Article

Effects of Cropping Systems on Soil Physicochemical Properties and Abundances and Spatial Distributions of Nitrogen-Cycling Bacteria

by
Annesly M. Netthisinghe
1,*,
Hunter O. Galloway
1,
Getahun E. Agga
2,
Phillip A. Gunter
1 and
Karamat R. Sistani
2
1
Department of Agriculture and Food Science, Western Kentucky University, Bowling Green, KY 42101, USA
2
U.S. Department of Agriculture, Agricultural Research Service, Food Animal Environmental Systems Research, Bowling Green, KY 42101, USA
*
Author to whom correspondence should be addressed.
Agronomy 2023, 13(6), 1461; https://doi.org/10.3390/agronomy13061461
Submission received: 24 April 2023 / Revised: 21 May 2023 / Accepted: 23 May 2023 / Published: 25 May 2023
(This article belongs to the Special Issue Management Practices Affect Soil Carbon and Nutrient Dynamics)

Abstract

:
Soil nitrogen (N) is a common limiting factor where soil N-cycling is a key component of agroecosystems. Soil N transformation processes are largely mediated by microbes, and understanding bacteria involvement in soil N-cycling in agricultural systems has both agronomic and environmental importance. This 2 yr field-scale study examined the abundances and spatial distributions of the total bacterial community (16S rRNA), bacteria involved in nitrification (amoA) and denitrification (narG, nirK, and nosZ), and soil physicochemical properties of winter wheat (Triticum aestivum L.)–soybean (Glycine max L.) double-crop with 2–3 weeks of spring grazing (WGS) and without grazing (WS) and tall fescue (Festuca arundinacea (L.) Schreb.) pasture (TF) managed to near-natural conditions with similar grazing. The TF soil had a significantly higher abundance of 16S rRNA, amoA, narG, nirK, and nosZ genes than the WS and WGS soils, which had similar levels between themselves. Soil organic matter (OM) and soil pH had stronger effects on the N-cycling bacteria gene abundance. All bacterial gene concentrations and soil pH showed nonrandom distribution patterns with a 141–186 m range autocorrelation. These results indicate that biological N transformation processes are more important in natural agricultural systems and the abundance of N-cycling bacteria can be manipulated by field-scale management strategies.

1. Introduction

Meeting the rising demand for food through increased productivity with a concomitant reduction in environmental impact is always challenging [1]. The sustainable intensification of conventional agriculture production systems has been identified as a measure of achieving higher production goals while assuring higher environmental quality standards [2]. Greater crop yields and animal production attained in recent decades were mainly derived from increasingly specialized and decoupled crop and livestock systems. However, this dissociation between crop and animal components poses significant threats to the sustainability of the food systems [3]. The integration of winter cereal crops for grain production or dual-use (grazing and grain production) into monocropping systems can be a sustainable intensification strategy and an alternative to conventional decoupled crop and animal production [3]. Winter cereal crops with forage production capability can contribute additional positive agronomic and ecological benefits by providing forage sources for livestock and food for human consumption [4].
Winter wheat (Triticum aestivum L.) has been shown to be compatible with soybean (Glycine max L.) and winter wheat–soybean double-cropping is a common practice in the southern corn-belt states in the United States [5]. Winter wheat, as a dual-use crop, can provide both grain yield and high-quality forage for livestock grazing in the spring [6,7] with no reduction in wheat grain yield compared to the winter wheat grown exclusively for grain production [8]. Winter wheat grown with soybean as a double crop did not affect the grain yield of subsequently planted soybean crops [9]. Winter wheat, as a dual-use crop, offers unique economic benefits to both grain production and value that is added by the weight gain of cattle grazing on the wheat crop. Tall fescue (Festuca arundinacea (L.) Schreb.) is an important cool-season perennial forage grass that is widely used for turf, forage production, and soil conservation [10]. Tall fescue pasture covers a significant area of the United States [11] and has the potential for growing on poor fertile soils with light management by occasional mowing [12].
Nitrogen (N) is an essential element for plant growth and is the element most demanded by plants [13]. The availability of N in soils is of primary importance in agroecosystem productivity [14] and environmental quality [15]. Shifts in soil N status can be caused by variations in N transformations [16], which are largely mediated by the microbiota [17]. The diversity, richness, and composition of microbial communities associated with N-cycling affect nitrogen availability to crops and N loss from the agricultural ecosystem [18]. The major soil N transformations include the mineralization of organic N, nitrification, denitrification, NH4 volatilization, and N2 fixation [19]. The mineralization of organic N in soils serves as the major source of N to plants for the uptake and synthesis of biomass. At the phylum level, the bacterial community in wheat–soybean rotation agroecosystems is mainly dominated by Actinobacteria, Proteobacteria, Firmicutes, Chloroflexi, and Acidobacteria [20].
Nitrifying bacteria largely determine N availability in soils in terms of both inorganic N quantity and NO3/NH4+ balance. Nitrification converts N derived from the mineralization of organic matter to nitrate, which is suitable for plant uptake or further microbial cycling [21] and, thus, is a fundamental component of soil N-cycling and fertility. The initial step in the nitrification pathway, the oxidation of NH4+ to NO3 via NH2OH, is completed by ammonia oxidizers comprising ammonia-oxidizing bacteria. Denitrifying bacteria are responsible for reducing soluble oxidized nitrogen compounds into gaseous N2O or N2 for energy conservation through a series of transformations. The denitrification process has received greater attention because it accounts for significant losses of fertilizer nitrogen from agricultural soils. In addition, denitrification is also responsible for the emission of N2O, an important greenhouse gas with a global warming potential c.a. 250 times higher than carbon dioxide [22]. These effects serve to focus attention on the organisms involved in the biogeochemical transformation of nitrogen in the soil.
The key enzyme for aerobic ammonia oxidizers is ammonia monooxygenase. The gene coding for a subunit of this enzyme, amoA, can reflect the phylogeny of the ammonia oxidizers [23]. As this step is rate limiting, the detection of amoA is widely used as a measure of the biological capacity for the entire nitrification process [24]. The denitrification pathway consists of the sequential reduction of NO3 to N2 via the metalloenzymes nitrate reductase (NO3 to NO2), nitrite reductase (NO2 to NO), nitric oxide reductase (NO to N2O), and nitrous oxide reductase (N2O to N2) [25] encoded by narG, nirK/nirS, norB, and nosZ genes, respectively [26,27]. The concentration of the total bacterial community can be quantified using 16S rRNA as a molecular marker [28].
The abundance of N-cycling genes is related to process rate and substrate availability and microbial population concentration in some environments [17,29,30]. Different agricultural practices have been shown to impact many microbial-driven natural biogeochemical processes in soil, including N-cycling [31] and plant community [9], such that alterations in microbial community composition or the abundance or activity of specific groups can alter nitrogen availability and nitrogen losses from the soil. In agricultural systems, the ecology of N geochemistry at a molecular level may be closely linked to soil factors. Previous studies have shown that shifts in the structure of bacterial communities can be associated with soil properties including texture [32], soil pH [33], and soil N availability [34]. The ammonia-oxidizing bacteria populations have greater abundance in agricultural soils (soils with N fertilizer inputs and higher soil disturbance) than in less disturbed systems [35]. An increase in soil pH by liming increased the abundance of amoA genes in pasture soils by 26% but did not affect narG copy numbers [17]. Environmental factors affecting denitrification, such as O2, pH, C availability, NO3 pools, etc., all act through the soil biological community [36]. Grazing can affect soil physical properties (e.g., compaction-driven soil decreases in macro-porosity and pore space), which in turn influences the habitat for soil microbiota and conditions affecting microbial processes (e.g., O2 limitation, REDOX, water-filled pore spaces, etc.). In addition, land management practices linked with agricultural production systems have been shown to affect soil chemical, physical, and biological parameters [37,38,39].
Evidence from several studies has shown that microbial communities can exhibit nonrandom spatial distribution patterns from centimeter to meter scale in terrestrial ecosystems [40,41,42]. Understanding distribution patterns of microbial communities and environmental determinants at the field scale is important for assessing the relative importance of local factors and land management practices on microbial communities and soil nutrient cycling processes that they are responsible for. Thus, characterizing spatial distribution patterns of N-cycling bacteria in agricultural systems enables one to better understand the ecology of N-cycling bacteria communities at a scale compatible with land management strategies focusing on transformation-related production improvement and mitigating negative environmental impacts of N transformations.
There exists a great opportunity for expanding productivity gains while achieving the environmental goals of agricultural ecosystems by manipulating the biological cycling of soil nutrients such as C, N, and P [15,43]. Thus, assessments conducted at the microbial community level focusing on the microbial ecology of N-cycling bacteria would facilitate realizing higher productivity gains while mitigating negative environmental effects through field-scale management strategies. Such information is scarce for wheat–soybean double-cropping systems. Further, this experiment is unique as it examined wheat–soybean cropping systems with the integration of livestock grazing. The overall objective of this experiment was to examine the N-cycling bacteria gene concentrations in wheat–soybean cropping and tall fescue pasture systems managed at near-natural conditions. The specific objectives were (1) to investigate the effects of winter wheat–soybean double-cropping with beef cow-calf grazing on wheat crops in spring (WGS) and without beef cow-calf grazing (WS) and of a tall fescue pasturing system (TF) managed to near-natural conditions on the abundance of total soil bacteria (16S rRNA) and N-cycling bacteria marker genes amoA, narG, nirK, and nosZ, and soil physicochemical properties. (2) to define field-scale spatial distribution patterns of total bacteria and soil N-cycling bacteria gene concentrations and soil properties. (3) To describe the relationships between soil N-cycling bacterial gene concentrations and soil properties.

2. Materials and Methods

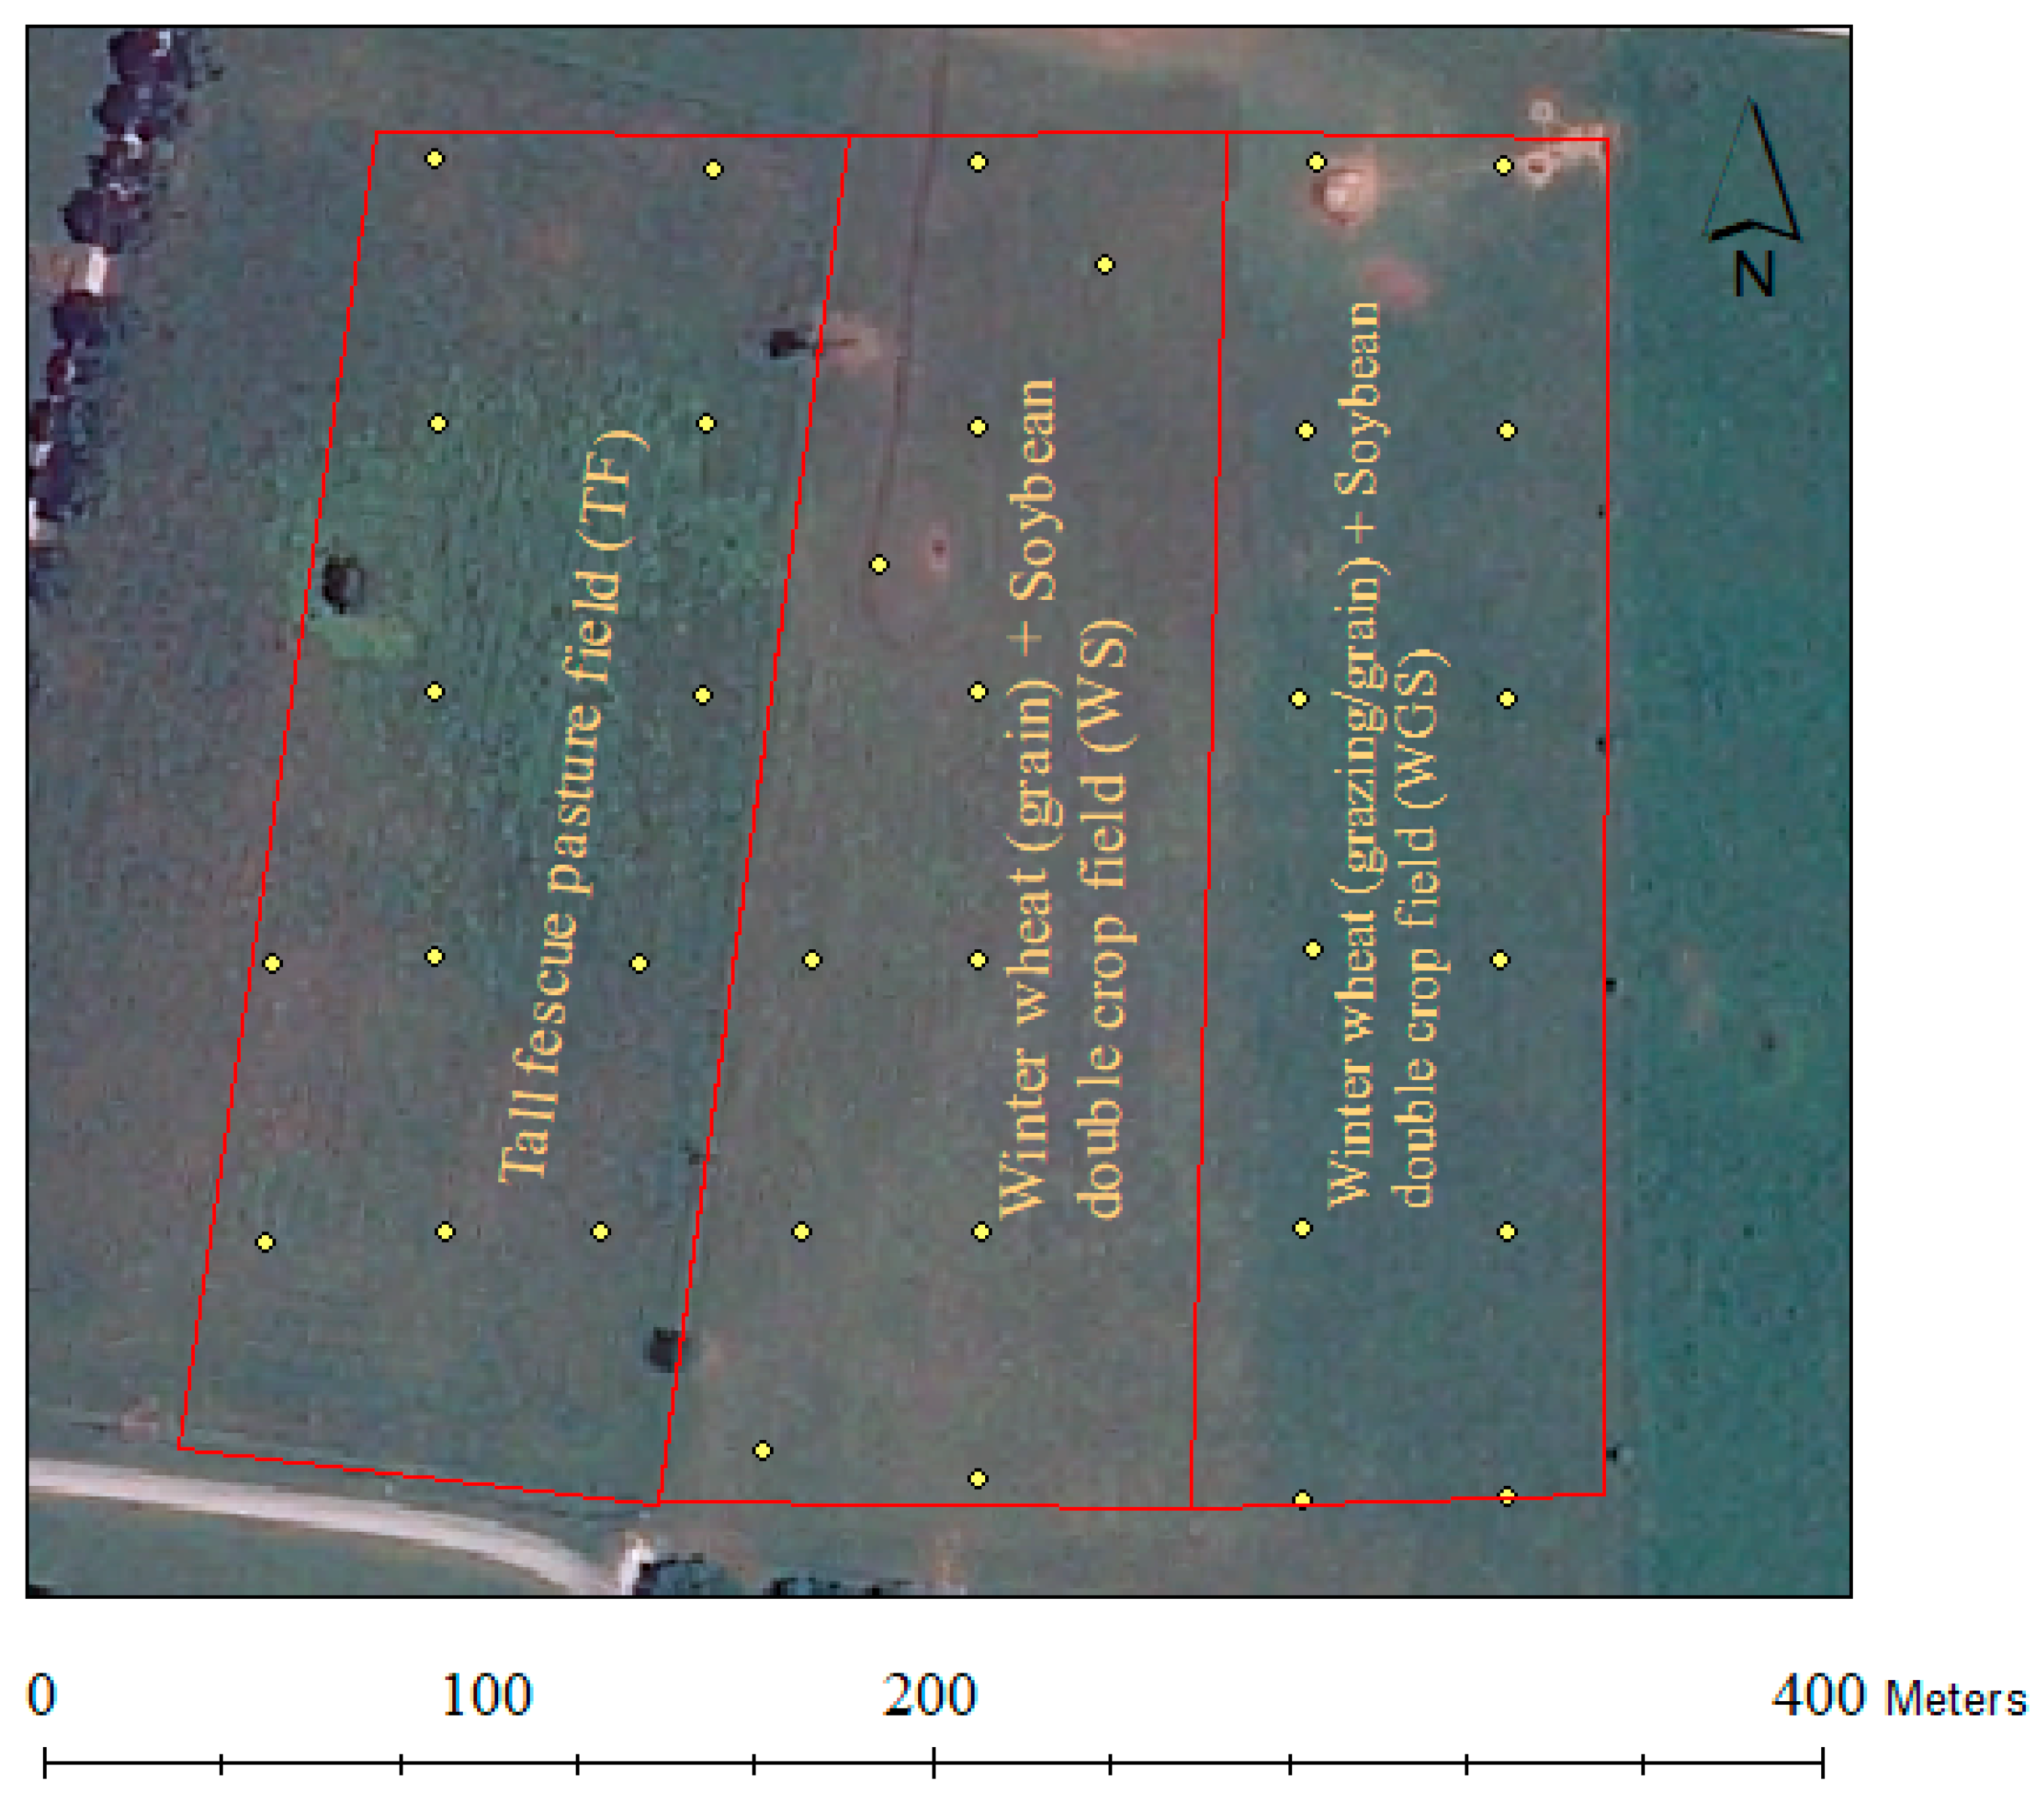
2.1. Site Management and Experimental Setup

The experiment was conducted at the Western Kentucky University Agriculture Research and Education Complex, Bowling Green, KY, USA (36°55′42″ N, 86°28″6″ W) during the 2016–2018 cropping seasons in three experimental fields, each with a 3.6 ha extent (Figure 1). The soils of the experimental fields were dominated by Crider silt loam (fine-silty, mixed, active, mesic Typic Paleudalf) with Nolin silt loam (Fine-silty, mixed, active, mesic Dystric Fluventic Eutrudepts), and vertrees silty clay loam (Fine, mixed, semiactive, mesic Typic Paleudalfs) soils. The climatic conditions of the experimental site are presented in Figure S1a,b. Before initiating the experiment, the entire field area had been planted into tall fescue pasture for beef cattle grazing. Detailed descriptions of the experimental fields and management practices were previously reported [8].
Briefly, two experimental fields were converted to winter wheat and summer soybean double-cropping. In the fall of 2016 and 2017, a soft red winter wheat cultivar (cv. Branson) was planted on those two fields as a wheat grain crop (WS) and wheat (forage grazing + grain) dual-use crop (WGS). The wheat crop fields were fertilized with 250 kg N ha−1 (diammonium phosphate) as a split application in the spring. The original tall fescue (Festuca arundinacea; cv. Kentucky 31) pasture stand in the 3rd field was managed to near-natural conditions (TF) with 2–3 mow downs, stockpiling, and light grazing for 2–3 weeks in spring seasons. Two different sets of cow/calf pairs of Angus breed (each consisting of eight pairs with similar body weights) grazed the TF or WGS fields for 2–3 weeks in the spring seasons of 2017 and 2018. The WS and WGS fields produced similar wheat grain yield (4.6 and 4.1 MG ha−1) and soybean grain yield (4.3 and 4.2 MG ha−1) with no significant differences between the WGS and WS systems [8].
Twelve georeferenced locations spaced at 40 m within TF and WGS experimental fields and eleven georeferenced locations spaced similarly from the WS field were used for soil sampling (Figure 1). The measurements of total bacteria, the abundance of nitrogen-cycling bacteria genes, and the soil physicochemical properties of each sampling location were considered as independent replication (pseudoreplicates) for statistical purposes [44,45]. Six soil samples were collected around each georeferenced location to a 10 cm depth using a 19 mm diameter soil probe (Oakfield Apparatus Co., Fond du Lac, WI, USA) and were then combined into a single composite sample to represent each location. The composite soil samples were divided into two subsamples where one was stored at −80 °C until bacterial DNA extraction and the other portion was air-dried at 25 °C and used for chemical analysis.

2.2. Soil Physicochemical Analysis

Soil pH, soil organic matter (OM), total C (TC), total N (TN), ammonium N (NH4–N), and nitrate N (NO3–N) contents were measured in twelve soil samples collected from the TF and WGS fields and eleven soil samples collected from the WS field. Soil pH was measured using a glass electrode with a 1:1 soil/water ratio. Soil organic matter content was approximated using the loss-on-ignition (LOI) method [46]. High-temperature combustion in a Vario MAX C-N analyzer (Elementar America Inc. Ronkonkoma, NY, USA) with a 2 g soil sample [47] was used to measure total soil C and N contents. The NH4–N and NO3–N concentrations were determined by potassium chloride extraction and flow-injection colorimetric analysis with cadmium reduction [48] on a Lachat Quickchem FIA+ 8000 analyzer (Hach Co., Loveland, CO, USA). Dry soil bulk density was measured [49] at each georeferenced soil sampling location using a 173.4 cm3 compact slide hammer corer (AMS Samplers, American Falls, ID, USA).

2.3. Quantification of Total Bacteria and N-Cycling Bacteria Genes in Soil Samples

Metagenomic DNA was extracted from 500 mg of soil using the FastDNA Spin kit for soils (MP Biomedical, Santa Ana, CA, USA) according to the manufacturer’s instructions. Real-time quantitative PCR (qPCR) was run on a BioRad CFX 96 real-time PCR detection system (BioRad, Hercules, CA, USA) to quantify the concentrations of the targeted genes by using published primers, probes, and protocols (Table S1), as previously described [50]. The primers and probes were obtained from Integrated DNA Technologies, Inc. (Coralville, IA, USA). The qPCR assay was performed with Qiagen HotStarTaq master mix (Qiagen, Valencia, CA, USA) in a total reaction volume of 25 μL. The assay consisted of 3 mM MgCl2, 600 nm each of the forward and reverse primers, 200 nm of the probe, and 10 ng of sample DNA or the standard (ranging from 102 to 108 copies). Sample DNA was diluted in a 1:200 ratio to reduce the effect of potential PCR inhibitors in the soil. A total of 5 μL of standard DNA for the standard and 5 μL of the diluted sample DNA were used as a template in the qPCR reaction. Total bacterial concentration (16S rRNA gene), NH3–oxidizing bacteria (amoA), NO3-reducing bacteria (narG), NO2 reducing bacteria (nirK), and N2O-reducing bacteria (nosZ) gene copy numbers were quantified at all sampling locations in each experimental field.

2.4. Statistical Analysis, Geostatistical Modeling, and Spatial Mapping

The gene copy numbers determined per gram of soil were transformed to a log10 scale before statistical analysis. The statistical ANOVA model accounted for four repeated measurements (spring and fall, 2017 and 2018) of log gene copy numbers g−1 soil and soil physicochemical properties measured at the twelve sampling locations in the TF and WGS fields, and at eleven locations in the WS field. The cropping system treatment was considered as the between-subject factor for the analysis. The log gene copy numbers g−1 and soil properties were considered dependent variables. To quantify the relationship between soil properties, bacteria, and N-cycling bacterial genes, Pearson’s correlation coefficients were calculated. Step-up (p = 0.02) multiple regression analysis (Table S2) was performed to describe the variation in bacterial gene abundances explained by soil properties. Statistical analyses were performed using SPSS 28 (IBM Corporation, Armonk, NY, USA). Post-hoc pair-wise multiple comparisons were performed using Bonferroni’s method at a 5% level of significance. The present study used a pseudo-replicated experimental design [44,45].
The spatial distribution patterns of total bacteria and N-cycling bacterial gene concentrations and soil pH in the three experimental fields were examined together. Moran’s I index [51] was used to assess the presence of spatial autocorrelation for the abundance of total and different N-cycling bacterial genes. The variables were modeled geostatistically [52] and a variogram analysis was performed by GS+ version 9 software (Gamma Design Software, Plainwell, MI, USA). The variogram parameters (Table S3) were then used to calculate linear unbiased estimates at unsampled locations as a weighted average of neighboring sampled points. Ordinary kriging in ArcGIS 10.1 (Environmental Systems Research Institute; Redlands, CA, USA) and Geostatistical Analyst extension were used to interpolate and map the gene copy numbers g−1 (log) and soil pH across the experimental fields.

3. Results

A repeated-measures ANOVA procedure revealed that cropping systems and time (season) had significant (p < 0.05) interaction effects on soil properties except for NH4-N content and soil bulk density. A significant interaction between cropping systems and time (season) has not been detected for the abundance of total and N-cycling bacterial genes. Both cropping systems and time (season) factors significantly influenced the abundance of total bacteria and N-cycling bacterial genes.

3.1. The Initial Soil Physicochemical Properties

The initial (i.e., after preparing the fields for the experiment and before sowing the winter wheat in the fall of 2016) soil physicochemical properties are shown in Table 1. The initial levels of soil pH, OM, and TN were similar among the cropping systems; however, the soil NO3-N (4.2 vs. 1.8 mg kg−1) and NH4-N (27.3 vs. 21.8–22.6 mg kg−1) levels were significantly higher in the TF than the two fields that were subsequently planted to winter wheat crop. Soil bulk density in the WS and WGS were significantly (p < 0.05) higher than the TF (1.38–1.42 vs. 1.29 g cm−3). However, no bacterial gene concentrations were different among the cropping systems just before the experiment.

3.2. Effect of Cropping Systems on Soil Physicochemical Properties

The mean soil physicochemical properties of cropping systems for the experimental period are presented in Table 2 and Table 3. In this experiment, both WS and WGS soils planted to winter wheat–summer soybean double-cropping with and without grazing in spring had significantly (p < 0.05) higher soil bulk densities than the TF soil. There was no difference in soil bulk density between the WS and WGS soils (Table 2). However, the WGS soils had a slightly higher soil bulk density than the WS soils.
During the spring season of 2017, soil pH did not vary significantly among the cropping systems; however, significant differences appeared with the advancement of the growing periods. The TF soils reported a consistently higher soil pH of >6.0, whereas the soil pH of the WS and WGS dropped to <6.0 from the fall of 2017 onward. In general, the TF had a significantly higher soil pH than the WS and WGS soils, while both the WS and WGS soils exhibited similar pH values. Soil OM and total C contents among the cropping systems followed similar distribution patterns within seasons. In general, the TF soils were rich in soil OM (24.7–33.4 g kg−1) and total C (20.5–36.5 gkg−1) contents compared to the WS and WGS soils (OM, 20.3–31.5 g kg−1; total C, 17.6–31.5 g kg−1). The OM and total C levels remained similar in the WS and WGS soils. The total N contents of cropping systems varied (1.92–4.46 g kg−1) with no clear trend for the within-season variability. Soil NH4-N content was not different among the cropping systems and mean content ranged from 9.5–10.1 mg kg−1. There were mixed responses for soil NO3-N concentrations among the cropping systems. The WS and WGS soils contained NO3-N levels similar to that of the TF soil (spring/fall 2017), higher than that of the TF soil (spring 2018), or lower than that of the TF soil (fall 2018). The overall NO3-N content during the experimental period ranged from 3.3–11.5 mg kg−1.

3.3. Effect of Cropping Systems on the Abundance of Total and Soil Nitrogen-Cycling Bacterial Marker Genes

The abundance of 16S rRNA, amoA, narG, nirK, and nosZ gene copy numbers of WS, WGS, and TF treatments are presented in Table 4. The total bacterial gene abundances among the cropping systems demarcated at >log 9.0 level. The nitrification and denitrification gene levels ranged from 6.4–7.9 log levels. In all treatments, the amoA gene was less abundant than the denitrification genes. In general, tall fescue soils carried significantly higher abundances of total bacteria and all N-cycling bacterial genes compared to the wheat–soybean cropping soils. Of the denitrification genes, the nosZ gene reported the highest concentration for all cropping systems but with statistically similar levels. In general, the abundance of the amoA gene in all of the treatments was less than the denitrification genes.

3.4. Relationship between Total and Soil Nitrogen-Cycling Bacterial Gene Abundances and Soil Chemical Properties

Several soil chemical properties established significant correlations with the abundances of total and N-cycling genes in the TF and wheat–soybean cropping systems (Table 5). In the TF system, soil OM emerged as the key factor controlling the abundances of all bacterial genes (r = 0.32–0.46) and the secondary factors were soil pH (amoA and narG; r = 0.37–0.46), NO3-N (amoA and narG; r = 0.30–0.39), and the NH4-N (16S rRNA, nirK, and nosZ; r = 0.31–0.53). Soil pH dominated as the key factor controlling the abundances of all bacterial genes (r = 0.25–0.59) in the WS and WGS systems. The other soil factors that established significant correlations with the abundances of bacterial genes in the WS and WGS soils were soil OM (16S rRNA, amoA, and narG; r = 0.25–0.32) and NH4-N (nirK and nosZ: r = 0.35–0.42).
Step-up multiple regression analysis (Table S2) revealed that in the wheat–soybean systems, 12% of the variation in 16S rRNA gene abundance and 25–40% variation in the N-cycling bacterial genes were explained by the soil properties. The soil properties in the TF explained a 15% variation in the total bacteria and a 22–35% variation in the N-cycling bacterial genes (Supplementary Table S2).

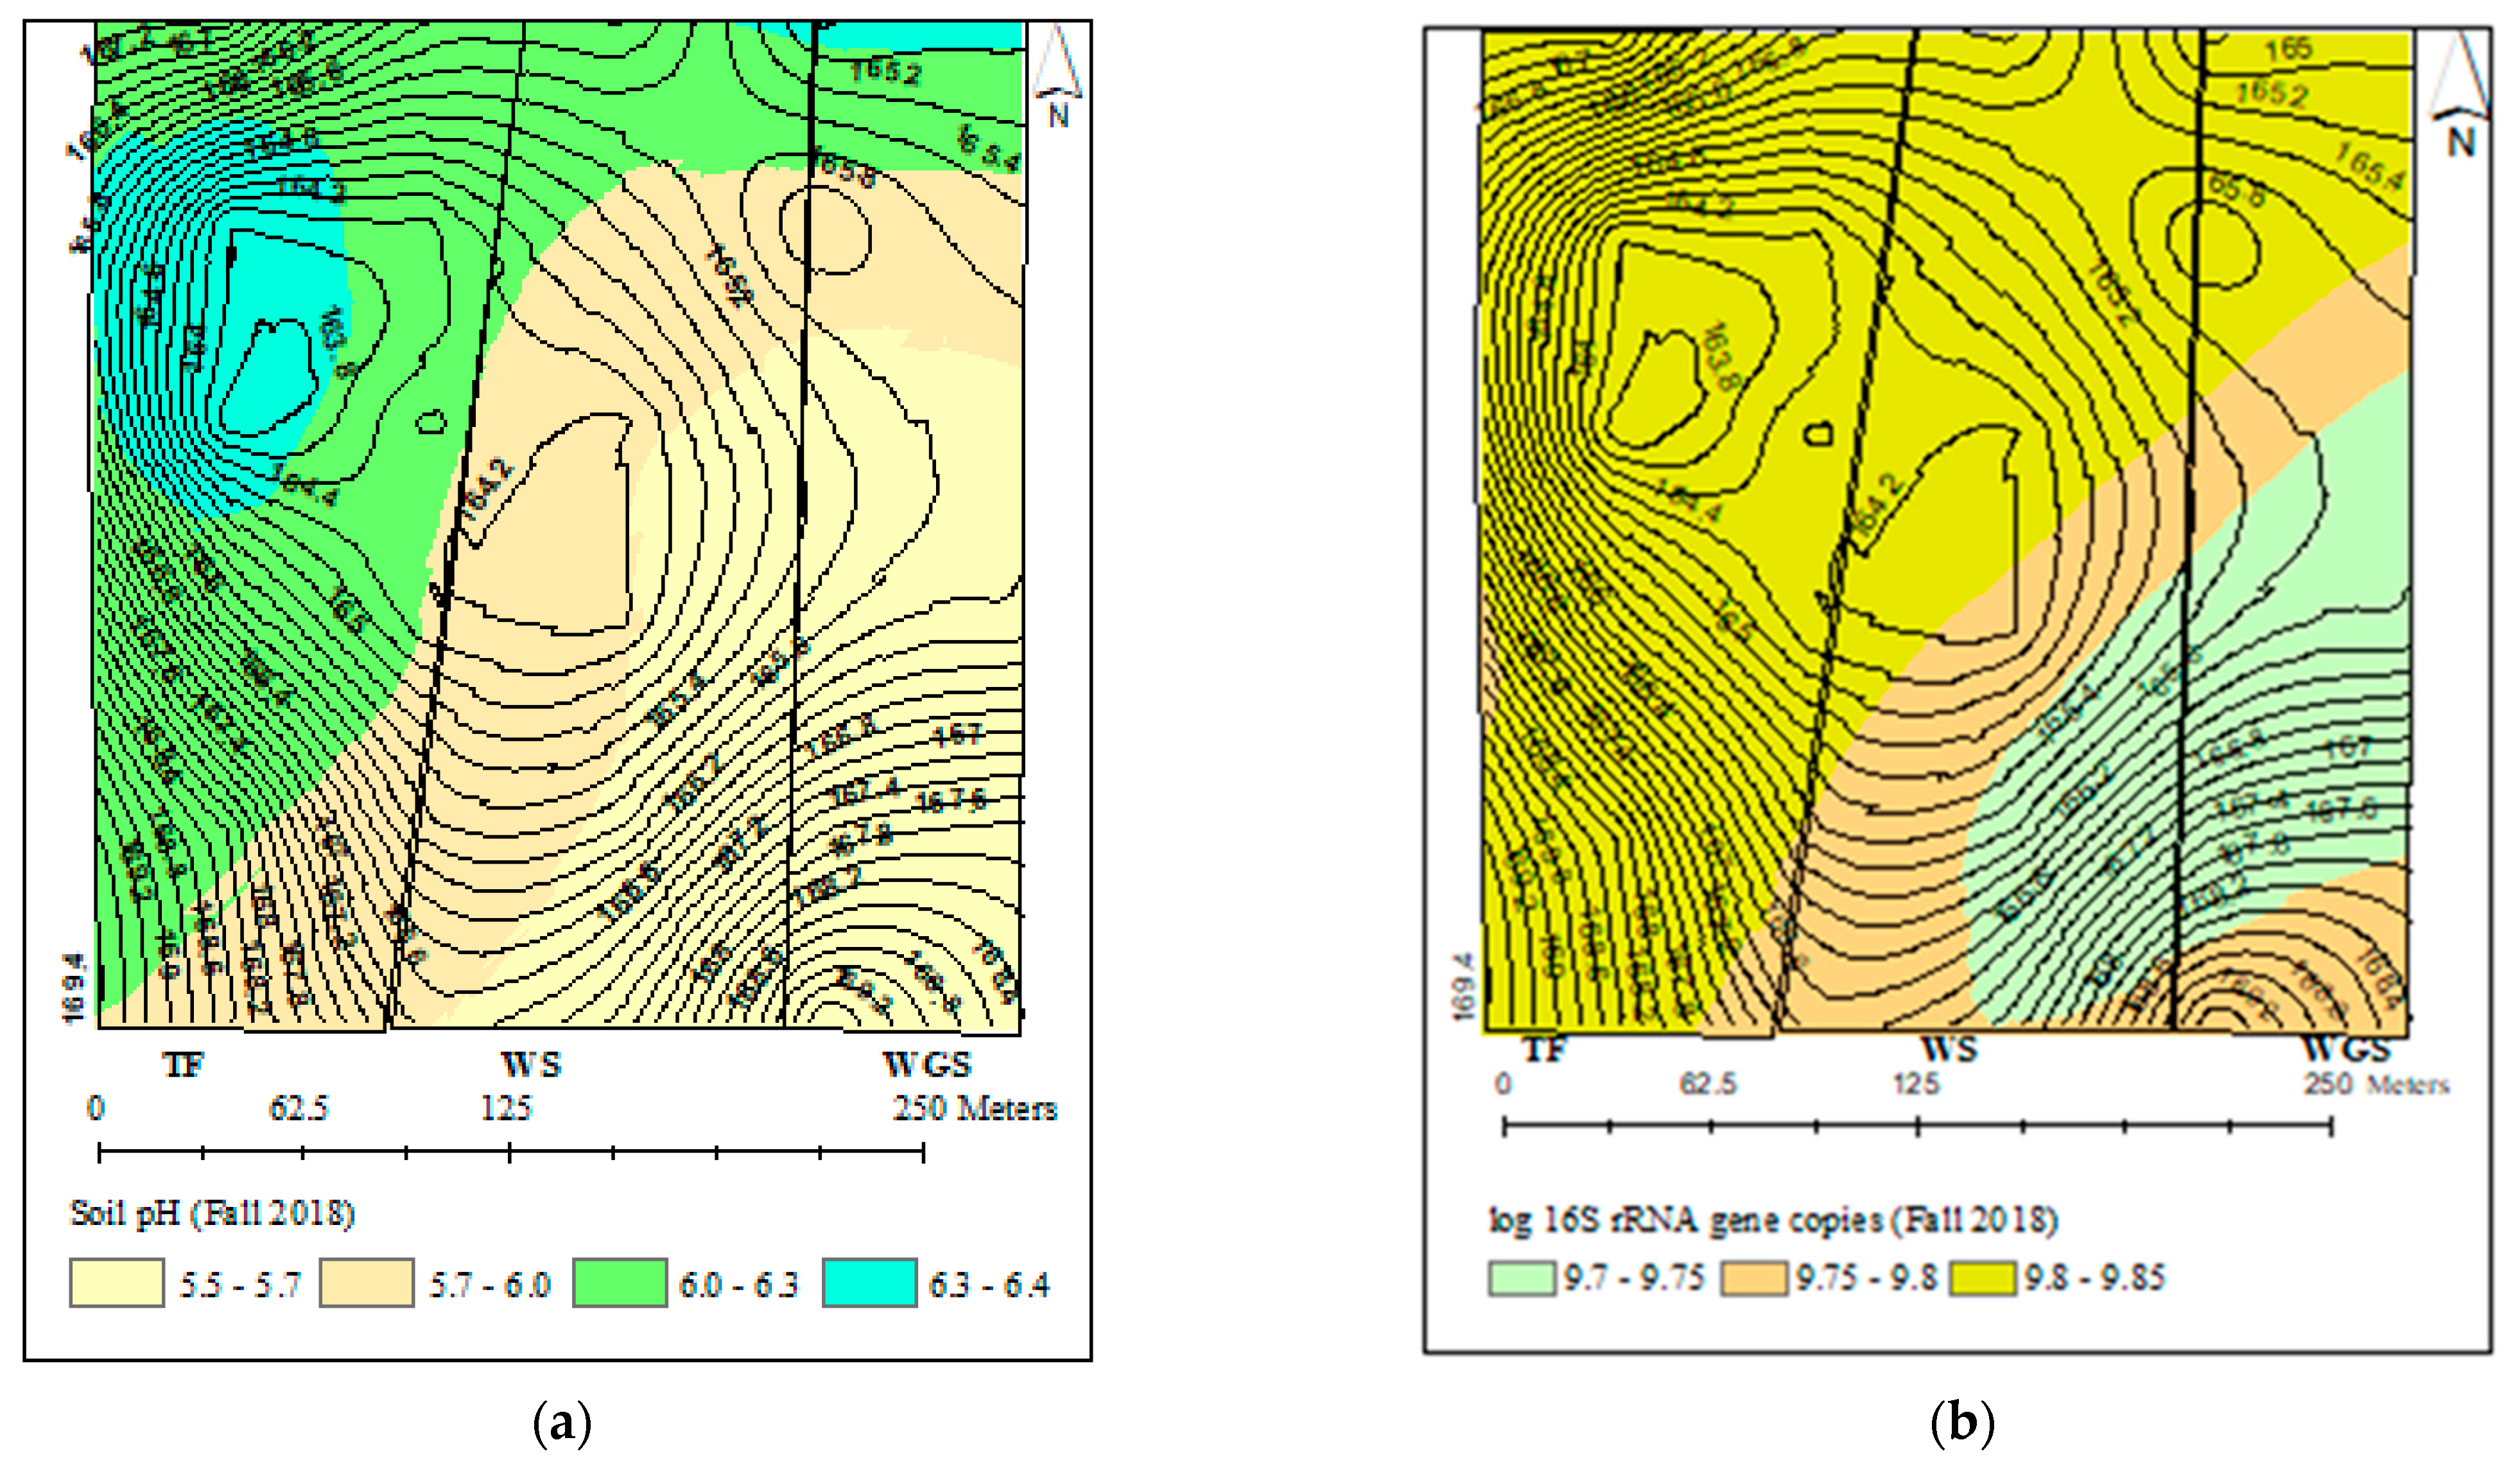
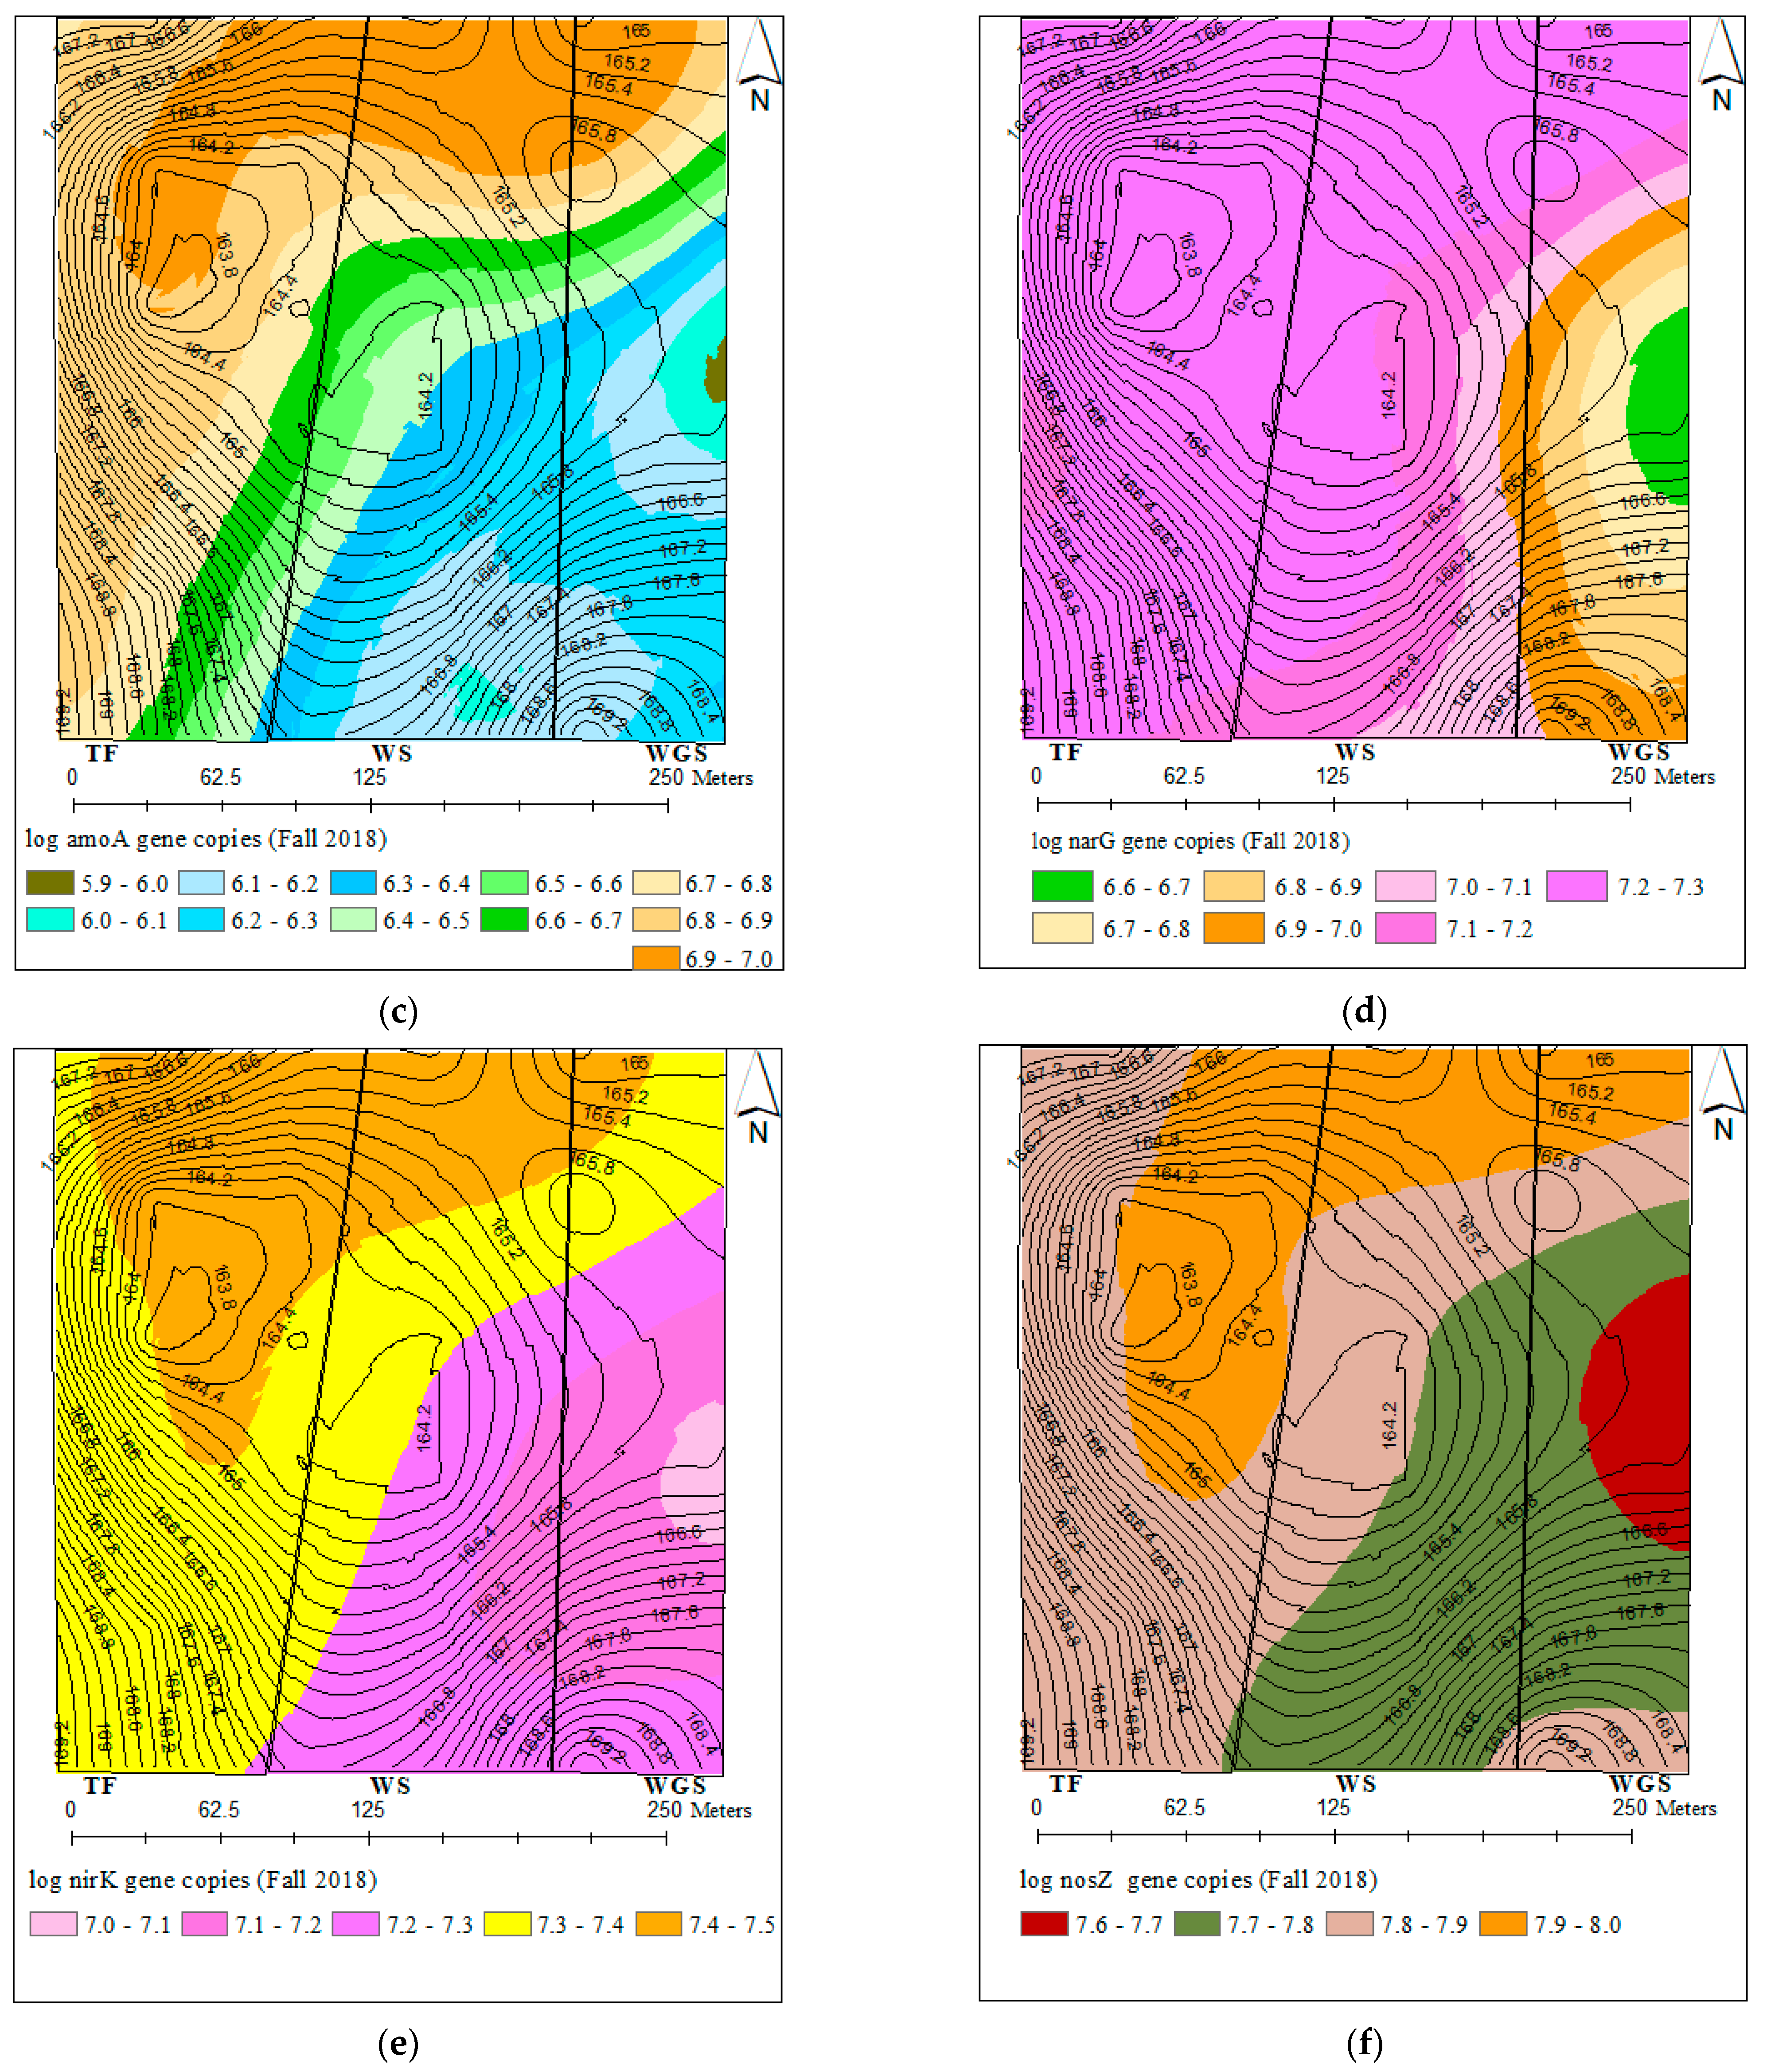
3.5. Spatial Distribution of Total and N-Cycling Bacterial Genes and Soil Chemical Properties

The spatial variability in total bacterial and N-cycling bacterial gene abundances comprised over one order of magnitude (Figure 2b–f). The distribution of total bacteria (16SrRNA), nitrification (amoA), and denitrification (narG, nirK, and nosZ) genes that were described by different variogram models showed a 141–187 m range spatial dependence (Table S3). The kriged maps in Figure 2b–f showed a southeast and northwest directional gradient for the distribution of all bacterial gene abundances. All bacterial genes were highly concentrated in the north and northwest parts of the landscape. Similarly, soil pH also showed a spatial distribution pattern with high soil pH levels in the north and northwest part of the landscape.

4. Discussion

Various management practices can have distinct influences on soil microbial communities in agricultural systems and their ecological functioning. Understanding the ecology of bacterial communities responsible for nutrient cycling and their relationships with local soil physicochemical properties is beneficial for improving productivity while enhancing the sustainability of agricultural systems. This 2-year study examined the abundances and distribution of total bacteria (16S rRNA), N-cycling bacteria (amoA, narG, nirK, and nosZ), and soil properties of wheat–soybean cropping systems with 2–3 weeks of spring grazing (WGS) and without grazing (WS) and a tall fescue pasture system (TF) managed to near-natural conditions with a similar grazing practice.
Before initiating the experiment, all three experimental fields experienced the same land use history of tall fescue pasturing for beef cattle grazing. The WS and WGS fields were grown to summer soybean crops before planting the first winter wheat crop in the fall of 2016. We conclude that WS, WGS, and TF reflected the effect of uniform management history with similar initial levels of soil pH, OM, and TN. The more frequent use of farm machinery for various field operations of pre-experimental summer soybean cropping resulted in significantly higher soil bulk density [53] in the WS and WGS soils. In addition, the active uptake of soil NH4-N and NO3-N by the summer soybean crop and low mineralization of organic N induced by high soil compaction [54] by farm machinery may have resulted in lower levels of NH4-N and NO3-N levels in the WS and WGS compared to the TF. The similar initial fertility among the cropping systems offered equally favorable conditions for microbial growth, thus no difference was detected for the initial abundances of total bacteria and N-cycling bacterial genes among the cropping systems.
The effects of different management disturbances of cropping systems were evident in this experiment. The TF soils that were managed at near-natural conditions experienced the least disturbances (cultivation, fertilization, etc.) compared to the wheat–soybean cropping. Soil compaction, because of frequent cultivation, is known to be an important problem that agriculture is facing [54]. Compaction disrupts soil’s physical integrity by modifying porosity and impeding gas, water, and nutrient movement and root growth in the soil profile [55]. In this experiment, both the WS and WGS soils that were planted to winter wheat–summer soybean double-cropping were more exposed to farm machinery for cultivation than the near-naturally managed TF soils. In the winter wheat–soybean double-cropping, the WGS soils additionally experienced 2–3 weeks of cattle grazing in spring seasons compared to the WS. The higher mean soil bulk density observed in the wheat–soybean cropping soils compared to the TF may support the effects of higher soil compaction by the extensive use of farm machinery for wheat–soybean cropping [53]. However, the additional exposure of WGS to cattle grazing for 2–3 weeks in spring did not significantly increase soil bulk density compared to the WS without the cattle grazing component. The shorter duration (2–3 weeks) of the grazing period and the short lifespan of the effects of soil compaction [53] could have been attributed to the similar soil bulk density between the WS and WGS soils.
Different cropping and land use systems can pose significant effects on soil carbon and other soil nutrient contents, soil texture, and soil pH [56,57], arising mainly from differences in plant species and associated management practices. The winter wheat–summer soybean cropping, especially the WGS, had significantly different soil biogeochemical properties from the tall fescue pasturing (TF). The soil pH in the TF consistently remained >6.0 throughout, most likely due to the undisturbed and consistent near-natural management practice. The drop in the soil pH in the WS and WGS to <6.0 could be due to the ammonia-based fertilization applied to wheat–soybean cropping and soil acidification resulting from ammonia fertilization [53]. The range of soil pH observed in the winter wheat–summer soybean soils was comparable to the levels (5.3–5.4) reported by [58] for wheat–soybean double-crop soils. Low levels of nitrification and the release of a small number of H+ ions can elevate soil pH in more compacted than in less compacted soils [53]. Results for soil pH did not agree with [53], where more compacted WS and WGS soils (higher soil bulk density) were more acidic than the TF soils with a lower soil bulk density. We suggest that soil compaction may not be a significant factor influencing soil pH in the WS and WGS systems, but it could be through plant uptake and soil solution charge balancing and the resulting soil acidification [53].
Under the near-natural management, TF pasture growth before stockpiling was mowed down to the soil. In the WS and WGS, winter wheat crop residues were removed from the fields in the form of bails, and summer soybean crop residues were returned to the soil. Thus, there had been a greater chance for a higher input of crop residues to the TF soils compared to the WS and WGS. It has been shown that the chemical composition of crop tissues influenced the decomposition rate of litter material [59,60]. The decomposition rate of plant residue is negatively correlated with the C:N ratio and hemicellulose content of plant tissues [59,61]. Soybean plant tissue has a <15:1 C:N ratio and 100 g kg−1 DM hemicellulose content [60,61]. The analysis of crop residues from this study revealed (data not presented) that soybean crop residue contained 102–113 g kg−1 DM hemicellulose and tall fescue pasture tissue had a 200–226 g kg−1 DM hemicellulose content. Based on the hemicellulose contents, we expect a higher decomposition potential for soybean crop residue than the TF pasture plant parts. Accordingly, we would expect soils of WS and WGS to contain higher amounts of soil OM than the TF. In addition, soil compaction by farm machinery and grazing cattle resulted in poor aeration and hampered the mineralization of soil OM [54] in the WS and WGS soils. Both the above factors may suggest that wheat–soybean crop soils contain higher levels of soil OM than the TF soils. However, the contrasting result from this study revealed that TF soils were richer in soil OM than the WS and WGS soils. We postulate that the loss of soil organic matter by cultivation [14] may have been attributed to the lower levels of soil OM in the WS and WGS soils. Thus, adoption of soil management practices with minimal soil disturbances would be beneficial to improve the soil OM levels in the wheat–soybean cropping systems.
Total soil C content among the cropping systems within seasons varied in a manner similar to the soil OM content. In general, the TF soils were richer in total C than the WS and WGS soils. The higher total C level in TF soil could be explained by the associated higher soil OM levels. The lower levels of total soil C in the WS and WGS soils could be explained by the potential microbial burning of soil C induced by N fertilization [62]. However, the levels of total C (25.2–31.5 g kg−1) reported in the wheat–soybean cropping soils of this experiment were 3–4 times higher than the 8.08–8.34 g kg−1 reported for winter wheat and soybean summer rotations [58].
The seasonal variability in total soil N concentration was inconsistent among the cropping systems. In general, total N levels were similar between the TF and WS soils, but the levels in the TF were significantly (p > 0.05) higher than the WGS soils, especially during the fall seasons. There is a greater potential for denitrification in the more compacted soil [63]. The slightly higher soil bulk density of the WGS soils and potentially higher denitrification losses could support the consistently lower total soil N concentration in the WGS soil compared to the WS soil. The concentration of total soil N observed in this experiment (0.5–0.94 g kg−1) was 1–2 times higher than the 2.22–2.92 g kg−1 previously reported for wheat–soybean crop rotations [58]. In general, the oxidation of ammonia is reduced in acidic soil conditions [24] because of the exponential reduction in NH3 availability with decreasing pH through the ionization to NH4+ [64]. On the other hand, the mineralization of organic N to NH4+ is less favored in compacted soils [54]. We suggest that both soil pH and soil compaction were collectively attributed to the similar levels of soil NH4-N detected in all of the cropping systems. The levels of soil NH4-N (9.5–10.1 g kg−1) detected in the WS and WGS were comparable to the 8.0 g kg−1 reported by [58] for wheat–soybean crop rotations.
Soil compaction can affect denitrification mainly through a limited supply of soil aeration and by the indirect effects on N and C transformation. Soil compaction reduces soil pore diameter and increases water-filled pore space, which, in turn, restricts oxygen diffusion within the soil, leading to denitrification [63]. Because of higher soil bulk density, we would expect higher denitrification and lower levels of NO3-N in the WS and WGS soils compared to the TF soils. However, this scenario was evident only in the fall of the 2018 season. There had been mixed responses during the rest of the seasons, where the WS and WGS soils contained NO3 levels similar to TF soil (the spring/fall of 2017) or higher than the TF soil (the fall of 2018). These mixed responses could have resulted from the seasonal climatic differences, management practices (N fertilization), and the occupying crops. In this experiment, we noticed a 3.3–11.5 mg kg−1 soil NO3-N in the WS and WGS soils which was comparable to the levels (6.5–11.3 mg kg−1) reported by [58] for the same crop rotation. Altogether, tall fescue pasture systems managed to near-natural management conditions had higher soil pH, OM, and C concentrations compared to the wheat–soybean cropping systems either with or without light spring grazing. However, the soil N dynamics in the tall fescue and wheat–soybean cropping systems are complex, unpredictable, and more likely to be affected by management practices and local environmental factors. Management practices such as minimum and zero tillage of wheat–soybean cropping may help in reducing the loss of soil organic matter, improve CEC, and increase the retention of NH4+-N, slowing down the denitrification process.
Greater heterogeneity of above-ground crop residues, senescent roots, and root exudates in agriculture systems, along with other management practices, can create more variable habitable resource niches in soil [61], thus agriculture systems can have different soil microbial properties [65,66]. The similarity of cropping history (under tall fescue pasturing) resulted in similar initial levels of 16S rRNA, amoA, narG, nirK, and nosZ gene copies among the cropping systems. Although previous research [67,68] has shown higher microbial abundance in frequently disturbed soils than in weakly disturbed, it was noted that the TF soils with the least disturbances (due to near-natural management) had comparatively higher abundances of total and N-cycling bacteria compared to the WS and WGS systems. The abundance of N-cycling bacteria in some environments can be related to substrate availability [28]. Higher soil C storage provides a benign dwelling while supplying substrates for soil microbes [69]. Organic C compounds are suitable electron donors for biological metabolism, and the increase in organic C can stimulate the abundance of ammonia-oxidizing and denitrifying bacteria [17,70]. We suspect that the higher availability of labile organic substrate [71,72] from the OM in the TF system might have resulted in a higher abundance of all bacteria genes. The mean 16S rRNA gene abundance observed in this experiment is consistent with the levels (108–109) reported by [27] for agricultural soils.
Autotropic ammonia-oxidizing bacteria have been shown to grow faster in neutral or slightly alkaline media [24]. The TF field managed to near-natural conditions had a comparatively higher soil pH close to neutral and reported higher abundances of amoA gene (log 7.01; 1.0 × 10⁷) than the more acidic WS/WGS wheat–soybean systems. The level of amoA genes found in the TF was comparable to those previously reported by [73] for unfertilized arable soils. Some studies have shown that chemical fertilization increased the abundance of ammonia-oxidizing bacteria [74], while negative impacts of chemical fertilization have also been observed [75,76]. The lower levels of the amoA gene detected in the WS and WGS could have been derived from the low soil pH as a result of NH4-based N fertilization. The lower levels of the amoA gene copies in the WS and WGS may further indicate the low dependency of wheat–soybean cropping on biological nitrification. Both WS and WGS systems harbored similar concentrations of amoA genes and the levels were consistent with the concentrations found in fertilized soils [73].
Although some of the between-group differences were not significant, the abundance of all denitrification genes followed a general trend TF > WS > WGS and mimicked the trend observed for soil OM and total C variations [77]. It has been reported that nitrification of ammonium N to NO3 is slow in compacted soils [52]. Thus, we assume that limited availability of NO3 from the nitrification of NH4+ resulted in the lower abundance of denitrification genes, especially the narG (NO3 to NO2) and nirK (NO2 to NO) genes in the WS and WGS compared to the TF. Recent studies [78,79] have shown that some denitrifiers can have a truncated denitrification pathway and lack the nosZ gene encoding nitrous oxide reductase. However, in this experiment, the nosZ gene accounted for the highest abundance among the denitrifiers. The nirK and nosZ gene levels detected in this experiment were consistent with the levels for agricultural soils planted to winter wheat, wheat, and corn crops [27]. There is evidence that cattle grazing can alter soil physical properties and conditions affecting the size of communities and microbial processes [55]. In addition, cattle grazing can modify nutrient availability through the deposition of urine and feces and stimulate denitrification. However, the effect of the change in soil properties by cattle grazing on the abundance of denitrifying bacterial communities was not evident in this experiment. Both WS and WGS soils harbored similar concentrations of denitrifying bacteria. We presume that the 2–3 weeks of grazing did not alter soil physical or chemical properties in the WGS sufficiently to show any significant change in the levels of denitrifying bacterial concentrations.
The significant correlations that existed for soil pH in the WS and WGS and soil OM content in the TF with the abundance of all N-cycling bacteria genes [17,74,77,80] suggest different management practices in the cropping systems influenced the abundance of N-cycling bacteria gene concentrations. The frequent mow-down of tall fescue pasture in the TF that added more soil organic matter, and N fertilization (ammonium fertilizer) to wheat–soybean cropping that reduced soil pH, could be identified as such management practices. Land management practices with minimum soil disturbance would be beneficial in building soil OM levels, improving soil buffer capacity, controlling soil acidification, increasing nitrification, and reducing denitrification and N losses, especially from the wheat–soybean cropping systems.
The characterization of bacterial distribution patterns at the field scale is important in understanding the ecology of bacterial communities at a scale compatible with land management strategies. The spatial variability in total and N-cycling bacterial concentrations comprising over one order of magnitude, with 141–187 m range spatial dependence and low nugget effects, were consistent with the previous work by [40,42]. The range of spatial dependence observed for N-cycling bacterial genes in this experiment was similar to the 130–140 m range spatial autocorrelation reported for ammonia-oxidizing bacteria across a 44 ha field [81]. The similar spatial distribution patterns of total and N-cycling bacteria indicate that the abundances of all bacterial genes were controlled by the same edaphic factor/s. The significant correlation and similarity of kriged maps for N-cycling bacterial concentration and soil pH further confirmed soil pH as one of the influential factors controlling the abundance of bacteria at the field scale. There may exist consistently favorable niches for bacteria growth in the north and northwest part of the landscape to harbor higher bacterial concentrations. The management history of the experimental fields showed that regular placement of supplementary feeders for grazing cattle occurred in the north–northeast parts. The more frequent animal roaming, higher animal congregation, and intensive manure and urine input to soils would have favored bacterial growth in those areas. These results, altogether, indicated that the abundance of bacteria involved in soil N-cycling is driven mainly by local environmental gradients that can be controlled by local management practices.

5. Conclusions

The quantification of bacteria involved in soil N transformations in agricultural systems helps expand our understanding of the response of N-cycling microbial populations to respective environmental disturbances. This study quantified soil physicochemical properties and the abundance of the 16S rRNA gene, N-cycling bacterial genes, amoA, narG, nirK, and nosZ in wheat–soybean crop rotations with 2–3 weeks of spring grazing (WGS) and without grazing (WS) and in a tall fescue pasturing system managed to near-natural conditions with similar grazing (TF). We explored the influence of three cropping systems on the abundance of total and N-cycling bacteria and soil physicochemical properties. In addition, we examined the relationships between soil properties and the abundance of bacteria and described field-scale spatial distribution patterns. There existed a marked contrast in the abundance of total and N-cycling bacteria and soil properties between the cropping systems, with higher abundances in the tall fescue pasture soils managed to near-natural conditions. Soil OM and soil pH emerged as key factors to influence total soil bacteria and targeted N-cycling gene abundances in the wheat–soybean and tall fescue pasture systems. Abundances of all bacteria genes of tall fescue and wheat–soybean cropping system soils were controlled by the same edaphic factor/s, which includes soil pH. There exists a potential to manipulate the abundance of N-cycling bacteria by devising field-scale management strategies targeting influential soil properties.

Supplementary Materials

The following supporting information can be downloaded at: https://www.mdpi.com/article/10.3390/agronomy13061461/s1, Table S1: Primers and amplification conditions for the quantification of nitrifying and denitrifying bacterial indicator genes in the soil samples collected from the grazing experiment.; Table S2: Summary of step-up multiple linear regression between abundance of nitrogen cycling functional genes and soil properties (n = 48); Table S3: Semi-variogram parameters of total and nitrogen cycling bacteria functional genes and mean soil pH (n = 36); Figure S1: Mean monthly precipitations (a) and temperatures (b) of the study site during the experimental period.

Author Contributions

Conceptualization, H.O.G. and A.M.N.; methodology, H.O.G., A.M.N. and G.E.A.; software, A.M.N.; formal analysis, A.M.N. and G.E.A.; investigation, H.O.G., A.M.N., G.E.A., P.A.G. and K.R.S.; writing—original draft preparation, A.M.N.; writing—review and editing, H.O.G., A.M.N., G.E.A., P.A.G. and K.R.S.; project administration, H.O.G. and P.A.G.; funding acquisition, H.O.G. All authors have read and agreed to the published version of the manuscript.

Funding

This research was funded by the United States Department of Agriculture, through the USDA-ARS; Western Kentucky University cooperative research program.

Data Availability Statement

Data are available on request.

Acknowledgments

We thank Rohan Parekh (U.S. Department of Agriculture, Agricultural Research Service, Food Animal Environmental Systems Research Unit, Bowling Green, Kentucky) for the technical assistance in microbial analysis laboratory work.

Conflicts of Interest

The authors declare no conflict of interest regarding the publication of this paper. The funder had no role in the design of the study; in the collection, analysis, or interpretation of data; in the writing of the manuscript; or in the decision to publish the results. The mention of trade names or commercial products in this publication is solely for the purpose of providing specific information and does not imply recommendation or endorsement by the U.S. Department of Agriculture. USDA is an equal opportunity provider and employer.

References

  1. Sanford, G.R.; Jackson, R.D.; Booth, E.G.; Hedtcke, J.L.; Picasso, V. Perenniality and diversity drive output stability and resilience in a 26-year cropping systems experiment. Field Crops Res. 2021, 263, 108071. [Google Scholar] [CrossRef]
  2. Smith, P. Delivering food security without increasing pressure on land. Glob. Food Secur. 2013, 2, 18–23. [Google Scholar] [CrossRef]
  3. Lemaire, G.; Franzluebbers, A.; de Faccio Carvalho, P.C.; Dedieu, B. Integrated crop–livestock systems: Strategies to achieve synergy between agricultural production and environmental quality. Agric. Ecosyst. Environ. 2014, 190, 4–8. [Google Scholar] [CrossRef]
  4. Planisich, A.; Utsumi, S.; Larripa, M.; Galli, J. Grazing of cover crops in integrated crop-livestock systems. Animal 2021, 15, 100054. [Google Scholar] [CrossRef] [PubMed]
  5. Moomaw, R.S.; Powell, T.A. Multiple cropping systems in small grains in Northeast Nebraska. J. Prod. Agric. 1990, 3, 569–576. [Google Scholar] [CrossRef]
  6. Horn, F. Chemical composition of wheat pasture. In National Wheat Pasture Symposium Proceedings; Horn, G.W., Ed.; Oklahoma Agriciculture Experimental Station: Oklahoma City, OK, USA, 1984; pp. 47–54. [Google Scholar]
  7. Winterholler, S.; Lalman, D.; Hudson, M.; Ward, C.; Krehbiel, C.; Horn, G. Performance, carcass characteristics, and economic analysis of calf-fed and wheat pasture yearling systems in the southern Great Plains. Prof. Anim. Sci. 2008, 24, 232–238. [Google Scholar] [CrossRef]
  8. Netthisinghe, A.; Galloway, H.; DeGraves, F.; Agga, G.E.; Sistani, K. Grain yield and beef cow–calf growth performance in dual-purpose and conventional grain wheat production systems and stockpiled tall fescue pasturing. Agronomy 2020, 10, 1543. [Google Scholar] [CrossRef]
  9. Kourtev, P.; Ehrenfeld, J.; Häggblom, M. Experimental analysis of the effect of exotic and native plant species on the structure and function of soil microbial communities. Soil Biol. Biochem. 2003, 35, 895–905. [Google Scholar] [CrossRef]
  10. Stuedemann, J.A.; Hoveland, C.S. Fescue endophyte: History and impact on animal agriculture. J. Prod. Agric. 1988, 1, 39–44. [Google Scholar] [CrossRef]
  11. Hoveland, C.S. Origin and history. In Tall Fescue for the Twenty-First Century; Fribourg, H.A., Hannaway, D.B., West, C.P., Eds.; Agronomy Mnograph: Madison, WI, USA, 2009; Volume 53, pp. 1–10. [Google Scholar]
  12. Leuchtmann, A.; Clay, K. Isozyme variation in the Acremonium/Epichloë fungal endophyte complex. Phytopathology 1990, 80, 1133–1139. [Google Scholar] [CrossRef]
  13. Horvatic, J.; Peršić, V.; Kočić, A.; Čačić, L.; Has-Schoen, E. Water quality and nutrient limitation in an area of the Danube River and an adjoining oxbow lake (1299 r. km): Algal bioassay. Fresenius Environ. Bull. 2009, 18, 12–20. [Google Scholar]
  14. Tripathi, N.; Singh, R.S. Influence of different land uses on soil nitrogen transformations after conversion from an Indian dry tropical forest. Catena 2009, 77, 216–223. [Google Scholar] [CrossRef]
  15. Orwin, K.H.; Wardle, D.A. New indices for quantifying the resistance and resilience of soil biota to exogenous disturbances. Soil Biol. Biochem. 2004, 36, 1907–1912. [Google Scholar] [CrossRef]
  16. Lang, M.; Cai, Z.-C.; Mary, B.; Hao, X.; Chang, S.X. Land-use type and temperature affect gross nitrogen transformation rates in Chinese and Canadian soils. Plant Soil 2010, 334, 377–389. [Google Scholar] [CrossRef]
  17. Wakelin, S.A.; Gregg, A.L.; Simpson, R.J.; Li, G.D.; Riley, I.T.; McKay, A.C. Pasture management clearly affects soil microbial community structure and N-cycling bacteria. Pedobiologia 2009, 52, 237–251. [Google Scholar] [CrossRef]
  18. Hayatsu, M.; Tago, K.; Saito, M. Various players in the nitrogen cycle: Diversity and functions of the microorganisms involved in nitrification and denitrification. Soil Sci. Plant Nutr. 2008, 54, 33–45. [Google Scholar] [CrossRef]
  19. Reddy, K.; Patrick, W.; Broadbent, F. Nitrogen transformations and loss in flooded soils and sediments. Crit. Rev. Environ. Sci. Technol. 1984, 13, 273–309. [Google Scholar] [CrossRef]
  20. Yokota, M.; Guan, Y.; Fan, Y.; Zhang, X.; Yang, W. Vertical and temporal variations of soil bacterial and archaeal communities in wheat-soybean rotation agroecosystem. PeerJ 2022, 10, e12868. [Google Scholar] [CrossRef]
  21. Bolan, N.S.; Saggar, S.; Luo, J.; Bhandral, R.; Singh, J. Gaseous emissions of nitrogen from grazed pastures: Processes, measurements and modeling, environmental implications, and mitigation. Adv. Agron. 2004, 84, 120. [Google Scholar]
  22. Lashof, D.A.; Ahuja, D.R. Relative contributions of greenhouse gas emissions to global warming. Nature 1990, 344, 529–531. [Google Scholar] [CrossRef]
  23. Rotthauwe, J.-H.; Witzel, K.-P.; Liesack, W. The ammonia monooxygenase structural gene amoA as a functional marker: Molecular fine-scale analysis of natural ammonia-oxidizing populations. Appl. Environ. Microbiol. 1997, 63, 4704–4712. [Google Scholar] [CrossRef] [PubMed]
  24. De Boer, W.; Kowalchuk, G.A. Nitrification in acid soils: Micro-organisms and mechanisms. Soil Biol. Biochem. 2001, 33, 853–866. [Google Scholar] [CrossRef]
  25. Zumft, W.G. Cell biology and molecular basis of denitrification. Microbiol. Mol. Biol. Rev. 1997, 61, 533–616. [Google Scholar] [PubMed]
  26. Chèneby, D.; Hallet, S.; Mondon, M.; Martin-Laurent, F.; Germon, J.; Philippot, L. Genetic characterization of the nitrate reducing community based on narG nucleotide sequence analysis. Microb. Ecol. 2003, 46, 113–121. [Google Scholar] [CrossRef]
  27. Henry, S.; Bru, D.; Stres, B.; Hallet, S.; Philippot, L. Quantitative detection of the nosZ gene, encoding nitrous oxide reductase, and comparison of the abundances of 16S rRNA, narG, nirK, and nosZ genes in soils. Appl. Environ. Microbiol. 2006, 72, 5181–5189. [Google Scholar] [CrossRef]
  28. López-Gutiérrez, J.C.; Henry, S.; Hallet, S.; Martin-Laurent, F.; Catroux, G.; Philippot, L. Quantification of a novel group of nitrate-reducing bacteria in the environment by real-time PCR. J. Microbiol. Methods 2004, 57, 399–407. [Google Scholar] [CrossRef]
  29. Colloff, M.; Wakelin, S.; Gomez, D.; Rogers, S. Detection of nitrogen cycle genes in soils for measuring the effects of changes in land use and management. Soil Biol. Biochem. 2008, 40, 1637–1645. [Google Scholar] [CrossRef]
  30. Nicol, G.W.; Leininger, S.; Schleper, C.; Prosser, J.I. The influence of soil pH on the diversity, abundance and transcriptional activity of ammonia oxidizing archaea and bacteria. Environ. Microbiol. 2008, 10, 2966–2978. [Google Scholar] [CrossRef]
  31. Reynolds, H.L.; Packer, A.; Bever, J.D.; Clay, K. Grassroots ecology: Plant–microbe–soil interactions as drivers of plant community structure and dynamics. Ecology 2003, 84, 2281–2291. [Google Scholar] [CrossRef]
  32. Girvan, M.S.; Bullimore, J.; Pretty, J.N.; Osborn, A.M.; Ball, A.S. Soil type is the primary determinant of the composition of the total and active bacterial communities in arable soils. Appl. Environ. Microbiol. 2003, 69, 1800–1809. [Google Scholar] [CrossRef]
  33. Fierer, N.; Jackson, R.B. The diversity and biogeography of soil bacterial communities. Proc. Natl. Acad. Sci. USA 2006, 103, 626–631. [Google Scholar] [CrossRef] [PubMed]
  34. Frey, S.D.; Knorr, M.; Parrent, J.L.; Simpson, R.T. Chronic nitrogen enrichment affects the structure and function of the soil microbial community in temperate hardwood and pine forests. For. Ecol. Manag. 2004, 196, 159–171. [Google Scholar] [CrossRef]
  35. Hayden, H.L.; Drake, J.; Imhof, M.; Oxley, A.P.; Norng, S.; Mele, P.M. The abundance of nitrogen cycle genes amoA and nifH depends on land-uses and soil types in South-Eastern Australia. Soil Biol. Biochem. 2010, 42, 1774–1783. [Google Scholar] [CrossRef]
  36. Wallenstein, M.D.; Myrold, D.D.; Firestone, M.; Voytek, M. Environmental controls on denitrifying communities and denitrification rates: Insights from molecular methods. Ecol. Appl. 2006, 16, 2143–2152. [Google Scholar] [CrossRef] [PubMed]
  37. Bissett, A.; Brown, M.V.; Siciliano, S.D.; Thrall, P.H. Microbial community responses to anthropogenically induced environmental change: Towards a systems approach. Ecol. Lett. 2013, 16, 128–139. [Google Scholar] [CrossRef]
  38. Osborne, C.A.; Zwart, A.B.; Broadhurst, L.M.; Young, A.G.; Richardson, A.E. The influence of sampling strategies and spatial variation on the detected soil bacterial communities under three different land-use types. FEMS Microbiol. Ecol. 2011, 78, 70–79. [Google Scholar] [CrossRef]
  39. Lauber, C.L.; Strickland, M.S.; Bradford, M.A.; Fierer, N. The influence of soil properties on the structure of bacterial and fungal communities across land-use types. Soil Biol. Biochem. 2008, 40, 2407–2415. [Google Scholar] [CrossRef]
  40. Franklin, R.B.; Mills, A.L. Multi-scale variation in spatial heterogeneity for microbial community structure in an eastern Virginia agricultural field. FEMS Microbiol. Ecol. 2003, 44, 335–346. [Google Scholar] [CrossRef]
  41. Nunan, N.; Wu, K.; Young, I.M.; Crawford, J.W.; Ritz, K. In situ spatial patterns of soil bacterial populations, mapped at multiple scales, in an arable soil. Microb. Ecol. 2002, 44, 296–305. [Google Scholar] [CrossRef]
  42. Ritz, K.; McNicol, J.; Nunan, N.; Grayston, S.; Millard, P.; Atkinson, D.; Gollotte, A.; Habeshaw, D.; Boag, B.; Clegg, C. Spatial structure in soil chemical and microbiological properties in an upland grassland. FEMS Microbiol. Ecol. 2004, 49, 191–205. [Google Scholar] [CrossRef]
  43. Gupta, V. Soil Biology in Pasture Systems: Knowledge and Opportunity Audit; Meat and Livestock Australia: Sydney, Australia, 2003. [Google Scholar]
  44. Hurlbert, S.H. Pseudoreplication and the design of ecological field experiments. Ecol. Monogr. 1984, 54, 187–211. [Google Scholar] [CrossRef]
  45. Wester, D.B. Replication, randomization, and statistics in range research. Rangel. Ecol. Manag./J. Range Manag. Arch. 1992, 45, 285–290. [Google Scholar] [CrossRef]
  46. Rowell, D. Laboratory methods for studying mineralization. In Soil Science: Methods and Applications; Longman Scientific and Technical, Longman Group UK Ltd.: London, UK, 1994. [Google Scholar]
  47. Nelson, D.A.; Sommers, L.E. Total carbon, organic carbon, and organic matter. In Methods of Soil Analysis: Part 2 Chemical and Microbiological Properties; Wiley: New York, NY, USA, 1983; Volume 9, pp. 539–579. [Google Scholar]
  48. Mulvaney, R.L. Nitrogen—Inorganic forms. In Methods of Soil Analysis: Part 3 Chemical Methods; Wiley: New York, NY, USA, 1996; Volume 5, pp. 1123–1184. [Google Scholar]
  49. Blake, G.; Hartge, K. Bulk density. In Methods of Soil Analysis: Part 1 Physical and Mineralogical Methods; Wiley: New York, NY, USA, 1996; Volume 5, pp. 363–375. [Google Scholar]
  50. Cook, K.; Ritchey, E.; Loughrin, J.; Haley, M.; Sistani, K.; Bolster, C.H. Effect of turning frequency and season on composting materials from swine high-rise facilities. Waste Manag. 2015, 39, 86–95. [Google Scholar] [CrossRef] [PubMed]
  51. Moran, P.A. Notes on continuous stochastic phenomena. Biometrika 1950, 37, 17–23. [Google Scholar] [CrossRef] [PubMed]
  52. Isaaks, E.H.; Srivastava, R.M. Applied Geostatistics; Oxford University Press: New York, NY, USA, 1989; Volume 561. [Google Scholar]
  53. Bhandral, R.; Saggar, S.; Bolan, N.; Hedley, M. Transformation of nitrogen and nitrous oxide emission from grassland soils as affected by compaction. Soil Tillage Res. 2007, 94, 482–492. [Google Scholar] [CrossRef]
  54. De Neve, S.; Hofman, G. Influence of soil compaction on carbon and nitrogen mineralization of soil organic matter and crop residues. Biol. Fertil. Soils 2000, 30, 544–549. [Google Scholar] [CrossRef]
  55. Greacen, E.L.; Sands, R. Compaction of forest soils. A review. Soil Res. 1980, 18, 163–189. [Google Scholar] [CrossRef]
  56. Murty, D.; Kirschbaum, M.U.; Mcmurtrie, R.E.; Mcgilvray, H. Does conversion of forest to agricultural land change soil carbon and nitrogen? A review of the literature. Glob. Chang. Biol. 2002, 8, 105–123. [Google Scholar] [CrossRef]
  57. Post, W.M.; Mann, L. Changes in Soil Organic Carbon and Nitrogen as a Result of Cultivation; Environmental System Science Data Infrastructure for a Virtual Ecosystem; U.S. Department of Energy Office of Scientific and Technical Information: Washington, DC, USA, 2005. [Google Scholar]
  58. Sun, R.; Guo, X.; Wang, D.; Chu, H. Effects of long-term application of chemical and organic fertilizers on the abundance of microbial communities involved in the nitrogen cycle. Appl. Soil Ecol. 2015, 95, 171–178. [Google Scholar] [CrossRef]
  59. Beyaert, R.; Paul Voroney, R. Estimation of decay constants for crop residues measured over 15 years in conventional and reduced tillage systems in a coarse-textured soil in southern Ontario. Can. J. Soil Sci. 2011, 91, 985–995. [Google Scholar] [CrossRef]
  60. Broder, M.; Wagner, G. Microbial colonization and decomposition of corn, wheat, and soybean residue. Soil Sci. Soc. Am. J. 1988, 52, 112–117. [Google Scholar] [CrossRef]
  61. McDaniel, M.; Grandy, A.; Tiemann, L.; Weintraub, M. Crop rotation complexity regulates the decomposition of high and low quality residues. Soil Biol. Biochem. 2014, 78, 243–254. [Google Scholar] [CrossRef]
  62. Williams, D.L.; Ineson, P.; Coward, P. Temporal variations in nitrous oxide fluxes from urine-affected grassland. Soil Biol. Biochem. 1999, 31, 779–788. [Google Scholar] [CrossRef]
  63. Rasiah, V.; Kay, B. Legume N mineralization: Effect of aeration and size distribution of water-filled pores. Soil Biol. Biochem. 1998, 30, 89–96. [Google Scholar] [CrossRef]
  64. Frijlink, M.J.; Abee, T.; Laanbroek, H.J.; de Boer, W.; Konings, W.N. The bioenergetics of ammonia and hydroxylamine oxidation in Nitrosomonas europaea at acid and alkaline pH. Arch. Microbiol. 1992, 157, 194–199. [Google Scholar] [CrossRef]
  65. Ashworth, A.; DeBruyn, J.; Allen, F.; Radosevich, M.; Owens, P. Microbial community structure is affected by cropping sequences and poultry litter under long-term no-tillage. Soil Biol. Biochem. 2017, 114, 210–219. [Google Scholar] [CrossRef]
  66. Lauber, C.L.; Ramirez, K.S.; Aanderud, Z.; Lennon, J.; Fierer, N. Temporal variability in soil microbial communities across land-use types. ISME J. 2013, 7, 1641–1650. [Google Scholar] [CrossRef]
  67. Bardgett, R.; Leemans, D.; Cook, R.; Hobbs, P.J. Seasonality of the soil biota of grazed and ungrazed hill grasslands. Soil Biol. Biochem. 1997, 29, 1285–1294. [Google Scholar] [CrossRef]
  68. Bruns, M.A.; Stephen, J.R.; Kowalchuk, G.A.; Prosser, J.I.; Paul, E.A. Comparative diversity of ammonia oxidizer 16S rRNA gene sequences in native, tilled, and successional soils. Appl. Environ. Microbiol. 1999, 65, 2994–3000. [Google Scholar] [CrossRef]
  69. Cruz-Martínez, K.; Suttle, K.B.; Brodie, E.L.; Power, M.E.; Andersen, G.L.; Banfield, J.F. Despite strong seasonal responses, soil microbial consortia are more resilient to long-term changes in rainfall than overlying grassland. ISME J. 2009, 3, 738–744. [Google Scholar] [CrossRef]
  70. Philippot, L.; Hallin, S.; Schloter, M. Ecology of denitrifying prokaryotes in agricultural soil. Adv. Agron. 2007, 96, 249–305. [Google Scholar]
  71. Bardgett, R.D.; Wardle, D.A. Herbivore-mediated linkages between aboveground and belowground communities. Ecology 2003, 84, 2258–2268. [Google Scholar] [CrossRef]
  72. Gaillard, V.; Chenu, C.; Recous, S.; Richard, G. Carbon, nitrogen and microbial gradients induced by plant residues decomposing in soil. Eur. J. Soil Sci. 1999, 50, 567–578. [Google Scholar] [CrossRef]
  73. Hermansson, A.; Lindgren, P.-E. Quantification of ammonia-oxidizing bacteria in arable soil by real-time PCR. Appl. Environ. Microbiol. 2001, 67, 972–976. [Google Scholar] [CrossRef] [PubMed]
  74. Fan, F.; Yang, Q.; Li, Z.; Wei, D.; Cui, X.A.; Liang, Y. Impacts of organic and inorganic fertilizers on nitrification in a cold climate soil are linked to the bacterial ammonia oxidizer community. Microb. Ecol. 2011, 62, 982–990. [Google Scholar] [CrossRef]
  75. He, J.Z.; Shen, J.P.; Zhang, L.M.; Zhu, Y.G.; Zheng, Y.M.; Xu, M.G.; Di, H. Quantitative analyses of the abundance and composition of ammonia-oxidizing bacteria and ammonia-oxidizing archaea of a Chinese upland red soil under long-term fertilization practices. Environ. Microbiol. 2007, 9, 2364–2374. [Google Scholar] [CrossRef]
  76. McAndrew, D.; Malhi, S. Long-term N fertilization of a solonetzic soil: Effects on chemical and biological properties. Soil Biol. Biochem. 1992, 24, 619–623. [Google Scholar] [CrossRef]
  77. Miller, M.; Zebarth, B.; Dandie, C.; Burton, D.; Goyer, C.; Trevors, J. Crop residue influence on denitrification, N2O emissions and denitrifier community abundance in soil. Soil Biol. Biochem. 2008, 40, 2553–2562. [Google Scholar] [CrossRef]
  78. Jones, C.M.; Stres, B.; Rosenquist, M.; Hallin, S. Phylogenetic analysis of nitrite, nitric oxide, and nitrous oxide respiratory enzymes reveal a complex evolutionary history for denitrification. Mol. Biol. Evol. 2008, 25, 1955–1966. [Google Scholar] [CrossRef]
  79. Philippot, L. Denitrifying genes in bacterial and archaeal genomes. Biochim. Biophys. Acta (BBA)-Gene Struct. Expr. 2002, 1577, 355–376. [Google Scholar] [CrossRef]
  80. Bru, D.; Ramette, A.; Saby, N.; Dequiedt, S.; Ranjard, L.; Jolivet, C.; Arrouays, D.; Philippot, L. Determinants of the distribution of nitrogen-cycling microbial communities at the landscape scale. ISME J. 2011, 5, 532–542. [Google Scholar] [CrossRef] [PubMed]
  81. Wessén, E.; Söderström, M.; Stenberg, M.; Bru, D.; Hellman, M.; Welsh, A.; Thomsen, F.; Klemedtson, L.; Philippot, L.; Hallin, S. Spatial distribution of ammonia-oxidizing bacteria and archaea across a 44-hectare farm related to ecosystem functioning. ISME J. 2011, 5, 1213–1225. [Google Scholar] [CrossRef] [PubMed]
Figure 1. The three experimental fields (tall fescue, winter wheat plus soybean double-cropping without grazing, and winter wheat plus soybean double-cropping with grazing) and georeferenced soil sampling locations (yellow dots).
Agronomy 13 01461 g001
Figure 2. Kriged maps for the spatial distributions of soil pH and bacterial genes across the three cropping systems: (a) soil pH, (b) 16S rRNA, (c) amoA, (d) narG, (e) nirK, and (f) nosZ.
Agronomy 13 01461 g002aAgronomy 13 01461 g002b
Table 1. Mean initial (fall 2016) levels of soil physicochemical properties, total bacteria, and N-cycling bacterial gene concentrations at the experimental sites.
TFWSWGS
n121112
Soil properties
Bulk density (g cm−3)1.29 ± 0.03 a1.38 ± 0.04 ab1.42 ± 0.02 b
pH6.62 ± 0.16 a5.76 ± 0.29 a5.81 ± 0.25 a
------------------------------- g kg−1 -------------------------------
OM27.4 ± 1.62 a24.9 ± 1.38 a24.55 ± 0.86 a
TN2.85 ± 0.09 a2.96 ± 0.09 a2.72 ± 0.08 a
------------------------------ mg kg−1 ------------------------------
NO3-N4.19 ± 0.51 a1.77 ± 0.24 b1.82 ± 0.29 b
NH4-N27.35 ± 1.77 a22.6 ± 0.77 b21.78 ± 1.01 b
Bacterial genes----------------------- log10 gene copies -----------------------
16S rRNA10.07 ± 0.04 a9.95 ± 0.04 a9.94 ± 0.04 a
amoA7.13 ± 0.10 a6.64 ± 0.18 a6.64 ± 0.11 a
narG7.57 ± 0.12 a7.13 ± 0.17 a7.23 ± 0.06 a
nirK7.74 ± 0.05 a7.60 ± 0.08 a7.52 ± 0.02 a
nosZ8.21 ± 0.05 a8.09 ± 0.09 a7.94 ± 0.05 a
TF: tall fescue pasturing; WS: winter wheat–soybean double-cropping without spring grazing; WGS: winter wheat–soybean double-cropping with spring grazing; OM: soil organic matter; TN: total soil N. Mean ± SE; numbers with different letters for each soil variable within rows are significantly different (p < 0.05).
Table 2. Mean soil bulk densities of the cropping systems during 2017–2018.
TFWSWGS
n242224
-------------------------------- g cm−3 --------------------------------
Bulk Density1.22 ± 0.02 a1.34 ± 0.02 b1.39 ± 0.02 b
TF: tall fescue pasturing; WS: winter wheat–soybean double-cropping without spring grazing; WGS: winter wheat–soybean double-cropping with spring grazing. Mean ± SE; numbers with different letters within the row are significantly different (p < 0.05).
Table 3. Mean soil chemical properties of the cropping systems.
nSpring 2017Fall 2017Spring 2018Fall 2018Mean
pH
TF126.33 ± 0.14 a6.37 ± 0.14 a6.28 ± 0.13 a6.51 ± 0.15 a
WS116.06 ± 0.13 a5.80 ± 0.14 b5.75 ± 0.13 b5.66 ± 0.16 b
WGS126.05 ± 0.14 a5.83 ± 0.14 b5.83 ± 0.13 b5.77 ± 0.15 b
------------------------------------ g kg−1 ---------------------------------
OM
TF1226.40 ± 1.00 a24.78 ± 1.02 a32.13 ± 1.14 a33.47 ± 1.06 a
WS1127.65 ± 1.03 a23.32 ± 1.07 ab31.54 ± 1.19 a30.30 ± 1.10 ab
WGS1223.15 ± 0.99 b20.30 ± 1.03 b26.66 ± 1.14 b27.12 ± 1.06 b
TC
TF1220.50 ± 0.98 a36.50 ± 1.63 a33.80 ± 1.4 a28.68 ± 1.07 a
WS1122.09 ± 1.02 a30.96 ± 1.70 ab31.99 ± 1.02 a27.17 ± 1.12 a
WGS1217.60 ± 0.98 b28.32 ± 0.95 b29.95 ± 1.83 a25.24 ± 1.07 a
TN
TF122.36 ± 0.09 a3.45 ± 0.14 a3.67 ± 0.19 b2.59 ± 0.07 a
WS112.34 ± 0.09 a2.92 ± 0.15 ab4.46 ± 0.20 a2.59 ± 0.07 a
WGS121.92 ± 0.09 b2.82 ± 0.15 b4.19 ± 0.19 ab2.22 ± 0.07 b
------------------------------------ mg kg−1 ------------------------------
NH4-N
TF48----9.56 ± 0.94 a
WS44----10.1 ± 1.05 a
WGS48----9.54 ± 1.0 a
NO3-N
TF125.79 ± 1.13 a8.49 ± 1.1 a5.77 ± 0.94 b6.56 ± 0.45 a
WS113.33 ± 1.18 a9.47 ± 1.14 a11.51 ± 0.94 a4.72 ± 0.45 b
WGS124.06 ± 1.13 a8.74 ± 1.10 a10.35 ± 0.9 a4.17 ± 0.47 b
TF: tall fescue pasturing; WS: winter wheat–soybean double-cropping without spring grazing; WGS: winter wheat–soybean double-cropping with spring grazing; OM: soil organic matter; TC; total soil C; TN: total soil N. Mean ± SE, numbers with different letters for each soil variable within columns (seasons) are significantly different (p < 0.05).
Table 4. Mean bacterial gene copy numbers of cropping system treatments.
TFWSWGS
n121112
16S rRNA9.87 ± 0.06 a9.78 ± 0.06 ab9.63 ± 0.06 b
amoA 7.01 ± 0.1 a6.49 ± 0.1 b6.42 ± 0.1 b
narG 7.25 ± 0.06 a7.17 ± 0.06 a6.88 ± 0.06 b
nirK 7.52 ± 0.04 a7.35 ± 0.04 b7.25 ± 0.04 b
nosZ 7.98 ± 0.05 a7.89 ± 0.05 a7.82 ± 0.05 a
Mean ± SE, numbers with different letters for each bacterial gene within rows are significantly different (p < 0.05).
Table 5. Correlations between soil properties and the abundances of bacterial genes in the three cropping systems.
Cropping System/
Bacterial Gene
npHOMNO3-NNH4-N
TF48
16S rRNA 0.200.34 **0.180.31 *
amoA 0.37 ** 0.32 *0.39 **0.14
narG 0.46 **0.46 **0.30 *0.17
nirK 0.180.37 **0.180.53 **
nosZ 0.200.35 *0.130.52 **
WS/WGS92
16S rRNA 0.25 *0.30 **0.130.17
amoA 0.59 *0.25 *0.160.12
narG 0.46 **0.32 **0.140.18
nirK 0.50 **0.120.030.42 **
nosZ 0.59 **0.060.040.35 **
Pearson’s correlation coefficients are significant * p < 0.05 and ** p < 0.00.
Disclaimer/Publisher’s Note: The statements, opinions and data contained in all publications are solely those of the individual author(s) and contributor(s) and not of MDPI and/or the editor(s). MDPI and/or the editor(s) disclaim responsibility for any injury to people or property resulting from any ideas, methods, instructions or products referred to in the content.

