

Improving the Oenological Potential of Grapes for Prosecco PDO Sparkling Wine Thanks to Nitrogen Fertigation
 , , , ,
  and
and
Abstract
:1. Introduction
2. Materials and Methods
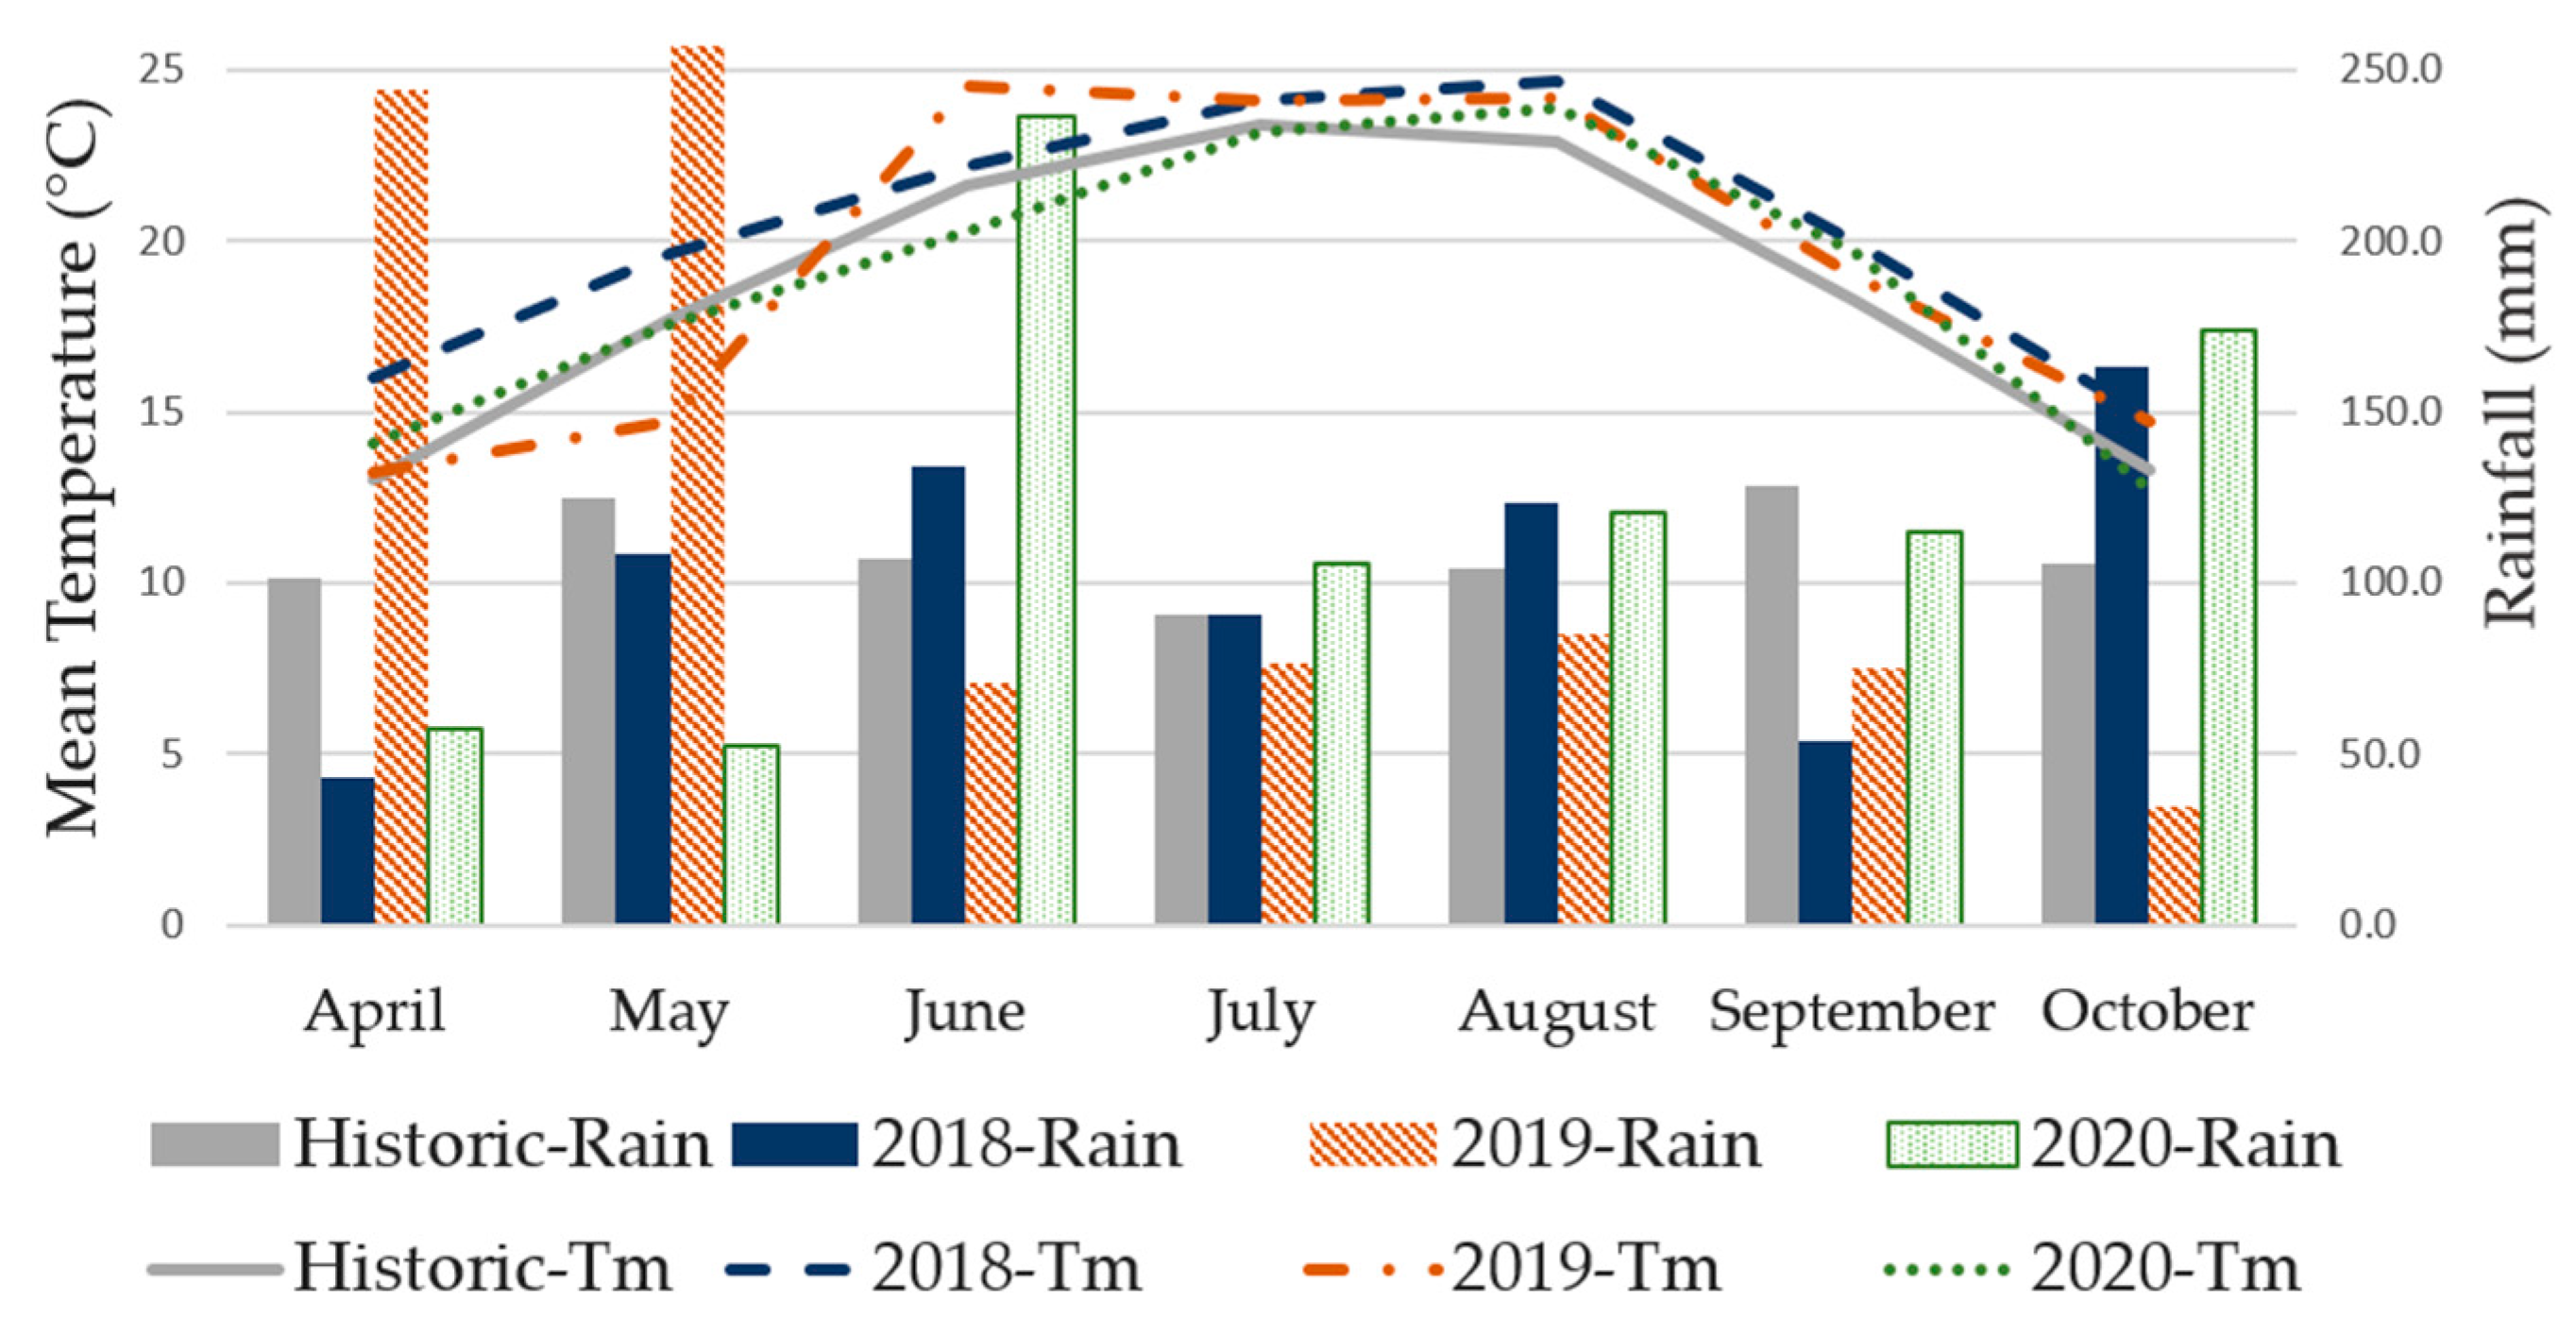
2.1. Experimental Site and Vine Management
2.2. Experimental Design and Fruits and Vines Sampling
2.3. Winemaking
2.4. Statistical Analysis
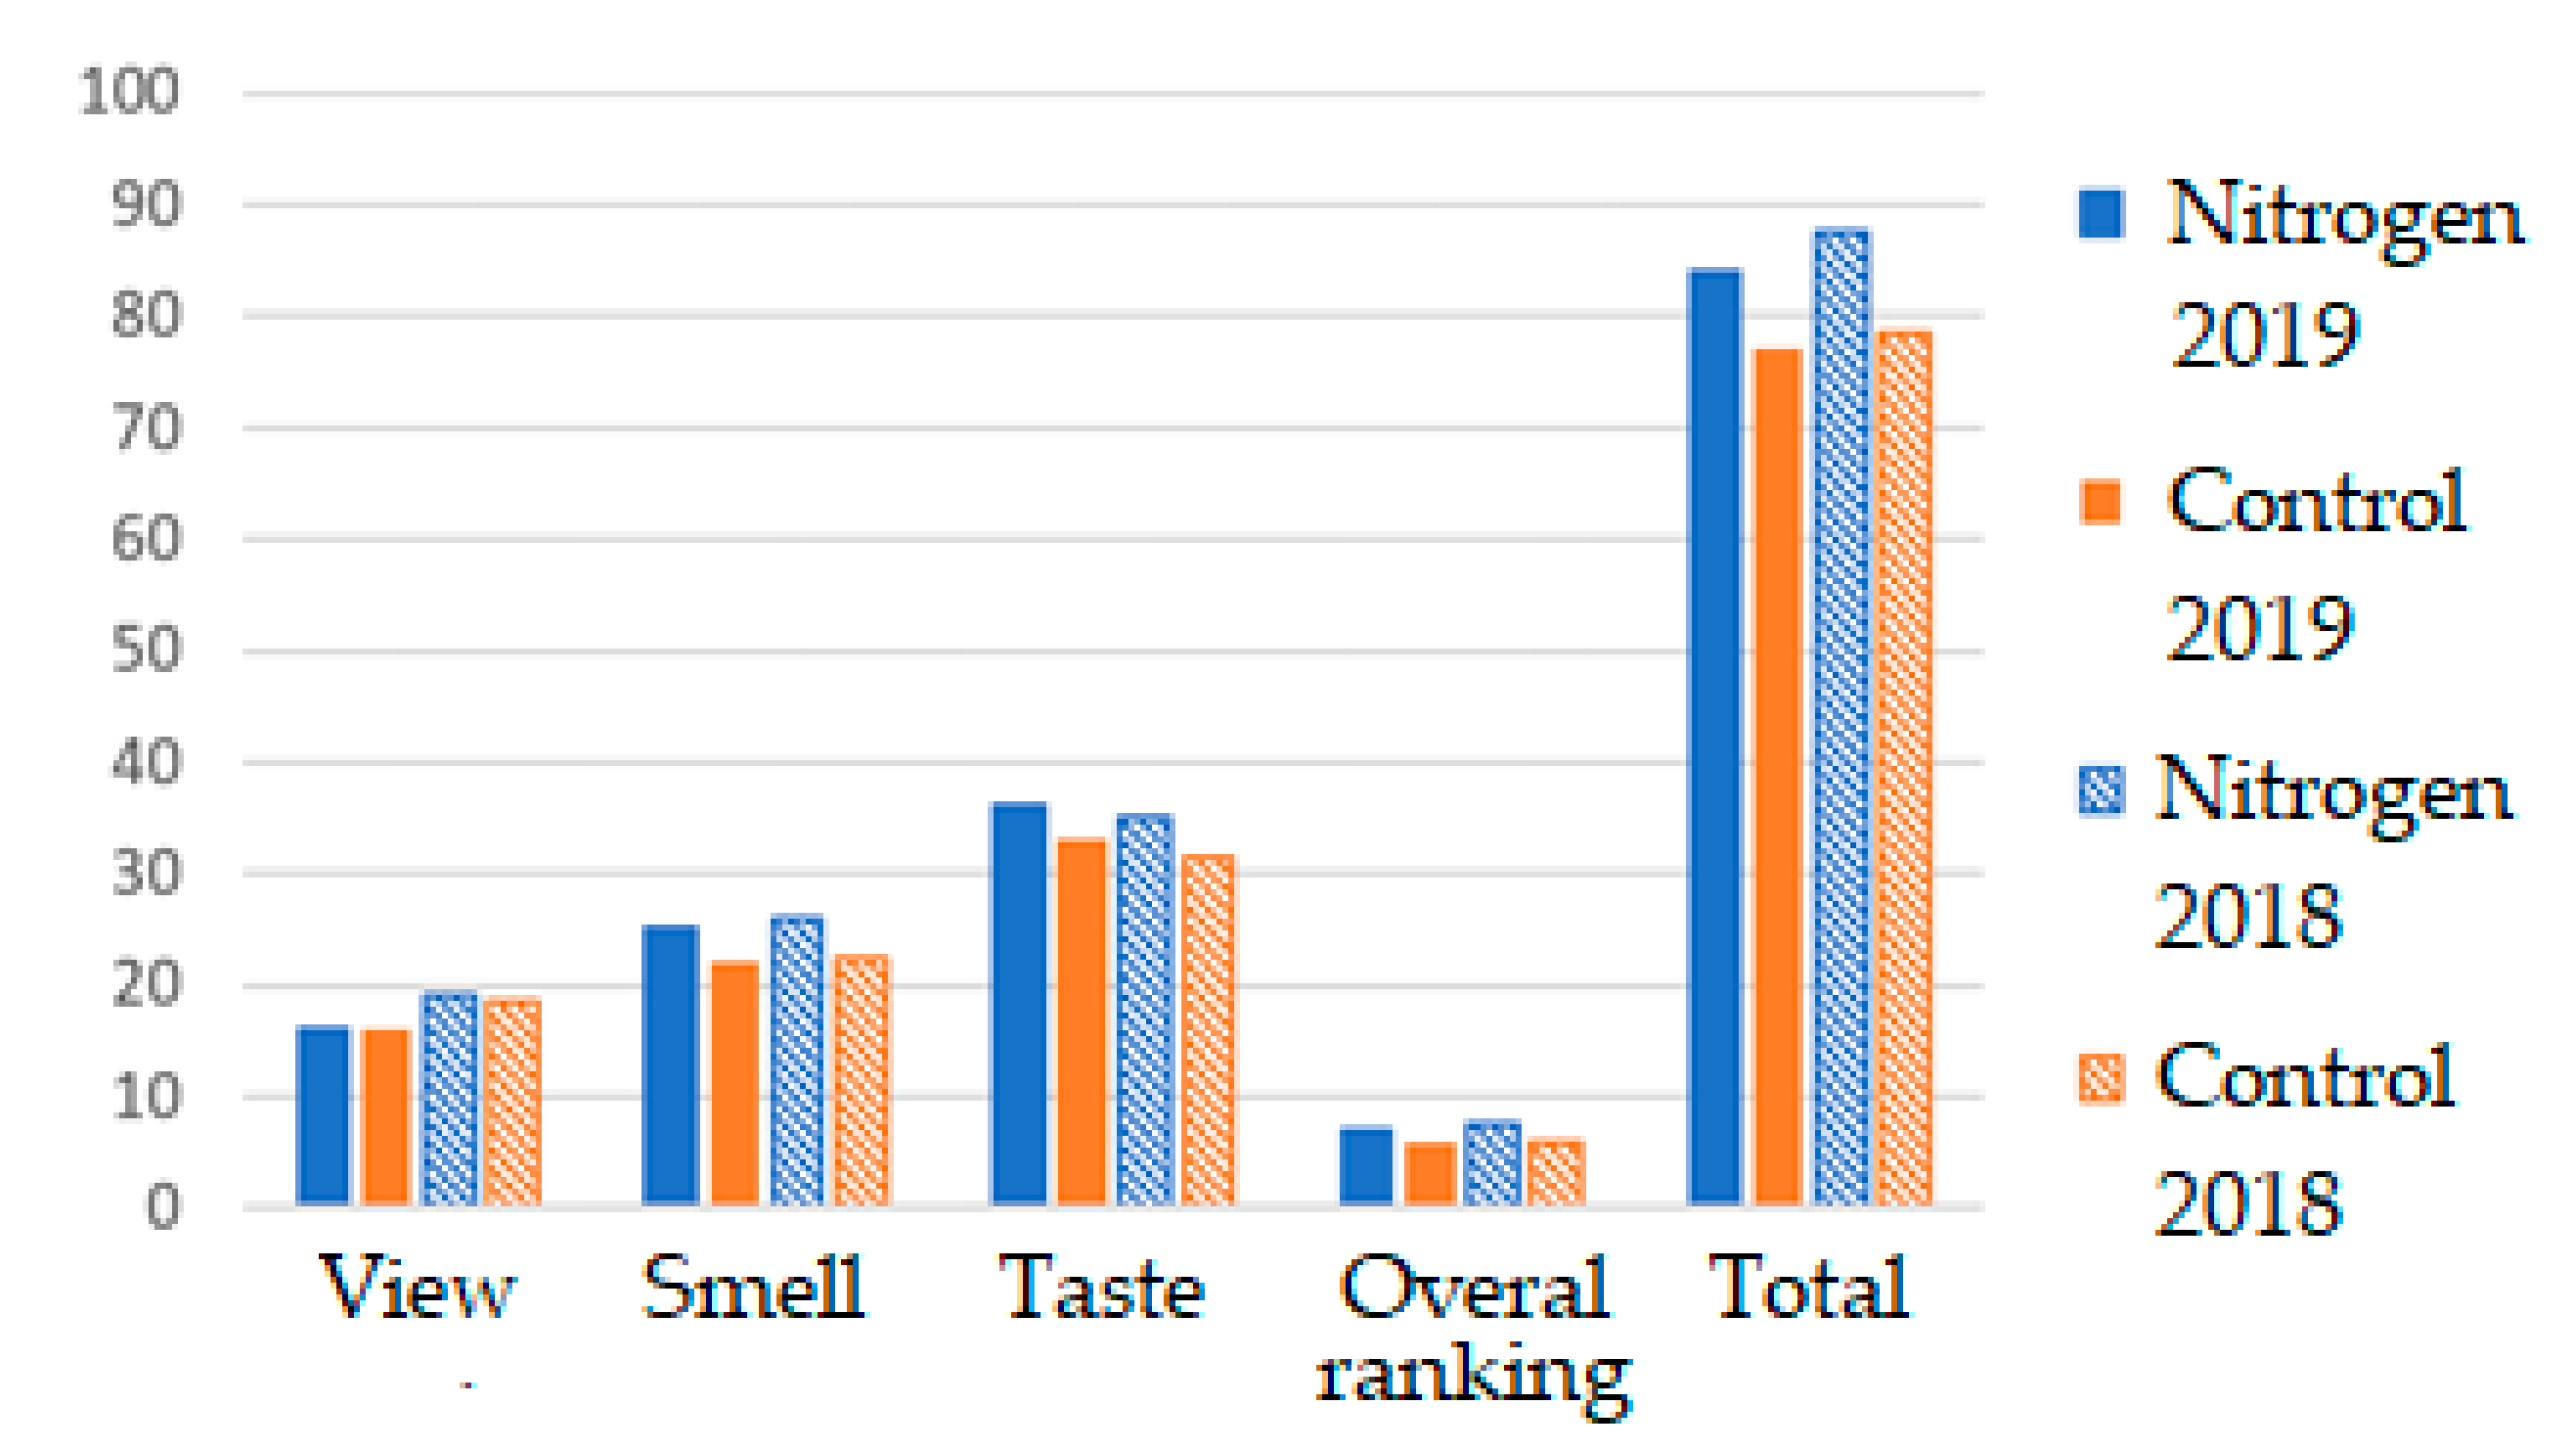
3. Results
4. Discussion
5. Conclusions
Author Contributions
Funding
Data Availability Statement
Acknowledgments
Conflicts of Interest
Appendix A

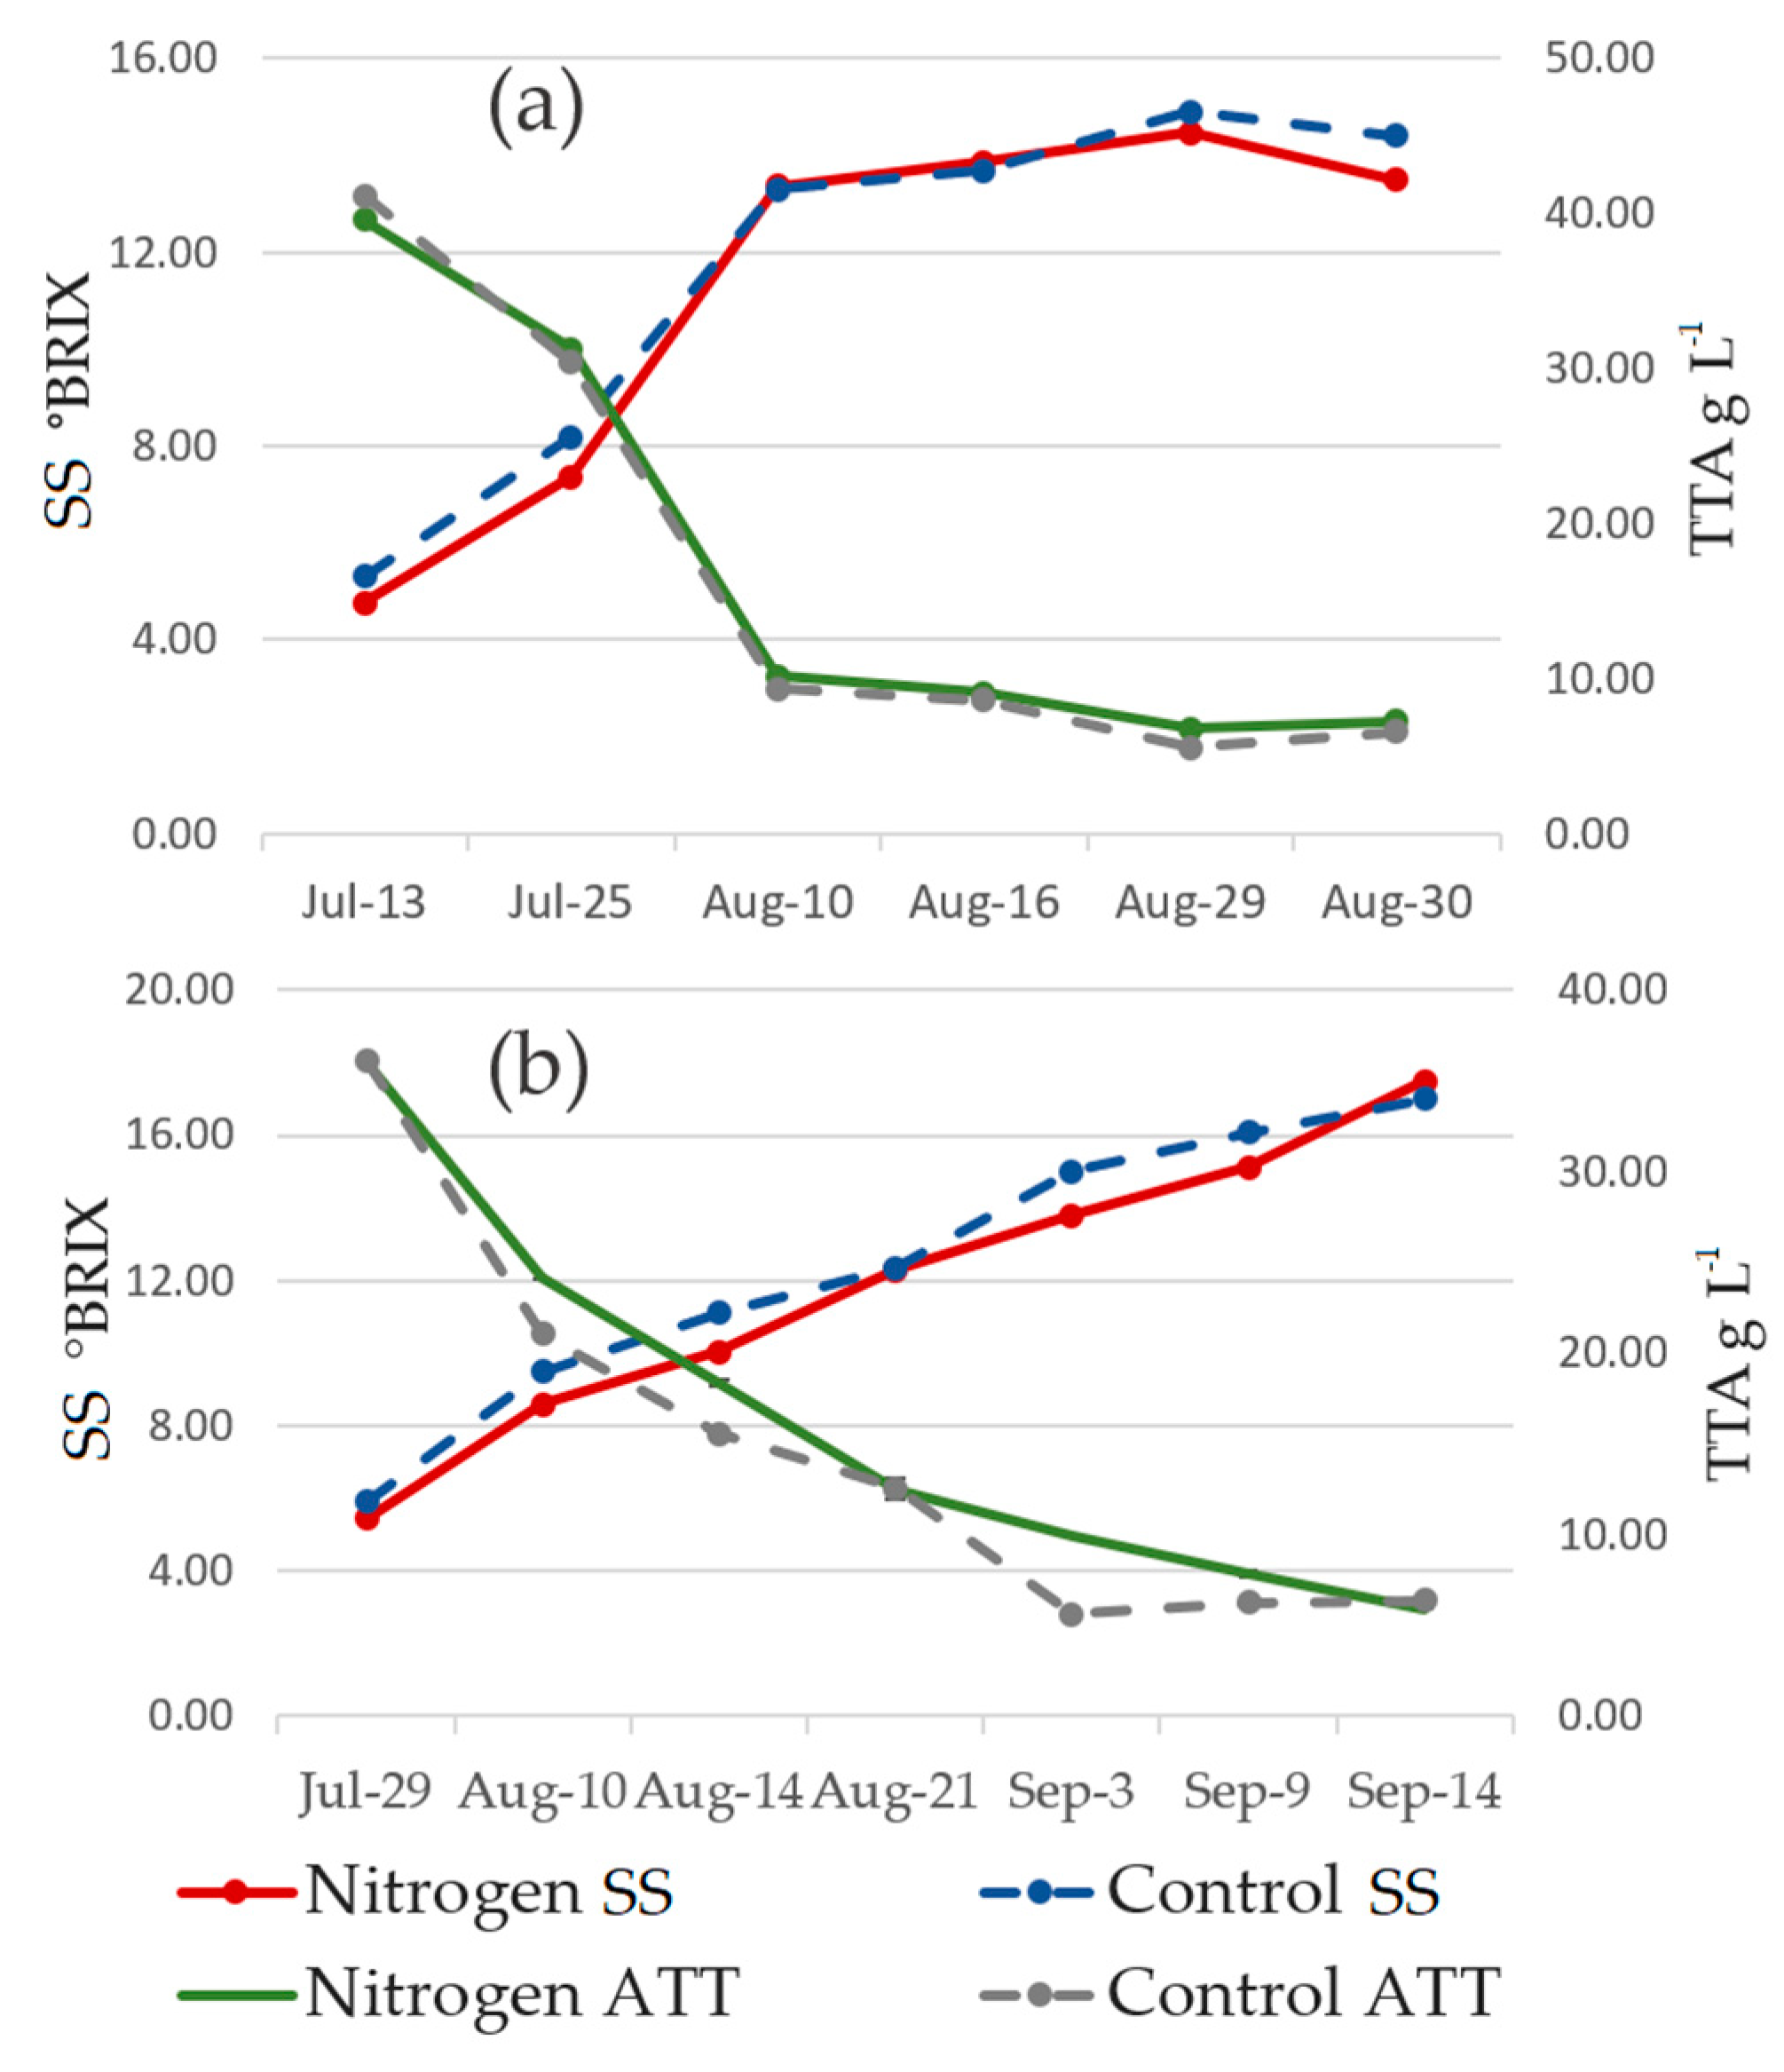
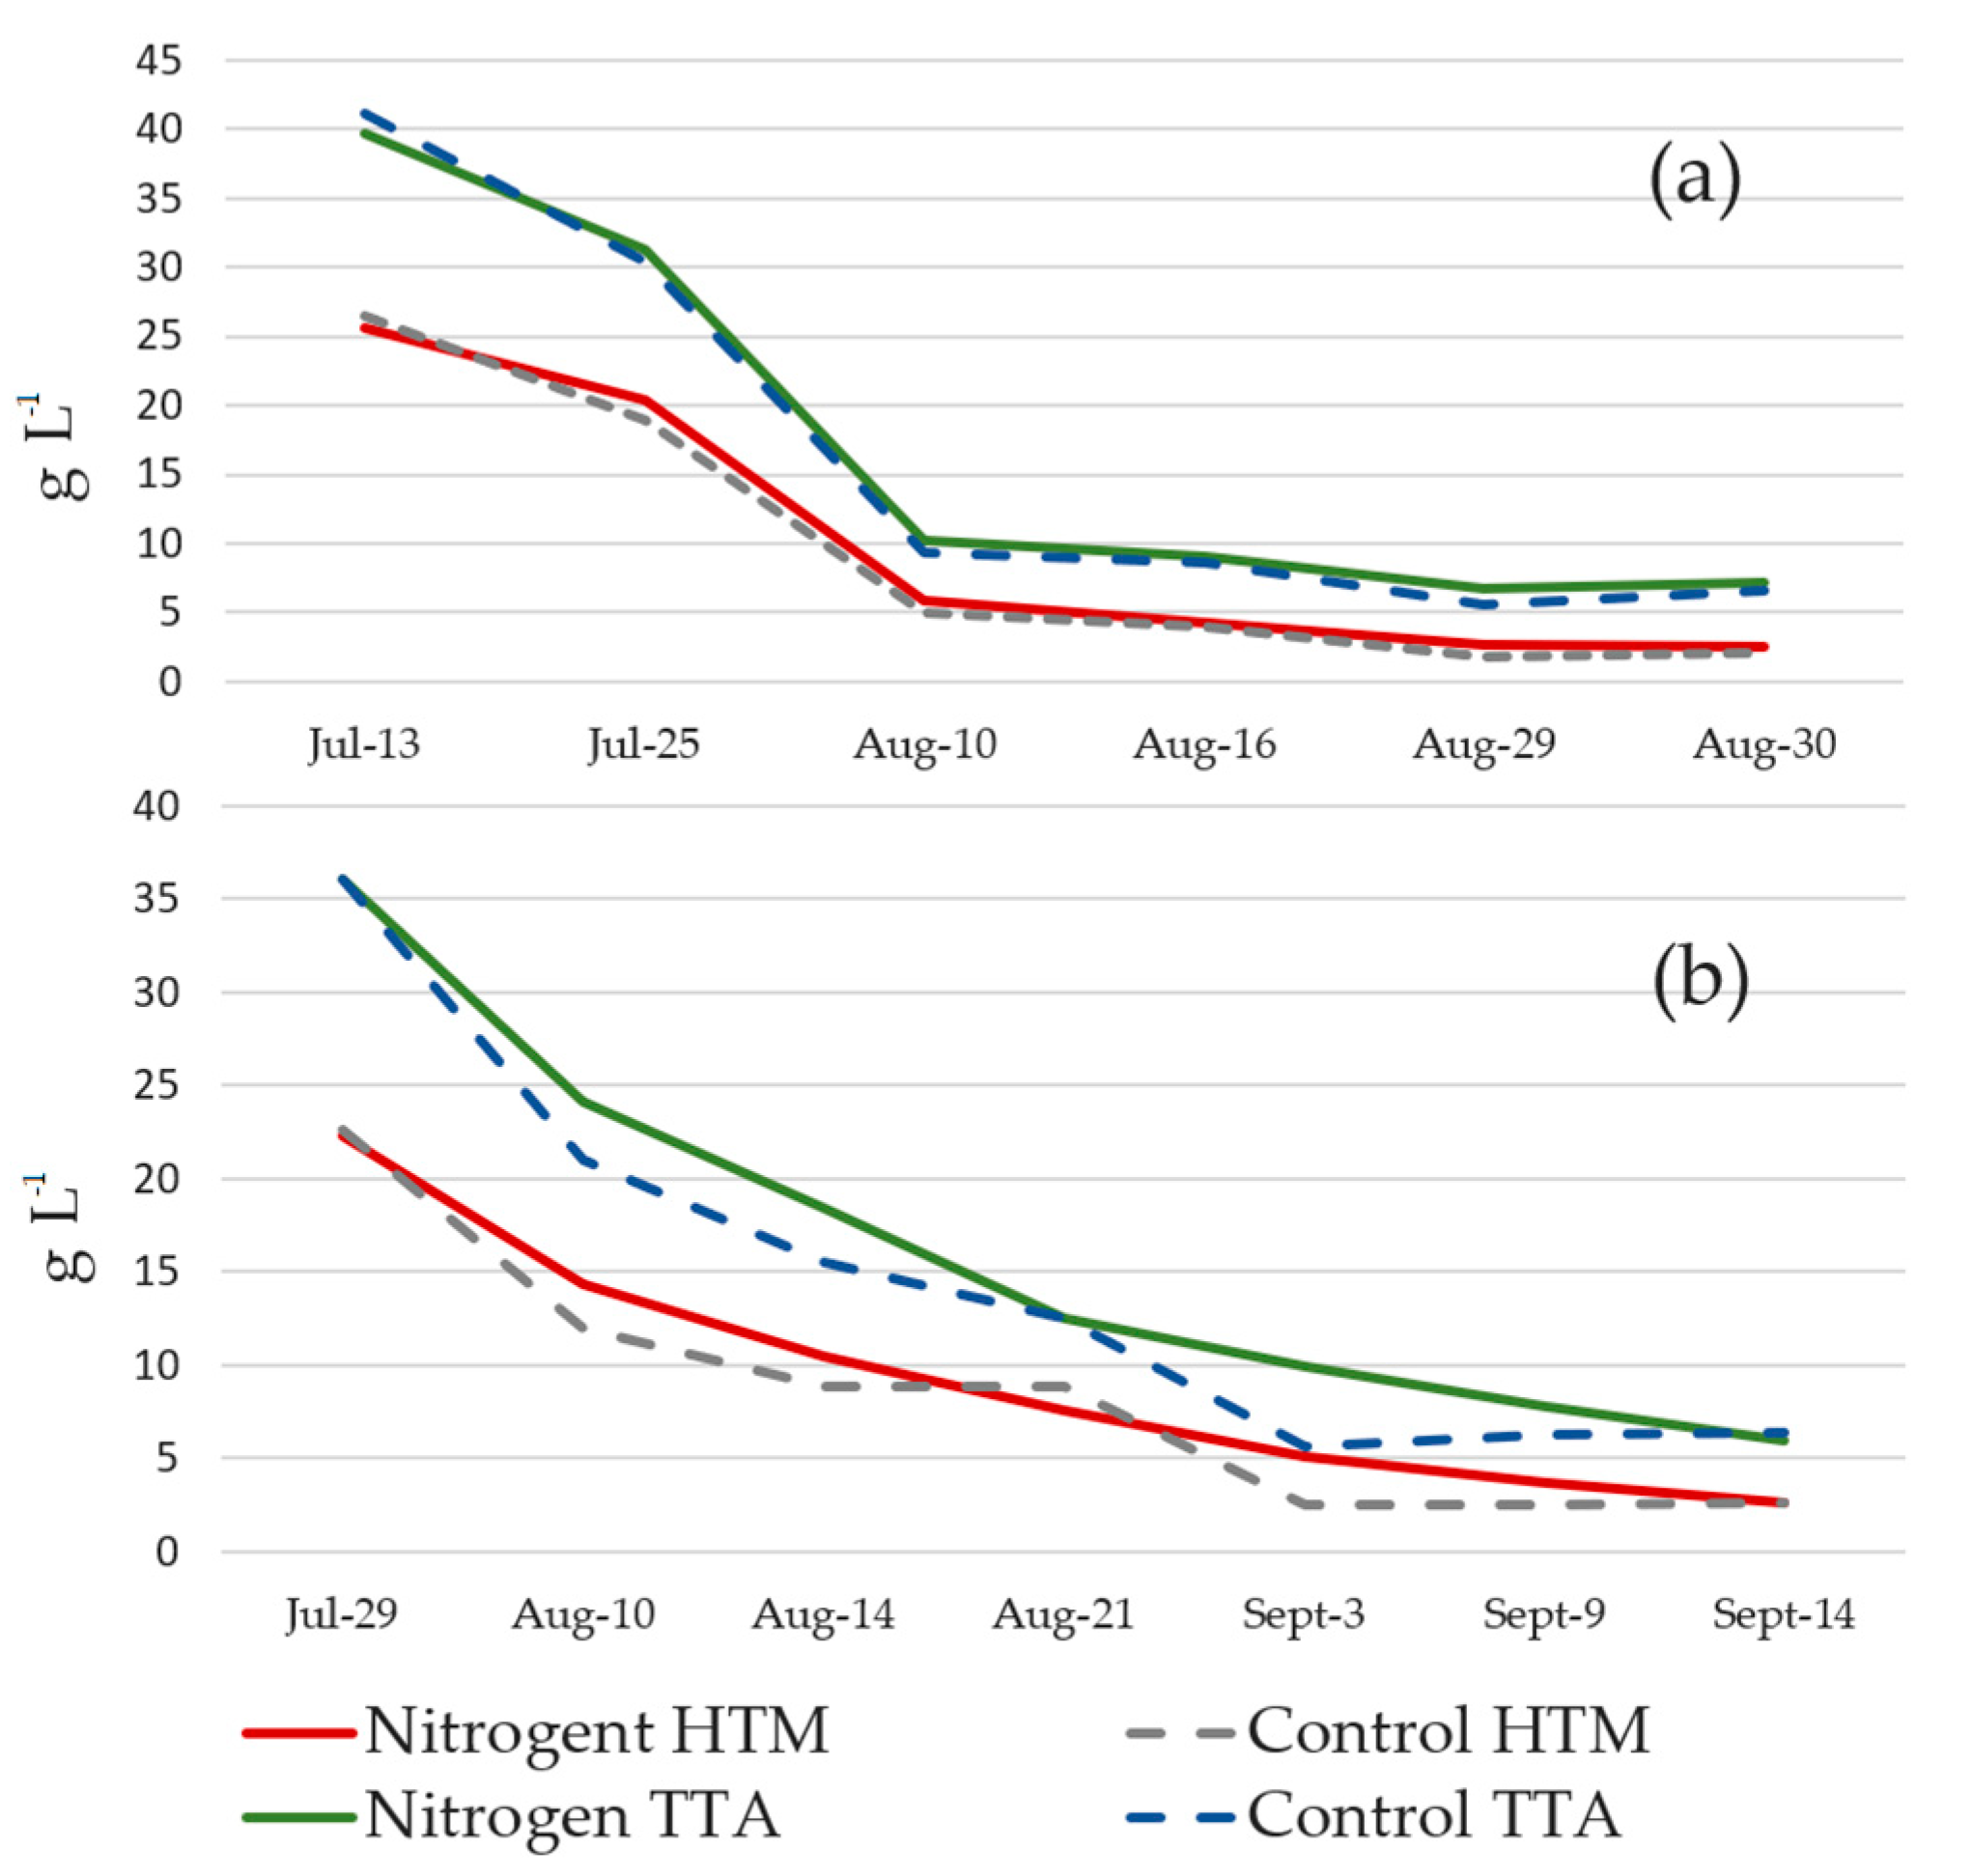
| Vintage | Date | Treatment | HTH g L−1 | HMH g L−1 | SS (°BRIX) | HTH+HMH g L−1 | TTA g L−1 | pH |
|---|---|---|---|---|---|---|---|---|
| 2018 | 13-July | Nitrogen | 13.14 | 25.62 | 4.77 | 38.76 | 39.64 | 2.45 |
| 2018 | 13-July | Control | 13.31 | 26.50 | 5.30 | 39.81 | 41.17 | 2.47 |
| 2018 | 25-July | Nitrogen | 10.49 | 20.43 | 7.37 | 30.92 | 31.29 | 2.35 |
| 2018 | 25-July | Control | 10.62 | 18.98 | 8.20 | 29.60 | 30.41 | 2.36 |
| 2018 | 10-August | Nitrogen | 6.44 | 5.88 | 13.37 | 12.32 | 10.16 | 3.22 |
| 2018 | 10-August | Control | 6.61 | 4.99 | 13.30 | 11.60 | 9.32 | 3.29 |
| 2018 | 16-August | Nitrogen | 5.19 | 4.27 | 13.87 | 9.46 | 9.06 | 3.26 |
| 2018 | 16-August | Control | 5.67 | 3.91 | 13.70 | 9.58 | 8.57 | 3.28 |
| 2018 | 29-August | Nitrogen | 5.09 | 2.66 | 14.47 | 7.75 | 6.76 | 3.22 |
| 2018 | 29-August | Control | 5.56 | 1.84 | 14.90 | 7.40 | 5.53 | 3.30 |
| 2018 | 30-August | Nitrogen | 7.03 | 2.49 | 13.50 | 9.52 | 7.23 | 3.17 |
| 2018 | 30-August | Control | 6.38 | 2.10 | 14.40 | 8.48 | 6.60 | 3.17 |
| 2019 | 28-August | Nitrogen | 8.11 | 7.51 | 13.90 | 15.62 | 13.51 | 2.92 |
| 2019 | 28-August | Control | 7.67 | 5.02 | 13.80 | 12.69 | 11.49 | 2.95 |
| 2019 | 5-September | Nitrogen | 7.40 | 5.29 | 15.00 | 12.69 | 11.48 | 3.03 |
| 2019 | 5-September | Control | 6.63 | 2.92 | 14.90 | 9.55 | 8.61 | 3.12 |
| 2019 | 16-September | Nitrogen | 6.23 | 3.42 | 16.37 | 9.65 | 8.60 | 3.17 |
| 2019 | 16-September | Control | 5.64 | 2.20 | 16.53 | 7.84 | 6.54 | 3.31 |
| 2020 | 29-July | Nitrogen | 12.54 | 22.21 | 5.60 | 34.75 | 36.10 | 2.45 |
| 2020 | 29-July | Control | 12.73 | 22.59 | 5.70 | 35.32 | 36.10 | 2.40 |
| 2020 | 10-August | Nitrogen | 10.67 | 14.34 | 8.60 | 25.02 | 24.10 | 2.59 |
| 2020 | 10-August | Control | 9.69 | 12.02 | 9.50 | 21.71 | 21.05 | 2.71 |
| 2020 | 14-August | Nitrogen | 8.97 | 10.46 | 10.05 | 19.44 | 18.39 | 2.86 |
| 2020 | 14-August | Control | 8.77 | 8.84 | 11.10 | 17.61 | 15.54 | 2.93 |
| 2020 | 21-August | Nitrogen | 7.90 | 7.53 | 12.30 | 15.43 | 12.50 | 2.99 |
| 2020 | 21-August | Control | 7.49 | 6.68 | 12.35 | 14.18 | 12.55 | 3.00 |
| 2020 | 3-September | Nitrogen | 7.22 | 5.13 | 13.80 | 12.35 | 9.91 | 3.13 |
| 2020 | 3-September | Control | 5.66 | 2.50 | 15.00 | 8.16 | 5.61 | 3.38 |
| 2020 | 9-September | Nitrogen | 6.70 | 3.65 | 15.13 | 10.34 | 7.82 | 3.23 |
| 2020 | 9-September | Control | 6.08 | 2.41 | 16.07 | 8.49 | 6.26 | 3.33 |
| 2020 | 14-September | Nitrogen | 6.03 | 2.63 | 17.50 | 8.66 | 5.92 | 3.33 |
| 2020 | 14-September | Control | 6.25 | 2.57 | 17.00 | 8.82 | 6.36 | 3.22 |
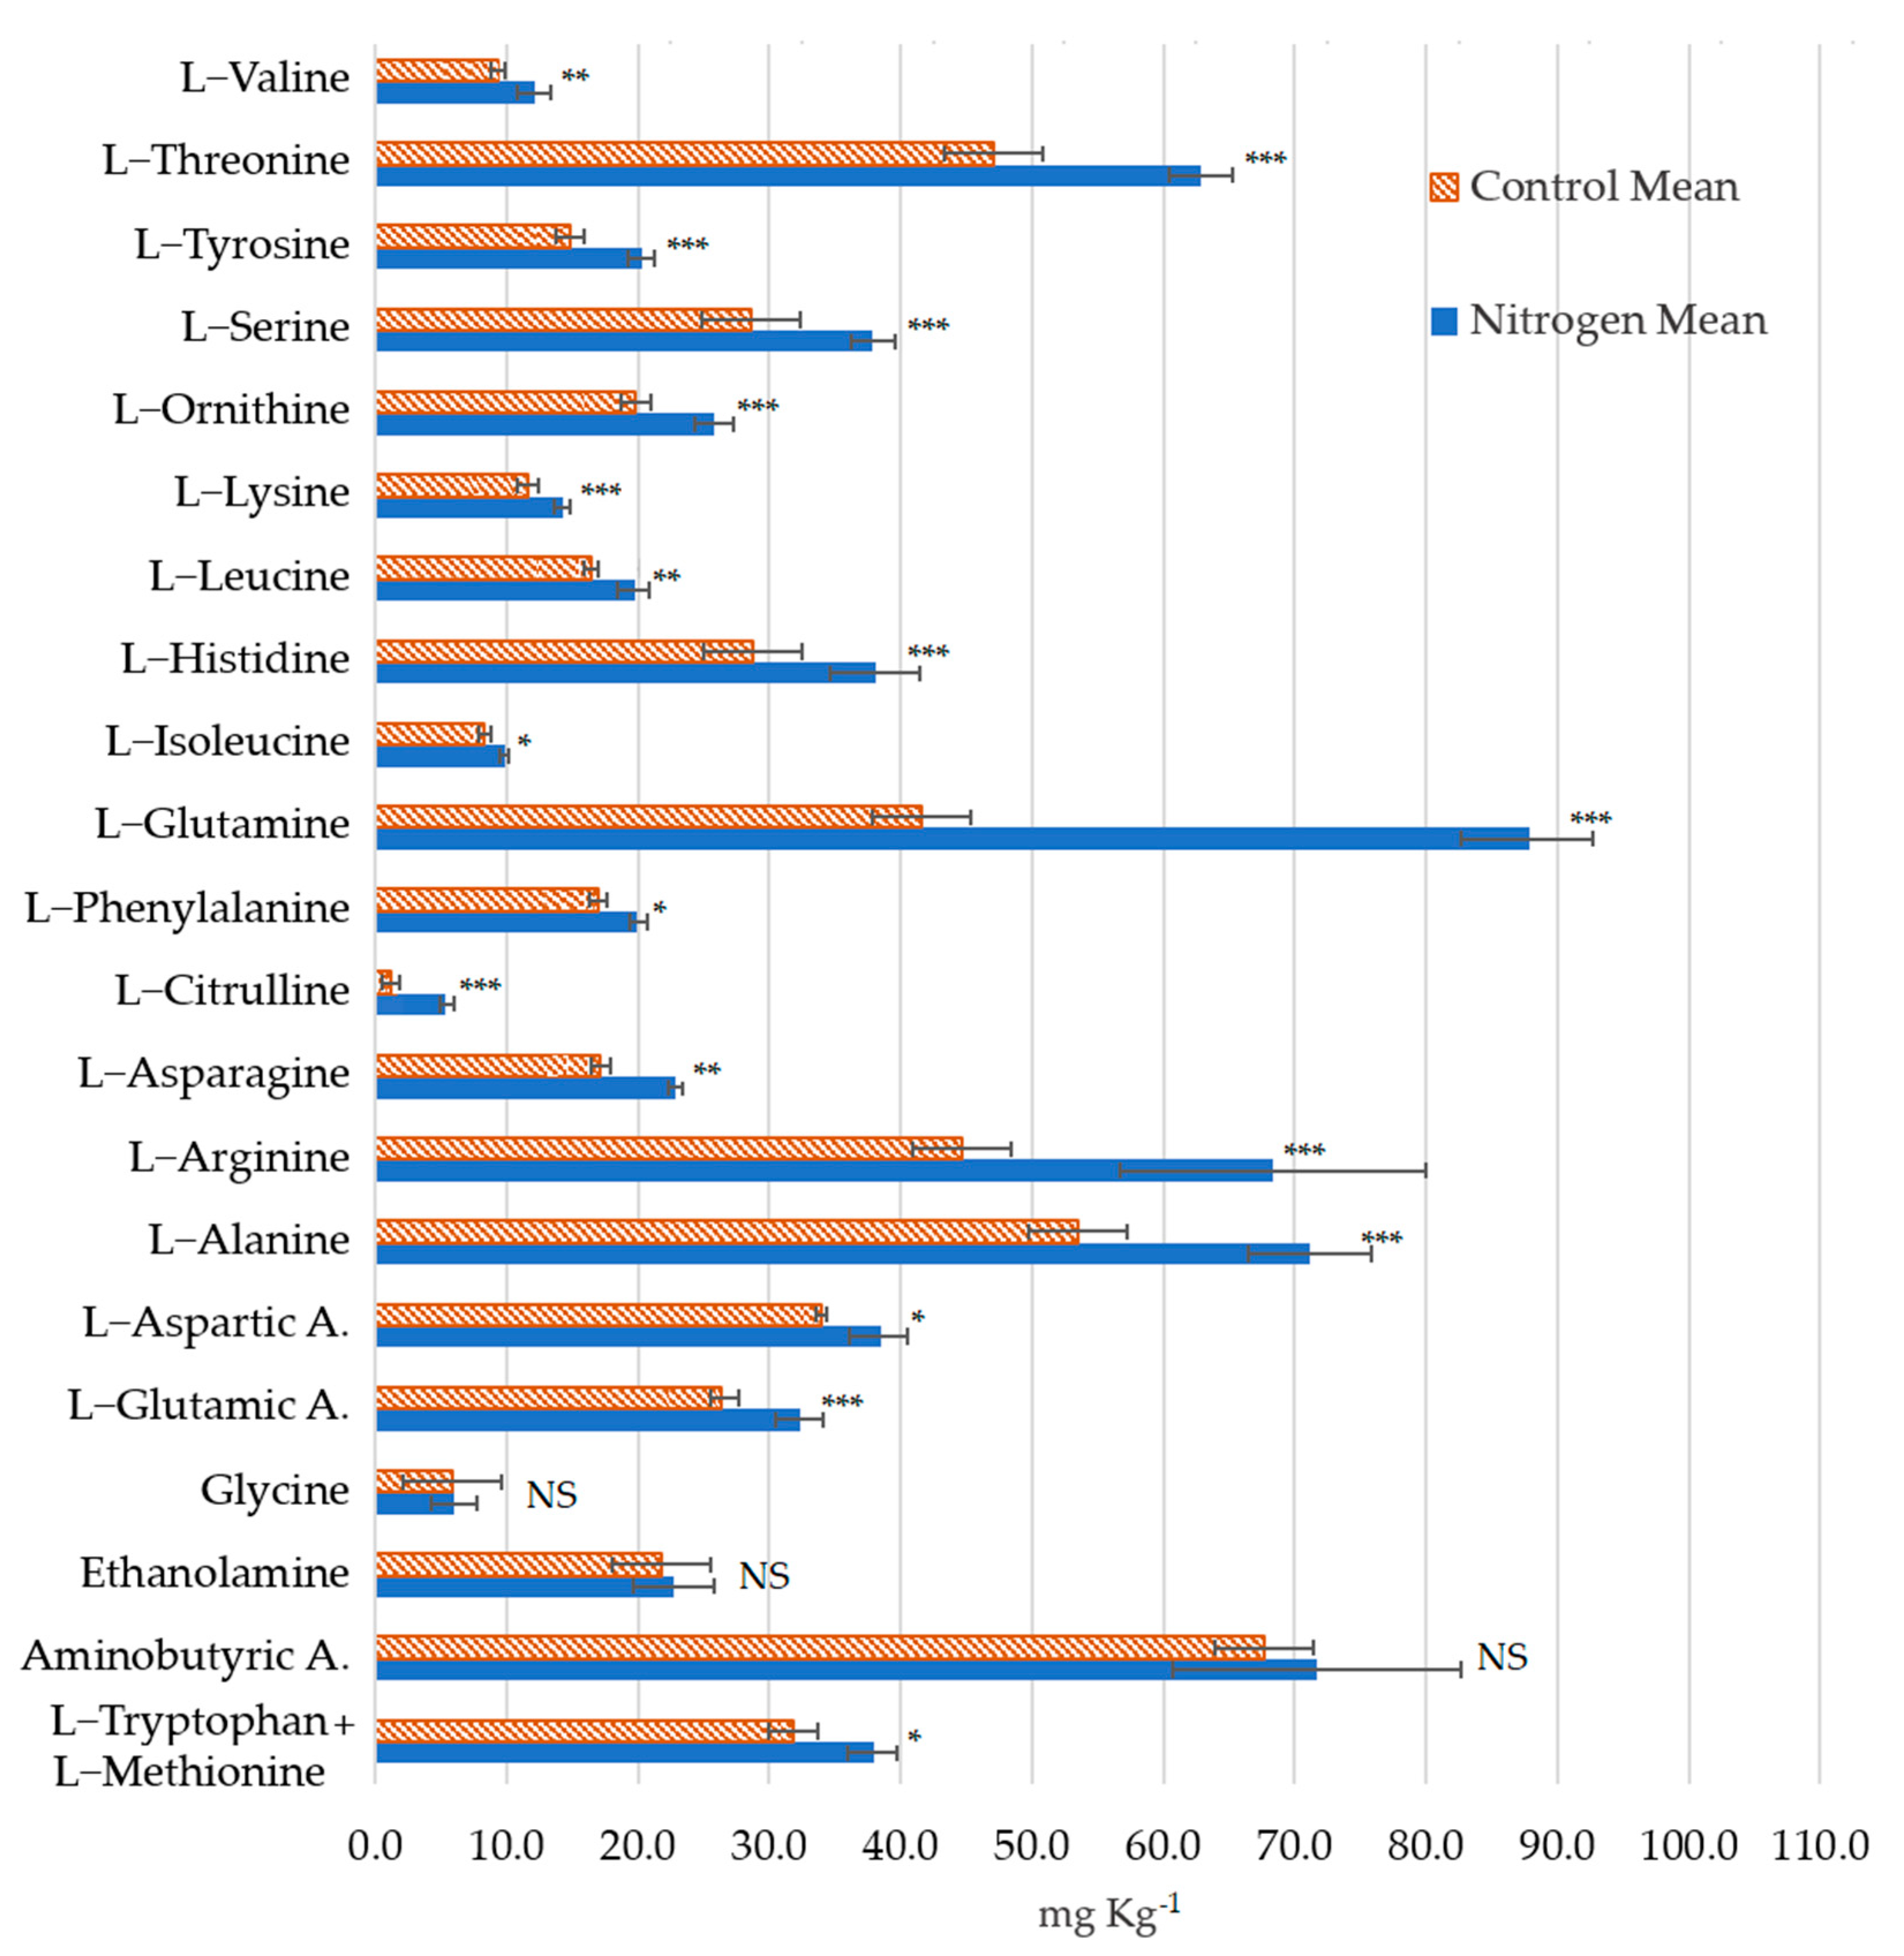
| Vintage | 2018 | 2019 | 2020 | ANOVA | |||||||||||
|---|---|---|---|---|---|---|---|---|---|---|---|---|---|---|---|
| Treatment | N | SD (n = 3) | C | SD (n = 3) | N | SD (n = 3) | C | SD (n = 3) | N | SD (n = 3) | C | SD (n = 3) | T | V | T∙V |
| L−Tryptophan + L−Methionine | 39.70 | 1.82 | 33.03 | 1.01 | 33.90 | 2.69 | 24.70 | 2.88 | 40.33 | 7.46 | 37.80 | 10.96 | * | * | ns |
| Aminobutyric A. | 75.27 | 10.12 | 69.10 | 8.68 | 90.83 | 1.50 | 73.23 | 10.37 | 48.93 | 2.25 | 60.73 | 3.69 | ns | *** | * |
| Ethanolamine | 16.17 | 1.01 | 16.50 | 0.95 | 24.03 | 0.60 | 20.60 | 2.79 | 28.10 | 0.72 | 28.27 | 0.85 | ns | *** | ns |
| Glycine | 4.23 | 0.84 | 3.23 | 0.45 | 3.83 | 0.38 | 3.33 | 0.78 | 10.03 | 0.25 | 10.87 | 1.42 | ns | *** | ns |
| L−Glutamic A. | 32.50 | 2.27 | 25.97 | 3.40 | 29.20 | 2.17 | 20.70 | 2.62 | 35.23 | 1.45 | 32.47 | 3.07 | *** | *** | ns |
| L−Aspartic A. | 31.83 | 2.00 | 28.30 | 3.56 | 47.43 | 5.99 | 36.37 | 2.51 | 36.30 | 1.39 | 37.27 | 2.52 | * | *** | * |
| L−Alanine | 80.27 | 5.70 | 66.23 | 9.65 | 66.50 | 6.17 | 41.77 | 2.16 | 66.63 | 1.39 | 52.63 | 1.60 | *** | *** | ns |
| L−Arginine | 488.17 | 19.64 | 380.43 | 18.58 | 625.00 | 33.51 | 392.67 | 40.53 | 937.23 | 31.74 | 566.50 | 5.06 | *** | *** | *** |
| L−Asparagine | 20.50 | 3.66 | 17.13 | 0.12 | 31.23 | 0.70 | 20.73 | 2.11 | 16.70 | 0.26 | 13.27 | 5.95 | ** | *** | ns |
| L−Citrulline | 0.10 | 0.00 | 0.10 | 0.00 | 0.10 | 0.00 | 0.10 | 0.00 | 15.83 | 0.74 | 4.57 | 1.59 | *** | *** | *** |
| L−Phenylalanine | 21.83 | 4.92 | 18.17 | 1.30 | 26.07 | 3.00 | 19.57 | 1.19 | 11.93 | 0.29 | 13.00 | 1.87 | * | *** | ns |
| L−Glutamine | 62.00 | 12.28 | 45.90 | 5.23 | 80.23 | 12.29 | 41.77 | 2.02 | 121.33 | 2.95 | 37.27 | 1.86 | *** | *** | *** |
| L−Isoleucine | 10.83 | 2.44 | 10.63 | 0.81 | 11.77 | 1.50 | 8.20 | 0.66 | 7.13 | 0.35 | 6.13 | 1.11 | * | *** | ns |
| L−Histidine | 33.37 | 6.77 | 26.70 | 4.23 | 43.23 | 4.03 | 26.70 | 2.33 | 37.60 | 1.28 | 32.70 | 2.63 | *** | ns | ns |
| L−Leucine | 16.90 | 2.34 | 15.53 | 1.00 | 25.13 | 3.45 | 17.97 | 2.46 | 17.47 | 0.23 | 15.73 | 2.27 | ** | ** | ns |
| L−Lysine | 12.13 | 0.61 | 7.60 | 0.10 | 12.13 | 0.50 | 9.27 | 0.71 | 18.70 | 0.26 | 17.97 | 1.22 | *** | *** | ** |
| L−Ornithine | 14.77 | 0.93 | 8.67 | 0.55 | 16.00 | 0.98 | 9.57 | 0.74 | 46.60 | 1.05 | 41.00 | 0.80 | *** | *** | ns |
| L−Serine | 39.17 | 1.18 | 30.93 | 3.79 | 34.67 | 2.91 | 23.77 | 1.36 | 39.80 | 0.79 | 31.23 | 3.20 | *** | ** | ns |
| L−Tyrosine | 28.80 | 3.82 | 21.47 | 3.03 | 16.97 | 1.86 | 11.30 | 1.48 | 15.20 | 0.26 | 11.87 | 0.91 | *** | *** | ns |
| L−Threonine | 64.03 | 2.42 | 48.53 | 6.09 | 60.40 | 7.01 | 41.93 | 4.06 | 64.13 | 1.14 | 50.80 | 2.60 | *** | ns | ns |
| L−Valine | 13.57 | 2.40 | 10.90 | 1.73 | 12.70 | 1.61 | 8.27 | 0.47 | 10.03 | 0.35 | 9.00 | 1.35 | ** | * | ns |


References
- Ribereau-Gayon, P.; Dubourdieu, D.; Doneche, B.; Lonvaud, A. Traité D’Oenologie—Tome 1, 7th ed.; Dunod: Malakoff, France, 2020. [Google Scholar]
- Conde, C.; Silva, P.; Fontes, N.; Dias, A.C.P.; Tavares, R.M.; Sousa, M.J.; Agasse, A.; Delrot, S.; Gerós, H. Biochemical Changes throughout Grape Berry Development and Fruit and Wine Quality. Food 2007, 1, 1–22. [Google Scholar]
- Ramos, M.C. Projection of Phenology Response to Climate Change in Rainfed Vineyards in North-East Spain. Agric. For. Meteorol. 2017, 247, 104–115. [Google Scholar] [CrossRef]
- Van Leeuwen, C.; Destrac-Irvine, A.; Dubernet, M.; Duchêne, E.; Gowdy, M.; Marguerit, E.; Pieri, P.; Parker, A.; de Rességuier, L.; Ollat, N. An Update on the Impact of Climate Change in Viticulture and Potential Adaptations. Agronomy 2019, 9, 514. [Google Scholar] [CrossRef]
- Ruml, M. Response of Grapevine Phenology to Recent Temperature Change and Variability in the Wine-Producing Area of Sremski Karlovci, Serbia. J. Agric. Sci. 2015, 154, 186–206. [Google Scholar] [CrossRef]
- Webb, L.B.; Whetton, P.H.; Bhend, J.; Darbyshire, R.; Briggs, P.R.; Barlow, E.W.R. Earlier Wine-Grape Ripening Driven by Climatic Warming and Drying and Management Practices. Nat. Clim. Chang. 2012, 2, 259–264. [Google Scholar] [CrossRef]
- Keller, M. The Science of Grapevines: Anatomy and Physiology; Macmillan Publishers Ltd.: London, UK, 2010; Volume 07/80, ISBN 9789968663038. [Google Scholar]
- Lakso, A.N.; Kliewer, W.M. The Influence of Temperature on Malic Acid Metabolism in Grape Berries. II. Temperature esponses of Net Dark CO2 Fixation and Malic Acid Pools. Am. J. Enol. Vitic. 1978, 29, 145–149. [Google Scholar] [CrossRef]
- Duchêne, E.; Schneider, C. Grapevine and Climatic Changes: A Glance at the Situation in Alsace. Agron. Sustain. Dev. 2005, 25, 93–99. [Google Scholar] [CrossRef]
- Van Leeuwen, C.; Destrac-Irvine, A. Modified Grape Composition under Climate Change Conditions Requires Adaptations in the Vineyard. OENO One 2017, 51, 147–154. [Google Scholar] [CrossRef]
- Poni, S.; Gatti, M.; Palliotti, A.; Dai, Z.; Duchêne, E.; Truong, T.T.; Ferrara, G.; Matarrese, A.M.S.; Gallotta, A.; Bellincontro, A.; et al. Grapevine Quality: A Multiple Choice Issue. Sci. Hortic. 2018, 234, 445–462. [Google Scholar] [CrossRef]
- Palliotti, A.; Tombesi, S.; Silvestroni, O.; Lanari, V.; Gatti, M.; Poni, S. Changes in Vineyard Establishment and Canopy Management Urged by Earlier Climate-Related Grape Ripening: A Review. Sci. Hortic. 2014, 178, 43–54. [Google Scholar] [CrossRef]
- Thomidis, T.; Zioziou, E.; Koundouras, S.; Karagiannidis, C.; Navrozidis, I.; Nikolaou, N. Effects of Nitrogen and Irrigation on the Quality of Grapes and the Susceptibility to Botrytis Bunch Rot. Sci. Hortic. 2016, 212, 60–68. [Google Scholar] [CrossRef]
- Baiano, A.; la Notte, E.; Coletta, A.; Terracone, C.; Antonacci, D. Effects of Irrigation Volume and Nitrogen Fertilization on Redglobe and Michele Palieri Table-Grape Cultivars. Am. J. Enol. Vitic. 2011, 62, 57–65. [Google Scholar] [CrossRef]
- Delgado, R.; Martín, P.; del Álamo, M.; González, M.R. Changes in the Phenolic Composition of Grape Berries during Ripening in Relation to Vineyard Nitrogen and Potassium Fertilisation Rates. J. Sci. Food Agric. 2004, 84, 623–630. [Google Scholar] [CrossRef]
- Gatti, M.; Squeri, C.; Garavani, A.; Vercesi, A.; Dosso, P.; Diti, I.; Poni, S. Effects of Variable Rate Nitrogen Application on Cv. Barbera Performance: Vegetative Growth and Leaf Nutritional Status. Am. J. Enol. Vitic. 2018, 69, 196–209. [Google Scholar] [CrossRef]
- Etienne, A.; Génard, M.; Lobit, P.; Mbeguié-A-Mbéguié, D.; Bugaud, C. What Controls Fleshy Fruit Acidity? A Review of Malate and Citrate Accumulation in Fruit Cells. J. Exp. Bot. 2013, 64, 1451–1469. [Google Scholar] [CrossRef]
- Bell, S.-J.; Henschke, P.A. Implications of Nitrogen Nutrition for Grapes, Fermentation and Wine. Aust. J. Grape Wine Res. 2005, 11, 242–295. [Google Scholar] [CrossRef]
- Parker, M.; Capone, D.L.; Francis, I.L.; Herderich, M.J. Aroma Precursors in Grapes and Wine: Flavor Release during Wine Production and Consumption. J. Agric. Food Chem. 2018, 66, 2281–2286. [Google Scholar] [CrossRef] [PubMed]
- Hernández-Orte, P.; Cacho, J.F.; Ferreira, V. Relationship between Varietal Amino Acid Profile of Grapes and Wine Aromatic Composition. Experiments with Model Solutions and Chemometric Study. J. Agric. Food Chem. 2002, 50, 2891–2899. [Google Scholar] [CrossRef]
- Xia, G.; Cheng, L. Foliar Urea Application in the Fall Affects Both Nitrogen and Carbon Storage in Young ‘Concord’ Grapevines Grown under a Wide Range of Nitrogen Supply. J. Am. Soc. Hortic. Sci. 2004, 129, 653–659. [Google Scholar] [CrossRef]
- Tesic, D.; Keller, M.; Hutton, R.J. Influence of Vineyard Floor Management Practices on Grapevine Vegetative Growth, Yield, and Fruit Composition. Am. J. Enol. Vitic. 2007, 58, 1–11. [Google Scholar] [CrossRef]
- Canoura, C.; Kelly, M.T.; Ojeda, H. Effect of Irrigation and Timing and Type of Nitrogen Application on the Biochemical Composition of Vitis vinifera L. Cv. Chardonnay and Syrah Grapeberries. Food Chem. 2018, 241, 171–181. [Google Scholar] [CrossRef] [PubMed]
- Tomasi, D.; Jones, G.V.; Giust, M.; Lovat, L.; Gaiotti, F. Grapevine Phenology and Climate Change: Relationships and Trends in the Veneto Region of Italy for 1964–2009. Am. J. Enol. Vitic. 2011, 62, 329–339. [Google Scholar] [CrossRef]
- Naor, A. Midday Stem Water Potential as a Plant Water Stress Indicator for Irrigation Scheduling in Fruit Trees. Acta Hortic. 2000, 537, 447–454. [Google Scholar] [CrossRef]
- Belfiore, N.; Nerva, L.; Fasolini, R.; Gaiotti, F.; Lovat, L.; Chitarra, W. Leaf Gas Exchange and Abscisic Acid in Leaves of Glera Grape Variety during Drought and Recovery. Theor. Exp. Plant Physiol. 2021, 33, 261–270. [Google Scholar] [CrossRef]
- Kordiš-Krapež, M.; Abram, V.; Kač, M.; Ferjančic, S. Determination of Organic Acids in White Wines by RP-HPLC. Food Technol. Biotechnol. 2001, 39, 93–100. [Google Scholar]
- Nicolini, G.; Larcher, R.; Versini, G. Status of yeast assimilable nitrogen in Italian grape musts and effects of variety, ripening and vintage. Vitis J. Grapevine Res. 2004, 43, 89–96. [Google Scholar]
- Delaiti, S.; Nardin, T.; Roman, T.; Pedò, S.; Zanzotti, R.; Larcher, R. Atypical ageing defect in Pinot Blanc wines: A comparison between organic and conventional production management systems. Sci. Food Agric. 2023, 103, 467–499. [Google Scholar] [CrossRef]
- Hunter, J.J.; Ruffner, H.P.; Volschenk, C.G. Starch Concentrations in Grapevine Leaves, Berries and Effect of Canopy Managment. S. Afr. J. Enol. Vitic. 1995, 16, 35–40. [Google Scholar] [CrossRef]
- OIV (International Organisation of Vine and Wine). Normes des concours internationaux des vins. Bull. L’OIV 1994, 67, 558–597. [Google Scholar]
- Mundy, D.C. A Review of the Direct and Indirect Effects of Nitrogen on Botrytis Bunch Rot in Wine Grapes. N. Z. Plant Prot. 2008, 61, 306–310. [Google Scholar] [CrossRef]
- Eh Ruhl, P.; Fuda, A.; Treeby, M.T. Effect of Potassium, Magnesium and Nitrogen Supply on Grape Juice Composition of Riesling, Chardonnay and Cabernet Sauvignon Vines. Aust. J. Exp. Agric. 1992, 32, 645–649. [Google Scholar] [CrossRef]
- Porro, D.; Dallaserra, M.; Zatelli, A.; Ceschini, A. The interaction between nitrogen and shade on grapevine: The effects on nutritional status, leaf age and leaf gas exchanges. Acta Hortic. 2001, 564, 253–260. [Google Scholar] [CrossRef]
- Roda, R.; Martín, L.; Mislata, A.M.; Castaño, F.J.; Puxeu, M.; Ferrer-Gallego, R. Effects of Fertigation by Elicitors Enriched in Amino Acids from Vegetal and Animal Origins on Syrah Plant Gas Exchange and Grape Quality. Food Res. Int. 2019, 125, 108630. [Google Scholar] [CrossRef] [PubMed]
- Hannam, K.D.; Neilsen, G.H.; Forge, T.; Neilsen, D. The Concentration of Yeast Assimilable Nitrogen in Merlot Grape Juice Is Increased by N Fertilization and Reduced Irrigation. Can. J. Plant Sci. 2013, 93, 37–45. [Google Scholar] [CrossRef]
- Vilanova, M.; Ugliano, M.; Varela, C.; Siebert, T.; Pretorius, I.S.; Henschke, P.A. Assimilable Nitrogen Utilisation and Production of Volatile and Non-Volatile Compounds in Chemically Defined Medium by Saccharomyces Cerevisiae Wine Yeasts. Appl. Microbiol. Biotechnol. 2007, 77, 145–157. [Google Scholar] [CrossRef] [PubMed]
- Torrea, D.; Varela, C.; Ugliano, M.; Ancin-azpilicueta, C.; Francis, I.L.; Henschke, P.A. Comparison of Inorganic and Organic Nitrogen Supplementation of Grape Juice—Effect on Volatile Composition and Aroma Profile of a Chardonnay Wine Fermented with Saccharomyces Cerevisiae Yeast. Food Chem. 2011, 127, 1072–1083. [Google Scholar] [CrossRef]
- Cook, J.A.; Kliewer, W.M. Arginine and Total Free Amino Acids as Indicators of the Nitrogen Status of Grapevines. J. Am. Soc. Hortic. Sci. 1971, 96, 581–587. [Google Scholar]
- Schreiner, R.P.; Scagel, C.F.; Lee, J. N, P, and K Supply to Pinot Noir Grapevines: Impact on Berry Phenolics and Free Amino Acids. Am. J. Enol. Vitic. 2014, 65, 43–49. [Google Scholar] [CrossRef]
- Jiménez-Moreno, N.; Moler, J.A.; Palacios, M.B.; Esparza, I.; Nieto-Rojo, R.; Ancín-Azpilicueta, C. Foliar Application of Urea to Tempranillo Vines Increased the Amino Acid Concentration of the Must. Food Addit. Contam. Part A Chem. Anal. Control Expo. Risk Assess. 2020, 37, 216–227. [Google Scholar] [CrossRef]
- Verdenal, T.; Dienes-Nagy, Á.; Spangenberg, J.E.; Zufferey, V.; Spring, J.L.; Viret, O.; Marin-Carbonne, J.; van Leeuwen, C. Understanding and managing nitrogen nutrition in grapevine: A revew. OENO One 2021, 55, 1–43. [Google Scholar] [CrossRef]
- Hjelmeland, A.K.; Ebeler, S.E. Glycosidically Bound Volatile Aroma Compounds in Grapes and Wine: A Review. Am. J. Enol. Vitic. 2015, 66, 1–11. [Google Scholar] [CrossRef]
- Styger, G.; Prior, B.; Bauer, F.F. Wine Flavor and Aroma. J. Ind. Microbiol. Biotechnol. 2011, 38, 1145–1159. [Google Scholar] [CrossRef] [PubMed]
- Schultz, H.R. Climate change and viticulture: A European perspective on climatology, carbon dioxide and UV-B effects. Aust. J. Grape Wine Res. 2000, 6, 2–12. [Google Scholar] [CrossRef]


| Vintage | Date | Date | Date | N Vine (g) | TotN Vine−1 (g) | TotN ha−1 (kg ha−1) |
|---|---|---|---|---|---|---|
| 2018 | 12 June | 5 July | 17 July | 4.33 | 13.00 | 38.0 |
| 2019 | 13 June | 11 July | 31 July | 4.33 | 13.00 | 38.0 |
| 2020 | 4 June | 27 June | 31 July | 4.33 | 13.00 | 38.0 |
| Measure | Vintage | Vines Sample | Nitrogen | Control | ANOVA | |||
|---|---|---|---|---|---|---|---|---|
| Mean | SD | Mean | SD | |||||
| One-way ANOVA | ||||||||
| Grape yield (kg) | 2020 | 3 | 22.20 | 3.64 | 24.12 | 2.55 | T | ns |
| Wood weight (kg) | 2019 | 10 | 13.33 | 1.14 | 14.80 | 0.44 | ||
| Wood weight (kg) | 2020 | 5 | 7.82 | 1.35 | 7.22 | 1.35 | T | ns |
| Two-way ANOVA | ||||||||
| Root’s sugars (mg g−1 dm−1) | 2018 | 5 | 29.76 b | 0.88 | 35.73 b | 3.20 | T | ns |
| Root’s sugars (mg g−1 dm−1) | 2019 | 5 | 21.52 b | 5.03 | 39.97 b | 23.94 | V | *** |
| Root’s sugars (mg g−1 dm−1) | 2020 | 5 | 16.18 a | 2.76 | 16.17 a | 0.20 | T∙V | * |
| Root’s starch (mg g−1 dm−1) | 2018 | 5 | 248.79 | 10.56 | 215.70 | 37.96 | T | ns |
| Root’s starch (mg g−1 dm−1) | 2019 | 5 | 227.90 | 7.52 | 192.84 | 50.01 | V | ns |
| Root’s starch (mg g−1 dm−1) | 2020 | 5 | 190.33 | 19.73 | 205.01 | 15.64 | T∙V | ns |
| Shoot’s sugars (mg g−1 dm−1) | 2018 | 5 | 126.28 b | 18.21 | 120.72 b | 9.50 | T | ns |
| Shoot’s sugars (mg g−1 dm−1) | 2020 | 5 | 75.45 a | 5.39 | 72.85 a | 11.88 | V | ** |
| T∙V | ** | |||||||
| Shoot’s starch (mg g−1 dm−1) | 2018 | 5 | 141.92 b | 7.89 | 130.40 b | 15.65 | T | ns |
| Shoot’s starch (mg g−1 dm−1) | 2020 | 5 | 106.36 a | 8.42 | 120.61 a | 7.89 | V | ** |
| T∙V | ** | |||||||
| Measure | Vintage | Nitrogen Mean SD | Control Mean SD | Two-Way ANOVA | |||
|---|---|---|---|---|---|---|---|
| HTH (g L−1) | 2018 | 5.09 a | 1.37 | 5.56 ab | 0.44 | T | ns |
| HTH (g L−1) | 2019 | 6.23 ab | 0.15 | 5.64 ab | 0.18 | V | * |
| HTH (g L−1) | 2020 | 6.70 b | 0.10 | 6.08 ab | 0.20 | T∙V | ns |
| HMH (g L−1) | 2018 | 2.66 ab | 0.74 | 1.84 a | 0.27 | T | *** |
| HMH (g L−1) | 2019 | 3.42 b | 0.19 | 2.20 a | 0.11 | V | ** |
| HMH (g L−1) | 2020 | 3.65 b | 0.24 | 2.41 a | 0.21 | T∙V | ns |
| HTH+HMH (g L−1) | 2018 | 7.75 ab | 2.06 | 7.40 a | 0.71 | T | ** |
| HTH+HMH (g L−1) | 2019 | 9.65 b | 0.15 | 7.84 a | 0.08 | V | * |
| HTH+HMH (g L−1) | 2020 | 10.34 b | 0.22 | 8.49 a | 0.39 | T∙V | ns |
| TTA (g L−1) | 2018 | 6.76 b | 0.47 | 5.53 a | 0.22 | T | *** |
| TTA (g L−1) | 2019 | 8.60 c | 0.79 | 6.54 ab | 0.16 | V | *** |
| TTA (g L−1) | 2020 | 7.82 c | 0.07 | 6.26 ab | 0.30 | T∙V | ns |
| SS (°BRIX) | 2018 | 14.47 a | 0.31 | 14.90 a | 0.20 | T | ** |
| SS (°BRIX) | 2019 | 16.37 b | 0.29 | 16.53 b | 0.23 | V | *** |
| SS (°BRIX) | 2020 | 15.13 a | 0.15 | 16.07 b | 0.31 | T∙V | ns |
| pH | 2018 | 3.22 b | 0.04 | 3.30 c | 0.01 | T | *** |
| pH | 2019 | 3.17 a | 0.04 | 3.31 bc | 0.05 | V | ns |
| pH | 2020 | 3.23 ab | 0.00 | 3.33 c | 0.04 | T∙V | ns |
| YAN (mg L−1) | 2018 | 216.5 c | 16.91 | 138.3 b | 11.77 | T | *** |
| YAN (mg L−1) | 2019 | 127.9 b | 23.08 | 60.5 a | 12.13 | V | *** |
| YAN (mg L−1) | 2020 | 200.9 c | 2.84 | 121.6 b | 11.38 | T∙V | ns |
Disclaimer/Publisher’s Note: The statements, opinions and data contained in all publications are solely those of the individual author(s) and contributor(s) and not of MDPI and/or the editor(s). MDPI and/or the editor(s) disclaim responsibility for any injury to people or property resulting from any ideas, methods, instructions or products referred to in the content. |
© 2023 by the authors. Licensee MDPI, Basel, Switzerland. This article is an open access article distributed under the terms and conditions of the Creative Commons Attribution (CC BY) license (https://creativecommons.org/licenses/by/4.0/).
Share and Cite
Zanchin, A.; Lovat, L.; Marcuzzo, P.; Sozzi, M.; Marinello, F.; Tomasi, D. Improving the Oenological Potential of Grapes for Prosecco PDO Sparkling Wine Thanks to Nitrogen Fertigation. Agronomy 2023, 13, 1369. https://doi.org/10.3390/agronomy13051369
Zanchin A, Lovat L, Marcuzzo P, Sozzi M, Marinello F, Tomasi D. Improving the Oenological Potential of Grapes for Prosecco PDO Sparkling Wine Thanks to Nitrogen Fertigation. Agronomy. 2023; 13(5):1369. https://doi.org/10.3390/agronomy13051369
Chicago/Turabian StyleZanchin, Alessandro, Lorenzo Lovat, Patrick Marcuzzo, Marco Sozzi, Francesco Marinello, and Diego Tomasi. 2023. "Improving the Oenological Potential of Grapes for Prosecco PDO Sparkling Wine Thanks to Nitrogen Fertigation" Agronomy 13, no. 5: 1369. https://doi.org/10.3390/agronomy13051369