
Framework for Assessing Collective Irrigation Systems Resilience to Climate Change—The Maiorga Case Study
by
 ,
,
Rita Esteves
1,
Maria João Calejo
2,
João Rolim
1,3 ,
,
José Luís Teixeira
1 and 
Maria Rosário Cameira
1,3,* 1
Department of Biosystems Engineering, Instituto Superior de Agronomia, Universidade de Lisboa, Tapada da Ajuda, 1349-017 Lisboa, Portugal
2
COBA, SA—Avenida 5 de Outubro, 323, 1600-011 Lisboa, Portugal
3
LEAF-Linking Landscape, Environment, Agriculture and Food-Research Center, Associated Laboratory TERRA, Instituto Superior de Agronomia, Universidade de Lisboa, Tapada da Ajuda, 1349-017 Lisboa, Portugal
*
Author to whom correspondence should be addressed.
Agronomy 2023, 13(3), 661; https://doi.org/10.3390/agronomy13030661
Submission received: 31 January 2023
/
Revised: 15 February 2023
/
Accepted: 22 February 2023
/
Published: 24 February 2023
(This article belongs to the Special Issue Improving Agricultural Water Productivity to Ensure Food Security under Changing Environments)
Abstract
:In order to increase water productivity at the Collective Irrigation System (CIS) level it is crucial to adapt the existing irrigation infrastructure, enhancing water intake at the source, as well as its transport and delivery efficiency. Rehabilitation may involve structural changes and thus, a large capital investment. This investment should be proportionate to the increase in climate resilience associated to different rehabilitation alternatives. A methodology framework was developed to evaluate CIS resilience to climate change considering different rehabilitation alternatives. The assessed components were: (i) crop production systems; (ii) on-farm irrigation systems; and (iii) project rehabilitation alternatives for the conveyance and distribution of the irrigation water from the source to the farmer fields. This framework was applied to the Maiorga CIS, in central Portugal, to test the methodology performance in assessing the impacts of climate change on the supply-demand balance of the proposed rehabilitation alternatives and to evaluate their climate resilience, for the representative concentration pathways, RCP4.5 and RCP8.5, and two time periods, 2041–2070 and 2071–2100. For each scenario, period, and rehabilitation alternative, irrigation requirements at the source (demand) and stream flows (supply) were computed and the supply-demand balance was performed. Projected increases in irrigation water demand varied between 5.5% for RCP4.5/2071–2100 and 35.7% for RCP8.5/2071–2100. For RCP4.5, 11% (2050) and 9% (2080) reductions in irrigation water supply were projected, while for RCP8.5 the reduction ranges between 13% (2050) and 30% (2080). The proposed framework determined that the rehabilitation alternatives considering just one type of water source, without flow regularization and with open channel distribution to the farmer’s field, have proved to be unviable due to low resilience to climate change.
1. Introduction
Nowadays, fresh water is the most important but vulnerable natural resource in the Mediterranean region [1,2]. Its sources are under great pressure due to the rapid increase in population, its intensive use by agriculture, industry and tourism, pollution and increased water scarcity due to extreme climate variability [3,4]. The agriculture sector is the main freshwater consumer in the Mediterranean region, e.g., as described in [5,6]. The water demand by this sector will be exacerbated in the future, particularly in some areas where it is projected that water needs for irrigation will increase by 35% due to increased crop water demand [7,8,9]. Future projections of climate change are mainly a result of anthropogenic emissions of GHG, e.g., the burning of fossil fuel [10]. Plausible scenarios for future climatic conditions can be provided by general circulation models (GCMs). However, its direct use in impact studies is limited by their coarse resolution, systemic errors and disability to capture inter-annual variability, namely in the case of precipitation [11,12,13,14]. Regional climate models (RCMs), through dynamic downscaling techniques, have reduced many of these limitations with the exception of systemic errors, that requires a further post-processing step to perform the bias correction [15,16,17].
Climate change affects crop water demand via crops physiology and phenology, effective precipitation, evapotranspiration and soil water balances [18,19]. These impacts will be particularly relevant in irrigated agriculture, as the growth cycle of the main crops coincides with the months with higher climatic demand and lower precipitation in which the effects of climate change will be felt the most [19,20]. The rainfed crop production will also be adversely affected, particularly due to the foreseen increase in precipitation variability, resulting in a decrease in the crop production [21,22,23]. Irrigation may be an important adaptation measure to cope with this decrease in rainfed crop production [20]. Climate change doubly affects irrigated agriculture in the Mediterranean environments, because on the one hand, crop evapotranspiration increases, and on the other hand, water reserves decrease from both natural and artificial surface water bodies [19,20,24] unbalancing the relation between water demand and availability or supply [25]. Regarding the latter, the projected climate change impacts include decreases in runoff and streamflow—due to progressive shifts in seasonal rainfall distribution and in intensity—and increase in the frequency and severity of extreme climatic events (e.g., droughts and floods) [26,27,28,29,30,31]. The results presented in [32] show that climate change will significantly change the stream flow regime and reduce water availability in a Portuguese river basin, but the existing reservoir infrastructure will alleviate some of these impacts, especially in the dry half-year. According to [29,32], in southern Portugal, the water supply-demand unbalance may lead to a decrease in irrigated areas, changes in cropping patterns and/or a decrease in production due to impacts of water deficit. In addition to these changes, it is expected that irrigation water productivity (ration yield and irrigation water, kg m−3) will decrease, even if crop productivity remains unchanged [27,28,29,30].
Over 80% of the agricultural production in the Mediterranean region comes from irrigated areas, which is why it is essential to optimize water productivity [33,34] to continue satisfying the future demand for food in a context of increasing water scarcity. Measures to this end must be applied: (i) at demand level (e.g., improvements in the efficiency of water use, water prices, and changes to more resilient crops) and; (ii) at the supply level (e.g., rehabilitation of water conveyance and distribution infrastructures to reduce water losses from the water source to the farm, and the improvement of on-farm water application [9,21,32,35]).
Collective Irrigation Systems (CIS) will play an increasingly important role in sustaining water productivity and food security, especially in arid and semi-arid areas [36], being one of the most important pillars of climate resilience. When the CIS do not have hydraulic storage infrastructures, there is no regularization of the streamflow and inflows are exploited by run-off-river. Therefore, the flow used is the instantaneous river flow coming from upstream. In such cases, the CIS is very dependent on summer flows, which is the main constraint, particularly in the Mediterranean regions, on the good performance of the global irrigation system, especially in the years with low precipitation. Thus, it is important to proceed with the CIS rehabilitation, where the original design criteria must be updated aiming at considering climate change impacts since infrastructures with a long-life span are included [37]. Rehabilitation may involve structural changes, which requires a large capital investment [32]. However, the investment should be proportionate to the increase in climate resilience associated to different rehabilitation alternatives. Therefore, the projects offering alternative solutions need to be compared and ranked in terms of climate resilience [38].
Most recent definitions associate resilience to the “ability” or “capacity” of a system to respond to a disruption or change [39,40]. The authors of [40] define resilience as “the ability of a system and its components to anticipate, absorb, accommodate, or recover from the effects of a hazardous event in a timely and efficient manner, including through ensuring the preservation, restoration, or improvement of its essential basic structures and functions”. The resilience assessment of the CSI rehabilitation alternatives has been gaining importance, in order to ensure that they will be able to meet the objectives, not only in the present, but also in the medium and long term. Climate change resilience analysis is the aim of some studies, e.g., [41,42], however, despite its growing importance, the application of resilience analysis in irrigation studies is still relatively new, with only a few studies in this regard, e.g., [43,44]. Most of the scientific works published are in fact risk and vulnerability analysis and not directly resilience analysis. Some examples of these studies are the work presented by [45] in which a risk assessment framework for irrigated agriculture under climate change is presented; by [46], where an integrated risk management framework for agricultural water conveyance and distribution system is presented, but without considering future climate change; and by [32], where a vulnerability approach is used to evaluate the impacts of climate change in the highly regulated Tagus River basin, in Portugal, and assesses various adaptation options. Regarding the particular issue irrigation water supply-demand-balance at the Collective Irrigation System (CIS) level, some studies provide pathways for future adaption to climate change, e.g., [36,38,47,48], but they also do not address resilience analysis.
The difficulty of assessing the resilience of a system may be due to the diverse factors that influence this variable including its multidimensional and highly dynamic nature, which hinders its parameterization, quantification and valorization [45]. Moreover, the lack of quantifiable indicators for resilience assessment makes this concept quite abstract and subjective [49]. Thus, a resilience assessment framework to support decision making in the context of climate change adaptation, using a hybrid approach including both qualitative and quantitative information, is recommended [47]. This type of approach facilitates comparison among solutions.
Aiming to help fill the gap in the existing literature, the objectives of the present work were:
- to develop a methodology framework, including both qualitative and quantitative information, to carry out the climate resilience analysis of Collective Irrigation Systems. The methodology integrates three CIS components: (i) crop production systems; (ii) on-farm irrigation systems; and (iii) rehabilitation alternatives for the conveyance and distribution of the irrigation water from the source to the farmer fields;
- to test the methodology for the Maiorga Collective Irrigation Scheme, for which four design rehabilitation and modernization alternatives were analyzed, and their resilience towards climate change scenarios was assessed. Analysis was performed at both levels supply and demand, for two climate change scenarios, RCP4.5 and RCP8.5, and two periods, 2041–2070 and 2071–2100.
2. Materials and Methods
2.1. Methodological Framework
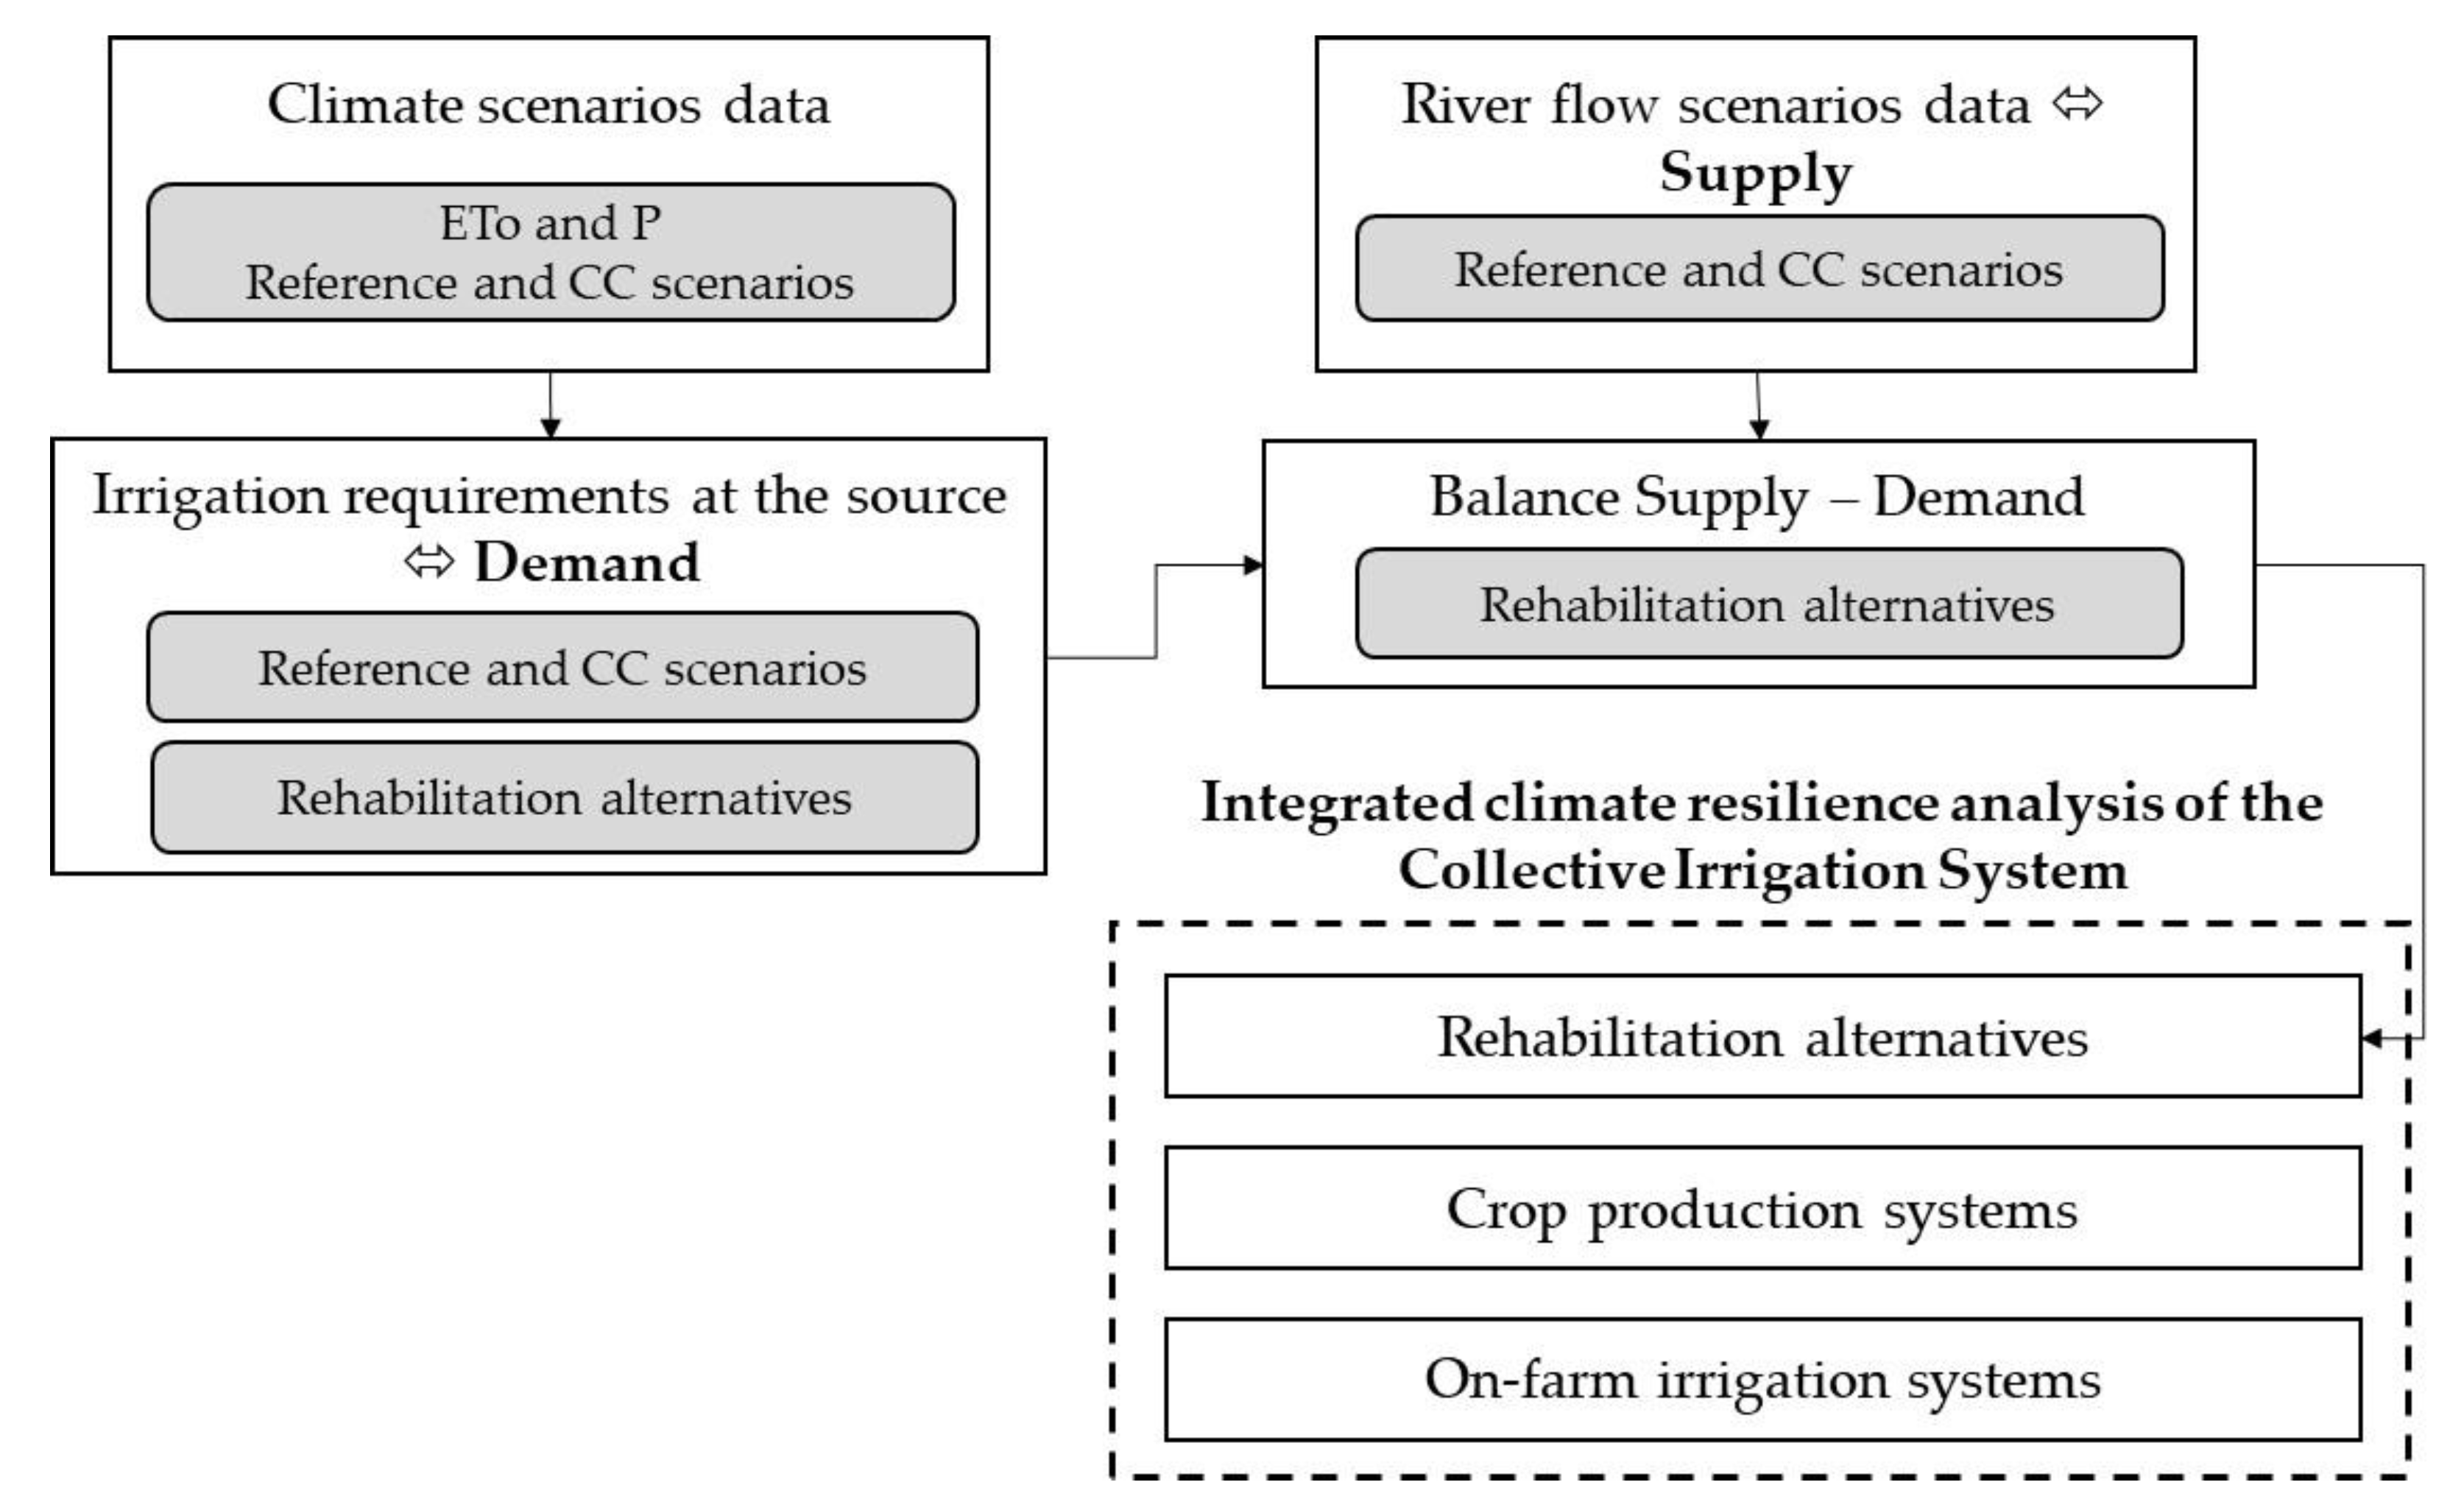
This section describes the methodology developed in the present work for the climate resilience analysis of Collective Irrigation Systems, considering different rehabilitation alternatives. Figure 1 presents the scientific approach used for the assessment of climate resilience of run-of-river Collective Irrigation Systems. The process begins with the construction of an ensemble of climate change scenarios. The data produced is used for the estimation of irrigation requirements at the water source (demand), for the different future CC scenarios and for different project rehabilitation alternatives. On the water supply side, the stream flows are projected for the considered CC scenarios providing the irrigation water availability (supply). The integrated resilience analysis is based upon the capacity of each project rehabilitation alternative to guaranty the demand, and also on the crop production systems and of the on-farm irrigation systems projected for the Collective Irrigation System. Each step is described in detail in the following sections.
2.1.1. Climate Change Scenarios
Climate Model Ensemble
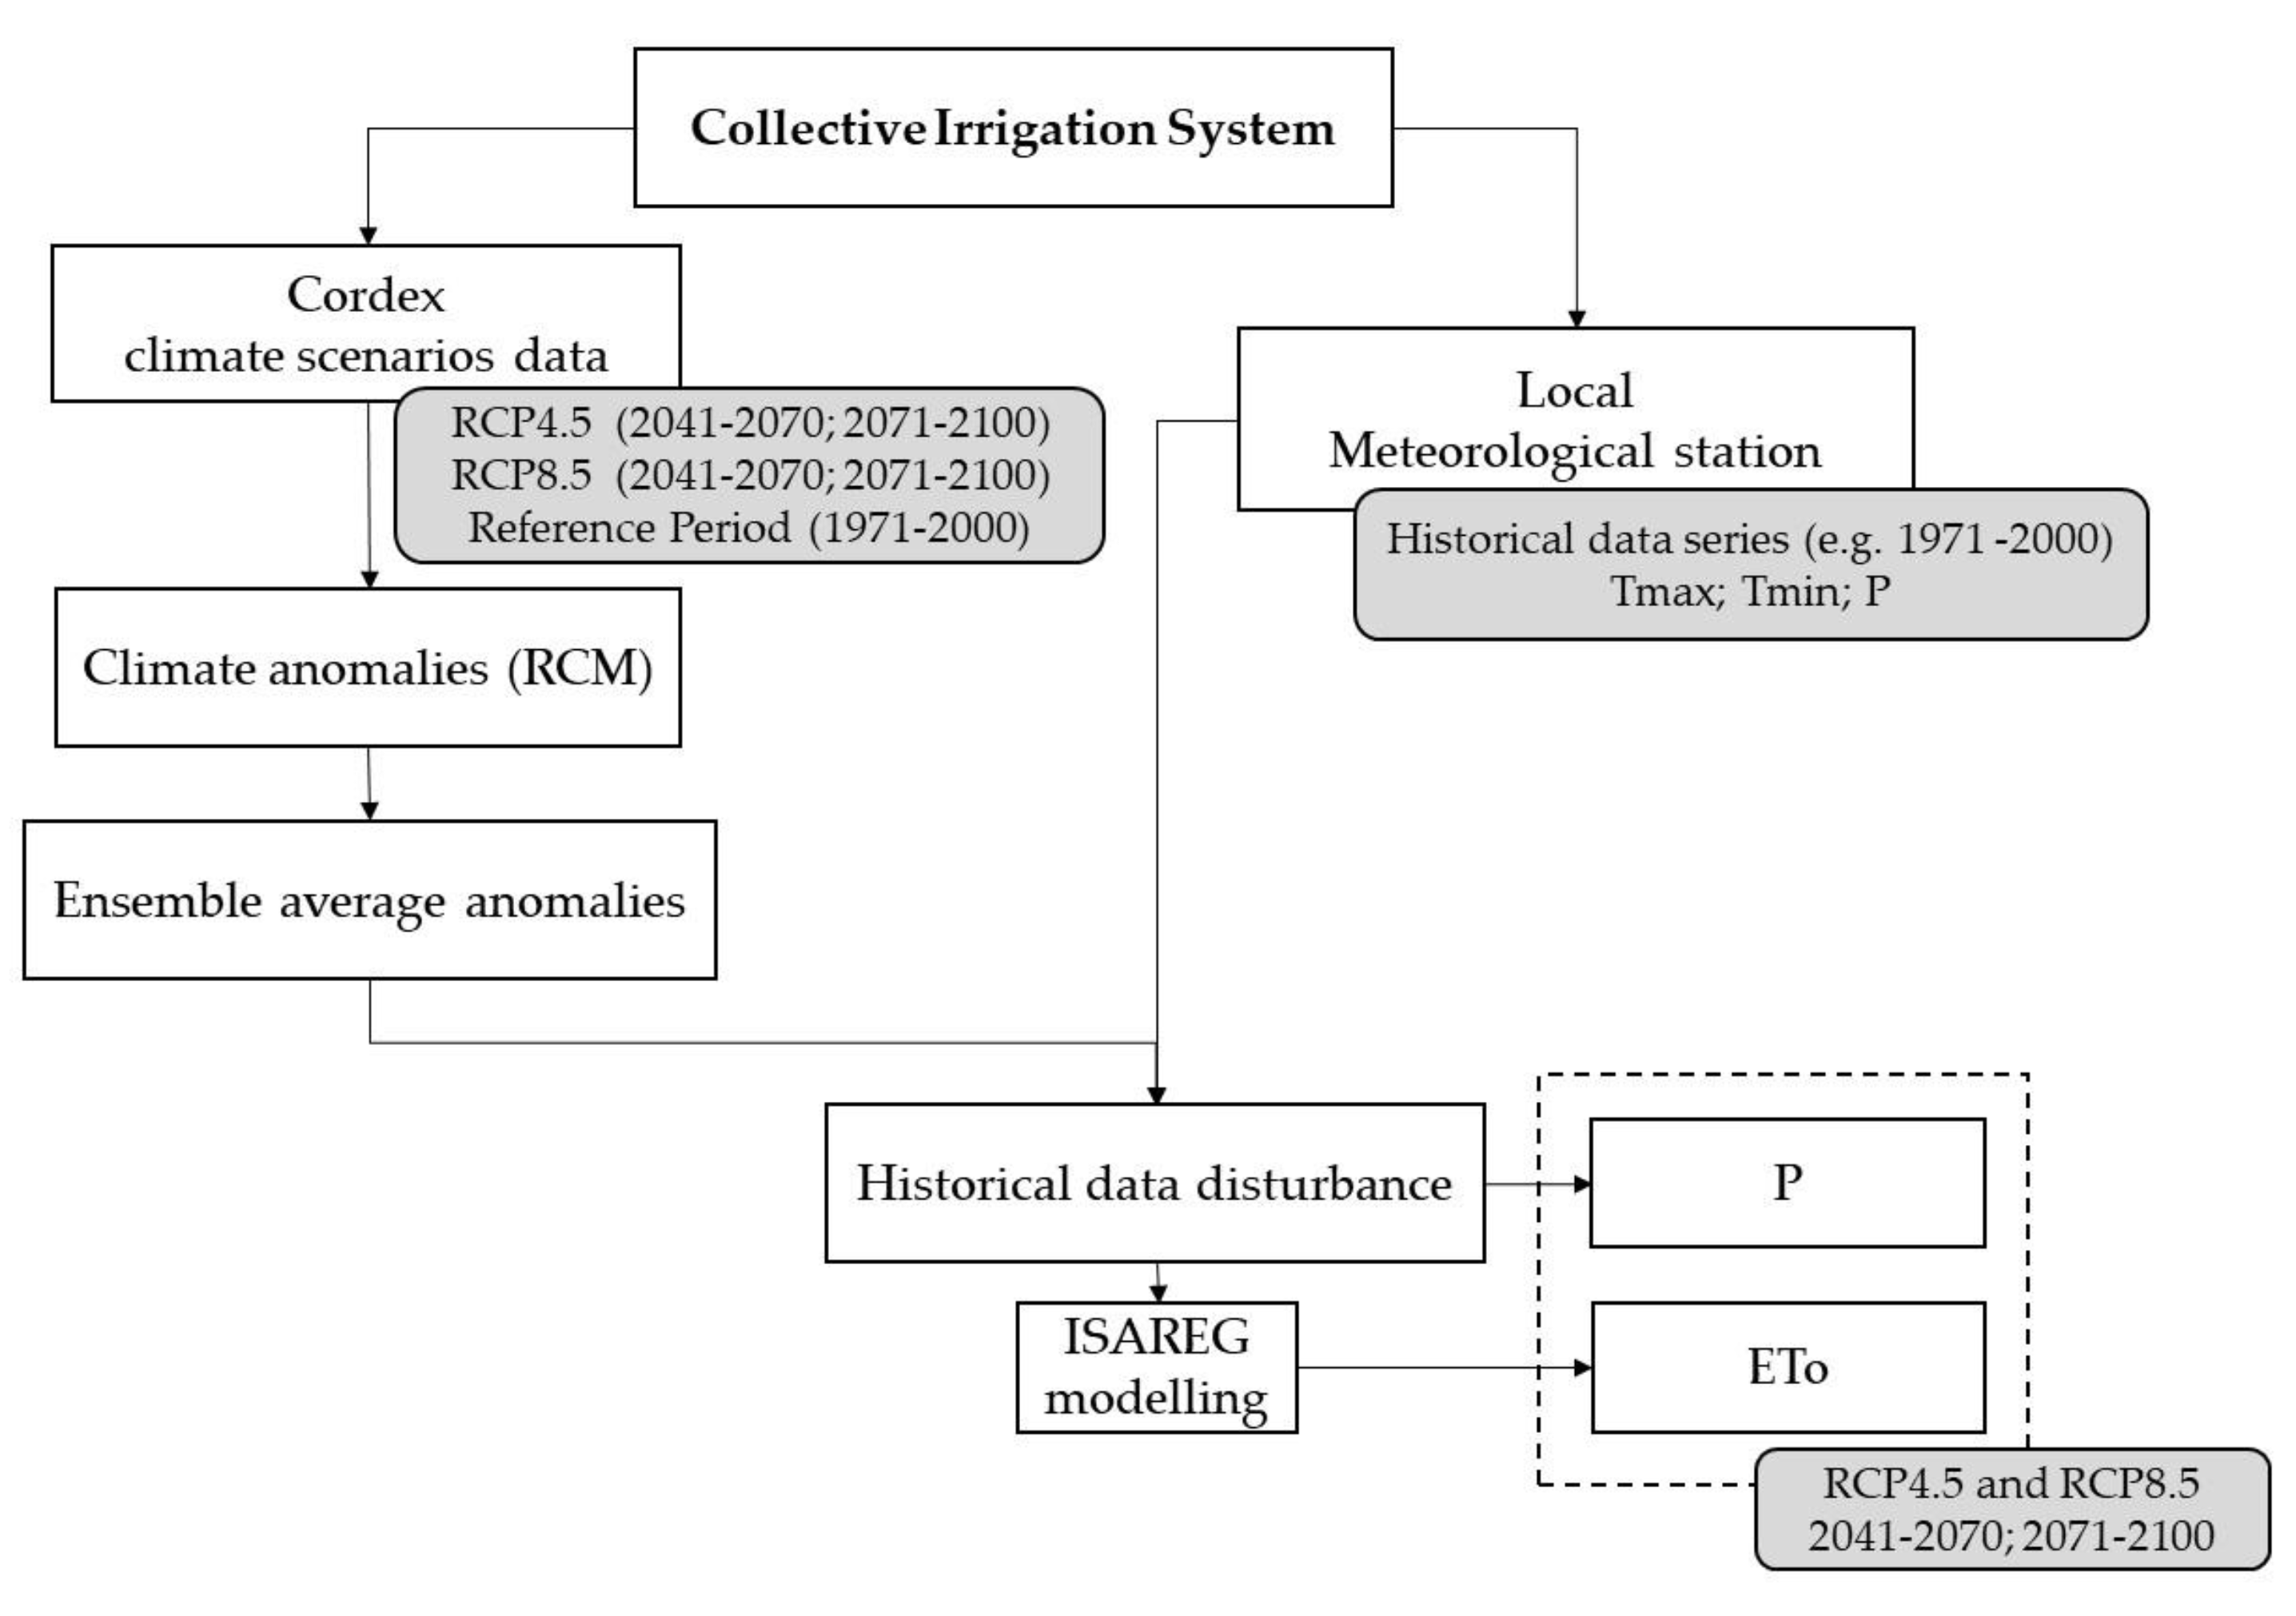
The methodology considers two CC scenarios, RCP4.5 and RCP8.5, and two periods, 2041–2070 and 2071–2100. The RCP4.5 is a controlled emissions scenario in which the level of global temperature rise is limited, while the RCP8.5 scenario corresponds to a more severe scenario in which there is a continuous growth of emissions throughout the 21st century. The period 2041–2070 was selected in order to represent a near future allowing to support farmer’s decisions, while the more distant scenario 2071–2100, allows to obtain a clearer signal of the CC impacts. On the other hand, because Collective Irrigation Systems present hydraulic infrastructures, which are designed for very long periods, it is necessary to consider larger temporal horizons. To obtain an ensemble of projections for each climate scenario and periods, six General Climate Models (GCM) were selected. The climate scenarios simulated the GCM model were downscaled using two Regional Climate Models (RCM), except for the global model CM5-MR in RCP4.5, for which there was only one model available. The future climate change projections produced by the RCM models were provided by the CORDEX project (Coordinated Regional Climate Downscaling Experiment). It was intended to build an ensemble consisting of 12 projections produced by six GCM × two RCM, or each climate scenario and period. However, for the RCP4.5 scenario, it was found that not all models were available for the reference period (1971–2000), not allowing bias correction. Thus, for RCP4.5, only two GCM were used, combined with two regional models. From the projections produced by the RCM, the monthly values of maximum and minimum temperature (Tmax and Tmin, respectively) and precipitation were taken for the reference period (1971–2000) and for the scenarios RCP4.5 and RCP8.5 considering the periods 2041–2070 and 2071–2100.
The RCM used for the RCP4.5 scenario differ from the regional models used for the RCP8.5 scenario. However, since it is intended to use an ensemble of climate projections, the difference between regional models does not affect the work developed here. The simulated scenarios were produced within the scope of the CORDEX project through the IS-ENES Climate4Impact portal. The spatial resolution of 11 km was chosen since it was the one with the highest and with the largest number of available models. The CORDEX project provides the climate scenarios data the in NetCDF files, which were later exported to csv using the Panoply 4.12.4 program freely available at [50]. Table 1 shows the global and regional models used for each scenario, as well as the institutions that developed them.
Climatic Anomalies
Climatic anomalies are the differences in the values of the climatic variables, between the periods of the future CC scenarios, 2041–2070 and 2071–2100, and the reference or base line period simulated by the RCM model (1971–2000). The average anomaly for the various models under study corresponds to an ensemble of 12 projections (six GCM × two RCM) defined for each scenario and period. The use of an average instead of the results of each RCM alone intends to mitigate the uncertainty associated with the climate projections. The anomalies will be later used to disturb the observed historical data series (1956–1985). When analyzing the data, it was found that the Had-GEM2-ES-COSMOcrCLIM model only had data up to November 2098, so all anomalies were calculated for the period 2071–2098 instead of 2071–2100.
Corrected Climate Scenarios Data
To correct the bias in the future climate scenarios projections produced by the RCM, corrected climate series are constructed through the use of the monthly climate anomalies (Ensemble) of the climate scenarios (2041–2070 and 2071–2100). The anomalies were used to disturb the observed historical series (1956–1985) according to the delta change method [15,51]. This method consists of adding the anomalies to the observed historical series for the minimum and maximum temperature (°C). Regarding precipitation (mm), a multiplicative factor was used according to the following expressions.
where Tscenario is the corrected temperature for the climate change scenario (°C); Thistorical is the temperature observed in the reference period (1971–2000) (°C); and Tanomaly corresponds to the difference between the air temperature simulated by the RCM for climate change scenarios (RCP4.5 and RCP8.5) and the temperature simulated by the RCM for the reference period (1971–2000) (°C).
For the precipitation variable, the delta change method is given by:
where Pscenario is the corrected precipitation regarding the climate change scenario (mm); Phistorical is the precipitation observed in the reference period (mm); PRCM scenario is the average monthly precipitation simulated by the RCM for the climate change scenario (mm); and PRCM reference is the average monthly precipitation simulated by the RCM for the reference period (mm).
The disturbed climate series were used to calculate ETo for the CC scenarios and periods, and to elaborate the precipitation input files for the calculation of crop irrigation requirements. The flowchart presented in Figure 2 shows the steps to compute reference evapotranspiration and precipitation for the historical data and for the CC scenarios.
2.1.2. Irrigation Requirements
Global Irrigation Water Requirements
Crop evapotranspiration, ETc, was computed using the FAO single crop coefficient methodology [52]:
where ETc is the crop evapotranspiration, ETo is the reference evapotranspiration and Kc is the crop coefficient.
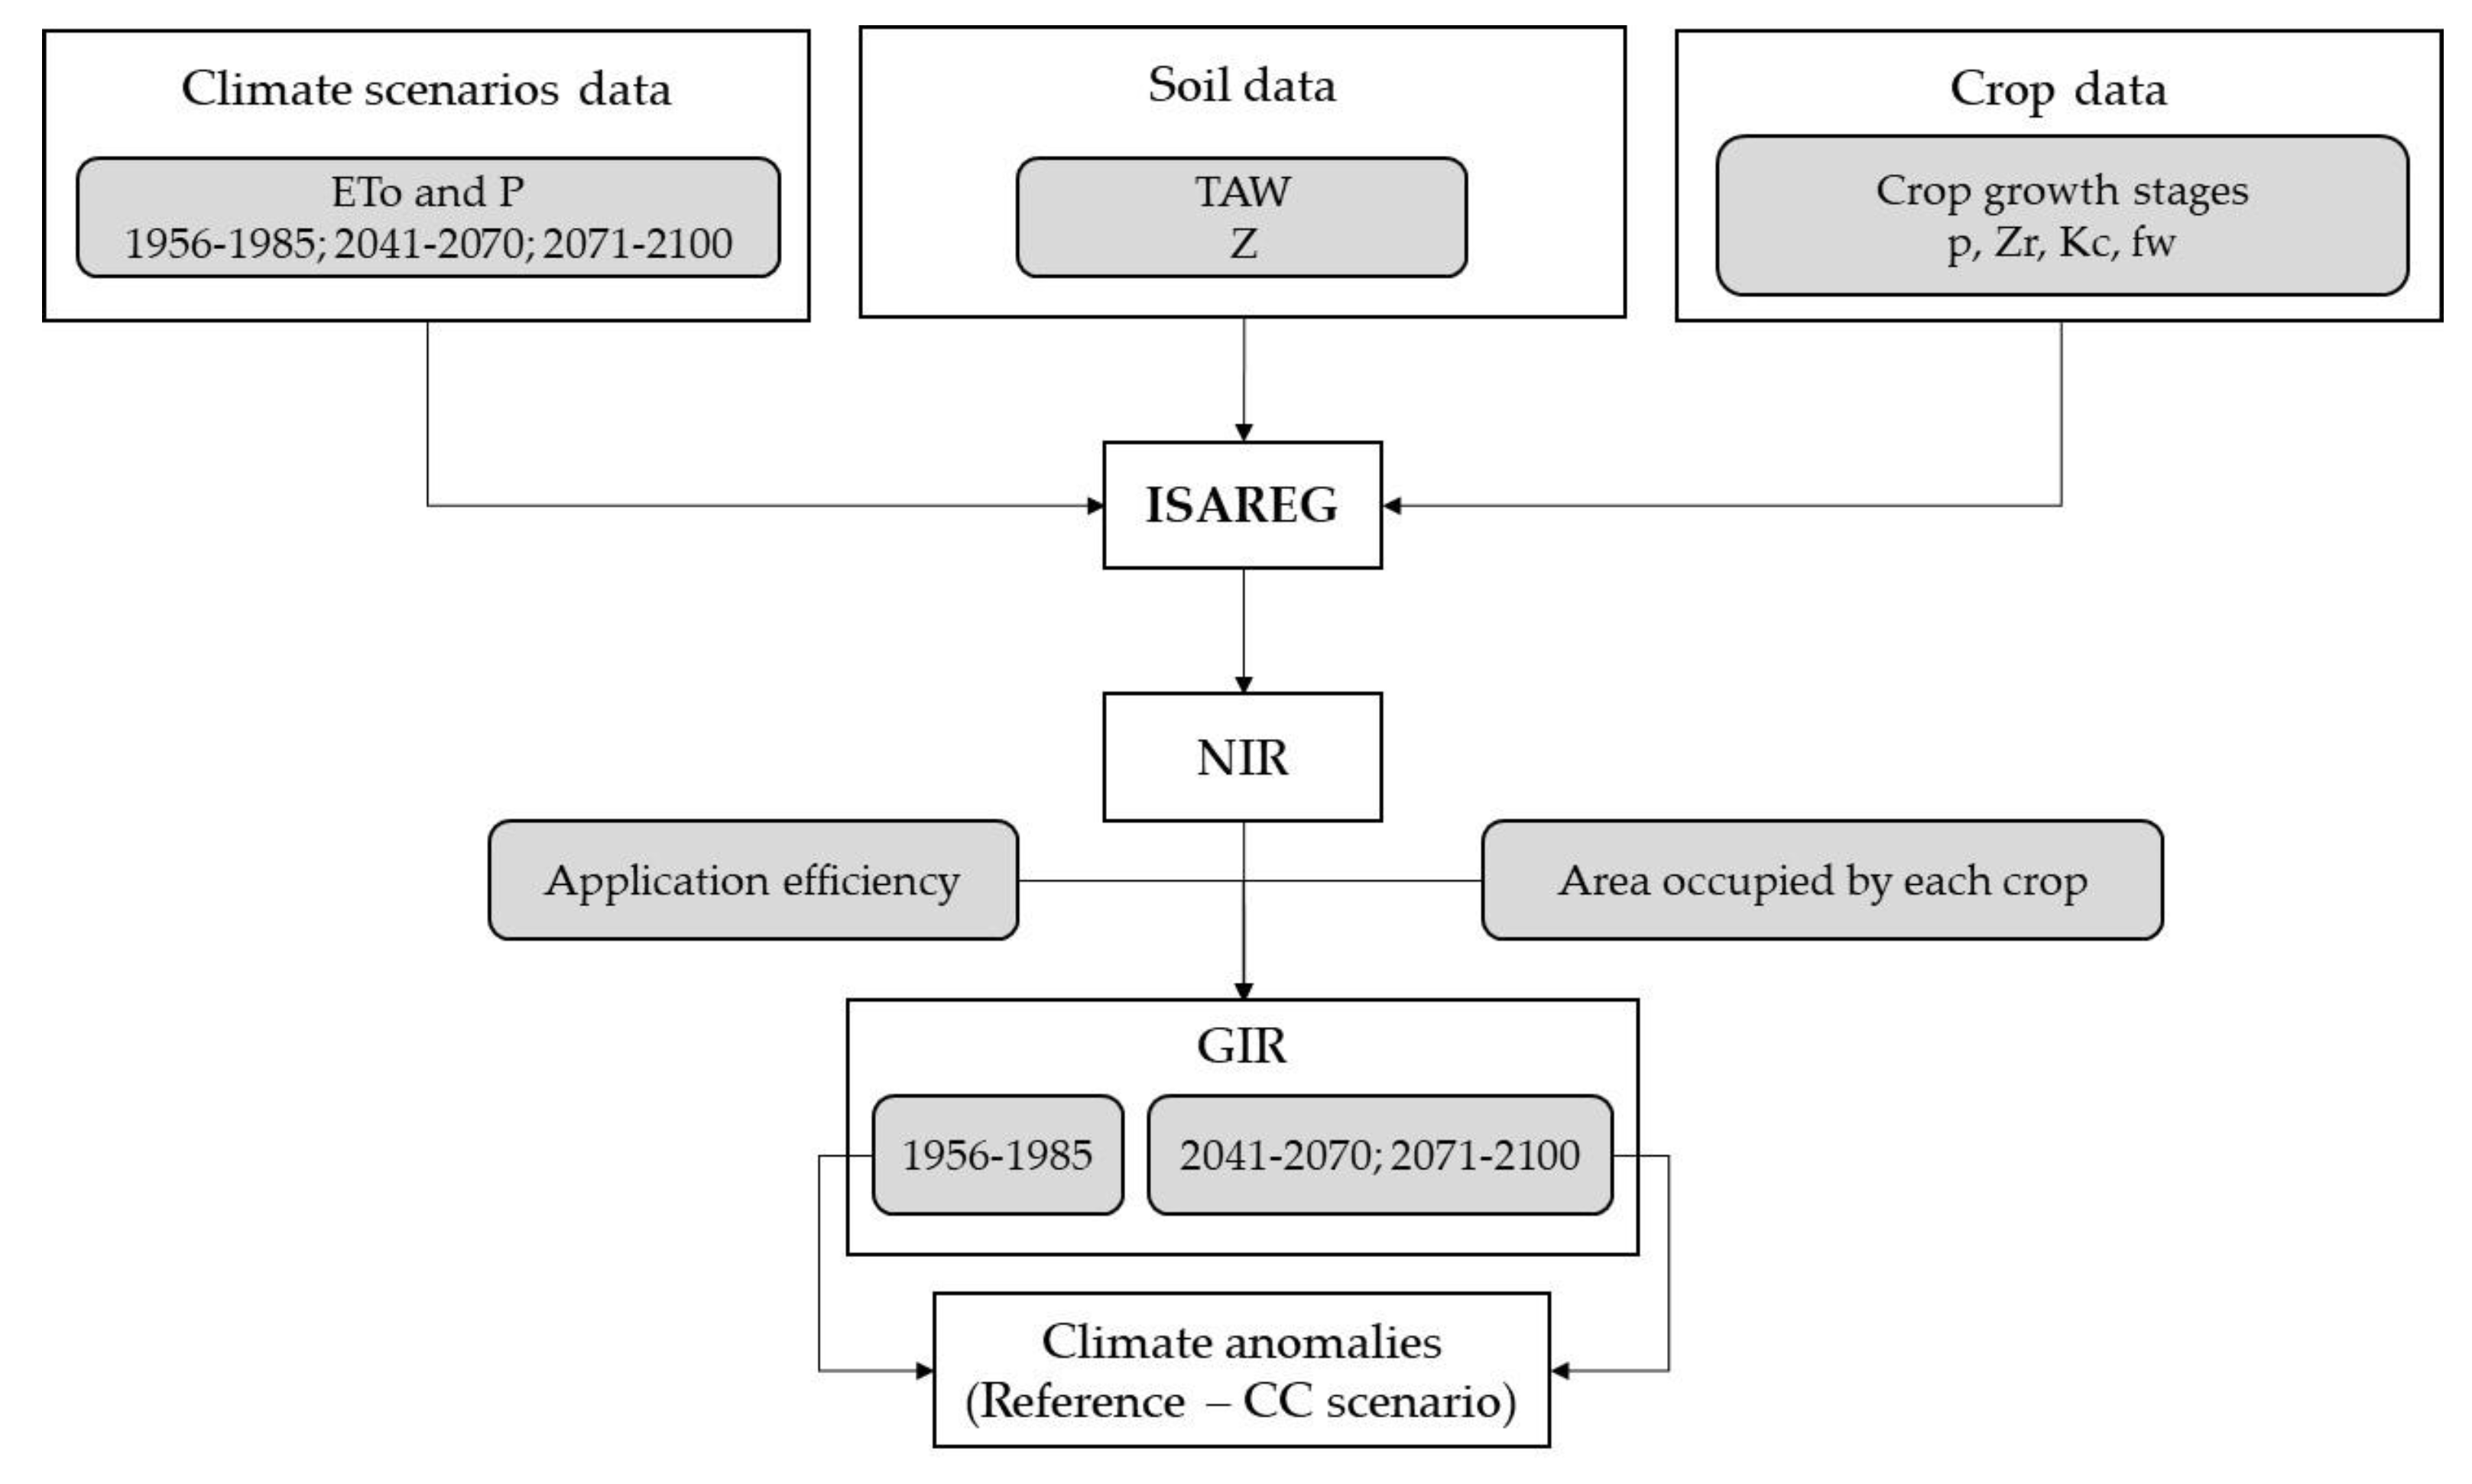
To compute the net irrigation requirements (NIR) for each crop, the soil water balance model ISAREG [53], based upon the FAO single crop coefficient methodology [52] was chosen because it has been applied to diverse climatic and soil conditions with good results. Examples of application include those to field crops [54,55], pastures [56], vegetable crops [57,58], and orchards [59,60]. Furthermore, the model has been used for the assessment of climate change on irrigation water requirements (e.g., [61,62]) and for irrigation management at Collective Irrigation System [63,64] and basin level [65].
The sum of the net irrigation requirements (NIR) of all the crops in the IS, affected by the respective on-farm irrigation system efficiency, the wet soil fraction produced by localized irrigation and the fraction of the area occupied by each crop, yields the global irrigation requirement (GIR) of the Collective Irrigation System (Equation (4)).
where GIR represents the global irrigation requirements for the Collective Irrigation System (mm), NIR the net irrigation requirements for each crop i (mm), Swa the wet soil fraction for each irrigation system (fraction), Ef the application efficiency of the irrigation system (fraction), Ai the area occupied by each crop i (ha), and AT the total irrigated area of the Collective Irrigation System (ha).
The monthly and annual GIR anomalies were calculated by comparing the values obtained for the historical observed period (e.g., 1970–2000) and the 2041–2070 or 2071–2100 periods. The methodology is presented in Figure 3.
Irrigation Water Requirements at the Source
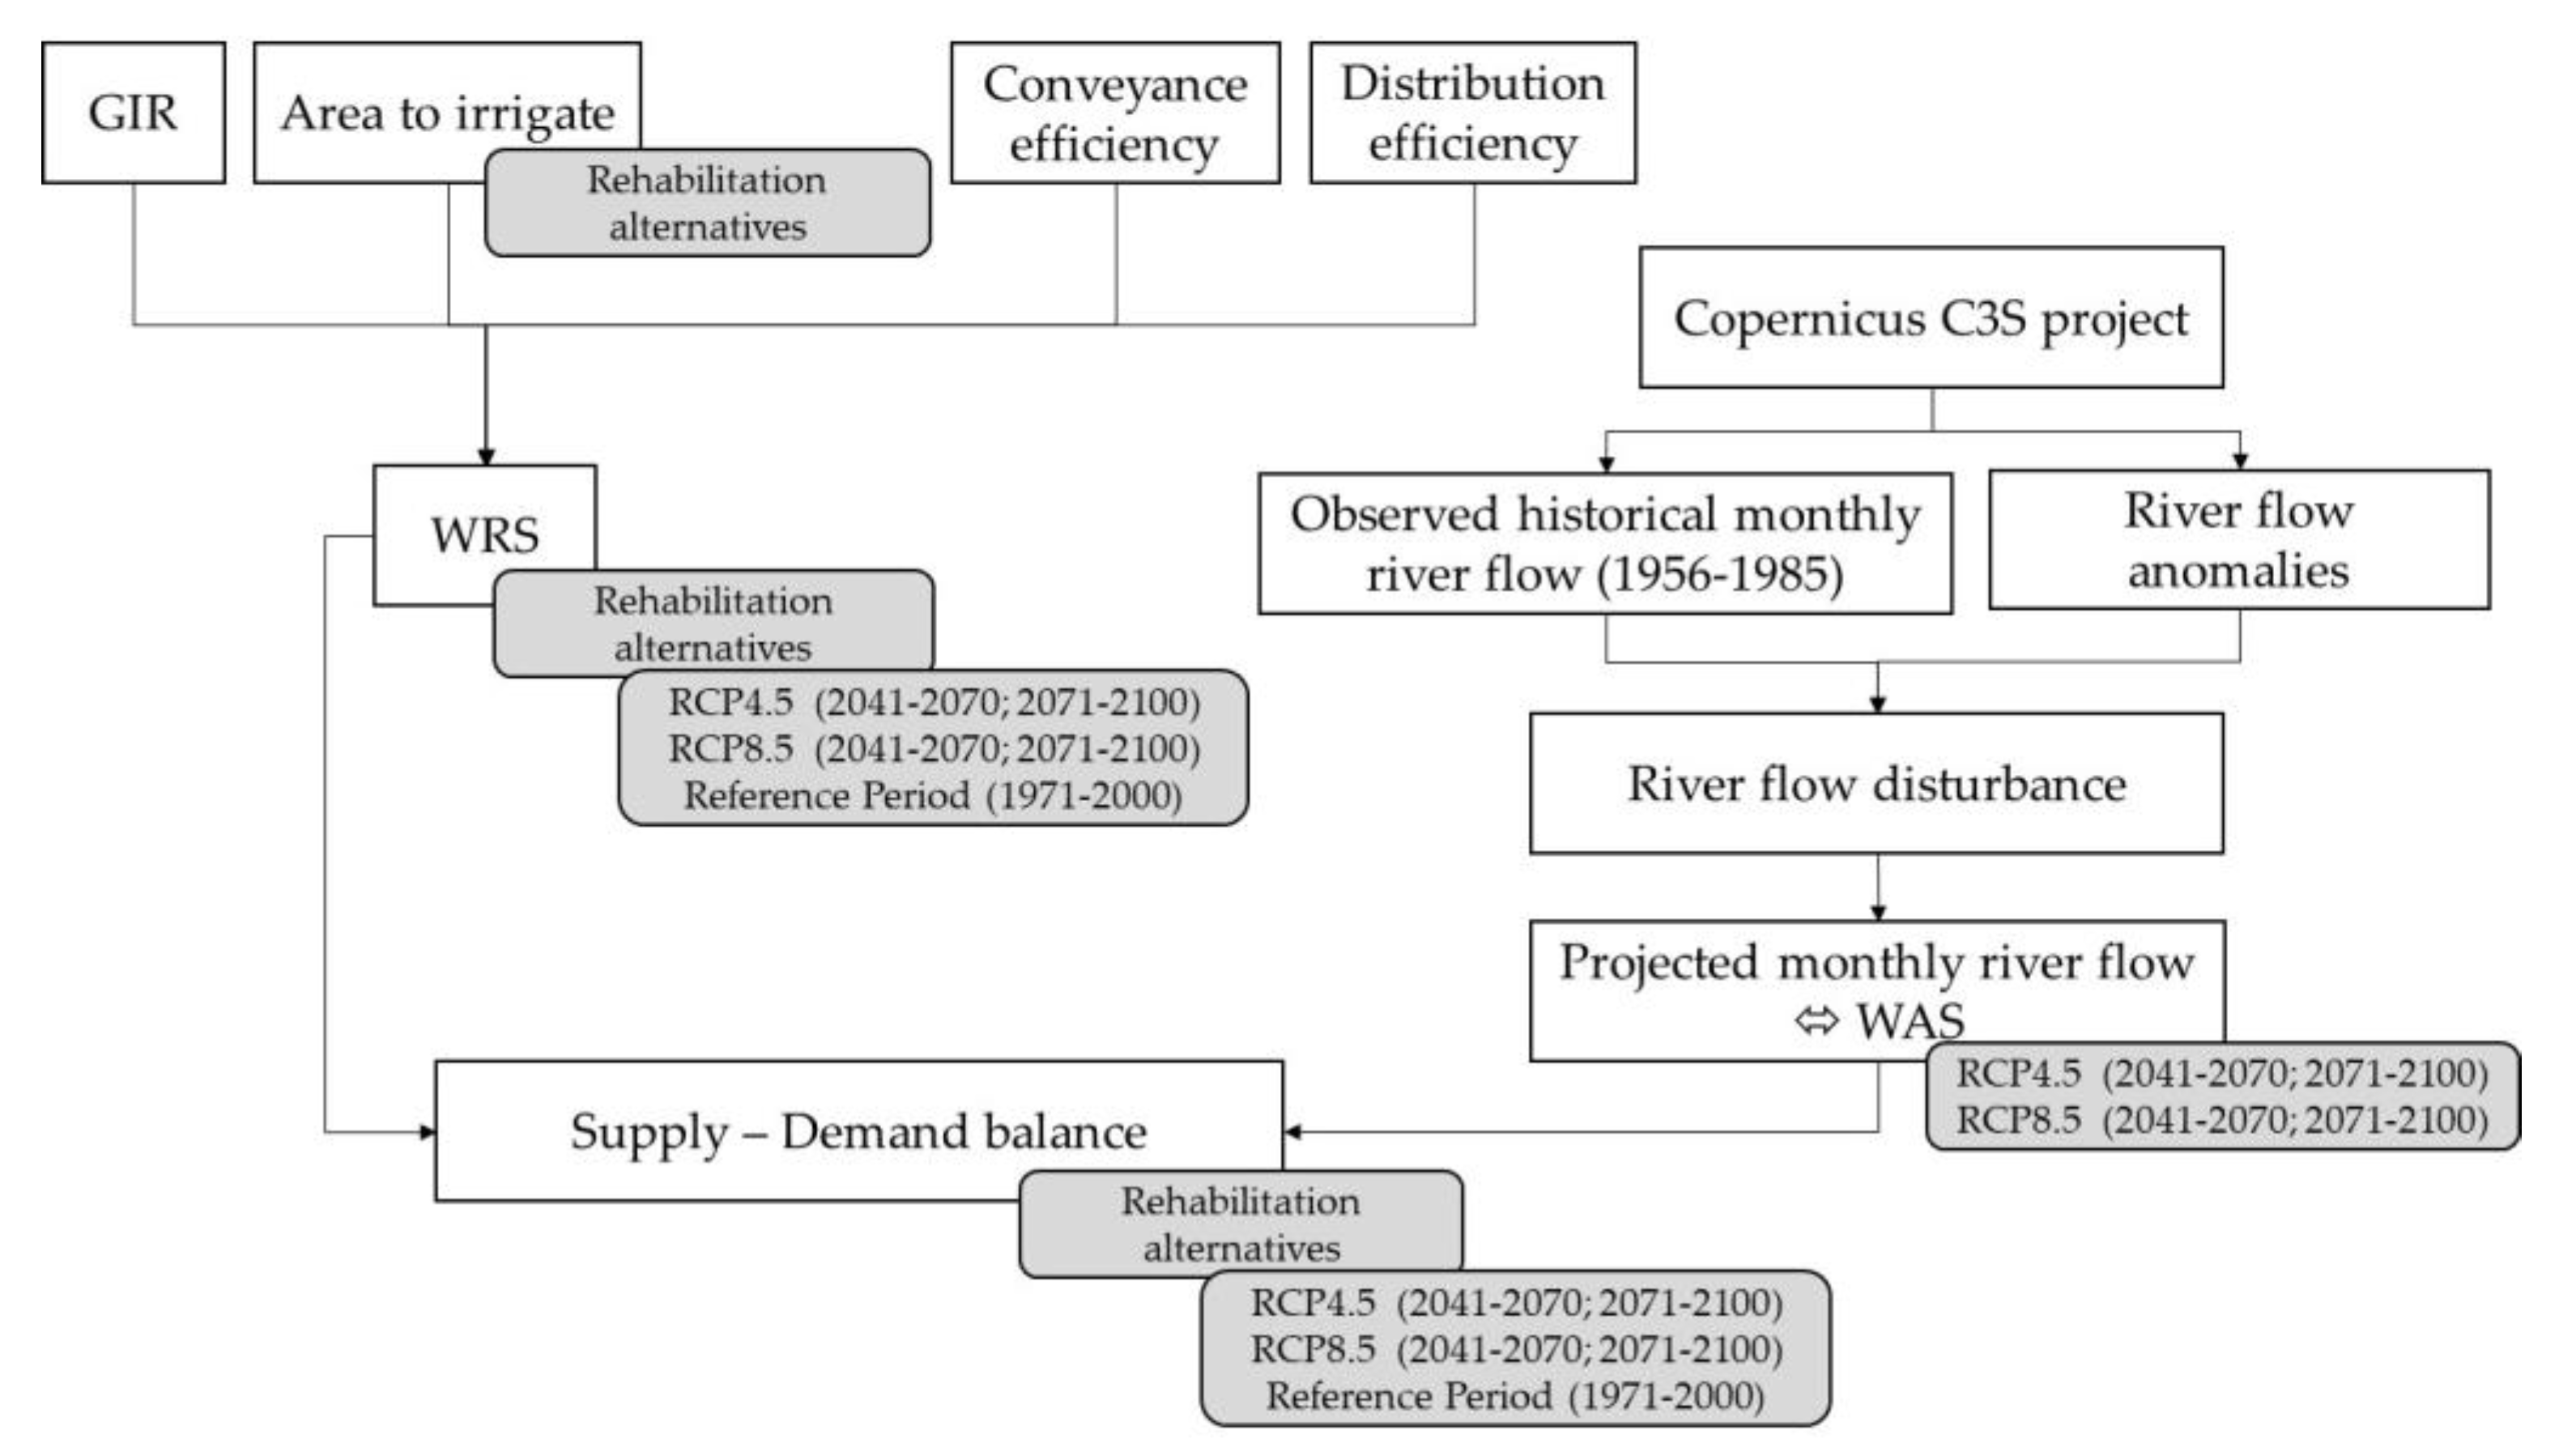
Water losses occur from the water abstraction point at the source to the hydrants supplying the farmer’s plots, due to leakage and evaporation. The number of losses depend upon if the water conveyance and distribution is performed by open channel or by a pressurized pipe system. In order to determine the water requirements at the source (WRS), it is therefore necessary to affect the global irrigation requirements determined at the plots level, by the conveyance and distribution network efficiencies (Equation (5)).
where WRS are the water requirements at the source (hm3), GIR are the global irrigation requirements (mm), EC and ED are the conveyance and distribution efficiencies (fraction), respectively, and A the total area to irrigate (ha).
2.1.3. Water Availability at the Source and Supply–Demand Balance
The methodology developed here applies to run-of-river Collective Irrigation Systems for which the availability depends upon the instantaneous stream flows, which in turn depend upon the watershed runoff flows. Projected changes in runoff were therefore used as a proxy for the expected changes in the stream flows. Runoff anomalies are provided by the Copernicus Climate Change Service (C3S) project [66] were used. Runoff anomalies data was obtained through the large-scale hydrological model HYPE (Hydrological Predictions for the Environment), with a daily time step and a spatial resolution of 50 km [67]. Data were only available for 2050 and 2080, so it was considered that these years were representative of each of the study periods (2041–2070 and 2071–2100). The river flow anomalies were used to disturb the observed historical series of the stream flows, producing the projected flow rates for the RCP scenarios, which correspond to the irrigation water availability, or supply, at the source (WAS). The supply–demand balance was then calculated for the future climatic scenarios as:
where S − D represents the supply demand balance, WAS represents the irrigation water availability at the source, and WRS are the irrigation water requirements at the source (demand).
The S − D results allowed the estimation of the irrigation supply guaranties for the future climatic scenarios.
2.1.4. Climate Resilience Analysis
The methodology applied in the present study to assess the resilience of a run-of-river Collective Irrigation System analyses three components, each one integrating the parameters that were considered the most determinant of resilience. These components are (i) the crop production systems; (ii) on-farm irrigation systems; and (iii) project rehabilitation alternatives for the conveyance and distribution of the irrigation water from the source to the farmer fields. By integrating these different components, this methodology allows for an integrated assessment of the climate IS resilience and not just of the infrastructures. A chromatic scale of resilience is used for the sake of simplicity, as it allows a straightforward identification of the weaknesses and strengths of the system [68]. Chromatic resilience scales, from very low to very high resilience, were created for each parameter [69].
- Climate resilience of crop production systems
The parameters considered of importance within this component were the orchards chilling requirements, crop response to water stress and salinity, the percentage of perennial crops in the Collective Irrigation System cropping pattern, and the crop production costs.
Chilling requirements:
Knowing the chilling requirements of a cultivar can be critical in determining if it can be adapted to a particular climatic condition. Fruit trees need to accumulate a cultivar-specific amount of chilling to break winter dormancy and to flower properly in the spring. Growers can use this information to anticipate the future performance of their orchards and the adaptation of new cultivars to their region [70,71]. With the increase in air temperature, namely the minimum temperature, projected by the climate models, the number of years in which the accumulation of chilling hours will not be sufficient to supply all the chilling requirements of the existing varieties in the MIS may increase. Based on the number of hours with temperatures below 7.2° [70], to which apple and pear trees must be subjected to break dormancy, the number of chilling units were accumulated, corresponding to the 90th and 10th percentiles for the period between 2011 and 2021. These values are to be compared to the chilling requirements of the fruit trees in the Collective Irrigation System.
Response to water stress:
According to [72], the yield response factor, Ky, relates the reduction of the crop productive yield with the reduction in evapotranspiration caused by the water deficit. The higher the Ky value, the greater the reduction in yield for a given reduction in evapotranspiration. Five classes of resilience were created for this parameter (Table 2).
Relation crop yield/salinity:
This parameter was evaluated according to [52], which classifies crops as tolerant, moderately tolerant, moderately sensitive, and sensitive. The parameter relies upon the electrical conductivity of the saturation extract when production begins to decrease (ECe threshold), and the reduction in production by increasing electrical conductivity in the saturation extract (b) after ECe threshold has been reached.
Soil water depletion factor, p:
This factor identifies crop resistance to water stress [52,73] and its knowledge allows the reduction of the volume of water supplied to the crop without production losses. It is also a function of the soil type, and its value is usually lower in clay soils as compared to sandy soils. Three classes of resilience (Table 2) were created for this parameter.
Production costs:
The analysis of installation and operation costs per hectare, unit costs per kilogram of production and gross revenues per hectare was carried out. This analysis will make it possible to assess resilience from an economic perspective, in which crops that require greater investment will present lower resilience, as in the event of crop loss, damage could jeopardize the farm economic viability. Thus, resilience increases from perennial crops (e.g., orchards) and very intensive and specialized agricultural systems, to more extensive and diversified crop systems with low investment and costs where the climate risk will have a low economic impact [74].
Percentage of permanent crops:
Two resilience classes were created for this parameter. It was considered that resilience is low when the irrigated area is composed of 75% or more of perennial crops and that it is high when the opposite occurs. Traditionally, in a situation of water scarcity, the supply of orchards and other perennial crops is prioritized to the detriment of annual crops. If the percentage of perennial crops is too high, this prioritization becomes unfeasible. In this case, the most sensitive or more profitable perennial crops may take priority over less sensitive or less profitable ones, which will lead to certain perennial crops not being irrigated, thereby reducing the resilience of the IS.
- Climate resilience of on-farm irrigation systems
Within this component, the parameters considered of importance with respect to climate change adaptation/resilience are the irrigation system application efficiency and the fraction of soil that is wet by irrigation. Irrigation systems application efficiency (AE) is defined as the ratio between the amount of water retained in the root zone and the amount of water applied by the system. Thus, a low AE means that irrigation system produces high water losses, and therefore its climate resilience is low. Four resilience classes were created for this parameter (Table 3). The soil wetted area, Swa, corresponds to the ratio between the area wetted by the irrigation system and the total field area. Low SWA induces reduced evaporation losses, and thus higher climate resilience (Table 3).
- Climate resilience of the project rehabilitation alternatives
Project rehabilitation alternatives aim to improve irrigation water distribution and supply to the farmers’ fields. Thus, the parameters considered of greater importance were the number and type of water sources, the water quality at the source, the type of distribution system (open channel or pressurized pipe), the supply demand balance, and the number of severe supply failures for each alternative.
Number and type of water sources considered:
Five resilience classes were created (Table 4), considering not only the number of water sources and their type (surface water vs. groundwater), but also their regularization capacity given by the existence or not of intermediate reservoirs.
Irrigation water quality at the source:
Irrigation water quality impacts the soil solution osmotic potential, and consequently the ability of the plants roots to absorb water, which can be very important in water scarcity conditions. To quantify the impact of water quality upon resilience, the values of electrical conductivity (ECw) at the water source were used, together with the crop specific levels of restriction proposed by [75]. Resilience classes are presented in Table 4.
Supply–demand balance:
This balance, calculated with Equation (6), allows the evaluation of the capacity of the different project rehabilitation alternatives to meet the irrigation requirements at the source (WRS) for an observed historical period (e.g., 1970–2000) and for each of the climatic scenarios and periods of analysis (RCP4.5 and 8.5, 2041–2070 and 2071–2100). For the period from April to October, corresponding to the irrigation season, and for each scenario and analysis period, the monthly stream flows obtained through the disturbance of the historical runoff series, are compared with the IRS. When 90% of the annual flow rates were able to supply at least 90% of the IRS (a value often used in irrigation projects) it was considered that there were no supply failures in that year. The methodology used for the supply–demand balance is presented in Figure 4.
Three climate resiliency classes were created regarding failures in water supply (Table 4). The minimum supply guarantee of 80% usually considered in irrigation projects was used, meaning that it is required that the supply meets the crop irrigation requirements in at least 80% of the years.
Number of severe irrigation water supply failures:
In the present study, severe failures are considered when the volume of water supplied is less than 60% of the irrigation volume required at the source. As the Collective Irrigation System uses runoff river flow, the failures severity was analyzed with a monthly step. For severe failures, two resilience classes were created, one corresponding to a system with severe failures and the other to a system without severe failures (Table 4).
For the parameters water supply guarantee and number of severe irrigation water supply failures, climate resilience was evaluated based on the projection for the RCP4.5 and RCP8.5 scenarios, considering the periods 2041–2070 and 2071–2100. For the crop parameters and irrigation water quality at the source, with no specific data available on how these parameters will behave in the future climate change scenarios, it will only be possible to infer their susceptibility to climate change, based on what is expected to occur in terms of temperature and precipitation evolutions.
2.2. Methodology Aplication to the Maiorga Collective Irrigation System
2.2.1. Localization and Climate of the Studied Area
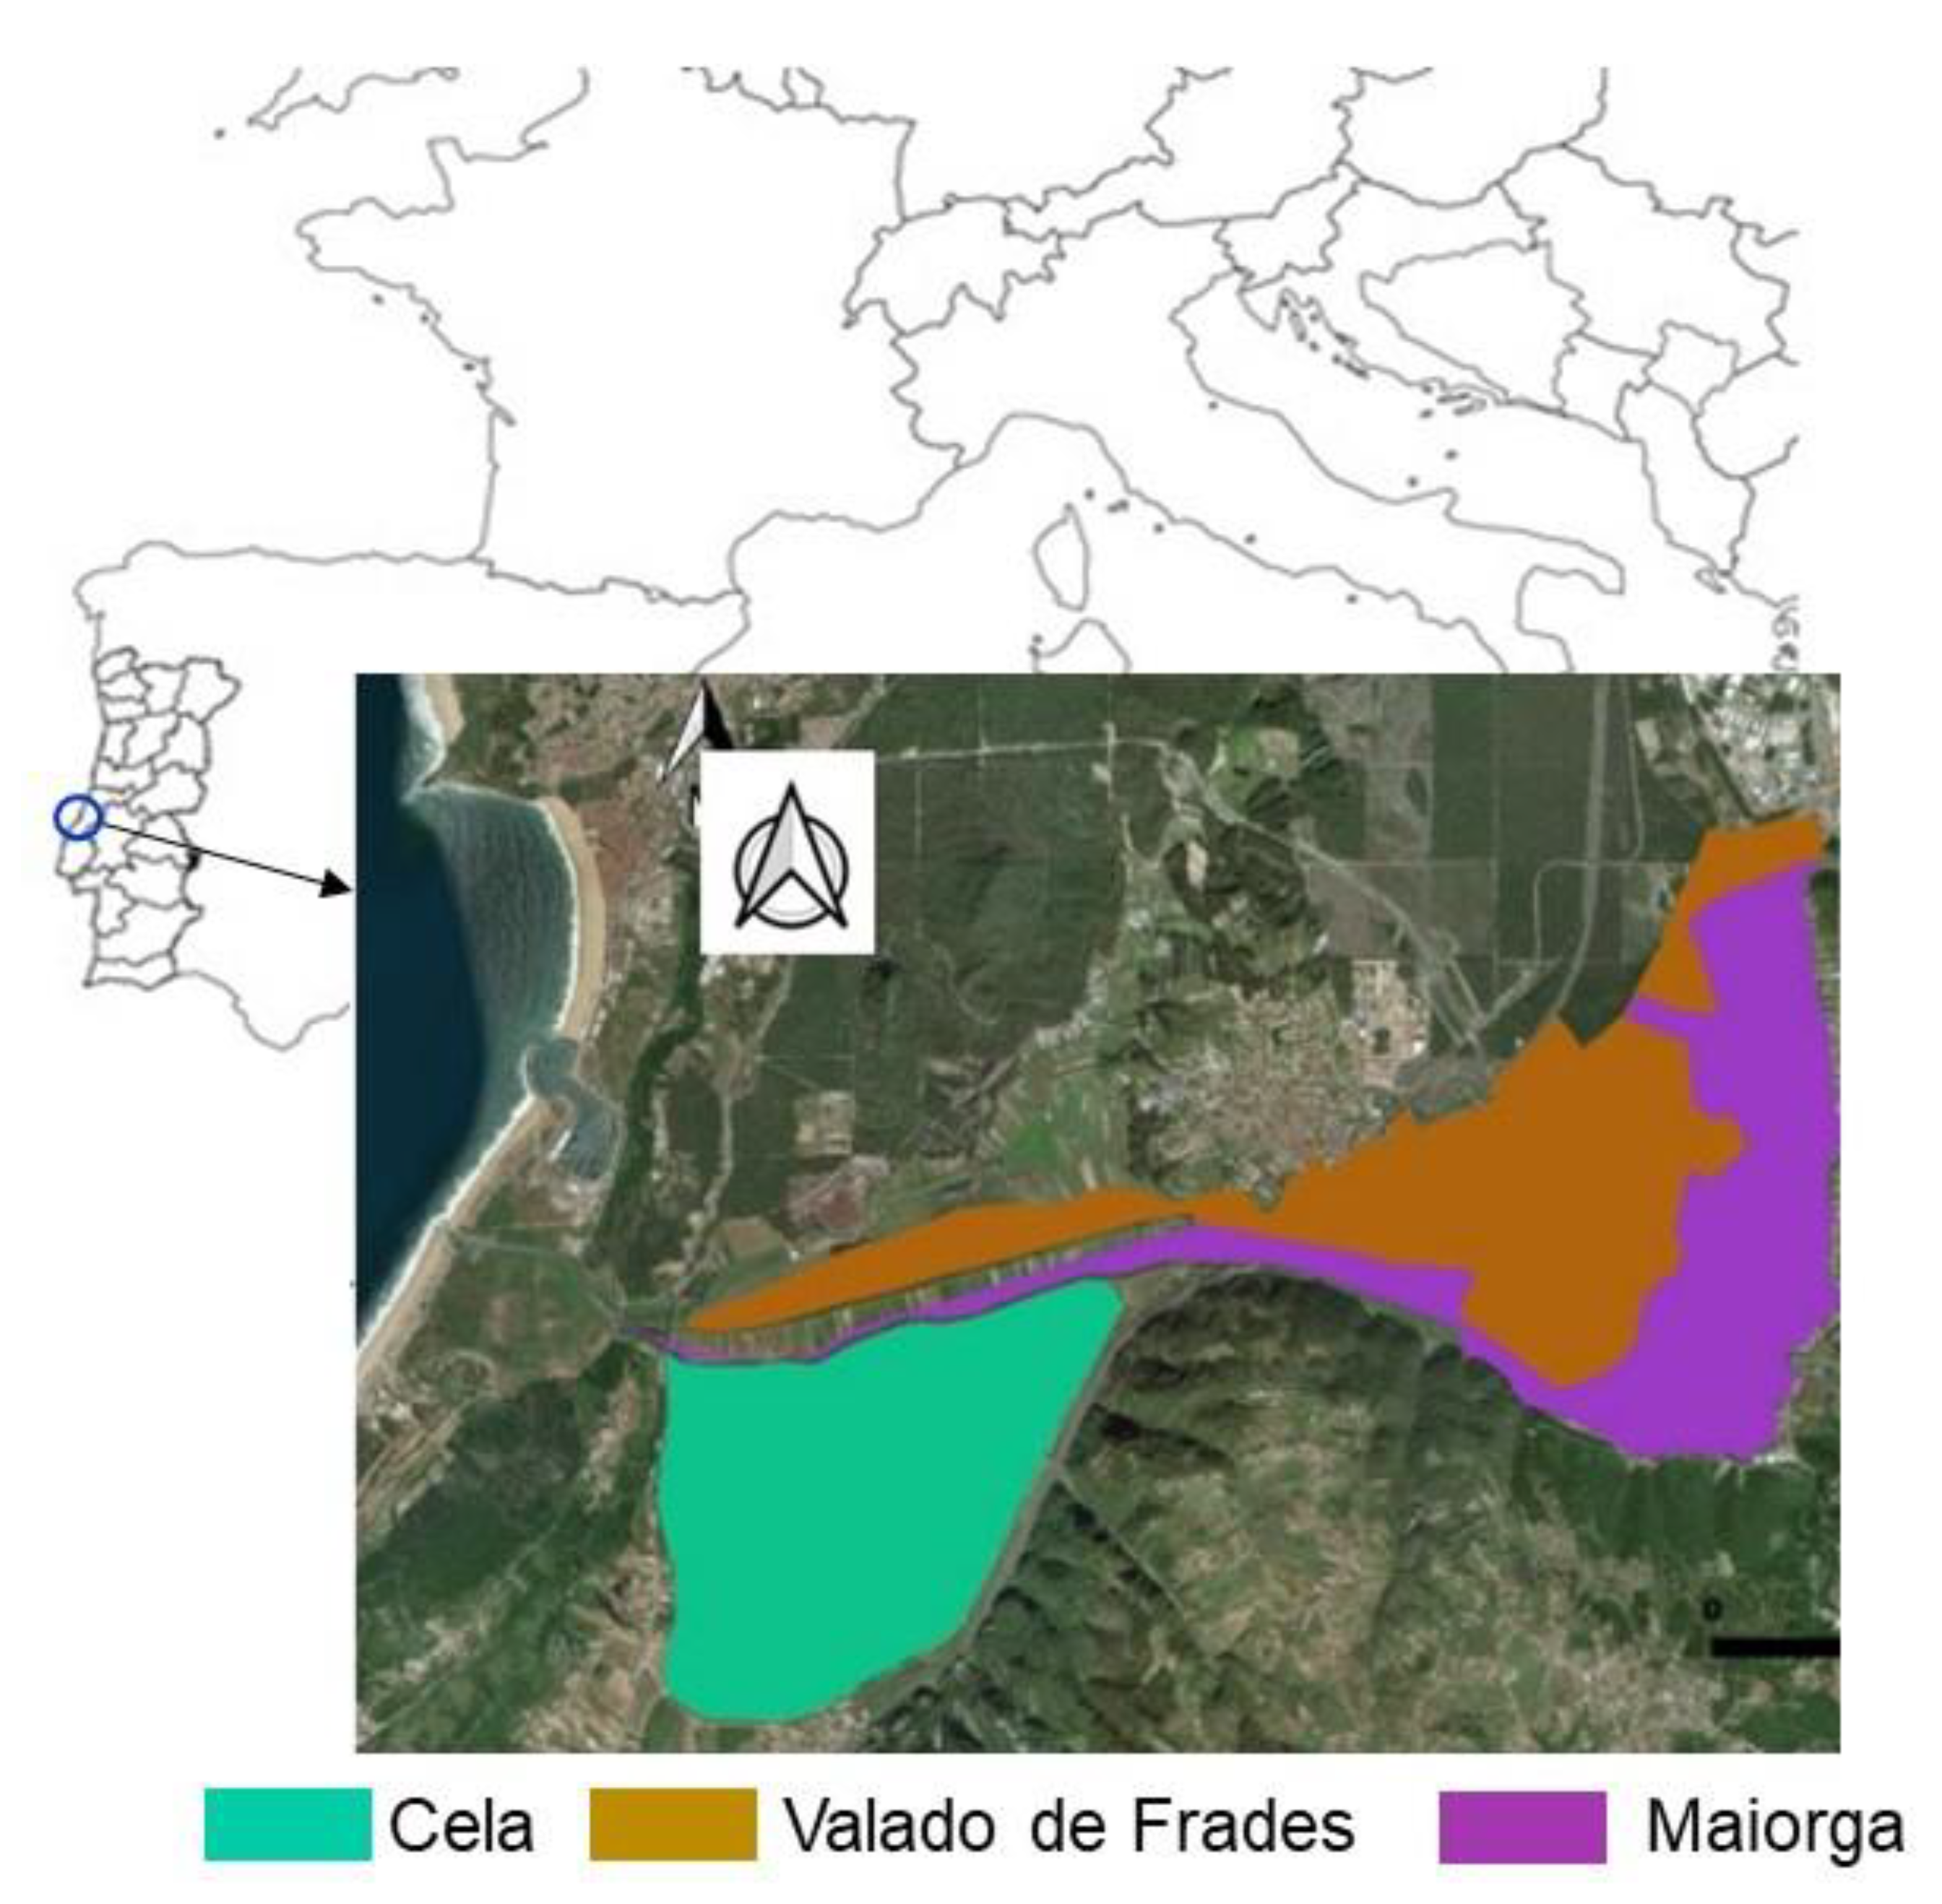
The Maiorga Collective Irrigation System (MIS) is localized in Leiria district, in central Portugal near the Atlantic coast. Figure 5 shows the area that will be occupied by MIS after rehabilitation, consisting of 365.4 ha on an alluvial plain. The MIS borders two other Collective Irrigation Systems, Cela and Valado de Frades, with whom the water sources are shared.
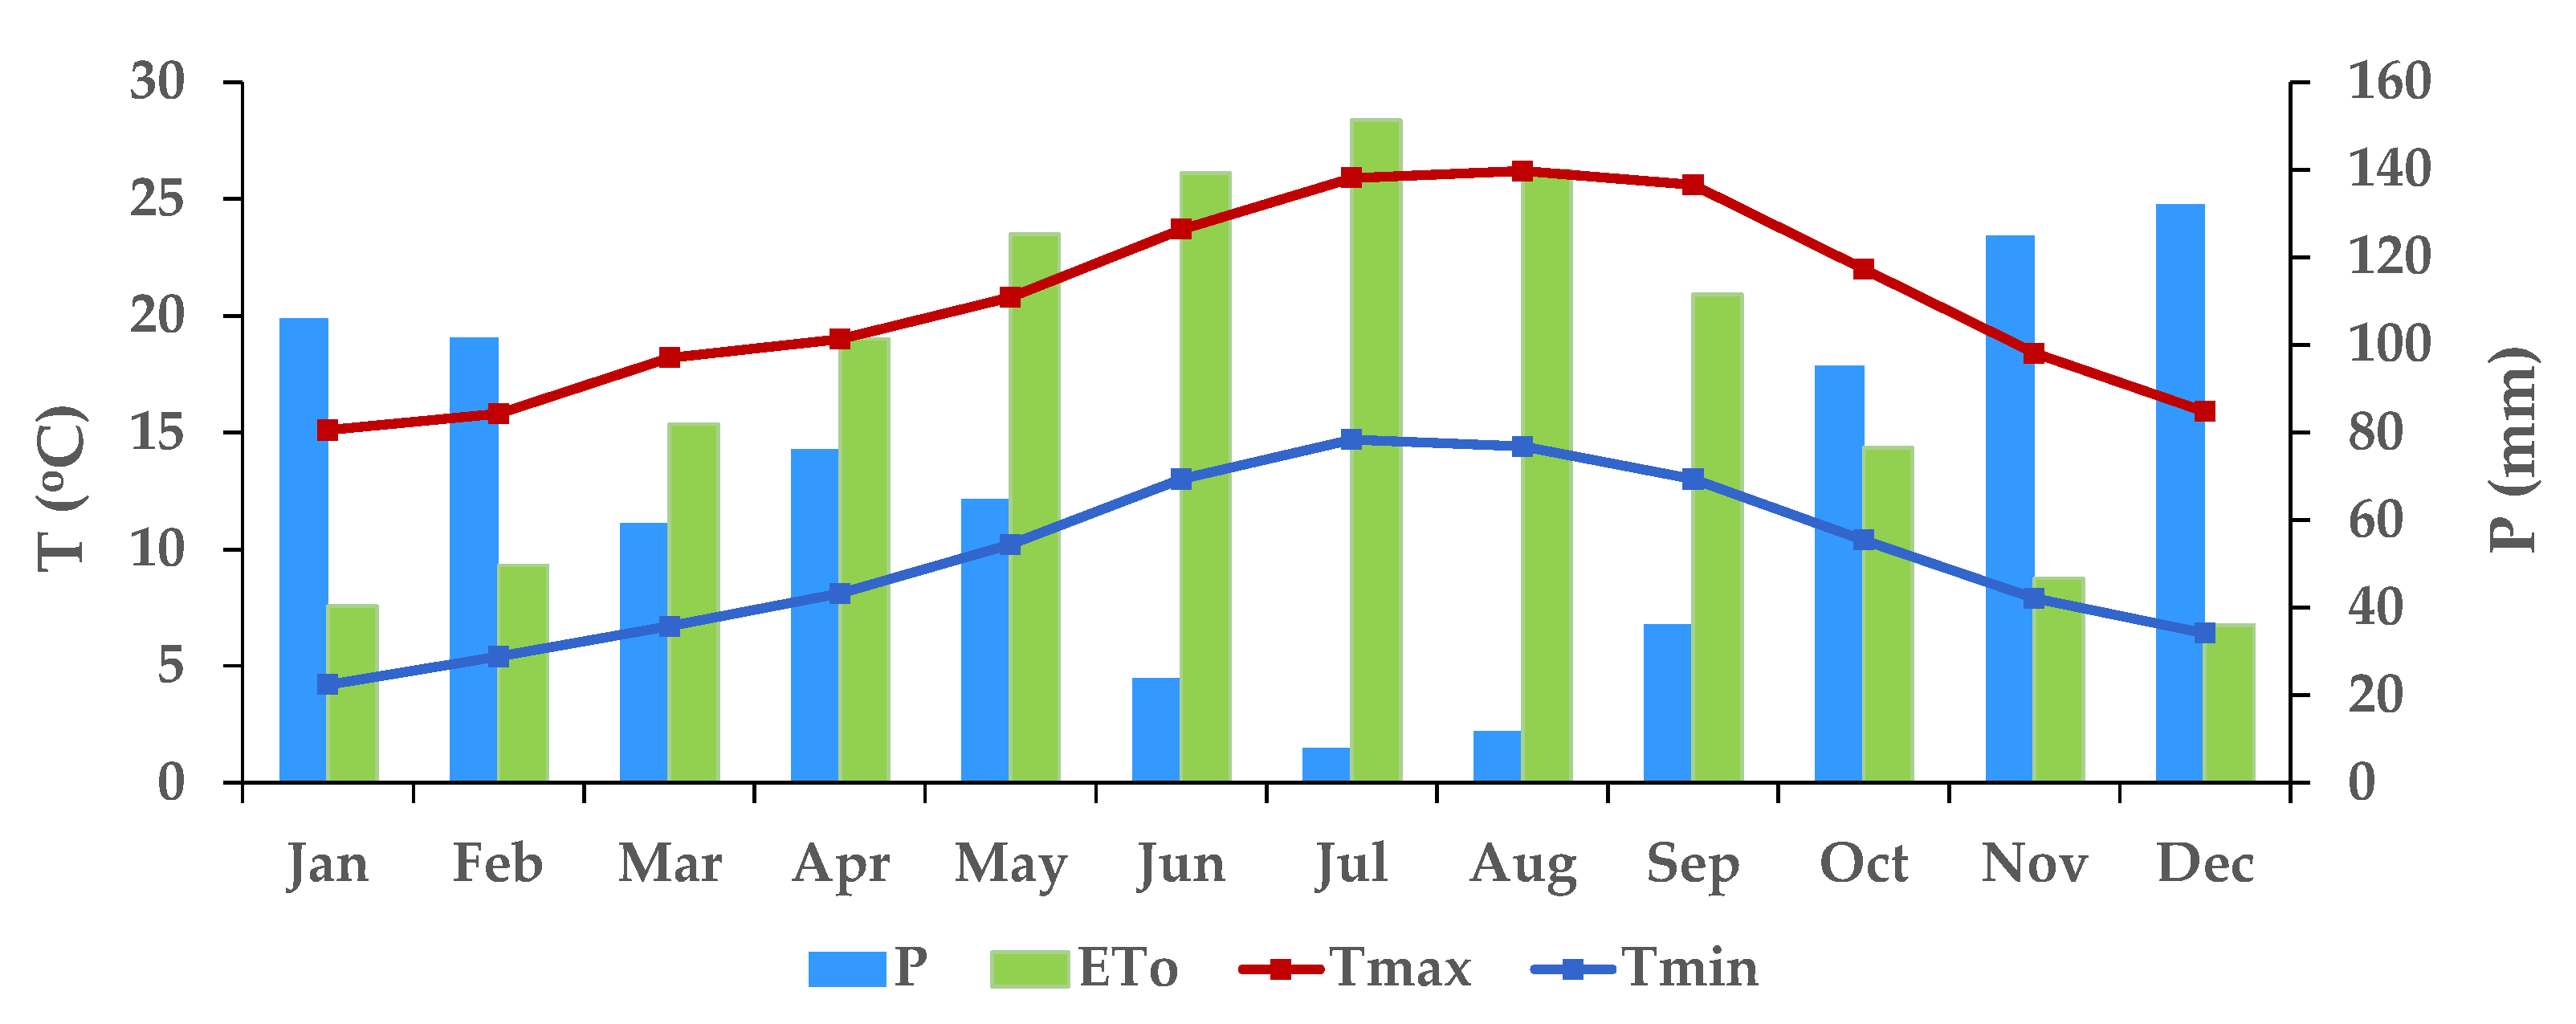
The climate of the region according to the Köppen–Geiger classification system is Csb, temperate Mediterranean climate with dry and mild summers [76]. The 1971–2000 monthly climate norm for the Alcobaça weather station (39°32′ N; 8°58′ W; 38 m a.s.l.), obtained from the Portuguese Institute for Sea and Atmosphere (IPMA) are shown in Figure 6. The seasonal distribution of precipitation is typical of the Mediterranean temperate climate, characterized by its concentration from October to April, during which occurs about 83% of the average annual precipitation (839.6 mm). The months of November, December, January and February are the ones with the highest occurrence of precipitation, with the months of July and August having the lowest average value. The monthly average temperature presents its minimum value in January with 9.6 °C and a maximum of 20.3 °C in July and August [77]. Reference evapotranspiration (ETo) presents the lowest monthly average value in December with 36.0 mm and the maximum in July with 151.4 mm. The above shows how crop production is highly dependent from irrigation in the Mediterranean regions.
2.2.2. Brief Characterization of the Maiorga Collective Irrigation System
The current collective water distribution system of MIS uses mainly runoff river flows from the Alcobaça, Areia and São Vicente rivers, and therefore without the existence of a regularization reservoir. To a lesser extent, ground water is also used as a source for irrigation. The weir on the Alcobaça River, upstream of the MIS, does not allow seasonal regulation of flows for irrigation. This weir supplies part of the MIS area through a hydraulic distribution system, consisting of a channel, pipes and ditches, with a set of agricultural plots in the banks of the Alcobaça River, which directly withdraws water from the river. The São Vicente River is an intermittent river with low flow or absence of flow during the summer. The Areia River constitutes the main source of water for the northern part of the MIS. At the present, the infrastructures that supply the Collective Irrigation System of Maiorga in Central Portugal have deteriorated presenting a low efficiency in water delivery.
The Collective Irrigation System comprises 407 farms, of which 325 present an area smaller than one ha. Farms with areas higher than 10 ha represent 22% of the total area.
Regarding the cropping pattern, pear and apple orchards present the higher share (72.4% of the area) followed by annual crops (mainly horticulture, such as potato and cabbage) covering 20% of the area. This is a typical pattern for this region of the country. Drip irrigation is used in the orchards while in the vegetable crops irrigation is performed by solid set sprinklers systems. To compute the global irrigation requirements, a scenario for the Collective Irrigation System future crop pattern was defined, based upon the pattern of evolution of recent years. This led to an increase in the orchards area to 85% of the total IS area and a decrease of the horticultural crops share to 15%.
2.2.3. Data Sets and Sources
The climatic anomalies were calculated for the reference period 1971–2000. However, these anomalies were used to disturb observed historical series relative to the 1956–1985 period, since historical data was available for the region only for this period, from the Alcobaça meteorological station. These two series are overlapped in 15 years, which may result in lower differences, so it is not an impediment to the application of the methodology.
Based on the historical data ETo was computed using the Penman-Monteith FAO equation [52] and the Hargreaves-Samani equation [78]. For the periods 2041–2070 and 2071–2100, for each RCP4.5 and RCP8.5 scenario, the available climatic data consisted of maximum and minimum air temperatures and precipitation. Only these variables were considered to produce the disturbed climate change series due to the high number of models and scenarios considered in the ensemble, which would make it impracticable to consider all the variables necessary for the calculation of the FAO Penman-Monteith equation. Thus, ETo was determined using the Hargreaves-Samani equation (HS), which is considered a valid alternative to the FAO PM after calibration. The calibration coefficient of the HS equation was obtained for the period 1956–1985, for which ETo was obtained using both equations [79].
Regarding the perennial crops, the apple varieties Royal Gala and Fuji require between 600 to 800 h of cold, while the pear variety Rocha requires 550 h of cold.
The stress coefficient’s values (Ky) were normalized to create the five resilience classes with the same amplitude and with values between zero and one, according to the methodology used in [45]. Normalization was performed as the ratio between the Ky of one given crop and the maximum Ky value for entire set of crops. The p values range from 0.3, for crops with shallow roots, to 0.7, for crops with deep roots. A Swa values of 0.6 was used for drip irrigation since the orchards of the MIS present reduced tree spacings.
According to the Portuguese Soil Map, heavy-textured cambisols predominate in the study area. Thus, a total available water (TAW) of 150 mm m−1 was inputted in the soil water balance model ISAREG. The irrigations were triggered when the soil water storage reached the no stress soil water threshold, with small irrigation depths corresponding to the daily ETc, being applied.
Table 5 summarizes the sources used to collect the data specific to the case study. Some of the data sets collected are presented in the Appendix in Table A1, Table A2, Table A3 and Table A4.
The project rehabilitation alternatives selected for the Maiorga Collective Irrigation System include different water sources and different water transport and distribution systems and hence different efficiencies, are presented in Table 6. The Areia River and the Alcobaça River also supply the neighbor Collective Irrigation Systems of Valado dos Frades and of Cela. Thus, it was necessary to calculate the irrigation water requirements at the source (WRS) for these CIS for the historical period (1956–1985) and for the climatic scenarios RCP4.5 and RCP8.5 for the periods 2041–2070 and 2071–2100, using the same methodology used for Maiorga.
3. Results and Discussion
3.1. Climate Scenarios Data
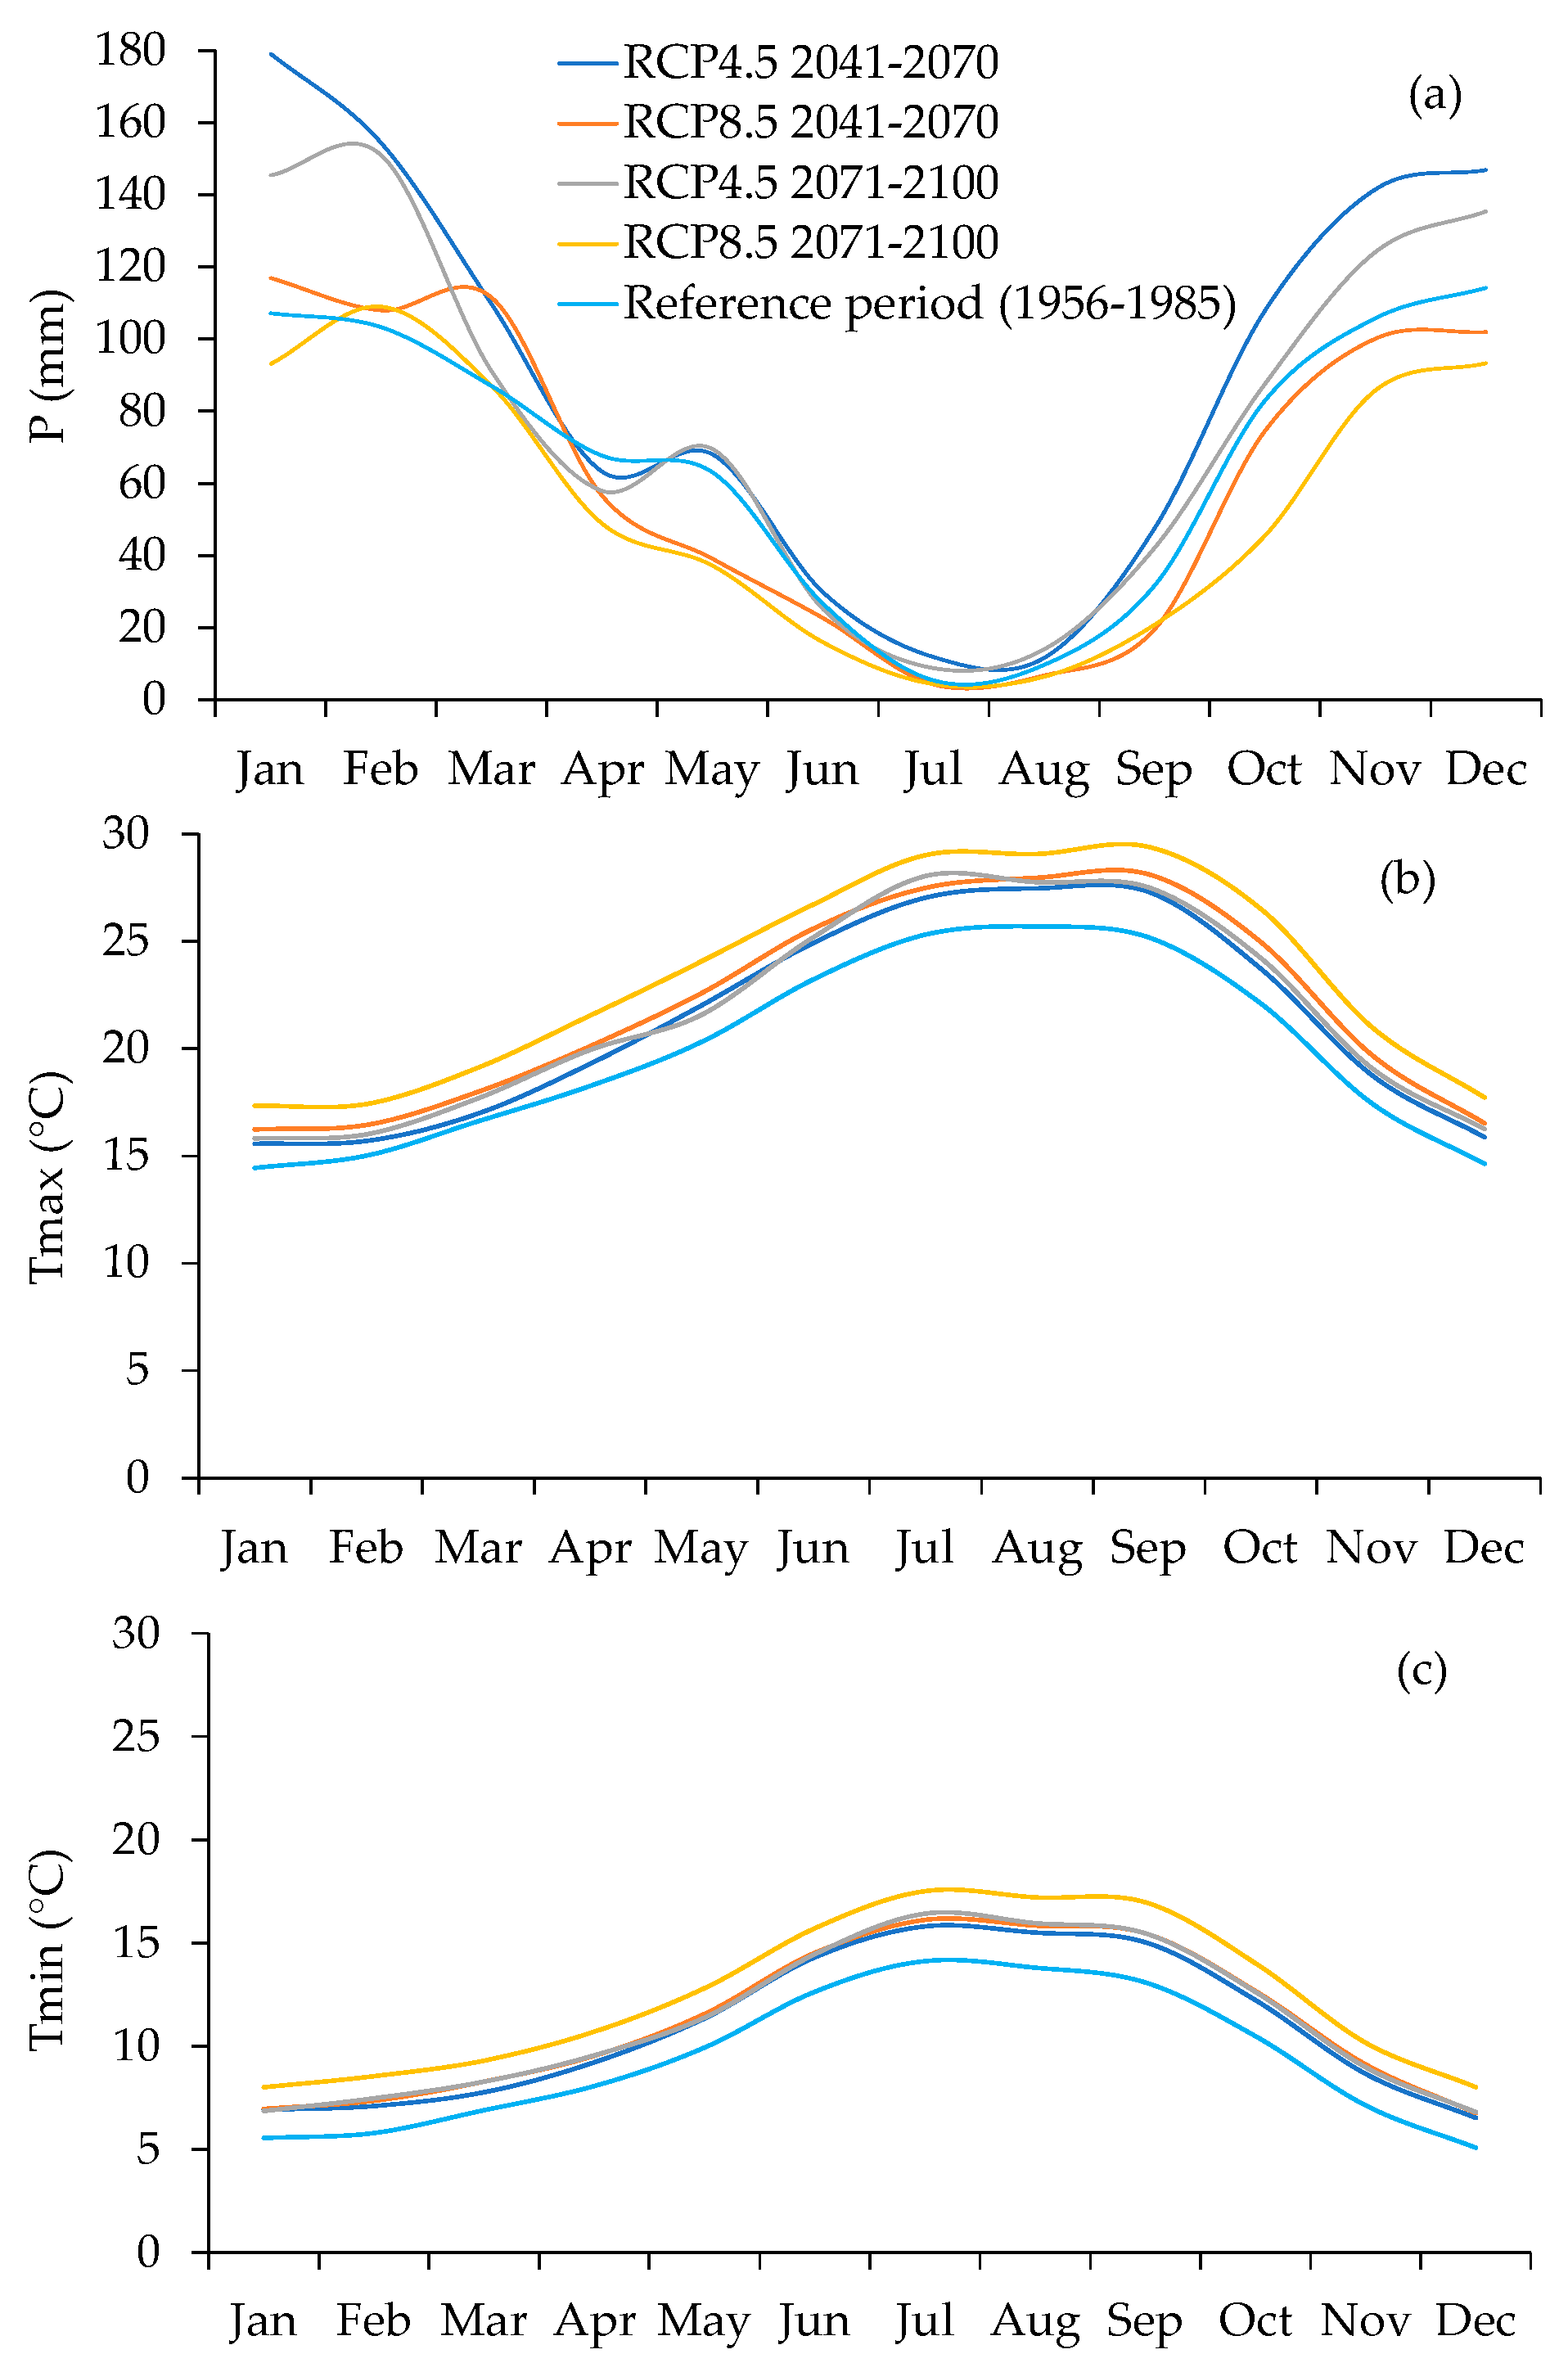
Monthly anomalies average, 90th and 10th percentiles of the ensemble of models considered are presented in Table A1, Table A2 and Table A3 in the Appendix. The calculated anomalies show high variability among the different models and periods, which confirms the uncertainty arising from future climate projections, as found by [86], who developed a study to evaluate uncertainty in the use of climate models to produce future climate scenarios for Europe. The historical data series were disturbed with the anomalies producing the projected climate scenarios. Figure 7a shows the average monthly precipitation for the historical period 1956–1985 and for the periods 2041–2070 and 2071–2100 for the RCP4.5 and 8.5 scenarios. It should be highlighted that an expressive reduction in precipitation during the spring (April and May) for all CC scenarios and periods was detected. Likewise, there is an increase in precipitation during the winter, for the CC scenarios, especially during January and February. Therefore, a tendency towards a greater concentration of precipitation in winter and a greater length of the dry season is projected. Similar trends are presented by [87] in their work describing how numerical models are used to simulate the climate at regional Mediterranean scale.
The monthly averages of maximum air temperature for the observed historical series 1956–1985 and for the scenarios RCP4.5 and RCP8.5, for the periods 2041–2070 and 2071–2100, are represented in Figure 7b. The analysis shows an increase in the average maximum temperature in all months, with this increase being more accentuated for the RCP8.5 scenario and for the more distant period (2071–2100). Thus, this scenario corresponds to an upper boundary of the anthropogenic radiative forcing, as stated in [88].
Figure 7c shows the monthly average values of the minimum air temperature (Tmin) for the observed climate series, 1956–1985, and for the RCP4.5 and RCP8.5 scenarios, for the 2041–2070 and 2071–2100 periods. As for the maximum air temperature, there is an increase in Tmin for all months, scenarios and periods, which is more expressive for the RCP8.5 scenario for 2071–2100, as expected [88].
3.2. Global Irrigation Requirements
Table 7 presents the global irrigation requirements, GIR, for the average years of the periods and scenarios considered, for the cropping pattern defined for the future scenarios (Equations (3) and (4) and Table A4, Table A5 and Table A6 in the Appendix). The future cropping pattern consists of pear and apple orchards (85% of the irrigated area) and annual crops, mainly horticulture such as potato and cabbage (15% of the irrigated area). Increases in GIR for the peak demand period (July) up to 15% can be noticed for future CC scenarios. Increases of 22 and 33% in seasonal irrigation requirements at a watershed level for the RCP 8.5 (2070–2100) using RACMO and RCA models, respectively, were calculated and presented in [28]. The average monthly and annual GIR anomalies (ΔGIR) for the proposed cropping pattern scenario and for each of the climate scenarios are presented in Table 7. The projected anomalies in the GIR, for the future CC scenarios, are considerably greater in the RCP8.5 (increase of 24.4%, in the 2041–2070 and 35.7%, in the 2071–2100) when compared to the RCP4.5, which presents increases between 5.5% (2071–2100) and 6.6% (2041–2070).
3.3. Stream Flows
The monthly average runoff anomalies for CC scenarios RCP4.5 and 8.5 in 2050 and 2080 compared to the reference period (1956–1985) are presented in Table 8. It should be noted that within the ensemble of models considered, there is a wide variation, with some models predicting an increase, while others predict a decrease in runoff. Analyzing the average anomalies for RCP4.5, a reduction in annual runoff of 11% is projected for 2050 and 9% for 2080. For RCP8.5, for 2050 a reduction of 13% of the annual runoff is predicted, but there is greater disparity between the results of the models. For 2080, a 30% reduction in annual runoff is expected, with all models projecting reductions. In their study regarding the rainfall–runoff relationships in Mediterranean streams [89], conclude that the future drier scenario considered in the climate projections could lead to an increase of the return period for the required magnitude of rainfall events to generate runoff flows.
Since the runoff anomalies were considered a proxy to stream flow anomalies, they were used to estimate river flows reductions. Flow anomalies show higher reductions for the RCP8.5 than for RCP4.5. It appears that despite the large variability of anomalies for the different models, there is an overall tendency for stream flow reductions. These reductions will be particularly expressive in the months of April and May, extending through the summer and again becoming more pronounced in October, thus indicating a reduction in water supply during the irrigation season. The results also show increases in stream flows for the months of January, February, and March, except in the RCP8.5 scenario for 2080. There is a noticeable reduction in runoff for RCP8.5 in 2080, in which all months present a negative anomaly. These expected changes in streamflow are in line with those provided by [31] who estimated reductions at the end of the century varying from 36.6% and 50.5%, and by [89] who projected changes in annual streamflow varying from +32% to −60% and reaching up to −65% in spring and −49% in summer.
3.4. Climate Resilience Analysis
3.4.1. Climate Resilience of the Crop Production Systems
Table 9 shows the Average, the 90th, and the 10th percentiles of chilling hours in the Alcobaça municipality between 2010 and 2020 [77], while the chilling units required by the apple and pear varieties produced at the MIS are shown in Table 10. One of the expected impacts of climate change is the decrease in the number of chilling hours, which could jeopardize the production of fruit trees [70,90,91]. This reduction in the accumulation of chilling units in the Iberian Peninsula is shown in the works developed by [90,92], especially for the RCP8.5 scenario and for the more distant period 2071–2100. The production of perennial fruit plants is dependent on the existence of low temperatures at a specific time of the year, which makes these crops one of the most vulnerable to climate change [93]. Currently, the existing cold hours in the MIS are sufficient, in most years, to satisfy the chilling requirements of the fruit trees. The varieties existing in the MIS that are more demanding in chilling hours require between 600 and 800 chilling hours, and in the last ten years, there was only one year in which the number of chilling hours was less than 638 h.
The yield response factor (Ky) of the crops present in the MIS are presented in Table 11. Regarding Ky, all crops produced in the MIS have very low climate resilience, and it is therefore expected that, in a future scenario of climate change, if there is water shortage, these crops will be very vulnerable and the yield losses will be significant.
The soil water depletion factor (p) values for the crops presents in the MIS and the respective resilience classes are presented in Table 11. All crops in the MIS can be considered as having medium resilience. The higher the depletion factor p value, the greater the amount of water stored in the soil that can exploited by the crop. Irrigation management based on the depletion factor (p) allows the maximisation of the soil water used by the plants, reducing the number of irrigation events [94]. The need to improve irrigation management as a measure to increase crops resilience to climate change is also referred by [95] due to the anticipated reduction in water availability.
The ECe threshold and b values for the MIS crops, as well as the sensitivity to salinity according to FAO 56 classification [52], are presented in Table 12.
Relative to the yield/salinity relation, cabbages and potatoes are classified as moderately sensitive and apple and pear orchards are classified as sensitive. Analyzing this parameter together with that of the water quality from the MIS supply sources, it can be speculated that, with the decrease in flow, water salinity may increase, which, in the case of the Alcobaça river could be problematic. The proximity of the MIS to the coast can also increase the risk of salinization due to the rise in sea level in future CC scenarios. In addition, the possible increase in evapotranspiration and the decrease in precipitation may make more difficult to wash salts along the soil profile. All these factors may, in the future, reduce the productivity of these crops in the MIS. The water quality degradation due to climatic change is also reported by [96], affecting the availability of water for irrigation and increasing the irrigation application depths through the need to include a leaching fraction.
Analysing crop production costs (Table 13), it can be concluded that crops can be divided in two groups, those with high investment and with significant installation costs (orchards), and those with low investment and without significant installation costs (annual crops). For orchards a longer return period is considered than in the case of annual crops, which, combined with the fact that orchards have a production cycle in the order of tens of years, makes them more susceptible to climate change as they will stay longer in the field. Furthermore, if an extreme climatic event occurs, which may lead to the destruction not only of production, but also of the crop itself, the costs related to such damage will be much higher compared to those of annual crops, since it is necessary to include the investment made for the orchard installation in addition to the operational costs of the year in question. Thus, despite being more profitable, orchards are more susceptible to prolonged drought periods, which means a lower climate resilience. However, according to [35], the economic analysis of crops production resilience is more complex since it depends also on risk management measures, such as crop insurances that could increase the crop production systems resilience.
The high percentage of perennial crops in the MIS, with 85% of the irrigated area occupied by orchards, makes this parameter to be considered as having a low resilience. In case of water scarcity, as is the case during drought periods, certain orchards may not be irrigated, or may only have access to a small amount of water that ensures the survival of the orchard, but not the crop production in that period.
The resilience analysis performed on the MIS crop production systems allowed the assessment of its vulnerability to climate change, translating its difficulty to adapt to the new climate conditions of the region [69]. However, it should be highlighted that the MIS crop production systems vulnerability depends not only of the amplitude of the changes but also of the pace of climate change to which the system is exposed.
3.4.2. Resilience of On-Farm Irrigation Systems
The resiliencies related to the Application efficiency (AE) and soil wet fraction (Swa) of the on-farm irrigation systems existing in the Maiorca Collective Irrigation System are presented in Table 14. It can be verified that in the case of MIS the irrigation systems efficiencies (AE) are high, corresponding to a high resilience class. This is an important characteristic since the adaptation to the future CC scenarios is dependent on the efficient use of water, and farmers are being required to adopt more efficient systems. The increase in application efficiency as a strategy to improve on-farm resilience was confirmed by [97], in their study carried out in Northwest China. They performed simulations with the AquaCrop model to evaluate water savings and production increases in the maize, wheat and canola crops, demonstrating that drip irrigation with plastic film mulch is the most resilient adaptation strategy.
The soil wet fraction (Swf) produced by the drip irrigation systems, reduces the total volume of water required for one given crop field. This reduction can be is considerable for large areas. In the context of climate change, where water availability is expected to decrease, this reduction could make the difference between the system being able to meet or not meet the irrigation requirements of a given collective irrigation system. The on-farm irrigation systems existing in the MIS present Swa with medium (drip) and low (sprinkler) resilience. The high Swa value for drip irrigation systems is not a consequence of the irrigation system itself, but rather the spacing of the orchards in this region (intensive, with reduced spacing in the line and between lines), which attenuates the effect of reducing the wet area produced by the drip irrigation. Still, it should be referred that [98], by using a participatory approach with farmers from Morocco, found that the interviewed farmers consider drip irrigation as the best measure to increase crop production systems resilience to climate change.
3.4.3. Resilience of Project Rehabilitation Alternatives
Resilience of the Supply-Demand Balance
The guarantee for irrigation water delivery for each of the alternatives, for the historical period (1956–1985) and for each of the climatic scenarios and respective periods, is presented in Table 15. For the supply guarantee to be 100% it is required that the supply meets the crop irrigation requirements in at least 80% of the years. The number of years when the supply was not enough to fill the demand is also presented for each rehabilitation alternative. As reported in [99] the reliability for meeting agricultural water demand in a semi-arid region in USA also decreases in the second half of the 21st century for all the future climatic scenarios considered in their study.
The resilience associated with the number and type of water sources for the different rehabilitation alternatives of the MIS is presented in Table 16. The fact that the water sources of the MIS are superficial and have no regularization makes the supply of the irrigated area very dependent on the existing river flow at each instant. As the projections indicate a decrease in the flow, the possible alternatives proposed for the MIS were evaluated as having very low resilience (Alternatives A, C, and D) and low resilience (Alternative B). The study presented by [99] also concludes that for the semi-arid Colorado region, river water alone will not meet the irrigation demand in future, and in the absence of agricultural water management improvements to prolong fresh groundwater availability, marginal water may be needed to guarantee the supply.
The quality of the water used for irrigation from the Areia River has no restriction on use, but the Alcobaça River has some salinity that, at the present, does not prevent its use for irrigation (Table 17). However, in the future, with the decrease in flows, it may become problematic. It is there associated with an average resilience.
The conveyance (EC) and distribution (ED) efficiencies of water to each of the irrigated areas supplied by the Alcobaça and Areia rivers, and respective resilience classes, are shown in Table 18. The lack of regularization in all the proposed alternatives can be considerably mitigated by improving conveyance and distribution efficiency. In the case of Alternative B, the existence of a pressurized transport and distribution system for Maiorga and a pressurized distribution system for Cela classifies as resilient the supply of these collective irrigation systems for RCP4.5 2041–2070 and 2071–2100, and RCP8.5 2041–2070 (although in these last two scenarios, the supply guarantee is slightly lower). In the case of Alternative C, the pressurized conveyance and distribution system for Maiorga and the pressurized distribution system for Cela makes the supply to these two uses to be considered resilient in all scenarios. In this alternative, supply failures occur in the Collective Irrigation System of Valado dos Frades, in which the transport and distribution system is less efficient.
Table 19 presents the supply guarantees, corresponding to the years for which the supply satisfies at least 90% of the irrigation demand (Section 2.1.4). Table 18 also presents the respective resilience classes of each alternative for both the MIS and the other collective irrigation systems supplied by each of the alternatives, for the reference period and for the RCP4.5 and RCP8.5 climate scenarios (2041–2070 and 2071–2100). The number of severe supply failures (corresponding to the years for which the supply satisfies less than 60% of the irrigation demand) for each alternative in the reference period (1956–1985) and in the RCP4.5 and RCP8.5, for periods 2041–2070 and 2071–2100 is presented in Table 20. The number of failures is also presented for both the MIS and the other Collective Irrigation Systems supplied by each alternative.
In terms of severe supply failures, alternative B is resilient for all three collective irrigation systems for the scenario RCP4.5 2041–2070. However, for scenario RCP4.5 2071–2100 and RCP8.5 2041–2070, alternative B presents two severe supply failures and for scenario RCP8.5 2070–2100 ten failures occur. Alternative D is resilient in the collective irrigation systems of Maiorga and Cela for all climatic scenarios, with the exception of RCP8.5 2071–2100, where only one severe failure occurs. In this alternative, the remaining severe failures occur in the collective irrigation system of Valado dos Frades. Alternatives A and C are not resilient in any of the climate scenarios and have a much higher number of severe failures than alternatives B and D.
3.4.4. Discussion of the Rehabilitation Alternatives Viability
Analysing the results above, it can be seen that there are two rehabilitation alternatives, A and C, which present several monthly and annual failures, for all climate scenarios. In alternative A, the Alcobaça river is able to satisfy the irrigation needs of Maiorga and the Cela block in scenarios RCP4.5 and RCP8.5, in both periods. However, the Areia River presents considerable insufficiency in the supply of water for irrigation. In both climate scenarios, the number of years in which at least 90% of annual irrigation needs are met does not exceed 45% (RCP4.5 2041–2070). Thus, due to the number of failures in the supply of the Areia River and their severity (often with supplied volume values below 60% of the requested volume), this alternative is not considered viable. Alternative C is also considered not viable, as in addition to the several monthly failures in both scenarios, the number of years in which the annual river flow is not sufficient to supply 90% of the demand (annual water requirements at the source) is very high, ranging between 15 years for RCP4.5 2041–2070 and 24 years for RCP8.5 2071–2100. With this alternative only in 52% of the years (RCP4.5 2041–2070) the flow will be sufficient to supply at least 90% of the annual irrigation requirements, and this percentage decreases in the period 2071–2100 of the same RCP and in the two periods of RCP8.5. Alternatives B and D produced more satisfactory results, with Alternative B providing guarantees of 90% of the annual demand (between 94% for RCP4.5 2041–2070 and 68% for RCP8.5 2071–2100) and Alternative D with guarantees between 100% (RCP4.5 2041–2070) and 90% (RCP8.5 2071–2100). Although Alternative D produced the best results for Maiorga and Cela, it is observed that the Valado dos Frades IS (in this option only supplied by the Areia River) will have a very poor water supply in both CC scenarios and respective periods. Therefore, the rehabilitation alternative that allows the guarantee of the supply of water to all three Collective Irrigation Systems with greater security is Alternative B, in which only in the most pessimistic scenario (RCP8.5 2071–2100) is the guarantee of water supply (90% of annual water requirements at the source) less than 80%. The analysis, taking into account an improvement in the water conveyance and distribution efficiency in the Valado dos Frades, leads to the conclusion that there are sufficient water resources to meet irrigation needs in most years in both climate scenarios. However, these are currently not being managed efficiently.
4. Conclusions
Due to climate change, the resilience assessment of the Collective Irrigations Systems (CIS) becomes unavoidable. Therefore, a framework was developed for assessing the resilience of the CIS to climate change, to ensure that they will have the capacity to meet demand, not only in the present, but also in the medium and long term. The proposed framework focuses on the resilience of the three main components: i) the crop production systems; ii) on-farm irrigation systems; and iii) project rehabilitation alternatives. It is based upon a simple methodology, allowing its application by CIS managers and design technicians. It is also a general and scalable approach, enabling its application to different type of systems, with different complexities according to site-specific data availability.
This framework was applied to the Maiorga Collective Irrigation System in central Portugal, to test the methodology’s performance in assessing the impacts of climate change on the supply–demand balance of the proposed rehabilitation alternatives and to evaluate their climate resilience.
The analysis of the climatic anomalies of the selected ensemble of climate models and scenarios was carried out for precipitation and minimum and maximum air temperature, showing a high level of uncertainty in the future CC scenarios, particularly in the case of precipitation. Regarding CC impacts in the global irrigation requirements when compared to the reference period, projected increases for both scenarios and periods can vary between 6.6% (RCP4.5 2041–2070) and 35.7% (RCP8.5 2071–2100). Regarding the stream flows, projected reductions vary between 11% (RCP4.5 2050) and 30% (RCP8.5 2080), with high variability in monthly model results. As expected, the greatest increases in the crop irrigation requirements (demand) and the greatest decrease in rivers flows (supply) were observed for the RCP8.5 scenario, and for the most distant period (2071–2100).
The resilience analysis performed to the MIS crop production showed its difficulty in adapting to the future climate conditions. This is mainly due to the very low resilience associated with the water stress–yield relation of the crops and their moderate to high sensitivity to irrigation water salinity. Furthermore, the high percentage of irrigated area occupied by orchards is classified as low resilience. Regarding the on-farm irrigation systems, climate resilience is high, particularly for the drip irrigation systems, due to its high application efficiencies and to the soil wet area produced.
In spite of the difficulty in applying resilience assessment methodologies due to the lack of quantifiable indicators which makes this concept rather subjective, the present study allowed the grouping of the CIS rehabilitation alternatives, selecting the ones with most viability. Alternative A and C presented a high number of supply failures for all climate scenarios. For the worse climate scenario and period (RCP8.5/2071–2100), the supply could not meet the demand in 60% and 53% of the years for Alternatives A and C, respectively. The other two alternatives– B and D–by utilising conjunctive use of surface water and groundwater show the capacity to guarantee the supply for the MIS only if an increase in conveyance and distribution efficiencies is achieved. For these alternatives the irrigation water demand could not be satisfied only in 10% and 1% of the years (Alternatives B and D, respectively).
Some limitations of the proposed framework were identified. On the one hand, the high variability among the Collective Irrigation Systems requires the site-specific adaptation of the methodology, including the selection of the most relevant parameters for resilience assessment. Therefore, the implementation of this framework must be carried out by experienced technician and engineers. On the other hand, the construction of the future climate projections ensemble is a quite time-consuming task and may discourage the application of the methodology.
As a final remark, the application of the developed framework to the particular Collective Irrigation Scheme of Maiorga demonstrates its usefulness for selecting the rehabilitation alternatives with the highest resilience to future climate changes. This is of great interest since Collective Irrigation Schemes rehabilitation require high investments and present long-life spans.
Author Contributions
Conceptualization, M.J.C. and M.R.C.; methodology, M.J.C., R.E. and M.R.C.; software, R.E. and M.J.C.; investigation, R.E., M.J.C., M.R.C., J.R. and J.L.T.; resources, M.J.C.; data curation, R.E. and M.J.C.; writing—original draft preparation, R.E. and M.J.C.; writing—review and editing, M.R.C., J.R. and J.L.T.; supervision, M.J.C. and M.R.C.; project administration, M.R.C.; funding acquisition, M.R.C. All authors have read and agreed to the published version of the manuscript.
Funding
This research was funded by HubIS Project (PRIMA/0006/2019), and the Portuguese Foundation for Science and Technology (FCT) through the research units Linking Landscape, Environment, Agriculture and Food Research Center, Associated Laboratory TERRA (LEAF–UIDB/04129/2020 and UIDP/04129/2020); João Rolim was funded by the Fundação para a Ciência e Tecnologia (FCT) through researcher contract DL 57/2016/CP1382/CT0021.
Acknowledgments
The authors would like to thank the COBA, SA for the support and for providing data for the development of this work.
Conflicts of Interest
The authors declare no conflict of interest.
Appendix A

Table A1.
Monthly average precipitation anomalies of the ensemble of climate models, 90th, and 10th percentiles, for the period RCP4.5 and RCP8.5 scenarios, relative to the simulated historical period (1971–2000).
Table A1.
Monthly average precipitation anomalies of the ensemble of climate models, 90th, and 10th percentiles, for the period RCP4.5 and RCP8.5 scenarios, relative to the simulated historical period (1971–2000).
| Climate Anomalies of Precipitation (%) | ||||||||||||
|---|---|---|---|---|---|---|---|---|---|---|---|---|
| Climate Scenario | Jan | Feb | Mar | Apr | May | Jun | Jul | Aug | Sep | Oct | Nov | Dec |
| RCP4.5 2041–2070 | ||||||||||||
| 10th Percentile | 13.6 | 31.2 | −2.0 | −24.7 | −19.6 | −1.4 | −3.2 | −3.1 | −19.9 | 25.4 | −29.0 | −14.0 |
| Ensemble Average | 60.0 | 46.7 | 20.9 | −4.4 | −12.1 | 1.4 | −1.2 | −0.6 | −6.4 | 12.7 | 18.5 | 20.1 |
| 90th Percentile | 108.9 | 58.1 | 46.3 | 13.9 | −0.6 | 5.5 | 2.1 | 2.1 | 5.5 | 51.1 | 69.8 | 55.6 |
| RCP4.5 2071–2098 | ||||||||||||
| 10th Percentile | 15.6 | 44.6 | −18.6 | 24.1 | −21.8 | −5.5 | −5.0 | −0.5 | −17.2 | 24.4 | −12.9 | −13.2 |
| Ensemble Average | 37.2 | 47.4 | 2.1 | −13.6 | 0.6 | −1.7 | −1.0 | 2.0 | 1.4 | −1.5 | 14.9 | 25.9 |
| 90th Percentile | 68.2 | 50.6 | 22.5 | −5.1 | 21.7 | 1.6 | 4.7 | 5.3 | 18.4 | 28.1 | 48.4 | 70.0 |
| RCP8.5 2041–2070 | ||||||||||||
| 10th Percentile | −22.9 | −15.8 | −10.0 | −27.3 | −30.7 | −15.2 | −5.8 | −5.6 | −28.5 | −72.0 | −33.1 | −83.5 |
| Ensemble Average | 2.5 | 17.0 | 7.0 | −20.7 | −21.9 | −9.3 | −2.0 | −3.6 | −15.6 | 26.3 | −3.5 | −19.1 |
| 90th Percentile | 32.5 | 70.9 | 22.7 | −1.1 | −9.1 | −3.2 | 0.7 | −1.6 | −4.7 | 6.8 | 34.0 | 25.9 |
| RCP8.5 2071–2098 | ||||||||||||
| 10th Percentile | −78.6 | −18.0 | −22.6 | −38.7 | −33.9 | −19.6 | −4.7 | −10.4 | −28.6 | −76.8 | −45.6 | −75.6 |
| Ensemble Average | −26.9 | 10.8 | 7.1 | −27.9 | −27.4 | −13.6 | −2.1 | −4.5 | −14.1 | −49.6 | −29.8 | −33.4 |
| 90th Percentile | 10.1 | 55.4 | 47.3 | −12.0 | 12.7 | −4.7 | 0.4 | 1.9 | −0.9 | −13.0 | −14.2 | 15.9 |
Table A2.
Monthly average maximum air temperature anomalies of the ensemble of climate models, 90th, and 10th percentiles, for the period RCP4.5 and RCP8.5 scenarios, relative to the simulated historical period (1971–2000).
Table A2.
Monthly average maximum air temperature anomalies of the ensemble of climate models, 90th, and 10th percentiles, for the period RCP4.5 and RCP8.5 scenarios, relative to the simulated historical period (1971–2000).
| Climate Anomalies of Maximum Air Temperature (°C) | ||||||||||||
|---|---|---|---|---|---|---|---|---|---|---|---|---|
| Climate Scenario | Jan | Feb | Mar | Apr | May | Jun | Jul | Aug | Sep | Oct | Nov | Dec |
| RCP4.5 2041–2070 | ||||||||||||
| 10th Percentile | 0.9 | 0.5 | 0.2 | 0.5 | 1.3 | 1.3 | 1.3 | 1.3 | 1.8 | 1.2 | 1.1 | 0.8 |
| Ensemble Average | 1.1 | 0.7 | 0.4 | 1.0 | 1.7 | 1.7 | 1.7 | 1.8 | 2.1 | 1.6 | 1.3 | 1.2 |
| 90th Percentile | 1.4 | 0.9 | 0.5 | 1.7 | 2.2 | 2.2 | 2.3 | 2.2 | 2.4 | 2.0 | 1.5 | 1.7 |
| RCP4.5 2071–2098 | ||||||||||||
| 10th Percentile | 1.3 | 0.6 | 0.6 | 1.5 | 0.2 | 1.7 | 1.9 | 1.6 | 1.8 | 1.9 | 1.3 | 1.2 |
| Ensemble Average | 1.4 | 1.0 | 1.1 | 1.7 | 1.3 | 2.0 | 2.7 | 2.1 | 2.3 | 2.1 | 1.6 | 1.6 |
| 90th Percentile | 1.5 | 1.4 | 1.5 | 1.8 | 2.4 | 2.2 | 3.7 | 2.6 | 2.8 | 2.4 | 2.0 | 2.0 |
| RCP8.5 2041–2070 | ||||||||||||
| 10th Percentile | 1.4 | 0.9 | 1.0 | 1.4 | 1.9 | 1.7 | 1.8 | 1.6 | 2.5 | 2.1 | 1.7 | 1.4 |
| Ensemble Average | 1.8 | 1.4 | 1.4 | 1.9 | 2.3 | 2.4 | 2.2 | 2.3 | 2.9 | 2.9 | 2.3 | 1.9 |
| 90th Percentile | 2.2 | 2.0 | 1.7 | 2.2 | 3.1 | 2.9 | 2.6 | 3.2 | 3.9 | 4.2 | 3.2 | 2.4 |
| RCP8.5 2071–2098 | ||||||||||||
| 10th Percentile | 2.2 | 1.7 | 2.0 | 2.1 | 2.7 | 2.7 | 3.1 | 2.7 | 3.2 | 3.6 | 2.9 | 2.5 |
| Ensemble Average | 2.9 | 2.4 | 2.5 | 3.3 | 3.8 | 3.5 | 3.7 | 3.4 | 4.2 | 4.4 | 3.6 | 3.1 |
| 90th Percentile | 3.8 | 3.3 | 3.3 | 5.1 | 4.8 | 4.3 | 4.5 | 4.4 | 5.2 | 6.3 | 5.0 | 3.8 |
Table A3.
Monthly average minimum air temperature anomalies of the ensemble of climate models, 90th, and 10th percentiles, for the period RCP4.5 and RCP8.5 scenarios, relative to the simulated historical period (1971–2000).
Table A3.
Monthly average minimum air temperature anomalies of the ensemble of climate models, 90th, and 10th percentiles, for the period RCP4.5 and RCP8.5 scenarios, relative to the simulated historical period (1971–2000).
| Climate Anomalies of Minimum Air Temperature (°C) | ||||||||||||
|---|---|---|---|---|---|---|---|---|---|---|---|---|
| Climate Scenario | Jan | Feb | Mar | Apr | May | Jun | Jul | Aug | Sep | Oct | Nov | Dec |
| RCP4.5 2041–2070 | ||||||||||||
| 10th Percentile | 1.2 | 1.1 | 0.6 | 0.9 | 1.2 | 1.5 | 1.2 | 1.2 | 1.5 | 1.3 | 1.3 | 0.9 |
| Ensemble Average | 1.7 | 1.3 | 0.9 | 1.2 | 1.4 | 1.7 | 1.7 | 1.7 | 2 | 1.8 | 1.5 | 1.4 |
| 90th Percentile | 2.2 | 1.6 | 1.2 | 1.4 | 1.6 | 1.8 | 2.4 | 2.4 | 2.6 | 2.3 | 1.9 | 2 |
| RCP4.5 2071–2098 | ||||||||||||
| 10th Percentile | 1.2 | 1.3 | 1.1 | 1.3 | 1.3 | 1.5 | 1.7 | 1.7 | 1.9 | 1.7 | 1.2 | 1.3 |
| Ensemble Average | 1.7 | 1.7 | 1.4 | 1.5 | 1.5 | 1.8 | 2.3 | 2.2 | 2.4 | 2.2 | 1.9 | 1.7 |
| 90th Percentile | 2.2 | 2 | 1.7 | 1.7 | 1.7 | 2.2 | 3.3 | 2.9 | 3.2 | 2.8 | 2.5 | 2.3 |
| RCP8.5 2041–2070 | ||||||||||||
| 10th Percentile | 1.4 | 1.2 | 1.1 | 1.3 | 1.4 | 1.6 | 1.5 | 1.6 | 2.1 | 1.7 | 1.5 | 1.1 |
| Ensemble Average | 1.8 | 1.6 | 1.4 | 1.5 | 1.6 | 1.9 | 2 | 2 | 2.4 | 2.2 | 2 | 1.7 |
| 90th Percentile | 2.2 | 2 | 1.6 | 1.7 | 2 | 2.3 | 2.3 | 2.6 | 2.8 | 3 | 2.4 | 2 |
| RCP8.5 2071–2098 | ||||||||||||
| 10th Percentile | 2.4 | 2.3 | 1.9 | 2 | 2.5 | 2.5 | 2.7 | 2.8 | 3.2 | 3 | 2.3 | 2.7 |
| Ensemble Average | 2.8 | 2.8 | 2.4 | 2.6 | 2.9 | 3.1 | 3.4 | 3.4 | 3.9 | 3.6 | 3.1 | 3 |
| 90th Percentile | 3.1 | 3.5 | 2.9 | 3.2 | 3.3 | 3.5 | 4 | 4.1 | 4.7 | 4.6 | 4 | 3.3 |
Table A4.
Average crop coefficients (Kc) for the Maiorga Irrigation Project crops [45].
Table A4.
Average crop coefficients (Kc) for the Maiorga Irrigation Project crops [45].
| Crop | Initial Stage | Mid Stage | Final Stage |
|---|---|---|---|
| Annual crops | |||
| Winter potato | 0.4–0.6 | 1.05 | 0.4 |
| Spring potato | 0.4–0.6 | 1.05 | 0.4 |
| Autumn potato | 0.4–0.6 | 1.05 | 0.4 |
| Winter cabbage | 0.4–0.7 | 1.1 | 0.9 |
| Spring cabbage | 0.4–0.7 | 1.1 | 0.9 |
| Autumn cabbage | 0.4–0.7 | 1.1 | 0.9 |
| Permanent crops | |||
| orchards | 0.4 | 0.9 | 0.4 |
Table A5.
Crop development stages, root depths (Zr), and depletion fraction (p) for each crop, obtained through inquiries to farmers.
Table A5.
Crop development stages, root depths (Zr), and depletion fraction (p) for each crop, obtained through inquiries to farmers.
| Potato | Cabbage | |||||||
|---|---|---|---|---|---|---|---|---|
| Crop Development Stage | Orchards | Winter | Spring | Autumn | Winter | Spring | Autumn | |
| Zr (m) | 0.8 | 0.5 | 0.5 | 0.5 | 0.5 | 0.6 | 0.6 | |
| p (%) | 40 | 40 | 40 | 40 | 40 | 40 | 40 | |
| Initial | Planting date | 01/jan | 15/feb | 01/jun | 15/sept | 15/may | 01/jun | 15/sept |
| Beginning of crop development | DAP | 90 | 15 | 15 | 15 | 15 | 15 | 15 |
| Beginning of flowering | DAP | 120 | 35 | 35 | 35 | 35 | 35 | 35 |
| Beginning of fruit formation | DAP | 150 | 60 | 60 | 60 | 60 | 60 | 60 |
| Beginning of late season | DAP | 185 | 80 | 80 | 80 | |||
| Harvest or end of irrigation | DAP | 240 | 90 | 90 | 90 | |||
| End of late season | DAP | 285 | ||||||
DAP—Days after planting.
Table A6.
Crop and irrigation system data for the determination of the global irrigation requirements.
Table A6.
Crop and irrigation system data for the determination of the global irrigation requirements.
| Area (%) | Irrigation System | Irrigation Efficiency | Fraction of Wetted Area | |
|---|---|---|---|---|
| Orchards | 85 | Drip | 0.9 | 0.6 |
| Other crops * | 15 | Solid set sprinkler | 0.85 | 1 |
* Winter, Spring and Autumn potato; Winter, Spring and Autumn cabbage.
Table A7.
Transport and distribution efficiencies considered for the Maiorga Collective Irrigation System [76].
Table A7.
Transport and distribution efficiencies considered for the Maiorga Collective Irrigation System [76].
| Conveyance Efficiency (%) | Distribution Efficiency (%) | |
|---|---|---|
| Open channel | 65 | 65 |
| Pressurized | 95 | 90 |
References
- Costa, J.M.; Vaz, M.; Escalona, J.; Egipto, R.; Lopes, C.; Medrano, H.; Chaves, M.M. Modern viticulture in southern Europe: Vulnerabilities and strategies for adaptation to water scarcity. Agr. Water Manag. 2016, 164, 5–18. [Google Scholar] [CrossRef]
- Vinci, G.; Maddaloni, L.; Mancini, L.; Prencipe, S.A.; Ruggeri, M.; Tiradritti, M. The Health of the Water Planet: Challenges and Opportunities in the Mediterranean Area: An Overview. Earth 2021, 2, 894–919. [Google Scholar] [CrossRef]
- Mastrocicco, M.; Colombani, N. The issue of groundwater salinization in coastal areas of the Mediterranean region: A review. Water 2021, 13, 90. [Google Scholar] [CrossRef]
- Tsesmelis, D.E.; Karavitis, C.A.; Kalogeropoulos, K.; Zervas, E.; Vasilakou, C.G.; Skondras, N.A.; Kosmas, C. Evaluating the Degradation of Natural Resources in the Mediterranean Environment Using the Water and Land Resources Degradation Index, the Case of Crete Island. Atmosphere 2022, 13, 135. [Google Scholar] [CrossRef]
- Alexandridis, T.K.; Cherif, I.; Chemin, Y.; Silleos, G.N.; Stavrinos, E.; Zalidis, G.C. Integrated methodology for estimating water use in mediterranean agricultural areas. Remote Sens. 2009, 1, 445–465. [Google Scholar] [CrossRef] [Green Version]
- Pisinaras, V.; Paraskevas, C.; Panagopoulos, A. Investigating the effects of agricultural water management in a Mediterranean coastal aquifer under current and projected climate conditions. Water 2021, 13, 108. [Google Scholar] [CrossRef]
- Fader, M.; Shi, S.; von Bloh, W.; Bondeau, A.; Cramer, W. Mediterranean irrigation under climate change: More efficient irrigation needed to compensate for increases in irrigation water requirements. Hydrol. Earth Syst. Sci. 2016, 20, 953–973. [Google Scholar] [CrossRef] [Green Version]
- Zittis, G.; Bruggeman, A.; Lelieveld, J. Revisiting future extreme precipitation trends in the Mediterranean. Weather Clim. Extrem. 2021, 34, 100380. [Google Scholar] [CrossRef]
- García-Garizábal, I.; Causapé, J.; Abrahao, R.; Merchan, D. Impact of climate change on Mediterranean irrigation demand: Historical dynamics of climate and future projections. Water Resour. Manag. 2014, 28, 1449–1462. [Google Scholar] [CrossRef]
- Elahi, E.; Khalid, Z.; Zhang, Z. Understanding farmers’ intention and willingness to install renewable energy technology: A solution to reduce the environmental emissions of agriculture. Appl. Energy 2022, 309, 118459. [Google Scholar] [CrossRef]
- Cannon, A.J.; Sobie, S.R.; Murdock, T.Q. Bias Correction of GCM Precipitation by Quantile Mapping: How Well Do Methods Preserve Changes in Quantiles and Extremes? J. Clim. 2015, 28, 6938–6959. [Google Scholar] [CrossRef]
- Vetter, T.; Reinhardt, J.; Flörke, M.; van Griensven, A.; Hattermann, F.; Huang, S.; Koch, H.; Pechlivanidis, I.G.; Plötner, S.; Seidou, O.; et al. Evaluation of sources of uncertainty in projected hydrological changes under climate change in 12 large-scale river basins. Clim. Chang. 2017, 141, 419–433. [Google Scholar] [CrossRef]
- Wilby, R.L.; Troni, J.; Biot, Y.; Tedd, L.; Hewitson, B.C.; Smith, D.M.; Sutton, R.T. A review of climate risk information for adaptation and development planning. Int. J. Clim. 2009, 29, 1193–1215. [Google Scholar] [CrossRef]
- Flato, G.; Marotzke, J.; Abiodun, B.; Braconnot, P.; Chou, S.C.; Collins, W.; Cox, P.; Driouech, F.; Emori, S.; Eyring, V.; et al. Evaluation of Climate Models. In Climate Change 2013: The Physical Science Basis. Contribution of Working Group I to the Fifth Assessment Report of the Intergovernmental Panel on Climate Change; Stocker, T.F., Qin, D., Plattner, G.-K., Tignor, M., Allen, S.K., Boschung, J., Nauels, A., Xia, Y., Bex, V., Midgley, P.M., Eds.; Cambridge University Press: Cambridge, UK; New York, NY, USA, 2013; pp. 741–866. [Google Scholar]
- Räty, O.; Räisänen, J.; Ylhäisi, J.S. Evaluation of delta change and bias correction methods for future daily precipitation: Intermodel cross-validation using ENSEMBLES simulations. Clim. Dyn. 2014, 42, 2287–2303. [Google Scholar] [CrossRef]
- Trzaska, S.; Schnarr, E. A Review of Downscaling Methods for Climate Change Projections; United States Agency for International Development: Washington, DC, USA; Tetra Tech ARD: Burlington, VT, USA, 2014; p. 42.
- Zhu, Y.; Luo, Y. Precipitation Calibration Based on the Frequency-Matching Method. Weather Forecast. 2015, 30, 1109–1124. [Google Scholar] [CrossRef]
- Le Page, M.; Fakir, Y.; Jarlan, L.; Boone, A.; Berjamy, B.; Khabba, S.; Zribi, M. Projection of irrigation water demand based on the simulation of synthetic crop coefficients and climate change. Hydrol. Earth Syst. Sci. 2021, 25, 637–651. [Google Scholar] [CrossRef]
- Iglesias, A.; Garrote, L.; Quiroga, S.; Moneo, M. A regional comparison of the effects of climate change on agricultural crops in Europe. Clim. Change 2012, 112, 29–46. [Google Scholar] [CrossRef] [Green Version]
- Turral, H.; Burke, J.; Faurès, J.M. Climate Change, Water and Food Security; FAO Water Reports 36; FAO: Rome, Italy, 2011; p. 174. [Google Scholar]
- del Pozo, A.; Brunel-Saldias, N.; Engler, A.; Ortega-Farias, S.; Acevedo-Opazo, C.; Lobos, G.A.; Molina-Montenegro, M.A. Climate change impacts and adaptation strategies of agriculture in Mediterranean-climate regions (MCRs). Sustainability 2019, 11, 2769. [Google Scholar] [CrossRef] [Green Version]
- Abd-Elmabod, S.K.; Muñoz-Rojas, M.; Jordán, A.; Anaya-Romero, M.; Phillips, J.D.; Jones, L.; de la Rosa, D. Climate change impacts on agricultural suitability and yield. Geoderma 2020, 374, 114453. [Google Scholar] [CrossRef]
- Cammarano, D.; Ceccarelli, S.; Grando, S.; Romagosa, I.; Benbelkacem, A.; Akar, T.; Ronga, D. The impact of climate change on barley yield in the Mediterranean basin. Eur. J. Agron. 2019, 106, 1–11. [Google Scholar] [CrossRef]
- Noto, L.V.; Cipolla, G.; Francipane, A.; Pumo, D. Climate change in the Mediterranean basin (part I): Induced alterations on climate forcings and hydrological processes. Water Resour. Manag. 2022, 1–19. [Google Scholar] [CrossRef]
- Wang, Z.; Huang, Y.; Liu, T.; Zan, C.; Ling, Y.; Guo, C. Analysis of the Water Demand-Supply Gap and Scarcity Index in Lower Amu Darya River Basin, Central Asia. Int. J. Env. Res. Pub. He. 2022, 19, 743. [Google Scholar] [CrossRef]
- Senatore, A.; Mendicino, G.; Smiatek, G.; Kunstmann, H. Regional climate change projections and hydrological impact analysis for a Mediterranean basin in Southern Italy. J. Hydrol. 2011, 399, 70–92. [Google Scholar] [CrossRef]
- Nunes, J.P.; Seixas, J.; Keizer, J.J. Modeling the response of within-storm runoff and erosion dynamics to climate change in two Mediterranean watersheds: A multi-model, multi-scale approach to scenario design and analysis. Catena 2013, 102, 27–39. [Google Scholar] [CrossRef]
- Rocha, J.; Carvalho-Santos, C.; Diogo, P.; Beça, P.; Keizer, J.J.; Nunes, J.P. Impacts of climate change on reservoir water availability, quality and irrigation needs in a water scarce Mediterranean region (southern Portugal). Sci. Total Environ. 2020, 736, 139477. [Google Scholar] [CrossRef] [PubMed]
- Rolim, J.; Teixeira, J.L.; Catalão, J.; Shahidian, S. The Impacts of climate change on irrigated agriculture in Southern Portugal. Irrig. Drain. 2017, 66, 3–18. [Google Scholar] [CrossRef]
- Kang, Y.; Khan, S.; Ma, X. Climate change impacts on crop yield, crop water productivity and food security—A review. Prog. Nat. Sci. 2009, 19, 1665–1674. [Google Scholar] [CrossRef]
- Serrano-Notivoli, R.; Martínez-Salvador, A.; García-Lorenzo, R.; Espín-Sánchez, D.; Conesa-García, C. Rainfall–runoff relationships at event scale in western Mediterranean ephemeral streams. Hydrol. Earth Syst. Sci. 2022, 26, 1243–1260. [Google Scholar] [CrossRef]
- Sondermann, M.N.; de Oliveira, R.P. Climate Adaptation Needs to Reduce Water Scarcity Vulnerability in the Tagus River Basin. Water 2022, 14, 2527. [Google Scholar] [CrossRef]
- Saadi, S.; Todorovic, M.; Tanasijevic, L.; Pereira, L.S.; Pizzigalli, C.; Lionello, P. Climate change and Mediterranean agriculture: Impacts on winter wheat and tomato crop evapotranspiration, irrigation requirements and yield. Agric. Water Manag. 2015, 147, 103–115. [Google Scholar] [CrossRef]
- Dai, C.; Qin, X.S.; Lu, W.T.; Huang, Y. Assessing adaptation measures on agricultural water productivity under climate change: A case study of Huai River Basin, China. Sci. Total Environ. 2020, 721, 137777. [Google Scholar] [CrossRef] [PubMed]
- Ward, F.A. Enhancing climate resilience of irrigated agriculture: A review. J. Environ. Manag. 2022, 302, 114032. [Google Scholar] [CrossRef] [PubMed]
- Ahmed, S.M. Impacts of drought, food security policy and climate change on performance of irrigation schemes in Sub-saharan Africa: The case of Sudan. Agric. Water Manag. 2020, 232, 106064. [Google Scholar] [CrossRef]
- Azcuña Castro, F.; Mejía Vaca, D.E. Analysis of resilience in investment of an irrigation system based on the comparison of climate scenarios. Invistigación Desarro. 2021, 21, 47–62. [Google Scholar]
- Narita, D.; Sato, I.; Ogawada, D.; Matsumura, A. Evaluating the robustness of project performance under deep uncertainty of climate change: A case study of irrigation development in Kenya. Clim. Risk Manag. 2022, 36, 100426. [Google Scholar] [CrossRef]
- Walker, B. Resilience: What it is and is not. Ecol. Soc. 2020, 25, 11. [Google Scholar] [CrossRef]
- IPCC. Glossary of terms. In Managing the Risks of Extreme Events and Disasters to Advance Climate Change Adaptation; Field, C.B., Barros, V., Stocker, T.F., Qin, D., Dokken, D.J., Ebi, K.L., Mastrandrea, M.D., Mach, K.J., Plattner, G.-K., Allen, S.K., et al., Eds.; A Special Report of Working Groups I and II of the Intergovernmental Panel on Climate Change (IPCC); Cambridge University Press: Cambridge, UK; New York, NY, USA, 2012; pp. 555–564. [Google Scholar]
- Engle, N.L.; de Bremond, A.; Malone, E.L.; Moss, R.H. Towards a resilience indicator framework for making climate-change adaptation decisions. Mitig. Adapt. Strateg. Glob. Chang. 2014, 19, 1295–1312. [Google Scholar] [CrossRef]
- Linkov, I.; Fox-Lent, C.; Read, L.; Allen, C.R.; Arnott, J.C.; Bellini, E.; Coaffee, J.; Florin, M.V.; Hatfield, K.; Hyde, I.; et al. Tiered approach to resilience assessment. Risk Anal. 2018, 38, 1772–1780. [Google Scholar] [CrossRef] [Green Version]
- Lankford, B.; Pringle, C.; McCosh, J.; Shabalala, M.; Hess, T.; Knox, J.W. Irrigation area, efficiency and water storage mediate the drought resilience of irrigated agriculture in a semi-arid catchment. Sci. Total Environ. 2023, 859, 160263. [Google Scholar] [CrossRef]
- Sikka, A.K.; Alam, M.F.; Mandave, V. Agricultural water management practices to improve the climate resilience of irrigated agriculture in India. Irrig. Drain. 2022, 71, 7–26. [Google Scholar] [CrossRef]
- Ronco, P.; Zennaro, F.; Torresan, S.; Critto, A.; Santini, M.; Trabucco, A.; Zollo, A.L.; Galluccio, G.; Marcomini, A. A risk assessment framework for irrigated agriculture under climate change. Adv. Water Resour. 2017, 110, 562–578. [Google Scholar] [CrossRef]
- Orojloo, M.; Shahdany, S.M.H.; Roozbahani, A. Developing an integrated risk management framework for agricultural water conveyance and distribution systems within fuzzy decision making approaches. Sci. Total Environ. 2018, 627, 1363–1376. [Google Scholar] [CrossRef] [PubMed]
- Frija, A.; Oulmane, A.; Chebil, A.; Makhlouf, M. Socio-Economic Implications and Potential Structural Adaptations of the Tunisian Agricultural Sector to Climate Change. Agronomy 2021, 11, 2112. [Google Scholar] [CrossRef]
- Akoko, G.; Kato, T.; Tu, L.H. Evaluation of Irrigation Water Resources Availability and Climate Change Impacts—A Case Study of Mwea Irrigation Scheme, Kenya. Water 2020, 12, 2330. [Google Scholar] [CrossRef]
- Torrico, J.C.; Janssens, M.J. Rapid assessment methods of resilience for natural and agricultural systems. An. Da Acad. Bras. De Ciências 2010, 82, 1095–1105. [Google Scholar] [CrossRef] [Green Version]
- NASA. Panoply NetCDF, HDF and GRIB Data Viewer. Available online: https://www.giss.nasa.gov/tools/panoply/ (accessed on 22 February 2021).
- Graham, L.P.; Andréasson, J.; Carlsson, B. Assessing climate change impacts on hydrology from an ensemble of regional climate models, model scales and linking methods—A case study on the Lule River basin. Clim. Change 2007, 81, 293–307. [Google Scholar] [CrossRef]
- Allen, R.G.; Pereira, L.S.; Raes, D.; Smith, M. Crop Evapotranspiration—Guidelines for Computing Crop Water Requirements-FAO Irrigation and Drainage Paper 56; FAO: Rome, Italy, 1998; Volume 300, p. D05109. [Google Scholar]
- Teixeira, J.L.; Pereira, L.S. ISAREG, an irrigation scheduling model. ICID Bull. 1992, 41, 29–48. [Google Scholar]
- Stulina, G.; Cameira, M.R.; Pereira, L.S. Using RZWQM to search improved practices for irrigated maize in Fergana, Uzbekistan. Agric. Water Manag. 2005, 77, 263–281. [Google Scholar] [CrossRef]
- Darouich, H.; Cameira, M.R.; Gonçalves, J.M.; Paredes, P.; Pereira, L.S. Comparing sprinkler and surface irrigation for wheat using multi-criteria analysis: Water saving vs. economic returns. Water 2017, 9, 50. [Google Scholar] [CrossRef] [Green Version]
- Wu, Y.; Liu, T.; Paredes, P.; Duan, L.; Wang, H.; Wang, T.; Pereira, L.S. Ecohydrology of groundwater-dependent grasslands of the semi-arid Horqin sandy land of Inner Mongolia focusing on evapotranspiration partition. Ecohydrology 2016, 9, 1052–1067. [Google Scholar] [CrossRef]
- Sousa, V.; Pereira, L.S. Regional analysis of irrigation water requirements using kriging: Application to potato crop (Solanum tuberosum L.) at Trás-os-Montes. Agric. Water Manag. 1999, 40, 221–233. [Google Scholar] [CrossRef]
- Chaterlán, Y.; León, M.; Duarte, C.; López, T.; Paredes, P.; Pereira, L.S. Determination of crop coefficients for horticultural crops in Cuba through field experiments and water balance simulation. Acta Hortic. 2011, 889, 475–482. [Google Scholar] [CrossRef]
- Alba, I.; Rodrigues, P.N.; Pereira, L.S. Irrigation scheduling simulation for citrus in Sicily to cope with water scarcity. In Tools for Drought Mitigation in Mediterranean Regions; Rossi, G., Cancelliere, A., Pereira, L.S., Oweis, T., Shatanawi, M., Zairi, A., Eds.; Water Science and Technology Library; Springer: Dordrecht, The Netherlands, 2003; Volume 44, pp. 223–242. [Google Scholar]
- Chaterlán, Y.; Hernández, G.; López, T.; Martínez, R.; Puig, O.; Paredes, P.; Pereira, L.S. Estimation of the papaya crop coefficients for improving irrigation water management in south of Havana. Acta Hortic. 2012, 928, 179–186. [Google Scholar] [CrossRef]
- Valverde, P.; Serralheiro, R.; de Carvalho, M.; Maia, R.I.; Oliveira, B.; Ramos, V. Climate change impacts on irrigated agriculture in the Guadiana River basin (Portugal). Agric. Water Manag. 2015, 152, 17–30. [Google Scholar] [CrossRef] [Green Version]
- Branquinho, S.; Rolim, J.; Teixeira, J.L. Climate Change Adaptation Measures in the Irrigation of a Super-Intensive Olive Orchard in the South of Portugal. Agronomy 2021, 11, 1658. [Google Scholar] [CrossRef]
- Zaccaria, D.; Oueslati, I.; Neale, C.M.U.; Lamaddalena, N.; Vurro, M.; Pereira, L.S. Flexible delivery schedules to improve farm irrigation and reduce pressure on groundwater: A case study in southern Italy. Irrig. Sci. 2009, 28, 257–270. [Google Scholar] [CrossRef]
- Ferreira, A.; Rolim, J.; Paredes, P.; Cameira, M.R. Assessing Spatio-Temporal Dynamics of Deep Percolation Using Crop Evapotranspiration Derived from Earth Observations through Google Earth Engine. Water 2022, 14, 2324. [Google Scholar] [CrossRef]
- Victoria, F.B.; Viegas Filho, J.S.; Pereira, L.S.; Teixeira, J.L.; Lanna, A.E. Multi-scale modeling for water resources planning and management in rural basins. Agric. Water Manag. 2005, 77, 4–20. [Google Scholar] [CrossRef]
- SMHI Hypeweb. Europe Climate Change. Available online: https://hypeweb.smhi.se/ (accessed on 22 July 2021).
- Lindström, G.; Pers, C.; Rosberg, J.; Strömqvist, J. Development and testing of the HYPE (Hydrological Predictions for the Environment) water quality model for different spatial scales Go. Hydrol. Res. 2010, 41, 295–319. [Google Scholar] [CrossRef]
- Water, I. Development of the Methodological Framework of the European Resilience Management Guidance (ERMG). 2016, Horizon 2020 Programme. Available online: http://resilens.eu/wp-content/uploads/2017/10/D3.1-Development-of-the-methodological-framework-of-ERMG.pdf (accessed on 22 July 2021).
- Albino, J.C.; Peralta-Rivero, C.; Ticona, P.; Pelletier, E. Capacidad De Resiliencia De Sistemas Agroforestales, Ganadería Semi-Intensiva y Agricultura Bajo Riego: Beneficios Alcanzados Por La PEP Del CIPCA. Centro de Investigación y Promoción del Campesinado. 2017. Available online: https://cipca.org.bo/docs/publications/es/108_cuaderno-resilencia-vweb.pdf (accessed on 22 July 2021).
- Rai, R.; Joshi, S.; Roy, S.; Singh, O.; Samir, M.; Chandra, A. Implications of changing climate on productivity of temperate fruit crops with special reference to apple. J. Hortic. 2015, 2, 135–141. [Google Scholar]
- Fadón, E.; Herrera, S.; Guerrero, B.I.; Guerra, M.E.; Rodrigo, J. Chilling and heat requirements of temperate stone fruit trees (Prunus sp.). Agronomy 2020, 10, 409. [Google Scholar] [CrossRef] [Green Version]
- Doorenbos, J.; Kassam, A.H. Yield Response to Water. Irrigation and Drainage Paper; Food and Agriculture Organization of the United Nations: Rome, Italy, 1979; Volume 33, p. 257. [Google Scholar]
- Puig-Sirera, À.; Provenzano, G.; González-Altozano, P.; Intrigliolo, D.S.; Rallo, G. Irrigation water saving strategies in Citrus orchards: Analysis of the combined effects of timing and severity of soil water deficit. Agric. Water Manag. 2021, 248, 106773. [Google Scholar] [CrossRef]
- Gil, J.D.B.; Cohn, A.S.; Duncan, J.; Newton, P.; Vermeulen, S. The resilience of integrated agricultural systems to climate change. WIREs. Clim. Chang. 2017, 8, e461. [Google Scholar]
- Ayers, R.S.; Westcot, D.W. Water Quality for Agriculture; Food and Agriculture Organization of the United Nations: Rome, Italy, 1985; Volume 29, p. 174. [Google Scholar]
- Beck, H.E.; Zimmermann, N.E.; McVicar, T.R.; Vergopolan, N.; Berg, A.; Wood, E.F. Present and future Köppen-Geiger climate classification maps at 1-km resolution. Sci. Data 2018, 5, 1–12. [Google Scholar] [CrossRef] [Green Version]
- IPMA. Agricultural Meteorological Bulletin. Available online: https://www.ipma.pt/pt/publicacoes/boletins.jsp?cmbDep=agr&cmbTema=bag&cmbAno=2019&idDep=agr&idTema=bag&curAno=2019 (accessed on 9 July 2021).
- Hargreaves, G.H.; Samani, Z.A. Reference crop evapotranspiration from temperature. Appl. Eng. Agric. 1985, 1, 96–99. [Google Scholar] [CrossRef]
- Nóia Júnior, R.D.S.; Fraisse, C.W.; Cerbaro, V.A.; Karrei, M.A.Z.; Guindin, N. Evaluation of the Hargreaves-Samani method for estimating reference evapotranspiration with ground and gridded weather data sources. Appl. Eng. Agric. 2019, 35, 823–835. [Google Scholar] [CrossRef]
- Matos, B. Contribution for the Study of Dormancy in Pear Trees, Rocha Variety (in Portuguese). Master’s Thesis, Instituto Superior de Agronomia-University of Lisbon, Lisbon, Portugal, 2019. [Google Scholar]
- IFAP. Tabelas De Preços De Referência A Aplicar No Âmbito Do Sistema De Seguros De Colheitas; Instituto de Financiamento da Agricultura e Pescas: Lisboa, Portugal, 2021. Available online: https://www.ifap.pt/documents/182/10564592/Tabela+_Preços_GPP_2021.pdf/e6ce9dba-bef1-dc60-36d0-f66ac99452f3 (accessed on 22 July 2021).
- DGADR. Sistema De Informação De Regadio—Statistics. Available online: https://sir.dgadr.gov.pt/stat (accessed on 22 July 2021).
- FENAREG. Projeto AGIR—Sistema de Avaliação da Eficiência do Uso da Água e da Energia em Aproveitamentos Hidroagrícolas. 2018. Available online: http://www.fenareg.pt/agir-grupooperacional-eficiencia-em-aproveitamentos-hidroagricolas-reune-para-preparacao-doquarto-semestre-do-projeto/ (accessed on 22 July 2021).
- EDIA. Anuário Agrícola de Alqueva; EDIA—Empresa de Desenvolvimento e Infra-estruturas do Alqueva, S.A.: Beja, Portugal, 2020; p. 204. [Google Scholar]
- SNIRH. Redes De Monitorização. Available online: https://snirh.apambiente.pt/ (accessed on 22 July 2021).
- Christensen, O.B.; Kjellström, E. Partitioning uncertainty components of mean climate and climate change in a large ensemble of European regional climate model projections. Clim. Dyn. 2020, 54, 4293–4308. [Google Scholar] [CrossRef]
- Lionello, P.; Giorgi, F.; Rohling, E.; Seager, R. Mediterranean climate: Past, present and future. In Oceanography of the Mediterranean Sea; Elsevier: Amsterdam, The Netherlands, 2023; pp. 41–91. [Google Scholar]
- Fonseca, A.; Fraga, H.; Santos, J.A. Exposure of Portuguese viticulture to weather extremes under climate change. Clim. Serv. 2023, 30, 100357. [Google Scholar] [CrossRef]
- Guerreiro, S.B.; Birkinshaw, S.; Kilsby, C.; Fowler, H.J.; Lewis, E. Dry Getting Drier—The Future of Transnational River Basins in Iberia. J. Hydrol. Reg. Stud. 2017, 12, 238–252. [Google Scholar] [CrossRef]
- Rodríguez, A.; Pérez-López, D.; Sánchez, E.; Centeno, A.; Gómara, I.; Dosio, A.; Ruiz-Ramos, M. Chilling accumulation in fruit trees in Spain under climate change. Nat. Hazard Earth Syst. Sci. 2019, 19, 1087–1103. [Google Scholar] [CrossRef] [Green Version]
- Darbyshire, R.; Webb, L.; Goodwin, I.; Barlow, E. Impact of future warming on winter chilling in Australia. Int. J. Biometeorol. 2013, 57, 355–366. [Google Scholar] [CrossRef]
- Fraga, H.; Pinto, J.G.; Santos, J.A. Climate change projections for chilling and heat forcing conditions in European vineyards and olive orchards: A multi-model assessment. Clim. Chang. 2019, 152, 179–193. [Google Scholar] [CrossRef]
- Luedeling, E.; Gebauer, J.; Buerkert, A. Climate change effects on winter chill for tree crops with chilling requirements on the Arabian Peninsula. Clim. Chang. 2009, 96, 219–237. [Google Scholar] [CrossRef] [Green Version]
- Pereira, L.S.; Teodoro, P.R.; Rodrigues, P.N.; Teixeira, J.L. Irrigation Scheduling Simulation: The Model Isareg. In Tools for Drought Mitigation in Mediterranean Regions; Rossi, G., Cancelliere, A., Pereira, L.S., Oweis, T., Shatanawi, M., Zairi, A., Eds.; Water Science and Technology Library; Springer: Dordrecht, The Netherlands, 2003; Volume 44. [Google Scholar]
- Langridge, P.; Braun, H.; Hulke, B.; Ober, E.; Prasanna, B.M. Breeding crops for climate resilience. Theor. Appl. Genet. 2021, 134, 1607–1611. [Google Scholar] [CrossRef]
- Srivastav, A.L.; Dhyani, R.; Ranjan, M.; Madhav, S.; Sillanpää, M. Climate-resilient strategies for sustainable management of water resources and agriculture. Environ. Sci. Pollut. Res. 2021, 28, 41576–41595. [Google Scholar] [CrossRef] [PubMed]
- Shen, Q.; Niu, J.; Liu, Q.; Liao, D.; Du, T. A resilience-based approach for water resources management over a typical agricultural region in Northwest China under water-energy-food nexus. Ecol. Indic. 2022, 144, 109562. [Google Scholar] [CrossRef]
- Hossard, L.; Fadlaoui, A.; Ricote, E.; Belhouchette, H. Assessing the resilience of farming systems on the Saïs plain, Morocco. Reg. Environ. Change 2021, 21, 1–14. [Google Scholar] [CrossRef]
- Samimi, M.; Mirchi, A.; Townsend, N.; Gutzler, D.; Daggubati, S.; Ahn, S.; Hargrove, W. Climate change impacts on agricultural water availability in the Middle Rio Grande basin. J. Am. Water Resour. Assoc. 2022, 58, 164–184. [Google Scholar] [CrossRef]
Figure 1.
Flowchart presenting the scientific approach used for calculating climate resilience of run-of-river Collective Irrigation Systems (ETo—reference evapotranspiration, P—precipitation, CC—climate change).
Figure 1.
Flowchart presenting the scientific approach used for calculating climate resilience of run-of-river Collective Irrigation Systems (ETo—reference evapotranspiration, P—precipitation, CC—climate change).

Figure 2.
Flowchart for the determination of reference evapotranspiration (ETo) and precipitation (P) for the observed historical period (e.g., 1971–2000) and for the scenarios RCP4.5 and 8.5, considering the periods 2041–2070 and 2071–2100 (Tmax is maximum temperature, Tmin is minimum temperature, P is precipitation, ETo is reference evapotranspiration).

Figure 3.
Flowchart summarizing the calculation methodology of the global irrigation requirements (GIR) at the Collective Irrigation System level (Eto—reference evapotranspiration, TAW—total available soil water, p—depletion fraction, Zr—depth of roots, Kc—crop coefficient, fw—wetted soil fraction, NIR—net irrigation requirements).

Figure 4.
Flowchart presenting the methodology for the calculation of the supply-demand balance for the different rehabilitation alternatives (GIR—Global irrigation requirements, IRS—Irrigation requirements at the source).
Figure 4.
Flowchart presenting the methodology for the calculation of the supply-demand balance for the different rehabilitation alternatives (GIR—Global irrigation requirements, IRS—Irrigation requirements at the source).

Figure 5.
Localization of the Collective Irrigation Systems, Maiorga, Cela, and Valado de Frades.

Figure 6.
Monthly average precipitation (P) and air temperature (Tmax and Tmin) measured in Alcobaça meteorological station for the 1971–2000 period, and respective reference evapotranspiration (ETo).
Figure 6.
Monthly average precipitation (P) and air temperature (Tmax and Tmin) measured in Alcobaça meteorological station for the 1971–2000 period, and respective reference evapotranspiration (ETo).

Figure 7.
Monthly average values for the historical period 1956–1986 and for the periods 2041–2070 and 2071–2100 (projection scenarios RCP4.5 and RCP8.5): (a) precipitation; (b) maximum air temperature; and (c) minimum air temperature.
Figure 7.
Monthly average values for the historical period 1956–1986 and for the periods 2041–2070 and 2071–2100 (projection scenarios RCP4.5 and RCP8.5): (a) precipitation; (b) maximum air temperature; and (c) minimum air temperature.

Table 1.
Climate models ensemble considered for the RCP4.5 and 8.5 scenarios and institutions where they were developed.
Table 1.
Climate models ensemble considered for the RCP4.5 and 8.5 scenarios and institutions where they were developed.
| General Circulation Models | Regional Climate Models | ||||
|---|---|---|---|---|---|
| RCP4.5 | RCP8.5 | ||||
| Model | Institution | Model | Institution | Model | Institution |
| CNRM-CM5 | Centre National de Recherches Météorologiques | - | - | HadREM3-GA7-05 REMO2015 | Hadley Centre Climate Service Center Germany |
| EC-EARTH | European Centre of Medium Range Weather Forecast | RACMO22E HIRHAM5 | Koninklijk Nederland Meteorologisch InstituutDanish Meteorological Institute | COSMO-crCLIM HadREM3-GA7-05 | ETH Zurich Hadley Centre |
| CM5A-MR | Institut Pierre Simon Laplace | - | - | HIRHAM5 REMO2015 | Danish Meteorological Institute Climate Service Center Germany |
| ESM-LR | Max Planck Institut für Meteorologie | SMHI-RCA4 CCLM4-8-17 | Rossby Centre Climate Limited- area Modelling-Community | SMHI-RCA4 HIRHAM5 | Rossby Centre Danish Meteorological Institute |
| HadGEM2-ES | Hadley Centre | - | - | COSMO-crCLIM HadREM3-GA7-05 | ETH Zurich Hadley Centre |
| NorESM1-M | EarthClim Project, Norwegian Climate Centre (NCC) | - | - | HadREM3-GA7-05 COSMO-crCLIM | Hadley Centre ETH Zurich |
Table 2.
Crop related parameters and correspondent resilience classes.
| Normalized Ky | Resilience Class | Soil Water Depletion Factor (p) | Resilience Class | |
|---|---|---|---|---|
| 1.0–0.8 | Very low | 0.2–0.5 | Low | |
| 0.8–0.6 | Low | 0.5–0.6 | Average | |
| 0.6–0.4 | Average | >0.6 | High | |
| 0.4–0.2 | High | |||
| 0.2–0.0 | Very high |
Table 3.
On-farm irrigation system parameters and correspondent classes of resilience.
| AE (%) | Resilience Class | Swa | Resilience Class | |
|---|---|---|---|---|
| <65 | Low | >0.9 | Very low | |
| 65–80 | Average | 0.6–0.9 | Low | |
| 80–90 | High | 0.4–0.6 | Average | |
| >90 | Very high | <0.4 | High |
AE—Application efficiency; Swa—Soil wet area.
Table 4.
Project rehabilitation alternatives and correspondent resilience classes.
| Number and type of irrigation water sources | Resilience class |
| One source; surface without flow regularization | Very low |
| More than one source; surface without flow regularization | Low |
| One groundwater or one surface source with flow regularization | Average |
| Groundwater source and surface source with flow regularization | High |
| Electrical conductivity of the water at the source | |
| Ecw (dS m−1)/Use restrictions | Resilience class |
| >3.0/Severe | Very low |
| 0.7–3.0/Moderate | Average |
| <0.7/None | High |
| Guarantee for irrigation water availability | |
| Guarantee (%) | Resilience class |
| <80 | Very low |
| 80–90 | Average |
| >90 | High |
| Failures in water availability | |
| Severe failures | Resilience class |
| with | Low |
| without | High |
Table 5.
Data sources used in the present study.
| Data | Source |
|---|---|
| Crop | |
| Crop coefficients and depletion factor (further corrected to local climatic conditions) | [52] |
| Stress coefficients for orchards and potatoes | [45,73] |
| Chilling requirements for orchards | [71,80] |
| Sowing and harvest dates, crop stage length, rooting depths | Farmers inquires |
| Yields and reference prices | Crop insurance data 2021 [81] |
| Irrigation systems | |
| On farm | [82] |
| Irrigation water conveyance and distribution efficiencies | [83] |
| Production costs | [84] |
| Meteorological data | |
| Historical temperature data series 1956–1985 | Alcobaça meteorological station (39°32′ N; 8°58′ W; 38 m a.s.l), |
| Historical precipitation data series 1956–1985 | Cela meteorological station (39°′34 N; 9°04′ W; 2 m a.s.l.) from [85] |
| Soils | Portuguese Soil Map (CSP) and Land Use Capacity (DGADR—Ministry of Agriculture) |
| Water | |
| Monthly flows of the Areia and Alcobaça rivers for the period 1956 to 1985 | [85] |
| Irrigation water quality for the period 1989 to 2014 | [85] |
Table 6.
Characteristics of the rehabilitation alternatives of the Maiorga Collective Irrigation System.
Table 6.
Characteristics of the rehabilitation alternatives of the Maiorga Collective Irrigation System.
| Rehabilitation Alternatives | Water Source (River) | Area to Irrigate (ha) | Transport and Distribution of Irrigation Water to Farmers’ Fields | |||
|---|---|---|---|---|---|---|
| Type | EC (%) [83] | ED (%) [83] | ||||
| A (baseline) | Alcobaça | Maiorga | 101.0 | open channel | 65 | 65 |
| Cela | 485.0 | pressurized | - | 90 | ||
| Areia | Maiorga | 210.0 | open channel | 65 | 65 | |
| V. Frades | 312.3 | open channel | 65 | 65 | ||
| B | Alcobaça | Maiorga | 355.6 | pressurized | 95 | 90 |
| Cela | 485 | pressurized | - | 90 | ||
| Areia | V. Frades | 312.3 | open channel | 65 | 65 | |
| C | Areia | Maiorga | 355.6 | pressurized | - | 90 |
| V. Frades | 312.3 | open channel | 65 | 65 | ||
| D | Alcobaça | Maiorga | 355.6 | pressurized | - | 90 |
| Cela | 485 | pressurized | - | 90 | ||
| Areia | V. Frades | 312.3 | open channel | 65 | 65 | |
EC—Conveyance efficiency, ED—distribution efficiency.
Table 7.
Global irrigation requirements (GIR), for the average year, for the crop scenario considered and respective anomalies (ΔGIR).
Table 7.
Global irrigation requirements (GIR), for the average year, for the crop scenario considered and respective anomalies (ΔGIR).
| Period | GIR (mm) | ΔGIR | |||||||||
|---|---|---|---|---|---|---|---|---|---|---|---|
| Mar | Apr | May | Jun | Jul | Aug | Sep | Oct | Annual | mm | % | |
| 1956–1985 | 0.4 | 1.4 | 11.2 | 38.5 | 74.4 | 59.8 | 26 | 3.6 | 215.3 | - | - |
| RCP4.5 2041–2070 | 0.8 | 3 | 14.2 | 40.3 | 74.5 | 63.7 | 27.7 | 5 | 229.6 | 14.3 | 6.6 |
| RCP8.5 2041–2070 | 0.4 | 2 | 21.6 | 54.8 | 81.7 | 66.5 | 35.8 | 4.8 | 267.9 | 52.6 | 24.4 |
| RCP4.5 2071–2100 | 0.4 | 1.8 | 12.6 | 43.5 | 79.7 | 60.7 | 24.5 | 3.7 | 227.1 | 11.8 | 5.5 |
| RCP8.5 2071–2100 | 0.4 | 3 | 27 | 62.8 | 85.5 | 67.8 | 36.3 | 8.3 | 292.1 | 76.8 | 35.7 |
Table 8.
Average monthly and annual runoff anomalies in 2050 and 2080 compared to the reference period 1956–1985 for climate scenarios RCP4.5 and RCP8.5.
Table 8.
Average monthly and annual runoff anomalies in 2050 and 2080 compared to the reference period 1956–1985 for climate scenarios RCP4.5 and RCP8.5.
| Average Anomalies (%) | ||||||||||||||
|---|---|---|---|---|---|---|---|---|---|---|---|---|---|---|
| Scenario | Period | Jan | Feb | Mar | Apr | May | Jun | Jul | Aug | Sep | Oct | Nov | Dec | Annual |
| RCP4.5 | 2050 | −5 | 7 | 20 | −17 | −39 | −15 | −17 | −18 | −18 | −6 | −25 | −23 | −11 |
| RCP4.5 | 2080 | 2 | 4 | 14 | −19 | −41 | −23 | −19 | −18 | −5 | −24 | −25 | −3 | −9 |
| RCP8.5 | 2050 | 2 | −6 | 13 | −15 | −34 | −19 | −20 | −20 | −13 | −3 | −19 | −31 | −13 |
| RCP8.5 | 2080 | −9 | −27 | −17 | −39 | −53 | −35 | −34 | −29 | −35 | −43 | −43 | −31 | −30 |
Table 9.
Average, 90th, and 10th percentiles of chilling hours in Alcobaça for 2010 and 2020.
| Statistics | Chilling Hours |
|---|---|
| Percentile 10 | 638 |
| Average | 804 |
| Percentile 90 | 963 |
Table 10.
Chilling hours of the apple and pear varieties existing in the MIS.
| Crop/Variety | Chilling Units |
|---|---|
| Apple (Royal Gala and Fuji) | 600–800 |
| Pear (Rocha) | 550 |
Table 11.
Crop yield response factor (Ky), soil water depletion factor (p), and respective climate resilience classes [45]. (red = very low and orange = low).
Table 11.
Crop yield response factor (Ky), soil water depletion factor (p), and respective climate resilience classes [45]. (red = very low and orange = low).
| Crops | Ky | Normalized Ky | Soil Water Depletion Factor (p) | |
|---|---|---|---|---|
| Orchards (apple and pear) | 1 | 0.91 | 0.5 | |
| Cabbage | 0.95 | 0.86 | 0.45 | |
| Potato | 1.1 | 1 | 0.35 |
Table 12.
ECe threshold and b values of the crops of the MIS and the respective sensitivity to salinity classification [52].
Table 12.
ECe threshold and b values of the crops of the MIS and the respective sensitivity to salinity classification [52].
| Crop | ECe Threshold (dS m−1) | b (%/dS m−1) | FAO 56 Classification |
|---|---|---|---|
| Cabbage | 1.0–1.8 | 9.8–14.0 | Moderately sensitive |
| Potato | 1.7 | 12.0 | Moderately sensitive |
| Apple | - | - | Sensitive |
| Pear | - | - | Sensitive |
ECe threshold—electrical conductivity of the saturation extract at the threshold of ECe when crop yield first reduces; b—reduction in yield per increase in ECe.
Table 13.
Installation and operating costs and gross revenues for the crops in the Maiorga Collective Irrigation System.
Table 13.
Installation and operating costs and gross revenues for the crops in the Maiorga Collective Irrigation System.
| Crop | Costs | Gross Revenue (€ ha−1) | |
|---|---|---|---|
| Installation (€ ha−1) | Operational (€ ha−1) | ||
| Cabbage | - | 6000 | 6400 |
| Potato | - | 5220 | 4500 |
| Apple | 12,000–18,000 | 9860 | 19,530–32,550 |
| Pear | 17,000–19,000 | 10,846 | 16,420–20,525 |
Table 14.
Application efficiency (AE) and soil wet fraction (Swa) of the on-farm irrigation systems in the Maiorca Collective Irrigation System and correspondent resiliency classes. (green = high, orange = low, red = very low).
Table 14.
Application efficiency (AE) and soil wet fraction (Swa) of the on-farm irrigation systems in the Maiorca Collective Irrigation System and correspondent resiliency classes. (green = high, orange = low, red = very low).
| On-Farm Irrigation System | AE | Swa |
|---|---|---|
| Sprinkler | 0.85 | 1.0 |
| Drip | 0.90 | 0.6 |
Table 15.
Supply guarantee and number of years with failures for each one of the alternatives in the period 1956–1985 and climate scenarios RCP4.5 and RCP8., for the 2041–2070 and 2071–2100 periods.
Table 15.
Supply guarantee and number of years with failures for each one of the alternatives in the period 1956–1985 and climate scenarios RCP4.5 and RCP8., for the 2041–2070 and 2071–2100 periods.
| Supply Guaranty (%) | Number of Years with Failures | ||||||||||
|---|---|---|---|---|---|---|---|---|---|---|---|
| RCP4.5 | RCP8.5 | RCP4.5 | RCP8.5 | ||||||||
| Project | 1966 1985 | 2041 2070 | 2071 2100 | 2041 2070 | 2071 2100 | 1966 1985 | 2041 2070 | 2071 2100 | 2041 2070 | 2071 2100 | |
| alternative | |||||||||||
| A | 100 | 100 | 100 | 100 | 97 | 0 | 0 | 0 | 0 | 1 | |
| 55 | 45 | 32 | 32 | 13 | 14 | 17 | 21 | 21 | 27 | ||
| B | 97 | 94 | 84 | 87 | 68 | 1 | 2 | 5 | 4 | 10 | |
| C | 58 | 52 | 35 | 39 | 23 | 13 | 15 | 20 | 19 | 24 | |
| D | 100 | 100 | 97 | 100 | 90 | 0 | 0 | 1 | 0 | 3 | |
| 74 | 71 | 61 | 61 | 48 | 8 | 9 | 12 | 12 | 16 | ||
Table 16.
Number and type of water source for each project rehabilitation alternatives for the Maiorga Collective Irrigation System and correspondent resilience classes (red = very low and orange = low).
Table 16.
Number and type of water source for each project rehabilitation alternatives for the Maiorga Collective Irrigation System and correspondent resilience classes (red = very low and orange = low).
| Number and Type of Irrigation Water Source | |
|---|---|
| Alternative A | One surface source without regularization |
| Alternative B | Two surface sources without regularization |
| Alternative C | One source without regularization |
| Alternative D | One source without regularization |
Table 17.
Electrical conductivity of the water at source and correspondent use restrictions [78] (green = high resilience/no restrictions and pink = average resilience/moderate).
Table 17.
Electrical conductivity of the water at source and correspondent use restrictions [78] (green = high resilience/no restrictions and pink = average resilience/moderate).
| Water Source | Ecw (dS m−1) |
|---|---|
| River Areia | 0.48 |
| River Alcobaça | 0.77 |
Table 18.
Area to irrigate per water source, conveyance and distribution efficiencies for each project rehabilitation alternative and correspondent resilience classes [76] (green = very high; red = low).
Table 18.
Area to irrigate per water source, conveyance and distribution efficiencies for each project rehabilitation alternative and correspondent resilience classes [76] (green = very high; red = low).
| Project Rehabilitation | Water Source (River) | Area to Irrigate | Efficiency (%) | |
|---|---|---|---|---|
| Alternatives | Conveyance | Distribution | ||
| A (baseline) | Alcobaça | Maiorga Cela | 65 | 65 |
| - | 90 | |||
| Areia | Maiorga V. Frades | 65 65 | 65 65 | |
| B | Alcobaça | Maiorga Cela | 95 | 90 |
| - | 90 | |||
| C | Areia | V. Frades | 65 | 65 |
| Areia | Maiorga | - | 90 | |
| D | V. Frades | 65 | 65 | |
| Alcobaça | Maiorga Cela | - - | 90 90 | |
| Areia | V. Frades | 65 | 65 | |
Table 19.
Irrigation water supply guarantee computed for each rehabilitation alternative, and correspondent resilience classes (green = high, orange = average, red = low).
Table 19.
Irrigation water supply guarantee computed for each rehabilitation alternative, and correspondent resilience classes (green = high, orange = average, red = low).
| Supply Guarantee for the MIS (%) | Global Supply Guarantee (%) | ||||||||||
|---|---|---|---|---|---|---|---|---|---|---|---|
| RCP4.5 | RCP8.5 | RCP4.5 | RCP8.5 | ||||||||
| Project alternative | 1966 1985 | 2041 2070 | 2071 2100 | 2041 2070 | 2071 2100 | 1966 1985 | 2041 2070 | 2071 2100 | 2041 2070 | 2071 2100 | |
| A | 100 | 45 | 32 | 32 | 13 | 55 | 45 | 32 | 32 | 13 | |
| B | 95 | 94 | 84 | 87 | 68 | 97 | 94 | 84 | 87 | 68 | |
| C | 58 | 52 | 52 | 39 | 23 | 58 | 52 | 52 | 39 | 23 | |
| D | 100 | 100 | 100 | 97 | 90 | 74 | 71 | 71 | 61 | 48 | |
MIS—Maiorga Collective Irrigation System.
Table 20.
Number of severe failures computed for each rehabilitation alternative, and correspondent resilience classes.
Table 20.
Number of severe failures computed for each rehabilitation alternative, and correspondent resilience classes.
| Severe Failures for MIS (No.) | Global Severe Failures (No.) | ||||||||||
|---|---|---|---|---|---|---|---|---|---|---|---|
| RCP4.5 | RCP8.5 | RCP4.5 | RCP8.5 | ||||||||
| Project alternative | 1966 1985 | 2041 2070 | 2071 2100 | 2041 2070 | 2071 2100 | 1966 1985 | 2041 2070 | 2071 2100 | 2041 2070 | 2071 2100 | |
| A | 14 | 21 | 23 | 27 | 60 | 14 | 21 | 23 | 27 | 60 | |
| B | 0 | 0 | 2 | 2 | 10 | 0 | 0 | 2 | 2 | 10 | |
| C | 13 | 17 | 22 | 24 | 53 | 13 | 17 | 22 | 24 | 53 | |
| D | 0 | 0 | 0 | 0 | 1 | 3 | 6 | 9 | 9 | 29 | |
MIS—Maiorga Collective Irrigation System.
Disclaimer/Publisher’s Note: The statements, opinions and data contained in all publications are solely those of the individual author(s) and contributor(s) and not of MDPI and/or the editor(s). MDPI and/or the editor(s) disclaim responsibility for any injury to people or property resulting from any ideas, methods, instructions or products referred to in the content. |
© 2023 by the authors. Licensee MDPI, Basel, Switzerland. This article is an open access article distributed under the terms and conditions of the Creative Commons Attribution (CC BY) license (https://creativecommons.org/licenses/by/4.0/).
Share and Cite
MDPI and ACS Style
Esteves, R.; Calejo, M.J.; Rolim, J.; Teixeira, J.L.; Cameira, M.R. Framework for Assessing Collective Irrigation Systems Resilience to Climate Change—The Maiorga Case Study. Agronomy 2023, 13, 661. https://doi.org/10.3390/agronomy13030661
AMA Style
Esteves R, Calejo MJ, Rolim J, Teixeira JL, Cameira MR. Framework for Assessing Collective Irrigation Systems Resilience to Climate Change—The Maiorga Case Study. Agronomy. 2023; 13(3):661. https://doi.org/10.3390/agronomy13030661
Chicago/Turabian StyleEsteves, Rita, Maria João Calejo, João Rolim, José Luís Teixeira, and Maria Rosário Cameira. 2023. "Framework for Assessing Collective Irrigation Systems Resilience to Climate Change—The Maiorga Case Study" Agronomy 13, no. 3: 661. https://doi.org/10.3390/agronomy13030661
Note that from the first issue of 2016, this journal uses article numbers instead of page numbers. See further details here.