
Biochar-Based Phosphate Fertilizers: Synthesis, Properties, Kinetics of P Release and Recommendation for Crops Grown in Oxisols

1
Department of Soil Science, Federal University of Lavras, University Campus, P.O. Box 3037, Lavras 37200-000, Minas Gerais, Brazil
2
Agrosystems Research, Wageningen University & Research, P.O. Box 16, 6700 AA Wageningen, The Netherlands
*
Authors to whom correspondence should be addressed.
Agronomy 2023, 13(2), 326; https://doi.org/10.3390/agronomy13020326
Submission received: 16 December 2022
/
Revised: 17 January 2023
/
Accepted: 19 January 2023
/
Published: 21 January 2023
(This article belongs to the Special Issue Application of Organic Amendments in Agricultural Production)
Abstract
:The agronomic efficiency of biochar-based fertilizers (BBFs) relies on the synthesis routes, properties, and interaction with the soil–plant system. In our study, BBFs were produced from coffee husk, low-grade acidulated phosphate rock with and without the addition of magnesium (Mg). BBFs were characterized for infrared analysis and the kinetics of phosphorus (P) release in water or citric acid (CA). The agronomic performance of BBFs was tested by growing maize and, in sequence, brachiaria grass in pots filled with two Oxisols with contrasting soil organic matter (SOM) content. Using the same chemical stoichiometric ratio, nitric acid was more effective than hydrochloric and sulfuric acids, creating BBFs with enhanced agronomic performance. The use of Mg in the BBFs synthesis reduced the P released in water. Phosphorus released in CA leachates positively correlated with the P in the shoot of both plants. BBFs produced using nitric acid had higher residual effect on brachiaria grass grown in the Oxisol with the highest SOM. Our outcomes show that the P rate for maize and brachiaria grass should be considered based on P soluble in neutral ammonium citrate plus water in BBFs. BBFs is an alternative to improve the use efficiency of P in Oxisols.
1. Introduction
Tropical Brazilian soils have low natural availability of phosphorus (P) and soil organic matter (SOM) levels. Phosphorus is often adsorbed in soil colloids, which reduces the agronomic efficiency of phosphate fertilizers, mainly in situations in which soluble P fertilizers are added to highly weathered soils [1,2,3]. The increase in SOM levels is a strategy to enhance the efficiency of P fertilization because organic compounds and radicals from the native SOM can block P fixation sites in soil colloids, as well as to form metal–organic ligand–phosphate complexes [1,4]. Increasing SOM levels takes a long time and is an enormous challenge in the tropical landscape due to the high SOM decomposition rate and low input of organic residues in crop fields of most tropical soils [1,2]. However, the similar beneficial effects of SOM on the soil P availability and plant nutrition could be reached through the use of organomineral fertilizers (OMFs), although the agronomic effectiveness of this fertilizer class relies on soil type, notably on the native SOM level [4,5,6,7,8].
OMFs may be produced through different routes and sources of minerals fertilizers and organic wastes, including the mixing low-grade or acidified P with feedstocks charred under different pyrolysis conditions, with the subsequent synthesis of biochar-based fertilizers (BBFs) [9,10]. Biochar-based fertilizers can also be formulated by mixing charred biomass rich in nutrients with low-grade and soluble nutrient mineral sources and organic wastes with different elemental compositions, chemical and physicochemical properties [9,11,12,13]. Compared to mineral sources, BBFs are capable of gradually releasing P in water [9]. The synthesis of BBFs by mixing organic wastes with raw igneous phosphate rock was already tested, although the formulated BBFs had low agronomic efficiency due to the reduced solubilization of apatite during pyrolysis, resulting in reduced availability of P in soil for crops [12]. In addition, the pyrolysis process involves the production of high pH charred matrices, and pH in the alkaline range is not an adequate condition to promote the full solubilization of low-grade phosphate rocks such as apatite [12,14].
The solubilization of low-grade phosphate rocks requires an acidic environment, thus, the pyrolysis process, typically alkaline in nature, is not efficient in promoting the full solubilization of apatite. The use of strong acids such as nitric, sulfuric, and hydrochloric is a crucial step to convert apatite into soluble P fertilizers with high agronomic value [15]. When phosphate rock is acidulated and converted into highly water-soluble mineral P chemical compounds, the P-fertilizer has low efficiency in most soils [3]. However, when the acidulation process leads to the production of soluble P chemical compounds capable to be completed by organic compounds, the forming of P–metal–organic complexes had a greater agronomic performance than soluble conventional P fertilizers [4]. Moreover, when inorganic acids interact with biochar, there is a chemical activation and functionalization of the biochar matrix, which favors P acquisition by crops [16].
Magnesium interacts positively with phosphate in fertilizers, promoting a more gradual release of P to crops; moreover, there is a synergistic effect between P and Mg, thus, P uptake by plants is improved when Mg availability in soil is adequate [9,17,18]. Fertilizers with a gradual P release may have a higher agronomic performance due to the P release rate, along with reducing P losses in tropical soil through specific phosphate adsorption, precipitation, and formation of low-soluble Ca-P compounds [17,19]. However, for BBFs, if P is slowly released to crops, growth may be hampered for plants with a short window to grow and uptake P, such as maize (Zea mays L.) with an early cycle (between 120–130 days) [9].
Kinetics of P release studies indicate the dynamics of P-fertilizer release, and most of the extractant solutions used to evaluate P in leachates use water or a 0.01 M CaCl2 as eluent solutions [9,20,21]. However, the P kinetics release was originally developed using water or CaCl2 solution as eluents for mineral fertilizers, which limits its use for BBFs due to different P pools (mineral and organic forms) associated with charred matrices. Hence other extractant solutions should be evaluated for OMFs with the same purpose [7,13]. Citric acid (CA) is a promising extractant to evaluate the kinetics of P release since plant roots can release this organic acid that is capable of mobilizing significant amounts of P in the rhizosphere [22].
Even for the main crop, some P types which are not assessed by chemical extractants in BBFs may be partially responsible for the positive effects of OMFs, compared with P mineral fertilizers. This effect was demonstrated due to a greater uptake by maize of P derived from OMF over monoammonium phosphate (MAP)-fertilized plants, in which the fertilization recommendation was based on the fertilizer P soluble in neutral ammonium citrate plus water (NAC + H2O). Other forms of P in OMFs, which is not fully assessed by the NAC + H2O solution, underestimates the P rate recommended for crops [5]. Moreover, due to a more gradual release of P from different P pools found in organic-based fertilizers, OMFs can promote a higher P residual effect (soil residual P) than mineral fertilizers [6,7]. Hence, the first and second crops must be successively grown and evaluated to assess the residual availability of P in soil.
Thus, the authors hypothesized that the mixture and pyrolysis of coffee husk (CH) with a low-grade acidulated Araxá phosphate rock (APR), combined with Mg as an additive, produce BBFs with new and enhanced properties, which controls the P release and increases the agronomic efficiency of BBFs for maize and Brachiaria grass (Brachiaria brizantha (Hochst. Ex A. Rich.) Stapf) successively grown in Oxisols with contrasting texture and SOM content. The aims of this study were to: (I) produce BBFs with different chemical properties and P solubility indices; (II) decrease P solubility in water in BBFs by using Mg as an additive; (III) evaluate the kinetics of P release using water and CA as extractant solutions; (IV) correlate fertilizer solubility P indices and P released by BBFs with the P uptake by maize and brachiaria grass successively grown in two contrasting Oxisols; (V) evaluate, in highly weathered soils, the residual P effect of BBFs.
2. Materials and Methods
2.1. Biochar-Based Fertilizers Synthesis
Twelve BBFs were formulated with the pyrolysis of mixtures of the CH, APR, inorganic acids, and Mg sources. Coffee husk and APR were mixed at a ratio of 2:1 (mass of CH: mass of APR), dried and passed through 1 and 0.25 mm mesh sieves. The coffee waste used had 17.3 and 42.4 g kg−1 of N and K total concentrations, respectively, and 1.2, 1.0, 1.2, 1.1, and 1.1 g kg−1 of total P (P-Total), P-soluble in water (P-H2O), P-soluble in NAC + H2O (P-NAC), P-soluble in citric acid at 2% (P-CA), and P-soluble in formic acid at 2% (P-FA), respectively. APR used had 126.2, 0.1, 6.5, 17.0, and 15.5 g kg−1, of P-Total, P-H2O, P-NAC, P-CA, and P-FA, respectively. All solutions to extract the P in fertilizers were prepared using distilled water. The neutron ammonium citrate plus water solution was prepared using citric acid monohydrate (Reagent grade, Synth, Diadema, Brazil), with the addition of ammonium hydroxide (29% of NH3) (Reagent grade, Synth, Diadema, Brazil); the final solution contained 0.95 mol L−1 of ammonium citrate (C6H11NO7).
Before pyrolysis, CH + APR was mixed with two different Mg sources: MgCl2 (Reagent grade, Synth, Diadema, Brazil) and a low-grade serpentinite rock (Pedras Congonhas, Nova Lima, Brazil). After that, the acidulation of these mixtures was performed using three different inorganic acids: sulfuric acid, (H2SO4—98%), hydrochloric acid (HCl—37%), and nitric acid (HNO3—65%) (Reagents grade, Synth, Diadema, Brazil). In order to compare with the BBF formulated with Mg, a CH + APR mixture without the addition of Mg was prepared. The treatments studied are shown and described in detail in Table 1. The proportion of inorganic acid was based on the H2SO4 amount used to solubilize the low-grade P rocks in the phosphate soluble fertilizer industry, as follows: 0.58:1 (w:w) ratio of H2SO4 to the APR low-grade rock [15]. Based on the stoichiometric ratio used to mix H2SO4 with APR, the amounts of HCl and HNO3 were also determined considering the chemical basis used to evaluate the chemical activation [16], following the same stoichiometry ratio used to solubilize phosphate rocks by different acids [15]. Magnesium was incorporated at a 1:1 mol P:Mg ratio [9]. After the pre-treatment, the mixtures were dried at 60 °C until constant weight. Then, pyrolysis was performed using a muffle furnace in which the temperature was set to 300 °C at a heating rate of 10 °C min−1, maintaining the target temperature for 30 min. The pyrolysis and BBFs production were performed with three replicates.
2.2. BBFs Chemical Characterization
Biochar samples were passed through a 1 mm sieve. The pH of biochar samples was determined in water at a ratio of 1:10 (w:v) through a pH digital Toledo Meter (Mettler-Toledo AG, Schwerzenbach, Switzerland) [23]. After the BBF digestion in sulfuric acid, total nitrogen (N) was determined through the Kjeldahl method [24]. Ammonium (NH4+) and nitrate (NO3−) in biochar was determined by the extraction with 2 mol dm−3 KCl solution (10 cm3 extractant g−1 biochar) [23]. An aliquot of the liquid samples contained the NH4+ and NO3− was added in distillation tube; initially 0.2 g of Magnesium Oxide (MgO) was added to the tube in order to create an alkaline condition. Thus, distillation (TE-0364—Nitrogen distiller, Ourinho, Brazil), followed by titration, was performed [23]. After the determination of NH4+, in sequence, NO3− was quantified after the addition of 0.2 g of the Devarda’s alloy in the same distillation tube, creating an environment capable of reducing and converting NO3− into NH3, and then the distillation procedure, followed by titration, was performed [23]. N loss during pyrolysis was calculated considering the use of nitric acid in the solubilization of APR and its mixture to the coffee waste feedstock in a previous step to the pyrolysis, as follows (Equation (1)):
where DW-Biochar, DW-Biomass, and W-Additive are the dry weight of biochar and biomass, and weight additive (Mg and acid), respectively; N-Biochar, N-Biomass, and N-Additive are, N concentrations in biochar, biomass, and the additive (Mg or inorganic acid), respectively.
The nitric-perchloric acids procedure was used to full digestion of the organic matter and, in sequence, the determination of P-Total and K-Total in the fertilizers digested extracts [25]. P-H2O was extracted by successive washing of 1 g of BBFs using a paper filter with distilled water until reaching a final volume of 250 mL in a volumetric flask [26]. P-CA was extracted by stirring 1 g of fertilizer with 100 mL of CA solution at 2% for 30 min [26]. P-NAC was extracted by boiling 1 g of fertilizer in 50 mL of NAC + H2O solution [26]. Based on the method recommended to determine the availability of P in biochars, the P-FA was also determined; thus, 0.35 g of biochar was mixed with 35 mL of a 2% FA solution, ultrasonicated for 10 min, then shaken for 30 min [23]. P-H2O, P-FA. P-NAC and P-FA were determined using the vanadomolybdate method [27]. To compare the P solubility of BBFs, a P index was calculated, taking into account the ratio of the P soluble fractions (P-H2O, P-FA. P-NAC and P-FA) and the P-Total in each BBF, as follows (Equation (2)):
2.3. Infrared Spectroscopy
Twelve synthetized BBFs samples were scanned in the medium infrared region, and the main peaks in the spectra were identified. Thus, the main bonds, organic functional groups, features, and spectroscopic signatures of BBFs were fully identified and discussed. The FTIR spectrum was obtained using the attenuated total reflectance (ATR) Fourier transform infrared (FTIR) spectroscopy technique in an Agilent® Cary 630 spectrometer (Agilent, Santa Clara, CA, USA). Measurements and spectra were generated in the 4000 to 650 cm−1 wavenumber range with a resolution of 4 cm−1. Pre-processing (normalization) of the dataset was performed for each FTIR spectrum [28]. The main peaks were identified and interpreted according to the infrared libraries and assignments available elsewhere for organic matrices and fertilizers [14,23,29,30,31].
2.4. The Kinetics of P Release
Based on the BBF’s properties and spectroscopy analysis, a cluster analysis was performed; eight BBFs were selected and, together with APR and TSP properties, were evaluated regarding their role in nourishing crops successively grown. We also evaluated variables reported in this study to predict the kinetics of P release using chemometric mathematical equations. BBFs samples produced with CH and serpentinite were not evaluated. The TSP used had 196, 175, 185, 175, and 178 mg kg−1, respectively, of P-Total, P-H2O, P-NAC, and P-FA. Two extraction solutions were chosen to evaluate the kinetics of P release; therefore, water and CA were used at 2% concentration as extractant solutions. The fertilizers were incubated with sand in a mini-lysimeter with periodic leaching of incubated BBFs with distilled water [32] or with a 2% CA solution, hereafter defined as a new method to evaluate the dynamics of P in leachates of the BBFs incubated in sandy substrate. In the mini-lysimeter, 200 mg kg−1 P was added to sand based on the P-Total of each BBF.
Initially, 50 mL of distilled water or CA solution were passed through each fertilizer incubated in the mini-lysimeter, which was the initial leaching time defined as 0 h. Then the volume of water or CA solution used in each leaching and, thus, the leachates, were collected in the following incubation times: 0, 4, 12, 24, 48, 72, 120, 168, 216, and 264 h. Leaching solutions were added to the sand–fertilizer mixtures at a cumulative equivalent rate of 7 cm3 h−1. Phosphorus concentration in leachates was determined by the vanadomolybdate method [27]. The kinetics of P release in water or CA was normalized according to the P-Total of each fertilizer (BBFs) packed and incubated in the mini-lysimeters.
2.5. BBFs Agronomic Performance
To verify the agronomic efficiency of the eight BBFs synthetized over the role played by APR and TSP on crops, maize and, in sequence, Brachiaria grass (Brachiaria brizantha (Hochst. Ex A. Rich.) Stapf), plants were grown in Red (RO) and Yellow (YO) Oxisols with contrasting textures and soil organic matter contents (Table 2). Plants were grown in pots filled with 0.8 kg Oxisol and 300 mg kg−1 P, which was based on the P-Total of each fertilizer. Fertilizers used as sources of P were homogenously mixed with the whole soil stored in each pot. Eleven treatments were studied in a completely randomized design with three replicates for each Oxisol. One treatment in which plants were cultivated without P application (negative control), and ten treatments related to the different P sources, as follows: APR, TSP, B, BMg, BSA, BSAMg, BHA, BHAMg, BNA, and BNAMg were tested. All fertilizers were added to Oxisols only at the beginning of maize cultivation, thus, the brachiaria grass plants were grown only with the residual P added to soil at the maize sowing.
Liming was performed in RO, aiming to raise the pH to 6–6.5 and increase the contents of exchangeable calcium (Ca) and Mg through the use of carbonates (CaCO3 and MgCO3 at the 4:1 ratio) (Reagent grade, Synth, Diadema, Brazil). After mixing soil with carbonates, samples were incubated for 30 days, and soil moisture was kept close to 70% of the soil maximum water-holding capacity (MWHC). In YO, soil acidity correction was not performed because the pH and Ca2+ contents were already at optimum levels for plentiful maize growth. Magnesium in YO was provided at the maize sowing fertilization. According to the difference in total N and K concentration found in BBFs fertilizers, there was a standardization of N and K amount supplied to crops. Thus, in the maize planting, the following nutrients were provided to plants: 100 mg of N and 200 mg of K per kg of soil, and N and K were supplied to maize at the sowing fertilization as NH4NO3 and KCl (Reagent grade, Synth, Diadema, Brazil). In the maize planting fertilization, it was also provided 30.0, 40.0, 0.8, 2.0, 7.3, 0.2, 5.0, and 10.0 mg per kg of soil of Mg, sulfur (S), boron (B), copper (Cu), manganese (Mn), molybdenum (Mo), zinc (Zn), and iron (Fe), respectively, which were supplied to plants with MgSO4·7H2O, H3BO3, CuSO4·5H2O, MnCl2·4H2O, (NH4)6Mo7O24·4H2O, ZnSO4·7H2O and FeCl3·6H2O (Reagent grade, Synth, Diadema, Brazil), respectively.
After the sowing fertilization, soil moisture was maintained at close to 70% MWHC. Five maize seeds were sowed per pot. Five days after planting, thinning was performed to grow only one maize plant per pot. Maize top-dressing fertilization was carried out at 14 and 21 days after planting, adding to soil 125 mg N per kg of soil supplied as NH4NO3 (Reagent grade, Synth, Diadema, Brazil). Maize was grown in the two Oxisols for 30 days based on other studies [32]. After the maize cultivation, in each experimental unit, ten seeds of brachiaria were sowed per pot. Thinning was performed ten days after planting, and two brachiaria grass plants were grown per pot. The Brachiaria planting fertilization was carried out with the supply of 50 mg of N and 100 mg kg of K per kg of soil, which were added to soils as NH4NO3 and KCl (Reagents grade, Synth, Diadema, Brazil). Brachiaria grass top-dressing fertilization was carried out at 15, 25, 35, and 45 days after planting, using 100 mg N per kg of soil as NH4NO3 (Reagent grade, Synth, Diadema, Brazil). To evaluate fertilizer P residual effects in Oxisols, brachiaria, in sequence to maize cultivation, was grown for 55 days.
After 12 h from planting, an aliquot of the soil solution (20 mL) was collected through the Suolo Acqua sampler [34]. The soil solution sampler was inserted in the middle of the pot during its packing with the Oxisol samples. The soil solution samples were filtered through a 0.45 µm pore membrane, and the soil solution pH was determined through a bench pH meter; the concentration of P in soil solution (solution P) was determined by the vanadomolybdate method [27]. After 18 h from maize planting, 30 g samples of whole soil were collected in each experimental unit through a pot soil auger; then, soil samples were dried and sieved (2 mm) and stored for further analysis. In the whole soil, pH was determined at a ratio of 1 g of soil to 2.5 mL of water (soil pH) and available P content by the ion-exchange resin method (P–resin soil test) were determined [33].
After the maize (30 days) and brachiaria (55 days) cultivation, plants were harvested, separated into shoots and roots, and then dried in a laboratory oven at 60 °C until constant weight. The dried biomass was weighed, and shoot (SDM) and root (RDM) dry matter were determined. Total dry matter (TDM) was obtained by adding SDM to RDM. Shoot dry matter was sieved (1 mm), and samples were digested in a mixture of nitric and perchloric acids at a 4:1 ratio; P in the shoot was determined by the molybdenum blue method [35]. According to the SDM and P content in plant tissue of each experimental unit, P accumulated in the shoot (P in the shoot) was calculated as follow (Equation (3)):
2.6. Statistical Analysis
All statistical analysis was carried out using the following R software packages: stats, base, tidyverse, agricolae, factoextra, FactoMineR, pvclust, and corrplot [36,37,38,39,40,41,42]. In the characterization of the twelve BBFs produced, the mean of N losses and soluble P indices were compared by the Duncan test (p < 0.05), after the assumptions of analysis of variance (ANOVA) were attained, and the significant difference was verified (p < 0.05). The whole dataset of pH and P in the whole soil and in its solution, and the maize and brachiaria biomass and P in both crops shoot were also compared by the Duncan test.
The dataset of the kinetics of P release in water or CA was adjusted to different non-linear mathematical models as an output of the relationship between incubation time versus the amount of P released from each fertilizer [9,43,44]. The following mathematical models were adjusted to the P kinetics dataset: Linear model (Equation (4)), Elovich model (Equation (5)), simple exponential model (Equation (6)), power function (Equation (7)), parabolic model (Equation (8)) and hyperbolic model (Equation (9)).
where Pt is the fraction of P released from each fertilizer in the leaching time evaluated; a, initial P content released from each fertilizer; b, P release rate constant for each fertilizer, t, time of release (hour); N0, the maximum amount of P released from fertilizer during the whole kinetics study. The best model was selected based on the highest value of the coefficient of determination (R2), the lowest value of root-mean-square error (RMSE), and the lowest value of the Akaike information criterion (AIC) [45]. Mathematical models fitted to each fertilizer rate of nutrient released over incubation time were compared using a 95% confidence interval and 1000 bootstrap interactions.
The synthetized BBFs were grouped in two ways, considering their chemical attributes or their infrared spectral signature in the middle wavenumber range. Initially, the dataset was scaled, and the cluster analysis was based on the matrix of Euclidean distances among samples, using the Ward’s algorithm hierarchical clustering [46]. Each dendrogram branch was calculated using the bootstrap approach. To determine the relationship between the chemical properties of the synthesized BBFs (excluding the dataset of BBFs produced with serpentinite) and the P nutrition status of maize and brachiaria grass plants grown in the two contrasting Oxisols. Initially, it was removed from the dataset. The results related to plants fertilized with TSP, APR, and those non-fertilized with P; using this new and pre-processed dataset, the Pearson’s correlation matrix analysis was performed.
3. Results
3.1. BBFs Chemical Properties
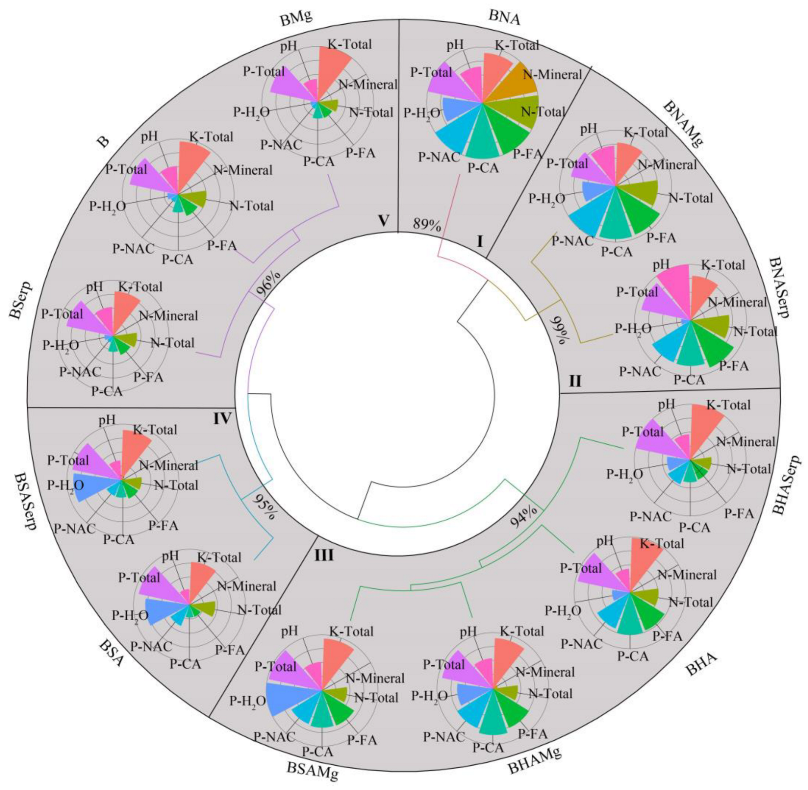
Fertilizer pH and NPK pools are shown in the Table A1. During pyrolysis, a higher loss of N occurred when nitric acid was used in pre-treatment of APR, and most of N (~88.5%) mixed with the charred matrices volatilized during pyrolysis (Table A2). The addition of MgCl2 increased N losses during pyrolysis in non-acidified and hydrochloric acid pre-treated feedstocks. According to pH and NPK pools, the cluster analysis formed five categories (clusters) of fertilizers (Figure 1). The BNA formed the group with intermediate values of P-H2O and higher values of P-CA, P-NAC, and P-FA, besides having a high value of N-Total and N-mineral. The second group was formed by BNAMg and BNASerp, which had properties similar to group I; however, the main difference in BBFs was their lower N-mineral over fertilizers from the group I. Group III was formed by BHASerp, BHA, BHAMg, and BSAMg. The BBFs of group III over other BBFs had intermediate P-CA, P-FA, and P-NAC and lower N-Total. The main properties of group IV enclosing the BSASerp and BSA were their higher P-H2O over other BBFs; however, over other BBFs produced through the acidulation of apatite, the fertilizers enclosed in this specific group had a lower proportion of P-CA, P-FA, and P-NAC. BBFs enclosed in group V had low P-H2O, P-CA, P-FA, and P-NAC (B, BMg, and BSerp).
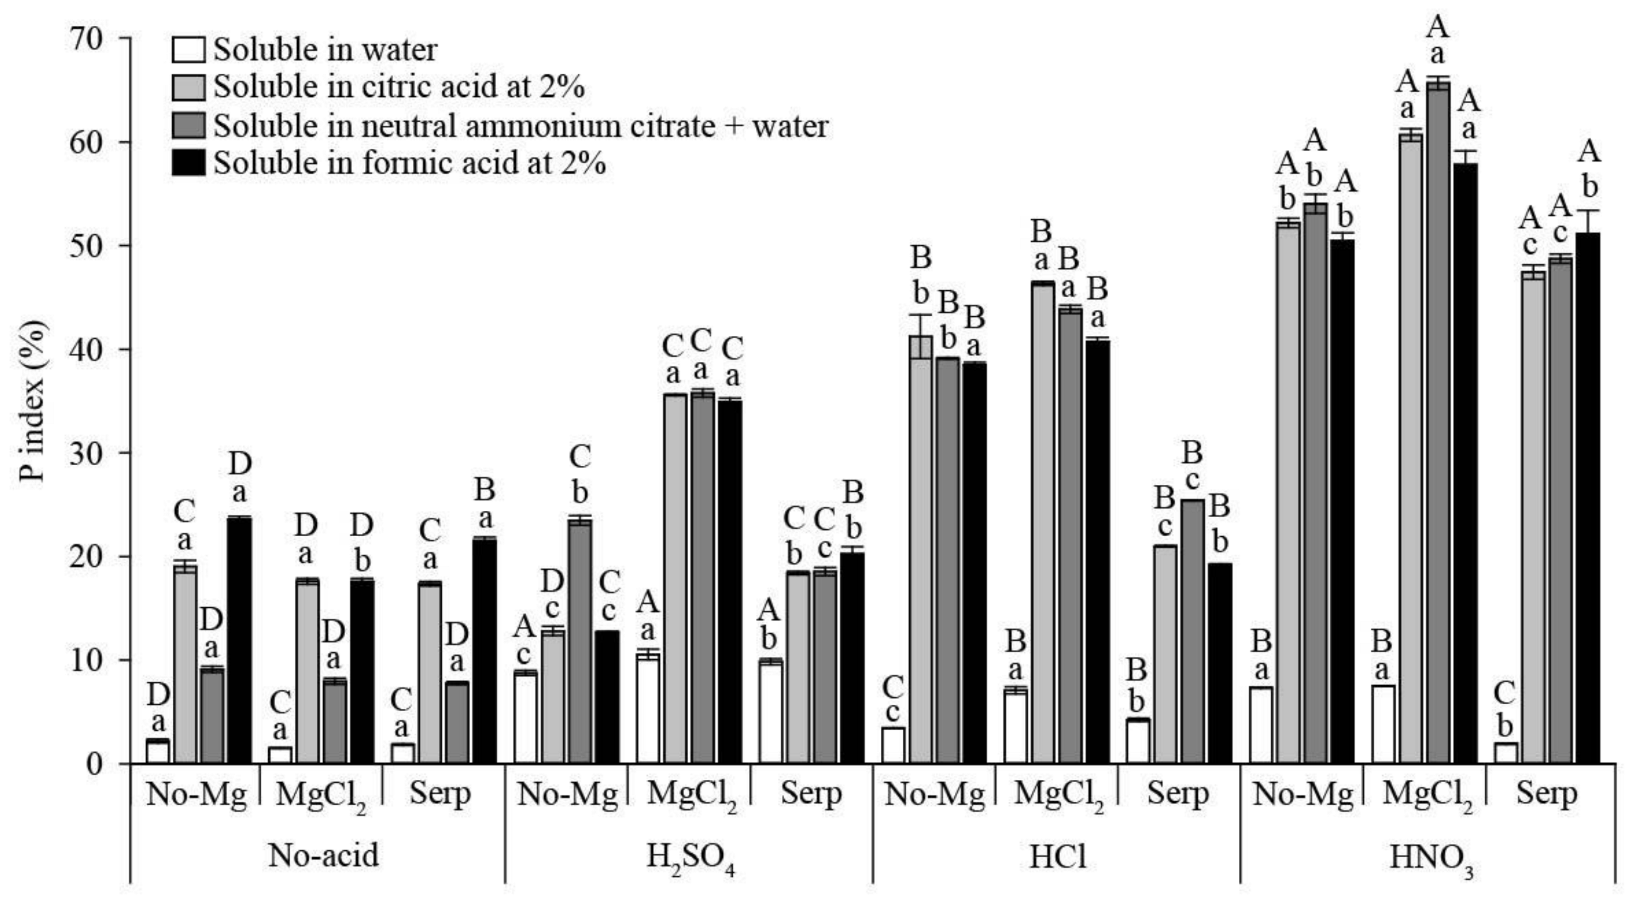
The fertilizers’ P solubility indices (water, CA, FA, and NAC) related to concentration of P soluble by different extractants, and related to the P-Total of the pertinent BBF was greater for the nitric acid-based BBFs, followed by the samples formulated with the hydrochloride acid and sulfuric acids (Figure 2). Compared with the exclusive use of nitric, hydrochloride, or sulfuric acids, Mg supplied as magnesium chloride increased all fertilizer-P solubility indices. Thus, the use of serpentinite as a source of Mg was ineffective in increasing fertilizer-P solubility indices. Among the BBFs, a higher fertilizer P-H2O was verified when sulfuric acid was mixed with coffee husk and MgCl2 before the pyrolysis of the BSAMg P source.
3.2. Infrared Spectroscopy
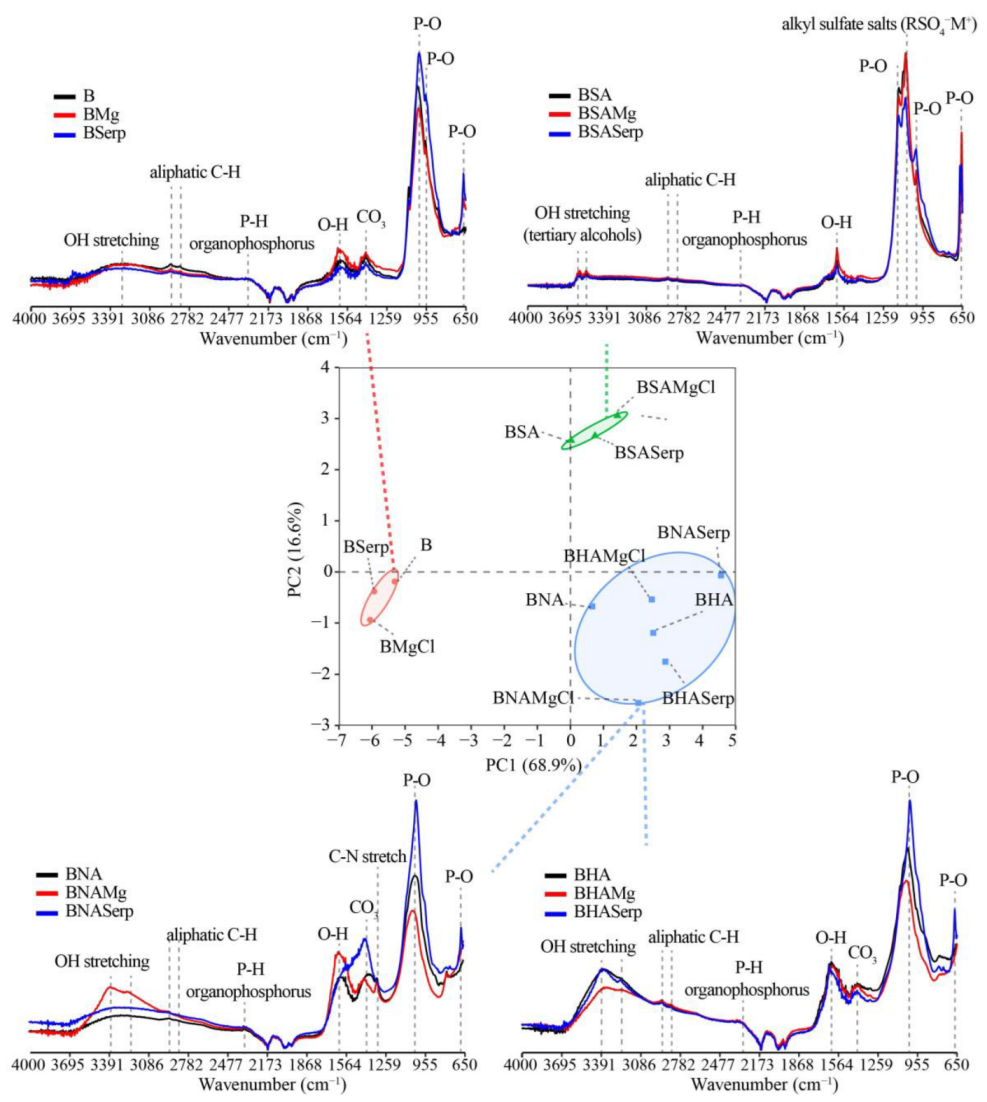
The Mg sources used in BBF synthesis did not generate new peaks in the FTIR spectra (Figure 3). The OH stretching was found for all BBFs at different IR spectra, in the IR range of 3400 to 3200 cm−1 for the non-acidified fertilizers, at 3380 and 3250 cm−1 for hydrochloric and nitric acids-derived BBFs, and at 3620 and 3550 cm−1 for sulfuric acid-derived BBFs; for sulfuric acid-derived biochars, the OH stretching was related to tertiary alcohols. Aliphatic C groups were recorded at 2915 and 2850 cm−1 for all BBFs. OH bonds were also verified for all BBFs at 1615, 1620, 1625, and 1640 cm−1 to non-acidified, sulfuric, hydrochloric, and nitric acid-derived BBFs, respectively.
The P-H organophosphorus groups were found at 2353 cm−1 for all BBFs. The P-O groups were recorded in the FTIR spectra for non-acidified (1025, 960, and 670 cm−1), sulfuric (1150, 960, and 670 cm−1), hydrochloric (1040 and 670 cm−1), and nitric-derived (1040 and 670 cm−1) biochars. Peaks related to the carbonate (CO3) groups were found in non-acidified (1420 cm−1), hydrochloric (1425 cm−1), and nitric acids-based BBFs. When the sulfuric acid was used to treat coffee and produce BBFs, the charred matrices had a peak at 1080 cm−1, which is related to RSO4+M alkyl sulfate salts. When nitric acid was used previous to pyrolysis, the formulated BBFs showed a peak at 1350 cm−1, which is assigned to the C-N stretch. Based on the FTIR spectra, three groups emerged regarding the type of acid employed before the pyrolysis and synthesis of BBFs. According to BBF FTIR spectral signatures and BBF clusters depicted the PCA diagram (Figure 3), three groups of BBFs were formed: group I (B, BMg, and BSerp), group II (BSA, BSAMg, and BSASerp), and group III (BNA, BNAMg, BNASerp, BHA, BHAMg, and BHASerp).
3.3. The Kinetics of P Release
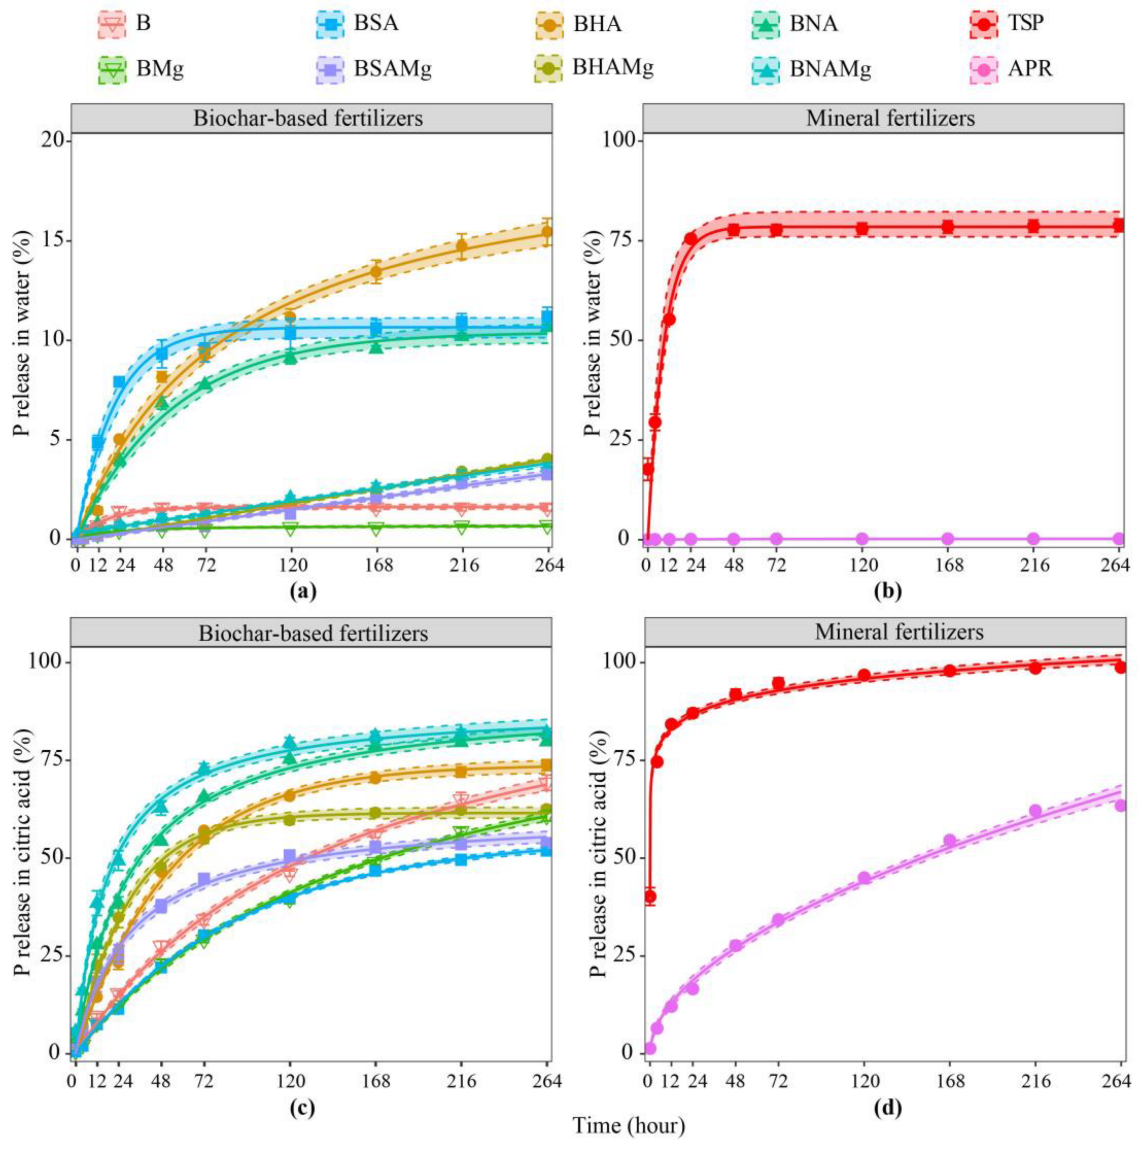
The mathematical PLS models adjusted to the BBF-P released over time (kinetics study) were based on the lowest values of RMSE, the highest values of the coefficient of determination, and the lowest values of AIC (Table A3 and Table A4). For the P released in water, the exponential model was the one that best fit to P released by TSP, B, BSA, and BNA, while the linear model explained most of the variation of P released by BSAMg, BHAMg, and BNAMg. The hyperbolic model fitted and explained most of the P released by APR, BMg and BHA. When kinetics of P release was performed using the CA solution, the power model was the one that best fit to TSP and APR P in leachates, while the hyperbolic model fitted better to the P released by B, BMg, BSAMg, BNA, and BNAMg, and the exponential model was the best one to explain the variation of P released from BSA, BHA, and BHAMg.
The non-acidified fertilizers (B and BMg) had less P release in the water among BBFs (Figure 4a). When MgCl2 was added during the BBF synthesis, the P release in water decreased, compared with the P in leachates of BBFs formulated without Mg, regardless of the strong acid used in the apatite acidulation. Considering the P released up to 264 h, 3.3, 4.1, and 3.6% of P-Total in BBFs, were released by BSAMg, BHAMg, and BNAMg, respectively. Without the use of Mg, P release up to 36 h was similar for BNA and BHA. After 36 h, BHA had a higher amount of P released in water than BNA, although from 72 to 96 h, over BNA, BHA had similar accumulated amounts released P in leachates. After 96 h of leachate sampling, BHA releases higher amounts of P than the other BBFs. After 156 h, the amounts of P released by BSA and BNA were similar and lower than those determined for BHA samples.
The TSP had a higher and faster release of P in water than the BBFs; about 76% of the P-Total in TSP was released up to 24 h (Figure 4b). After 24 h, the release of P from the TSP tends to stabilize, reaching values of 78.9% of P-Total released in water at the end of the kinetics study. The release of P in the water leachates of APR was the lowest among all P sources, thus, it was inferior to 0.3% of APR P-Total (Figure 4b). At 264 h of the kinetics of P release in water, the amounts of P released were: 1.6, 0.7, 11.2, 3.3, 15.5, 4.1, 10.7, 3.6, 0.2, and 78.9% of the P-Total for B, BMg, BSA, BSAMg, BHA, BHAMg, BNA, BNAMg, AR and TSP, respectively.
When the kinetics of P release was performed using CA solution (Figure 4c,d), the pattern of P release was different among BBFs. Amounts of P released in CA increased when nitric acid was used previously in the BBFs production, regardless of the Mg addition (Figure 4c). A higher initial P release was found for BNAMg, whereas, after 168 h, the P release by this P source was similar to those P in leachates of BNA and BNAMg (Figure 4c). A high initial P release was verified due to Mg addition when the hydrochloride acid was used to produce BBFs. However, after 72 h of incubation, the amounts of P released by BHA were higher than BHAMg. The lowest released amounts were determined after 264 h for sulfuric acid-derived BBFs. Initially, the Mg addition increased the P released; however, up to 264 h, the amounts of P released by BSA and BSAMg were similar. Surprisingly, the kinetics of P release in water, when CA was used, P released was higher for B, BMg, and APR over the other P sources. Phosphorus released in CA by TSP was higher and faster than P amounts released by BBFs, reaching values close to 92% at the 48h leaching time, while up to 264 h, the P released by TSP accounted for 99% of P-Total in this soluble fertilizer (Figure 4d). Comparing the confidence interval of models (95%) up to 264 h, the amounts of P released in CA followed this decreasing order: TSP (99.0%) > BNAMg (79.8%) = BNA (82.0%) > BHA (73.8%) > B (69.3%) = FA (63.4%) > BHAMg (62.6%) = BMg (60.9%) > BSAMg (53.9%) = BSA (51.9%).
3.4. BBFs Agronomic Efficiency: Maize Nutrition and Growth
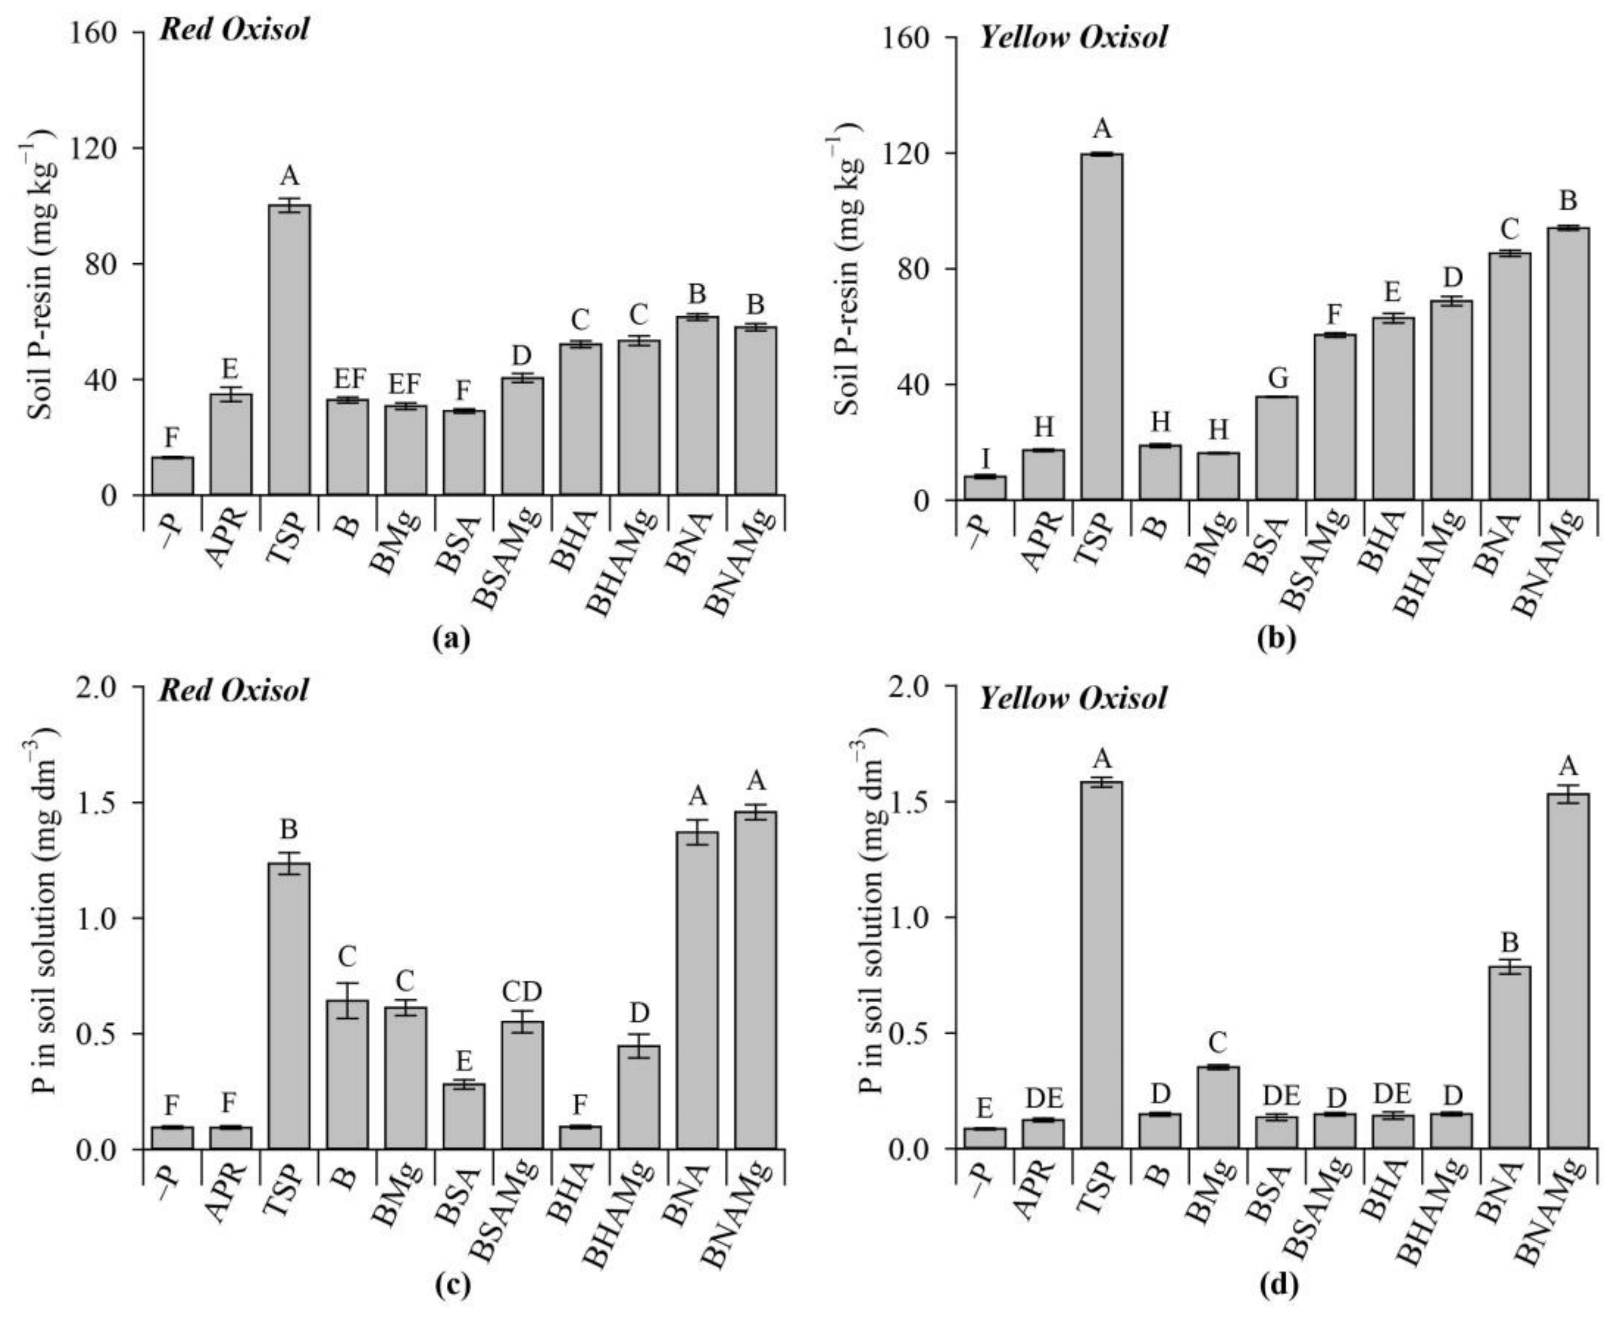
The P availability in the whole soil evaluated by the resin soil test was higher for TSP over BBFs-treated Oxisols (Figure 5a,b). In RO, among BBFs, the soil P-resin followed this decreasing order: BNA = BNAMg > BHAMg = BHAMg > BSAMg. Compared with TSP, there was a reduction in soil P-resin of approximately 42, 39, 47, 48 and 60% for BNA, BNAMg, BHAMg, BHAMg, and BSAMg, respectively. B, BMg, and BA did not increase the soil P-resin, compared to the APR-treated samples for maize grown in RO (Figure 5a). In YO, the acidulation of apatite previously to the pyrolysis increased the soil P-resin over APR-treated soil samples as follows: BNAMg > BNA > BHAMg > BHA > BSAMg > BSA. Overall, the P resin levels in the YO samples treated with BBFs were lower than the values reported for RO samples (Figure 5b). In both Oxisols, on average, over TSP, the reduction of soil P-resin was 21, 29, 42, 47, 52, and 70% for BNAMg > BNA > BHAMg > BHA > BSAMg > BSA-treated samples, respectively.
The P in soil solution in RO was higher for BNAMg and BNA over TSP, increasing ~14.5% (Figure 5c). The other BBFs reduced the solution P over TSP in the treated RO samples. BBFs-treated samples had a lower P in RO solution, compared with TSP-treated samples. B, BMg, BSAMg, BHAMg, and BSA increased the solution P over the addition of APR to RO. When maize was cultivated in YO, TSP and BNAMg had a higher soil solution P than the other BBFs and APR as well (Figure 5d). Compared to APR, the BNA, BMg, BHAMg, BSAMg, and B increased the soil solution P, although they were lower than solution P of soils treated with TSP. The results of the pH of whole soil and its solution for maize are contained in Table A5.
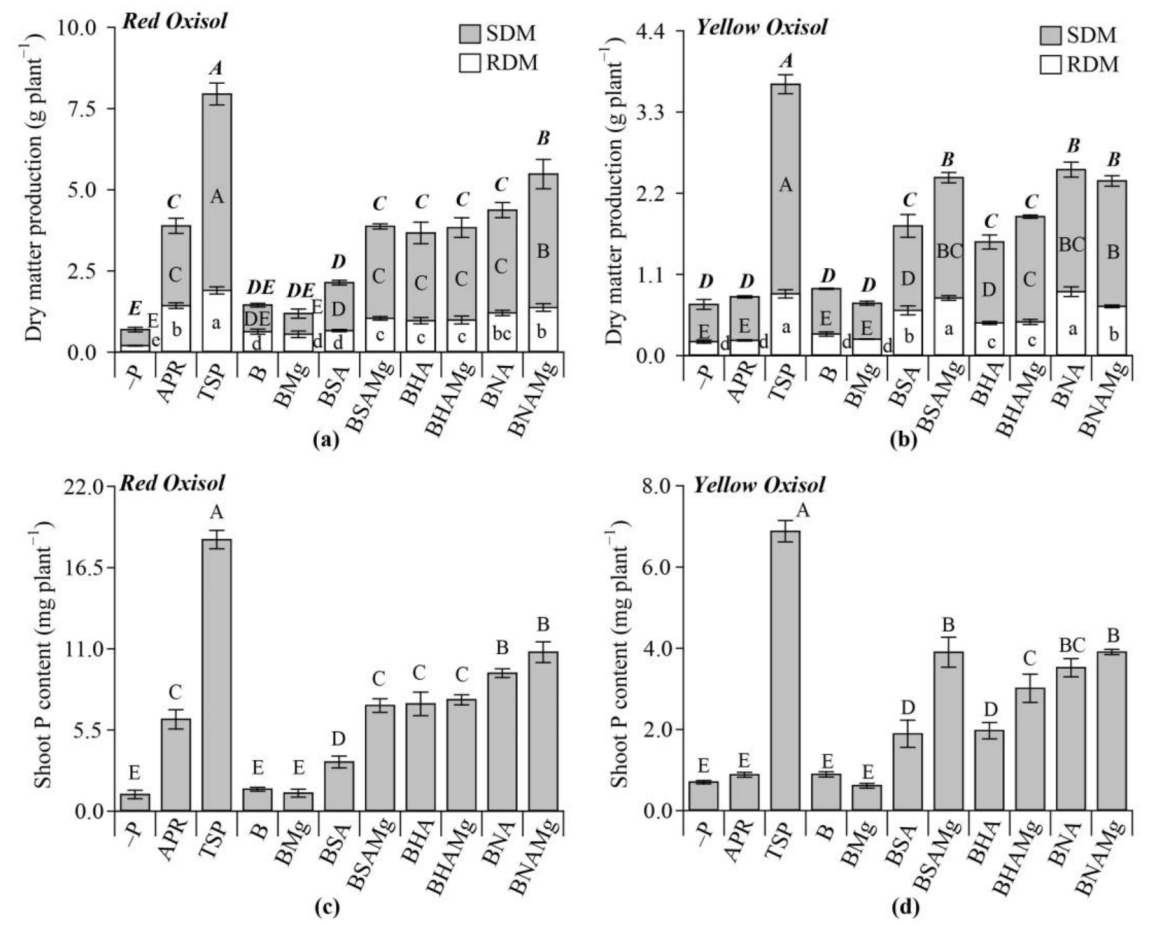
Considering the recommendation of P to crops based on the fertilizer P-Total, TSP was the source of P that produced the highest maize biomass (SDM, RDM, and TDM), in both Oxisols (Figure 6a,b). Among BBFs used to treat RO, the BNAMg leads to a higher SDM and TDM than APR (Figure 6a). The P in the shoot of maize grown in RO was higher for plants fertilized with nitric acid-derived BBFs than APR, regardless of Mg addition via MgCl2 (BNA and BNAMg) (Figure 6c). Overall, the maize biomass was lower for BBFs than TSP-fertilized plants. Over TSP-fertilized plants, on average, 51 and 59% less P was accumulated in the maize shoot fertilized with BNA and BNAMg. Compared with APR added to RO, the BSAMg, BHA, and BHAMg show similar values, and B, BMg, and BSA decreased the P accumulated in the maize shoot. In YO, the soil with the lowest OM content, BSA, BSAMg, BHA, BHAMg, BNA, and BNAMg had a higher SDM, RDM, TDM, and P in maize shoot that the other BBFs, although the maize growth was higher for TSP-fertilized plants (Figure 6b). Thus, compared to TSP, the BBFs reduced the P in the maize shoot, on average, reductions of ~57, 44, 51, and 57% for P accumulated by maize plants over the P in the shoot of TSP-fertilized plants, respectively, for BSAMg, BHAMg, BNA, and BNAMg (Figure 6d).
3.5. BBFs P Residual Effect on Brachiaria Growth
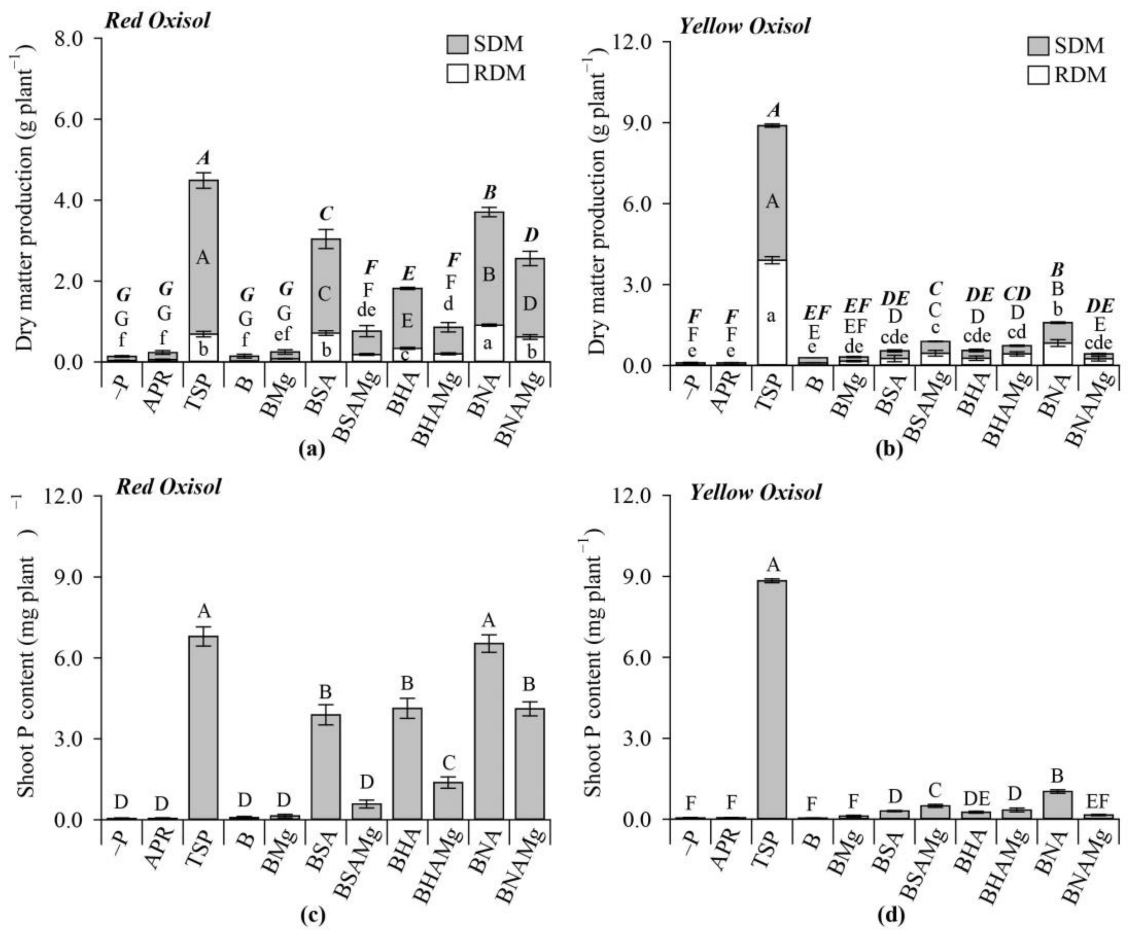
In RO, evaluating the residual effect of BBFs on the soil P-resin, BHA, BHAMg, BNA, and BNAMg had a higher soil P-resin than TSP (Figure 7a). Thus, soil P-resin increased ~40, 40, 26, and 36% for BHA, BHAMg, BNA, and BNAMg-treated soils (Figure 7a). The residual effect of BSA and TSP was similar on RO P-resin. Among the treatments with the use of P to fertilize maize plants grown in RO, the residual soil P-resin for brachiaria grass was lower for APR, B, and BMg over the other BBFs. TSP had a higher residual soil P-resin for brachiaria grass cultivated in YO, followed by BNAMg = BNA > BHAMg > BHA = BSAMg > BSA, with a reduction of 25, 28, 38, 43, 45, and 64%, respectively, for P-resin in the BNAMg, BNA, BHAMg, BHA, BSAMg and BSA-treated soils, compared to TSP (Figure 7b). A higher residual effect of BBF on the P in the RO solution was verified for BNAMg, BNA, and BSAMg over TSP, with an increase In P-solution for BNA and BNAMg of ~87% over TSP (Figure 7c). In YO, the BSAMg, BSA, BNA, and BNAMg increased ~60% the of P in soil solution over TSP-treated samples (Figure 7d). Besides, the results of the pH of whole soil and its solution for brachiaria grass cultivation are contained in Table A5.
Despite the little effect on maize growth, the BSA, BNA, and BNAMg showed positive residual effects on soil P available (resin soil test) to brachiaria biomass production (Figure 8). In RO, BSA, BNA, and BNAMg lead to a lower SDM and TDM than TSP, reaching 51–74% and 61–96%, respectively, of SDM and TDM produce by maize plants fertilized with TSP (Figure 8a). However, the RDM was similar to BSA and BNAMg, and higher for BNA-fertilizer plants (an increase of ~32%) than the TSP-fertilized maize grown in RO.
When P in brachiaria shoot was evaluated for plants grown in RO, plant growth and biomass were similar for BNA and TSP fertilizers (Figure 8c). BSA, BHA, and BNAMg increased the P in brachiaria shoot over APR applied to RO, reaching values of ~57, 61, and 61% for BSA, BHA, and BNAMg, respectively, over TSP-fertilized plants. In YO, the brachiaria biomass production (SDM, RDM, and TDM) and P accumulated in brachiaria shoot of BBFs and APR-fertilized plants were lower, compared with TSP-treated plants (Figure 8b). The BNA leads to a higher maize biomass production and P in maize shoot, compared to the other BBFs (Figure 8d), which only reached 15, 21, 18 and 21% of SDM, RDM, TDM and P, respectively, in shoot verified in maize plants fertilized with TSP.
3.6. Correlation Matrix Analysis
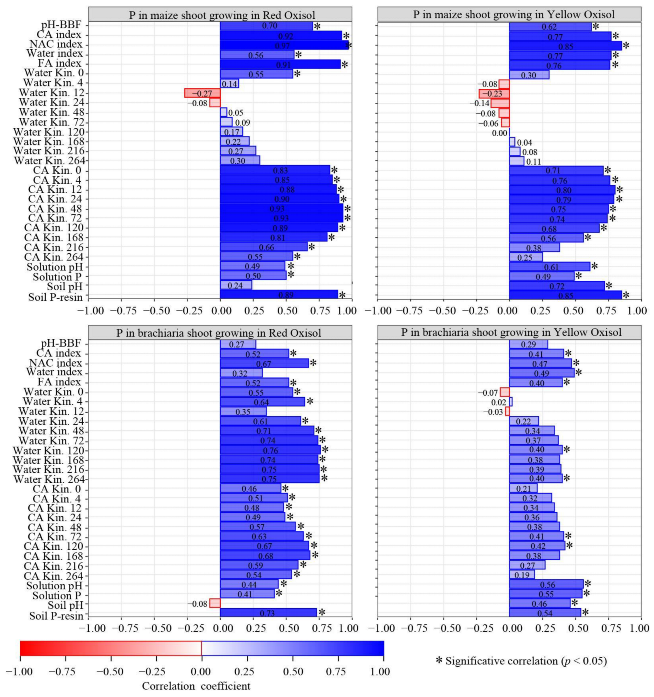
When maize was grown in RO and YO, significant correlations were found between P in maize shoot and the pH of BBFs, as well as with the soluble P indices (P-CA, P-H2O, P-NAC, and P-FA) (Figure 9). Higher correlation coefficients (r) for BBF’s chemical properties were observed between P-NAC and P accumulated in maize shoot, with r equal to 0.97 and 0.85 for RO and YO, respectively. The kinetics of P release in water was not correlated with P in maize shoot, for both Oxisols. Amounts of P released in the kinetics study using a 2% CA solution positively correlated with P in maize shoot, and a higher coefficient of correlation was observed between P in the shoot and the amount of P released up to 48–72 h for RO (r: 0.93), as well as for P in shoot and P released between 12–24 h in the YO leachates (r: 0.79–0.80). An increase in soil solution pH, soil solution P, and soil P-resin due to BBF application positively correlated with P in maize shoot for both Oxisols. The pH explained most of P in maize shoot in YO. The highest coefficient of correlation were verified for soil P-resin and P in maize shoot (r = 0.85–0.89).
When brachiaria was grown after maize, the same significant correlations were found for P in brachiaria grass shoot and fertilizer P-CA, P-NAC, and P-FA soluble indices (Figure 9). The relationship between the water-soluble P fertilizer index and P in brachiaria shoot was observed only for plants grown in YO. Coefficients of correlation between soluble P indices and P in the shoot were lower for brachiaria than maize plants. For the brachiaria grown in RO, the kinetics of P release in water or CA correlated positively with P in the plant shoot, with a higher correlation of P with the amounts of P released in water. The P in brachiaria shoot only positively correlated with the amounts of P released in water up to 120 and 264 h. For P in brachiaria shoot, P released in CA between 72–120 h was the best index to explain the P in brachiaria grass shoot. An increase in soil solution pH, solution P, and soil P-resin also positively correlated with P in maize shoot in both Oxisols, while the soil pH explained most of the variation in P in the maize shoot for plants grown in YO. A positive correlation coefficient (r) was observed between soil P-resin and P in maize shoot, whilst, in this specific case, r was reduced to 0.75 for plants grown in RO and 0.54 for YO-cultivated plants.
4. Discussion
4.1. BBFs Chemical and Spectroscopic Characterization
The pH of BBFs varied from 2.9 to 10.3 (Table A1). The fertilizer pH is an important factor that controls its solubilization and the reactions of nutrients with soil components in the soil–fertilizer interface [47]. Based on the P index, the type of BBFs which was produced without the apatite acidulation had a low proportion of water-soluble P in relation to P-Total in the APR fertilizer (Figure 2). Due to the low natural solubility of P-low grade rocks, phosphate of igneous rocks are commonly converted into highly soluble mineral P fertilizers through the acidulation process using sulfuric and phosphoric acids, which take a long time for industries to process the final fertilizer besides having a high cost with the generation of byproducts such as gypsum [3]. However, the addition of a bioactive organic matrix during the synthesis of fertilizers can increase the agronomic performance of fertilizers by generating BBFs with P in complexed forms [4].
Based on the same stoichiometry (mol of acid: g of P-APR), the nitric and hydrochloric acids lead to a higher P solubilization of APR, compared with the use of sulfuric acid for the same purpose (Figure 2). This effect occurs because P-apatite rock dissolves readily when nitric acid is added to the mixture, as it was already demonstrated in the nitrophosphate production route [15]. When sulfuric acid is mixed with P-low grade phosphate rocks, initially, there is a fast reaction, with subsequent formation of phosphoric acid (H3PO4) and calcium sulfate (CaSO4). In sequence, at a slower rate, the phosphoric acid formed in the first step of the apatite solubilization reacts again with the P-rock, forming monocalcium phosphate (Ca(H2PO4)2). Although the reactions occur simultaneously, the second step is slow and occurs after several days or weeks (2–6 weeks), thus requiring the curing process for production of P fertilizers [15]. In this work, during the BBF synthesis, the curing process was excluded since the reaction of apatite with the strong acids is instantaneous, which explains a lower proportion of P-CA, P-NAC, and P-FA when the sulfuric acid was used in the apatite acidulation (Table A1).
Although the main effects of inorganic acids on the P solubility index of BBFs, during the apatite acidulation step, the Mg addition promoted changes in fertilizer P solubility, and this effect depends on the Mg source used (MgCl2 or serpentinite) (Figure 2). Serpentinite did not promote changes in the BBF’s P solubility indices. Conversely, the use of Mg as magnesium chloride is a true input to improve the agronomic performance of BBFs. Without the apatite acidulation, the BBF produced with serpentinite or with no Mg, or blended with magnesium chloride were enclosed in a unique cluster (Figure 1).
Comparing the two Mg sources, the Mg provided via serpentinite over the magnesium chloride reduced the proportion of P-H2O and CA solutions based on the fertilizer P availability indices in water, CA, NAC, and FA (Figure 2). The fertilizer P-H2O decreased when serpentinite was used as an additive previously to pyrolysis, regardless of the type of acid used in the apatite acidulation. Serpentinite is a low-grade Mg source, chemically stable and with Mg insoluble forms. Thus, it needs to be solubilized to insoluble Mg be converted into soluble forms more prone to chemically react with other chemical compounds and phosphate ions [48,49]. Thus, part of the acid was consumed in the phosphate rock solubilization, while the remaining strong acid, possibly, reacted and partially promoted the solubilization of serpentinite, which could explain the incompleteness of the APR.
When Mg was supplied as magnesium chloride, which is soluble, the added acid could be used to solubilize P derived from APR. Therefore, the MgCl2 is more effective than serpentinite in increasing the fertilizers of P soluble in CA, NAC, and FA (Figure 2). The Mg added via magnesium chloride also increases the BBFs P-H2O when sulfuric and hydrochloride acids were used in the apatite solubilization. Magnesium added during the synthesis of P-biochar reacts with phosphates, forming magnesium pyrophosphate (Mg2P2O7) or struvite (NH4MgPO4.6H2O), which are chemical compounds with low solubility in water but high solubility in other extractant solutions, such as the citric acid solution [9,18,50]. Citric acid is an extractor that simulates the capacity of roots to acquire P [51] with a high potential to be used in studies related to the kinetics of P release by fertilizers. The Mg addition reduced the P-H2O leachates (P kinetics study). Overall, P released in CA leachates increased regardless of the type of acid used in the apatite acidulation (Figure 4).
The main effects observed due to the type of acid used in the apatite acidulation process were also confirmed by the clustering (PCA diagram) of the BBFs regarding their FTIR spectral signatures (Figure 3). The hydrochloric and nitric acids were the most effective in the apatite acidulation, considering that they were enclosed in the same cluster based on the BBF-FTIR spectra dataset. The group formed by hydrochloric and nitric acids had similarities regarding the presence in the matrices of some functional groups as follows: higher presence of OH groups, more prominent peaks of CO3, and reduction in the intensity of P-O groups; in fact, the P-O group decreased in the following order for the addition or not of Mg: serpentinite > no Mg > MgCl2. In addition, the hydrochloric and nitric acid clusters had bands related to aliphatic C-H groups over the non-acidulation biochar or the charred matrices acidulated with sulfuric acid.
The differences in OH stretching were verified by the cluster analysis, considering that the groups recorded in FTIR spectra at 3400–3200 cm−1 for the non-acidified fertilizer, while the hydrochloric and nitric acids-derived BBFs bands recorded at 3500–3250 cm−1 are related to OH stretching vibration in phenolic groups [52]. The peak of OH stretching verified when the sulfuric acid used in the apatite acidulation was related to tertiary alcohols (3620 and 3550 cm−1) [30], and OH stretching from tertiary alcohols over phenolic groups, which contributed to the increase in fertilizer P solubility in water. The CO3 groups found in BBFs are related to the IR assignment peaks already found in raw APR, and C-aliphatic groups found in all BBFs are derived from organic material (coffee husk) used in the biochar production [14]. The maintenance or increase in C-aliphatic groups is a new property of organomineral fertilizers, and its presence indicates a possible biostimulant role of organomineral fertilizers on plants. The role of C-aliphatic groups as plant biostimulants in response to the use of humic materials (humic acid) promotes stimulation of the plant cell plasma membrane H+-ATPase [53], a proton pump that has an important role in the process that triggers plant nutrient uptake [54]. Among BBFs, those produced with the acidification of apatite with nitric acid may have a more important biostimulant role, due to the higher intensity of C-aliphatic groups in the respective FTIR spectra.
Part of the P from APR was incorporated into the biochar matrix as observed by the formation of P-H organophosphorus in BBFs, with peaks, already described, at 2353 cm−1 [31] and not found in the coffee husk feedstock [14]. The P-O peaks at 960 cm−1 were verified in the non-acidified BBFs and the BBFs treated sulfuric acid. The reduction in the intensity of P-O peaks at 1040 cm−1 may be related to the lower proportions of soluble P indices determined for the BBFs. Thus, the presence of P-O groups in BBFs is related to a lower proportion of soluble P in CA, NAC and FA (Figure 2 and Figure 3).
With the use of sulfuric acid in the apatite acidulation process, the BBFs produced had a specific spectral signature when compared to other BBFs. In this direction, peaks related to alkyl sulfate salts (RSO4−M) mirror the interaction of organic radicals from coffee husks with the S from sulfuric acid and Ca from the APR (Ca5(PO4)3(Cl/F/OH)). Thus, new C-SO4Ca compounds were produced, which, together with the peaks of OH from tertiary alcohols, contributed to the increase in fertilizer P-H2O over the other BBFs. A higher loss of N was observed when the nitric acid was used in the apatite acidulation, compared to the sulfuric acid and HCl. However, some part of N from nitric acid was incorporated into the biochar structure, which was demonstrated by the presence of C-N stretch in the BNA, BNA Mg, and BNAMg FTIR-spectra (Figure 3).
4.2. BBFs Agronomic Efficiency as Related toP Pools and Kinetics of P Release
Based on the cluster analysis, the following BBFs were chosen to fertilize the maize-brachiaria succession: B, BMg, BSA, BSAMg, BHA, BHAMg, BNA, and BNAMg, which were compared to the TSP and APR. A higher biomass production was observed in the treatments of fertilizers with greater proportions of soluble P-NAC, P-CA, and P-FA (Figure 6 and Figure 8). It is reported that the NAC + water solution is able to efficiently simulate the process of P acquisition by plants [23,51,55,56]. When only BBFs were used to fertilize plants, a higher correlation between P soluble in NAC and P in maize and brachiaria shoots (in both Oxisols) was reported, compared with those relations verified for P soluble in CA, FA, or in water (Figure 9). Evaluating seventy-nine P-rich wastes and fertilizers added to three soils (alkaline and two acid soils) cultivated with rye (Secale cereale L.), it was verified that the fertilizer P-NAC was related with the plant biomass production, with a correlation coefficient of 0.52 for the acid soil, with 294 g kg−1 clay, and 0.19 for the acid soil with 101 g kg−1 clay [56]. However, due to the high diversity of fertilizers in Duboc’s study [56], a better statistical approaches would be made by splitting the fertilizers into groups with common and specific properties.
The capacity of chemical extractants in determining the P pools in different matrices depends on the type of fertilizer analyzed, i.e., P from rock phosphates can be partially solubilized with citric and formic acids. However, the NAC extraction involves the strong cation complexation, mainly those prone to complex Ca and Fe, thus, inducing P co-dissolution [55,56]. In biochar, the FA extraction solution with the simultaneous use of the ultrasonication process in the P extraction is the recommended biochar test to extract P available to crops because the ultrasonication improves the wetting of the biochar, allowing, in some cases, a more efficient extraction of P of charred matrices [23]. Overall, the fertilizer P-H2O pool mirrors in soil the P readily available for plants [26].
Despite the high correlation of NP-AC + H2O and P uptake by maize and brachiaria in this study, the use of the NAC solution is limited for the evaluation of the dynamics of P release due to the pre-heating samples as one of the phase of the P extraction by the NAC solution [26,56]. Thus, the use of CA is an alternative to extract P in kinetics of soluble phosphate over time, given its significant correlation with P uptake by maize and brachiaria plants (Figure 9). The P release in CA had a high correlation with the accumulated amounts of P in maize and Brachiaria plants grown in both Oxisols (Figure 9), being the 48–72 and 12–24 h the bet incubation time to evaluate the P released and uptake by maize cultivated in RO and YO, respectively, while the 120 or 264, and 72–120 h incubation time was the best to infer the P available for brachiaria grass cultivated in RO and YO, respectively. Thus, compared to the use of water, the use of citric acid as an eluent in kinetics P studies is a reliable and effective agronomic method to study the rate of P released from BBFs over time.
Other extractant solutions such as the 0.01 M CaCl2 with the pH adjusted to values > 6 with 0.1 M NaOH are indicated to simulate the P solubility of mineral fertilizer used in the fertilization of plants grown in temperate climate soils in order to represent the ionic strength conditions of the soil solution of colder regions [20]. However, there is no established research on the kinetics of P release from fertilizers in weathered tropical soils and BBFs-treated soils. In BBFs, both mineral and organic P chemical species and organic groups are associated with charred matrices. Thus, due to the potential exudation of citric acid by roots [22], CA it is a potential extractor to be employed in kinetics of P release studies, mainly for BBFs-treated samples due to the greater practicality and lower cost of CA solutions in estimating the P accumulated by maize and brachiaria grass plants demonstrated in this study (Figure 9). The efficiency of fertilizer P soluble in CA in anticipating the P uptake by ryegrass plants was already reported [11].
In both kinetics of P release performed (with the use of water or CA), it was verified that TSP release P in higher amounts and faster way than BBFs (Figure 4). The results reported in this study are in line with those found by Lustosa Filho et al. [9] when comparing the kinetics of P release in the water of P-biochar over TSP. The gradual release is a property of fertilizers that reduces P loss, as it happens with P-BBFs with more gradual P release, which contributes to increase the availability of P in soil [17,19]. In the kinetics of P release from BBFs, it was observed that the acidulation process lead to a greater amount of P in leachates of BBFs without Mg. Adding Mg + apatite acidulation promoted a slower and lower P release in water in comparison to the P released by the acidulated BBFs blended with magnesium chloride. The slow P release of biochar produced by adding Mg before pyrolysis is controlled by the slow dissolution of Mg2P2O7 crystals formed during pyrolysis and due to the gradual release of P from struvite [18,50,57]. Conversely, the use of CA leads to the same amount of P released by Mg-dopped and no-Mg blended BBFs produced with the use of nitric and sulfuric acids in the apatite solubilization, whilst the hydrochloric acid-derived biochars were the ones with the lowest rate of P release over the other acids used in the apatite solubilization.
The Mg addition over non-Mg enriched biochars slowed the release of P in CA leachates (Figure 4). When Mg was added during the production of BBFs with poultry litter (PL) and TSP, or phosphoric acid (H3PO4), or monoammonium phosphate (MAP), the P released in water was lower, reducing the P release from 99.8 to 31.6, 86.0 to 28.9% and 37.0% to 9.1%, respectively, Mg blended over non-Mg fertilizers obtained with the following combination: PLxTSP, PLx H3PO4 and PLxMAP [9]. The rapid release of P from fertilizer may promote high rates of phosphate adsorption in Fe and Al oxides of high fixing P tropical soils. In Brazil, a smart approach to increase the fertilizer efficiency and recuperation in soils is the use of P fertilizers that combine high levels of P in extractant solution that simulate P uptake capacity of the root, such as the NAC solution, with the lowest levels of fertilizer P-H2O [1,14,58]. The effect is reached when Mg is mixed with phosphate previously to the BBF synthesis (Figure 2 and Figure 4).
The relationship found in our study proved that P soluble in FA from biochar was a sensitive indicator of P bioavailability for plants (Figure 9), which is in line with the results reported by Wang et al. [13]. However, in general, the higher response of BBF was related to higher amounts of P soluble in NAC, which improves the soil P-resin. Thus, a higher P resin levels in soils improves the maize and brachiaria growth and P acquisition (Figure 2, Figure 5, Figure 6, Figure 7, Figure 8 and Figure 9). In three successive resin extractions, the P extracted was efficient in increasing the P accumulation capacity of the Italian ryegrass (Lolium multiflorum Lam.) [59]. However, a mixture in the dataset from mineral P sources with the biochar-based P sources can compromise the applications of models due to an apparent higher influence of mineral sources dataset on the created mathematical models [59]. Thus, the best option would be to establish relationships only for the BBFs dataset without the use of the mineral P sources results.
The BBFs interact with the soil medium, and the positive effects of biochar on the soil are due to changes in physical, chemical, and microbiological properties of soil, thus affecting the P chemical and availability as a function of the interaction of P with mineral and organic soil components [19]. The P available in soil increases due to biochar application by the following mechanisms: increase adsorption of cations from soil into the biochar matrix, consequently reducing the P sorption and precipitation with these cations; an increase in water retention capacity, which enhances the diffusion of P in soil; an increase in soil pH, causing a stronger anionic repulsion by soil colloids, thus, enhancing the levels of P in soil solution; competitive reactions between phosphate and C organic molecules for biochar and soil colloid adsorption sites, thus blocking P adsorption sites; a more gradual release of P, which increases the fertilizer efficiency when biochar is mixed with P mineral fertilizers; finally, the effect of biochar and BBFs application on the P availability may increase its uptake by plants and the yield of crops; at last instance, the effects of these factors and mechanisms depend on the rate and properties of biochar, which are governed by pyrolysis temperature, feedstock, C:N ratio, etc. [17,19,21,60,61].
When analyzing the P in the soil solution during the first crop using maize as a test plant, different trends were observed for the resin P available levels in soils (Figure 5). At the beginning of the maize cultivation, the solution P in RO increased by 14% for BNA and BNAMg over TSP. Two hypotheses may be related to the higher solution P values observed in the BNA and BNAMg-treated soils: the first includes the formation in BNA and BNAMg of compounds such as calcium nitrate with higher hygroscopicity and solubility because nitrate-containing compounds are generally more soluble and hygroscopic than other P salts [62]. A higher hygroscopicity may have increased water absorption (hydration) by BBFs. Consequently, this could have increased the levels of P in soil solution, especially in the soil with greater water retention capacity (RO), which contained a greater volume of water in pots due to its higher SOM levels (Table 2); the interaction of P from APR with the subsequent formation of phosphates in the complexed forms (Figure 3), and the presence of these chemical bonds and P in complexed forms favor the availability of P in soil [4].
In YO, during maize cultivation, BBFs do not increase solution P over TSP-treated samples (Figure 5). Only BNAMg had similar values of solution P compared to TSP. Among the BBFs, the BNA increased the soil solution P values, and Mg addition in BBFs improved solution P. Mg increasing soil solution P was also observed in BHAMg over BHA and BSAMg over BSA; thus, Mg showed the synergic effect of magnesium and phosphate of BBFs. The presence of Mg in BBFs having a synergistic effect on P uptake due to the application of Mg-enriched BBFs has already been demonstrated [21]; however, our work showed that this effect was related to changes in P availability in soil.
These effects of BBFs on soil solution could not promote gains of maize biomass production for both Oxisols, compared to TSP. Within the BBFs, the ones that lead to the highest biomasses were BNA in RO, and BSA, BNA, and BNAMg in YO (Figure 6). The main effect on maize growth and P plant acquisition was conditioned by the fraction of P soluble in different chemical extractant solutions (CA, NAC, and CA) and by the amount of P released in CA leachates. These effects of BBFs on the soil solution were promising and should be better studied in other research studies, taking, as a guide, the definition of P rate to crops using the P-NAC fertilizer. Using the standard method of P recommendation to crops based on the P-NAC fertilizer, it was observed that P-biochar reduced the maize biomass production and P in shoot due to low solubility of P in water (less than 2%), compared to TSP-fertilized plants; the formation of P in stable forms during pyrolysis immobilized P in the biochar organic matrix, which is the reason why, for high P-demanding crops, such as maize, the P released by biochar is not enough to meet some crop P requirement in the right time and amount throughout the different crop growth stages [9,10,11].
In addition to the main effect on the first crop, fertilizers with a more gradual release have a higher residual effect in soils, thus increasing the availability of P during successive crop cultivation cycles. Use of BBFs over mineral fertilizers leads to a higher P residual effect (soil residual P) across different crop seasons [6,7,8]. For this reason, in this study brachiaria grass was cultivated in succession to the maize growing. The gradual release of P, as it was verified for BBFs, can positively affect the short and long-term P supply to crops in successive cultivations [21]. The increase in the residual soil P is due to a more gradual P release from BBFs, which means a higher P availability of P in comparison to soils treated with full solubilized mineral P fertilizers in the long term (residual P), as it was reported by Sakurada et al. [8]. Due to the residual effect of BBFs after the first cultivation, mainly due to nutrient forms in BBFs, it is advisable to evaluate the P availability in the soil in further studies in order to check if the residual P effect is enough to meet the nutritional demand of plants grown in sequence to the crash crop in field conditions [7,8].
It is observed that the residual effect of BBFs was highly dependent on soil properties such as SOM [4]. The residual effect of P (soil P resin) in RO for brachiaria was higher for BHA, BHAMg, BNA, and BNAM over TSP (Figure 7). However, in YO, the P resin is higher for TSP-treated soils over BBFs, showing the influence of soil type in controlling the residual effect of nutrients in fertilizers. When evaluating the soil solution in the RO, it was observed that the same pattern of P increase in soil solution was verified, with greater P, ~66% for BNA and BNAMg over TSP-treated samples. In YO, BSA, BSAMg, BNA, and BNAMg had higher soil P resin (Figure 7) than TSP. In YO, the increase in solution P and soil P resin did not lead to a higher production of brachiaria biomass or P in the plant shoot. Conversely, the use of TSP assured a higher residual soil P resin and brachiaria biomass production, and P in the grass shoot, than the other BBFs. However, in RO, BNA P residual effect allows maintaining the same P accumulation in the brachiaria shoot, although with a lower brachiaria biomass production, than TSP-fertilized plants.
4.3. Study Limitations and Future Perspectives
We provide a basis for choosing the best fertilizer solubility indices and extractants, as well as an initial agronomic basis for recommending BBFs to nourish with P a maize–brachiaria succession. Furthermore, the authors propose a new method to evaluate the kinetics of P release; thus, the citric acid solution should be considered in further studies dealing with the dynamics of P release by BBFs. However, in future studies, for a better comparison between BBFs and mineral fertilizers, the amount of P recommended for crops should be based on the P-NAC. Since experiments under controlled conditions have shown the potential of the novel BBFs to nourish plants with P, it is necessary to test the BBFs under field conditions across different crops, soils, and cultivation systems and plant rotations. We have demonstrated the possibility of using nitric acid in the synthesis of BBFs. However, due to high N losses during pyrolysis, other strategies of apatite acidulation with nitric acid should be investigated.
5. Conclusions
Acidulation of a low-grade phosphate rock, and the subsequent mixing of it with coffee husk-derived biochar, have created BBFs with different chemical properties, NPK pools, and infrared spectral signatures. The Mg addition via magnesium chloride before the pyrolysis was effective in promoting positive changes in BBF properties; thus, Mg contributed to a reduction in the amounts of P released in water and, at the same time, increased the P released in a 2% citric acid (CA) solution. Use of the CA solution in the evaluation of the dynamics (kinetics release) of P release effectively unravels the potential agronomic efficiency of BBFs in nourishing and promoting the growth of maize and brachiaria grass successively grown in contrasting Oxisols. The main effect of BBFs on the maize growth and soil residual P available for brachiaria grass plants was conditioned by the properties of the novel fertilizers formulated, as well as by the soil type. The effect of BBFs on residual P was higher in the Oxisol with the highest organic matter content. Instead of the fertilizer P-Total, the BBF concentration of P soluble in neutral ammonium citrate plus water (P-NAC) is the best fertilizer-P index to be used in the definition of P rate for maize and brachiaria plants cultivated in the Oxisols. Plant growth and P nutrition were the main plant traits related to the amounts of P added to soil based on the P-NAC fertilizer. In order to compare the agronomic performance of BBFs over mineral P soluble fertilizers, the recommended P rate for crops should be based on the P-NAC fertilizer. Thus, the recommendation of P based on fertilizer P-Total concentration was not a key factor governing maize and brachiaria grass P uptake and growth.
Author Contributions
Conceptualization, E.G.d.M., C.A.S. and K.J.; methodology, E.G.d.M. and C.A.S.; software, E.G.d.M.; validation, E.G.d.M., C.A.S. and K.J.; formal analysis, E.G.d.M.; investigation, E.G.d.M., C.A.S. and K.J.; resources, E.G.d.M., C.A.S. and K.J.; data curation, E.G.d.M.; writing—original draft preparation, E.G.d.M., C.A.S. and K.J.; writing—review and editing, E.G.d.M., C.A.S. and K.J.; visualization, E.G.d.M.; supervision, C.A.S. and K.J.; project administration, C.A.S.; funding acquisition, C.A.S. and K.J. All authors have read and agreed to the published version of the manuscript.
Funding
This research was funded by Coordination for the Improvement of Higher education personnel (CAPES), grant number CAPES-PROEX/AUXPE 593/2018, National Council for Scientific and Technological Development (CNPq), grant numbers 303899/2015-8 and 307447/2019-7, and The Foundation for Research of the State of Minas Gerais (FAPEMIG). Keiji Jindo receive financial support with Wageningen internal project number (3710473400).
Data Availability Statement
The datasets generated during and/or analyzed during the current study are available from the corresponding author upon reasonable request.
Acknowledgments
Many thanks to the Coordination for the Improvement of Higher Education Personnel (CAPES) (CAPES-PROEX/AUXPE 593/2018), National Council for Scientific and Technological Development (CNPq) (303899/2015-8 and 307447/2019-7 grants), and the Foundation for Research of the State of Minas Gerais (FAPEMIG) for financial support and scholarships provided. We appreciated the help of Teotonio Soares de Carvalho in helping us to create the digital and statistical basis to create the layout of Figure 1. Keiji Jindo wishes to acknowledge financial support (3710473400).
Conflicts of Interest
The authors declare no conflict of interest.
Appendix A

Table A1.
pH, nitrogen, phosphorus, and potassium pools and concentrations in biochar-based fertilizers.
Table A1.
pH, nitrogen, phosphorus, and potassium pools and concentrations in biochar-based fertilizers.
| Fertilizer | pH | N-Total (g kg−1) | N-NH4+ (g kg−1) | N-NO3− (g kg−1) | K-Total (g kg−1) |
| B | 5.3 ± 0.1 | 10.72 ± 0.49 | 0.035 ± 0.005 | 0.058 ± 0.002 | 34.90 ± 1.74 |
| BMg | 4.3 ± 0.1 | 7.67 ± 0.23 | 0.038 ± 0.007 | 0.038 ± 0.007 | 35.81 ± 1.39 |
| BSerp | 5.4 ± 0.1 | 8.99 ± 0.35 | 0.033 ± 0.002 | 0.066 ± 0.003 | 33.15 ± 0.13 |
| BSA | 2.9 ± 0.2 | 9.71 ± 0.13 | 0.058 ± 0.003 | - | 36.62 ± 1.51 |
| BSAMg | 5.3 ± 0.1 | 9.42 ± 0.05 | 0.118 ± 0.007 | - | 36.49 ± 0.48 |
| BSASerp | 3.6 ± 0.2 | 7.73 ± 0.06 | 0.146 ± 0.003 | - | 32.84 ± 1.57 |
| BHA | 4.4 ± 0.2 | 10.74 ± 0.29 | 0.155 ± 0.007 | - | 28.52 ± 0.15 |
| BHAMg | 5.6 ± 0.2 | 9.30 ± 0.13 | 0.240 ± 0.003 | - | 29.16 ± 1.05 |
| BHASerp | 4.8 ± 0.2 | 7.97 ± 0.10 | 0.170 ± 0.005 | - | 28.08 ± 2.13 |
| BNA | 6.8 ± 0.3 | 21.05 ± 0.14 | 0.054 ± 0.003 | 2.702 ± 0.089 | 34.08 ± 3.89 |
| BNAMg | 7.5 ± 0.1 | 15.88 ± 0.33 | 0.057 ± 0.003 | 0.114 ± 0.007 | 32.84 ± 2.00 |
| BNASerp | 10.3 ± 0.1 | 14.55 ± 0.06 | 0.053 ± 0.004 | - | 29.34 ± 2.60 |
| Fertilizer | P-Total (g kg−1) | P-H2O (g kg−1) | P-CA (g kg−1) | P-NAC (g kg−1) | P-FA (g kg−1) |
| B | 51.91 ± 1.58 | 1.15 ± 0.10 | 9.88 ± 0.31 | 4.73 ± 0.16 | 12.26 ± 0.15 |
| BMg | 51.25 ± 0.49 | 0.78 ± 0.01 | 9.03 ± 0.15 | 4.09 ± 0.15 | 9.02 ± 0.15 |
| BSerp | 50.16 ± 1.15 | 0.94 ± 0.04 | 8.71 ± 0.11 | 3.91 ± 0.07 | 10.80 ± 0.17 |
| BSA | 54.64 ± 3.66 | 4.79 ± 0.14 | 7.01 ± 0.23 | 12.83 ± 0.26 | 6.96 ± 0.03 |
| BSAMg | 57.31 ± 2.55 | 6.06 ± 0.28 | 20.39 ± 0.05 | 20.50 ± 0.23 | 20.01 ± 0.21 |
| BSASerp | 52.51 ± 0.65 | 5.18 ± 0.15 | 9.67 ± 0.09 | 9.74 ± 0.21 | 10.64 ± 0.37 |
| BHA | 56.16 ± 0.71 | 1.94 ± 0.02 | 23.14 ± 1.19 | 21.96 ± 0.04 | 21.64 ± 0.12 |
| BHAMg | 54.96 ± 0.38 | 3.91 ± 0.19 | 25.47 ± 0.11 | 24.09 ± 0.21 | 22.39 ± 0.22 |
| BHASerp | 58.73 ± 2.11 | 2.50 ± 0.09 | 12.32 ± 0.05 | 14.93 ± 0.03 | 11.27 ± 0.07 |
| BNA | 58.84 ± 0.65 | 4.31 ± 0.02 | 30.69 ± 0.26 | 31.79 ± 0.54 | 29.69 ± 0.46 |
| BNAMg | 48.03 ± 0.44 | 3.61 ± 0.02 | 29.14 ± 0.29 | 31.54 ± 0.31 | 27.76 ± 0.63 |
| BNASerp | 52.94 ± 0.55 | 1.03 ± 0.04 | 25.12 ± 0.36 | 25.80 ± 0.24 | 27.09 ± 1.19 |
Not detected or low limit of detection of method. N-Total, N-NH4+ and N-NO3−: concentrations of nitrogen total, ammonium, and nitrate, respectively; K-Total: total concentrations of potassium; P-Total, P-H2O, P-CA, P-NAC and P-FA: concentrations of total phosphorus (P), P soluble in water, in citric acid at 2%, neutral ammonium citrate plus water, and formic acid at 2% respectively. More details of the BBFs acronyms are shown in Table 1.
Table A2.
Nitrogen losses during pyrolysis and biochar-based fertilizers production.
| Materials Used in Biochar Synthesis | N Loss (%) |
|---|---|
| Coffee husk | 20.5 ± 2.1 Bb |
| Coffee husk + MgCl2 | 36.5 ± 1.0 Ba |
| Coffee husk + Serpentinite | 17.5 ± 1.2 Bb |
| Coffee husk + H2SO4 | 17.6 ± 1.9 BCa |
| Coffee husk + MgCl2 + H2SO4 | 14.3 ± 0.2 Da |
| Coffee husk + Serpentinite + H2SO4 | 16.0 ± 0.6 Ba |
| Coffee husk + HCl | 14.7 ± 0.8 Cb |
| Coffee husk + MgCl2 + HCl | 19.2 ± 2.7 Ca |
| Coffee husk + Serpentinite + HCl | 15.3 ± 0.2 Bb |
| Coffee husk + HNO3 | 87.9 ± 0.5 Aa |
| Coffee husk + MgCl2 + HNO3 | 88.2 ± 0.4 Aa |
| Coffee husk + Serpentinite + HNO3 | 89.5 ± 0.1 Aa |
The bars with standard error followed by the same capital letter did not differ the acid treatment in each Mg condition tested according to the Duncan test (p < 0.05). The bars with standard error followed the same minuscule letter did not differ the Mg condition in each acid treatment tested according to the Duncan test (p < 0.05).
Table A3.
Coefficients of the kinetics of P release in water for each fertilizers studied.
| Fertilizer | Linear | Elovich | Exponential | Power | Parabolic | Hyperbolic | ||||||||||||
|---|---|---|---|---|---|---|---|---|---|---|---|---|---|---|---|---|---|---|
| R2 | RMSE | AIC | R2 | RMSE | AIC | R2 | RMSE | AIC | R2 | RMSE | AIC | R2 | RMSE | AIC | R2 | RMSE | AIC | |
| APR | 0.72 | 0.04 | −68 | 0.57 | 0.05 | −60 | 0.94 | 0.02 | −91 | 0.90 | 0.02 | −89 | 0.89 | 0.02 | −86 | 0.94 | 0.02 | −94 |
| TSP | 0.38 | 17.18 | 177 | 0.75 | 10.95 | 159 | 0.97 | 5.95 | 134 | 0.83 | 9.02 | 151 | 0.62 | 13.51 | 167 | 0.94 | 6.80 | 139 |
| B | 0.40 | 0.50 | 35 | 0.61 | 0.41 | 27 | 0.92 | 0.19 | −4 | 0.75 | 0.33 | 18 | 0.62 | 0.40 | 26 | 0.89 | 0.22 | 3 |
| BMg | 0.64 | 0.14 | −17 | 0.62 | 0.14 | −16 | 0.90 | 0.08 | −41 | 0.87 | 0.08 | −37 | 0.82 | 0.10 | −30 | 0.91 | 0.07 | −45 |
| BSA | 0.56 | 2.70 | 102 | 0.66 | 2.38 | 97 | 0.97 | 0.76 | 52 | 0.87 | 1.49 | 79 | 0.78 | 1.93 | 89 | 0.96 | 0.83 | 55 |
| BSAMg | 0.97 | 0.18 | −5 | 0.32 | 0.93 | 60 | - | - | - | 0.97 | 0.18 | −5 | 0.89 | 0.37 | 23 | - | - | - |
| BHA | 0.87 | 2.05 | 91 | 0.50 | 3.97 | 118 | 0.98 | 0.75 | 51 | 0.97 | 1.06 | 65 | 0.97 | 1.02 | 64 | 0.99 | 0.68 | 47 |
| BHAMg | 0.99 | 0.15 | −13 | 0.31 | 1.16 | 69 | - | - | - | 0.99 | 0.13 | −20 | 0.90 | 0.45 | 31 | - | - | - |
| BNA | 0.77 | 1.96 | 90 | 0.52 | 2.83 | 104 | 0.98 | 0.57 | 41 | 0.92 | 1.14 | 68 | 0.92 | 1.18 | 69 | 0.98 | 0.65 | 45 |
| BNAMg | 0.97 | 0.21 | −1 | 0.39 | 0.95 | 61 | 0.98 | 0.20 | −0.66 | 0.98 | 0.23 | −2 | 0.95 | 0.26 | 9 | 0.98 | 0.22 | −1 |
R2: regression coefficient; RMSE: root mean squared error; AIC: Akaike Information Criterion; TSP: triple superphosphate; APR: Araxá phosphate rock. More details of the BBFs acronyms are shown in Table 1.
Table A4.
Coefficients of the kinetics of P release in citric acid at 2% for each fertilizer studied.
Table A4.
Coefficients of the kinetics of P release in citric acid at 2% for each fertilizer studied.
| Fertilizer | Linear | Elovich | Exponential | Power | Parabolic | Hyperbolic | ||||||||||||
|---|---|---|---|---|---|---|---|---|---|---|---|---|---|---|---|---|---|---|
| R2 | RMSE | AIC | R2 | RMSE | AIC | R2 | RMSE | AIC | R2 | RMSE | AIC | R2 | RMSE | AIC | R2 | RMSE | AIC | |
| APR | 0.93 | 5.84 | 133 | 0.50 | 15.52 | 172 | 0.99 | 2.41 | 98 | 0.99 | 1.83 | 87 | 0.99 | 1.91 | 89 | 0.99 | 2.00 | 91 |
| TSP | 0.50 | 9.40 | 152 | 0.91 | 3.90 | 117 | 0.82 | 17.97 | 178 | 0.95 | 3.03 | 107 | 0.73 | 6.88 | 140 | 0.87 | 17.57 | 177 |
| B | 0.94 | 5.73 | 133 | 0.47 | 17.70 | 178 | 0.99 | 1.95 | 89 | 0.99 | 2.04 | 91 | 0.99 | 2.40 | 98 | 0.99 | 1.59 | 81 |
| BMg | 0.95 | 4.72 | 125 | 0.45 | 15.83 | 173 | 1.00 | 1.42 | 77 | 0.99 | 1.71 | 84 | 0.99 | 2.26 | 95 | 0.99 | 1.17 | 69 |
| BSA | 0.90 | 6.04 | 135 | 0.48 | 13.82 | 168 | 0.99 | 0.79 | 53 | 0.98 | 2.88 | 105 | 0.98 | 2.75 | 103 | 0.99 | 1.10 | 66 |
| BSAMg | 0.71 | 10.39 | 156 | 0.62 | 11.87 | 162 | 0.99 | 2.07 | 92 | 0.94 | 4.84 | 126 | 0.90 | 6.16 | 135 | 0.99 | 2.01 | 91 |
| BHA | 0.78 | 13.04 | 165 | 0.54 | 18.80 | 180 | 0.99 | 1.91 | 89 | 0.94 | 6.87 | 140 | 0.93 | 7.38 | 143 | 0.99 | 2.99 | 107 |
| BHAMg | 0.66 | 12.88 | 165 | 0.64 | 13.34 | 166 | 0.99 | 2.05 | 91 | 0.92 | 6.20 | 136 | 0.87 | 8.11 | 146 | 0.99 | 2.22 | 95 |
| BNA | 0.73 | 14.61 | 170 | 0.63 | 16.95 | 176 | 0.99 | 2.77 | 104 | 0.95 | 6.16 | 135 | 0.91 | 8.25 | 147 | 0.99 | 2.00 | 90 |
| BNAMg | 0.64 | 16.18 | 174 | 0.70 | 14.98 | 171 | 0.98 | 4.31 | 121 | 0.94 | 6.79 | 139 | 0.86 | 10.20 | 156 | 0.99 | 2.88 | 105 |
R2: regression coefficient; RMSE: root mean squared error; AIC: Akaike Information Criterion; TSP: triple superphosphate; APR: Araxá phosphate rock. More details of the BBFs acronyms are shown in Table 1.
Table A5.
pH of whole soil and its solution for maize and brachiaria grown in Red and Yellow Oxisols.
Table A5.
pH of whole soil and its solution for maize and brachiaria grown in Red and Yellow Oxisols.
| Maize Cultivation | ||||
| Treatments | Whole Soil | Soil Solution | ||
| Red Oxisol | Yellow Oxisol | Red Oxisol | Yellow Oxisol | |
| –P | 6.0 ± 0.02 E | 5.9 ± 0.06 C | 5.9 ± 0.04 EF | 6.4 ± 0.08 B |
| APR | 6.0 ± 0.01 E | 5.9 ± 0.06 C | 5.9 ± 0.04 EF | 6.3 ± 0.05 B |
| TSP | 6.1 ± 0.04 CD | 5.9 ± 0.06 C | 5.9 ± 0.06 DEF | 6.3 ± 0.08 B |
| B | 6.3 ± 0.02 B | 6.0 ± 0.06 C | 6.3 ± 0.03 B | 6.3 ± 0.08 B |
| BMg | 6.1 ± 0.04 C | 6.0 ± 0.04 C | 6.0 ± 0.02 DE | 6.2 ± 0.08 B |
| BSA | 5.9 ± 0.04 E | 6.0 ± 0.04 C | 5.8 ± 0.03 F | 6.3 ± 0.07 B |
| BSAMg | 6.0 ± 0.04 E | 6.3 ± 0.03 B | 6.1 ± 0.07 CD | 6.4 ± 0.05 B |
| BHA | 6.0 ± 0.03 DE | 6.3 ± 0.01 B | 5.9 ± 0.06 EF | 6.3 ± 0.06 B |
| BHAMg | 6.0 ± 0.01 E | 6.3 ± 0.04 B | 6.2 ± 0.07 CD | 6.3 ± 0.09 B |
| BNA | 6.4 ± 0.01 A | 6.8 ± 0.04 A | 6.5 ± 0.02 AB | 6.8 ± 0.04 A |
| BNAMg | 6.4 ± 0.01 A | 6.8 ± 0.05 A | 6.6 ± 0.07 A | 6.8 ± 0.06 A |
| Brachiaria Cultivation | ||||
| Treatments | Whole Soil | Soil Solution | ||
| Red Oxisol | Yellow Oxisol | Red Oxisol | Yellow Oxisol | |
| –P | 6.4 ± 0.01 A | 6.4 ± 0.09 B | 5.5 ± 0.03 F | 6.3 ± 0.05 A |
| APR | 6.3 ± 0.02 B | 6.4 ± 0.05 B | 5.5 ± 0.05 F | 6.3 ± 0.03 A |
| TSP | 6.1 ± 0.02 C | 6.4 ± 0.09 B | 6.0 ± 0.04 CD | 6.5 ± 0.12 A |
| B | 6.4 ± 0.04 A | 6.3 ± 0.06 B | 6.1 ± 0.09 BC | 6.4 ± 0.08 A |
| BMg | 6.3 ± 0.02 B | 6.3 ± 0.05 B | 5.8 ± 0.03 DE | 6.4 ± 0.08 A |
| BSA | 5.9 ± 0.03 D | 6.4 ± 0.06 B | 5.7 ± 0.03 E | 6.3 ± 0.09 A |
| BSAMg | 6.0 ± 0.02 D | 6.3 ± 0.11 B | 6.0 ± 0.03 CD | 6.5 ± 0.06 A |
| BHA | 6.0 ± 0.01 D | 6.5 ± 0.04 B | 5.9 ± 0.02 DE | 6.6 ± 0.01 A |
| BHAMg | 6.0 ± 0.03 D | 6.4 ± 0.06 B | 5.8 ± 0.05 E | 6.4 ± 0.05 A |
| BNA | 6.3 ± 0.03 B | 6.8 ± 0.06 A | 6.4 ± 0.06 A | 6.7 ± 0.07 A |
| BNAMg | 6.3 ± 0.02 B | 6.7 ± 0.04 A | 6.2 ± 0.07 BC | 6.5 ± 0.20 A |
The means with standard error followed by the same letter did not differ the treatments according to the Duncan test (p < 0.05). –P: no P fertilizer application; TSP: triple superphosphate; APR: Araxá phosphate rock. More details of the BBFs acronyms are shown in Table 1.
References
- Fink, J.R.; Inda, A.V.; Tiecher, T.; Barrón, V. Iron oxides and organic matter on soil phosphorus availability. Ciênc. Agrotecnol. 2016, 40, 369–379. [Google Scholar] [CrossRef] [Green Version]
- McLaughlin, M.J.; McBeath, T.M.; Smernik, R.; Stacey, S.P.; Ajiboye, B.; Guppy, C. The chemical nature of P accumulation in agricultural soils-implications for fertiliser management and design: An Australian perspective. Plant Soil 2011, 349, 69–87. [Google Scholar] [CrossRef]
- Withers, P.J.A.; Rodrigues, M.; Soltangheisi, A.; de Carvalho, T.S.; Guilherme, L.R.G.; Benites, V.D.M.; Gatiboni, L.C.; de Sousa, D.M.G.; Nunes, R.D.S.; Rosolem, C.A.; et al. Transitions to sustainable management of phosphorus in Brazilian agriculture. Sci. Rep. 2018, 8, 2537. [Google Scholar] [CrossRef] [PubMed] [Green Version]
- Erro, J.; Urrutia, O.; Baigorri, R.; Aparicio-Tejo, P.; Irigoyen, I.; Torino, F.; Mandado, M.; Yvin, J.C.; Garcia-Mina, J.M. Organic Complexed Superphosphates (CSP): Physicochemical characterization and agronomical properties. J. Agric. Food Chem. 2012, 60, 2008–2017. [Google Scholar] [CrossRef]
- Frazão, J.J.; Benites, V.D.M.; Pierobon, V.M.; Ribeiro, S. A Poultry Litter-Derived Organomineral Phosphate Fertilizer Has Higher Agronomic Effectiveness Than Conventional Phosphate Fertilizer Applied to Field-Grown Maize and Soybean. Sustainability 2021, 13, 11635. [Google Scholar] [CrossRef]
- Martins, D.C.; Resende, Á.V.D.; Galvão, J.C.C.; Simão, E.D.P.; Ferreira, J.P.D.C.; Almeida, G.D.O. Organomineral Phosphorus Fertilization in the Production of Corn, Soybean and Bean Cultivated in Succession. Am. J. Plant Sci. 2017, 08, 2407–2421. [Google Scholar] [CrossRef] [Green Version]
- Sakurada, R.; Batista, L.M.A.; Inoue, T.T.; Muniz, A.S.; Pagliar, P.H. Organomineral phosphate fertilizers: Agronomic efficiency and residual effect on initial corn development. Agron. J. 2016, 108, 2050–2059. [Google Scholar] [CrossRef]
- Sakurada, R.L.; Muniz, A.S.; Sato, F.; Inoue, T.T.; Neto, A.M.; Batista, M.A. Chemical, Thermal, and Spectroscopic Analysis of Organomineral Fertilizer Residue Recovered from an Oxisol. Soil Sci. Soc. Am. J. 2019, 83, 409–418. [Google Scholar] [CrossRef]
- Lustosa Filho, J.F.; Penido, E.S.; Castro, P.P.; Silva, C.A.; Melo, L.C.A. Co-Pyrolysis of Poultry Litter and Phosphate and Magnesium Generates Alternative Slow-Release Fertilizer Suitable for Tropical Soils. ACS Sustain. Chem. Eng. 2017, 5, 9043–9052. [Google Scholar] [CrossRef]
- Lustosa Filho, J.F.; Barbosa, C.F.; Carneiro, J.S.D.S.; Melo, L.C.A. Diffusion and phosphorus solubility of biochar-based fertilizer: Visualization, chemical assessment and availability to plants. Soil Tillage Res. 2019, 194, 104298. [Google Scholar] [CrossRef]
- Rose, T.J.; Schefe, C.; Weng, Z.H.; Rose, M.T.; van Zwieten, L.; Liu, L.; Rose, A.L. Phosphorus speciation and bioavailability in diverse biochars. Plant Soil 2019, 443, 233–244. [Google Scholar] [CrossRef]
- Tumbure, A.; Bishop, P.; Bretherton, M.; Hedley, M. Co-Pyrolysis of Maize Stover and Igneous Phosphate Rock to Produce Potential Biochar-Based Phosphate Fertilizer with Improved Carbon Retention and Liming Value. ACS Sustain. Chem. Eng. 2020, 8, 4178–4184. [Google Scholar] [CrossRef]
- Wang, T.; Camps-Arbestain, M.; Hedley, M.; Bishop, P. Predicting phosphorus bioavailability from high-ash biochars. Plant Soil 2012, 357, 173–187. [Google Scholar] [CrossRef]
- Maluf, H.J.G.M.; Silva, C.A.; Morais, E.G.D.; Paula, L.H.D.D. Is Composting a Route to Solubilize Low-Grade Phosphate Rocks and Improve MAP-Based Composts? Rev. Bras. Ciência Do Solo 2018, 42, e0170079. [Google Scholar] [CrossRef]
- UNIDO; IFDC. Fertilizer Manual, 1st ed.; UNIDO, IFDC, Eds.; Kluwer Academic Publishers: Dordrecht, The Netherlands, 1998; ISBN 978-0-7923-5032-3. [Google Scholar]
- Sahin, O.; Taskin, M.B.; Kaya, E.C.; Atakol, O.; Emir, E.; Inal, A.; Gunes, A. Effect of acid modification of biochar on nutrient availability and maize growth in a calcareous soil. Soil Use Manag. 2017, 33, 447–456. [Google Scholar] [CrossRef]
- An, X.; Wu, Z.; Liu, X.; Shi, W.; Tian, F.; Yu, B. A new class of biochar-based slow-release phosphorus fertilizers with high water retention based on integrated co-pyrolysis and co-polymerization. Chemosphere 2021, 285, 131481. [Google Scholar] [CrossRef]
- Suwanree, S.; Knijnenburg, J.T.N.; Kasemsiri, P.; Kraithong, W.; Chindaprasirt, P.; Jetsrisuparb, K. Engineered biochar from sugarcane leaves with slow phosphorus release kinetics. Biomass Bioenergy 2022, 156, 106304. [Google Scholar] [CrossRef]
- Ghodszad, L.; Reyhanitabar, A.; Maghsoodi, M.R.; Asgari Lajayer, B.; Chang, S.X. Biochar affects the fate of phosphorus in soil and water: A critical review. Chemosphere 2021, 283, 131176. [Google Scholar] [CrossRef]
- Baird, R.; da Silva, R.C.; Degryse, F.; McLaughlin, M.J. A column perfusion test to assess the kinetics of nutrient release by soluble, sparingly soluble and coated granular fertilizers. J. Plant Nutr. Soil Sci. 2019, 182, 763–771. [Google Scholar] [CrossRef]
- Carneiro, J.S.S.; Andrade Ribeiro, I.C.; Nardis, B.O.; Barbosa, C.F.; Lustosa Filho, J.F.; Azevedo Melo, L.C. Long-term effect of biochar-based fertilizers application in tropical soil: Agronomic efficiency and phosphorus availability. Sci. Total Environ. 2021, 760, 143955. [Google Scholar] [CrossRef]
- Adeleke, R.; Nwangburuka, C.; Oboirien, B. Origins, roles and fate of organic acids in soils: A review. South Afr. J. Bot. 2017, 108, 393–406. [Google Scholar] [CrossRef]
- Singh, B.; Camps-Arbestain, M.; Lehmann, J.; CSIRO. Biochar: A Guide to Analytical Methods; CSIRO Publishing: Clayton, Australia, 2017; ISBN 1486305105. [Google Scholar]
- Phares, C.A.; Atiah, K.; Frimpong, K.A.; Danquah, A.; Asare, A.T.; Aggor-Woananu, S. Application of biochar and inorganic phosphorus fertilizer influenced rhizosphere soil characteristics, nodule formation and phytoconstituents of cowpea grown on tropical soil. Heliyon 2020, 6, e05255. [Google Scholar] [CrossRef] [PubMed]
- Enders, A.; Lehmann, J. Comparison of Wet-Digestion and Dry-Ashing Methods for Total Elemental Analysis of Biochar. Commun. Soil Sci. Plant Anal. 2012, 43, 1042–1052. [Google Scholar] [CrossRef]
- Ministério da Agricultura, Pecuária e Abastecimento. Manual de Métodos Analíticos Oficiais Para Fertilizantes e Corretivos; MAPA: Brasília: Brasil, 2017; ISBN 978-85-7991-109-5. [Google Scholar]
- Kitson, R.E.; Mellon, M.G. Colorimetric Determination of Phosphorus as Molybdivanadophosphoric Acid. Ind. Eng. Chem. Anal. Ed. 1944, 16, 379–383. [Google Scholar] [CrossRef]
- Gautam, R.; Vanga, S.; Ariese, F.; Umapathy, S. Review of multidimensional data processing approaches for Raman and infrared spectroscopy. EPJ Tech. Instrum. 2015, 2, 1–38. [Google Scholar] [CrossRef] [Green Version]
- Stuart, B.H. Infrared Spectroscopy: Fundamentals and Applications; John Wiley & Sons: Hoboken, NY, USA, 2004; Volume 8, ISBN 9780470011140. [Google Scholar]
- Socrates, G. Infrared and Raman Characteristic Group Frequencies: Tables and Charts; John Wiley & Sons: Hoboken, NY, USA, 2004; ISBN 978-0-470-09307-8. [Google Scholar]
- Wang, Y.; Yin, R.; Liu, R. Characterization of biochar from fast pyrolysis and its effect on chemical properties of the tea garden soil. J. Anal. Appl. Pyrolysis 2014, 110, 375–381. [Google Scholar] [CrossRef]
- Morais, E.G.; Silva, C.A.; Maluf, H.J.G.M.; Guilherme, L.R.G. Slow-Release Humic Acid-Based Zinc Fertilizers Improve Growth and Nutrition of Maize and Brachiaria Grass Successively Grown in Oxisols. ACS Agric. Sci. Technol. 2022, in press. [Google Scholar] [CrossRef]
- Teixeira, P.C.; Donagemma, G.K.; Fontana, A.; Teixeira, W.G. (Eds.) Manual de Métodos de Análise de Solo, 3rd ed.; Embrapa: Brasília, Brasil, 2017; ISBN 978-85-7035-771-7. [Google Scholar]
- Carmo, D.L.D.; Silva, C.A.; Lima, J.M.D.; Pinheiro, G.L. Electrical Conductivity and Chemical Composition of Soil Solution: Comparison of Solution Samplers in Tropical Soils. Rev. Bras. Ciência Do Solo 2016, 40, e0140795. [Google Scholar] [CrossRef]
- Silva, F.C. (Ed.) Manual de Análises Químicas De solos, Plantas e Fertilizantes, 2nd ed.; Embrapa Informação Tecnológica: Brasília, Brasil, 2009; ISBN 978-85-7383-430-7. [Google Scholar]
- Kassambara, A.; Mundt, F. factoextra: Extract and Visualize the Results of Multivariate Data Analyses 2020. Available online: https://cran.r-project.org/web/packages/factoextra/readme/README.html (accessed on 12 July 2022).
- Mendiburu, F. agricolae: Statistical Procedures for Agricultural Research 2020. Available online: https://cran.r-project.org/web/packages/agricolae/index.html (accessed on 12 July 2022).
- R Core Team. R: A Language and Environment for Statistical Computing 2020. Available online: https://www.R-project.org/ (accessed on 12 July 2022).
- Wei, T.; Simko, V. R package “corrplot”: Visualization of a Correlation Matrix 2017. Available online: https://cran.microsoft.com/snapshot/2020-04-20/web/packages/corrplot/index.html (accessed on 12 July 2022).
- Wickham, H.; Averick, M.; Bryan, J.; Chang, W.; McGowan, L.; François, R.; Grolemund, G.; Hayes, A.; Henry, L.; Hester, J.; et al. Welcome to the Tidyverse. J. Open Source Softw. 2019, 4, 1686. [Google Scholar] [CrossRef] [Green Version]
- Lê, S.; Josse, J.; Husson, F. FactoMineR: An R Package for Multivariate Analysis. J. Stat. Softw. 2008, 25, 1–18. [Google Scholar] [CrossRef]
- Suzuki, R.; Terada, Y.; Shimodaira, H. pvclust: Hierarchical Clustering with P-Values via Multiscale Bootstrap Resampling 2019. Available online: https://cran.r-project.org/web/packages/pvclust/pvclust.pdf (accessed on 12 July 2022).
- Dou, Z.; Toth, J.D.; Jabro, J.D.; Fox, R.H.; Fritton, D.D. Soil nitrogen mineralization during laboratory incubation: Dynamics and model fitting. Soil Biol. Biochem. 1996, 28, 625–632. [Google Scholar] [CrossRef]
- Liang, Y.; Cao, X.; Zhao, L.; Xu, X.; Harris, W. Phosphorus Release from Dairy Manure, the Manure-Derived Biochar, and Their Amended Soil: Effects of Phosphorus Nature and Soil Property. J. Environ. Qual. 2014, 43, 1504–1509. [Google Scholar] [CrossRef]
- Akaike, H. A Bayesian Extension of the Minimum AIC Procedure of Autoregressive Model Fitting. Biometrika 1979, 66, 237. [Google Scholar] [CrossRef]
- Ward, J.H. Hierarchical Grouping to Optimize an Objective Function. J. Am. Stat. Assoc. 1963, 58, 236–244. [Google Scholar] [CrossRef]
- Lombi, E.; McLaughlin, M.J.; Johnston, C.; Armstrong, R.D.; Holloway, R.E. Mobility, solubility and lability of fluid and granular forms of P fertiliser in calcareous and non-calcareous soils under laboratory conditions. Plant Soil 2005, 269, 25–34. [Google Scholar] [CrossRef]
- Vieira, K.R.M.; Arce, G.L.A.F.; Luna, C.M.R.; Facio, V.O.; Carvalho, J.A.; Neto, T.G.S.; Ávila, I. Understanding the Acid Dissolution of Serpentinites (Tailings and Waste Rock) for Use in Indirect Mineral Carbonation. South Afr. J. Chem. Eng. 2022, 40, 270. [Google Scholar] [CrossRef]
- Teir, S.; Revitzer, H.; Eloneva, S.; Fogelholm, C.J.; Zevenhoven, R. Dissolution of natural serpentinite in mineral and organic acids. Int. J. Miner. Process. 2007, 83, 36–46. [Google Scholar] [CrossRef]
- Talboys, P.J.; Heppell, J.; Roose, T.; Healey, J.R.; Jones, D.L.; Withers, P.J.A. Struvite: A slow-release fertiliser for sustainable phosphorus management? Plant Soil 2016, 401, 109–123. [Google Scholar] [CrossRef] [Green Version]
- Binh, T.; Zapata, F. Standard characterization of phosphate rock samples from the FAO/IAEA phosphate project. In Assessment of Soil Phosphorus Status and Management of Phosphatic Fertilizers to Optimize Crop Production; IAEA-TECDOC-1272: Vienna, Austria, 2002; pp. 9–23. [Google Scholar]
- Lago, B.C.; Silva, C.A.; Melo, L.C.A.; Morais, E.G. de Predicting biochar cation exchange capacity using Fourier transform infrared spectroscopy combined with partial least square regression. Sci. Total Environ. 2021, 794, 148762. [Google Scholar] [CrossRef]
- Aguiar, N.O.; Novotny, E.H.; Oliveira, A.L.; Rumjanek, V.M.; Olivares, F.L.; Canellas, L.P. Prediction of humic acids bioactivity using spectroscopy and multivariate analysis. J. Geochem. Explor. 2013, 129, 95–102. [Google Scholar] [CrossRef]
- Marschner, P. Marschner’s Mineral Nutrition of Higher Plants; Elsevier: Oxford, UK, 2012; ISBN 9780123849052. [Google Scholar]
- Santos, W.O.; Mattiello, E.M.; Barreto, M.S.C.; Cantarutti, R.B. Acid ammonium citrate as P extractor for fertilizers of varying solubility. Rev. Bras. Cienc. Do Solo 2019, 43, 1–12. [Google Scholar] [CrossRef] [Green Version]
- Duboc, O.; Hernandez-Mora, A.; Wenzel, W.W.; Santner, J. Improving the prediction of fertilizer phosphorus availability to plants with simple, but non-standardized extraction techniques. Sci. Total Environ. 2022, 806, 150486. [Google Scholar] [CrossRef] [PubMed]
- Xu, K.; Lin, F.; Dou, X.; Zheng, M.; Tan, W.; Wang, C. Recovery of ammonium and phosphate from urine as value-added fertilizer using wood waste biochar loaded with magnesium oxides. J. Clean. Prod. 2018, 187, 205–214. [Google Scholar] [CrossRef]
- Urrutia, O.; Erro, J.; Guardado, I.; San Francisco, S.; Mandado, M.; Baigorri, R.; Claude Yvin, J.; Ma Garcia-Mina, J. Physico-chemical characterization of humic-metal-phosphate complexes and their potential application to the manufacture of new types of phosphate-based fertilizers. J. Plant Nutr. Soil Sci. 2014, 177, 128–136. [Google Scholar] [CrossRef]
- Wang, T.; Camps-Arbestain, M.; Hedley, M. The fate of phosphorus of ash-rich biochars in a soil-plant system. Plant Soil 2014, 375, 61–74. [Google Scholar] [CrossRef]
- Bai, S.H.; Omidvar, N.; Gallart, M.; Kämper, W.; Tahmasbian, I.; Farrar, M.B.; Singh, K.; Zhou, G.; Muqadass, B.; Xu, C.-Y.; et al. Combined effects of biochar and fertilizer applications on yield: A review and meta-analysis. Sci. Total Environ. 2022, 808, 152073. [Google Scholar] [CrossRef]
- Johan, P.D.; Ahmed, O.H.; Omar, L.; Hasbullah, N.A. Phosphorus Transformation in Soils Following Co-Application of Charcoal and Wood Ash. Agronomy 2021, 11, 2010. [Google Scholar] [CrossRef]
- Nasiraee, M.; Mousavi, S.M.; Saljoughi, E.; Kiani, S.; Razmgar, K. Production of calcium nitrate crystals via membrane distillation crystallization using polyvinylidene fluoride/sorbitan trioleate membranes. Adv. Powder Technol. 2021, 32, 1463–1471. [Google Scholar] [CrossRef]
Figure 1.
Clustering of biochar-based fertilizers (BBFs) synthetized based on their main properties. Percentage means the similarity within each group formed as an output of the cluster analysis. K-Total: total concentration of potassium; N-Mineral and N-Total: concentration of N-mineral and N-total; P-FA, P-CA, P-NAC, and P-H2O: the concentration of P soluble in formic acid at 2%, in citric acid at 2%, in neutral ammonium citrate plus water, and water respectively; P-Total: total concentration of P. The charts at the tip of terminal branches of the diagram display the ratio of each variable in each biochar in relation to the maximum value of the same variable found in one of all BBFs. For each variable measured, the rescaled values varied from 0 to 1 (maximum value across all samples). More details of the BBFs acronyms are shown in Table 1.

Figure 2.
Biochar-based fertilizer-P solubility index of different extractant solutions, considered the P extracted as a percentage of total P concentration in each fertilizer (P index). The P fertilizer index are displayed in relation to different acid and Mg sources used previous to the pyrolysis and production of BBFs. The bars with standard error followed by the same capital letter did not differ regarding the acid treatment for each Mg source, according to the Duncan test (p < 0.05). The bars with standard error followed by the same lowcase letter did not differ regarding the Mg source used to produce the BBFS, according to the Duncan test (p < 0.05). No-Mg: no-Mg addition; MgCl2: Mg added via magnesium chloride; Serp: Mg added via serpentinite. More details of the BBFs acronyms and synthesis routes are shown in Table 1.

Figure 3.
Attenuated total reflectance Fourier transform infrared spectrum of biochar based-fertilizers (BBFs) and their clustering (Based on the BBF spectral signature) in the principal component analysis (PCA) diagram. More details of the BBFs acronyms and synthesis routes are shown in Table 1.
Figure 3.
Attenuated total reflectance Fourier transform infrared spectrum of biochar based-fertilizers (BBFs) and their clustering (Based on the BBF spectral signature) in the principal component analysis (PCA) diagram. More details of the BBFs acronyms and synthesis routes are shown in Table 1.

Figure 4.
The kinetics of P release in water (a,b) and citric acid at 2% (c,d) as related to the total P content of biochar based-fertilizers (BBFs) and mineral fertilizers (TSP: triple superphosphate; APR: Araxá phosphate rock). More details of the BBFs acronyms and synthesis routes are shown in Table 1.

Figure 5.
The resin soil test assessed available Phosphorus (P) in whole soil (a,b) and P in soil solution (c,d), for maize grown in the Red and Yellow Oxisols. Bars with standard error followed by the same letter did not differ regarding the treatment means, according to the Duncan test (p < 0.05). –P: no P fertilizer supplied to plants; TSP: triple superphosphate; APR: Araxá phosphate rock. More details of the BBFs acronyms and synthesis routes are shown in Table 1.

Figure 6.
Biomass production (a,b) and phosphorus (P) accumulated in maize shoot (c,d) for plants cultivated in the Red and Yellow Oxisols. The bars with standard error followed by the same bold italic, capital, and same lowercase letter did not differ regarding the treatment means, respectively, for total (full bar), shoot (SDM), and root (RDM) dry matter, according to the Duncan test (p < 0.05). The bars with standard error followed by the same uppercase letter did not differ regarding the treatment means for P accumulated in maize shoot, according to the Duncan test (p < 0.05). –P: no P fertilizer used in the maize cultivation; TSP: triple superphosphate; APR: Araxá phosphate rock. More details of the BBFs acronyms and synthesis routes are shown in Table 1.

Figure 7.
Residual resin P available in whole soil samples of RO (a), and YO (b), and P in solution of RO (c) and YO (d) for brachiaria grass grown in the Red and Yellow Oxisols. The bars with standard error followed by the same letter did not differ regarding the treatment mean based on the Duncan test (p < 0.05). –P: no P fertilizer added to maize plants; TSP: triple superphosphate; APR: Araxá phosphate rock. More details of the BBFs acronyms and synthesis routes are shown in Table 1.

Figure 8.
Biomass production (a,b) and phosphorus (P) accumulated (c,d) in brachiaria shoot for plants grown in the Red and Yellow Oxisols in sequence to maize cultivation. The bars with standard error followed by the same bold italic, uppercase and lowercase letter did not differ regarding the treatment means, respectively, for total (full bar), shoot (SDM), and root (RDM) dry matter production according to the Duncan test (p < 0.05). The bars with standard error followed by the same uppercase letter did not differ regarding the treatment means for P accumulated in brachiaria grass shoot according to the Duncan test (p < 0.05). –P: no P fertilizer supplied to maize plants; TSP: triple superphosphate; APR: Araxá phosphate rock. More details of the BBFS acronyms and synthesis routes are shown in Table 1.

Figure 9.
Pearson’s correlation analysis among phosphorus (P) accumulated in maize or brachiaria grass shoot as related to biochar-based fertilizers (BBFs) properties and nutrient pools, as well as correlated with the whole soil and solution attributes. pH-BBFs: pH of BBFs, CA, NAC, Water, FA: indices of P solubility in citric acid (2%), neutral ammonium citrate plus water, water, and formic acid (2%), respectively; Water Kin. 0, 4, 12, 24, 48, 72, 120 168, 216, and 264: amounts of P release in the kinetics of P release in water at 0, 4, 12, 24, 48, 72, 120 168, 216, and 264 h, respectively; CA Kin. 0, 4, 12, 24, 48, 72, 120 168, 216 and 264: amounts of P release in the kinetics of P release in citric acid (2%) at 0, 4, 12, 24, 48, 72, 120 168, 216 and 264 h, respectively; Solution pH and soil pH: pH determined in whole soil and soil solution, respectively; Solution P and soil P-resin: P available determined in the soil solution and whole soil, respectively. *: significative Pearson’s correlation at 5% probability (p < 0.05).

Table 1.
Acronyms and synthesis route steps used in the production of biochar-based fertilizers.
| Acronym | Acid Type | Mg Source |
|---|---|---|
| B | No acidulation | No Mg addition |
| BMg | MgCl2 | |
| BSerp | Serpentinite | |
| BSA | Sulfuric acid | No Mg addition |
| BSAMg | MgCl2 | |
| BSASerp | Serpentinite | |
| BHA | Hydrochloric acid | No Mg addition |
| BHAMg | MgCl2 | |
| BHASerp | Serpentinite | |
| BNA | Nitric acid | No Mg addition |
| BNAMg | MgCl2 | |
| BNASerp | Serpentinite |
Table 2.
Main chemical, physicochemical, and texture of Oxisols used in the maize–brachiaria grass succession cultivation.
Table 2.
Main chemical, physicochemical, and texture of Oxisols used in the maize–brachiaria grass succession cultivation.
| Oxisol | pH | C (g kg−1) | Clay (g kg−1) | Silt (g kg−1) | Sand (g kg−1) | P-rem (mg L−1) |
|---|---|---|---|---|---|---|
| Red | 4.9 | 19.8 | 770 | 100 | 130 | 15.5 |
| Yellow | 6.2 | 4.5 | 460 | 85 | 455 | 11.7 |
| Oxisol | Total N (mg kg−1) | Available P (mg kg−1) | K+ (cmolc kg−1) | Ca2+ (cmolc kg−1) | Mg2+ (cmolc kg−1) | Al3+ (cmolc kg−1) |
| Red | 2580 | 8.3 | 16.6 | 0.2 | 0.1 | 0.8 |
| Yellow | 329 | 6.1 | 2.5 | 1.9 | 0.1 | 0.1 |
pH was determined in water at a ratio of 1:2.5 (w/v); P: available phosphorus determined by the resin soil test, K: available potassium determined by the Mehlich-1 soil test; P-rem: remaining phosphorus; exchangeable calcium (Ca2+), exchangeable magnesium (Mg2+) and aluminum (Al3+) extracted by a 1 mol L−1 KCl solution-soil test; C: carbon determined (dry combustion) in an automatic TOC analyzer; clay, silt and sand assessed by the Boyoucos method. All methodologies are described in detail in Teixeira et al. [33].
Disclaimer/Publisher’s Note: The statements, opinions and data contained in all publications are solely those of the individual author(s) and contributor(s) and not of MDPI and/or the editor(s). MDPI and/or the editor(s) disclaim responsibility for any injury to people or property resulting from any ideas, methods, instructions or products referred to in the content. |
© 2023 by the authors. Licensee MDPI, Basel, Switzerland. This article is an open access article distributed under the terms and conditions of the Creative Commons Attribution (CC BY) license (https://creativecommons.org/licenses/by/4.0/).
Share and Cite
MDPI and ACS Style
Morais, E.G.d.; Jindo, K.; Silva, C.A. Biochar-Based Phosphate Fertilizers: Synthesis, Properties, Kinetics of P Release and Recommendation for Crops Grown in Oxisols. Agronomy 2023, 13, 326. https://doi.org/10.3390/agronomy13020326
AMA Style
Morais EGd, Jindo K, Silva CA. Biochar-Based Phosphate Fertilizers: Synthesis, Properties, Kinetics of P Release and Recommendation for Crops Grown in Oxisols. Agronomy. 2023; 13(2):326. https://doi.org/10.3390/agronomy13020326
Chicago/Turabian StyleMorais, Everton Geraldo de, Keiji Jindo, and Carlos Alberto Silva. 2023. "Biochar-Based Phosphate Fertilizers: Synthesis, Properties, Kinetics of P Release and Recommendation for Crops Grown in Oxisols" Agronomy 13, no. 2: 326. https://doi.org/10.3390/agronomy13020326
Note that from the first issue of 2016, this journal uses article numbers instead of page numbers. See further details here.