Article

Effect of Different Long-Term Potassium Dosages on Crop Yield and Potassium Use Efficiency in the Maize–Wheat Rotation System

Key Laboratory for Farmland Eco-Environment of Hebei, College of Resources and Environmental Sciences, Hebei Agricultural University, Baoding 071000, China
*
Authors to whom correspondence should be addressed.
Agronomy 2022, 12(10), 2565; https://doi.org/10.3390/agronomy12102565
Submission received: 27 September 2022 / Revised: 11 October 2022 / Accepted: 14 October 2022 / Published: 19 October 2022

Abstract

:
Potassium (K) is the second most important plant nutritional element and is used for numerous physiological processes. We established an eight-year experiment comparing the effects of five K fertilization treatments (0, 48, 84, 120 and 156 kg K ha−1) on crop yield, K use efficiency and soil apparent K balance under the maize–wheat rotation system in the North China Plain. The highest maize and wheat yields were achieved in the K120 treatment, increasing by up to 16.7% and 25.1%, respectively. The increase in grain yield and K agronomic efficiency (AEK) with K application was greater in wheat than in maize. The K recovery efficiency (REK) and K accumulative recovery efficiency (ARE) significantly decreased with the increase in K fertilization in the maize and wheat seasons. However, the soil apparent K balance and soil available K content increased; the former was deficiency (−24.3 kg ha−1 yr−1) in the K0 treatment, but the latter did not decrease significantly compared with that in the initial year of the experiment. The soil available K content increased by 10.9 mg kg−1 per 100 kg ha1. In conclusion, the yield response to K fertilization was greater in wheat than in maize and alleviated soil K depletion, but the K fertilizer efficiency was lower. We believed that K fertilizer can be increased moderately in the wheat season and decreased in the maize season.

1. Introduction

Potassium is one of the essential nutrient elements for crop growth and development. It promotes enzyme activation and protein synthesis and facilitated photosynthesis. Potassium also plays important roles in improving crop quality and enhancing crop resistance [1,2,3]. To maximize productivity and yield while maintaining quality for crop growers, nitrogen (N) and phosphorus (P) fertilization are usually given more attention than potassium (K) [4,5]. In addition, unreasonable fertilization can also lead to soil nutrient imbalance, soil hardening, CEC anomaly, and other problems [6]. Therefore, improving K fertilization is considered to be crucial for a better understanding of the productivity and sustainability [7] and to recommend management solutions that would promote efficient use of K.
The application of K fertilizer increases wheat and maize yields [8,9]. On the basis of nitrogen (N) and phosphorus (P) fertilization, the application of K fertilizer increased winter wheat yield by more than 10.2% [10] and summer maize yield by 9.9–14.9% [11]. However, crop yield did not increase with continually increasing K fertilizer input [12,13]. Similarly, most studies show that K fertilizer use efficiency decreases with increasing fertilizer [11,14]. It has been reported that the average K recovery efficiency (RE) of maize and wheat in China is still relatively low, 30.3% and 31.9%, respectively [15]. The K fertilizer efficiency varied evidently even under the same K fertilization rates [11]. The environmental conditions, crop varieties, husbandry practices, soil K supply capacity and their interactions all influence the resulting K use efficiency [16,17]. Previous studies were mainly focused on the effect of K fertilizer application on one-season crop yield [2,18], and most studies believed that maize was relatively sensitive to K and that applied K fertilizer had a higher yield effect in maize than in wheat [17,19].
Most of the K in soil is unavailable to crop and is divided into three pools: rapidly available K (including exchangeable K and water soluble K), nonexchangeable K, and mineral K [20,21]. There are dynamic equilibrium reactions between different forms of K in soils. The soil K begins with the release of K into the soil solution from clay minerals [22]. Soil K input is available from the decomposition of crop remains and fertilizers. The crop removal of K can be momentous due to its large amount of plant uptake [6]. The loss of K with eroded soil and K leaching can occur with irrigation water and carelessly soil management practices [23]. According to statistics, soil K deficiency has been shown in a wide range of croplands worldwide [24,25]. The annual apparent soil K deficit was 134–258 kg ha−1 with neither K fertilization nor straw return in North China, resulting in soil K depletion [26]. Majumdar [27] showed that removal of K by crop biomass yield makes the annual soil balance deficit 14 million tons in India. The apparent K balance in Bangladesh was also severely deficient (−80–109 kg ha−1) [28]. It has been argued that the soil K balance is affected by excessive N and P fertilizers, straw removal, and high-yielding varieties in recent years [29,30,31]. To maintain and/or improve soil K fertility in farmland and to achieve stable and high crop yield, additional attention should be given to the balance of soil K. The application of K fertilizer also immediately influenced the soil available K content, and the change in soil available K content was a closely related parameter that directly reflected the K budget in the soil crop system. In addition, long-term field experiments that can evaluate the fertilizer effects and predict nutrient balance with its influencing factors are needed to give more rational fertilization recommendations, thus ensuring the sustainable development of intensive agriculture [32,33].
In order to clarify the effect of long-term different K application rates on crop yield, K utilization and the fate of K of maize–wheat rotation system in North China Plain, an eight-year field experiment (from 2010 to 2018) was conducted. The main objectives were (i) determining the response of crop yield to different K fertilizer application rates, (ii) understanding the variations in K use efficiency with different K fertilization rates, and (iii) identifying the influence of soil apparent K balance under different K fertilization rates.

2. Materials and Methods

2.1. Site Description

The long-term field experiment was conducted from 2010 to 2018 under a maize–wheat rotation system in Qingyuan County (38.77′ N, 115.48′ E), Hebei Province, China. The study site has a warm–temperate, subhumid, continental monsoon climate. The average annual temperature is 12 °C, and the average annual precipitation is 550 mm (Figure S1). The test soil was classified as Loamy fluvo-aquic soil. The basic properties of the plow layer soil prior to the start of the experiment were as follows: pH, 8.3; organic matter content, 16 g kg−1; total nitrogen content, 0.8 g kg−1; available phosphorus content, 13.2 mg kg−1; and available potassium content, 96.7 mg kg−1.

2.2. Experimental Design

The experiment was carried out in a randomized complete block design with three replications (plot size = 44 m2). Five treatments of different K fertilization rates were applied in each maize and wheat season: (1) K0, control with no K fertilizer application; (2) K48, K fertilizer application rate at 48 kg K ha−1; (3) K84, K fertilizer application rate at 84 kg K ha−1; (4) K120, K fertilizer application rate at 120 kg K ha−1; and (5) K156, K fertilizer application rate at 156 kg K ha−1. Summer maize was sown in the middle of June after the harvest of winter wheat and was harvested in early October each year. The maize cultivar used in this study was ‘Zhengdan 958’, which is widely cultivated in the North China Plain. In each maize growing season, a total of 255 kg N ha−1 was applied, with 30% of the N broadcast as a basal application, 50% of the N applied at the 11-leaf stage and the remaining 20% applied at the silking stage. Phosphorus fertilizer was basally applied at 120 kg P ha−1 to each K treatment in one application.
Winter wheat was planted in early October shortly after the harvest of summer maize and was harvested in the middle of June in the following year. The wheat cultivars used were ‘Shixin 539’ in 2011–2012 and ‘Jimai 22’ in the rest of the experimental years. For wheat, a total of 255 kg N ha−1 was applied in the form of urea, with 40% of N applied at sowing before the soil was plowed, 50% of N was furrow fertilized at the jointing stage, and the remaining 10% of N was broadcast at the flowering stage. Phosphorus fertilizer was applied at 120 kg P ha−1 in each treatment. The P and K fertilizers were all applied at sowing. Straw was returned to the soil surface at the wheat harvest. The fertilizers used in this study were urea (of 46% N), calcium superphosphate (of 12% P), and potassium chloride (of 60% K). The straw was crushed and returned to the soil during maize harvest.

2.3. Sampling and Analysis

Summer maize was harvested from two 15 m2 areas in each plot, and the grains were dried naturally in the sun to determine the grain yield. For wheat, two 1 m2 areas in the center of each plot were harvested manually to determine the grain yield. Plant samples were separated into subsamples, grains and other biomass. The subsamples of maize and wheat were dried in an oven at 105 °C for 30 min and then dried to a constant weight at 70 °C. Afterward, subsamples were ground and digested in 70% concentrated H2SO4 and 30% H2O2 to determine the K content.
Soil samples (0–20 cm) were collected before the initiation of the experiment (June 2010) to determine the soil properties. After each maize harvest season from 2010 to 2017, soil samples (0–20 cm) from three random sites were collected from each experimental plot using a core sampler (5 cm diameter). The soil samples were mixed thoroughly, and the visible roots, organic residues, and stone fragments were removed. Soil samples were then passed through a 1 mm sieve and extracted with 1 mol L−1 NH4OAc to determine the available K content [34].

2.4. Indicator Calculation Methods

K recovery efficiency (REK), K agronomic efficiency (AEK), and K accumulative recovery efficiency (ARE) were calculated using the following equations:
R E K ( % ) = U N F × 100
A E K ( kg   kg 1 ) = Y Y 0 F
A R E n ( % ) = i = 1 n C U i i = 1 n C N i i = 1 n C F i × 100
where F is the K fertilization rate; U and N are the aboveground plant K uptake with and without K fertilizer applications, respectively; Y and Y 0 are the grain yield in the K fertilizer application treatments with and without K fertilizer treatment, respectively; A R E n is the K accumulative recovery efficiency in maize and wheat under the nth season (n = 1–8); C U i and C N i are the sums of aboveground plant K uptake in maize and wheat with and without K fertilizer application during the nth season, respectively; and C F i is the sum of the K fertilization rates in maize and wheat during the nth season.
The apparent K balance was calculated using the following equation:
Apparent   K   balance   ( kg   ha 1 ) = K i n p u t K o u t p u t
where K i n p u t includes the K fertilizer application and the K returning from straw of the previous crop and K o u t p u t refers to the K uptake in crop aboveground. The amount of straw K returned from wheat cultivation at the start of maize sowing in 2010 was calculated based on the farmers’ traditional practice (the farmers’ traditional practice application was 270 kg N ha−1, 75 kg P ha−1, and 75 K ha−1 before this study, and the straw K content of wheat was 85.0 (kg ha−1) in 2010). K losses by leaching and runoff were not taken into account in the equation. A positive value indicates a surplus, and a negative value shows a deficiency in the soil K balance.

2.5. Statistical Analysis

The effects of K on crop yield, K agronomic efficiency, and K accumulative recovery efficiency were tested using one-way analysis of variance (ANOVA). Vertical T bars in the histogram indicate the standard error (SE). Mean differences were determined based on the least significant difference (LSD) at the 5% level. All statistical analyses were conducted using IBM SPSS Statistics 22.0 (IBM Corporation, Armonk, NY, USA).

3. Results

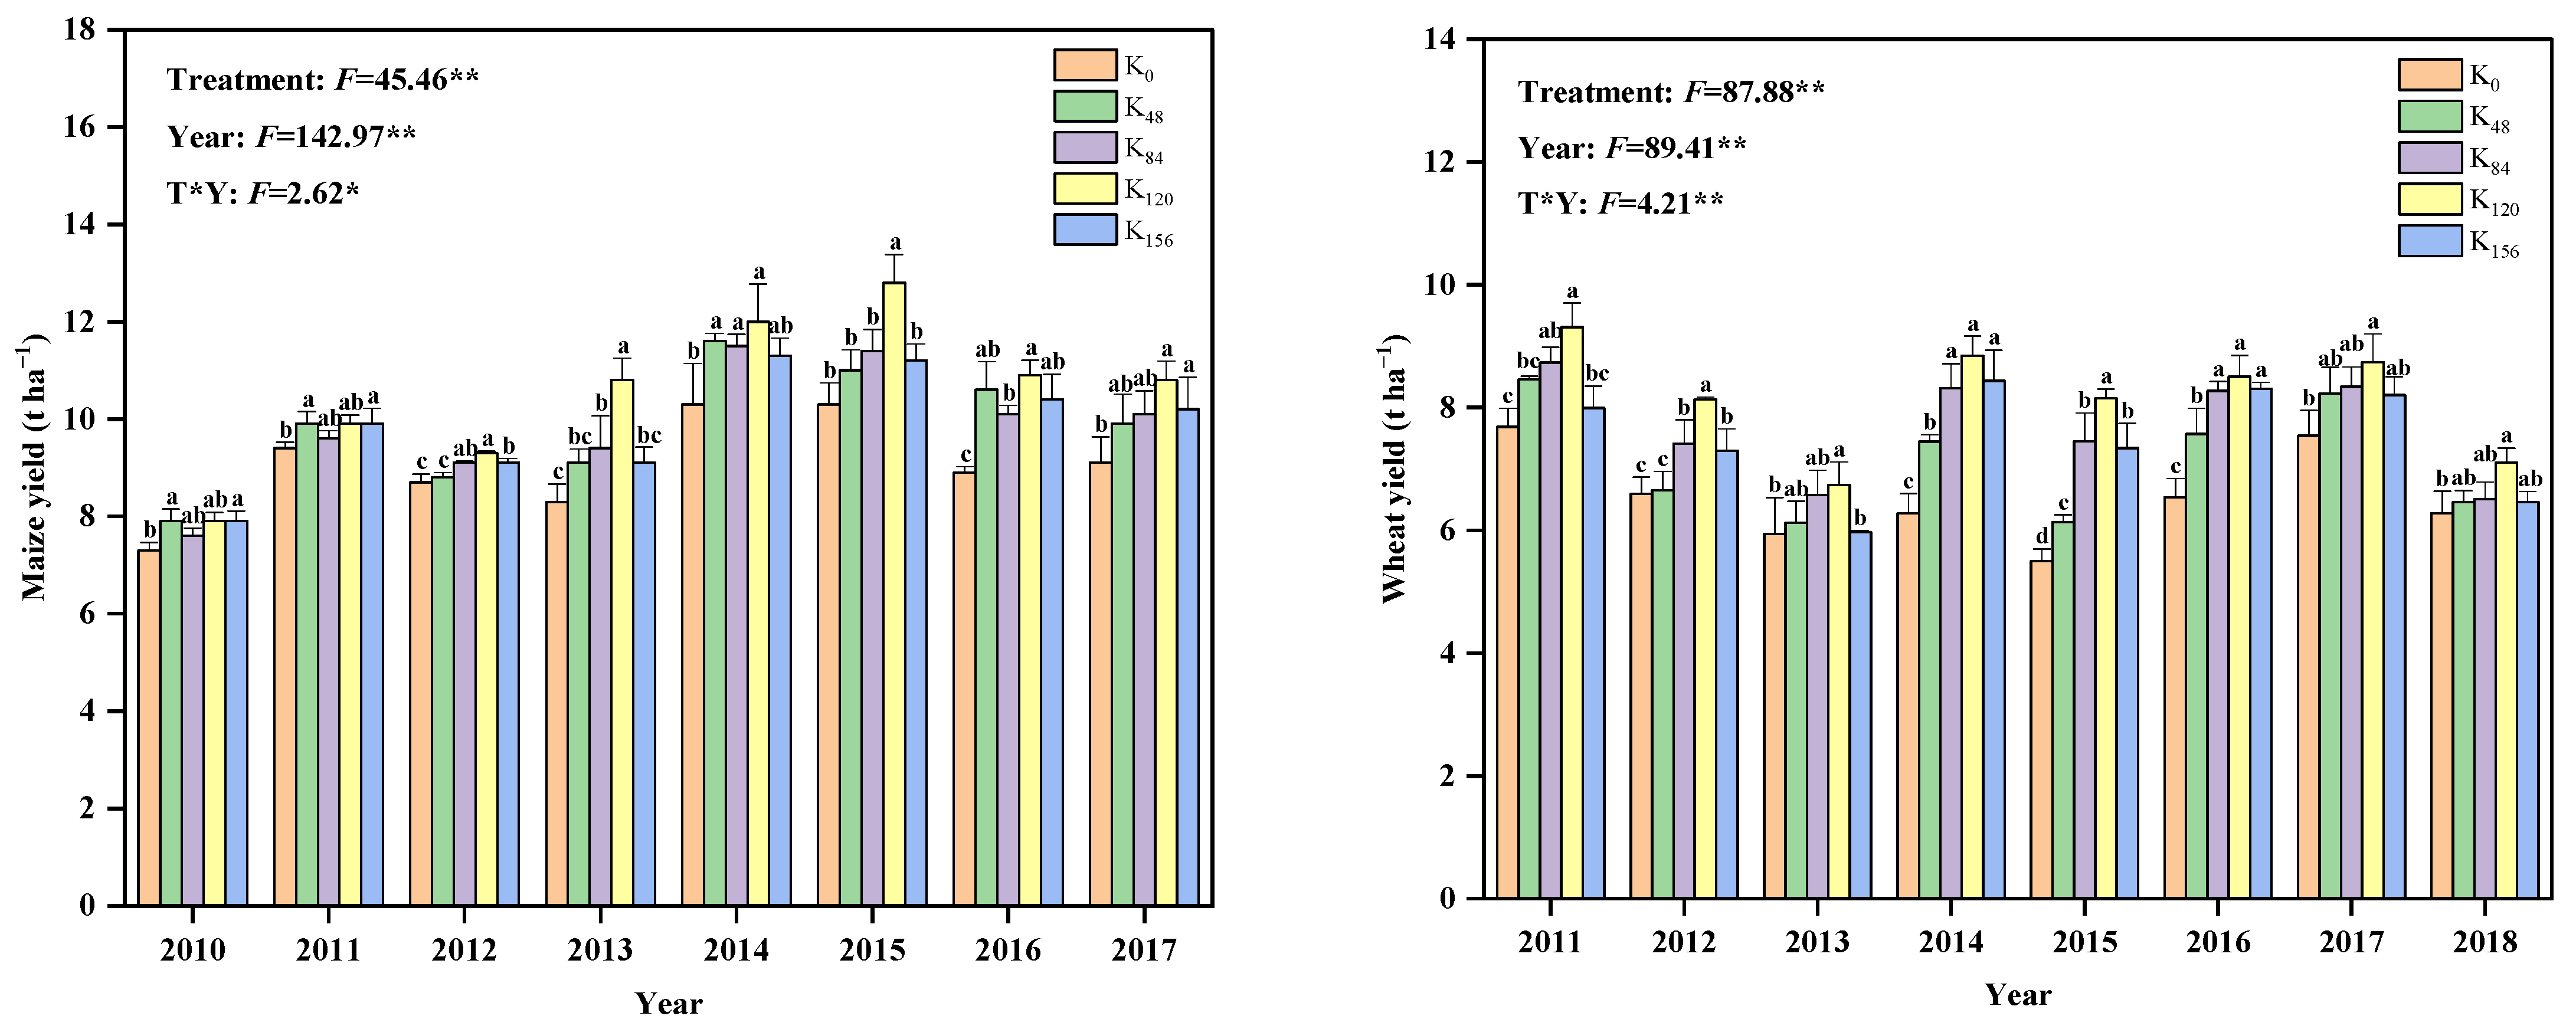
3.1. Changes of Crop Yield

The application of K fertilizers (K48, K84, K120 and K156) generally increased the average maize yield compared with the K0 treatment (Figure 1). The average maize yield under the K120 treatment reached 10.5 t ha−1, which was 16.7%, 7.1% and 7.0% higher than that under the K0, K48 and K84 treatments, respectively. However, no significant differences in the average maize yield were found between the K156 treatment and the K120 treatment. There were large variations in maize yield as affected by different K fertilization treatments among years. The maize yield in 2014 and 2015 were higher than those in other years. The yield increases by K fertilizer application were lower in the first three seasons than in the remaining five seasons.
Similarly, the application of K fertilizers generally also increased the average wheat yield compared with the K0 treatment (Figure 1). The average grain yield of wheat (8.1 t ha−1) was highest in the K120 treatment, which was significantly enhanced by 25.1%, 14.8%, 6.4% and 9.2% compared with the K0, K48, K84 and K156 treatments, respectively. In addition, large variations in wheat yield as influenced by K fertilizer applications fluctuated among years. Specifically, the K0, K48, K84, and K120 treatments had the highest wheat yields in 2011, which were 7.7, 8.5, 8.7, and 9.3 t ha−1, respectively. The K fertilizer applications were positively correlated with wheat yield but not with maize yield (Figure S2), and the increase in grain yield by K84, K120, and K156 was greater in wheat than in maize. The theoretical K fertilizer application and optimal K fertilizer application in the maize season by the fitting equation showed a decreasing trend (Figure 2).

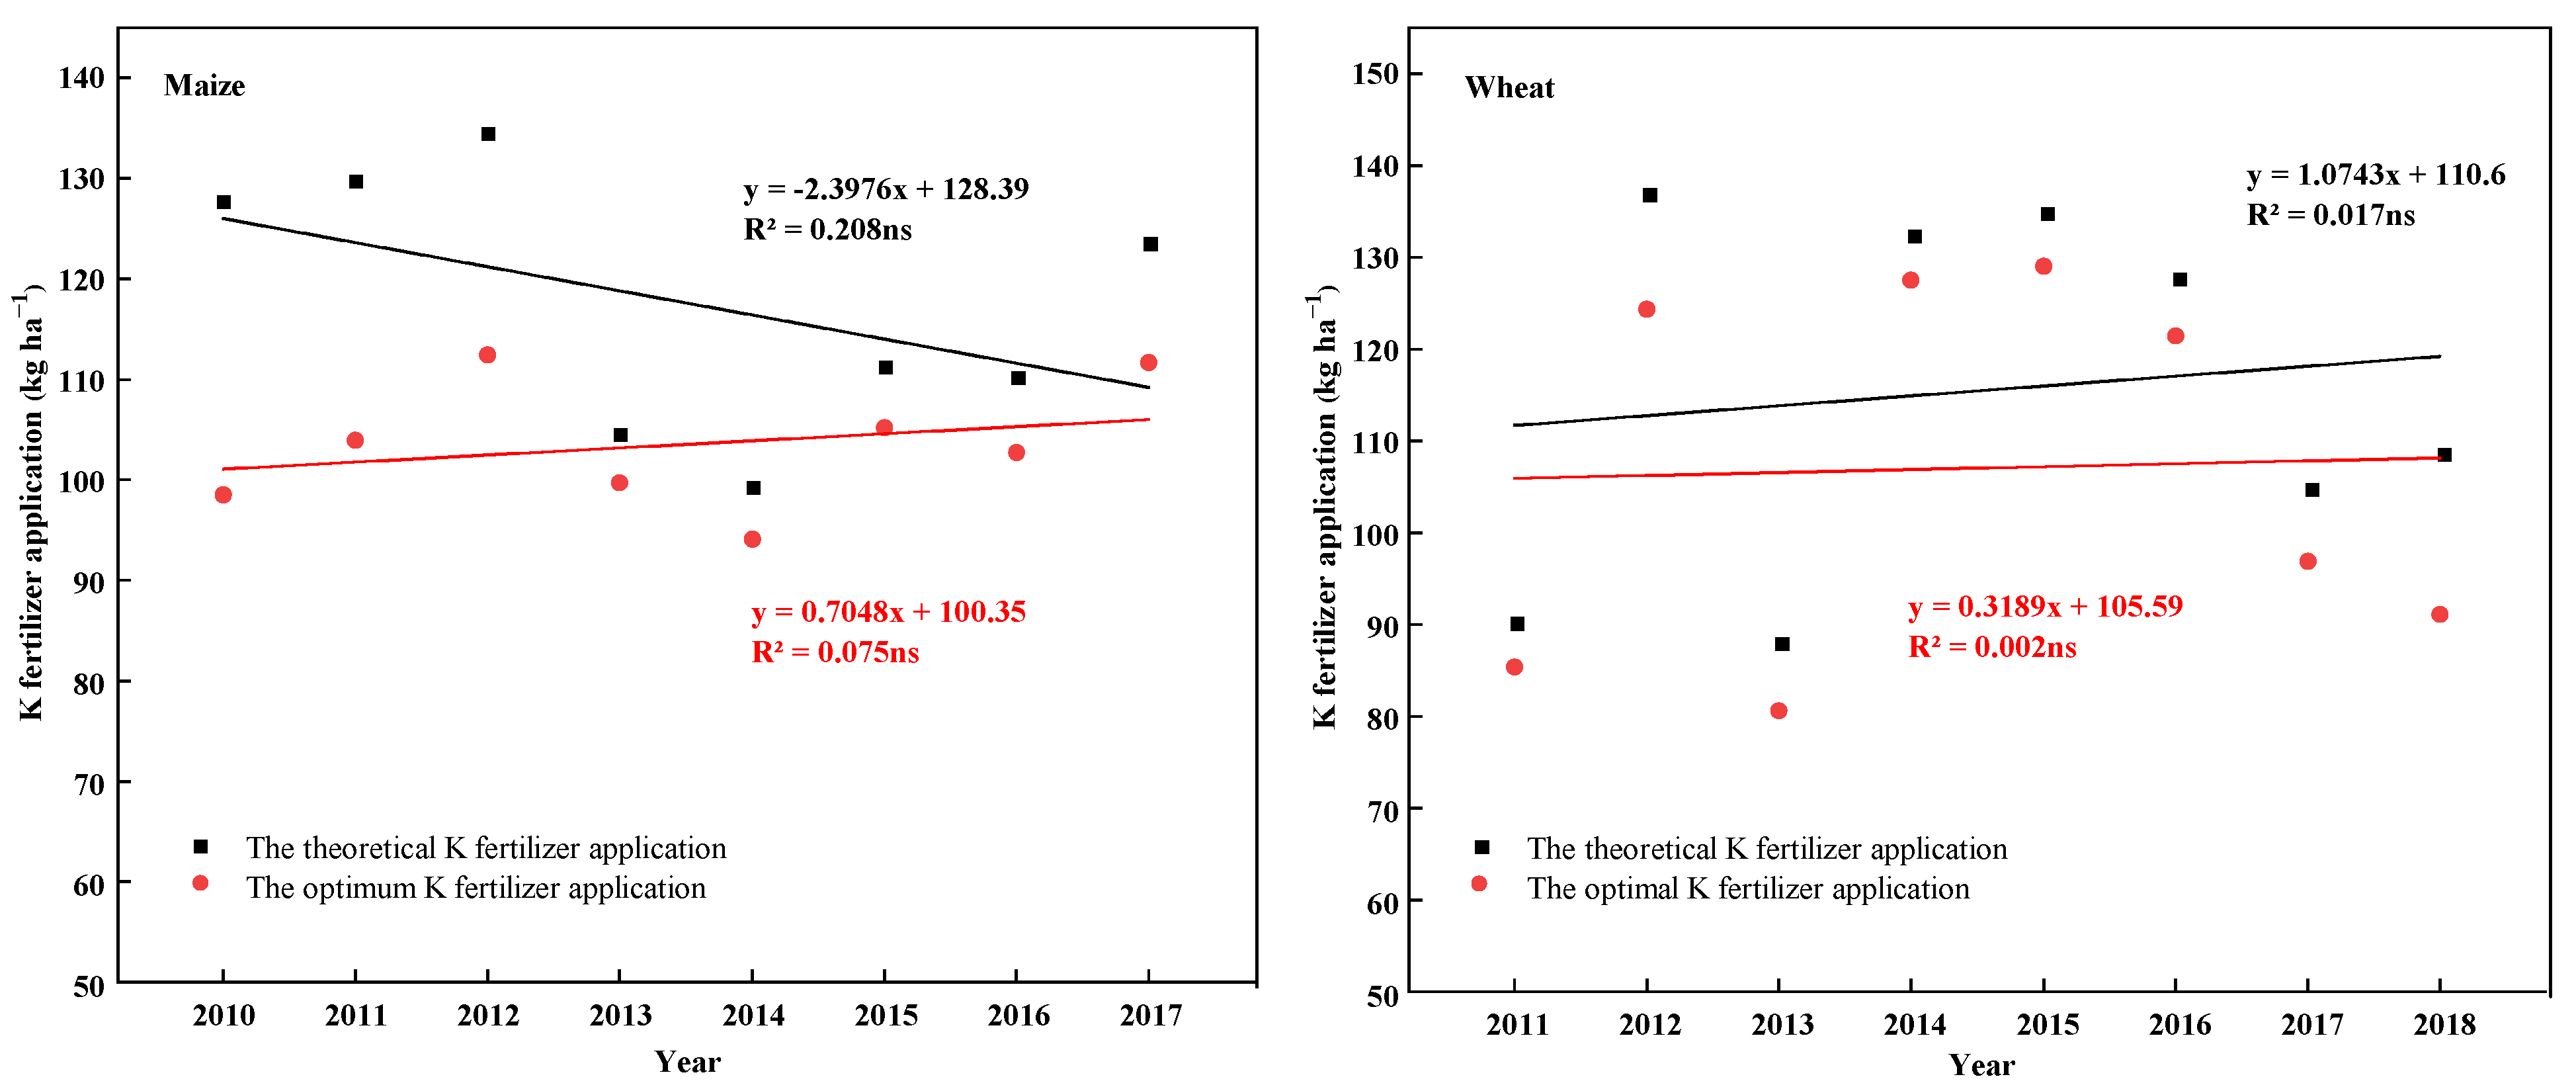
3.2. Changes of Potassium Use Efficiency

The K use efficiency with REK for the mean averaging over years in maize seasons significantly decreased with the K application rates (Table 1). The average REK from the K48 treatments was 39.5%, which was decreased to 16.4% from the K156 treatments. The AEK was highest for the maize season under the K48 treatment but was not significantly different under the K84 and K120 treatments. For the wheat season (Table 2), the mean REK also decreased with increasing K fertilizer. Between the K120 and K0 treatments, there were significant differences in AEK in three of eight years. The REK and AEK in the K84, K120, and K156 treatments in the wheat season were higher than those in the maize season. Over the experimental period, the average REK decreased from 73.4% in the K48 treatment to 44.9% in the K156 treatment, and the average AEK was highest in the K120 treatment, which was 12.3 kg kg−1. Furthermore, differences in the ARE were demonstrated among the K fertilization treatments (Table 3). The highest ARE was shown in the K48 treatment, ranging between 56.4% and 63.3%, while the lowest ARE was achieved in the K156 treatment, ranging from 28.1% to 31.6%. The ARE remained relatively stable in each treatment without obvious variations across years.

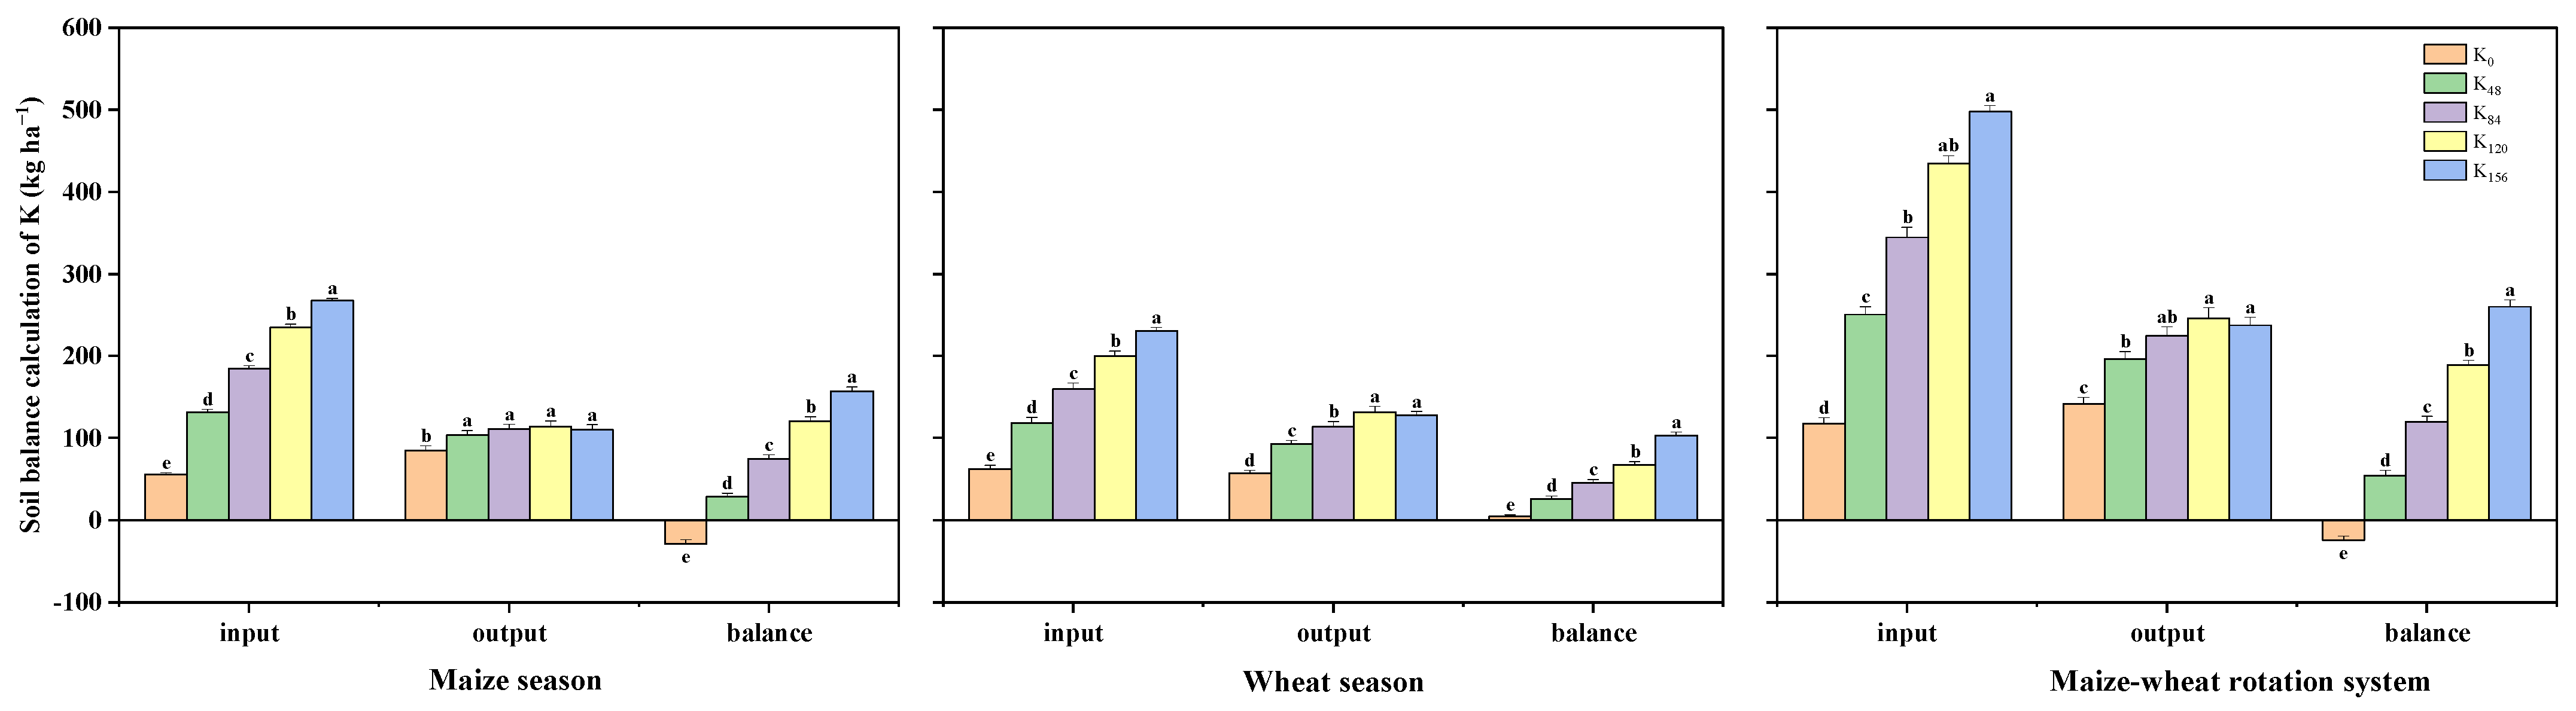
3.3. Changes of Soil Apparent K Balance

Soil K input included fertilizer K and straw K. The input of straw K for maize and wheat was 62.1–79.3 kg ha−1 and 55.7–114.9 kg ha−1, respectively (Figure 3). The output of soil K was the absorption of aboveground crop. In the maize season, the soil K output was 84.7–114.1 kg ha−1. The aboveground maize absorption in the K0 treatment exceeded the soil K input of wheat straw, and the soil apparent K balance was deficient by −29.0 kg ha−1. The soil apparent K balance increased with increasing fertilizer application rate in the other treatment groups. The K output aboveground in wheat was 54.7–131.6 kg ha−1, which was highest in the K120 treatment. The soil apparent K balance was surplus for all five treatments in the wheat season. For the maize–wheat rotation system, the annual straw input was 117.8–185.9 kg ha−1, and the average crop output was 142.1–237.7 kg ha−1. Even with straw return application to the field, the K output exceeded the K input without K fertilizer application (K0), resulting in a deficiency in the soil apparent K balance of 24.3 kg ha −1. For the treatments with K fertilizer applications, the soil K input was higher than the K output, and the soil K exhibited a surplus of 53.7, 120.0, 188.1 and 260.2 kg ha−1 in the K48, K84, K120 and K156 treatments, respectively. The regression equation showed that a significant positive correlation existed between the soil K balance and the K fertilizer input (y = 0.5417x + 16.835, R2 = 989**). Consequently, the soil K deficit needs to be replenished by adequate inputs of K as fertilizer and residue returning in the maize–wheat rotation system.

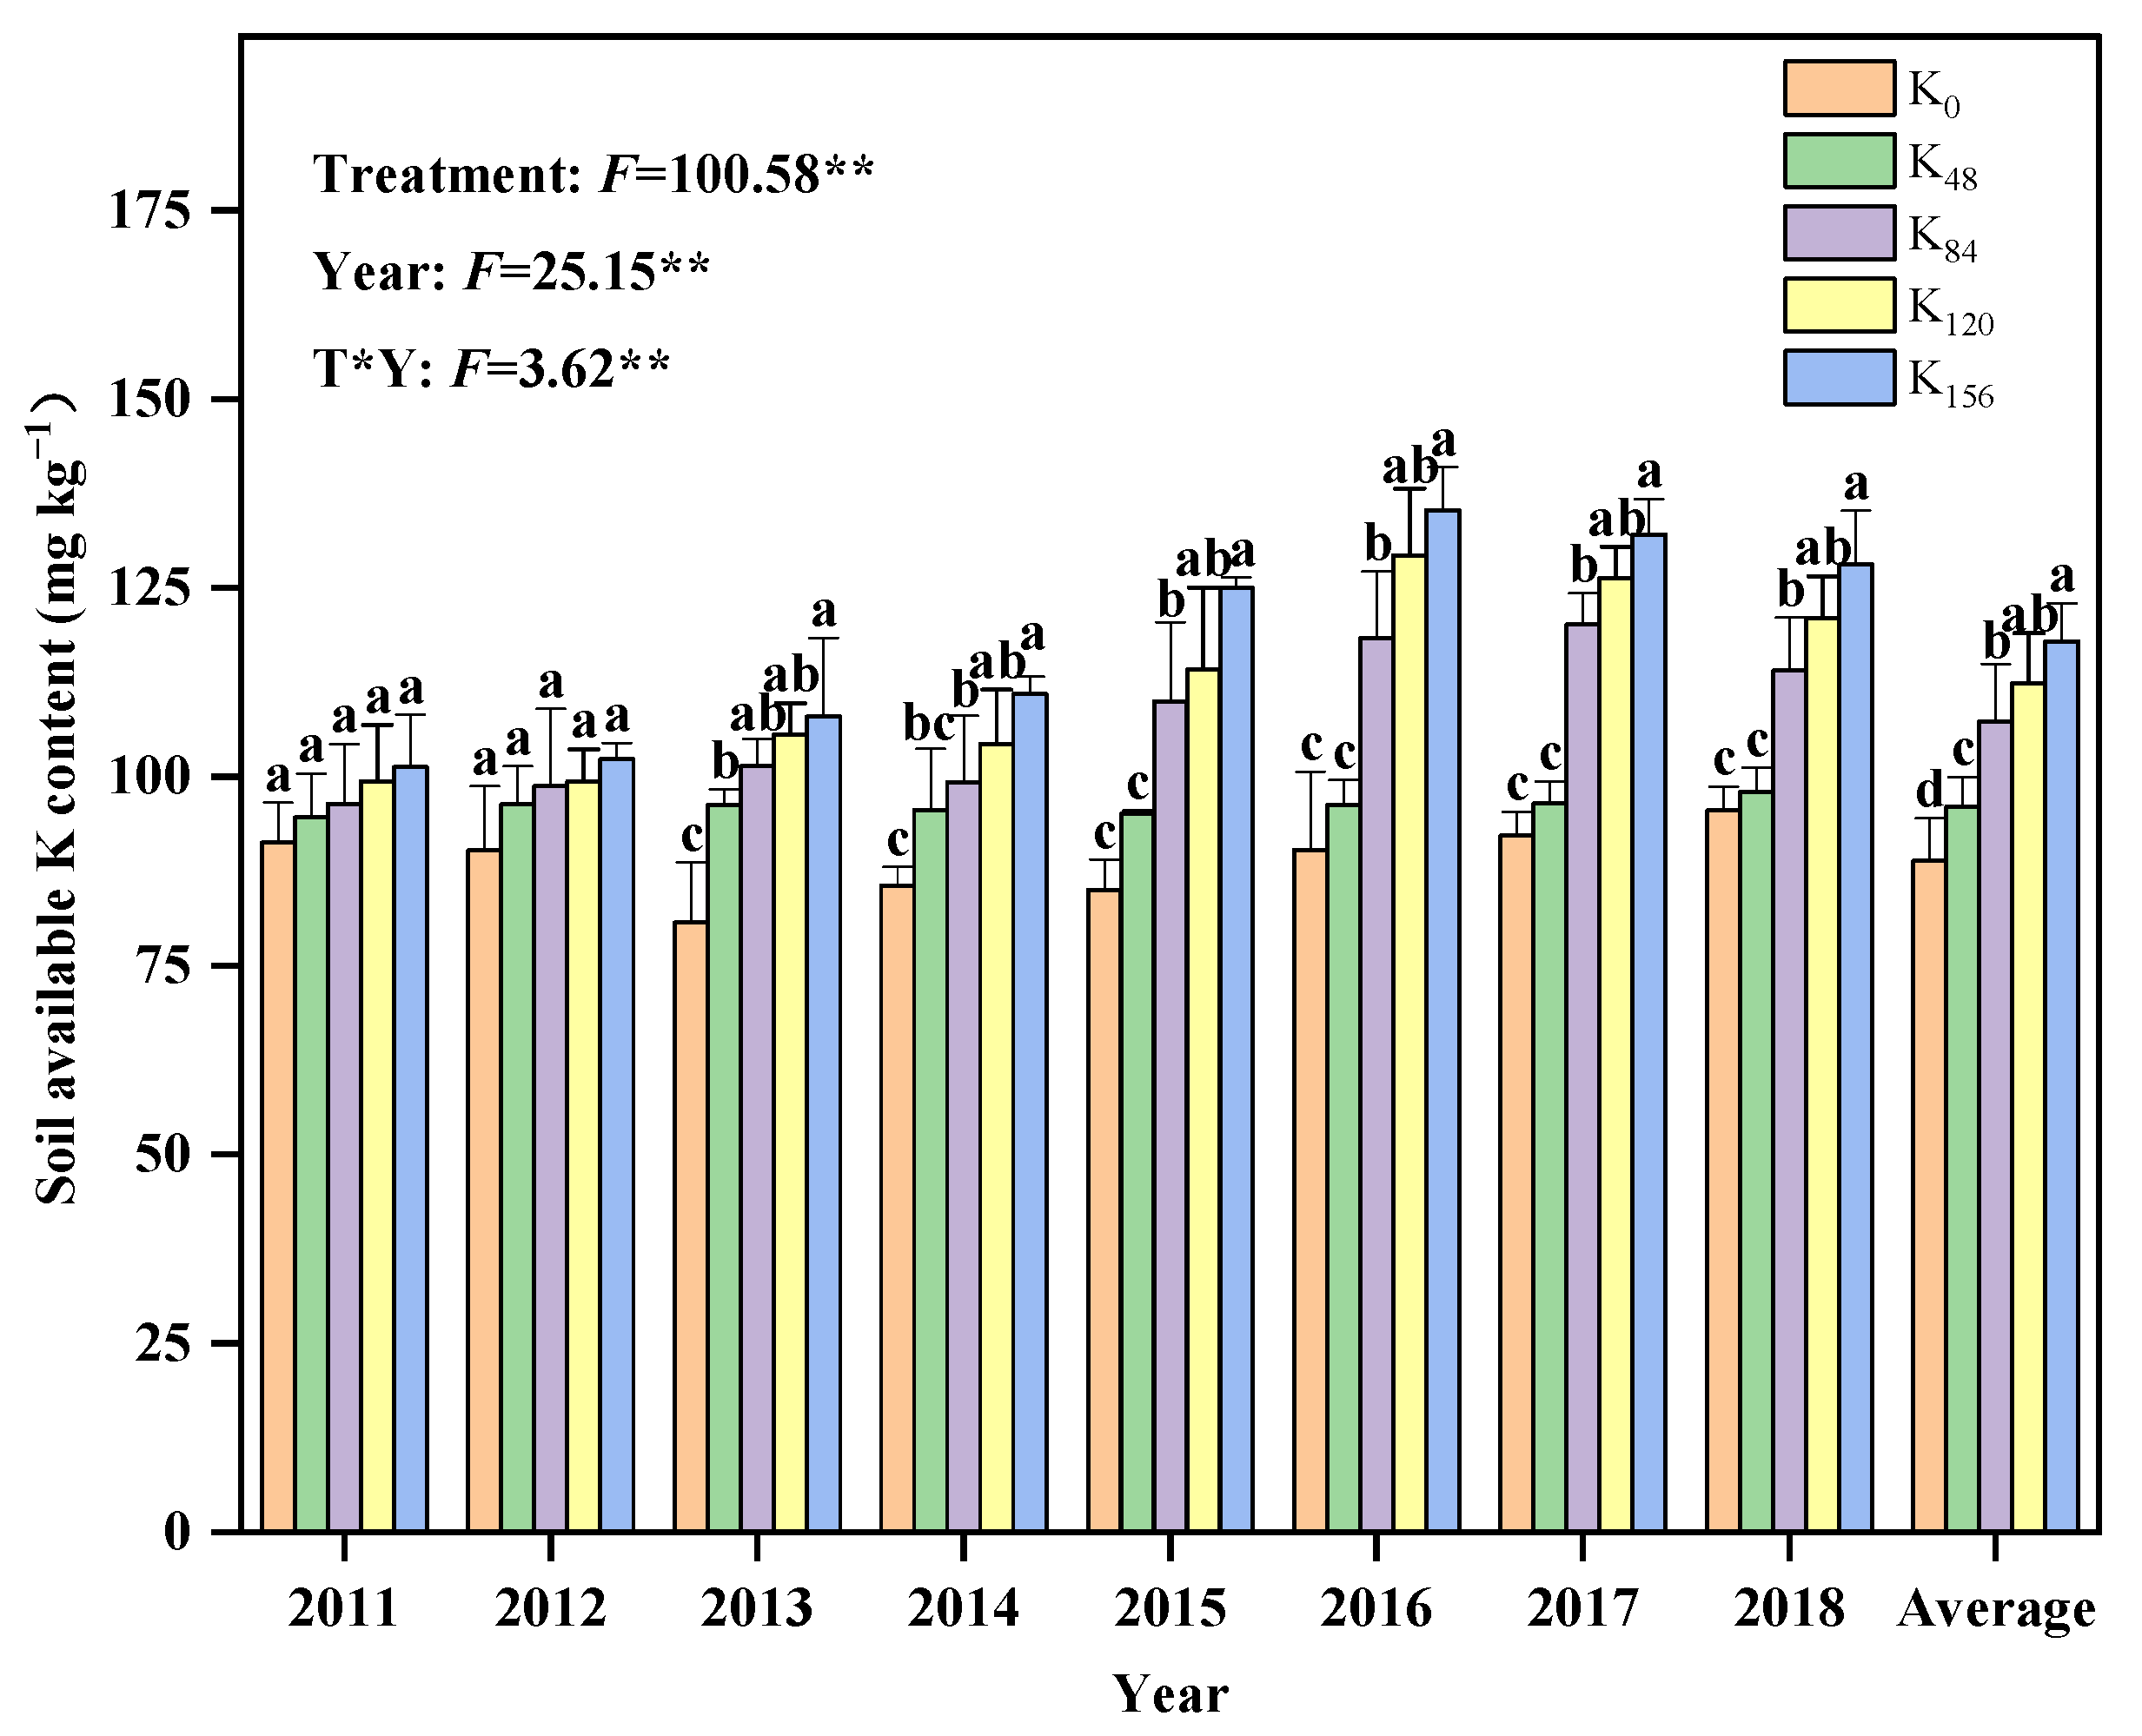
3.4. Soil Available K

The average soil available K content increased with increasing K fertilizer application rates, but the difference between K156 and K120 treatments was not significant (Figure 4). Compared with the K0 treatment, the average soil available K content in the K48, K84, K120 and K156 treatments was significantly increased by 8.1%, 20.8%, 26.5% and 32.7%, respectively. Compared with the initial soil available K content in 2010 (96.7 mg kg−1), the soil available K content in the K0 treatments was basically at the same level after eight years of rotation. However, the soil available K content in the K84, K120 and K156 treatments increased with the extension of rotation years and by 18.0%, 25.1%, and 32.5% in 2018 compared with 2011, respectively. The regression equation showed that a significant positive correlation existed between the average soil available K content and the soil K balance (Figure 5). In addition, the soil available K content was affected by the accumulated K balance. For every 100 kg ha−1 soil apparent K accumulation, the average soil available K content was increased by 10.9 mg kg−1.

4. Discussion

4.1. Potassium Fertilization Rates versus Crop Yield

Potassium is one of the necessary macronutrients for crop growth. Adequate K supply is of great significance for increasing yield and improving the quality of crop [35]. In the present study, the yields of maize and wheat increased with increasing K fertilizer application rates in the range of 0 to 120 kg K ha−1, while there was a tendency to decreased with further increases in K fertilization rates up to 156 kg K ha−1 (Figure 1). This might due to increased the crop chlorophyll content and the photosynthetic efficiency when applied K fertilizer application, leading to enhanced starch-based carbohydrate supply to the grains [36]. However, crop did not absorb luxurious amounts of K at the higher K fertilizer input (K156) (Figure 3), and the grain weigh of maize and wheat have not increased significantly (Tables S1 and S2), which was supported by Singh [37]. The regression test showed that the yield for maize and wheat were achieved with 111 and 115 kg K ha−1, where the crop yields were 10.2 and 7.8 t ha−1, respectively (Figure S2). Furthermore, the yield of maize and wheat varied among the experimental years (Figures S2 and S3). For maize, the yield variation was positively associated with the 1000-grain weight in the present study (Table S3); similar results were reported by others [38,39]. However, the variations in wheat grain yield resulted from not only grain weight but also the number of spikes and grains per spike (Table S3), with correlation coefficients of 0.706**, 0.552** and 0.324*, respectively. The linear regression between yield components and increased yield also indicated that the interannual variation in crop yield was due to the effect of K fertilization on 1000-grain weight (Figure S3), which was in accordance with the findings of Rajicic [40]. Moreover, our study indicated that the yield response of wheat affected by K fertilization was higher than that of maize (Figure S2). This might be due to the maize yield are generally higher than in wheat at this region, so the effect of K fertilizer application on yield is slightly lower than wheat [41]. This result was also supported by the lower soil K recovery efficiency of maize compared to that of wheat (Table 1 and Table 2). By fitting the theoretical and the optimal K fertilizer application over 8 years (Figure 2) (The optimal fertilizer application was based on annual maize and wheat prices, as shown in Figures S4 and S5), it can be seen that the K fertilizer application for the maize season tended to decrease with increasing farming years under the return of straw to the field, but this trend was nonsignificant in the wheat season. This may be due to the large variability of the treatment and year in the wheat season. Additionally, it also requires long-term experimental monitoring, which does not obvious over shorter periods.

4.2. Potassium Fertilization Rates versus Potassium Use Efficiency

The REK in the maize and wheat seasons was significantly decreased with K fertilization, which was highest under the K48 treatment (Table 1 and Table 2). This observation was mainly because the K input of the K156 treatment was higher than that of the K48 treatment (Figure 3). Zhan [12] stated that the K use efficiency decreased once the K application rate exceeded the crop demand. Maize season has the highest AEK at lower K fertilizer application (K48 treatment). However, the AEK of the K120 and K84 treatments were higher than K48 treatment in the wheat season, which was due to the better yield of wheat increasing in the K120 and K84 treatments (Figure 1). In addition, the AEK of the wheat season was higher than that of the maize season in the K84, K120, and K156 treatments (Table 1 and Table 2), and the yield response increase of wheat under these treatments was also higher than that of maize under K fertilization (Figure S2). Moreover, the REK of wheat under the K48, K84, K120 and K156 treatments was much higher than that of maize, which was in agreement with the findings of Zhang [41] and Bai [42]. This result may be due to the one-time input of straw K and K fertilizer, soil K resulted in a large amount of loss by leaching, runoff and infiltration in the maize season with high temperatures and heavy precipitation (Figure S1) [16,43]. In addition, REK was also affected by soil fertility [44], climatic characteristics [16], crop genetic [45], K fertilization rates [13] and other factors. From the perspective of the maize–wheat rotation system, the ARE in the four K fertilization treatments increased during the third rotation system period (2010–2013) and then stabilized without many variations (Table 3). These results indicated that although K fertilization had a residue-effect on accumulative recovery efficiency, it was not expansile with consecutive application of K fertilizers throughout the years.

4.3. Potassium Fertilization Rates versus Soil Potassium Balance

Long-term unbalanced fertilization (i.e., relatively low K input compared to high N and P inputs) in agricultural production will eventually cause severe soil K deficiency in China [46,47]. In the present experiment, the negative soil K balance in the K0 treatment was −29.0 kg ha−1, other treatments were gradually increased with increasing fertilizer and wheat straw inputs in the maize season (Figure 3). However, for the wheat season, the apparent balance of soil K was greater under the five treatments. This also shows that the K loss of wheat straw in the maize season was influenced by rainfall and irrigation, while the K application combined with straw can supply the needs of crop growth and supplement soil K. In terms of the maize–wheat rotation system, the soil K deficit was 24.3 kg ha−1 under the K0 treatment, which was consistent with the results from Singh [48]. However, Ju [49] showed that the soil apparent K balance was −163 kg ha−1 when 38 kg K ha−1 was applied. This result may be because the application of K fertilizer combined with the return of maize and wheat straw to the field supplemented the soil K. In addition, the average apparent K balance in the maize–wheat rotation system was surplus in the K48, K84, K120, and K156 treatments. These results indicate that the application of K fertilizer with straw return to the field was able to supplement the K removal by crop and achieve a surplus of the soil apparent K balance, which was consistent with previous studies [50,51]. Except for the fraction of which may be uptake by plant, the large amounts of surplus K may be fixed to nonexchangeable K (Figure 6) [52,53]. However, the fraction of fixed K is gradually released for crop uptake when there is rigorous depletion of K from the soil [54]. The soils was 2:1 clay minerals (illite, vermiculite and smectite) in our study region. Shakeri and Abtahi [55] reported that the high negative charge of these minerals increases the absorption capacity of cations such as K. Other researchers have also showed an increase in K fixation of soils by increase in added K levels into the soil [56,57].Therefore, the fixation of K can be seen as potential K reservoir. In the future g study, we will explore the dynamics of K fixation and release of the agricultural use of soils.

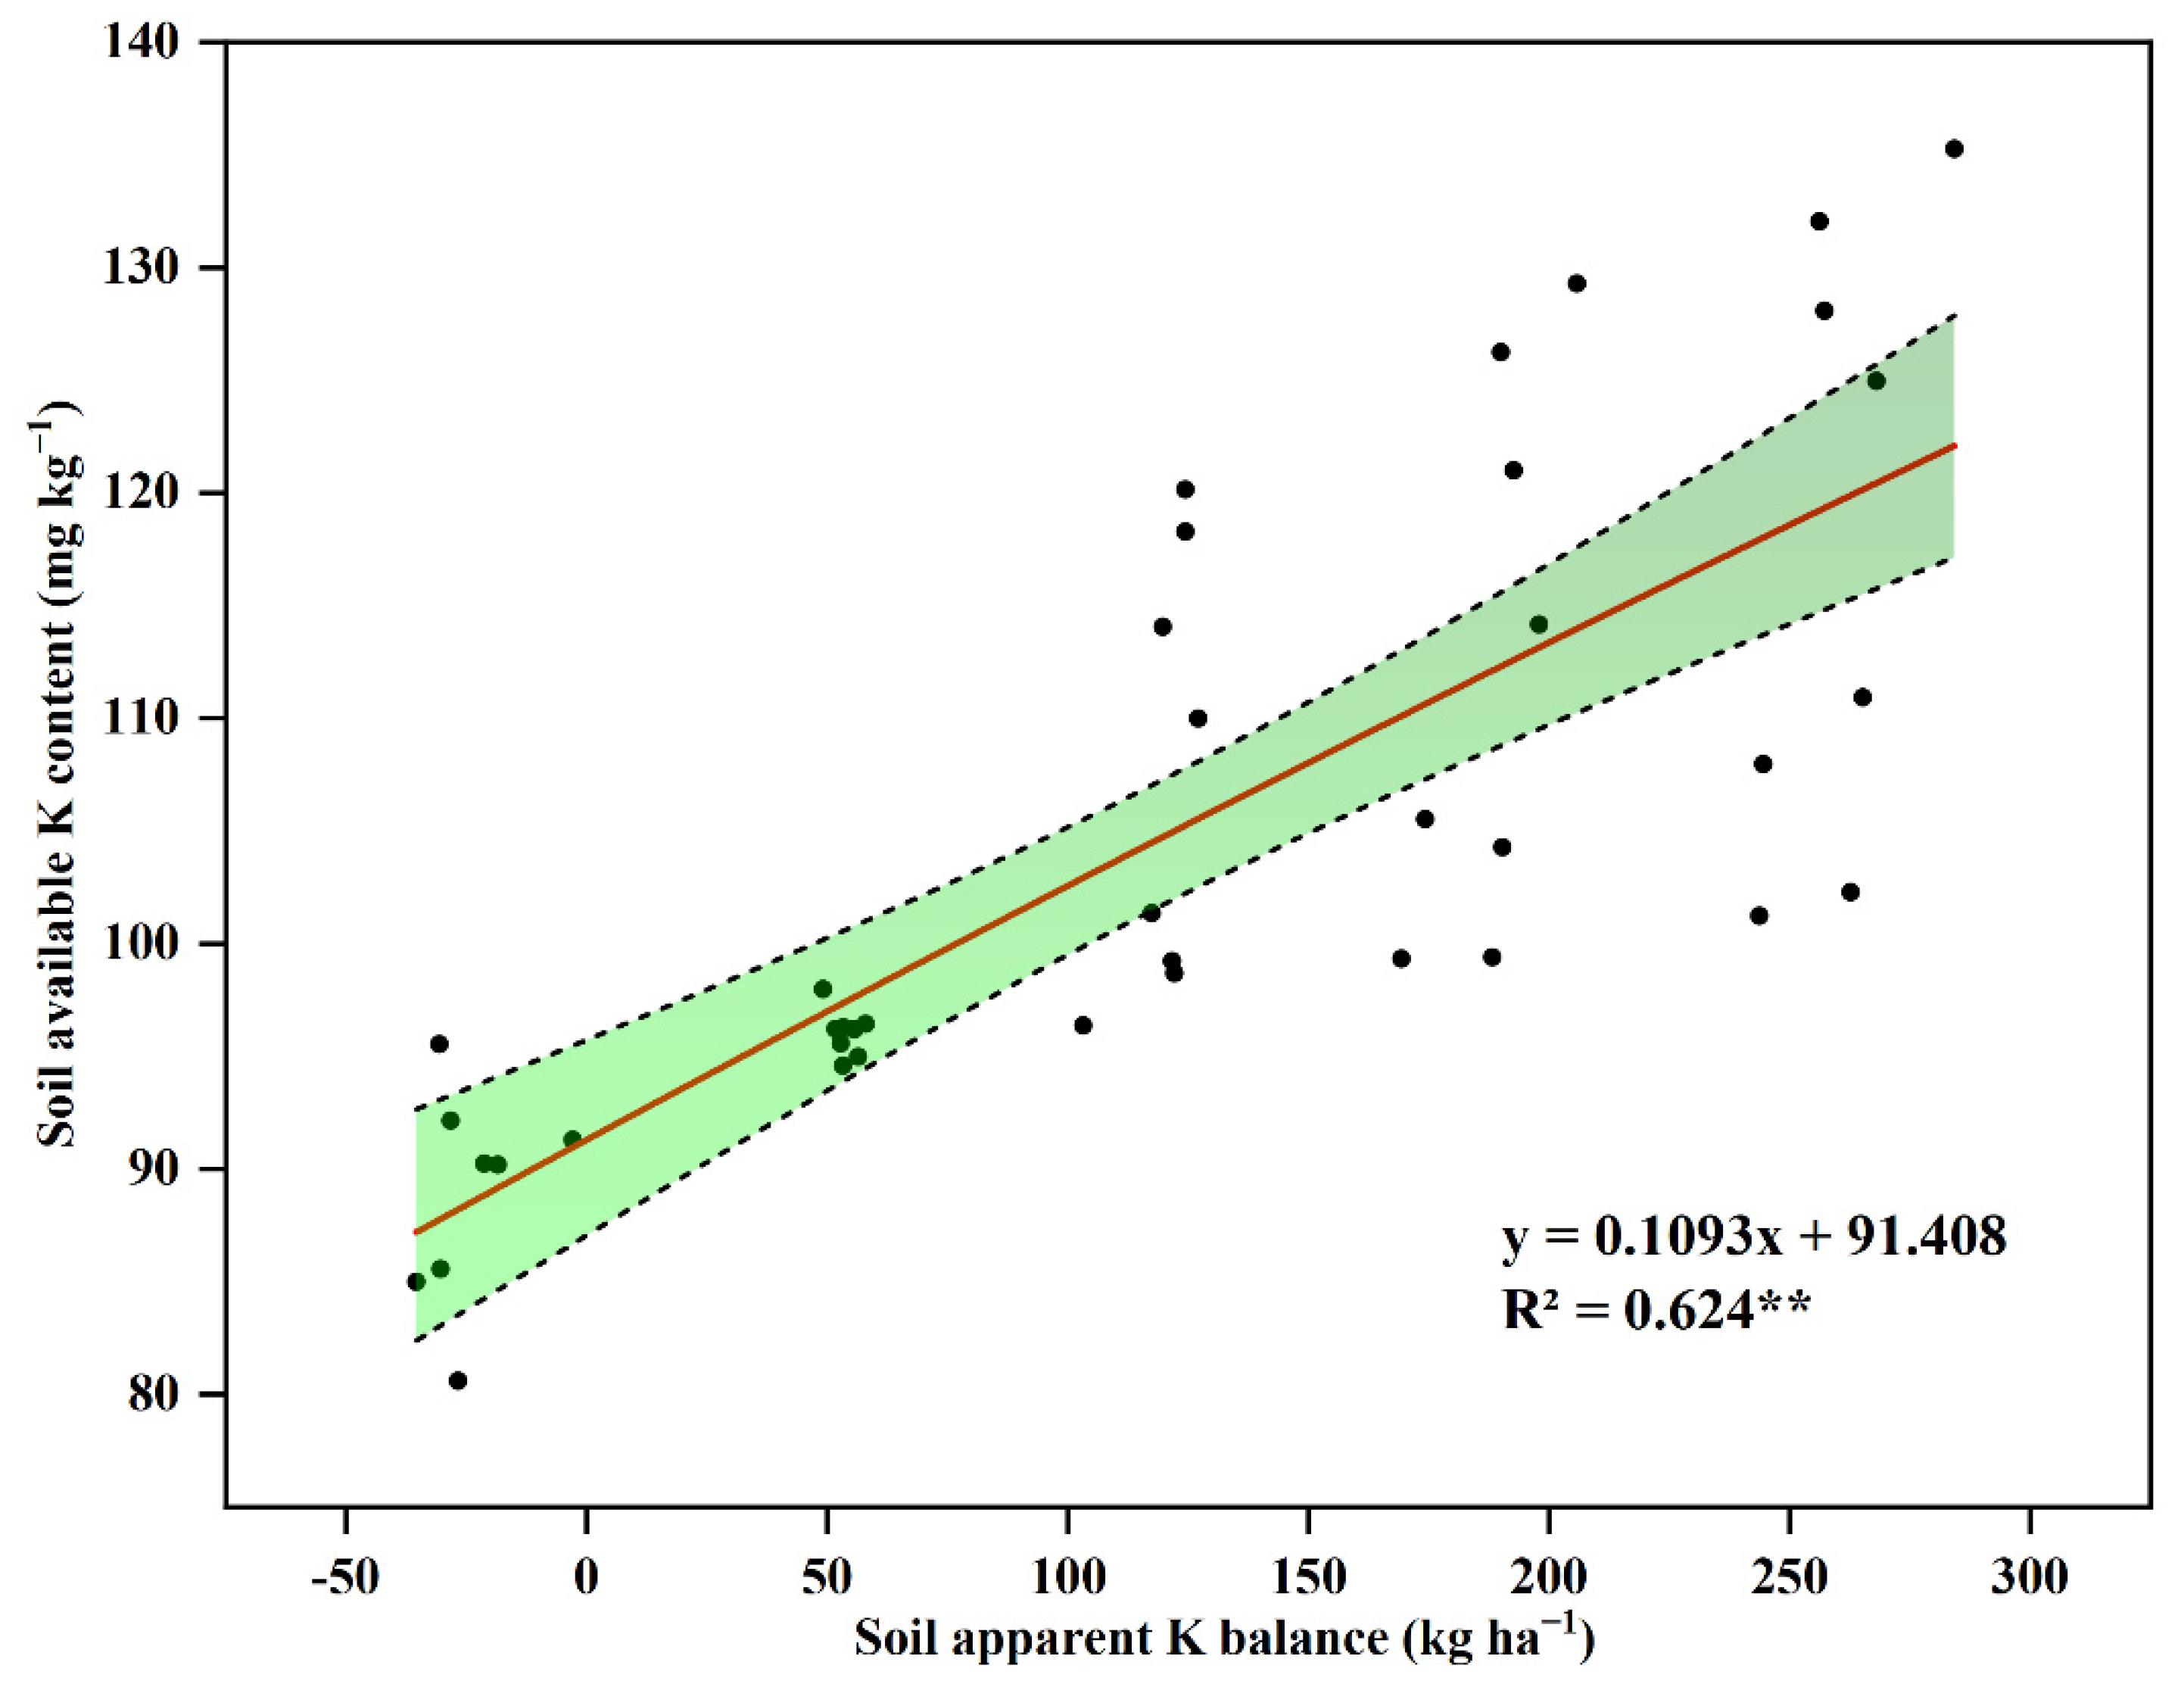
4.4. Soil Available Potassium versus Soil Potassium Balance

In this study, the soil available K under the K48, K84, K120, and K156 treatments was higher than that under the K0 treatment and increased with increasing K fertilization rates (Figure 4). There was the same K level after eight years of rotation in the K0 treatments compared with the initial soil available K content in 2010. This may be attributed to the release of nonexchangeable K in the soil, which supplements the depletion of soil available K [58]. This results also indicated that only straw return to the field can neither alleviate the depletion of soil K, and nor fundamentally maintain the supply capacity of the K reservoir. Although a high soil apparent K balance was surplus in the K84, K120 and K156 treatments in the present study (Figure 3), the soil available K content after eight years of rotation compared to the initial soil was only increased by 18.0%, 25.1% and 32.5%, respectively (Figure 4), and the soil available K content increased by 10.9 mg kg−1 per 100 kg ha−1 surplus K. It means that approximately 24.5 kg in 100 kg surplus K was transferred into available K pool in 0–20 cm soil profile and the 75% K surplus would be lost or fixed into nonexchangeable K and mineral K (Figure 6) in the lattice of clay minerals such as vermiculite and mica [59], thus mainly increasing the slowly available K and total K content in the soil [24]. This region has a high rainfall and frequency in summer. The transformation of straw K into water solution K after entering the soil was sensitive to rainfall, which can also lead to loss of K [60]. The variability of transformation into soil available K was greater when the soil K balance was higher than 100 kg ha−1, which could also explain these changes (Figure 5). In soil, there is a gradual change between each form of K (i.e., exchangeable K, water-soluble K and nonexchangeable K), and these forms remain in a dynamic equilibrium. The equilibrium is affected by soil organic, clay content and cation exchange capacity and environmental conditions [14,61].

5. Conclusions

Our studies have shown that the crop yields of maize and wheat were generally higher under K120 treatment, and the yield was not increased under excessive fertilization (K156). The REK was also significantly decreased with K fertilization supply in maize and wheat season. From the perspective of AEK, which was higher under the K48 treatment in the maize season. While the AEK in K84 and K120 treatments were higher in wheat season. The AEK and yield response increase in the wheat season was higher than that of the maize season. Meanwhile, the K fertilizer application in maize season showed a slight decreasing trend with fertilizer periods. In addition, the four fertilization treatments (K48, K84, K120, and K156) had large surpluses of soil K except for the non-fertilization treatment, and increased soil available K content. However, soil K surplus transformed to soil available K was smaller with massive fertilizer input (K120 and K156 treatments). In summary, we believe that K fertilizer application in the wheat season can be higher than in the maize season. In order to improve the K fertilizer efficiency and avoid the waste of large K surpluses, it is necessary to pay attention to the transformation between different K forms in the soil after K fertilizer application in the further study.

Supplementary Materials

The following supporting information can be downloaded at: https://www.mdpi.com/article/10.3390/agronomy12102565/s1, Figure S1: Monthly rainfall (mm) and mean temperature (°C) during the maize and wheat growing seasons from 2010 to 2018; Figure S2: Effects of different K fertilization rates on the average yields of maize and wheat; Table S1: Effects of different K fertilization rates on maize yield composition between 2010–2017; Table S2: Effects of different K fertilization rates on wheat yield composition between 2010–2018; Table S3: Correlation analysis of maize and wheat yields, yield composition; Figure S3: Linear regression between 1000-grain weight, grain number, effective spike number and increased of yield in maize and wheat by K application; Figure S4: Regression analysis of maize yield with K fertilizer application in 2010–2017; Figure S5: Regression analysis of wheat yield with K fertilizer application in 2011–2018.

Author Contributions

Formal analysis, B.H.; writing—review and editing, B.H., C.X. and W.M.; writing—original draft preparation, B.H.; supervision Z.S. and W.M.; investigation Q.J.; software B.H. and J.W.; conceptualization, W.M. All authors have read and agreed to the published version of the manuscript.

Funding

This work was supported by the National Key R&D Program of China (2021YFE0101900, 2016YFD0200403), the National Basic Research Program of China (2015CB150405), and the Special Fund for Agro-scientific Research in the Public Interest, China (201103003).

Data Availability Statement

Not applicable.

Acknowledgments

We would like to thank Lingyun Weng, Xiaoqia Yang and Jingjing Sun for management of the field experiments.

Conflicts of Interest

The authors declare no conflict of interest.

References

  1. Lin, Z.; Zoebisch, M.A.; Chen, G.; Feng, Z. Sustainability of farmers’ soil fertility management practices: A case study in the North China Plain. J. Environ. Manag. 2006, 79, 409–419. [Google Scholar]
  2. Pettigrew, W.T. Potassium influences on yield and quality production for maize, wheat, soybean and cotton. Physiol. Plant 2008, 133, 670–681. [Google Scholar] [CrossRef] [PubMed]
  3. Watanabe, K.; Murayama, T.; Niino, T.; Nitta, T.; Nanzyo, M. Reduction of phosphatic and potash fertilizer in sweet corn production by pre-transplanting application of potassium phosphate to plug seedlings. Plant Prod. Sci. 2005, 8, 608–616. [Google Scholar] [CrossRef] [Green Version]
  4. Gao, C.; Sun, B.; Zhang, T. Sustainable nutrient management in Chinese agriculture: Challenges and perspective. Pedosphere 2006, 16, 253–263. [Google Scholar] [CrossRef]
  5. Cao, M.; Yu, H.; Yan, H.; Jiang, C. Difference in tolerance to potassium deficiency between two maize [Zea mays] inbred lines. Plant Prod. Sci. 2007, 10, 42–46. [Google Scholar]
  6. Yahaya, S.M.; Mahmud, A.A.; Abdullahi, M.; Haruna, A. Recent advances in the chemistry of N, P, K as fertilizer in soil—A review. Pedosphere 2022, in press. [Google Scholar] [CrossRef]
  7. Tripler, C.E.; Kaushal, S.S.; Likens, G.E.; Walter, M.T. Patterns in potassium dynamics in forest ecosystems. Ecol. Lett. 2006, 9, 451–466. [Google Scholar] [CrossRef]
  8. Kubar, G.M.; Talpur, K.H.; Kandhro, M.N.; Khashkhali, S. Effect of potassium (K+) on growth, yield components and macronutrient accumulation in wheat crop. Pure Appl. Biol. 2018, 7, 248–254. [Google Scholar] [CrossRef]
  9. Atapattu, A.J.; Prasantha, B.D.R.; Amaratunga, K.S.P.; Marambe, B. Increased rate of potassium fertilizer at the time of heading enhances the quality of direct seeded rice. Chem. Biol. Technol. Agric. 2018, 5, 1–9. [Google Scholar] [CrossRef]
  10. Wang, H.; Ji, J.; Wang, B.; Zhao, P. Effects of long-term potassium application and wheat straw return to cinnamon soil on wheat yields and soil potassium balance in Shanxi. Plant Nutr. Fertil. Sci. 2010, 16, 801–808. [Google Scholar]
  11. Niu, J.; Zhang, W.; Chen, X.; Li, C.; Zhang, F.; Jiang, L.; Liu, Z.; Xiao, K.; Assaraf, M.; Imas, P. Potassium fertilization on maize under different productionp practices in the North China Plain. Agron. J. 2011, 103, 822–829. [Google Scholar] [CrossRef] [Green Version]
  12. Zhan, A.; Zou, C.; Ye, Y.; Liu, Z.; Cui, Z.; Chen, X. Estimating on-farm wheat yield response to potassium and potassium uptake requirement in China. Field Crops Res. 2016, 191, 13–19. [Google Scholar] [CrossRef]
  13. Qiu, S.; Xie, J.; Zhao, S.; Xu, X.; Hou, Y.; Wang, X.; Zhou, W.; He, P.; Johnston, A.M.; Christie, P.; et al. Long-term effects of potassium fertilization on yield, efficiency, and soil fertility status in a rain-fed maize system in northeast China. Field Crops Res. 2014, 163, 1–9. [Google Scholar] [CrossRef]
  14. Dhillon, J.S.; Eickhoff, E.M.; Mullen, R.W.; Raun, W.R. World potassium use efficiency in cereal crops. Agron. J. 2019, 111, 889–896. [Google Scholar] [CrossRef] [Green Version]
  15. Zhang, F.; Wang, J.; Zhang, W.; Cui, Z.; Ma, W.; Chen, X.; Jiang, R. Nuterient use efficiencies of major cereal crops in China and measures for improvement. Acta Pedol. Sin. 2008, 45, 916–922. [Google Scholar]
  16. Zhang, H.; Yang, X.; He, X.; Xu, M.; Huang, S.; Liu, H.; Wang, B. Effect of long-term potassium fertilization on crop yield and potassium efficiency and balance under wheat-maize rotation in China. Pedosphere 2011, 21, 154–163. [Google Scholar] [CrossRef]
  17. He, C.; Zhu, O.; Tian, Z.; Schaffer, H.D. Yield and potassium balance in a wheat–maize cropping system of the North China Plain. Agron. J. 2012, 104, 1016–1022. [Google Scholar] [CrossRef]
  18. Niu, J.; Zhang, W.; Ru, S.; Chen, X.; Xiao, K.; Zhang, X.; Assaraf, M.; Imas, P.; Magen, H.; Zhang, F. Effects of potassium fertilization on winter wheat under different production practices in the North China Plain. Field Crops Res. 2013, 140, 69–76. [Google Scholar] [CrossRef]
  19. Sharma, A.; Jalali, V.K.; Arora, S. Non-exchangeable potassium release and its removal in foot-hill soils of North-west Himalayas. Catena 2010, 82, 112–117. [Google Scholar] [CrossRef]
  20. Moody, P.W.; Bell, M.J. Availability of soil potassium and diagnostic soil tests. Aust. J. Soil Res. 2006, 44, 265–275. [Google Scholar] [CrossRef] [Green Version]
  21. Syers, J. Potassium in Soils: Current Concepts; Feed the soil to feed the people The role of potash in sustainable agriculture; International Potash Institute: Basel, Switzerland, 2002; p. 301. [Google Scholar]
  22. Barré, P.; Montagnier, C.; Chenu, C.; Abbadie, L.; Velde, B.J.P. Soil Clay minerals as a soil potassium reservoir: Observation and quantification through X-ray diffraction. Plant Soil 2008, 302, 213–220. [Google Scholar] [CrossRef]
  23. Barré, P.; Velde, B.; Fontaine, C.; Catel, N.; Abbadie, L. Which 2:1 clay minerals are involved in the soil potassium reservoir? Insights from potassium addition or removal experiments on three temperate grassland soil clay assemblages. Geoderma 2008, 146, 216–223. [Google Scholar] [CrossRef]
  24. Römheld, V.; Kirkby, E.A. Research on potassium in agriculture: Needs and prospects. Plant Soil 2010, 335, 155–180. [Google Scholar] [CrossRef]
  25. Yang, X.; Liu, J.; Wang, W.; Ye, Z.; Luo, A. Potassium internal use efficiency relative to growth vigor, potassium distribution, and carbohydrate allocation in rice genotypes. J. Plant Nutr. 2004, 27, 837–852. [Google Scholar] [CrossRef]
  26. Zhao, S.; He, P.; Qiu, S.; Jia, L.; Liu, M.; Jin, J.; Johnston, A.M. Long-term effects of potassium fertilization and straw return on soil potassium levels and crop yields in north-central China. Field Crops Res. 2014, 169, 116–122. [Google Scholar] [CrossRef]
  27. Majumdar, K.; Sanyal, S.K.; Singh, V.K.; Dutta, S.; Satyanarayana, T.; Dwivedi, B.S. Potassium fertiliser management in indian agriculture:current trends and future needs. Indian J. Fertil. 2017, 13, 20–30. [Google Scholar]
  28. Ali, M.Y.; Waddington, S.R.; Timsina, J.; Hodson, D.; Dixon, J. Maize–rice cropping systems in Bangladesh: Status and research needs. J. Agric. Sci. Technol. 2009, 3, 35–53. [Google Scholar]
  29. Zhang, H.; Xu, M.; Shi, X.; Li, Z.; Huang, Q.; Wang, X. Rice yield, potassium uptake and apparent balance under long-term fertilization in rice-based cropping systems in southern China. Nutr. Cycl. Agroecosyst. 2010, 88, 341–349. [Google Scholar] [CrossRef]
  30. Xu, X.; He, P.; Pampolino, M.F.; Johnston, A.M.; Qiu, S.; Zhao, S.; Chuan, L.; Zhou, W. Fertilizer recommendation for maize in China based on yield response and agronomic efficiency. Field Crops Res. 2014, 157, 27–34. [Google Scholar] [CrossRef]
  31. Heming, S. Potassium balances for arable soils in southern England 1986–1999. Soil Use Manag. 2004, 20, 410–417. [Google Scholar] [CrossRef]
  32. Dawe, D.; Dobermann, A.; Moya, P.; Abdulrachman, S.; Singh, B.; Lal, P.; Li, S.Y.; Lin, B.; Panaullah, G.; Sariam, O.; et al. How widespread are yield declines in long-term rice experiments in Asia? Field Crops Res. 2000, 66, 175–193. [Google Scholar] [CrossRef]
  33. Camara, K.M.; Payne, W.; Rasmussen, P.E. Long-term effects of tillage, nitrogen, and rainfall on winter wheat yields in the Pacific Northwest. Agron. J. 2003, 95, 828–835. [Google Scholar] [CrossRef] [Green Version]
  34. Helmke, P.A.; Sparks, D.L. Lithium, Sodium, Potassium, Rubidiumand Cesium. In Methods of Soil Analysis, Part 3; ASA and SSSA: Madison, WI, USA, 1996. [Google Scholar]
  35. Dong, H.; Kong, X.; Li, W.; Tang, W.; Zhang, D. Effects of plant density and nitrogen and potassium fertilization on cotton yield and uptake of major nutrients in two fields with varying fertility. Field Crops Res. 2010, 119, 106–113. [Google Scholar] [CrossRef]
  36. Xie, J.; Zhou, J.; Hardter, R. Potassium and Chinese Agriculture; Hohai University Press: Nanjing, China, 2000. [Google Scholar]
  37. Singh, V.K.; Dwivedi, B.S.; Singh, S.K.; Majumdar, K.; Jat, M.L.; Mishra, R.P.; Rani, M. Soil physical properties, yield trends and economics after five years of conservation agriculture based rice-maize system in north–western India. Soil Tillage Res. 2016, 155, 133–148. [Google Scholar] [CrossRef]
  38. Sweeney, D.W.; Granade, G.V.; Eversmeyer, M.G.; Whitney, D.A. Phosphorus, potassium, chloride, and fungicide effects on wheat yield and leaf rust severity. J. Plant Nutr. Soil Sci. 2000, 23, 1267–1281. [Google Scholar] [CrossRef]
  39. Sharma, S.; Duveiller, E.; Basnet, R.; Karki, C.B.; Sharma, R.C. Effect of potash fertilization on Helminthosporium leaf blight severity in wheat, and associated increases in grain yield and kernel weight. Field Crops Res. 2005, 93, 142–150. [Google Scholar] [CrossRef]
  40. Rajicic, V.; Milivojevic, J.; Popovic, V.; Brankovic, S.; Djuric, N.; Perisic, V.; Terzic, D. Winter wheat yield and quality depending on the level of nitrogen, phosphorus and potassium fertilization. J. Agric. For. 2019, 65, 79–88. [Google Scholar] [CrossRef]
  41. Zhang, H.; Zhang, L.; Huang, Y.; Ye, Y.; Cui, J.; Sokolowski, E. Eeffect of potassium application on yield and soil potassium balance in maize and wheat rotation system. J. Triticeae Crops 2013, 33, 988–995. [Google Scholar]
  42. Bai, Y.-L.; Wang, L.; Lu, Y.-L.; Yang, L.-P.; Zhou, L.-P.; NI, L.; Cheng, M.-F. Effects of long-term full straw return on yield and potassium response in wheat–maize rotation. J. Integr. Agric. 2015, 14, 2467–2476. [Google Scholar] [CrossRef]
  43. Rodríguez-Lizana, A.; Carbonell, R.; González, P.; Ordóñez, R. N, P and K released by the field decomposition of residues of a pea–wheat–sunflower rotation. Nutr. Cycl. Agroecosyst. 2009, 87, 199–208. [Google Scholar] [CrossRef]
  44. Premi, O.; Kandpal, B.; Rathore, S.; Shekhawat, K.; Chauhan, J. Green manuring, mustard residue recycling and fertilizer application affects productivity and sustainability of Indian mustard (Brassica juncea L.) in Indian semi-arid tropics. Ind. Crops Prod. 2013, 41, 423–429. [Google Scholar] [CrossRef]
  45. Wang, L.; Chen, F. Genotypic variation of potassium uptake and use efficiency in cotton (Gossypium hirsutum). J. Plant Nutr. Soil Sci. 2012, 175, 303–308. [Google Scholar] [CrossRef]
  46. Ju, X.; Zhang, F.; Bao, X.; Römheld, V.; Roelcke, M. Utilization and management of organic wastes in Chinese agriculture: Past, present and perspectives. Sci. China Ser. C Life Sci. 2005, 48, 965–979. [Google Scholar]
  47. Yang, S.; Li, F.; Malhi, S.S.; Wang, P.; Suo, D.; Wang, J. Long-Term fertilization effects on crop yield and nitrate nitrogen accumulation in soil in Northwestern China. Agron. J. 2004, 96, 1039–1049. [Google Scholar] [CrossRef]
  48. Singh, V.K.; Sharma, B.B.; Dwivedi, B.S. The impact of diversification of a rice wheat cropping system on crop productivity and soil fertility. J. Agric. Sci. 2002, 139, 405–412. [Google Scholar] [CrossRef]
  49. Ju, X.; Kou, C.; Christie, P.; Dou, Z.; Zhang, F. Changes in the soil environment from excessive application of fertilizers and manures to two contrasting intensive cropping systems on the North China Plain. Environ. Pollut. 2007, 145, 497–506. [Google Scholar] [CrossRef] [PubMed] [Green Version]
  50. Xu, X.; Ma, Y.; Zhang, R.; Shen, P. Effect of potassium application on transformation of soil potassium in different soils. Chin. J. Soil Sci. 2005, 36, 59–61. [Google Scholar]
  51. Tan, D.; Jin, J.; Jiang, L.; Huang, S.; Liu, Z. Potassium assessment of grain producing soils in North China. Agric. Ecosyst. Environ. 2012, 148, 65–71. [Google Scholar] [CrossRef]
  52. Cassman, K.G.; Bryant, D.C.; Higashi, S.L.; Roberts, B.A.; Kerby, T.A. Soil Potassium Balance and Cumulative Cotton Response to Annual Potassium. Soil Sci. Soc. Am. J. 1989, 53, 805–812. [Google Scholar] [CrossRef]
  53. Portela, E.; Monteiro, F.; Fonseca, M.; Abreu, M.M. Effect of soil mineralogy on potassium fixation in soils developed on different parent material. Geoderma 2019, 343, 226–234. [Google Scholar] [CrossRef]
  54. Bakker, E. The Impact of Plant Growth and Potassium Uptake on Clay Minerals in Soil; Université Grenoble Alpes (ComUE): Grenoble, France, 2018. [Google Scholar]
  55. Shakeri, S.; Abtahi, S.A. Potassium forms in calcareous soils as affected by clay minerals and soil development in Kohgiluyeh and Boyer-Ahmad Province, Southwest Iran. J. Arid Land 2018, 10, 217–232. [Google Scholar] [CrossRef] [Green Version]
  56. Ghiri, M.N.; Abtahi, A. Factors affecting potassium fixation in calcareous soils of southern Iran. Arch. Agron. Soil Sci. 2012, 58, 335–352. [Google Scholar] [CrossRef]
  57. Dhaliwal, A.K.; Gupta, R.K.; Singh, Y.; Singh, B. Potassium Fixation and Release Characteristics of Some Benchmark Soil Series under Rice-Wheat Cropping System in the Indo-Gangetic Plains of Northwestern India. Commun. Soil Sci. Plant Anal. 2006, 37, 827–845. [Google Scholar] [CrossRef]
  58. Jiang, C.; Zheng, Q.; Zu, C. Research progress on effects of straw returning on soil potassium and its substitute for potassium fertilizer. Chin. J. Ecol. 2015, 34, 1158–1165. [Google Scholar]
  59. Yu, W.; Jiang, Z.; Shen, S.; Zhang, L. K fertility and K deficit index of aquic brown soil under different fertilization systems. Chin. J. Appl. Ecol. 2007, 18, 2239–2244. [Google Scholar]
  60. Lu, D.; Dong, Y.; Chen, X.; Wang, H.; Zhou, J. Comparison of potential potassium leaching associated with organic and inorganic potassium sources in different arable soils in China. Pedosphere 2022, 32, 330–338. [Google Scholar] [CrossRef]
  61. Tan, D.; Liu, Z.; Jiang, L.; Luo, J.; Li, J. Long-term potash application and wheat straw return reduced soil potassium fixation and affected crop yields in North China. Nutr. Cycl. Agroecosyst. 2017, 108, 121–133. [Google Scholar] [CrossRef]
Figure 1. Effects of different K fertilization rates on maize and wheat yield between 2010 and 2018. K0, no K fertilizer application; K48, 48 kg K ha−1; K84, 84 kg K ha−1; K120, 120 kg K ha−1; K156, 156 kg K ha−1. Vertical T bars in the histogram indicate SE. Different letters indicate significant differences among treatments. Lowercase letters represent significant differences between different fertilization treatments in the same year (p < 0.05). * Significant at the 0.05 probability level. ** Significant at the 0.01 probability level.
Agronomy 12 02565 g001
Figure 2. Relationship between the theoretical K fertilizer application and the optimal K fertilizer application of maize and wheat for eight years. The black solid line represents the fitting equation of the theoretical K fertilizer application. The red solid line represents the fitting equation of the optimal fertilizer application. ns, represents nonsignificant differences at the 0.05.
Agronomy 12 02565 g002
Figure 3. Effects of different K fertilization rates on soil K balance. K0, no K fertilizer application; K48, 48 kg K ha−1; K84, 84 kg K ha−1; K120, 120 kg K ha−1; K156, 156 kg K ha−1. Vertical T bars in the histogram indicate SE. Different letters indicate significant differences among treatments.
Agronomy 12 02565 g003
Figure 4. Effects of different K fertilization rates on soil available K content between 2010 and 2018. K0, no K fertilizer application; K48, 48 kg K ha−1; K84, 84 kg K ha−1; K120, 120 kg K ha−1; K156, 156 kg K ha−1. Vertical T bars in the histogram indicate SE. Different letters indicate significant differences among treatments. ** Significant at the 0.01 probability level.
Agronomy 12 02565 g004
Figure 5. Relationship between soil apparent K balance and soil available K content. Linear regression is shown as a red solid line and dashed curve represents 95% confidence intervals (CI). ** Significant at the 0.01 probability level.
Agronomy 12 02565 g005
Figure 6. Relationship among available K, nonexchangeable K and mineral K in the soil-plant system.
Agronomy 12 02565 g006
Table 1. Effects of different K fertilization rates on K recovery efficiency (REK) and K agronomic efficiency (AEK) in maize season between 2010 and 2017.
YearREK (%)AEK (kg kg−1)
K0K48K84K120K156K0K48K84K120K156
2010-49.2 a36.5 b33.1 bc20.5 c-12.5 a3.7 b4.7 b3.7 b
2011-57.1 a39.7 b31.4 bc22.6 c-11.8 a3.3 b4.4 b3.5 b
2012-58.0 a44.3 b32.8 c20.9 d-3.6 a5.8 a5.6 a3.0 a
2013-38.3 a27.6 b23.0 bc14.2 d-16.0 ab12.8 ab20.6 a4.7 b
2014-27.0 a27.7 a22.6 ab16.1 b-27.5 a14.5 ab14.1 ab6.5 b
2015-24.6 a24.4 a18.1 b13.0 bc-12.7 ab12.6 ab20.4 a5.3 b
2016-28.7 a22.4 ab16.3 b11.2 bc-35.4 a13.8 b16.8 b9.5 b
2017-32.9 a25.7 b18.6 c12.5 d-16.4 a11.7 a14.2 a7.1 b
Mean-39.46 a31.04 b24.49 c16.38 d-16.3 a9.4 ab12.6 a5.4 b
F values
Treatment** **
Year** **
T*Y** ns
Values followed by lower case letter(s) within a column are significant at p < 0.05. ** indicated the significant at the 0.01 probability level. ns, represents nonsignificant at the 0.05 probability level.
Table 2. Effects of different K fertilization rates on K recovery efficiency (REK) and K agronomic efficiency (AEK) in wheat season between 2011 and 2018.
YearREK (%)AEK (kg kg−1)
K0K48K84K120K156K0K48K84K120K156
2011-68.5 a63.1 ab48.5 c35.7 d-16.1 a12.5 a13.5 a2 b
2012-72.3 a67 bc54.1 c37.9 d-1.1 d9.6 b12.8 a4.5 c
2013-74.5 a67.8 ab65 bc49.3 c-3.8 b7.5 a6.7 a0.2 c
2014-75.6 a67.5 b66.8 b49.2 c-24.2 a24.2 a21.4 a13.8 b
2015-76.3 a66.3 b65.8 b49.2 c-13.2 b23.1 a22.1 a11.8 b
2016-73.7 a65.7 b58.8 c39 d-21.5 a20.6 a16.4 b11.3 bc
2017-70.7 a68.5 ab67.1 ab48.1 c-14.4 a9.5 b10 ab4.3 c
2018-75.4 a71.5 a68.5 ab50.9 c-3.9 ab2.8 b6.9 a1.2b c
Mean-73.4 a67.2 b61.8 c44.9 d-12.3 a13.7 a13.7 a6.1 b
F values
Treatment** **
Year** **
T*Y* ns
Values followed by lower case letter(s) within a column are significant at p < 0.05. *, represents significant differences at the 0.05. **, represents significant differences at the 0.01. ns, represents nonsignificant differences at the 0.05.
Table 3. Effects of different K fertilization rates on accumulative recovery efficiency (ARE) in the maize–wheat rotation periods.
TreatmentARE (%)
2010–20112011–20122012–20132013–20142014–20152015–20162016–20172017–2018
K0--------
K4858.8 a61.8 a63.3 a61.7 a59.7 a57.9 a56.8 a56.4 a
K8449.8 b51.6 b53.1 b51.7 b50.7 b49.8 b49.2 b49.1 b
K12040.8 c41.8 c44.2 c44.4 c44.3 bc43.3 bc43.1 bc43.2 c
K15628.1 d29.2 d31.2 d31.3 d31.6 d30.6 d30.5 d30.6 d
F values
Treatment**
Year**
T*Yns
Values followed by lower case letter(s) within a column are significant at p < 0.05. ** represents significant at the 0.01 probability level. ns, represents nonsignificant at the 0.05 probability level.
Publisher’s Note: MDPI stays neutral with regard to jurisdictional claims in published maps and institutional affiliations.

