

Design and Implementation of Artificial Intelligence of Things for Tea (Camellia sinensis L.) Grown in a Plant Factory


Department of Biomechatronics Engineering, National Pingtung University of Science and Technology, Pingtung City 91201, Taiwan
*
Author to whom correspondence should be addressed.
Agronomy 2022, 12(10), 2384; https://doi.org/10.3390/agronomy12102384
Submission received: 15 August 2022
/
Revised: 23 September 2022
/
Accepted: 29 September 2022
/
Published: 1 October 2022
(This article belongs to the Special Issue The New Agricultural Revolution: From Traditional Farms to Smart Agriculture—New Technologies in Agriculture 5.0)
Abstract
:An innovative plant growth monitoring and environmental control platform is designed and implemented in this study. In addition to using multi-band artificial light sources for plant growth and development, an artificial intelligence of things (AIoT) approach is also utilised for environmental parameter monitoring, control, and the recording of plant growth traits and diseases. The five LED bands are white (5000 K), cool white (5500 K), blue (peak: 450 nm), red (660 nm), and light red (630 nm). The tea plant (Camellia sinensis f. formosana) is irradiated using lighting-emitting diodes (LED) composed of bands of different wavelengths. In addition, the number of leaves, contour area of the leaves, and leaf colour during the growth period of two varieties of tea plants (Taicha No. 18 and Taicha No. 8) under different irradiation intensities are analysed. Morphological image processing and deep learning models are simultaneously used to obtain plant growth characterization traits and diseases. The effect of the spectral distribution of the light source on the growth response of tea leaves and the effect of disease suppression are not fully understood. This study depicts how light quality affects the lighting formula changes in tea plants under controlled environments. The experimental results show that in three wavelength ranges (360–500 nm, 500–600 nm, and 600–760 nm), the light intensity ratio was 2.5:2.0:5.5 when the illuminance intensity was about 150 µmol∙m−2∙s−1 with a photoperiod of 20:4 (dark); this enabled more leaves, a smaller contour area of the leaves, and a light green colour of the leaves of the tea plant (Taicha No. 18). In addition, during the lighting treatment, when the ratio of the band with an irradiation intensity of 360–500 nm to that with an irradiation intensity of 500–600 nm was 2:1.5, it resulted in a better leaf disease inhibition effect. When the light intensity was increased to more than 400 µmol∙m−2∙s−1, it had little effect on the growth and development of the tea plants and the inhibition of diseases. The results of the study also found that there was a significant difference between the colour of the leaves and the relative chlorophyll content of the tea trees. Finally, the tea plant growth response data obtained from manual records and automatic records are compared and discussed. The accuracy rates of leaf number and disease were 94% and 87%, respectively. Compared with the results of manual measurement and recording, the errors were about 3–15%, which verified the effectiveness and practicability of the proposed solution. The innovative platform provides a data-driven crop modeling application for plant factories.
1. Introduction
Extreme climate change leads to irregular crop harvest times and a cost risk of over- or under-production [1,2,3,4]. The OECD-FAO (2020) committee has estimated that global demand for agricultural products will increase by 15% in the next 10 years. However, in the face of an ageing farmer population and limited farmland, crop production efficiency has been reduced [5]. Fortunately, large-scale plant growth chambers can produce large quantities of vegetable crops, flower plants, or microgreens without the use of pesticides, thus reducing soil and environmental pollution. This practice can overcome the limitations of abnormal climates to realise the behaviour of agricultural production [6].
Its main concept is to simulate an ecological system indoors in which environmental parameters, including temperature, humidity, carbon dioxide concentration, and light intensity, are monitored and controlled [7,8,9]. Environmental parameters can be achieved through some environmental control strategies and by some facilities to achieve an ideal crop growth environment. Nevertheless, it is quite difficult to maintain consistent environmental parameters over large-scale areas, which consume huge amounts of electricity and increase production costs. Furthermore, when a large number of crop production operations are implemented in larger-scale factories, cultivators must constantly check the growth status of plants and environmental changes in the cultivation field, which also brings some risks of bacterial invasion and increases the probability of plant infection. Mishandling by personnel can also damage plants and cause diseases and even the spread of pathogens in the plant factories, resulting in yield loss.
To address these constraints and ensure food security, effectively applying automatic and intelligent technology to reduce labour costs and achieve the most efficient food production under limited time and manpower has become one of the key factors for the success of future agricultural upgrading. At present, the functions of crop production platforms in a plant factory focus on monitoring and controlling environmental parameters throughout the whole area of a plant factory. This production mode consumes a lot of ineffective power in areas where crops are not planted, such as aisles, corners, or locations near the ceiling. Therefore, reducing the number of workers entering and leaving the factory, avoiding contact with crops, and reducing energy consumption using environmental control technology is a challenging topic for plant production factory managers.
Relying on the improvement of wireless network technology, Internet of Things (IoT) technology has gradually undergone civil and industrial use in the past five years, such as in industry, hospitals, transportation, etc. [10]. Its technology connects sensing devices, cameras, and other measuring instruments to each other through different types of communication protocols to form a sensing and actuator network [11,12]. This technology is also applied in agricultural fields, such as water-saving irrigation; crop growth environment monitoring; agricultural product quality, safety, and traceability; and other fields to achieve improvements in natural resources and reduce costs [13,14,15], especially in the development and application of wireless sensor networks in crop watering [16]. The environmental data acquired by the sensing equipment are transmitted to the computing system through the IoT for data analysis; then, data mining is used to analyse these agricultural data to predict suitable environmental information such as temperature and humidity, and further optimise the management of crop growth.
The growth and development of the crop can be analysed by noting the contour area of its leaves and the number of leaves. Chlorophyll content is an important physiological parameter for plants to undergo photosynthesis and transpiration, and it is one of the indicators used to evaluate plant health. In addition, leaf traits are indicators for quantifying the severity of pests and diseases. Common methods of obtaining leaf parameters are drawing, weighing, and instrumentation, which are time-consuming and interfere with the crop growth environment. Meanwhile, a slight delay in notification causes the disease to spread. Image processing technology has become common practice in recent years. Users can use visual devices to extract plant phenotypic characteristics through non-destructive morphological algorithms [17,18].
In addition, various intelligent imaging systems can be used to identify plant species [19]. The system used a convolutional neural network (CNN) to classify 22 early-stage crop species with 86.2% accuracy. Barre et al. [20] proposed a CNN model named LeafNet, which can identify leaves to determine plant species. The LeafNet model classifies different species of plant within the three datasets with performance accuracies ranging from 86.3% to 97.9%. Combining image processing technology, an orthophoto mosaic, and a convolutional neural network (CNN) can also be used to quickly count plant numbers, and determine their geo-location, gaps (locations with dead or no plants), and heights in the field, and even the number of dead plants. These functions are packaged into a convenient interactive and user-friendly application that provides users with the automatic creation of plant inventories and the evaluation of plant characteristics [21].
In addition, image processing techniques and CNNs have also been applied to identify leaf diseases [22,23,24,25]. Since the colour of disease spots is different from that of plant leaves, image processing techniques including colour transformation, median filtering, and object segmentation algorithms can be used to detect the location of disease spots [22]. Singh et al. [26] proposed a Genetic Algorithm (GA), which was used to segment the illness region from the smooth filtered leaf disease image. This method is superior to threshold-based or K-means cluster segmentation techniques, which are used to extract many features from images, such as colour and texture. An accuracy of 97.6% was obtained via the use of the SVM classifier. Chen et al. [27] used a LeafNet-based model to identify the types of diseases in tea leaves with an average accuracy of 90.16%. A more compact model based on AlexNet [28] identified nine plant diseases within the PlantVillage dataset, and achieved a maximum accuracy of 99.75% [29]. A multiscale feature extraction module introduced into an improved deep CNN of a CIFAR10-quick model has been proven to be effective for tea leaf disease identification, with an average recognition accuracy of 92.5% [30]. Furthermore, images of crop leaves are pre-binarised using adaptive Otsu’s thresholding algorithm, which makes the architecture easier and speeds up the operation of convolutional neural networks used as classifiers [31].
Redmon et al. [32] proposed a YoLo model for fast object detection. Various versions have been released [32,33] and applied to object detection in agricultural fields [34]. Despite the recent release of the latest YoLo model, fourth-generation YoLo (YoLov4) is still the most popular due to the incompatibility of the latest model’s operating environment and the fact that detection accuracy and processing speed have not been significantly improved. The aforementioned practice of the automatic identification of plant diseases can help farmers manage crops more efficiently, thereby increasing yields [24].
A non-toxic growing environment and food safety are the most important items for agricultural producers and consumers. In recent years, there has been a growing trend in health care, among which a variety of teas can boost the body’s immune system, fight inflammation, and even ward off cancer, heart disease, and severe acute respiratory syndrome coronavirus 2 (SARS-CoV-2) [35,36]. The growth quality of tea trees depends on the climatic environment of planting, including light, air, soil, and water quality. Cooler temperatures can cause tea trees to go dormant or grow slowly; conversely, high temperatures can lead to lower yields [37]. Tea trees are suitable for growing in humid and sunny environments. Most tea trees grow on hilly terrain or hillsides that are foggy all year round, and their abundant rainfall can maintain the water needed for tea tree growth. However, prolonged solar radiation exposure and wet soil make tea trees grow poorly; during cultivation, suitable temperatures and sufficient light intensity can make tea trees grow well. When there is sufficient rain but a lack of light, the growth rate of tea trees during the day is higher than that at night; when the temperature is high and the daylight strength is strong, the growth rate during the day is lower than that at night due to the increase in respiration and transpiration [38]. Additionally, in the process of tea cultivation, an increase in temperature and precipitation levels is conducive to the growth and distribution of most pest species, and the production of tea is directly affected by various external disturbances, such as air or water pollution [39,40]. Therefore, farmers often spray large amounts of pesticides and use herbicides to maintain good growth quality of their tea trees. However, this undoubtedly causes damage to the soil ecosystem and also causes environmental pollution, which indirectly affects consumers’ willingness to drink tea. Providing a safe growing environment is strictly the biggest challenge in the process of growing tea trees.
The use of light emitting diode (LED) artificial light sources for indoor plant lighting has been proven to increase the yield of leafy crops in a short period of time, and many studies have shown that different light formulations have different effects on the tissue of plant growth [41,42,43,44,45]. In general, broad-spectrum LEDs (such as white light) are preferred in horticultural production because they allow better visual inspection of plants and are comparable to or better than monochromatic LEDs [46]. Conversely, applying different formulas for light irradiation at different growth stages of plants can also regulate the amount of specific physiological tissues in plants [47,48]. Although LED lighting technology has been widely used in the fields of plant tissue culture and vegetable production, and in plant growth chamber nurseries, most of the research focuses on herbaceous plants, and this technology is rarely used in woody plants. There are no relevant research results on the use of LEDs to grow tea plants indoors. In addition, the cultivation environment still needs to be considered during crop planting, including the interaction of temperature with humidity, air speed, and carbon dioxide concentration [49]. Understanding these effects and quantifying them to optimally control the indoor environment can significantly improve plant yield and light use efficiency in plant factories [50].
This study presents the design and implementation of an artificial intelligence of things system for plant trait appearance and environmental monitoring, which is integrated with a commercial data analysis platform to manage plant cultivation in multiple zones through the proposed platform. Two varieties of potted tea plants were subjected to LED irradiation with different light formulations, and the lighting intensity of the three wavelength bands was adjusted during the mid-cultivation period. A morphology-based image processing technique and the YoLov4 model were used to detect the number, colour, and contour area of the leaves, and the type of disease, during cultivation. The environmental parameters of each cultivation zone were continuously maintained within a specific range by IoT-based sensing and control technology. The data analysis platform allows users to remotely observe the environmental data of each cultivation zone and send monitoring messages to users. These environmental factors and crop growth data can be utilised to quantify the growth processes of crops and their responses to the environment, which provides an innovative concept and the application of data-driven crop modelling in a plant factory [51]. The growth responses of tea plants under the irradiation of different light formulations, including leaf diseases, are also briefly discussed in this study.
2. Materials and Methods
2.1. Design Concept
Multiple cultivation zones are in the same closed space, and each cultivation zone is equipped with an environmental sensing module that includes sensors for illuminance, temperature, humidity, carbon dioxide, and soil moisture content. The environmental measurement system collects the environmental data and transmits it to the server in the data analysis platform via the Internet for storage. A micro-organic light-emitting diode (OLED) display interface is installed in each cultivation zone, which can provide field operators with the ability to observe the current environmental parameters. In addition, the user can also observe the environmental data in the cultivation zone through the web page. There are two web cameras (webcams) in the cultivation zone that can regularly capture plant images. One is installed on the front partition of the cultivation area (the viewing angle can be adjusted), and the other is installed on the side bracket of the cultivation shelf. Tea plant image datasets can be obtained by executing the image measurement system. The datasets are sent back to Google Cloud and the server on the data analysis platform to be stored. In addition, the built-in logic rule-based programme of the environmental control system sends a command to the actuator in each cultivation zone to drive the fan and the atomiser, thereby stabilising the temperature and humidity levels of each cultivation zone. Meanwhile, the controller’s built-in timer programme is executed at regular intervals to turn on and off the power to the drip irrigation device and the solenoid valve on the CO2 refill bottle. Finally, the built-in knowledge base of the data analysis platform is used to evaluate whether the current environmental parameters exceed the pre-set range. When an abnormal value occurs, the built-in notification programme on the platform is executed, and a warning message is sent to the app on the administrator’s mobile device. The framework of indoor cultivation with the artificial IoT is shown in Figure 1.
2.2. Implementation of the AIoT Platform
The platform is comprised of five parts: a double-layer planting shelf with LEDs, mist and CO2 generators, environmental measurement and control, image measurement, and a data query and display.
2.2.1. Double-Layer Planting Shelf with LEDs
Two double-layer LED planting shelves, called A and B, provided plant cultivation and lighting [52]. The dimensions were 120 cm × 75 cm × 200 cm (L × W × H), and the upper and middle layers were used for growing crops, named A1, A2, B1, and B2. Ranging from 360 to 760 nm, five LED lighting bands were selected as light treatments, namely white (5000 K), cool white (5500 K), blue (peak: 450 nm), red (peak: 660 nm), and light red (peak: 630 nm), and their spectral distributions are shown in Figure 2. The lighting facilities in each zone were composed of 12 LED light strips, which were evenly arranged and installed on the light board. Each group of light strips underwent a 24-h lighting test to ensure that its light intensity was stable. The beam angle, configuration spacing, and distance of each LED tube from the plants can affect the uniformity of light intensity distribution across the cultivation area. We set up multiple measurement points in the planting area. A quantum light sensor (3668I, Spectrum Technologies, Inc., Aurora, IL, USA) was used to measure the uniformity of light at plant cultivation. The sensing value was recorded using a data logger (WatchDog 1650, Spectrum Technologies, Inc., Aurora, IL, USA). The total recording time was 24 h. The ambient temperature at the cultivation zone was maintained at 20 ± 2 °C. The light intensity distributions at the four cultivation zones were tested. To randomly adjust the light intensity in the five LED lighting bands, when the required light intensities were all set to 300 µmol∙m−2∙s−1, the average light intensity 15 cm below the LED tubes was between 266 and 325 µmol∙m−2∙s−1. The light intensity around the planting area was the lowest, and was unsuitable for growing crops. The dimming controller could be used to adjust different light recipes, and shading plates were installed around the cultivation zone to reduce the interference of light irradiation from other shelves [52]. Temperature uniformity was measured using a handheld thermal imager (Fluke TiS60+; Fluke Co., Everett, WA, USA). Figure 3 shows the temperature distribution 5 cm below the LED tubes in cultivation zones A1 and B1. This was measured without any facilities operating in the cultivation area. The temperature distributions of the A1 zone and the B1 zone ranged from 20.2 to 22.1 degrees (Figure 3a) and 20.6 to 22.7 degrees (Figure 3b), respectively.
In addition, circulation fans placed on the right side and above the left side of each planting area (Figure 4) were used for air circulation and to reduce the heat concentration around the LED tubes.
2.2.2. Mist and CO2 Generators
The ultrasonic atomiser (Model: OKS-WH150W, Beijing OKSUltrasonic Group Co., Ltd., Beijing, China) is placed in a reverse osmosis (RO) water tank that converts liquid water into mist, pumped by a fan to each cultivation space through pipelines (Figure 5a). In addition, the CO2 cylinder also injects carbon dioxide gas into the mist generation box through the black water pipe (Figure 5b), and the gas is then transmitted to each cultivation zone through the pipeline. A set of sensing modules are placed in the central positions of the four cultivation zones, which are used to capture CO2 and humidity values. The fans installed on both sides of the cultivation area are used to evenly distribute the air and moisture in the cultivation area, so as to obtain more reliable CO2 concentration and humidity sensing values. Figure 5c shows the appearance of the CO2-filled cylinder, which includes a double-header pressure reducer (B570, ISTA company, Essen, Germany). The output working pressure is about 2–3 kg/cm2.
2.2.3. Environmental Measurement and Control
The environmental sensing module includes a microcontroller (NodeMCU V3, Espressif Systems Co., Ltd., Shanghai, China), an illumination sensing element (BH1750FVI, ROHM Co., Ltd., Tokyo, Japan), an environmental sensor (BME280, Bosch Sensortec GmbH, Reutlingen, Germany), a carbon dioxide sensor (MH-Z19B, Winsen Electronics Technology Co., Ltd., Zhengzhou, China), and capacitive soil moisture sensor. The circuit layout and appearance of the module are shown in Figure 5b and Figure 6a, respectively. Among them, the OLED display interface is attached to the outer casing of the module (the lower right corner of Figure 6b). The carbon dioxide sensor has a temperature compensation function, which must be calibrated manually as follows: First, place the sensor in an open space, and then confirm that the carbon dioxide concentration there is about 400 ppm. Then, connect the calibration pin of the sensor to 0 V for 7 s to start the calibration process. The calibration procedure is completed after the sensor is powered on for 20 min. The carbon dioxide sensor is calibrated every 3 months.
Each cultivation pot has a drip irrigation pipe, and a soil moisture sensor is installed in a randomly selected cultivation pot in each cultivation zone. The four zones share a set of dropper controllers that are mainly used to turn the water supply valve on and off to maintain the soil moisture level in the pots of each cultivation zone.
The mist generator and fan are used to increase air humidity and provide air circulation in the cultivation zone. The turn-on and turn-off principles of these facilities depend on a temperature- and humidity-control logic programme, as shown in Figure 7. First, the maximum value Tmax and the minimum value Tmin of the indoor temperature and the maximum value Hmax and the minimum value Hmin of the humidity are measured and set. Second, three thresholds within the range are set, including two thresholds for humidity (Ha and Hb) and one temperature threshold (Tth). The light sensor can be used to confirm whether the light intensity and irradiation time of the cultivation zone are the original settings, and can also ensure that the image of tea plant is captured under sufficient LED white-light irradiation.
2.2.4. Image Measurement
Two sets of webcams are set up in each cultivation zone. One camera module (Model: OV5647, Raspberry Pi Foundation, Cambridge, UK) captures the appearance of tea trees in the cultivation zone from the oblique side. Another set of cameras (Model: BRIO Ultra HD Pro, Logitech Inc., Lausanne, Switzerland) captures the appearance and growth of tea plants from a frontal view. Captured images are uploaded to Google Drive via an embedded controller (Raspberry Pi 3; Raspberry Pi Foundation, Cambridge, UK). The positions of the two webcams are adjusted according to the size of the plants to obtain the maximum angular field of view (AFOV).
The contour area of the leaves and the leaf colour of the tea plants are obtained via morphological image processing. One advantage of its use is that images can be provided in any desired format such as black and white, as well as different colour spaces, which are used to quickly detect objects in the image. The digital red–green–blue (RGB) images captured by the webcam are first converted to the hue–saturation–value (HSV) colour space to reduce the impact of lighting on object recognition. Next, four green ranges are defined in this layer: full green colour, light green, normal green, and dark green. Finally, different kinds of green objects are segmented to obtain four binarised images. Each image is subjected to morphological operations, including erosion, closure, thinning, Canny edge detection, and eight-neighbour connectivity, to obtain the number of leaves with different colours and the contour area of the leaves. The principles of morphological image processing are available from reference books and literature [18,53].
Meanwhile, one YoLov4 model is used to detect the number of leaves in the cultivation zone, and another YoLov4 model is used to detect the different types of diseased leaves (such as brown blight, white spot, and algal spot) and to count the number of diseased leaves. The measurement process of leaf traits is shown in Figure 8.
In principle, an object detection model usually consists of a convolutional neural network (backbone), a feature fusion layer (neck) and a prediction output layer (head). Among them, the convolutional neural network is used to extract the feature maps of the input image; the feature fusion layer uses some fusion operations and combinations to transmit the feature maps to the output layer, which predicts the types of output objects, and defines the bounding boxes and object confidence index (OCI). The YoLov4 model is currently the state-of-the-art object detector, outperforming all available methods on the COCO dataset in terms of detection speed and detection accuracy [54]. The structure of the YoLov4 model is illustrated in Figure 9. YoLov4 uses CSPDarknet53 as the backbone convolutional neural network [55]. Spatial pyramid pooling (SPPnet) [56] and the path aggregation network (PANet) [57] are used as a feature fusion layer. They use the same architecture of the prediction output layer as YoLov3, which is used to detect multiple small objects [33].
The input image is passed through 5 residual block bodies (R1–R5) to extract deep features. The network includes convolutional layers, a batch normalization layer, and a mish activation layer. In R3–R5, a cross-stage local network (CSPNet) is introduced, and the gradient information in the optimization process is propagated through different network paths to generate large correlation differences and reduce the repetition of gradient information, so that the network structure can reduce the computational cost [55]. Leaky-ReLU is used as the activation function of YoLov4 to reduce the computational cost.
Using SPPnet expends the receptive field of the detection model through max-pooling layers of different scales. PANet employs top-down and bottom-up methods to repeatedly extract features. As shown in Figure 9, Ci (I = 1, 2,…, 5) represents the fusion procedure of feature maps of different sizes in the neck layer. Ci performs convolution, batch normalization, and leaky-ReLU feature extraction and classification procedures. Among them, there are multiple max-pooling layers in C1, which integrate with the above operators to obtain feature information. C2 and C3 perform top-down methods for feature fusion. C4 executes the feature fusion process using a bottom-up method. Output 1, output 2, and output 3 represent the output of feature maps of different scales in the neck layer. The YoLo head includes YoLo head 1 (76 × 76), YoLo head 2 (38 × 38), and YoLo head 3 (19 × 19), which are utilised to fuse and interact with feature maps of different scales to detect objects of different sizes.
The loss functions used in the YoLov4 model include object classification loss (), confidence loss (), and object predicted location loss (). The sum of these losses is presented as Equation (1).
where , , and represent the balance coefficient. and use the cross-entropy method [58], which deals with the correlation difference between the two probability distributions, which is the same as the loss measurement of YoLov3. The object prediction position loss is determined based on the Complete Intersection Over Union (CIOU) algorithm [59], as shown in Equation (2).
where and represent the predicted bounding box and the ground-truth bounding box, respectively. means that “*” and “+” are executed as an Intersection Over Union operation. The symbol represents the penalty item. depicts the Euclidean distance of the centre point (predicted bounding box) and (ground-truth bounding box). is a constant coefficient. is a positive number, and is used to measure the consistency of the aspect ratio, as shown in Equations (3) and (4):
where and represent the width and height of the ground-truth bounding box, respectively, and and represent the width and height of the predicted bounding box, respectively. When z = 0, then . The function of is to control the width and height of the predicted bounding box to match the width and height of the ground-truth bounding box as quickly as possible.
2.2.5. Data Query and Display
The monitored data are stored in the structured query language (SQL) database on the local server. At the same time, the data are also transmitted to a public server platform, Thingspeak, which provides an intuitive user interface (UI) that can display historical environmental data and facility status. In addition, the interface also has a real-time display of environmental data and fan facility status. The user can set the data display range on this interface and filter out abnormal sensor data. Meanwhile, the interface provides a “notification robot” function option that can periodically send environmental data to the user. If the system detects abnormal data, such as temperature, air humidity, and soil humidity, that are too high or too low, or when the measured value exceeds the range set by the user, the function programme can also be executed to send a notification to the user [34].
2.3. Cultivation Environment
The experimental site is located in the Plant Cultivation Room of the Department of Biomechanical Engineering, National Pingtung University of Science and Technology, Pingtung County, Taiwan. Two 14-month-old potted tea plants were planted in A1/B1 (Taicha No. 18) and A2/B2 (Taicha No. 8). Cohesive laterite was used as the medium. The light treatment was divided into two stages, each of which lasted 3 months for a total of 6 months. The expected temperature and humidity of the four cultivation zones was 20 ± 2 °C and 80 ± 10%, respectively. The carbon dioxide concentration was maintained at 550 ± 50 ppm in the four cultivation zones. The soil moisture content was maintained at 80%. The indoor temperature and humidity were maintained at 18 ± 2 °C and 60 ± 10%, respectively. The environmental control parameters were set as follows: Tmax = 25 °C, Tmin = 15 °C, Hmax= 100%, Hmin= 40%, Ha = 60%, Hb = 90%, and Tth= 18 °C.
The numbers of tea trees planted in the first stage of the experiment were 18 (A1 zone), 16 (B1 zone), 15 (A2 zone), and 15 (B2 zone); in the second stage, the numbers of planted trees were 6 (A1 zone), 12 (B1 zone), 15 (A2 zone), and 15 (B2 zone). The tea plants in each cultivation zone were pre-selected by tea farmers, including the number of leaves, area of the leaves, and number of branches, to ensure that the traits of the tea plants were consistent in the early stage of the cultivation experiments. The environmental and image sensing modules and environmental control facilities were all pre-calibrated and tested to ensure that the sensing data were reliable.
During the cultivation of tea trees, different light treatments were given at different growth stages (as shown in Table 1), among which the spectrum of the A1 and A2 zones were light red (630 nm), blue (peak: 450 nm), and cool white (6500 K); the light spectrum of B1 and B2 were a combination of red (peak: 660 nm), blue (peak: 450 nm), and white (5500 K). The lighting period of the first stage was set to 20/4 (light/dark) hours. The light intensities of the A1, B1, A2, and B2 zones were 449, 140, 340, and 373 µmol∙m−2∙s−1, respectively.
In the second stage of the light treatment, zones A1 and B1 were irradiated continuously for 10 h each with two different light intensities. In addition, the lighting time of the A2 and B2 zones was maintained for 20 h. The lighting intensity of the A2 and B2 zones was regulated to 145 and 150 µmol∙m−2∙s−1, respectively, and their lighting intensity was less than half that of the first stage. The LED light formula of the four zones was also adjusted.
3. Experiments and Results
This section presents the process and results of the cultivation experiments on tea plants on the artificial IoT platform. The performance of environmental control and the growth response to light treatments applied at different growth stages are also described in this section.
3.1. Data Processing and Recording
Environmental data such as temperature, humidity, and carbon dioxide concentration were sampled per second by the measurement system and recorded on the server. Two cameras, located in each cultivation zone, captured images of the tea plants at 12 h intervals. During shooting, only the LED white light was activated to illuminate the plants to obtain the RGB digital images. An image feature extraction system was used to automatically extract and estimate leaf number, leaf contour area, leaf colour, and disease in the image. At the end of each stage of the lighting treatment, the data were analysed via analysis of variance (ANOVA). The python computer vision (OpenCV) library, provided in commercial and open-source image processing software, was used to perform morphological operations for leaf trait extraction, including estimation of the contour area of the leaves and leaf colour segmentation. The system was executed once a day, counting the average number of leaves and diseased leaves of each plant, and then, recording the data in the database. The Windows 10 operating system was used as the execution environment for the detection model (YoLov4). The tools and software used were Python3.6, OpenCV library, and CUDA10.2 (NVIDIA Developer, NVIDIA Inc., Santa Clara, CA, USA). The brand of the core processor was Intel Core i7-8750H@ 2.2 GHz with a GeForce graphics accelerator unit (GPU) (model: GeForce GTX 3070Ti, NVIDIA Inc.), which was used for model training.
The images of tea diseases used to train the model were obtained from previous planting experiments. Technicians trained on these disease images drew bounding boxes on the parts of interest and exported them to YoLo format. These images were used for model training and evaluation. Image data augmentation was utilised to expand the training dataset, which could improve the performance and generalisation of the model. For training and testing the leaf number detection model and the disease detection model, 340 and 520 images, respectively, were used. Among the 520 images, there were 170, 170, and 180 images of white spot disease, algal spot, and brown blight, respectively. Of these image samples, 90% were used for training, and 10% were used for testing. During training, the training loss achieved at each iteration was drawn to visualise model performance. Once the loss trend stabilised with no significant changes, the training process was stopped, and the corresponding weights of the model were saved for further evaluation and implementation. The training parameters (.cfg) of the two detection models were the same: a batch size of 64, resized images of 416 × 416 pixels, subdivisions of 32, momentum of 0.95, decay of 0.0005, a learning rate of 0.00013, max batches of 10,000, etc.
The number of leaves and the number of diseased leaves were also measured manually. The total number of leaves was counted once a day, and the average number of leaves per plant was recorded. Leaves that were too small were ignored. At the same time, the SPAD-502Plus metre (Model: SPAD-502Plus, KonicaMinolta Co., Ltd., Toyoko Japan) was used to obtain the relative chlorophyll content (Chl-a) of the leaves. Beginning with the third leaf at the bottom of the tea plant, measurements were made at five points on the leaf, and the average of these values was recorded. In this way, a total of 15 point measurements were made on the third to fifth leaves of the tea plant. When an outlier was detected, the measurement was repeated. In addition, at the end of each stage of the light treatments, LI3000C (Model: LI3000C, LI-COR Co., Ltd., Lincoln, NE, USA) was used to measure the contour area of the leaves of the tea plants, and the average value was recorded.
3.2. Results
3.2.1. Leaf Trait Extraction
The original digital RGB image (Figure 10a) was converted to an HSV colour space (Figure 11b). In the HSV colour space, the colour range of full green for H was [26,77], for S was [43,255], and for V was [30,255]. If S and V remained unchanged, the colour values of the H layer were set to [26,35] (light green), [35,50] (normal green), and [50,77] (dark green). The binarization operation was then performed, and the results are shown in Figure 11(c1−c3). Subsequently, a morphological operation, including erosion (Figure 11(d1−d3)), closure (Figure 11(e1−e3)), thinning (Figure 11(f1−f3)), and Canny edge detection was performed to determine the veins of the leaves and remove small-area objects, and the results are shown in Figure 11(g1−g3). Finally, the eight-neighbour connectivity method was used to separate the objects (Figure 11(h1–h3)) and frame them (Figure 11(i1–i3)). Note that the areas of objects that were too small were ignored. Figure 10a presents a snapshot of a tea plant from another view, and the colour space of its RGB image is converted to HSV (Figure 10b). Next, the full green area of the image was preserved, and the image was subjected to a binarization operation (Figure 10c). Finally, the contour detection operation was performed, and the results are shown in Figure 10d. The area inside the contour (in pixels) was also counted. The performance results of the leaf and disease detection models are shown in Table 2.
As shown in Table 2, the accuracy of the detection of the number of leaves was up to 97% in the zones with a narrow angular field of view (AFOV), and at least 91% in the areas with a wide AFOV for Taicha No. 18. The average accuracy, precision, recall, and F1-score of regional leaf number estimation were 94%, 91%, 84%, and 87%, respectively. Snapshots of the tea leaf detection results of the two tea plants are presented in Figure 12a,b. The result of the identification of the number of leaves on the tea plants with a wide AFOV is demonstrated in Figure 12c.
In terms of the performance metrics for leaf disease-type recognition, the average accuracy, precision, recall, and F1-score of diseased leaf detection in the zones were 87%, 94%, 88%, and 91%, respectively (see Table 3). There were three types of tea tree symptoms: white spot, brown blight, and algal spot. Snapshots of the leaf disease recognition results are presented in Figure 13. White spots, multiple infections, and algal spots on leaves were detected in Figure 13a, Figure 13b, and Figure 13c, respectively. Among them, the leaf diseases in Figure 13b include brown blight and white spots. The leaf disease detection results (a wide AFOV) are shown in Figure 13d,e. Most leaf diseases were brown blight and were identified.
3.2.2. LED Light Treatment
- First stage
The differences in the average number of leaves per plant, contour area of the leaves, and leaf colour between the two varieties of tea tree are shown in Figure 14. Among them, in terms of Taicha No. 18 (A1 and B1 layers), there was no significant difference in the number of leaves. However, the contour area of leaves of the A1 zone was greater than that of the B1 zone, and the leaf colour of the tea plants in the B1 zone was darker than that of the tea plants in the A1 zone. In terms of Taicha No. 8 (A2 and B2 zones), the number of leaves of tea plants in the B2 zone was higher than that of tea plants in the A2 zone, but there was no significant difference in contour area of the leaves. The number of light green leaves in the B2 zone was greater than that in the B1 zone.
- 2.
- Second stage
Similarly, at the end of the second stage of light treatment, the data on the leaf number, contour area of the leaves, and leaf colour were analysed and compared, and the results are shown in Figure 15. For Taicha No. 18, there was no significant difference in the number of the leaves of plants grown in the A1 and B1 zones (see Figure 15a).
The contour area of the leaves of plants grown in the B1 zone was significantly higher than in those grown in the A1 zone (Figure 15b); however, the leaves of the plants cultivated in the A1 zone were mostly dark green in colour (Figure 15c). In contrast, plants grown in the B1 zone had mostly normal green leaves (Figure 15d). For Taicha No. 8, the number of leaves in the A2 zone was lower than that in the B2 zone. The contour area of leaves in the B2 zone was significantly higher than for those in the A2 zone; there was no significant difference in leaf colour between the A2 and B2 zones.
In addition, the results of the leaf trait identification were also compared with those observed via manual methods, and are shown in Table 4. For Taicha No. 18, in the first stage of light treatment, about two to four diseased leaves per plant were obtained via automatic identification, and about four leaves per plant were recorded manually. In the second stage of light treatment, the number of diseased leaves obtained via automatic identification was about one to three per plant, while the number of diseased leaves obtained via the manual method was about two leaves per plant.
In the second stage of light treatment, the number of diseased leaves obtained via automatic identification was about one to three per plant, and the result of using the manual method was about two per plant. For Taicha No. 8, in the first and second stages of light treatment, the average number of diseased leaves obtained via automatic identification was one to five per plant; the result of using the manual method was about four to six per plant.
3.2.3. Environmental Control
Examples of changes in environmental parameters, such as temperature and humidity, within one month in each cultivation zone during the light treatment are shown in Figure 16 and Figure 17, and the grey area indicates the maximum and minimum range of parameter changes. The total length of the data records is up to 6 months. The black dotted line in the graph represents the mean value. As shown in Figure 16a, the average temperature in the A1 zone is between 17.6 and 21.5 degrees and the temperature fluctuation is about 2.4 degrees. During the period from 12:00 to 18:00 in the A2 zone, the temperature first drops from 19.3 degrees to the lowest point of 17.9 degrees, and then rise to about 19.1 degrees (see Figure 16b). From 12:00 to 18:00, the variation trend of the average temperature in the B1 (Figure 16c) and B2 (Figure 16d) zones is also the same as that in the A2 zone. The average temperature of B1 is slightly higher than that in the A1, A2, and B2 zones by 0.6, 1.2, and 0.7 degrees. In particular, the temperature fluctuations in the B1 zone were higher than those in the others, and among them, abnormal data appeared at two time intervals (8:00 and 22:00) in the B1 zone. The range of average temperature fluctuation in the B2 zone was about 2.2 degrees, which was the smallest among the four zones. The average humidity of the A1 zones from 3:00 to 16:00 was lower than 80% (see Figure 17a). It can be observed from Figure 17b that the average humidity of the A2 zone is about 91%, and the average humidity value in the interval from 4:00 to 17:00 has obvious fluctuations. The trends of average humidity in the B1 (Figure 17c) and B2 zones (Figure 17d) are similar to those in the A1 and A2 zones, respectively. However, the variation in humidity of B1 and B2 is relatively higher than that of A1 and A2. Assuming that one sample is collected at time point i every day, after N days, a total of N samples at time point i are collected. The range of fluctuations (FR) is defined and used to assess the variability in environmental parameters in the cultivation area, as represented by Equation (5)
Among them, and represent the maximum and minimum values in N samples at time point i, respectively. The symbol I depicts the number of samples per day. The average, maximum, minimum, and FR parameter values of temperature and humidity in each cultivation zone are shown in Table 5. The average temperatures in zones A1, B1, A2, and B2 were 19.62 °C, 20.20 °C, 19.04 °C, and 19.50 °C, respectively. The average humidity in zones A1, B1, A2, and B2 was 82.03%, 79.48%, 91.5%, and 92.68%, respectively. The temperature variation in each zone ranged from 2.23 to 2.65. However, the humidity fluctuations in the B1 and B2 zones ranged from 12.85 to 13.58, and were significantly higher than those in the A1 and A2 zones.
4. Discussion
4.1. Performance of Environmental Control
The position and direction of the sensor must consider air convection in the cultivation zone. Placing it in a location with poor air convection results in unreliable sensing data. The experimental results showed that the difference between the temperature measured by the instrument and the temperature measured by the sensor were within 0.5 degrees of each other. In addition, the indoor ambient temperature was still mainly regulated by air-conditioning equipment supplemented with fans and atomisers. The atomizer can produce a large amount of water vapour in the cultivation area in a short time and increase the humidity. Once the atomiser is turned off, the air humidity will gradually drop when the fan is turned on. The degree of the air humidity drop in the A1 and B1 zones is higher than that in A2 and B2 due to the fact that the two zones (A1 and B1) are located in the upper layer of the planting frame. The height of the A2 and B2 zones from the ground is the same as the height of the air outlet of the air conditioner, and the convection effect is better. In addition, the average ambient temperature of each cultivation area will rise by about 1.2 degrees when the LED light group is turned on, and the temperature will drop immediately once the LEDs are turned off (see Figure 16b,d). Since the light intensity of the A1 and B1 zones was higher than that of the A2 and B2 zones, the average temperature will be higher than that of the A1 and B1 zones. Since the ambient humidity in the cultivation area was at least 60%, there was no significant correlation between air humidity and soil moisture content in each cultivation zone.
The large fluctuation in carbon dioxide concentration in the cultivation zone was attributed to the operator entering and leaving the cultivation room. It can be observed from Figure 18b that although the LED light source was turned off from 15:00 to 19:00, the CO2 concentration in each zone decreased because the CO2 supplement was turned off. Because CO2 and mist are transmitted to each cultivation area using the same pipeline, when the CO2 or the atomiser is activated, the circulating fans in the water tank will be activated and the indoor air will be sent to each cultivation zone. This phenomenon caused some fluctuations in the environmental parameters of the cultivation zone.
In addition, it can also be observed from Figure 17 and Table 5 that if the humidity was maintained at about 90%, the number of leaf diseases in the tea plants tended to increase (such as in the A2 and B2 zones). The effect of atmospheric pressure on the growth response of tea trees was not considered in this study, and further research in this area still needs to be carried out.
4.2. Effect of Tea Plant Growth Response on LED Lighting Treatment
According to the results of the first and second stages of light treatment, the number of leaves and contour area of the leaves of tea plants can be effectively increased when the light intensity in the range of 600–760 nm is higher than the other wavelengths. In contrast, when the lighting intensity of 500–600 nm is higher than the other wavelengths, the leaf colour can be effectively shifted to dark green. No relevant research has been found to analyse the effects of different light qualities on the growth of tea plants, and most of the research subjects are lettuce. Wang et al. [60] observed that the increase in lettuce leaf area was proportional to the R/B ratio. Similar results were also observed in this study. Frąszczak et al. [61] mentioned that different varieties of lettuce seedlings also responded differently to the applied spectrum. Adding either blue or red light to white light significantly increased the relative chlorophyll content in dark green lettuce varieties. However, the experimental results for Taicha No. 18 in this study showed that an excessively high proportion of red light would inhibit the production of chlorophyll, while there was no significant difference for Taicha No. 8. The green light band is used to irradiate tea plants, which can increase the production of chlorophyll, but different lighting ratios also affect the increased amount of chlorophyll in tea plants.
Related studies have pointed out that the content of chlorophyll in tea has a significant correlation with catechins, and environmental factors, especially light, also affect the levels of catechins [62]. At low lighting intensities (360–500 nm), leaf chlorophyll concentrations were lower, indicating higher catechin content. The illumination intensity of light and the content of chlorophyll are significantly correlated with rosewood plants [63]. In particular, the shaded tea trees have higher chlorophyll content and a lower content of catechins. In the second stage of light treatment, the Taicha No. 18 tea trees growing in the A1 and B1 zones were, respectively, subjected to two light formulas with different lighting intensities. Among them, the cumulative lighting intensity of the A1 zone was higher than that of the B1 zone. The experimental results showed that the relative chlorophyll content of tea leaves in B1 zone was slightly higher than that in A1 zone.
This result also verifies that low levels of lighting intensity can increase relative chlorophyll content. In addition, increasing the lighting intensity of 600–760 nm could reduce the accumulation of chlorophyll in the leaves of the two varieties of tea plants and indirectly increase the content of catechins. Leaf colour is an important indicator for evaluating tea quality [64]. Regarding Taicha No. 18, in the second stage of light treatment, the number of leaves, contour area of the leaves, and leaf colour were significantly different when different light intensities were given at different times. For example, the tea plant planted in A1 had many leaves and a small contour area of its leaves, and the colour of the leaves was light green. On the other hand, the colour of its tea leaves was significantly correlated with the average chlorophyll content. The experimental results showed that the relative chlorophyll content was higher when the number of old leaves was more than that of new leaves, and vice versa.
The combination of different light qualities affects the physiological development of lettuces [47]. In the first stage of light treatment, under the same light quality ratio, high lighting intensity reduces the number of leaves but increases the contour area of the leaves. A lower amount of light intensity resulted in a lower number of leaves but a relative increase in the contour area of the leaves. For Taicha No. 18, the light intensity of the second stage (150–209 µmol∙m−2∙s−1) was lower than that of the first stage (except for the light treatment in the B1 zone), and the experimental results show that the high light intensity (449 µmol∙m−2∙s−1), the number of leaves on the tea trees did not increase significantly. For Taicha No. 8, higher light intensity (340–373 µmol∙m−2∙s−1) resulted in higher leaf numbers. In the case of light intensity of about 150 µmol∙m−2∙s−1, the high proportion of light intensity of 600–760 nm increased the contour area of the leaves and the number of leaves. Since increasing the intensity of red LED irradiation can improve the growth and development of lettuce, both the leaf area and the number of leaves will increase significantly [45], and the same results were also found for Taicha No. 8. However, for Taicha No. 18, increasing the irradiation intensity of 600–760 nm did not significantly increase the number of leaves, and the contour area of the leaves was reduced. Although red light can promote an increase in leaf area for most plants, these growth responses still vary by plant species, and the combination of wavelengths and the intensity of illumination must also be considered.
The results show that in the three wavelength ranges (360–500, 500–600, and 600–760 nm), the ratio of the light intensity of the tea plants (Taicha No. 18) illuminated by LEDs was 2.5:2.0:5.5, and the lighting intensity was about 150 µmol∙m−2∙s−1. With a photoperiod of 20:4 (dark), a higher number of leaves and a smaller contour area of the leaves can be achieved with this light treatment. Different varieties of tea plants have different growth traits. In the first stage of light treatment, the contour area of the leaves and number of leaves of Taicha No. 8 were higher than those of Taicha No. 18, but there was no significant difference in leaf colour. However, under the spectrum with a high proportion of red light, the contour area of the leaves of Taicha No. 8 was significantly larger than that of Taicha No. 18. The leaves of the two varieties of tea plants are green or light green, suitable for making black tea.
During the two stages of light treatment, some tea plant leaves were infected with diseases in each cultivation zone. In the second stage of light treatment, the plants were irradiated with low light intensity and subjected to different lighting intensities at different times. The results showed that the number of leaf diseases was much lower than in the first stage. Different light intensities have different effects on inhibiting the proliferation of pathogens in different plant species and regulating the defence mechanisms of plant bodies against diseases [65,66,67]. First of all, the use of high light intensity to irradiate the Taicha No. 18 tea tree did not enhance its growth and development. Secondly, we observed that in the first stage of the light treatment experiment, the plant leaves were infected earlier than in the second stage of the light treatment experiment. During a long-term cultivation period, once a plant is infected in the cultivation area, and the pathogens in the plant body cannot be completely eliminated, other plants will also be indirectly infected with the disease and it will quickly spread to the entire cultivation area. However, the experimental results showed that the plant leaves in the cultivation area were not fully infected (the proportion of infected leaves accounted for 45–68% of the total number of leaves). We infer that the pathogens of tea plants are inhibited under high light intensity, or the defence ability of the plant body is improved, which slows down the spread of the disease.
The proportion of irradiation intensity in different wavelength bands also had different inhibitory effects and triggered different defence mechanisms against leaf diseases. According to the experimental results, only increasing the illumination intensity of the wavelength band of 360–500 nm could not effectively inhibit the spread of leaf diseases, such as in the light treatment experiment in the A1 zone in the first stage. In contrast, under the appropriate light ratio and lighting period, tea plants have good growth responses and disease defence. For example, for the Taicha No. 18 variety, when the light intensity was between 150 and 210 µmol∙m−2∙s−1 (the second stage of the light treatment) with a high proportion of red-light irradiation (600–760 nm), the number of infected leaves was about 12% to 16% of the total number of leaves. This result indicates that red light induces resistance in tea plants to the spread of leaf diseases, which is the same as in [68]. Although related studies have pointed out that supplementation with 405 nm LEDs in greenhouses can effectively inhibit the breeding of tomato plant pathogens [69], and the use of blue or ultraviolet LEDs alone can effectively inhibit the spread of Botrytis cinerea on tomato leaves [70], it is necessary to consider different light quality combinations and ratios to obtain the best plant growth response and disease resistance.
The experimental results showed that when the light intensity was increased to more than 300 µmol∙m−2∙s−1, it had little effect on the development of plants and the inhibition of diseases. Meanwhile, 500–600 nm could promote crop growth, and this result is the same as in [71]. When the irradiation intensity in the 500–600 nm band was slightly less than that in the 360–500 nm band, the ratio of the irradiation intensity (about 2:1.5) had a better inhibitory effect on leaf diseases. The inhibition and spread of leaf diseases and the defence mechanism of tea trees against diseases still need to be discussed and further studied.
4.3. Effect of LED Lighting on Leaf Trait Extraction
However, the measurement error of the number of leaves and diseases affected by this phenomenon is small and negligible. The results of this study indicate that the leaf trait identification method is suitable for tea plants in the seedling stage, especially when only a single lens is used to obtain 2D images—that is, when the leaf distribution is relatively sparse. When using an automatic identification system in a plant factory, it is necessary to avoid the interference of LED light sources of different colours while shooting. Fortunately, the LED dimming system can cooperate with the camera, and turn on only the white LED when taking pictures to avoid affecting the image quality. By adjusting the light intensity of the LEDs, it is possible to reduce the problem of recognition failure caused by image processing or deep learning due to excessive light intensity.
5. Conclusions
This study presented an AIoT platform that can be used to produce crops in a plant factory. Two varieties of tea plant were selected for indoor cultivation, and the effectiveness of the proposed platform was verified through the cultivation process. Among these, image processing and deep learning tools were successfully used to identify changes in the growth appearance of tea trees, including the number of leaves, contour area of the leaves, and the number and types of diseased leaves. In addition to the wide AFOV, the disease detection accuracy was less than 85% (algal spot), and the trait recognition accuracy in other scenarios reached 95%. Compared with the results recorded via manual measurement, the error was about 3–15%. Environmental monitoring and control technology with the function of IoTs has been successfully used to adjust the environmental parameters in cultivation zones. This technology enables the maintenance of desired environmental parameter values. It can be beneficial for supplying out-of-season crops that are lacking in the market and can also reduce the risk of market price collapse due to overplanting. Additionally, growers do not need to constantly inspect the growth response of crops, thus reducing time costs. Finally, the number of leaves, contour area of the leaves, and colour of the leaves have been verified to be regulated by different LED light quality ratios and light intensities. Researchers can use this platform to develop crop physiological models or to improve the quality of tea leaves. Finally, heterogeneous data on crop growth, including environmental and physiological data, can be collected through this platform, which can provide tea farmers with the ability to develop teas with different flavours and even teas rich in nutritional value.
Future work should focus on stereo-vision technology to attempt to improve the detection rate of leaf traits and reduce errors between manual measurements. At the same time, the impact of atmospheric pressure changes on plant growth should also be studied, and can be further used as a new measurement solution for precision agriculture.
Author Contributions
Conceptualization, C.-L.C.; methodology, C.-L.C. and C.-C.H.; software, C.-L.C., H.-W.C. and C.-C.H.; validation, C.-L.C., H.-W.C. and C.-C.H.; formal analysis, H.-W.C. and C.-C.H.; investigation, H.-W.C.; resources, C.-L.C.; data curation, H.-W.C. and C.-C.H.; writing—original draft preparation, C.-L.C., H.-W.C. and C.-C.H.; writing—review and editing, C.-L.C.; visualization, C.-C.H.; supervision, C.-L.C.; project administration, C.-L.C.; funding acquisition, C.-L.C. All authors have read and agreed to the published version of the manuscript.
Funding
This research was funded by the National Science and Technology Council, grant numbers MOST 108-2622-B-020-008-CC3 and MOST 111-2221-E-020-024.
Institutional Review Board Statement
Not applicable.
Informed Consent Statement
Not applicable.
Conflicts of Interest
The authors declare no conflict of interest.
References
- Boyer, J.S. Plant productivity and environment. Science 1982, 218, 443–448. [Google Scholar] [CrossRef] [PubMed]
- Porter, J.R.; Xie, L.; Challinor, A.J.; Cochrane, K.; Howden, S.M.; Iqbal, M.M.; Lobell, D.B.; Travasso, M.I. Chapter 7: Food Security and Food Production Systems. In Food security and food production systems. In Climate Change 2014: Impacts, Adaptation, and Vulnerability. Part A: Global and Sectoral Aspects. Contribution of Working Group II to the Fifth Assessment Report of the Intergovernmental Panel on Climate Chan; Cambridge University Press: Cambridge, UK, 2014; pp. 485–533. [Google Scholar]
- Tito, R.; Vasconcelos, H.L.; Feeley, K.J. Global climate change increases risk of crop yield losses and food insecurity in the tropical andes. Glob. Chang. Biol. 2018, 24, e592–e602. [Google Scholar] [CrossRef] [PubMed]
- Gitz, V.; Meybeck, A.; Lipper, L.; de Young, C.; Braatz, S. Climate Change and Food Security: Risks and Responses; Food & Agriculture Organization of the United Nations (FAO): Rome, Italy, 2016; ISBN 9789251089989. [Google Scholar]
- Pawlak, K.; Smutka, L.; Kotyza, P. Agricultural Potential of the EU Countries: How Far Are They from the USA? Agriculture 2021, 11, 282. [Google Scholar] [CrossRef]
- Kozai, T.; Niu, G.; Takagaki, M. Plant Factory an Indoor Vertical Farming System for Efficient Quality Food Production, 2nd ed.; Academic Press: San Diego, CA, USA, 2019; ISBN 9780128166925. [Google Scholar]
- Ahmed, H.A.; Tong, Y.X.; Yang, Q.C. Lettuce plant growth and tipburn occurrence as affected by airflow using a multi-fan system in a plant factory with artificial light. J. Therm. Biol. 2020, 88, 102496. [Google Scholar] [CrossRef]
- Quan, Q.; Zhang, X.; Xue, X.Z. Design and implementation of a closed-loop plant factory. IFAC-PapersOnLine 2018, 51, 353–358. [Google Scholar] [CrossRef]
- Kalia, P.; Ansari, M.A. IoT based air quality and particulate matter concentration monitoring system. Mater. Today 2020, 32, 468–475. [Google Scholar] [CrossRef]
- Kumar, S.; Tiwari, P.; Zymbler, M. Internet of Things Is a Revolutionary Approach for Future Technology Enhancement: A Review. J. Big Data 2019, 6, 111. [Google Scholar] [CrossRef] [Green Version]
- Abioye, E.A.; Abidin, M.S.Z.; Mahmud, M.S.A.; Buyamin, S.; AbdRahman, M.K.I.; Otuoze, A.O.; Ramli, M.S.A.; Ijike, O.D. IoT-based monitoring and data-driven modelling of drip irrigation system for mustard leaf cultivation experiment. Inf. Process. Agric. 2020, 8, 270–283. [Google Scholar] [CrossRef]
- Hajjaji, Y.; Boulila, W.; Farah, I.R.; Romdhani, I.; Hussain, A. Big data and IoT-based applications in smart environments: A systematic review. Comput. Sci. Rev. 2021, 39, 100318. [Google Scholar] [CrossRef]
- Chang, C.L.; Chung, S.C.; Fu, W.L.; Huang, C.C. Artificial intelligence approaches to predict growth, harvest day, and quality of lettuce (Lactuca sativa L.) in a IoT-enabled greenhouse system. Biosyst. Eng. 2021, 212, 77–105. [Google Scholar] [CrossRef]
- Linaza, M.T.; Posada, J.; Bund, J.; Eisert, P.; Quartulli, M.; Döllner, J.; Pagani, A.; Olaizola, I.G.; Barriguinha, A.; Moysiadis, T.; et al. Data-driven artificial intelligence applications for sustainable precision agriculture. Agronomy 2021, 11, 1227. [Google Scholar] [CrossRef]
- Xu, J.; Gu, B.; Tian, G. Review of Agricultural IoT Technology. Artif. Intell. Agric. 2022, 6, 10–22. [Google Scholar] [CrossRef]
- Muangprathub, J.; Boonnam, N.; Kajornkasirat, S.; Lekbangpong, N.; Wanichsombat, A.; Nillaor, P. IoT and agriculture data analysis for smart farm. Comput. Electron. Agric. 2019, 156, 467–474. [Google Scholar] [CrossRef]
- Hamuda, E.; Glavin, M.; Jones, E. A survey of image processing techniques for plant extraction and segmentation in the field. Comput. Electron. Agric. 2016, 125, 184–199. [Google Scholar] [CrossRef]
- Chang, C.L.; Fu, W.L. A feature extraction approach based on Hough transform to estimate growth responses of leaf lettuce. In Proceedings of the 2019 Boston, MA, USA, July 7–July 10 2019; American Society of Agricultural and Biological Engineers: St. Joseph, MI, USA, 2019; p. 1. [Google Scholar]
- Dyrmann, M.; Karstoft, H.; Midtiby, H.S. Plant species classification using deep convolutional neural network. Biosyst. Eng. 2016, 151, 72–80. [Google Scholar] [CrossRef]
- Barré, P.; Stöver, B.C.; Müller, K.F.; Steinhage, V. LeafNet: A computer vision system for automatic plant species identification. Ecol. Inform. 2017, 40, 50–56. [Google Scholar] [CrossRef]
- Ampatzidis, Y.; Partel, V.; Costa, L. Agroview: Cloud-based application to process, analyze and visualize UAV-collected data for precision agriculture applications utilizing artificial intelligence. Comput. Electron. Agric. 2020, 174, 105457. [Google Scholar] [CrossRef]
- Chaudhary, P.; Chaudhari, A.K.; Cheeran, A.N.; Godara, S. Color Transform Based Approach For Disease Spot Detection On Plant Leaf. Int. J. Comput. Sci. Telecomm. 2012, 3, 65–70. [Google Scholar]
- Singh, V.; Sharma, N.; Singh, S. A review of imaging techniques for plant disease detection. Artif. Intell. Agric. 2020, 4, 229–242. [Google Scholar] [CrossRef]
- Tugrul, B.; Elfatimi, E.; Eryigit, R. Convolutional Neural Networks in Detection of Plant Leaf Diseases: A Review. Agriculture 2022, 12, 1192. [Google Scholar] [CrossRef]
- Dhaka, V.S.; Meena, S.V.; Rani, G.; Sinwar, D.; Kavita; Ijaz, M.F.; Woźniak, M. A Survey of Deep Convolutional Neural Networks Applied for Prediction of Plant Leaf Diseases. Sensors 2021, 21, 4749. [Google Scholar] [CrossRef] [PubMed]
- Singh, V.; Misra, A.K. Detection of plant leaf diseases using image segmentation and soft computing techniques. Inf. Process. Agric. 2017, 4, 41–49. [Google Scholar] [CrossRef] [Green Version]
- Chen, J.; Liu, Q.; Gao, L. Visual tea leaf disease recognition using a convolutional neural network model. Symmetry 2019, 11, 343. [Google Scholar] [CrossRef] [Green Version]
- Krizhevsky, A.; Sutskever, I.; Hinton, G.E. ImageNet Classification with Deep Convolutional Neural Networks. Commun. ACM 2017, 60, 84–90. [Google Scholar] [CrossRef] [Green Version]
- Wagle, S.A.; Harikrishnan, R.; Ali, S.H.M.; Faseehuddin, M. Classification of Plant Leaves Using New Compact Convolutional Neural Network Models. Plants 2022, 11, 24. [Google Scholar] [CrossRef]
- Hu, G.; Yang, X.; Zhang, Y.; Wan, M. Identification of tea leaf diseases by using an improved deep convolutional neural network. Sustain. Comput. Inform. Syst. 2019, 24, 100353. [Google Scholar] [CrossRef]
- Yogeshwari, M.; Thailambal, G. Automatic feature extraction and detection of plant leaf disease using GLCM features and convolutional neural networks. Mater. Today Proc. 2021, in press. [CrossRef]
- Redmon, J.; Divvala, S.; Girshick, R.; Farhadi, A. You only look once: Unified, real-time object detection. In Proceedings of the 2016 IEEE Conference on Computer Vision and Pattern Recognition (CVPR), Las Vegas, NV, USA, 27–30 June 2016; pp. 779–788. [Google Scholar]
- Redmon, J.; Farhadi, A. YOLOv3: An Incremental Improvement. arXiv arXiv:1804.02767, 2018. [CrossRef]
- Huang, C.C.; Chen, H.W.; Chang, C.L. Deep Learning and IoT Technology Applied to Monitor the Growth of Tea Trees Indoors under Artificial Lighting. ID:2489. In Proceedings of the AgEng 2021 Conference, Évora, Portugal, 5–8 July 2021. [Google Scholar]
- Khan, N.; Mukhtar, H. Tea and health: Studies in humans. Curr. Pharm. Des. 2013, 19, 6141–6147. [Google Scholar] [CrossRef] [Green Version]
- Singh, R.; Bhardwaj, V.K.; Sharma, J.; Purohit, R.; Kumar, S. In-silico evaluation of bioactive compounds from tea as potential SARS-CoV-2 nonstructural protein 16 inhibitors. J. Tradit. Complement. Med. 2022, 12, 35–43. [Google Scholar] [CrossRef]
- Jayasinghe, S.L.; Kumar, L. Modeling the climate suitability of tea [Camellia sinensis (L.) O. Kuntze] in Sri Lanka in response to current and future climate change scenarios. Agric. For. Meteorol. 2019, 272–273, 102–117. [Google Scholar] [CrossRef]
- De Costa, W.A.J.M.; Mohotti, A.J.; Wijeratne, M.A. Ecophysiology of tea. Braz. J. Plant Physiol. 2007, 19, 299–332. [Google Scholar] [CrossRef]
- Roy, S.; Barooah, A.K.; Ahmed, K.Z.; Baruah, R.D.; Prasad, A.K.; Mukhopadhyay, A. Impact of climate change on tea pest status in northeast India and effective plans for mitigation. Acta Ecologica Sinica 2020, 40, 432–442. [Google Scholar] [CrossRef]
- Skendžić, S.; Zovko, M.; Živković, I.P.; Lešić, V.; Lemić, D. The impact of climate change on agricultural insect pests. Insects 2021, 12, 440. [Google Scholar] [CrossRef]
- Folta, K.M.; Childers, K.S. Light as a growth regulator: Controlling plant biology with narrow-bandwidth solid-state lighting systems. HortScience 2008, 43, 1957–1964. [Google Scholar] [CrossRef] [Green Version]
- Lin, K.H.; Huang, M.Y.; Huang, W.D.; Hsu, M.H.; Yang, Z.W.; Yang, C.M. The effects of red, blue, and white light-emitting diodes on the growth, development, and edible quality of hydroponically grown lettuce (Lactuca sativa, L. Var. Capitata). Sci. Hortic. 2013, 150, 86–91. [Google Scholar] [CrossRef]
- Ouzounis, T.; Rosenqvist, E.; Ottosen, C.-O. Spectral effects of artificial light on plant physiology and secondary metabolism: A review. HortScience 2015, 50, 1128–1135. [Google Scholar] [CrossRef] [Green Version]
- Bantis, F.; Smirnakou, S.; Ouzounis, T.; Koukounaras, A.; Ntagkas, N.; Radoglou, K. Current status and recent achievements in the field of horticulture with the use of light-emitting diodes (LEDs). Sci. Hortic. 2018, 235, 437–451. [Google Scholar] [CrossRef]
- Naznin, M.T.; Lefsrud, M.; Gravel, V.; Azad, M.O.K. Blue light added with red LEDs enhance growth characteristics, pigments content, and antioxidant capacity in lettuce, spinach, kale, basil, and sweet pepper in a controlled environment. Plants 2019, 8, 93. [Google Scholar] [CrossRef] [Green Version]
- Park, Y.; Runkle, E.S. Spectral effects of light-emitting diodes on plant growth, visual color quality, and photosynthetic photon efficacy: White versus blue plus red radiation. PLoS ONE 2018, 13, e0202386. [Google Scholar] [CrossRef] [Green Version]
- Chang, C.L.; Chang, K.P. The growth response of leaf lettuce at different stages to multiple wavelength-band light-emitting diode lighting. Sci. Hortic. 2014, 179, 78–84. [Google Scholar] [CrossRef]
- Wong, C.E.; Teo, Z.W.N.; Shen, L.; Yu, H. Seeing the lights for leafy greens in indoor vertical farming. Trends Food Sci. Technol. 2020, 106, 48–63. [Google Scholar] [CrossRef]
- Ahmed, H.A.; Tong, Y.; Li, L.; Sahari, S.Q.; Almogahed, A.M.; Cheng, R. Integrative effects of CO2 concentration, illumination intensity and air speed on the growth, gas exchange and light use efficiency of lettuce plants grown under artificial lighting. Horticulturae 2022, 8, 270. [Google Scholar] [CrossRef]
- Xu, D.; Ahmed, H.A.; Tong, Y.; Yang, Q.; van Willigenburg, L.G. Optimal control as a tool to investigate the profitability of a Chinese plant factory-lettuce production system. Biosyst. Eng. 2021, 208, 319–332. [Google Scholar] [CrossRef]
- Lin, Z.; Wang, S.; Fu, R.; Ting, K.C.; Lin, T. Data-Driven Modeling for Crop Growth in Plant Factories. In Sensing, Data Managing, and Control Technologies for Agricultural Systems; Springer International Publishing: Cham, Switzerland, 2022; pp. 101–129. ISBN 9783031038334. [Google Scholar]
- Chang, C.L.; Chang, K.P. Design and implementation of a cloud-based LED Lighting control system for protected horticulture. Appl. Eng. Agric. 2016, 32, 697–706. [Google Scholar] [CrossRef]
- Soille, P. Morphological Image Analysis; Springer: Berlin/Heidelberg, Germany, 1999; ISBN 9783662039410. [Google Scholar]
- Lin, T.Y.; Maire, M.; Belongie, S.; Hays, J.; Perona, P.; Ramanan, D.; Dollár, P.; Zitnick, C.L. Microsoft COCO: Common Objects in Context. In Computer Vision—ECCV 2014; Springer International Publishing: Cham, Switzerland, 2014; pp. 740–755. ISBN 9783319106014. [Google Scholar]
- Wang, C.Y.; Liao, H.Y.; Wu, Y.H.; Chen, P.Y.; Hsieh, J.W.; Yeh, I.H. CSPNet: A New Backbone That Can Enhance Learning Capability of CNN. In Proceedings of the 2020 IEEE/CVF Conference on Computer Vision and Pattern Recognition Workshops (CVPRW), Seattle, WA, USA, 14–19 June 2020; pp. 1571–1580. [Google Scholar]
- He, K.; Zhang, X.; Ren, S.; Sun, J. Spatial Pyramid Pooling in Deep Convolutional Networks for Visual Recognition. In Computer Vision—ECCV 2014; Springer International Publishing: Cham, Switzerland, 2014; pp. 346–361. ISBN 9783319105772. [Google Scholar]
- Liu, S.; Qi, L.; Qin, H.; Shi, J.; Jia, J. Path Aggregation Network for Instance Segmentation. In Proceedings of the 2018 IEEE/CVF Conference on Computer Vision and Pattern Recognition, Salt Lake City, UT, USA, 18–23 June 2018. [Google Scholar]
- Murphy, K.P. Machine Learning: A Probabilistic Perspective; MIT Press: London, England, 2012; ISBN 9780262018029. [Google Scholar]
- Zheng, Z.; Wang, P.; Liu, W.; Li, J.; Ye, R.; Ren, D. Distance-IoU Loss: Faster and Better Learning for Bounding Box Regression. Proc. Conf. AAAI Artif. Intell. 2020, 34, 12993–13000. [Google Scholar] [CrossRef]
- Wang, J.; Lu, W.; Tong, Y.; Yang, Q. Leaf morphology, photosynthetic performance, chlorophyll fluorescence, stomatal development of lettuce (Lactuca sativa L.) exposed to different ratios of red light to blue light. Front. Plant Sci. 2016, 7, 250. [Google Scholar] [CrossRef] [Green Version]
- Frąszczak, B.; Kula-Maximenko, M. The preferences of different cultivars of lettuce seedlings (Lactuca sativa L.) for the Spectral Composition of Light. Agronomy 2021, 11, 1211. [Google Scholar] [CrossRef]
- Wei, K.; Wang, L.; Zhou, J.; He, W.; Zeng, J.; Jiang, Y.; Cheng, H. Catechin Contents in Tea (Camellia Sinensis) as Affected by Cultivar and Environment and Their Relation to Chlorophyll Contents. Food Chem. 2011, 125, 44–48. [Google Scholar] [CrossRef]
- de Carvalho Gonçalves, J.F.; de Sousa Barreto, D.C.; dos Santos Junior, U.M.; Fernandes, A.V.; Sampaio, P.d.T.B.; Buckeridge, M.S. Growth, Photosynthesis and Stress Indicators in Young Rosewood Plants (Aniba Rosaeodora Ducke) under Different Light Intensities. Braz. J. Plant Physiol. 2005, 17, 325–334. [Google Scholar] [CrossRef]
- Taylor, S.; Baker, D.; Owuor, P.; Orchard, J.; Othieno, C.; Gay, C. A Model for Predicting Black Tea Quality from the Carotenoid and Chlorophyll Composition of Fresh Green Tea Leaf. J. Sci. Food Agric. 1992, 58, 185–191. [Google Scholar] [CrossRef]
- Hasan, M.M.; Bashir, T.; Ghosh, R.; Lee, S.K.; Bae, H. An Overview of LEDs’ Effects on the Production of Bioactive Compounds and Crop Quality. Molecules 2017, 22, 1420. [Google Scholar] [CrossRef] [PubMed] [Green Version]
- Suthaparan, A.; Torre, S.; Stensvand, A.; Herrero, M.L.; Pettersen, R.I.; Gadoury, D.M.; Gislerød, H.R. Specific Light-Emitting Diodes Can Suppress Sporulation of Podosphaera Pannosa on Greenhouse Roses. Plant Dis. 2010, 94, 1105–1110. [Google Scholar] [CrossRef] [PubMed] [Green Version]
- Liao, H.L.; Alferez, F.; Burns, J.K. Assessment of Blue Light Treatments on Citrus Postharvest Diseases. Postharvest Biol. Technol. 2013, 81, 81–88. [Google Scholar] [CrossRef]
- Rahman, M.Z.; Honda, Y.; Arase, S. Red-light-induced resistance in broad bean (Viciafaba, L.) to leaf spot disease caused by Alternariatenuissima. J. Phytopathol. Phytopathol. Z. 2003, 151, 86–91. [Google Scholar] [CrossRef]
- Tokuno, A.; Ibaraki, Y.; Ito, S.I.; Araki, H.; Yoshimura, K.; Osaki, K. Disease Suppression in Greenhouse Tomato by Supplementary Lighting with 405 Nm LED. Environ. Contr. Biol. 2012, 50, 19–29. [Google Scholar] [CrossRef] [Green Version]
- Xu, H.; Fu, Y.N.; Li, T.L.; Wang, R. Effects of Different LED Light Wavelengths on the Resistance of Tomato against Botrytis Cinerea and the Corresponding Physiological Mechanisms. J. Integr. Agric. 2017, 16, 106–114. [Google Scholar] [CrossRef] [Green Version]
- Kudo, R.; Ishida, Y.; Yamamoto, K. Effects of Green Light Irradiation on Induction of Disease Resistance in Plants. Acta Hortic. 2011, 907, 251–254. [Google Scholar] [CrossRef]
Figure 1.
Indoor cultivation framework with artificial Internet-of-things (AIoT). Each cultivation chamber is equipped with two webcams (one is installed and fixed on the side bracket of the cultivation zone, and the other is installed and fixed on the front partition of the cultivation zone), six LED light tubes, an environmental sensing module (including OLED display interface), and fans. The environmental data and the tea plant image are, respectively, transmitted to the data analysis platform by the environmental measurement system and the image measurement system via the Internet for storage. The image datasets will also be transmitted to Google Cloud to be stored. The dashed frame represents the cultivation facilities, including dripper, mist maker, and CO2 supplier. Environmental control systems are used to drive these facilities, as well as fans in each cultivation zone, which are utilised to maintain certain levels of environmental parameters in the cultivation zone.

Figure 2.
Five LED spectrums.

Figure 3.
Temperature distribution around LED lamps at plant cultivation. (a) A1 cultivation zone, (b) B1 cultivation zone. The ambient temperature is 20 ± 2 °C.
Figure 3.
Temperature distribution around LED lamps at plant cultivation. (a) A1 cultivation zone, (b) B1 cultivation zone. The ambient temperature is 20 ± 2 °C.

Figure 4.
LED strips (top) and circulation fan (bottom).

Figure 5.
Mist generation system and CO2 generator. (a) The generation pipeline and mist generation tank; (b) reverse osmosis (RO) water delivery hose (blue colour) and CO2 gas input hole (white coloured frame); (c) CO2 cylinder and a double-header pressure reducer. Double-header pressure reducer is located to the left of the cylinder on the image. The gauges on the right and left show the pressure in the cylinder and the pressure at the outlet, respectively.

Figure 6.
Environmental sensing and display module: (a) circuit layout, (b) appearance of the module. ➀: microcontroller chip; ➁: OLED display interface; ➂: environmental sensing chip set; ➃: carbon dioxide sensor; ➄: light sensor; ➅: soil moisture sensor.
Figure 6.
Environmental sensing and display module: (a) circuit layout, (b) appearance of the module. ➀: microcontroller chip; ➁: OLED display interface; ➂: environmental sensing chip set; ➃: carbon dioxide sensor; ➄: light sensor; ➅: soil moisture sensor.

Figure 7.
Rules for turning on and off facilities. The thin horizontal lines indicate that the mist generator and fan are turned on when the temperature is too high and the humidity is too low; the dark grey area indicates that only the mist generator is turned on when the humidity is too low; and in the grey area, the mist generator and fan are turned off. A thin vertical line indicates that the humidity is too high and that the fan is turned on to avoid condensation on the blades.

Figure 8.
Leaf trait identification process. Morphological operations are performed on contour area of leaves measurement and leaf colour classification. The area of grey colour represents the different colour levels of green. Two YoLov4 models were developed to count number of leaves and leaf disease.

Figure 9.
The structure of YoLov4 model, which includes a backbone network based on CSPDarknet53 (backbone), feature fusion layer (neck), and YoLo head. SPPnet and PANet are included in neck. Feature maps of different scales (R3–R5) are output to YoLo head 1, YoLo head 2, and YoLo head 3 after feature fusion processing (C1–C5).

Figure 10.
Image processing for the estimation of the number of leaves. (a) Original image. (b) HSV colour space. (c) Binarization. (d) Contour area of leaves.
Figure 10.
Image processing for the estimation of the number of leaves. (a) Original image. (b) HSV colour space. (c) Binarization. (d) Contour area of leaves.

Figure 11.
An example of trait extraction of tea plant images in morphological operations: (a1) and (b1) are the original and HSV samples, respectively. (c1−c3) are the binarization operation results of different colour values of the H layer of (b1) sample. The upper, middle, and lower parts of the figure are the segmentation results of light green, normal green, and dark green, respectively. All three images were subjected to morphological operations to remove the stems and branch stems of tea plants. (d1−d3) Erosion; (e1−e3) closure; (f1−f3) thinning; (g1−g3) Canny edge detection; (h1−h3) eight-neighbour connectivity; (i1−i3) object labelling.

Figure 12.
Detection of tea leaves in different cultivation zones with different types of angular field of view (AFOV). (a) Tea leaf detection for a single plant (Taicha No. 18). (b) Tea leaf detection for a tea plant (Taicha No. 8). (c) Results of detection of number of tea leaves in the zones with a wide AFOV for tea plants (Taicha No. 18). The purple and green colors represent the detected leaves of Taicha No. 18 and Taicha No. 8, respectively.

Figure 13.
Detection results of leaf diseases: (a) white spot; (b) multiple infection (Taicha No. 18); (c) algal spot; (d,e) brown blight leaf disease. Green, light green, and purple coloured frames denote brown blight, algal spot, and white spot leaf disease, respectively.
Figure 13.
Detection results of leaf diseases: (a) white spot; (b) multiple infection (Taicha No. 18); (c) algal spot; (d,e) brown blight leaf disease. Green, light green, and purple coloured frames denote brown blight, algal spot, and white spot leaf disease, respectively.

Figure 14.
Light treatment results for the first stage of the experiment: (a) number of leaves, (b) contour area of leaves, (c) colour of leaves, and (d) relative chlorophyll-a.
Figure 14.
Light treatment results for the first stage of the experiment: (a) number of leaves, (b) contour area of leaves, (c) colour of leaves, and (d) relative chlorophyll-a.

Figure 15.
Comparison of the lighting treatment in the second stage: (a) number of leaves, (b) contour area of leaves, (c) leaf colour, and (d) relative chlorophyll-a.
Figure 15.
Comparison of the lighting treatment in the second stage: (a) number of leaves, (b) contour area of leaves, (c) leaf colour, and (d) relative chlorophyll-a.

Figure 16.
Variation in temperature in cultivation zones (a) A1, (b) A2, (c) B1, and (d) B2.

Figure 17.
Variation in humidity in cultivation zones (a) A1, (b) A2, (c) B1, and (d) B2.

Figure 18.
Variation in soil moisture content and carbon dioxide concentration. (a) Soil moisture content, (b) carbon dioxide concentration.
Figure 18.
Variation in soil moisture content and carbon dioxide concentration. (a) Soil moisture content, (b) carbon dioxide concentration.


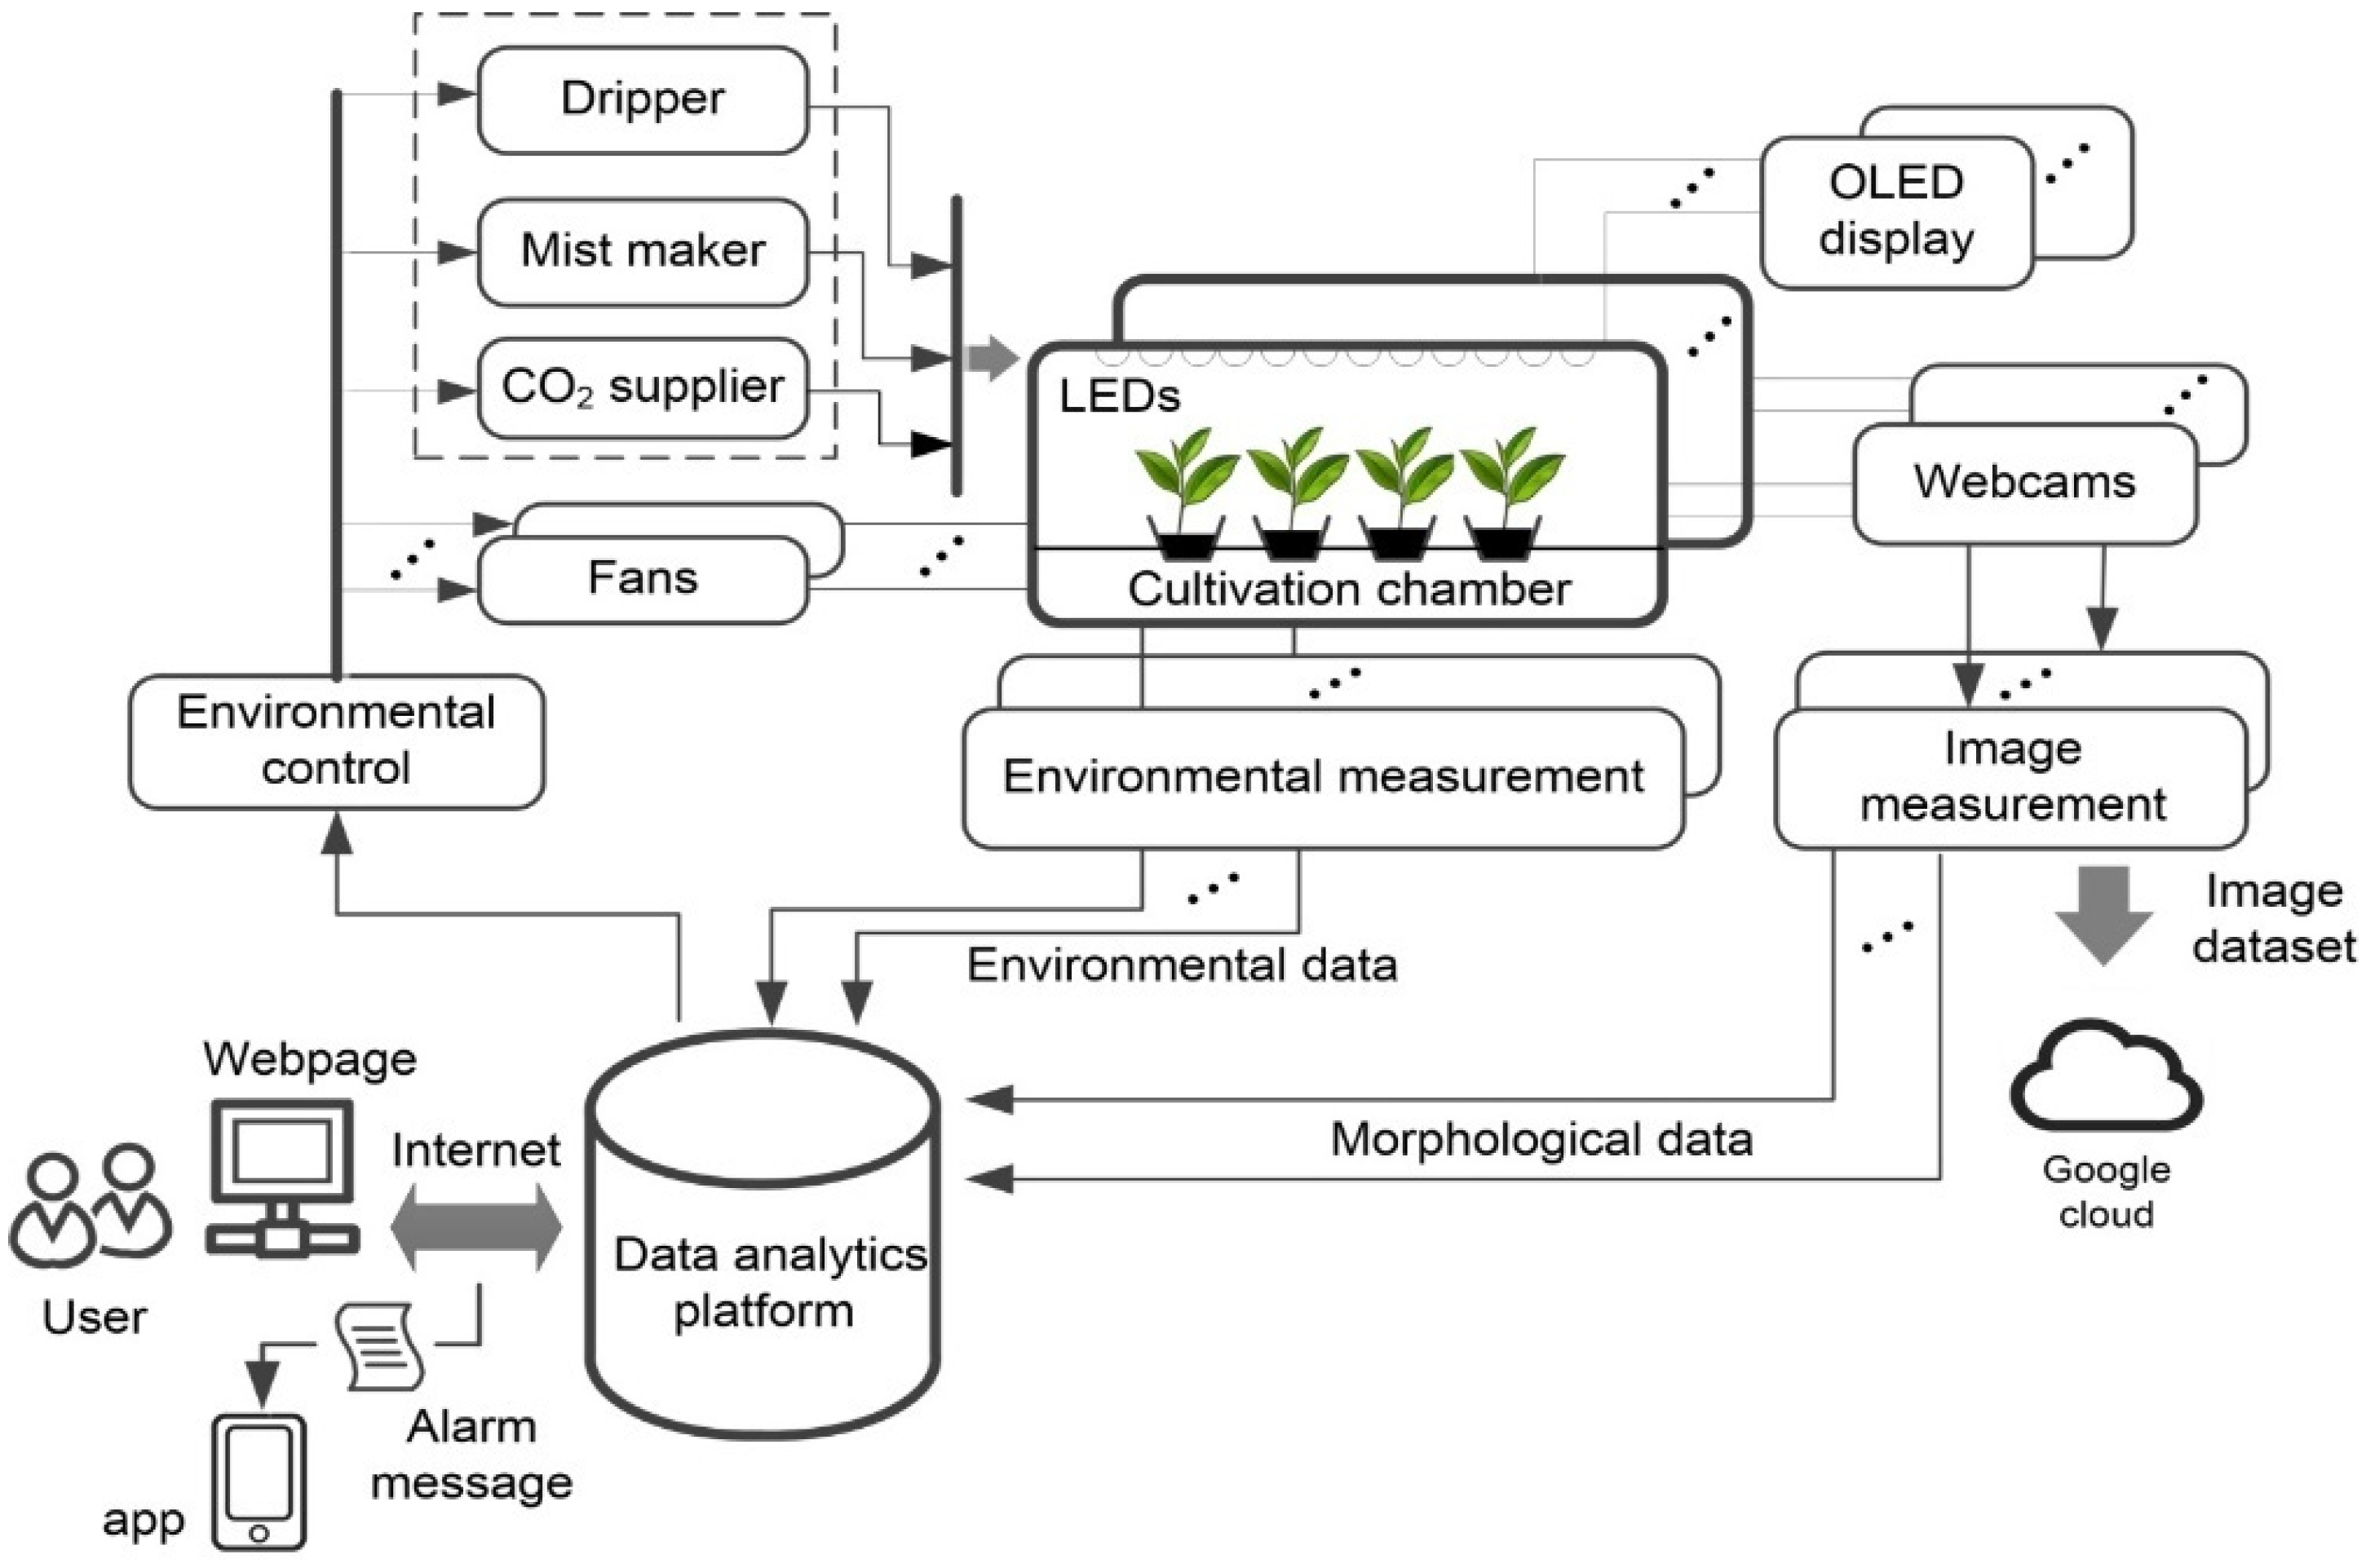
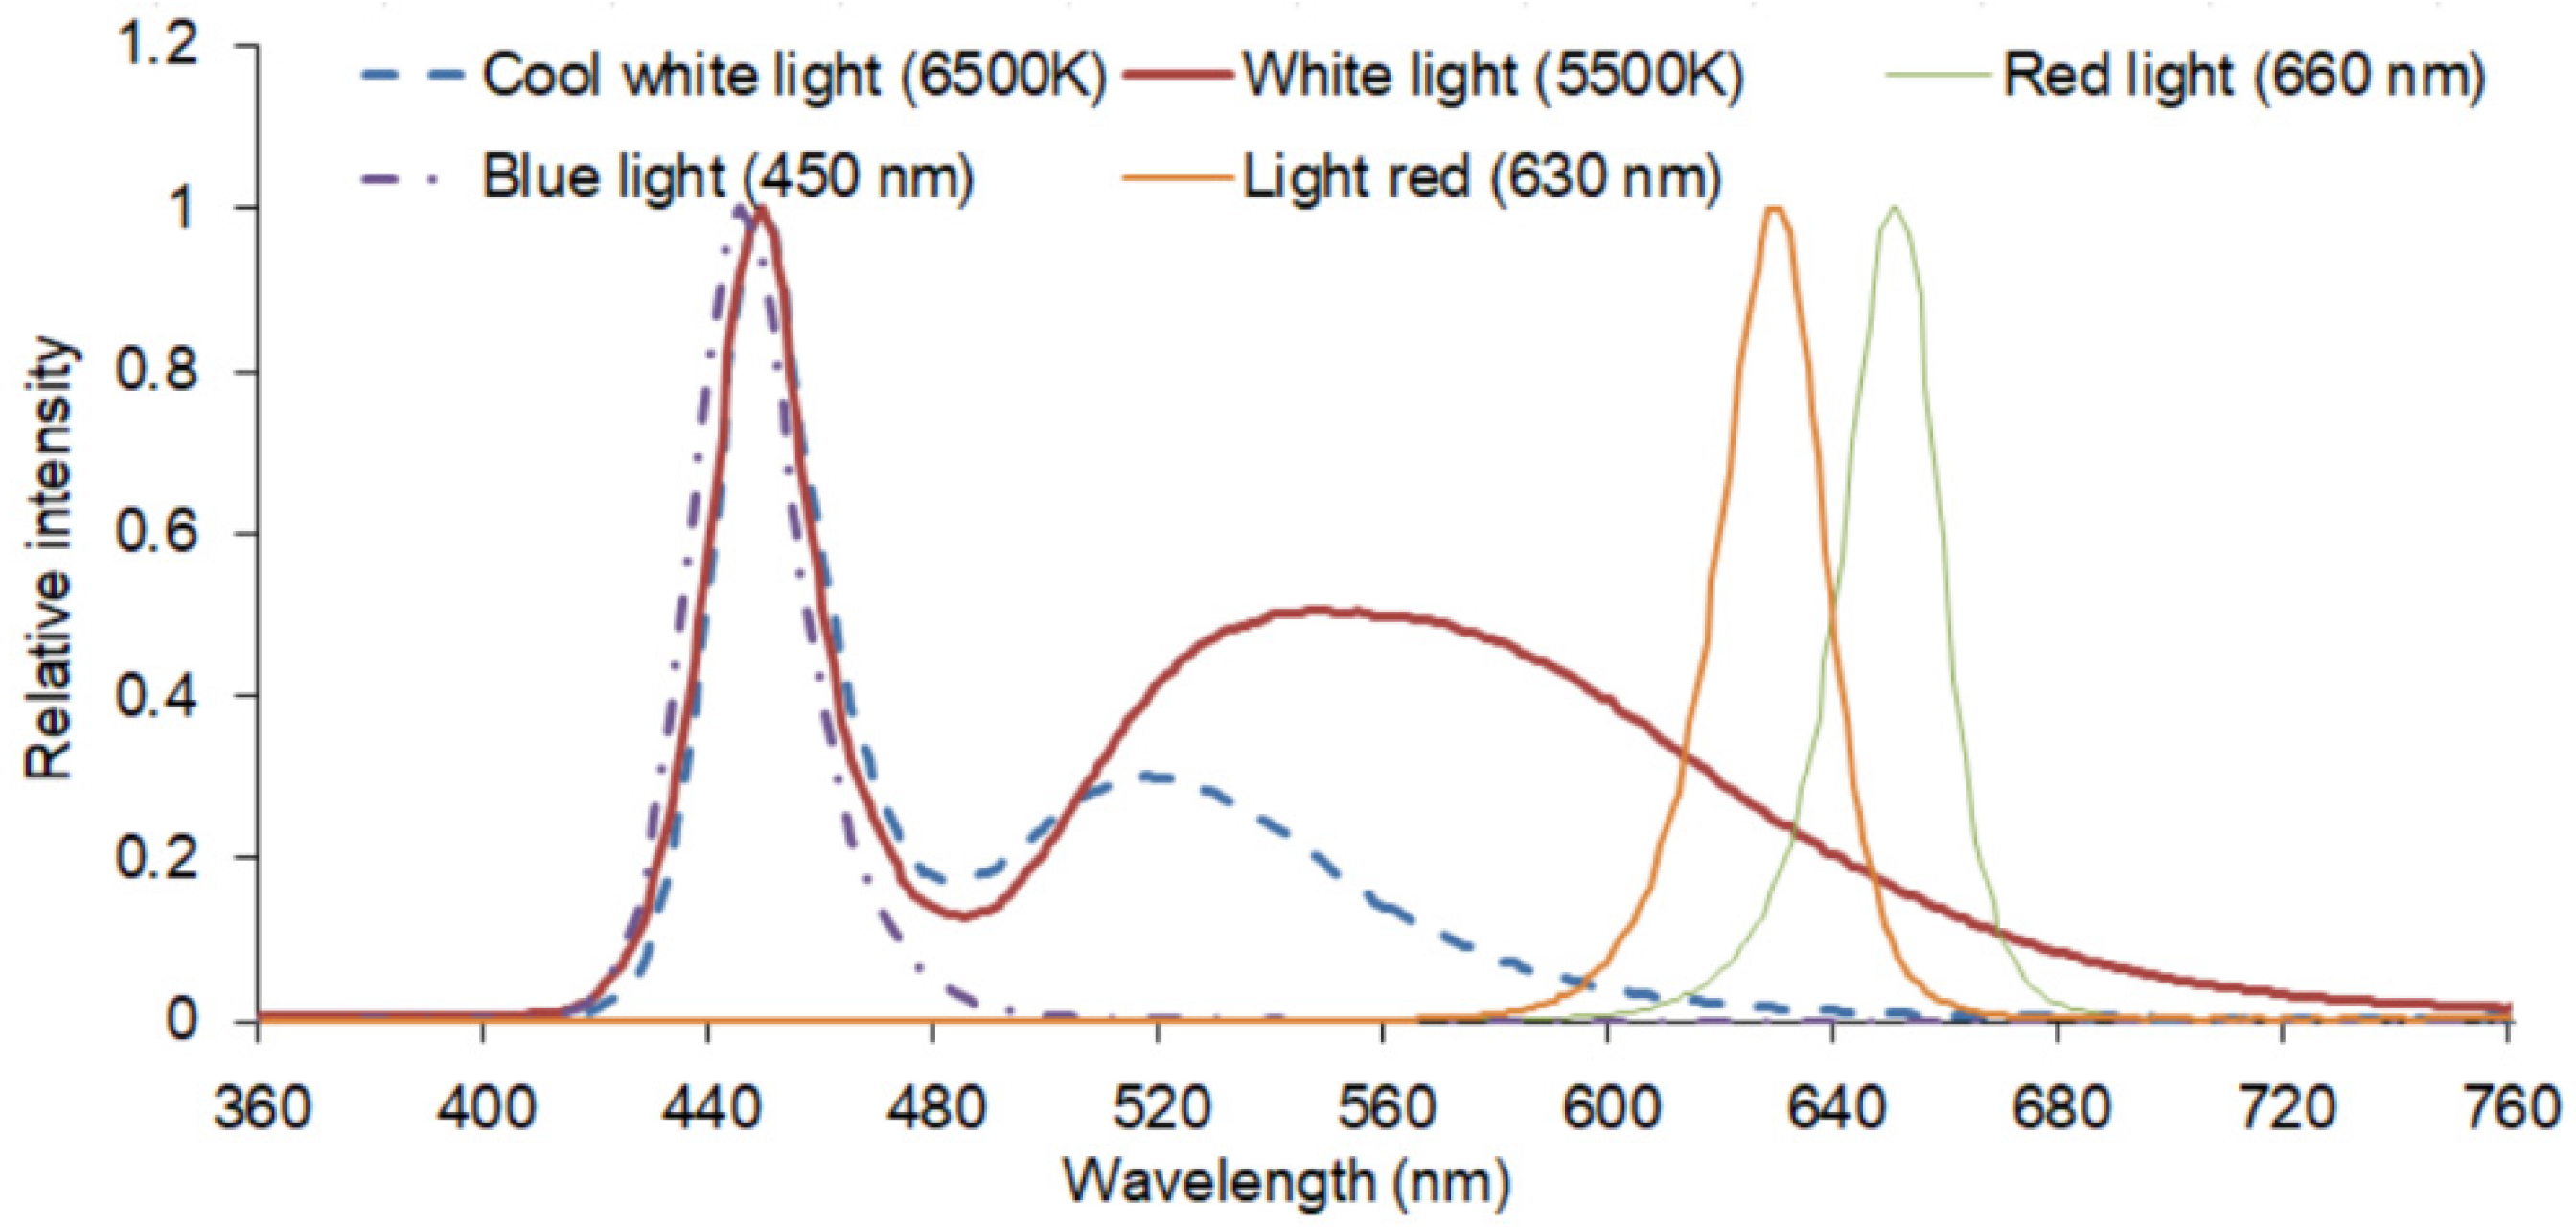
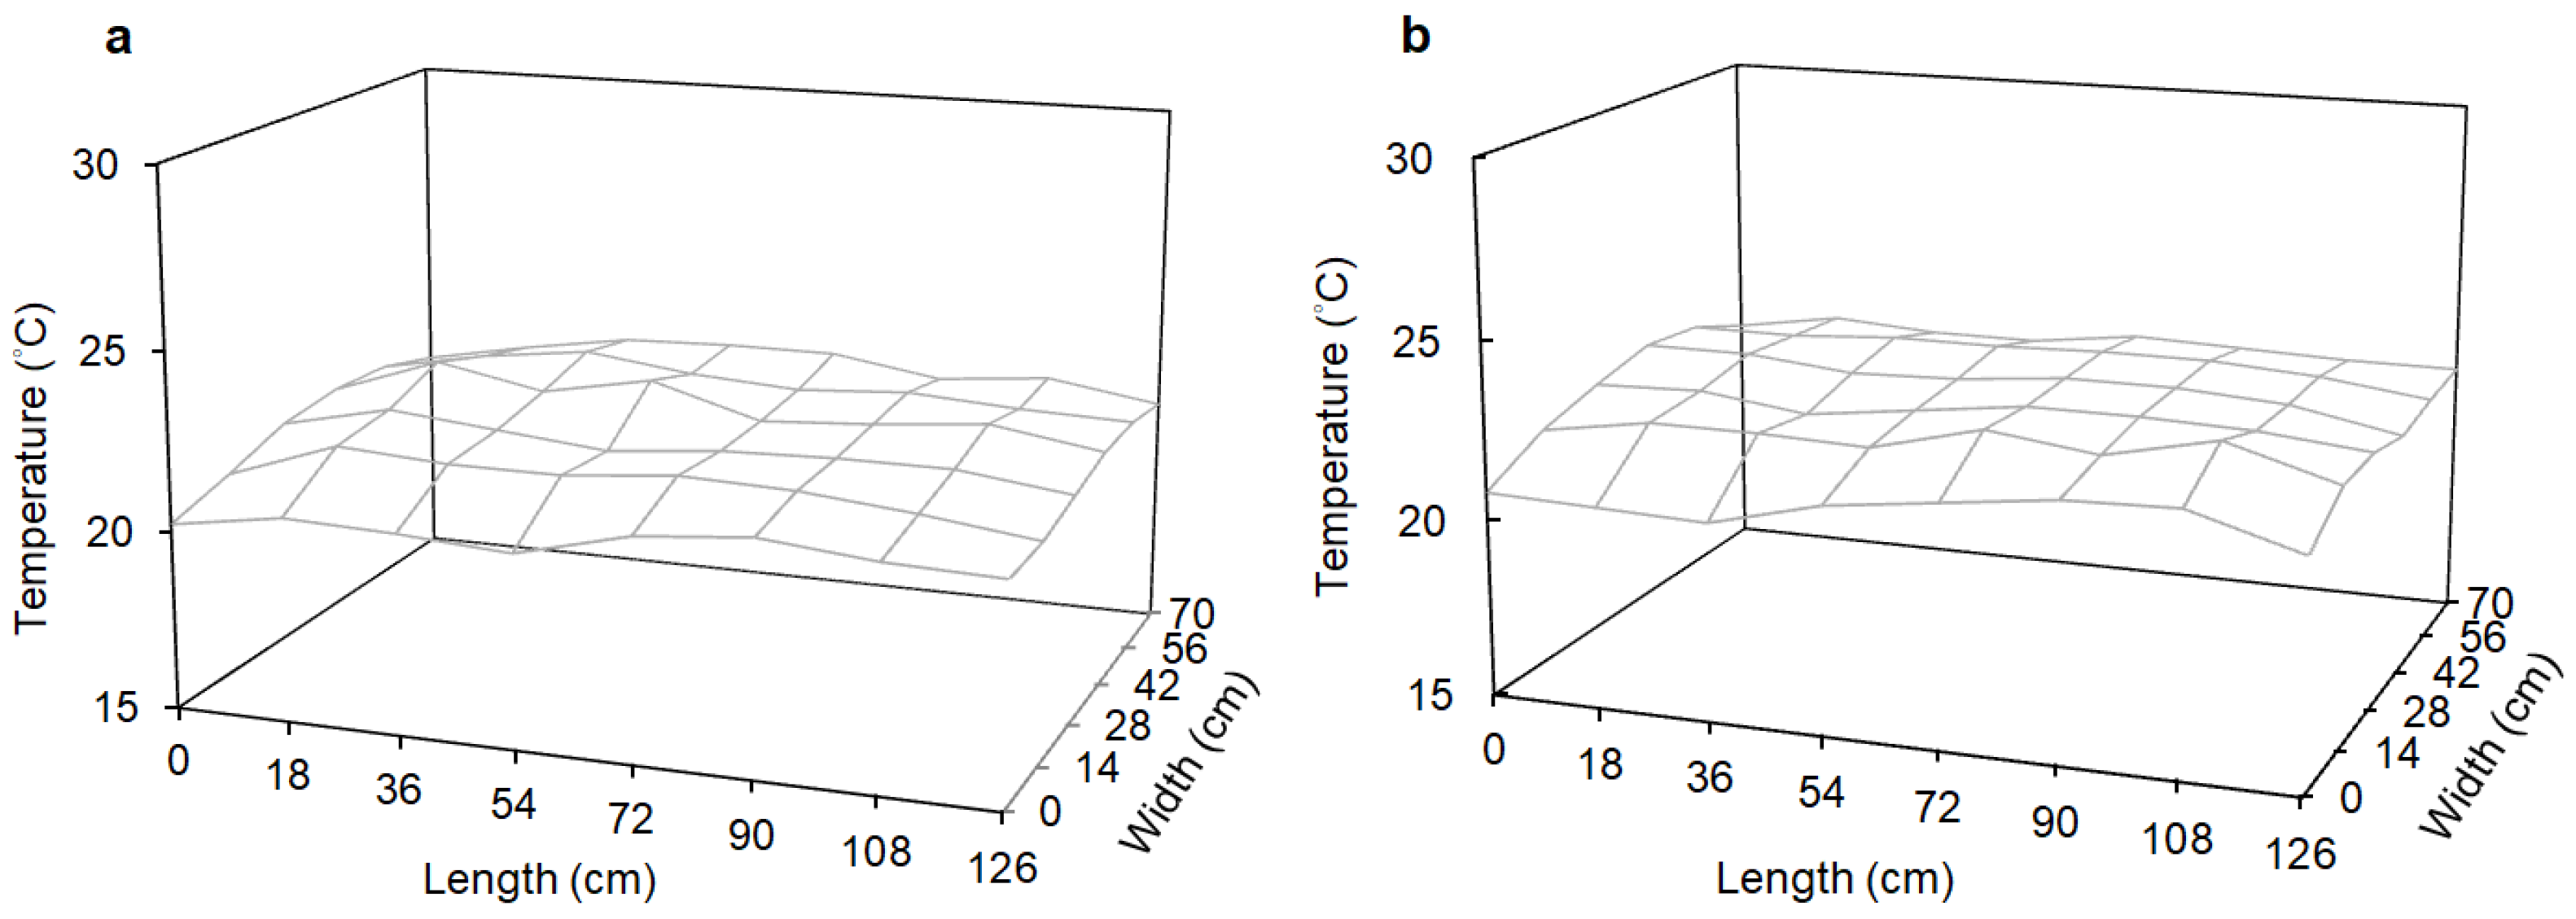
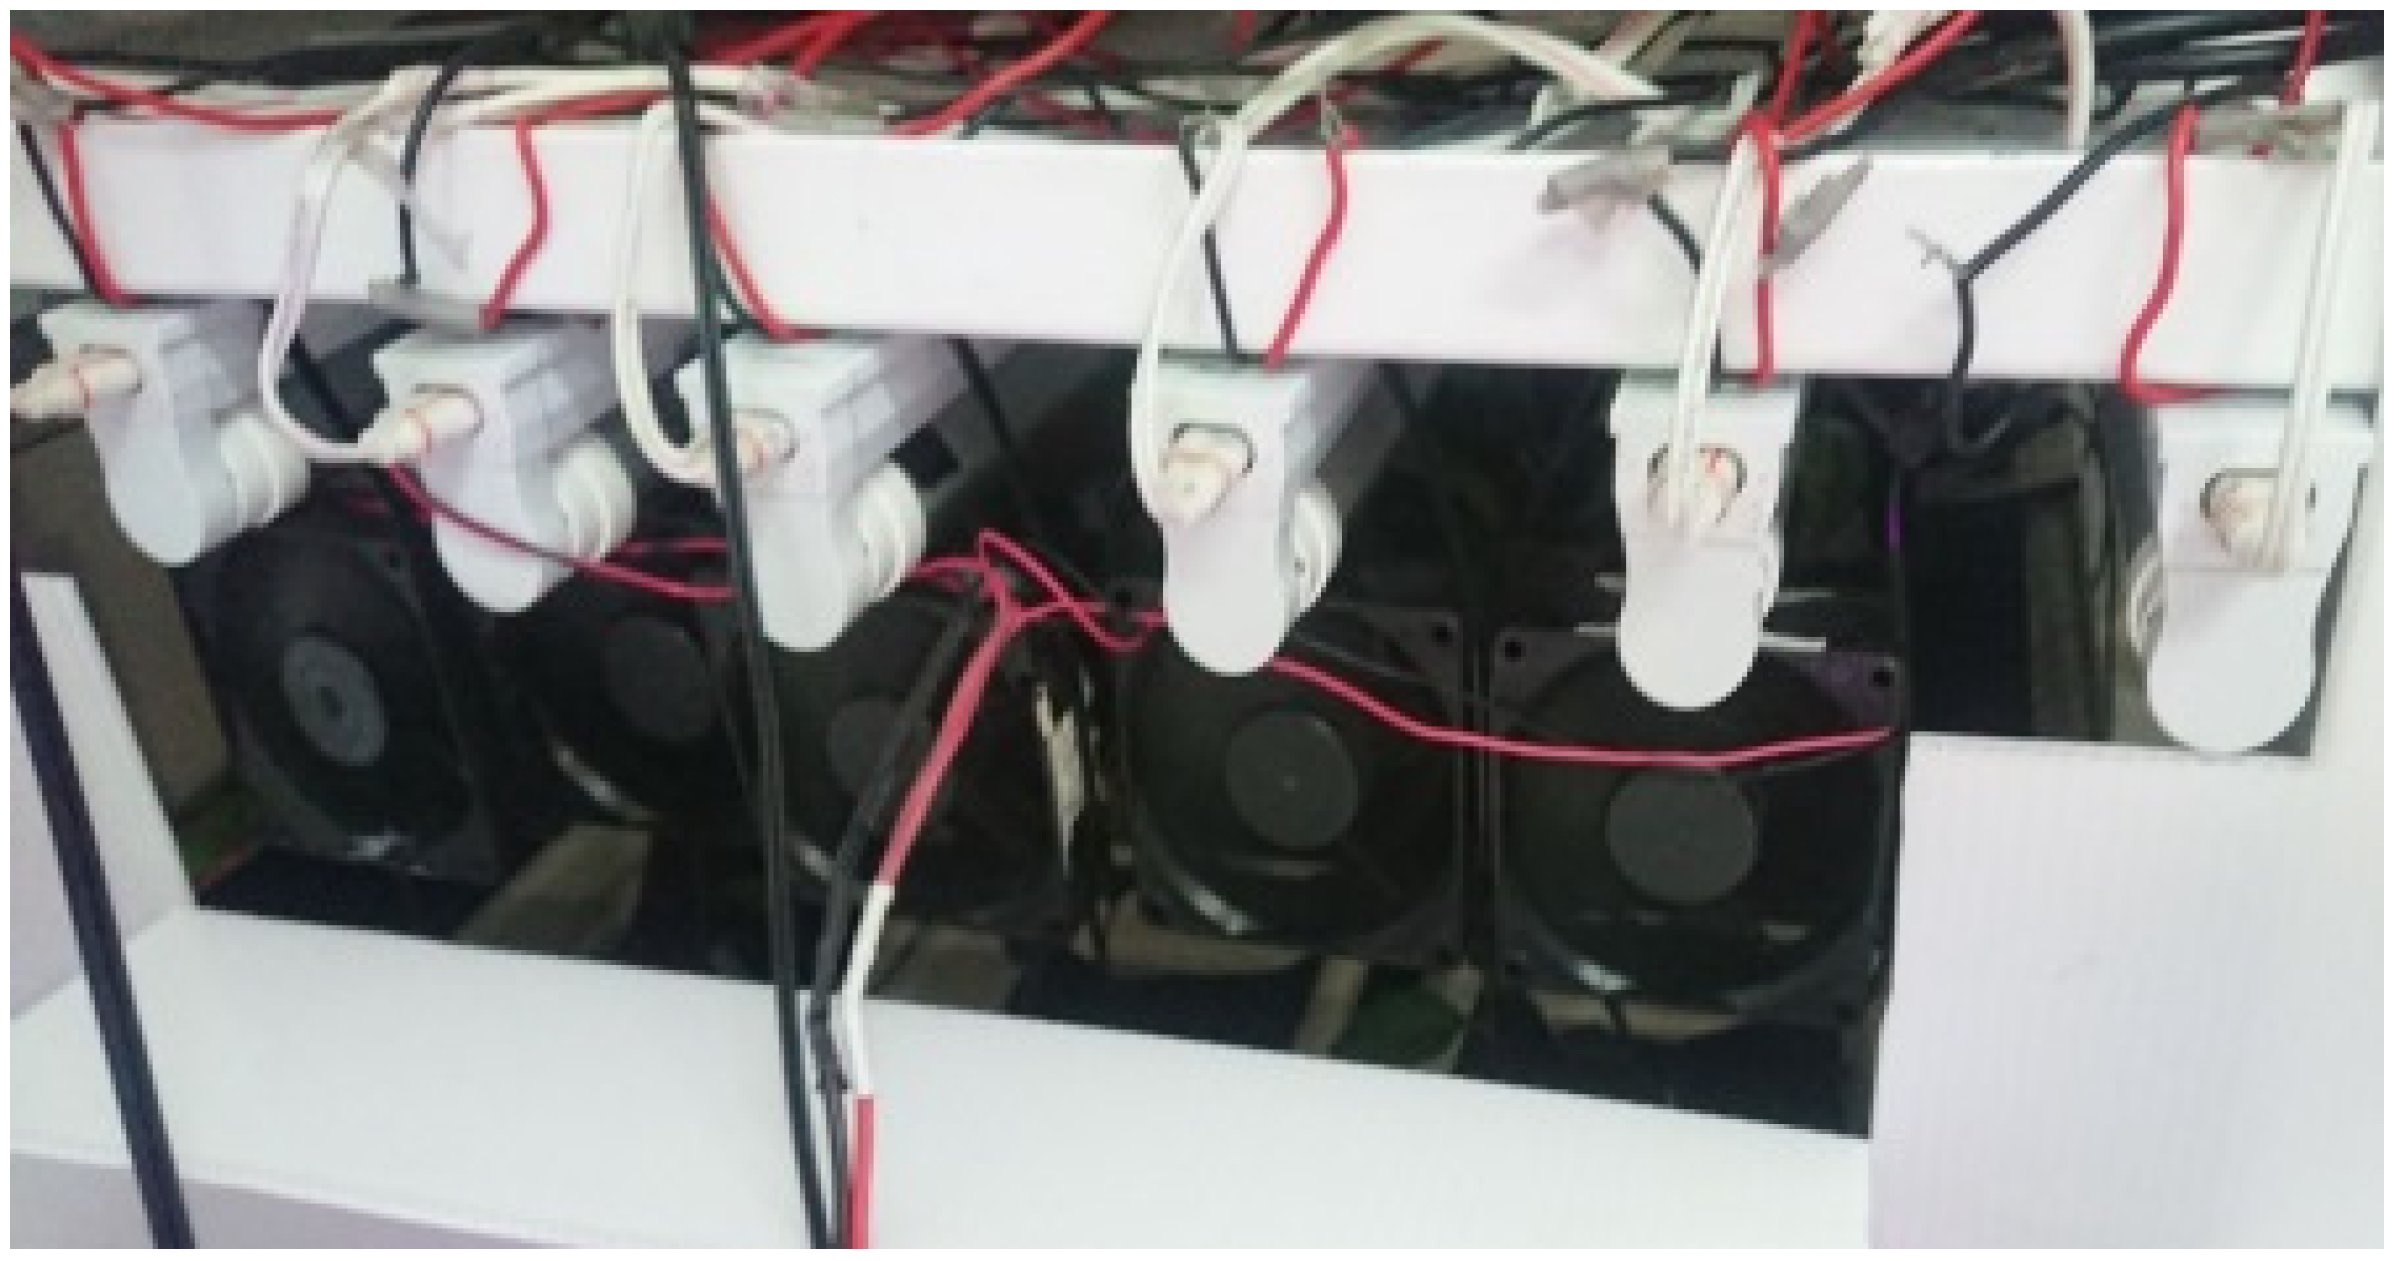
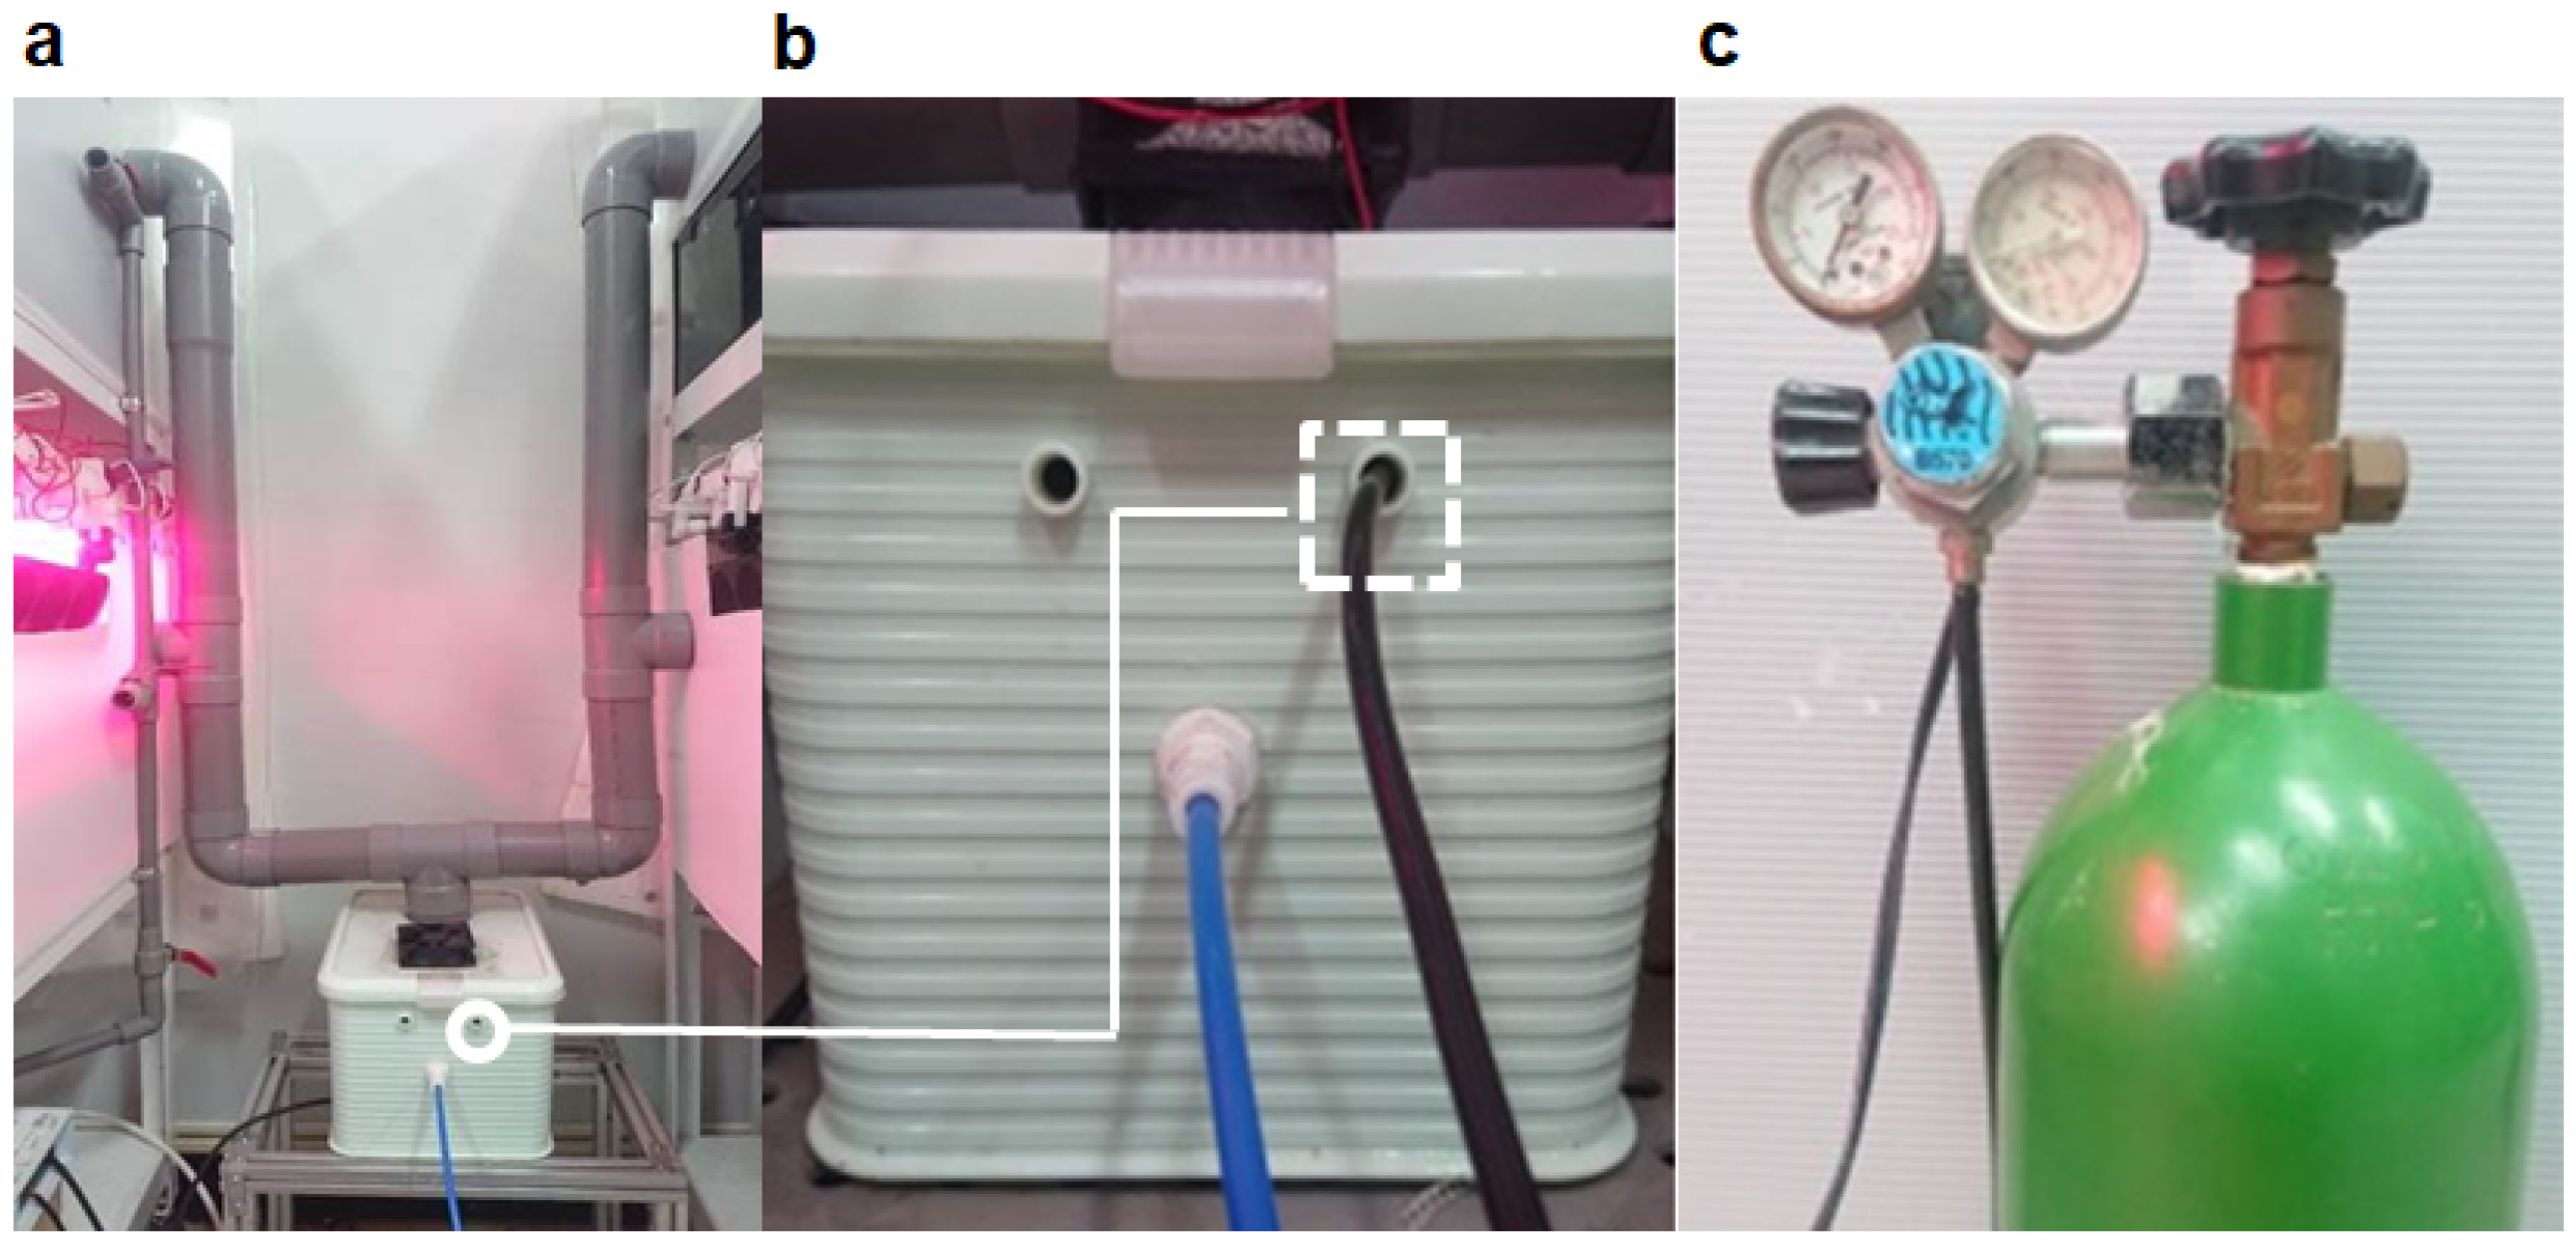
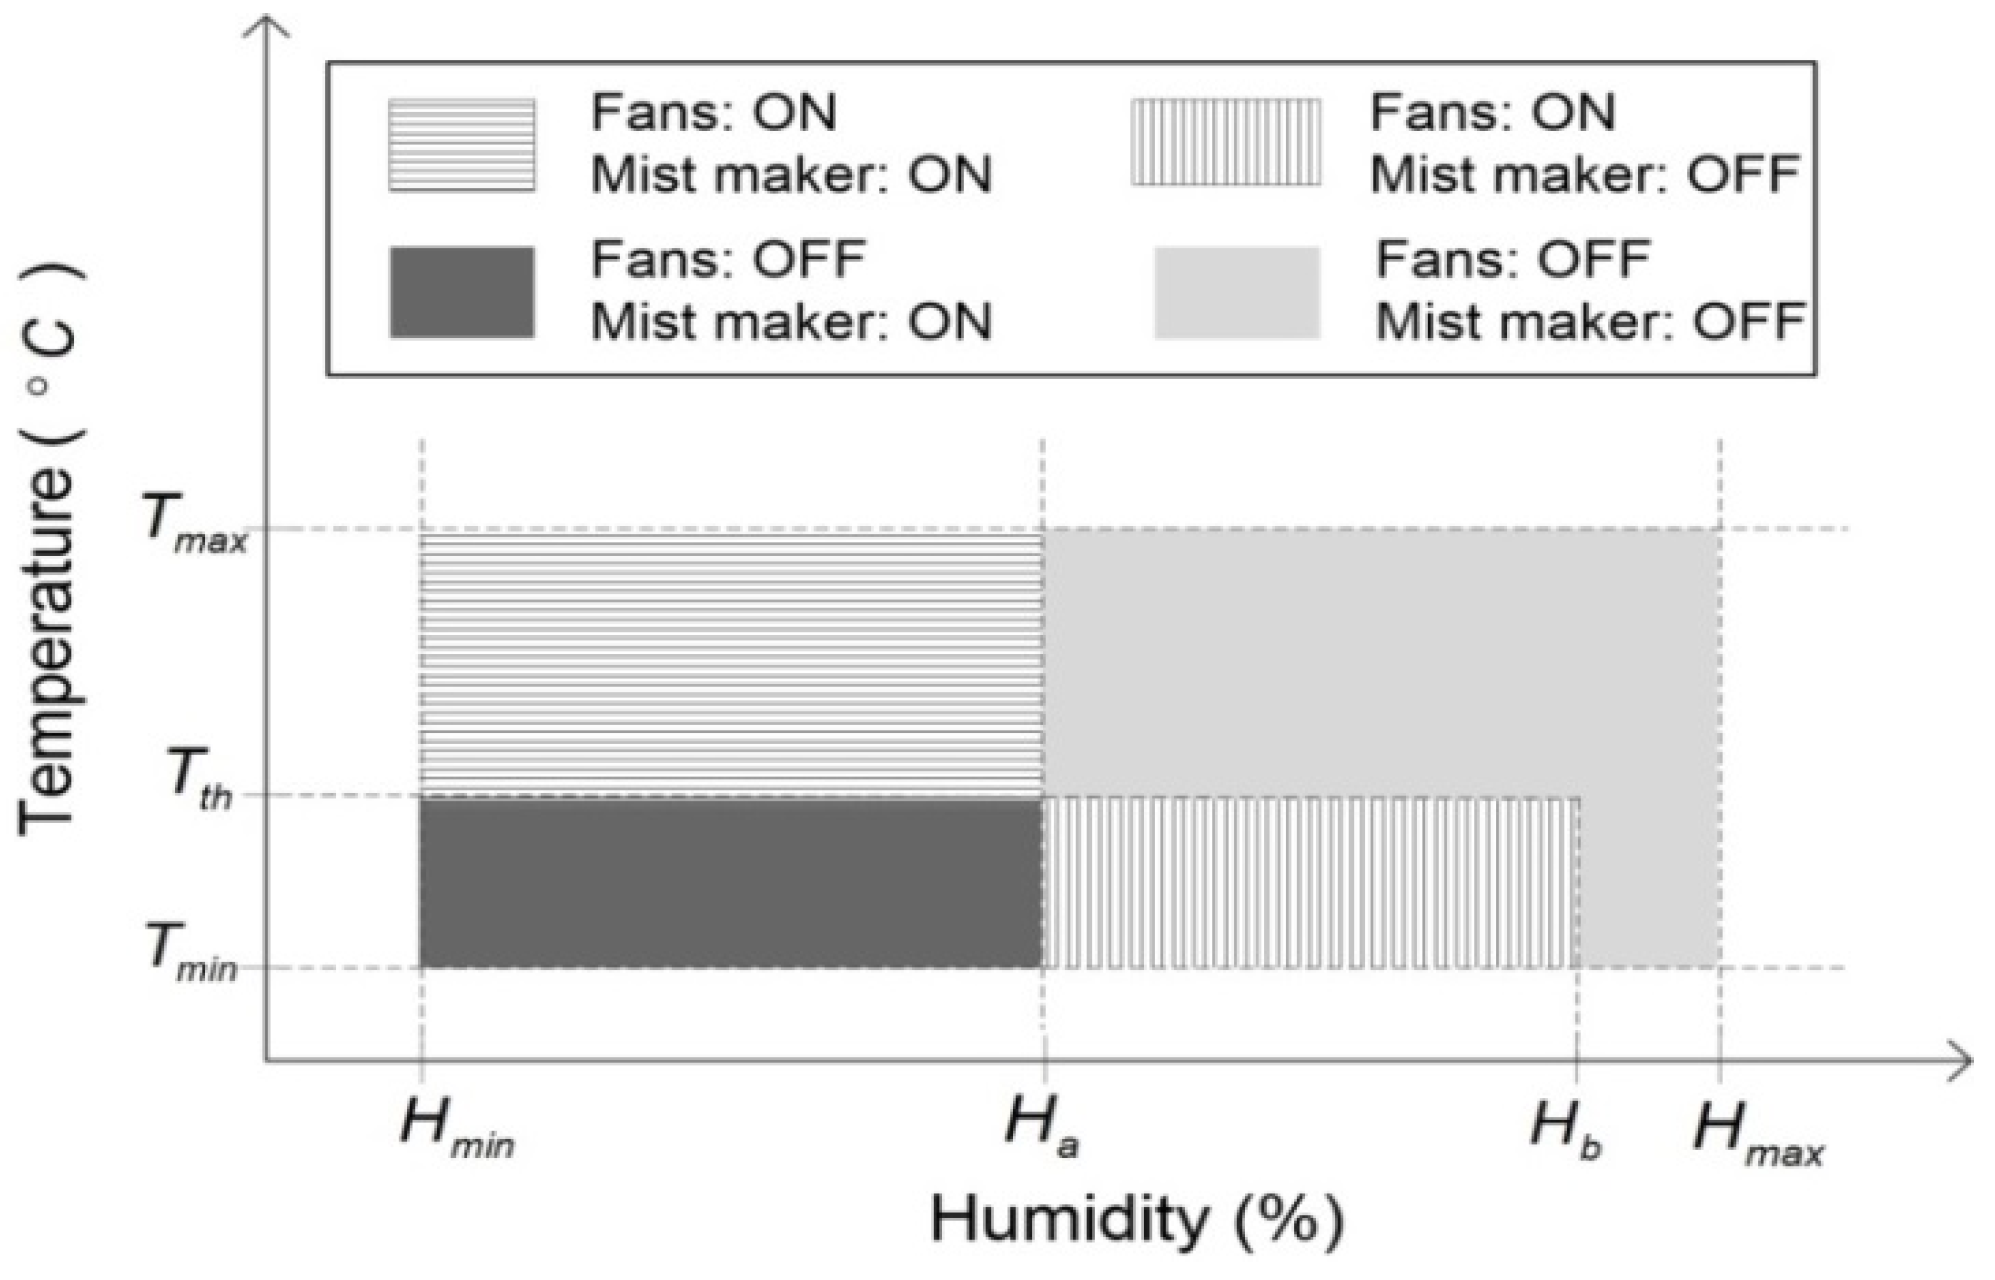
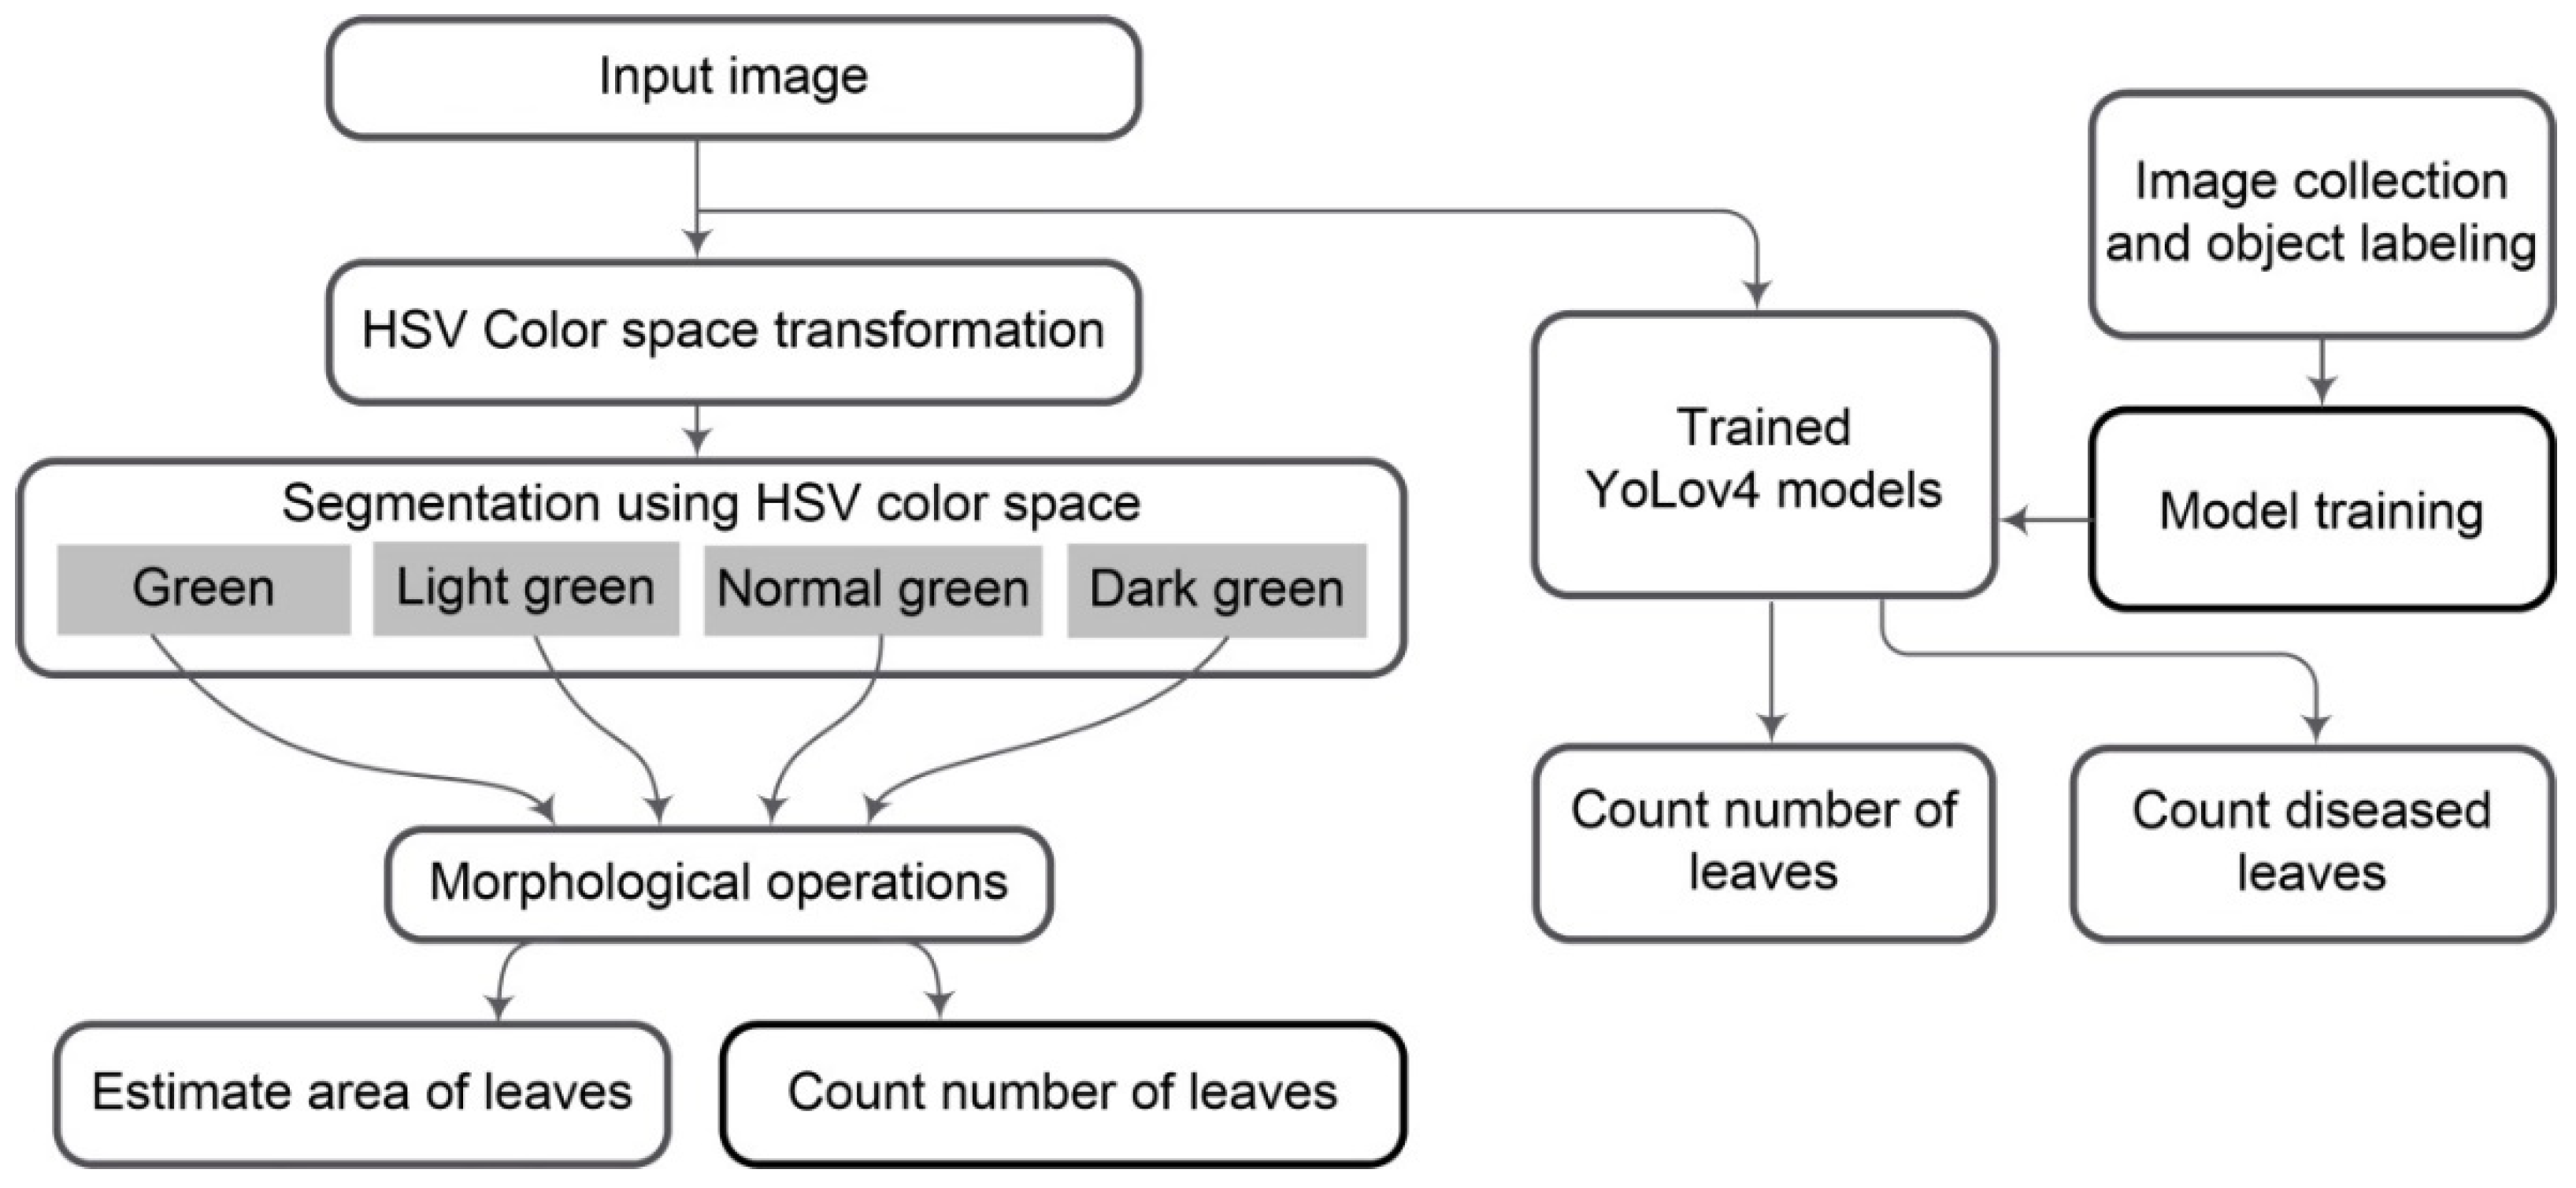
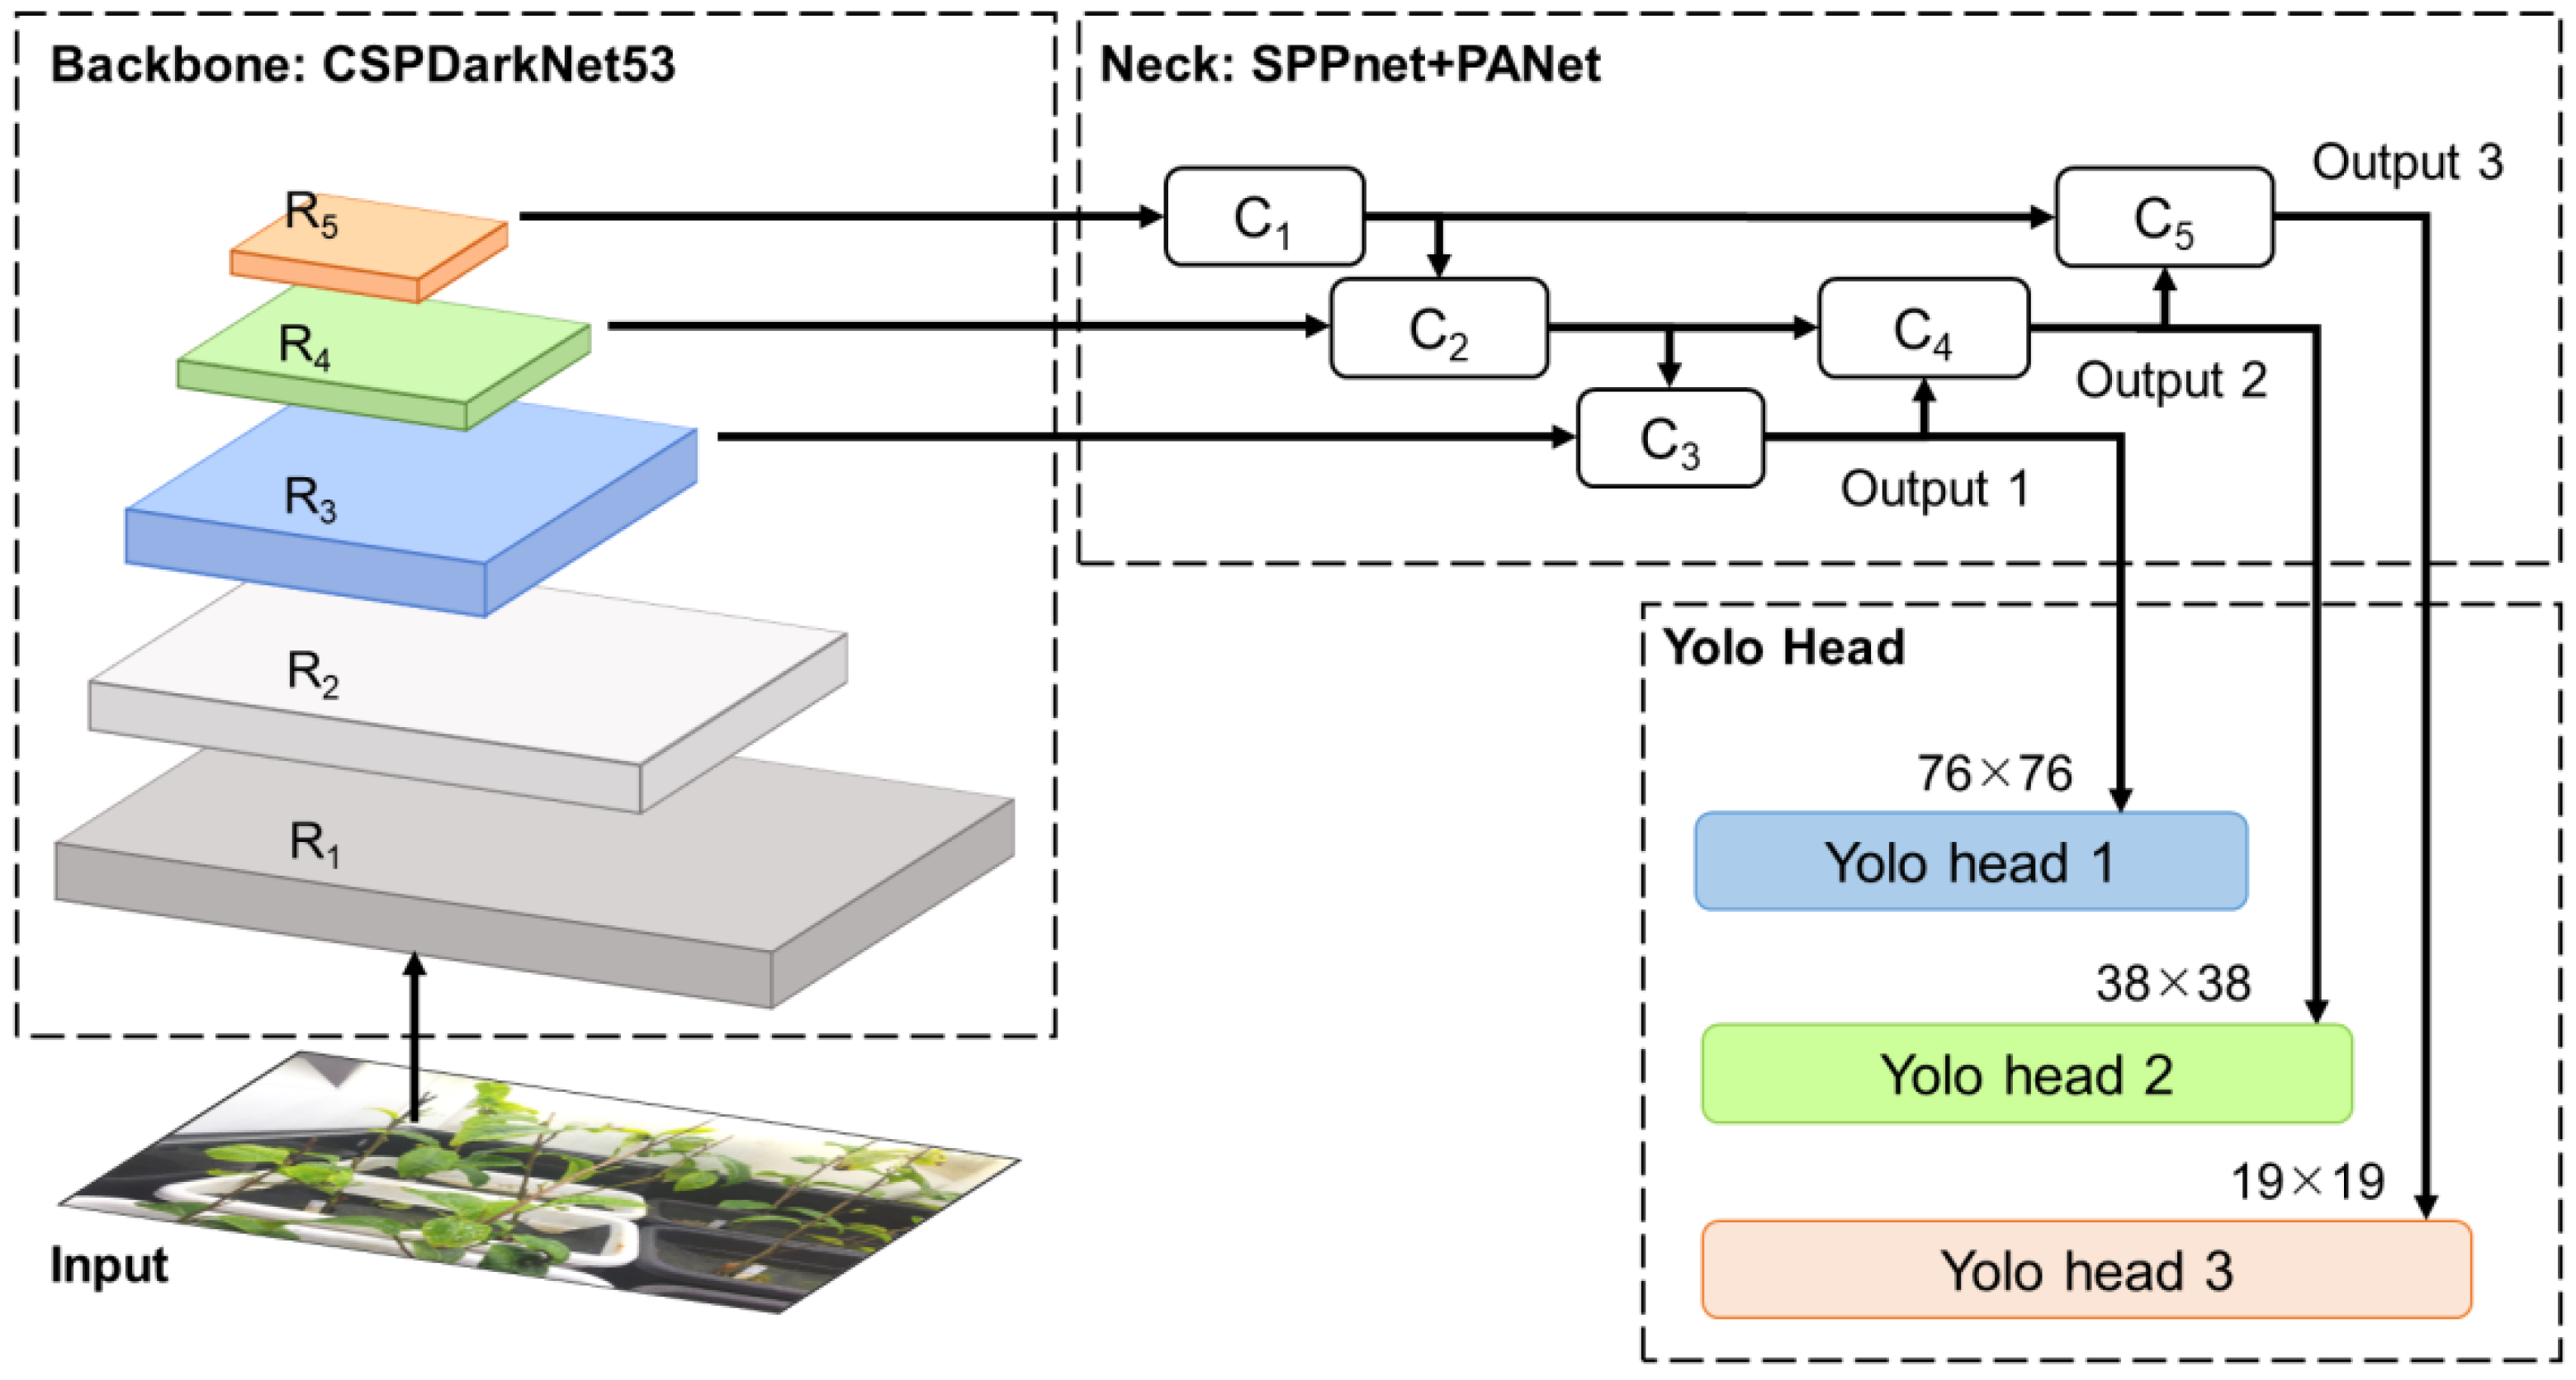
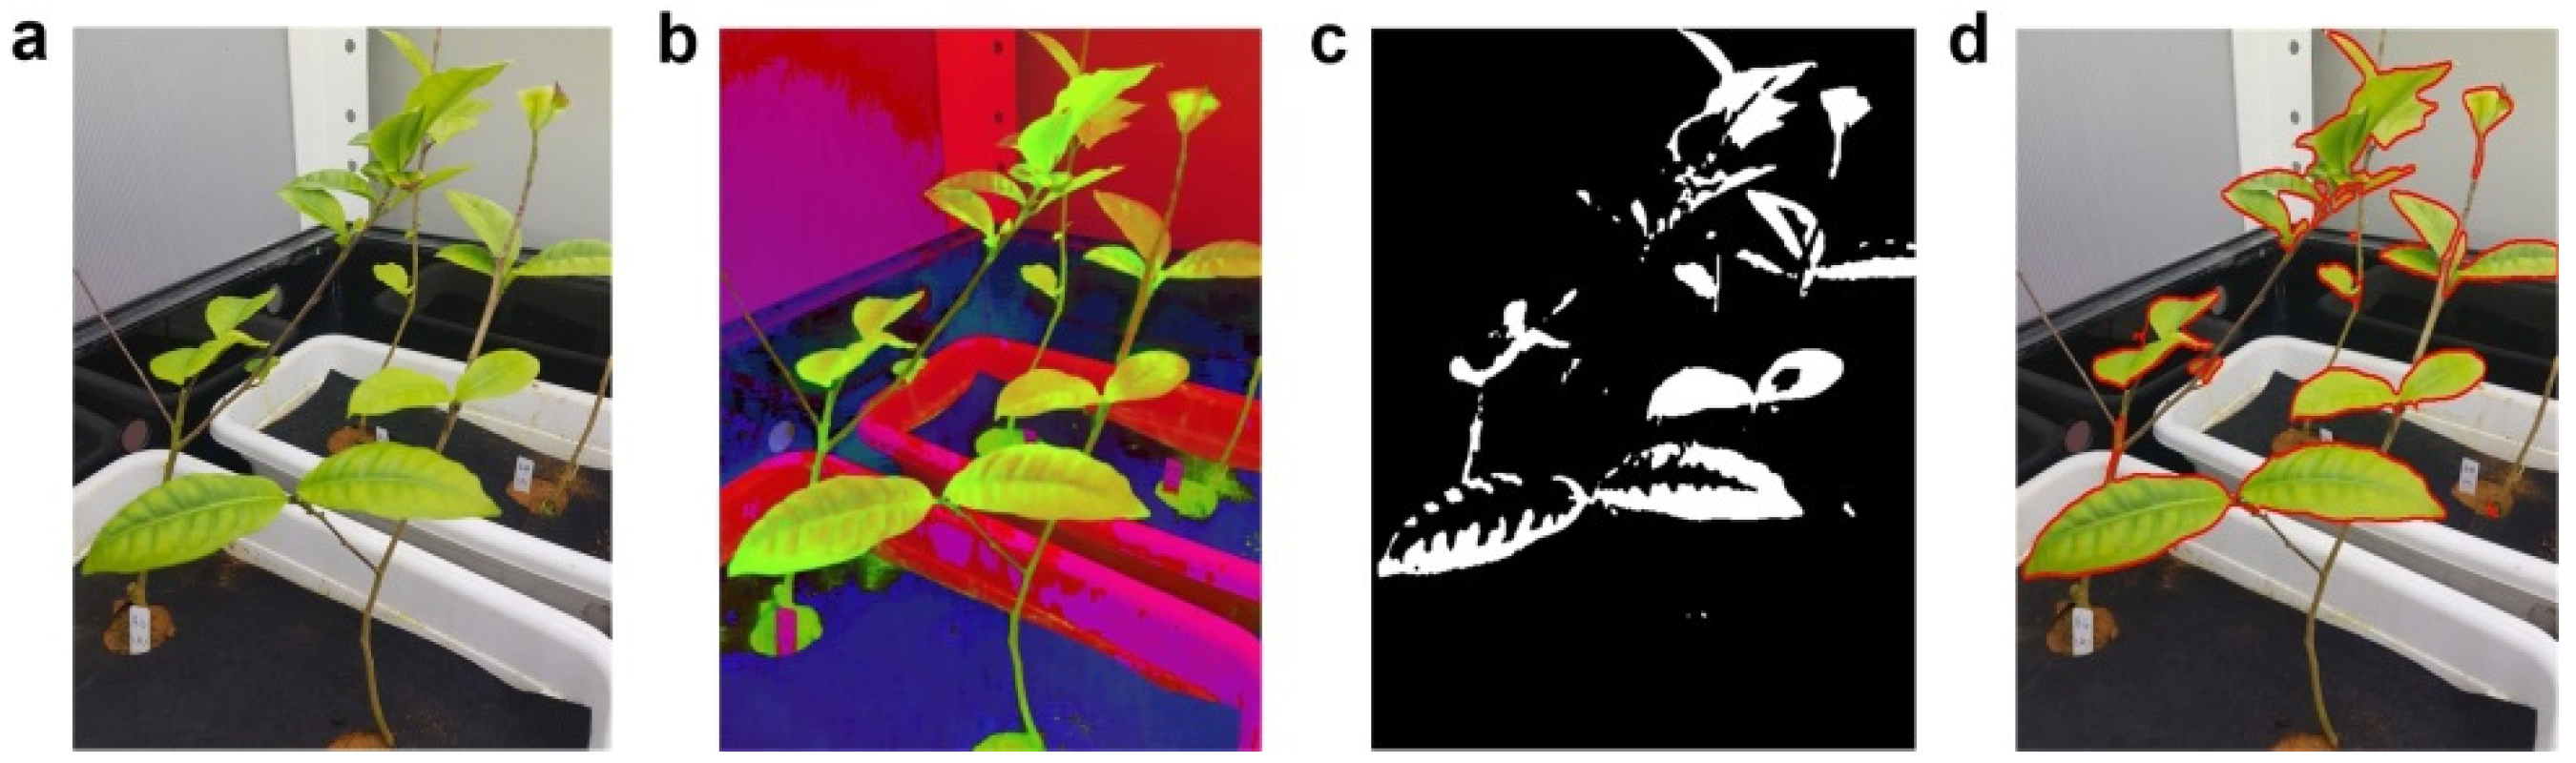
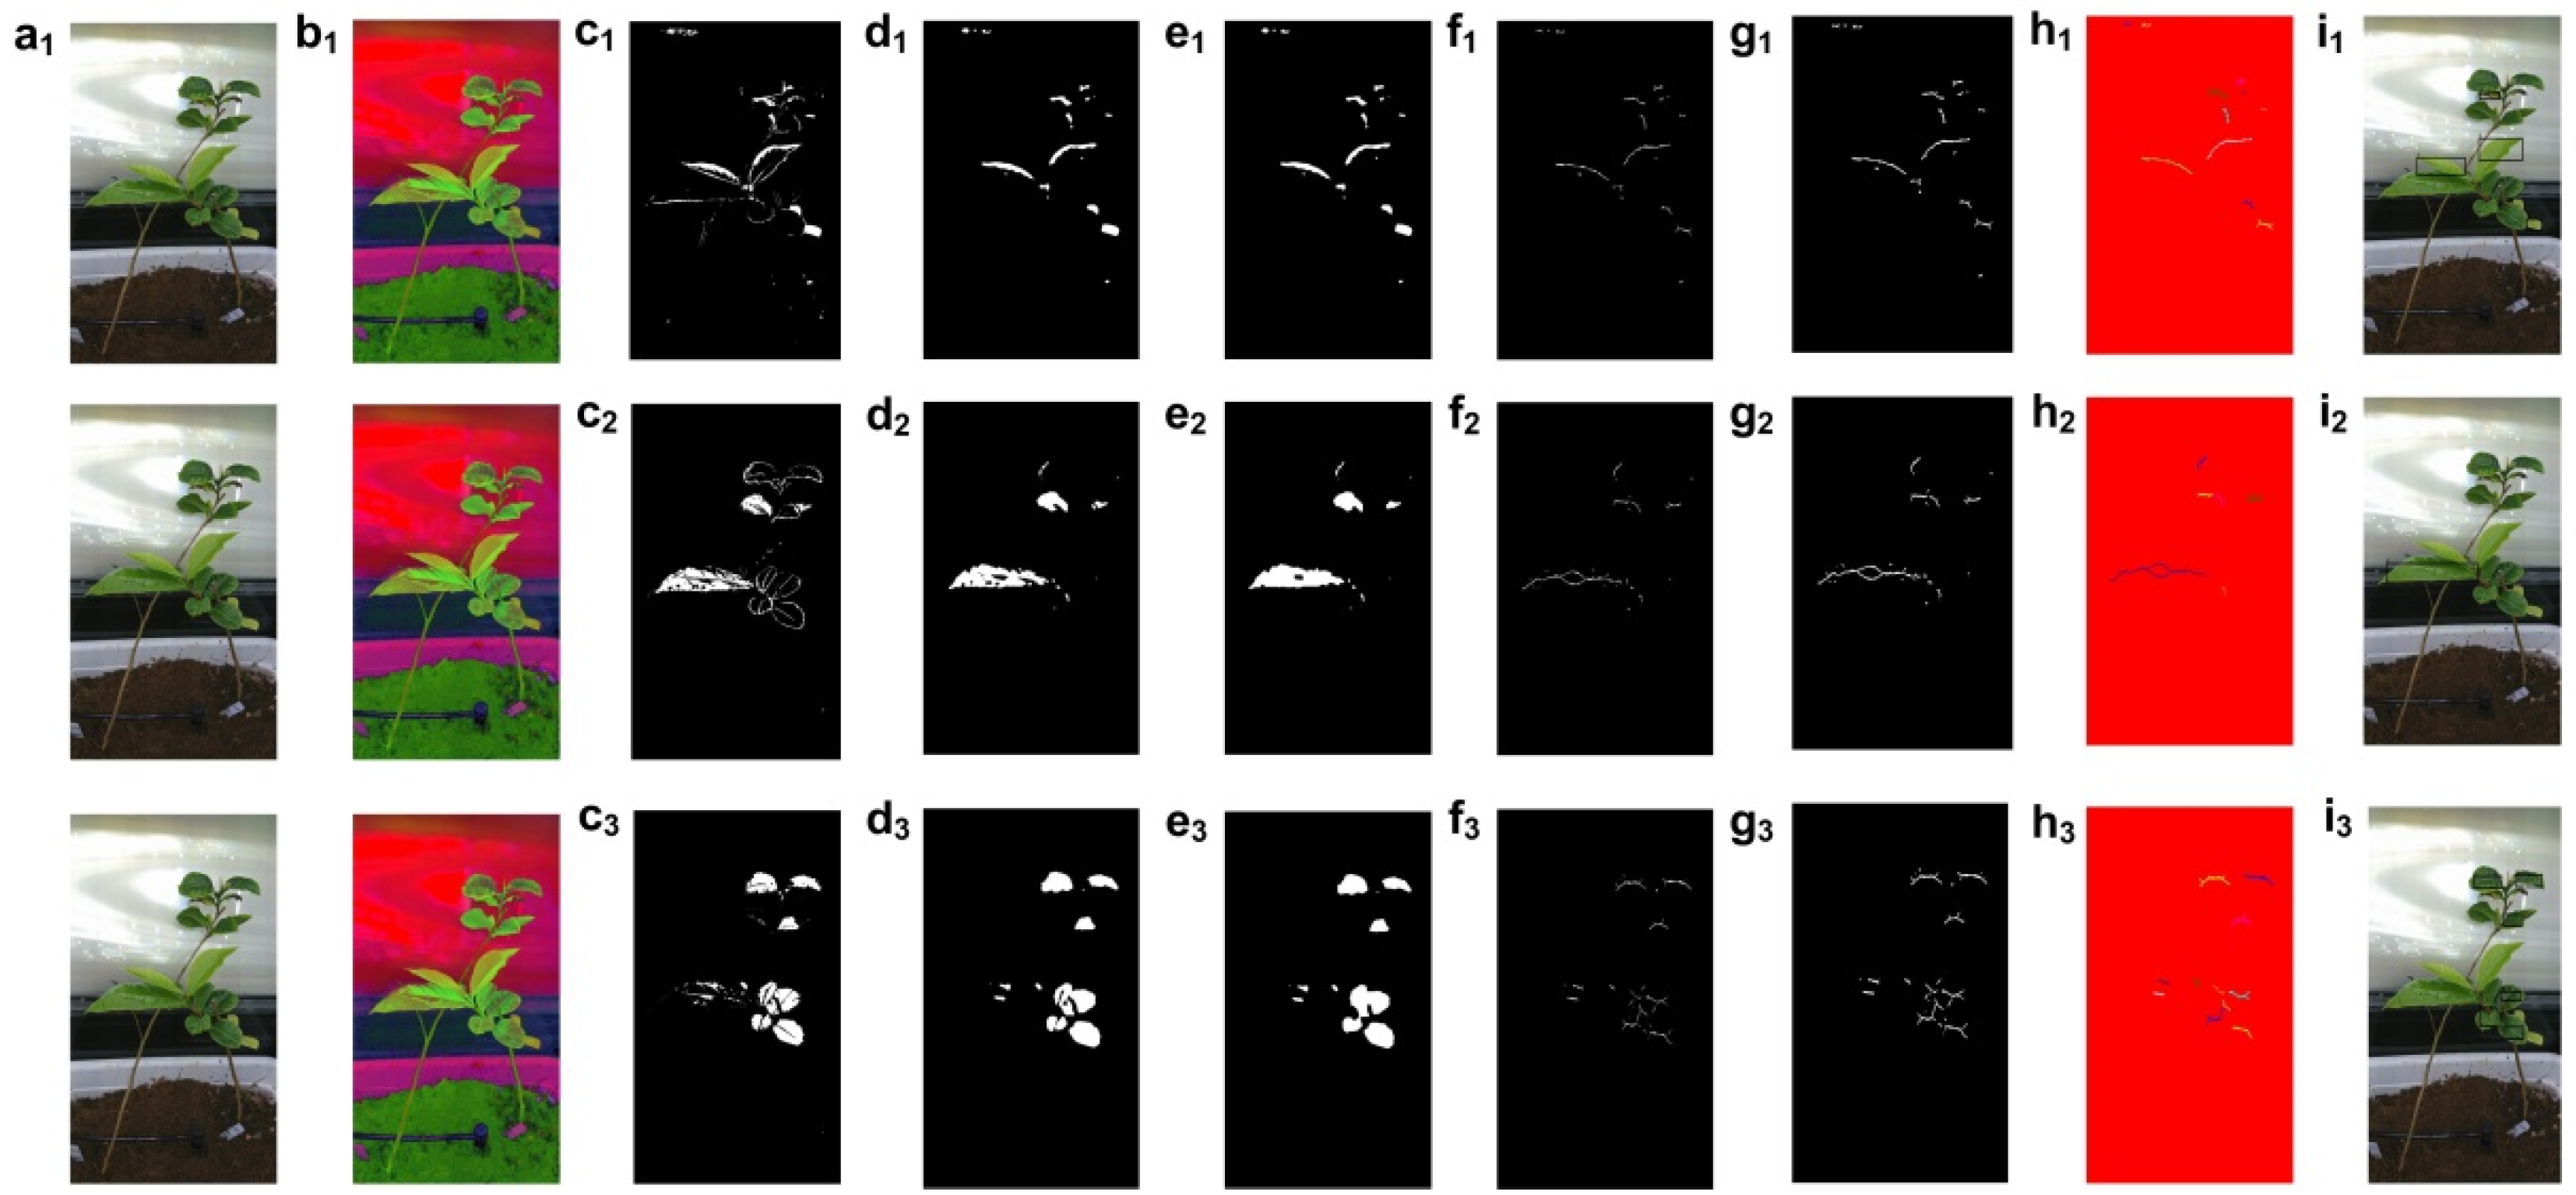
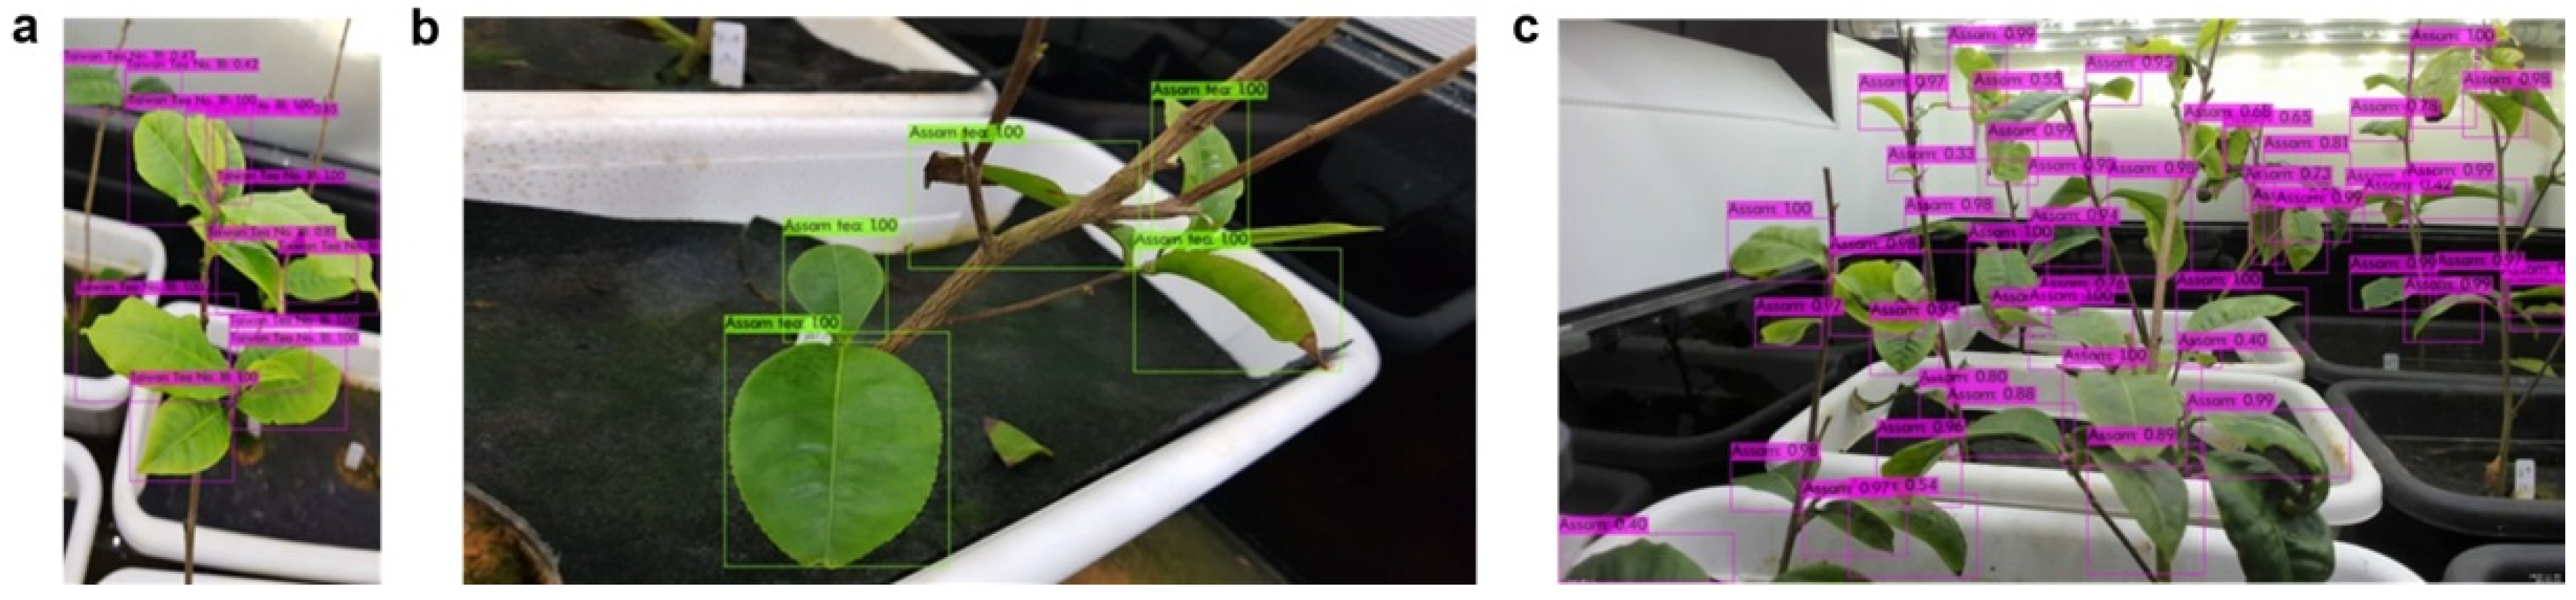
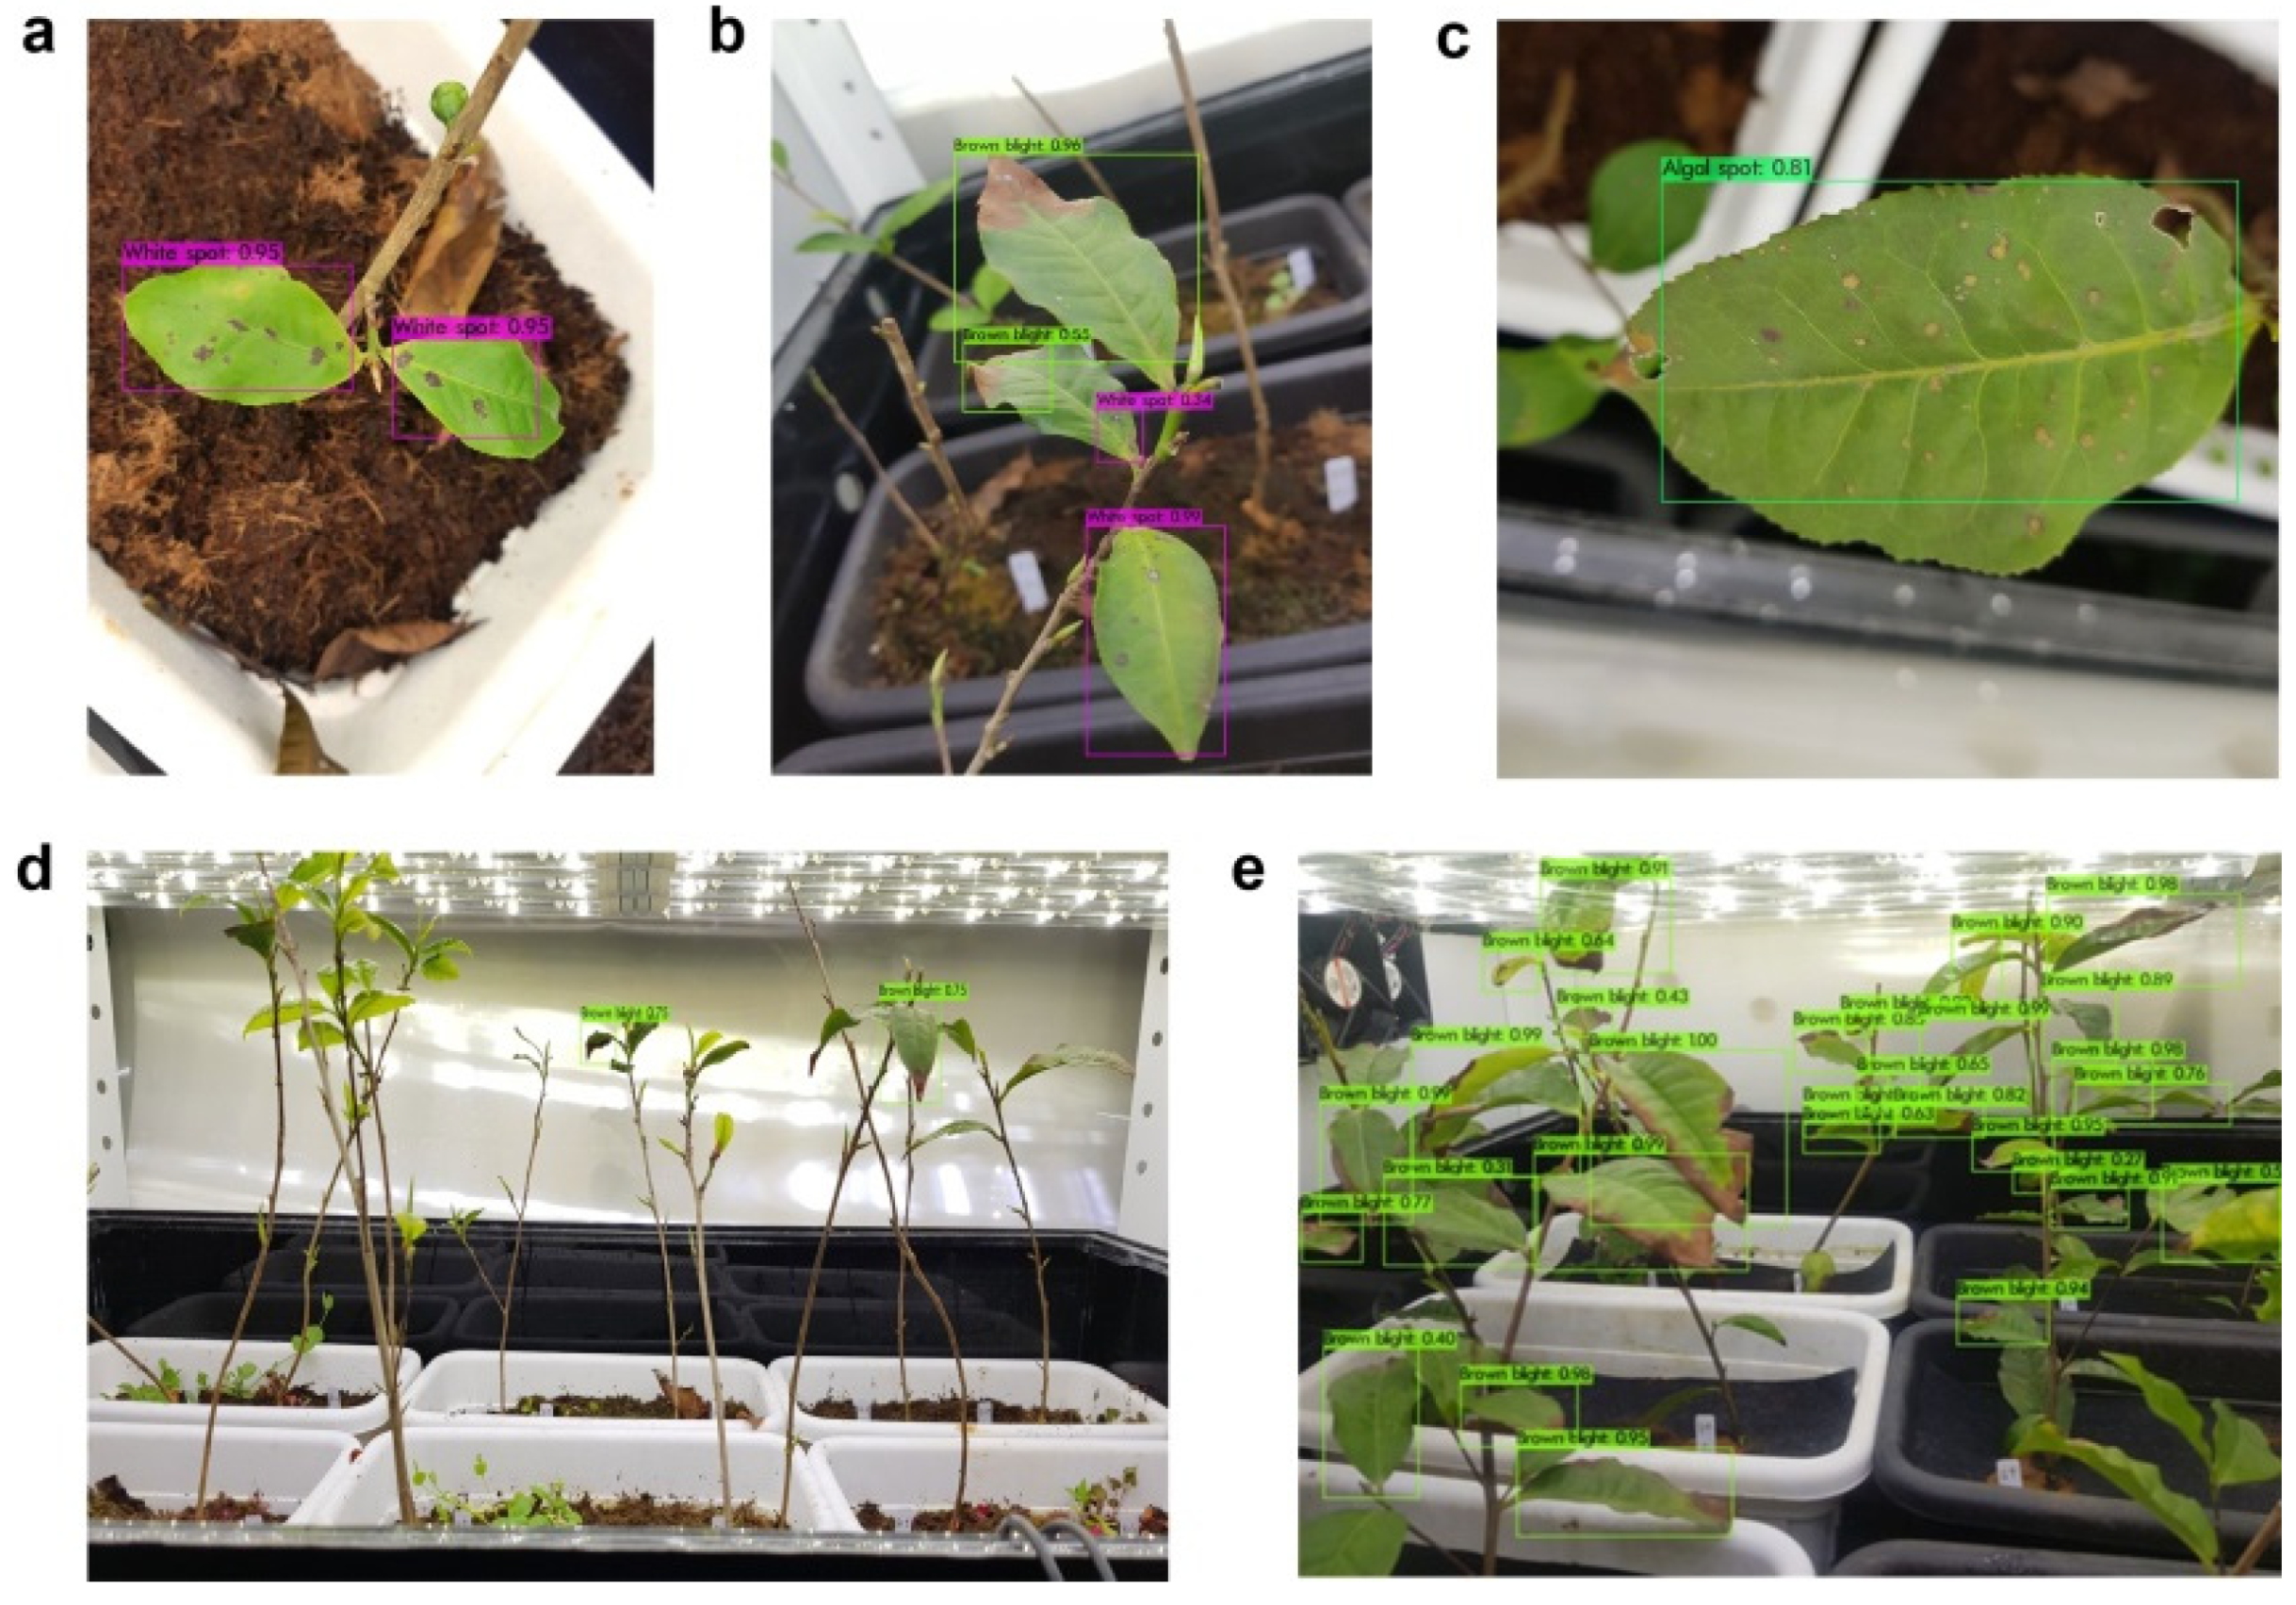
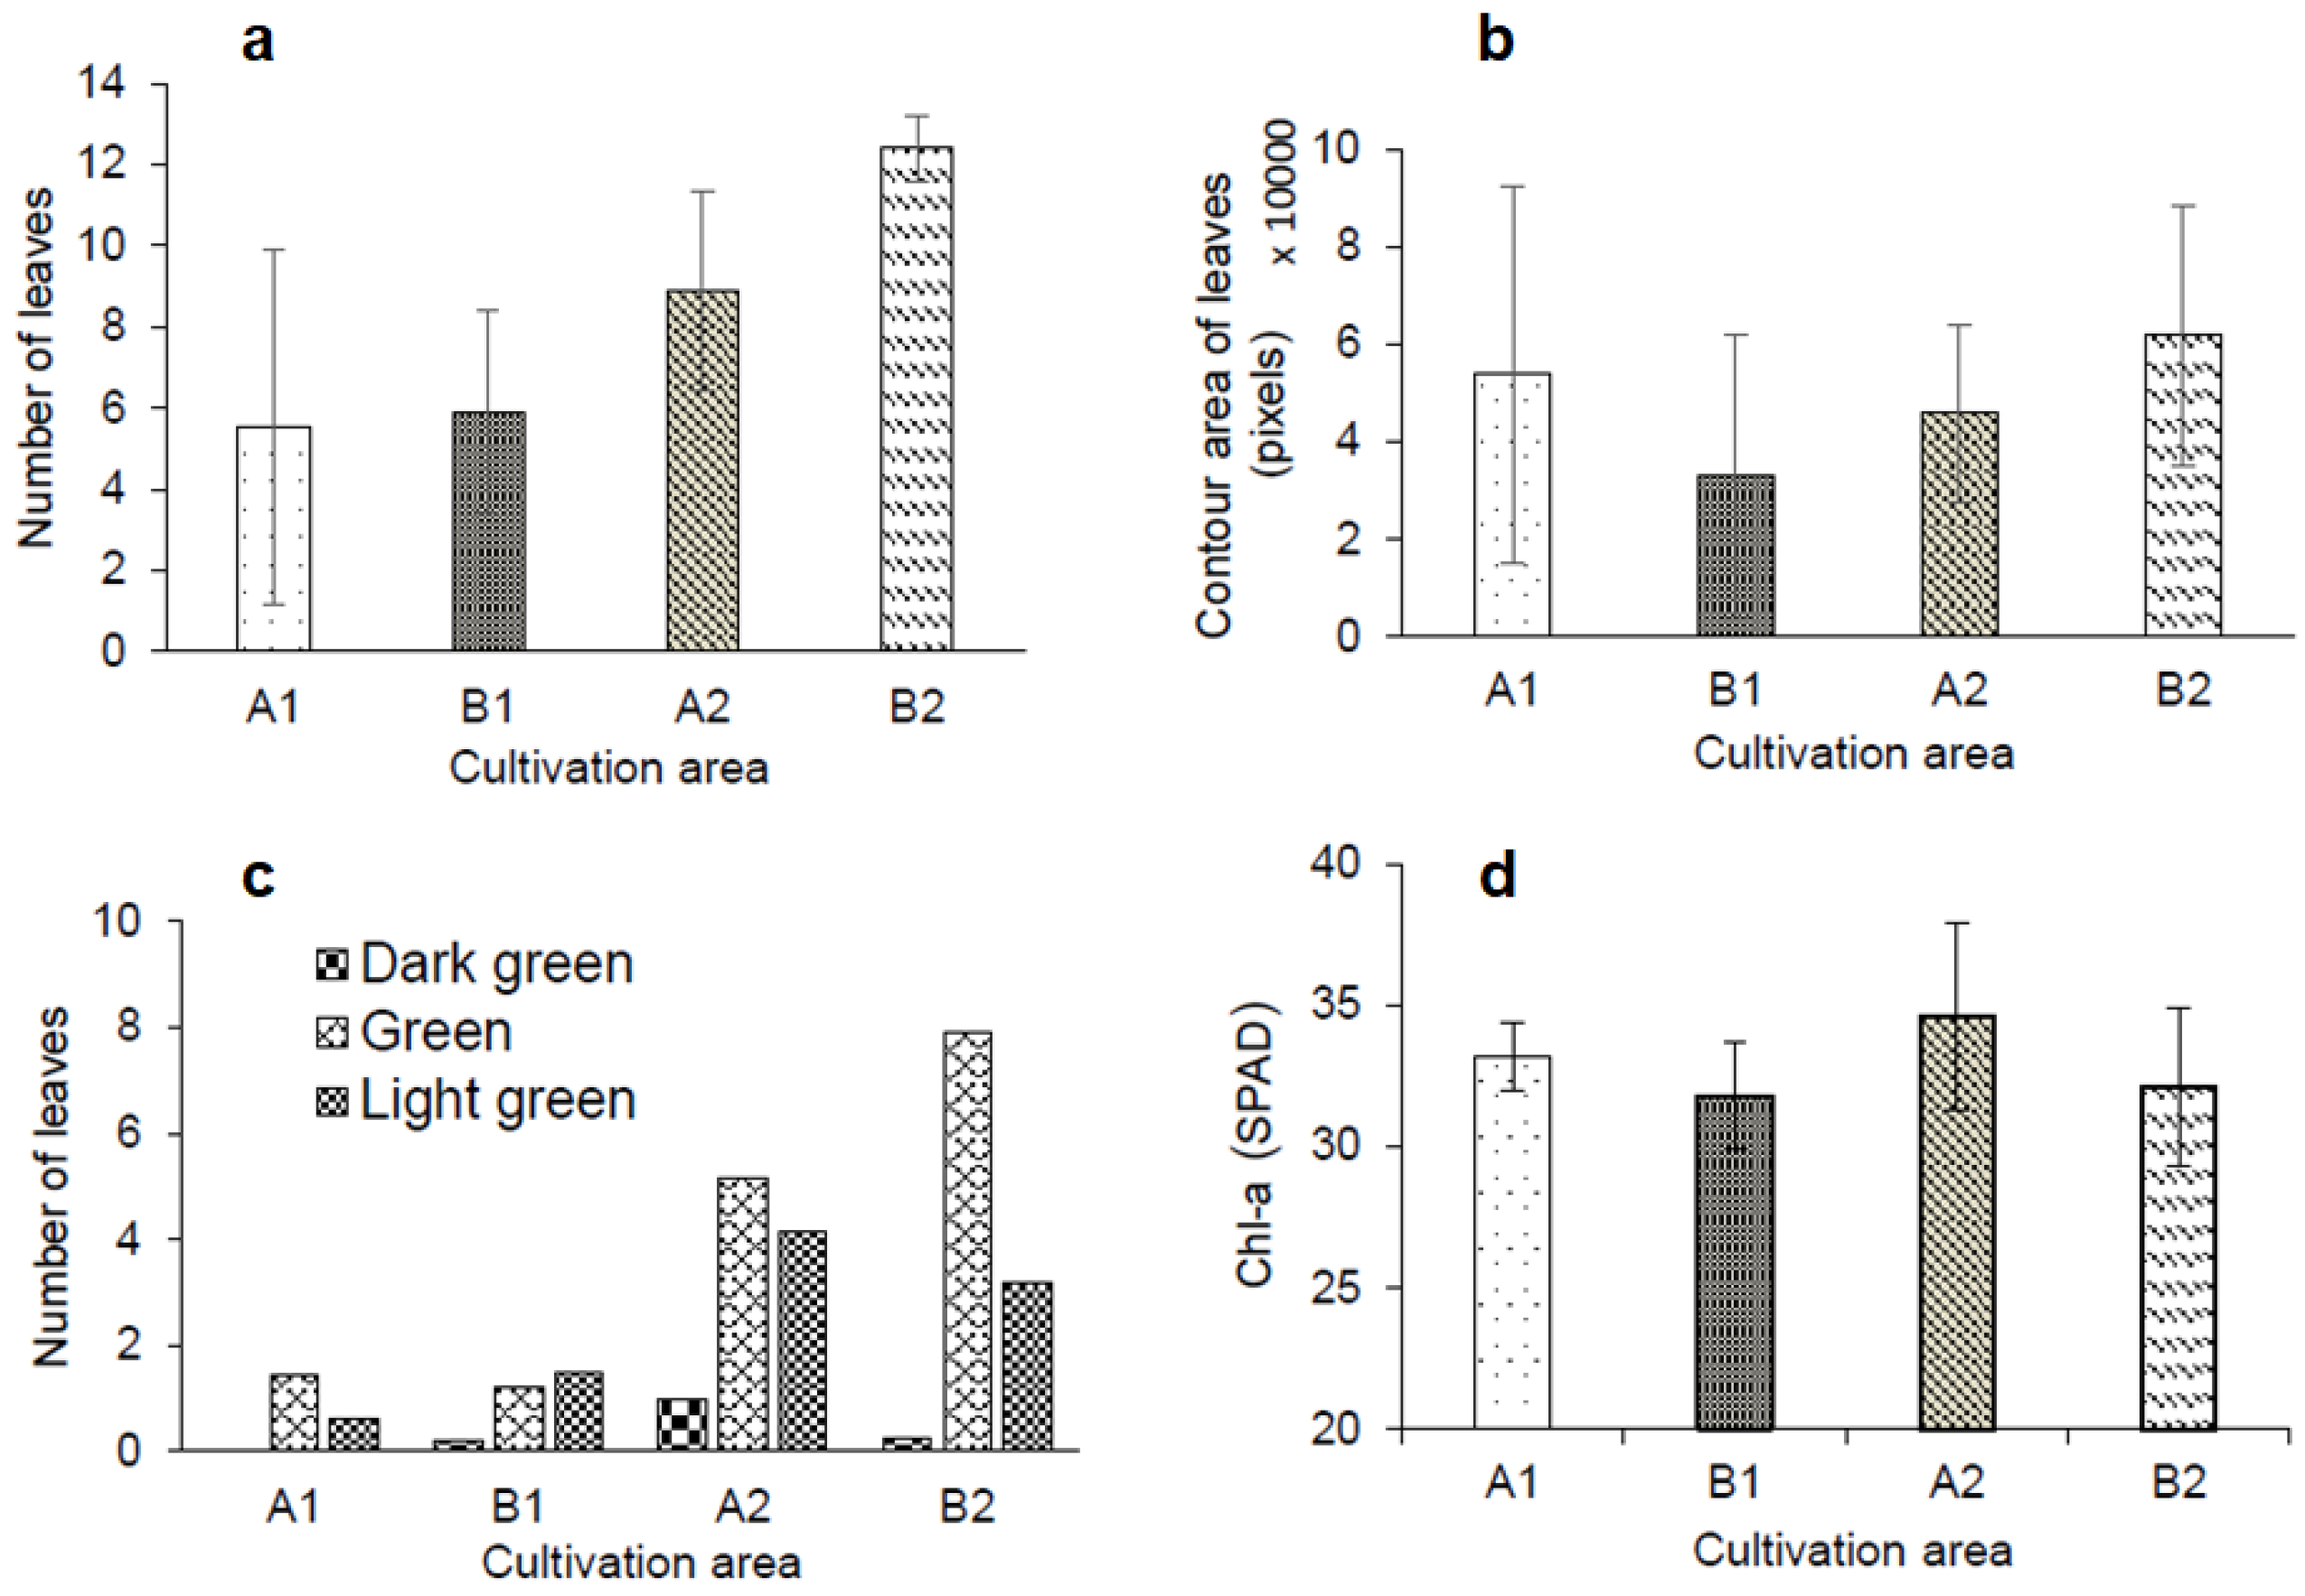
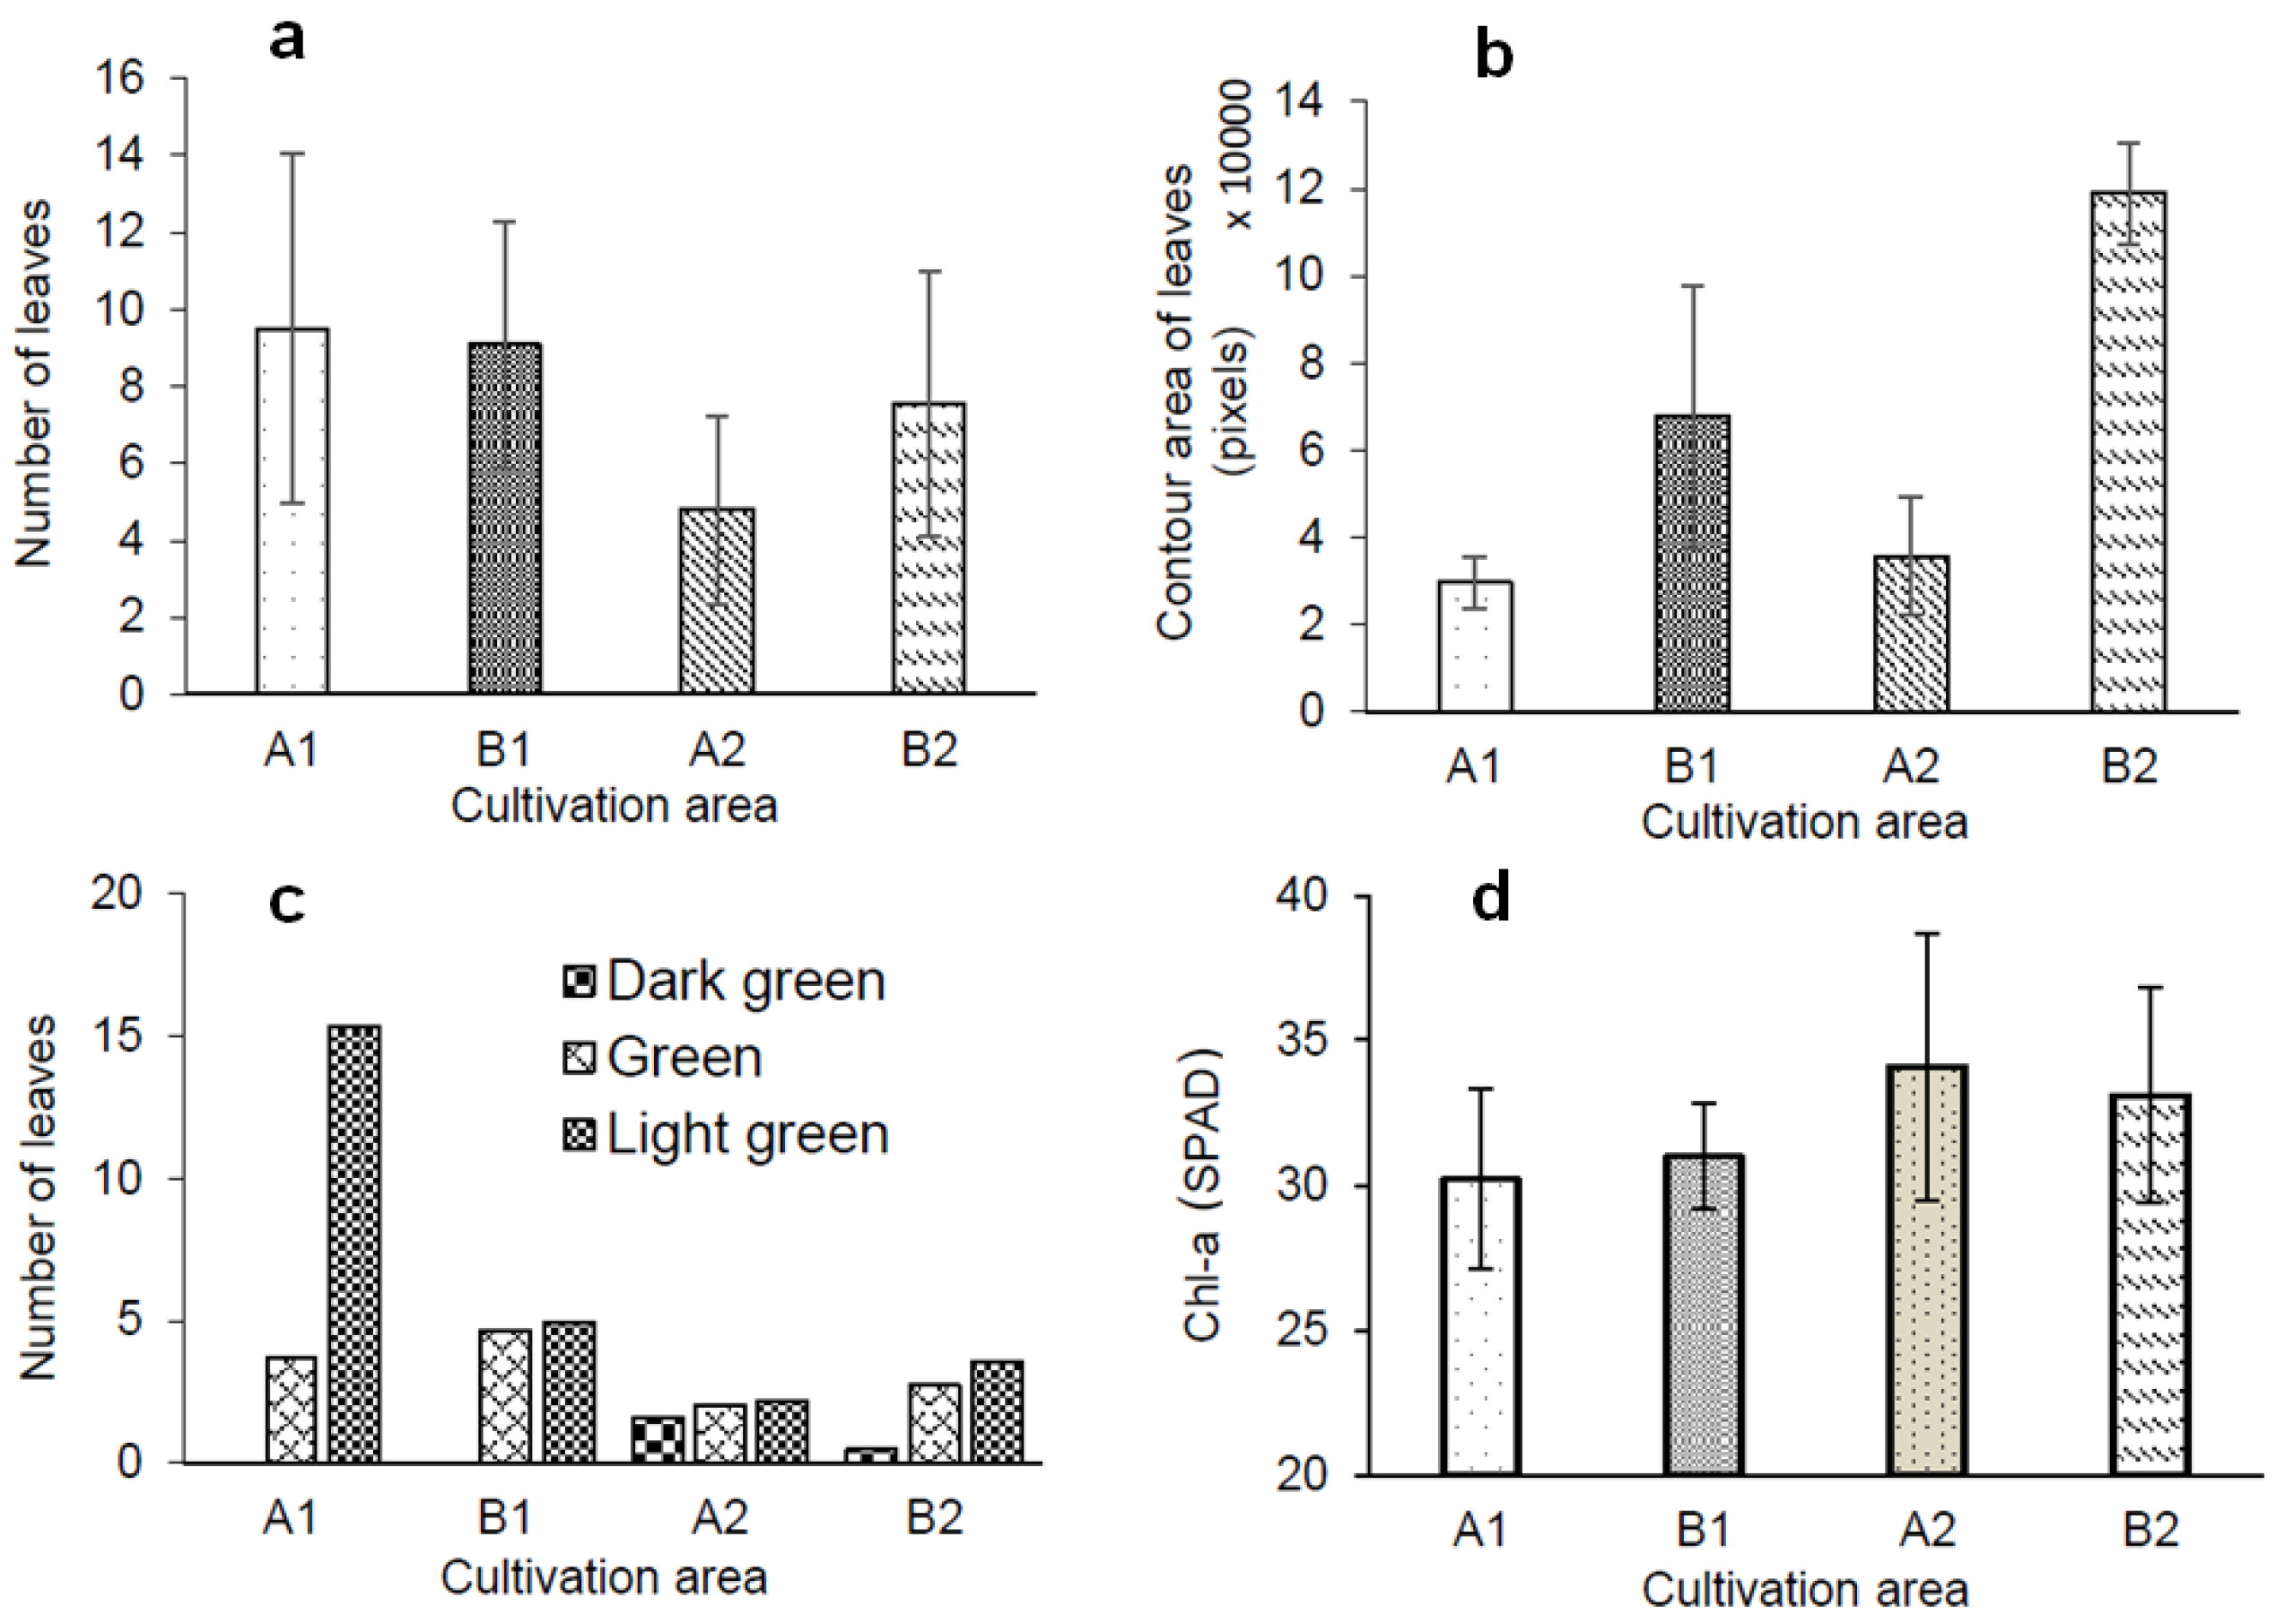
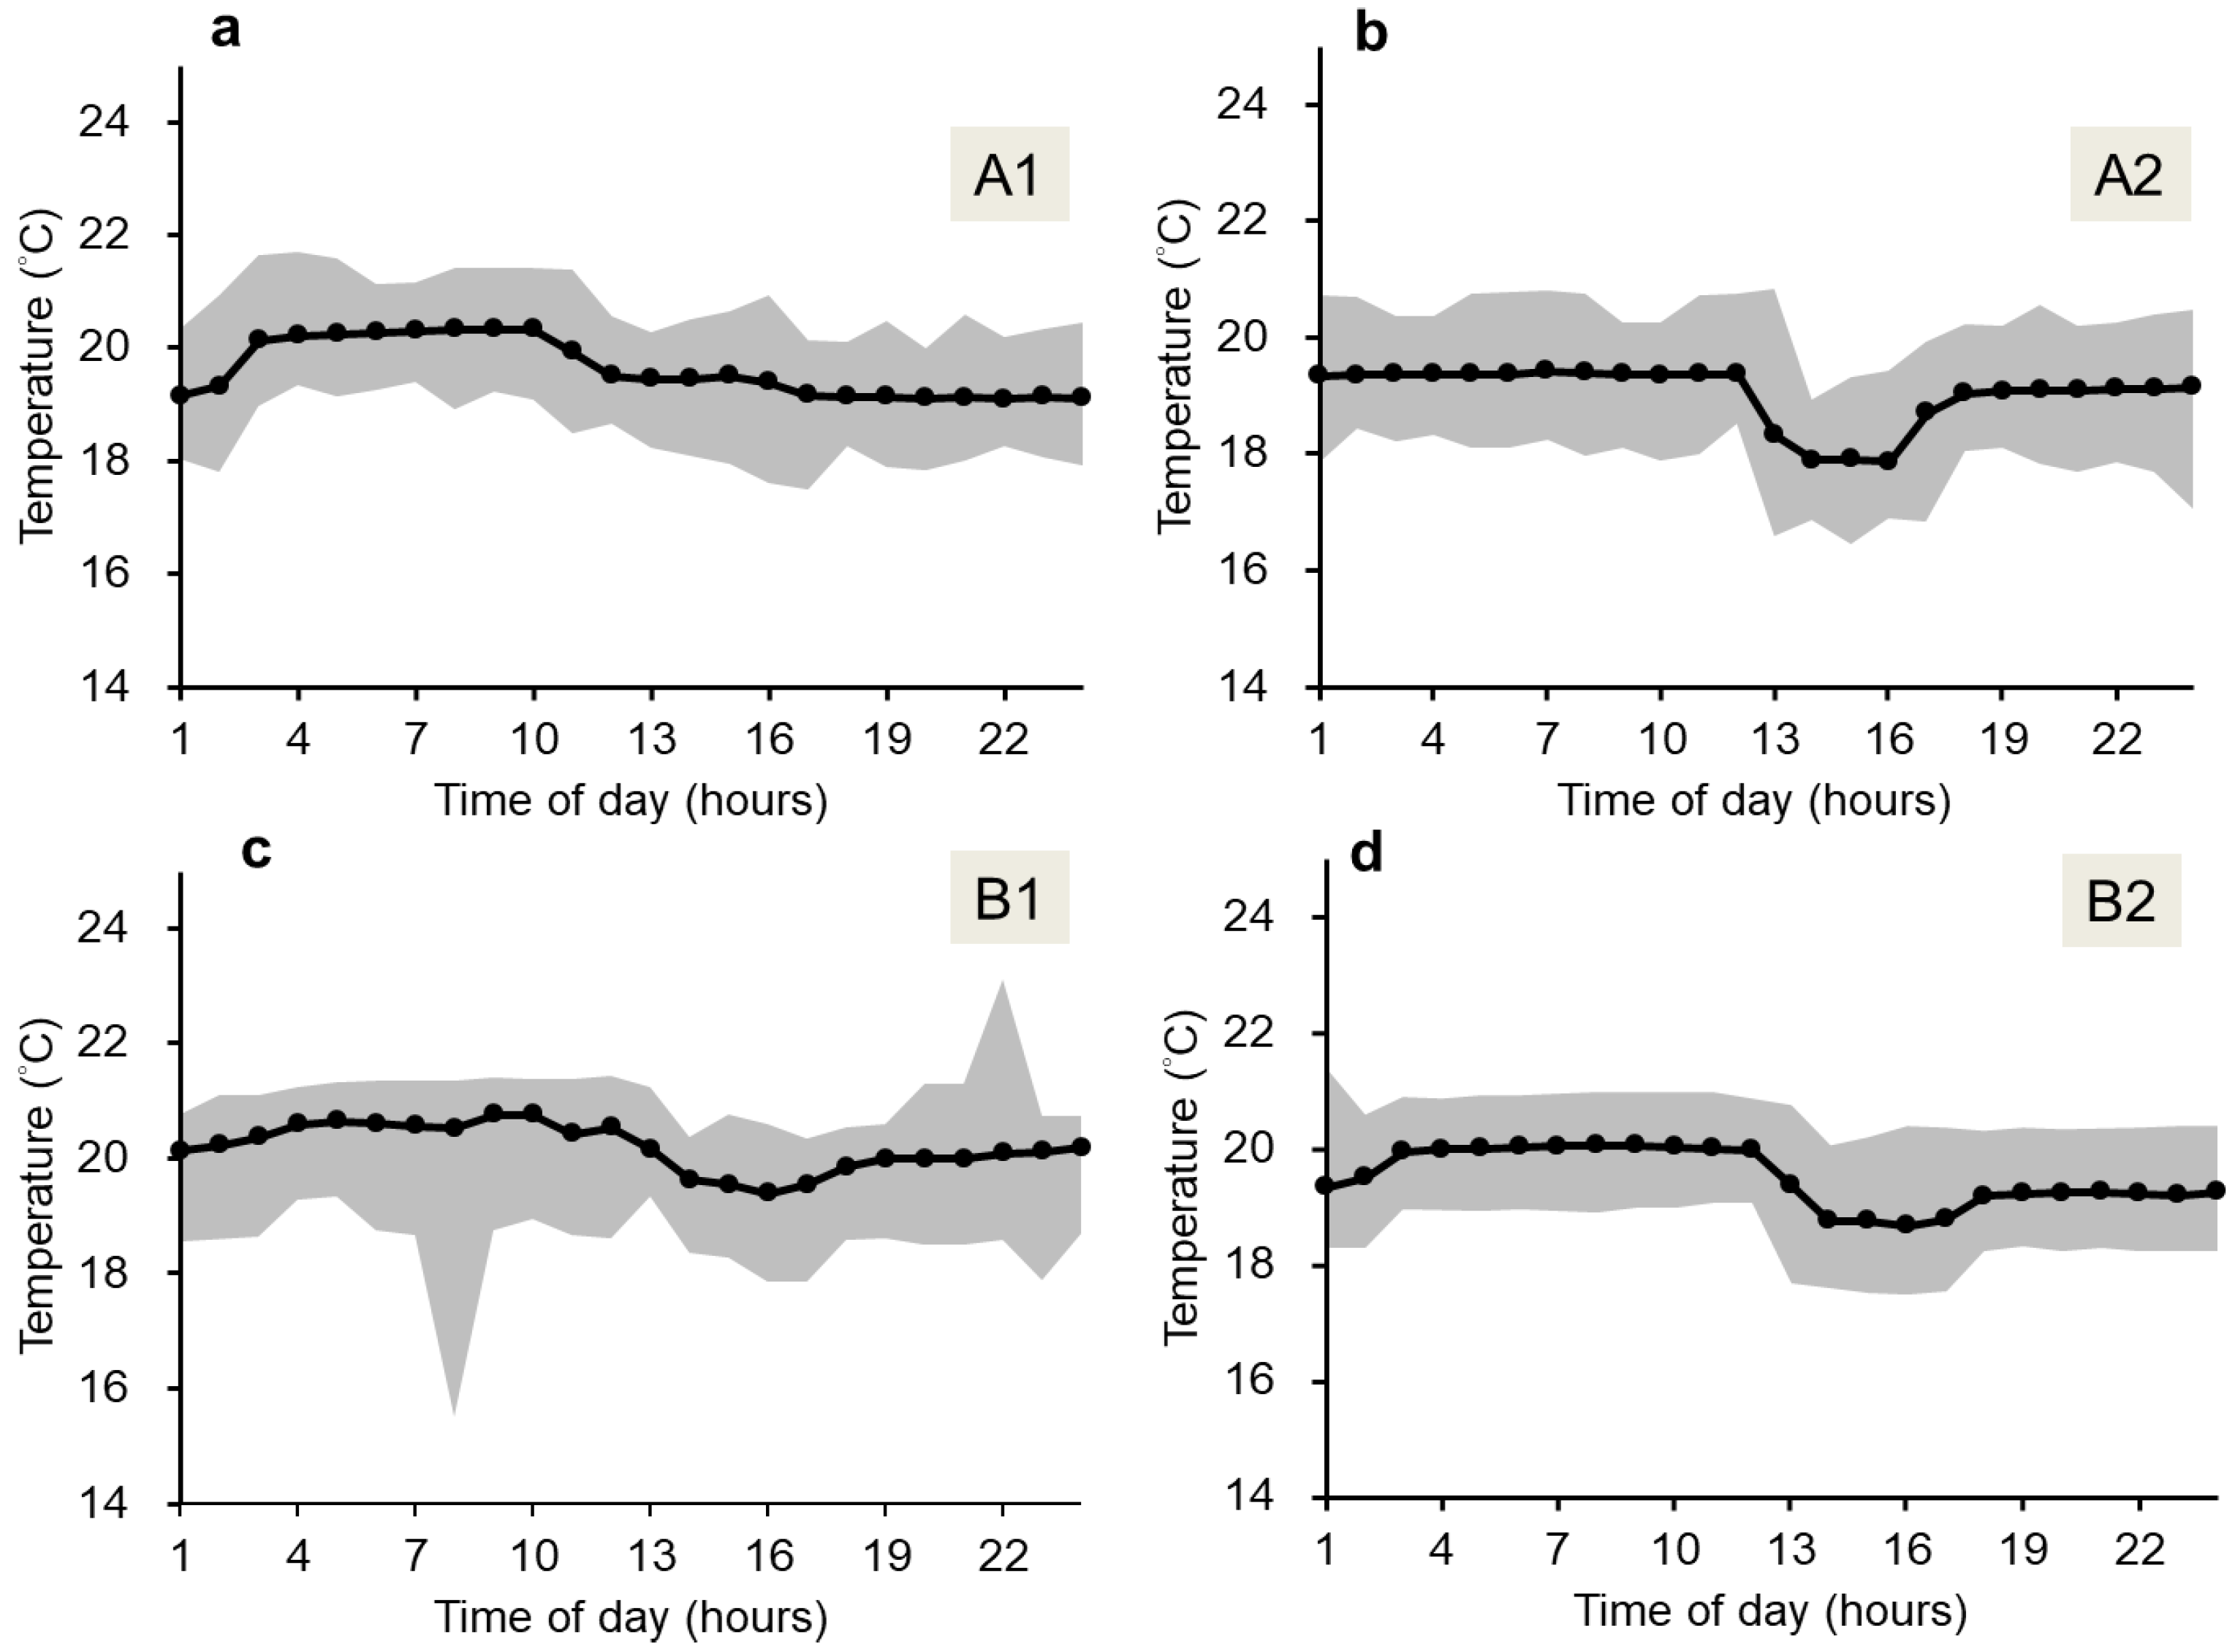
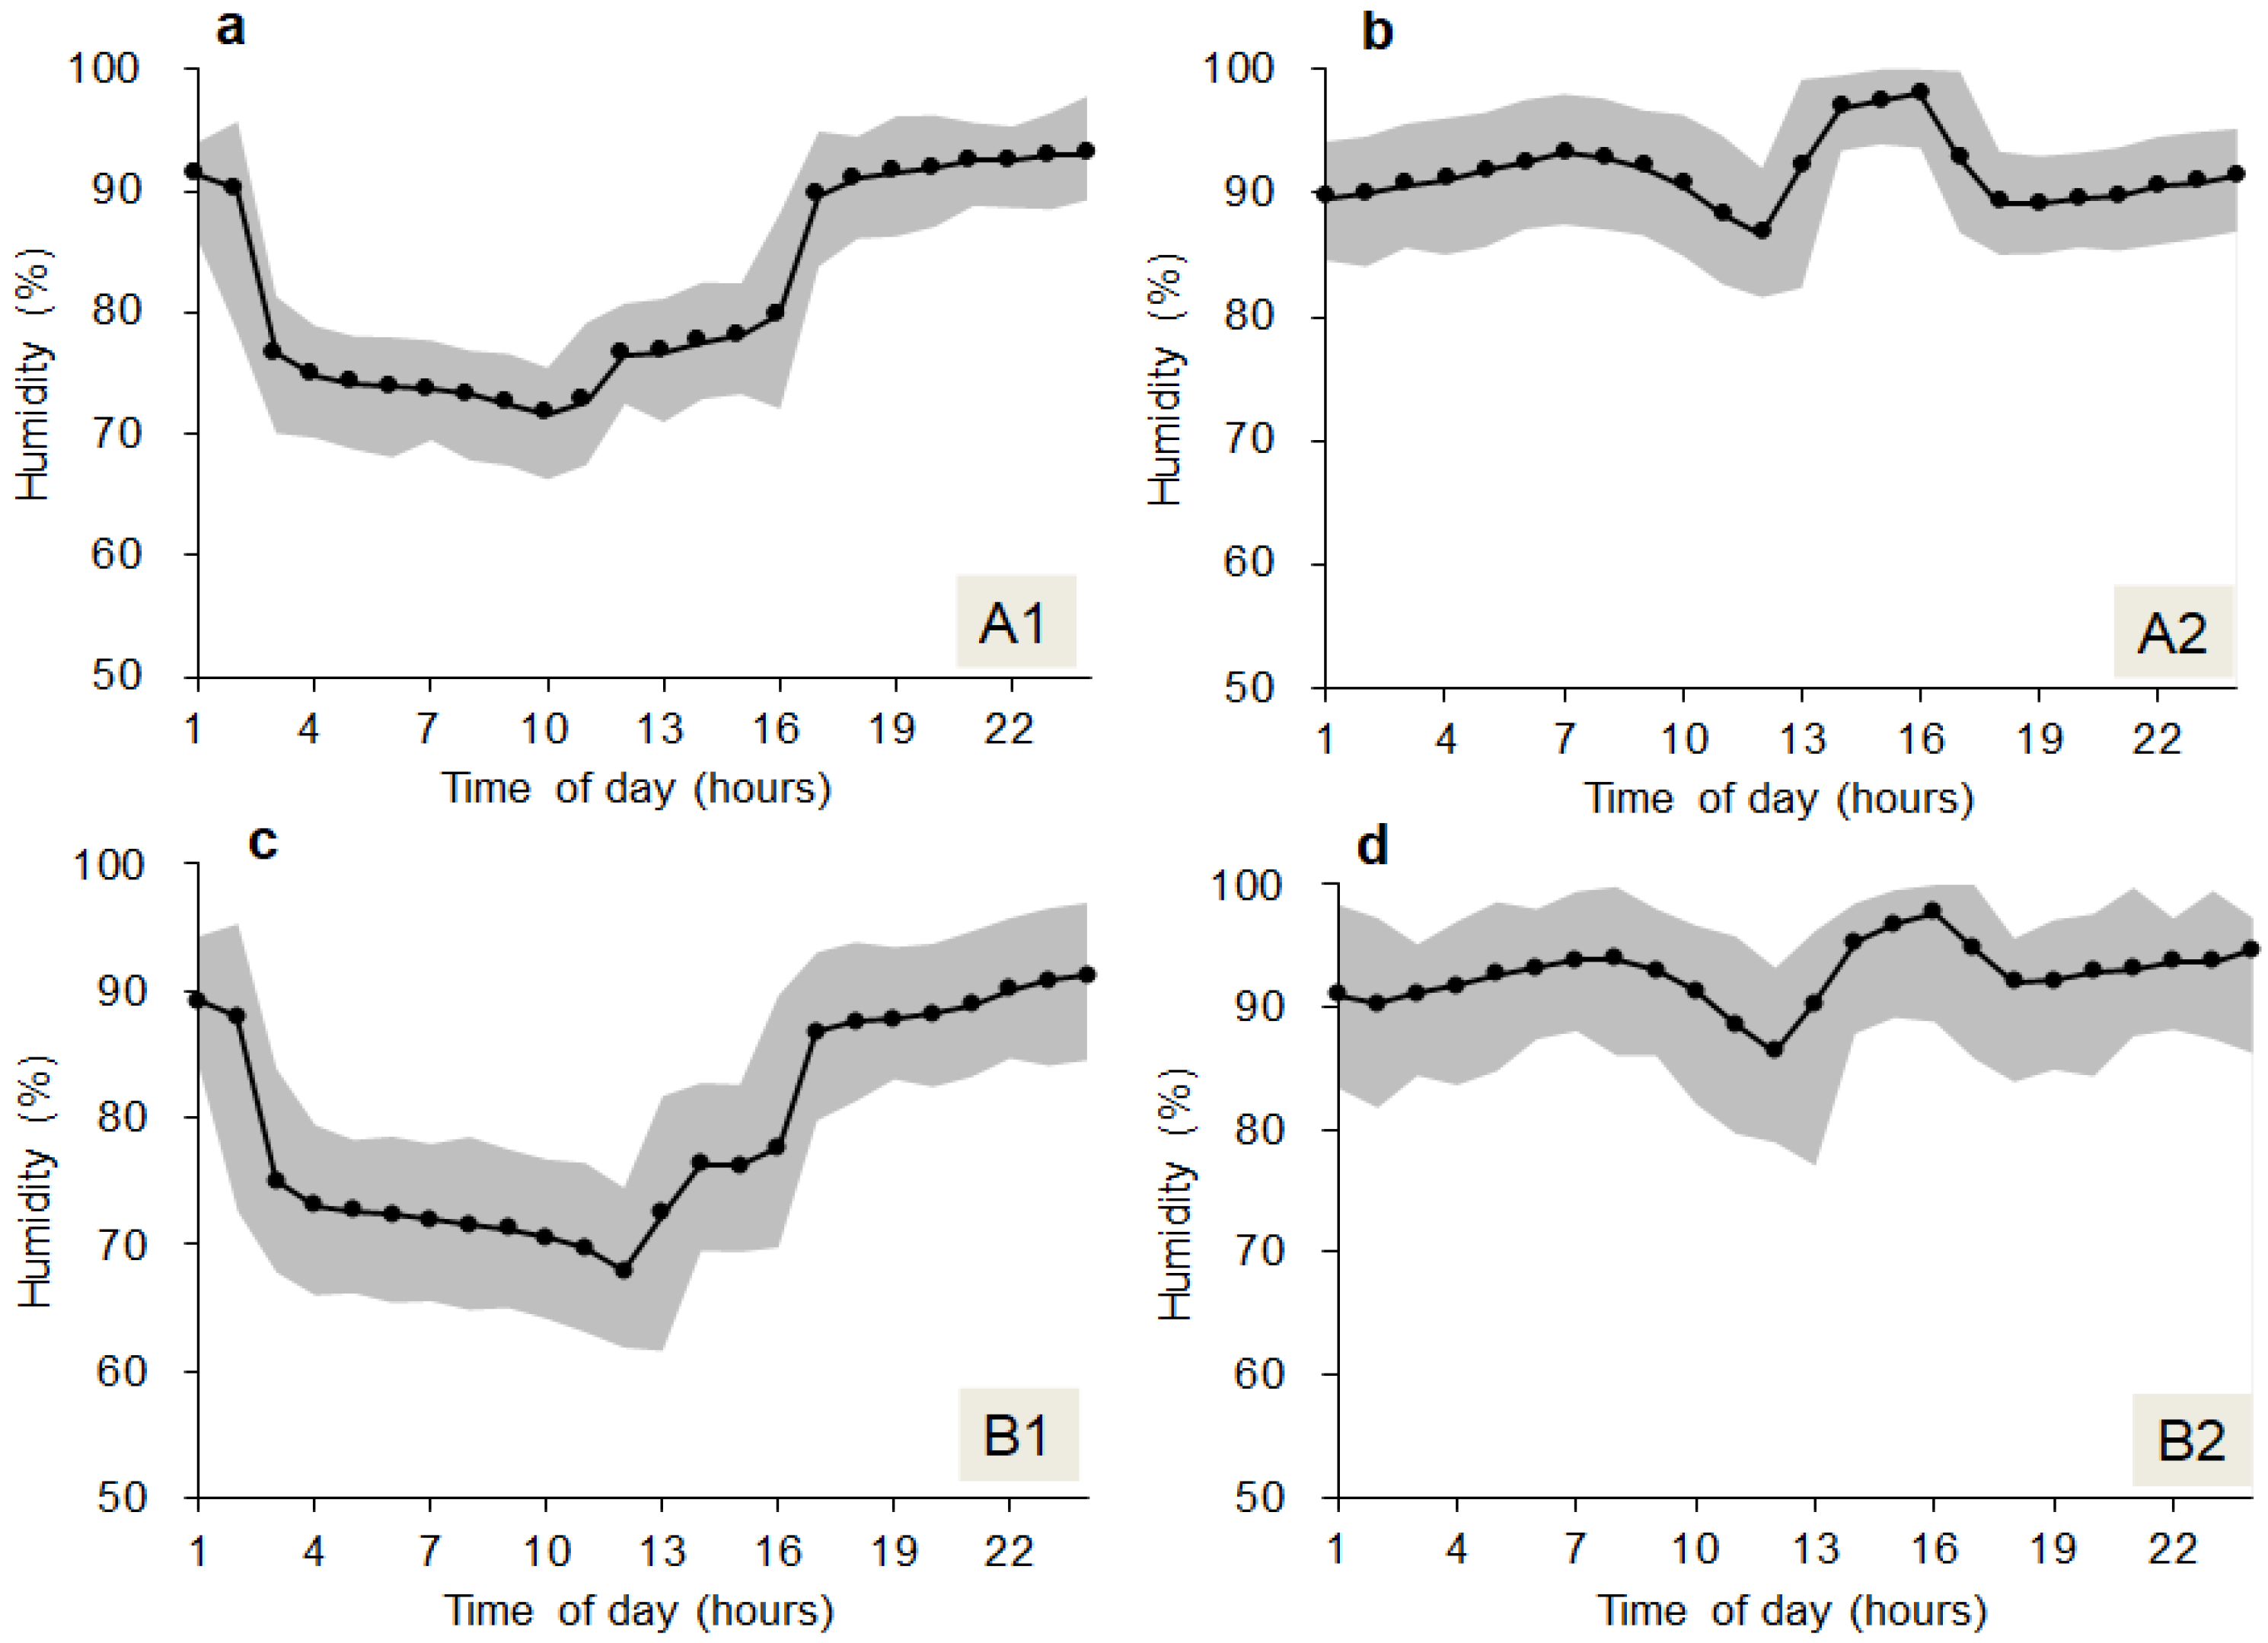
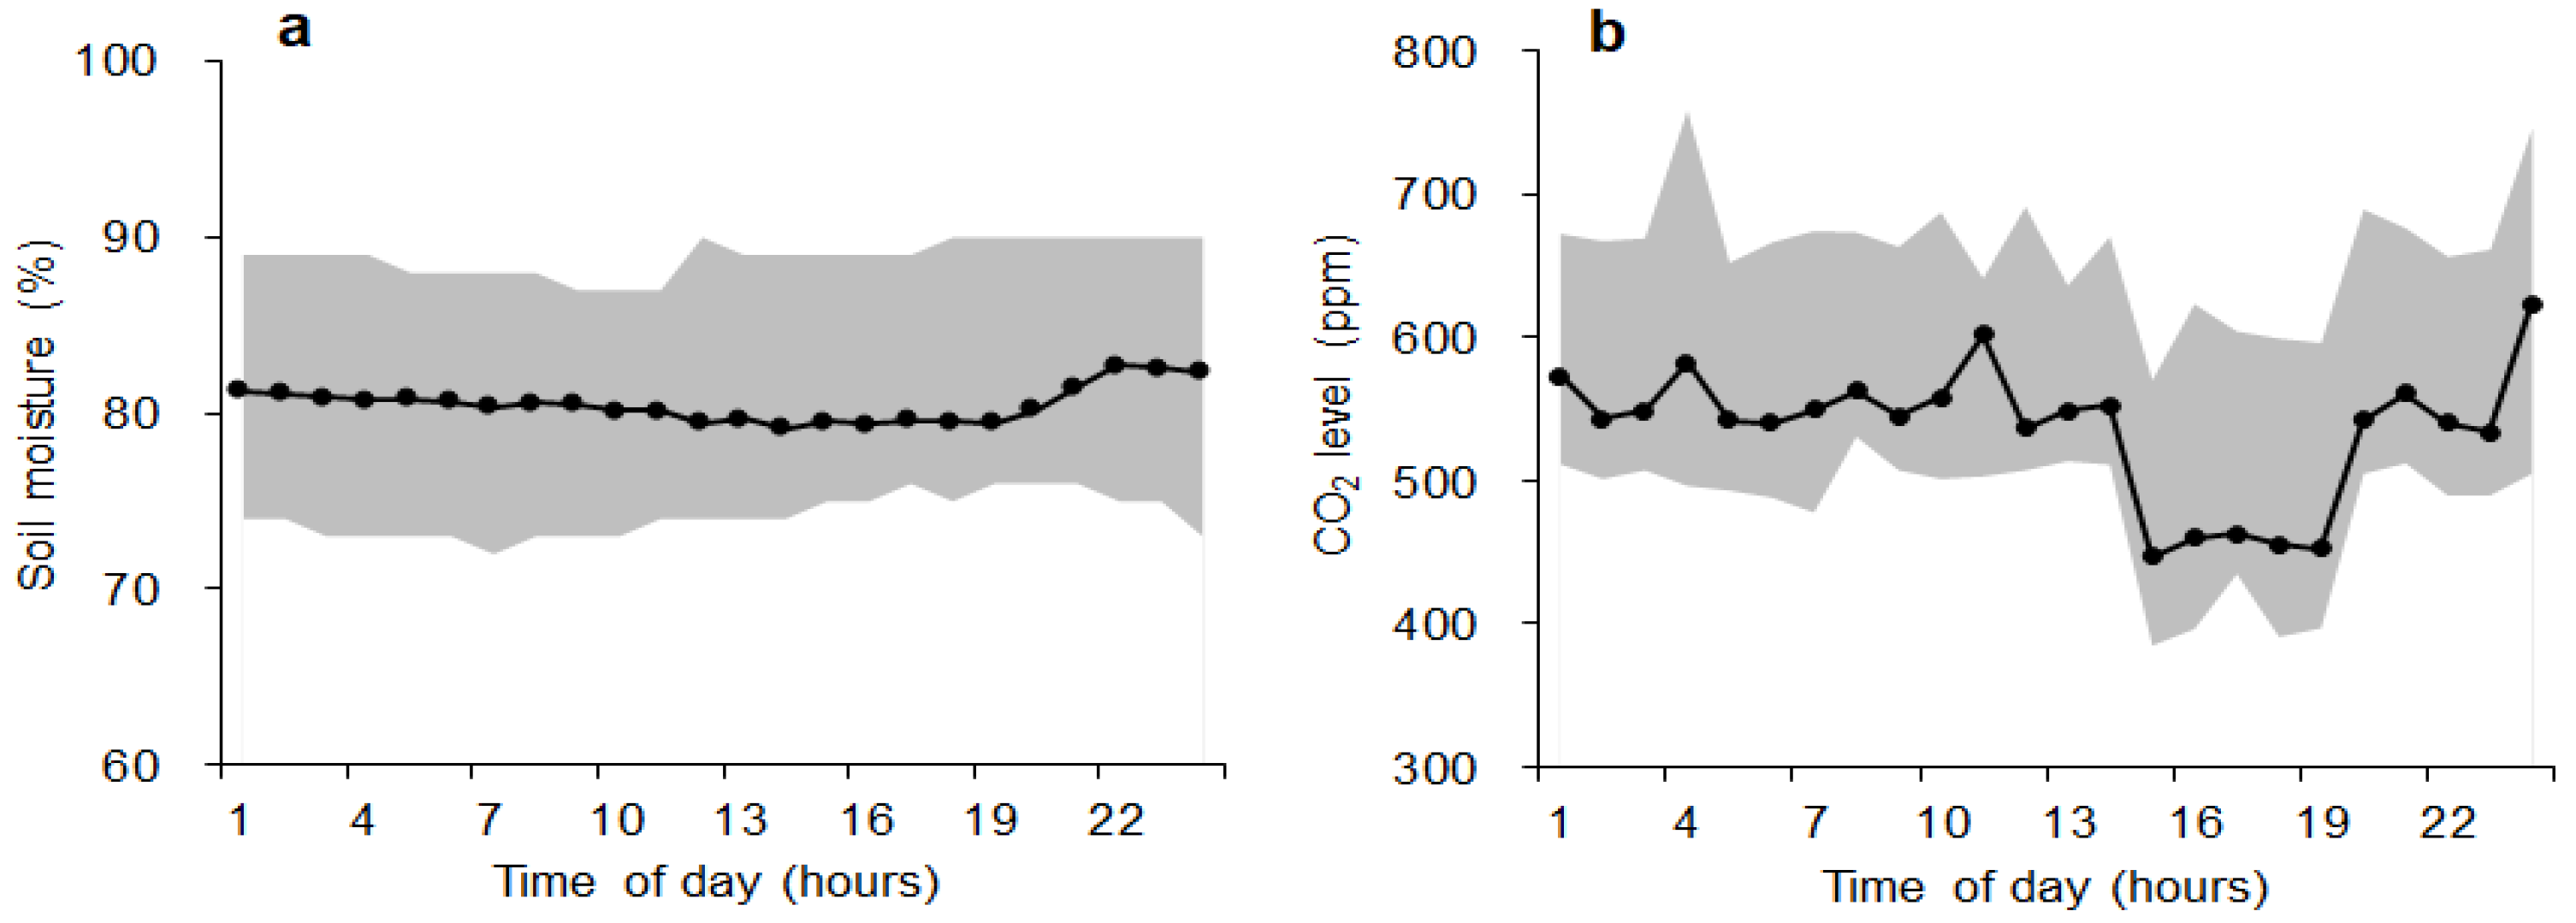
Table 1.
Light quantum value of each light band of the LED.
| Lighting Treatments | LED Light Intensity (Unit: µmol∙m−2∙s−1; 15 cm Below the LED Tubes) | Total | |||
|---|---|---|---|---|---|
| 360–500 nm | 500–600 nm | 600–760 nm | 360–760 nm | ||
| First stage | A1 | 170 | 71 | 208 | 449 |
| B1 | 36 | 22 | 82 | 140 | |
| A2 | 73 | 75 | 192 | 340 | |
| B2 | 93 | 72 | 208 | 373 | |
| Second stage | A1 | 31 | 23 | 101 | 155 |
| 38 | 36 | 135 | 209 | ||
| B1 | 31 | 25 | 94 | 150 | |
| 56 | 43 | 73 | 172 | ||
| A2 | 29 | 22 | 94 | 145 | |
| B2 | 19 | 13 | 118 | 150 | |
Table 2.
Performance evaluation of detection of number of leaves for tea plants (Taicha No. 8 and No. 18).
Table 2.
Performance evaluation of detection of number of leaves for tea plants (Taicha No. 8 and No. 18).
| Classes | AFOV | Accuracy | Precision | Recall | F1-Score | ||||
|---|---|---|---|---|---|---|---|---|---|
| No. 8 | No. 18 | No. 8 | No. 18 | No. 8 | No. 18 | No. 8 | No. 18 | ||
| Number of Leaves | Narrow | 0.96 | 0.97 | 0.95 | 0.90 | 0.86 | 0.88 | 0.90 | 0.89 |
| Wide | 0.92 | 0.91 | 0.91 | 0.88 | 0.81 | 0.82 | 0.86 | 0.85 | |
| Average | 0.94 | 0.91 | 0.84 | 0.87 | |||||
Table 3.
Performance evaluation of each class for tea plants (Taicha No. 8 and No. 18).
| Classes | AFOV | Accuracy | Precision | Recall | F1-Score | ||||
|---|---|---|---|---|---|---|---|---|---|
| No. 8 | No. 18 | No. 8 | No. 18 | No. 8 | No. 18 | No. 8 | No. 18 | ||
| Brown blight | Narrow | 0.91 | 0.93 | 0.93 | 0.99 | 0.94 | 0.94 | 0.93 | 0.96 |
| Wide | 0.89 | 0.91 | 0.94 | 0.95 | 0.91 | 0.93 | 0.92 | 0.94 | |
| White spot | Narrow | 0.85 | 0.88 | 0.97 | 0.99 | 0.88 | 0.89 | 0.92 | 0.94 |
| Wide | 0.88 | 0.86 | 0.95 | 0.96 | 0.84 | 0.83 | 0.89 | 0.89 | |
| Algal spot | Narrow | 0.95 | 0.77 | 0.90 | 0.94 | 0.90 | 0.91 | 0.90 | 0.92 |
| Wide | 0.83 | 0.72 | 0.84 | 0.88 | 0.77 | 0.83 | 0.80 | 0.85 | |
| Average | 0.87 | 0.94 | 0.88 | 0.91 | |||||
Table 4.
Comparison of the results of estimating the number of diseased leaves using automatic and manual measurement.
Table 4.
Comparison of the results of estimating the number of diseased leaves using automatic and manual measurement.
| Variety | Cultivation Zone | First Stage | Second Stage | ||
|---|---|---|---|---|---|
| Automatic | Manual | Automatic | Manual | ||
| Taicha No. 18 | A1 | ||||
| B1 | |||||
| Taicha No. 8 | A2 | ||||
| B2 | |||||
Table 5.
Variation in temperature and humidity in four zones during tea plant cultivation. The range of fluctuations (FR) is defined in (5) (N = 180 and I = 1440).
Table 5.
Variation in temperature and humidity in four zones during tea plant cultivation. The range of fluctuations (FR) is defined in (5) (N = 180 and I = 1440).
| Parameters Zone | Temperature (Degrees Celsius) | Humidity (%) | ||||||
|---|---|---|---|---|---|---|---|---|
| Mean | Max. | Min. | FR | Mean | Max. | Min. | FR | |
| A1 | 19.62 ± 0.51 z | 21.70 | 17.51 | 2.38 | 82.03 ± 8.54 | 97.95 | 66.28 | 9.78 |
| B1 | 20.20 ± 0.40 | 23.12 | 15.50 | 2.65 | 79.48 ± 8.39 | 96.96 | 61.64 | 13.58 |
| A2 | 19.04 ± 0.51 | 20.82 | 16.45 | 2.57 | 91.50 ± 2.75 | 100 | 81.61 | 9.78 |
| B2 | 19.50 ± 0.49 | 21.41 | 17.51 | 2.23 | 92.68 ± 2.47 | 100 | 77.07 | 12.85 |
z Means and their standard errors.
Publisher’s Note: MDPI stays neutral with regard to jurisdictional claims in published maps and institutional affiliations. |
© 2022 by the authors. Licensee MDPI, Basel, Switzerland. This article is an open access article distributed under the terms and conditions of the Creative Commons Attribution (CC BY) license (https://creativecommons.org/licenses/by/4.0/).
Share and Cite
MDPI and ACS Style
Chang, C.-L.; Huang, C.-C.; Chen, H.-W. Design and Implementation of Artificial Intelligence of Things for Tea (Camellia sinensis L.) Grown in a Plant Factory. Agronomy 2022, 12, 2384. https://doi.org/10.3390/agronomy12102384
AMA Style
Chang C-L, Huang C-C, Chen H-W. Design and Implementation of Artificial Intelligence of Things for Tea (Camellia sinensis L.) Grown in a Plant Factory. Agronomy. 2022; 12(10):2384. https://doi.org/10.3390/agronomy12102384
Chicago/Turabian StyleChang, Chung-Liang, Cheng-Chieh Huang, and Hung-Wen Chen. 2022. "Design and Implementation of Artificial Intelligence of Things for Tea (Camellia sinensis L.) Grown in a Plant Factory" Agronomy 12, no. 10: 2384. https://doi.org/10.3390/agronomy12102384
Note that from the first issue of 2016, this journal uses article numbers instead of page numbers. See further details here.