Review

Comparative Analysis of Soil Fertility, Productivity, and Sustainability of Organic Farming in Central Europe—Part 2: Cultivation Systems with Different Intensities of Fertilization and Legume N2 Fixation as well as Perspectives for Future Development

Sächsisches Landesamt für Umwelt, Landwirtschaft und Geologie (LfULG), 01683 Nossen, Germany
Author retired since 2016; Current address: Altes Dorf 19, 04435 Schkeuditz, Germany.
Agronomy 2022, 12(9), 2060; https://doi.org/10.3390/agronomy12092060
Submission received: 22 July 2022 / Revised: 16 August 2022 / Accepted: 24 August 2022 / Published: 29 August 2022

Abstract

:
In the course of the broad expansion of organic farming, a considerable increase in the number of different cultivation types has also occurred. Compared to the formerly ideal forms with arable farming and animal husbandry around 0.5–1.0 LU ha−1 and the corresponding use of organic manure, an increasing differentiation of cultivation systems can be observed today. There are market crop systems without livestock and purchased fertilizer with less than 20% legumes and forage cropping systems with more than 2.5 LU ha−1 livestock and a cultivation of grain and forage legumes of more than 50% in the crop rotations. From a long list of corresponding survey studies of farms in agricultural practice as well as a number of important long-term field trials, in this overview paper it was possible to investigate and to discuss both the manifold possibilities and the limitations of intensification in organic agriculture by a comparative analysis of results from a wide range of cropping systems from Central Europe. The short-term as well as the long-term effects on the development of yield and quality performance of crop rotations, nutrient management, and soil fertility, as well as of important environmental effects, were quantified, and aspects of further development and sustainability of organic farming systems were shown in detail.

1. Introduction

In accordance with the cultivation standard rules of organic farming [1], essentially no light-soluble mineral fertilizers nor synthetic pesticides are used. Instead, there is a supply of nitrogen (N) both through the cultivation of legumes and the application of organic fertilizers in diverse crop rotations. The extent of animal husbandry is linked to the size of the farmland. According to EU regulation, an upper limit of 170 kg N ha−1 year−1 of organic fertilizers must be observed. Many organic associations have lower maximum values.
Following the consumers’ wishes and demand for organic products, there has been a marked increase in the number of farms and in the areas under organic cultivation [2]. At the same time, an increasing differentiation in the types and methods of cultivation on farms has occurred as a result of agronomic and economic requirements. Recent studies in this regard also identified a wide range of important farm measures of productivity and soil fertility, which can also be expected to have different impacts on environmental protection and farm sustainability [3,4,5,6,7,8,9,10,11].
Comparative analyses have shown, for example, not only characteristic yield differences between conventional and organic farming, but also tendencies towards stagnation and even an increase in yield differences over time for some crop species. Developments of this kind are particularly observed in certain market crop farms, which could eventually also reduce the economic attractiveness of these mostly stockless farming systems [12,13,14].
Depending on farm specialization and taking into account approaching climate change, quite different developments can be expected in the future if these trends continue: from further declining soil fertility and yield potential, e.g., in certain market crop systems, to an increasing occurrence of forms of overfertilization and imbalances of organic matter (humus balance) and specific nutrients, not only in some intensive vegetable farms [11,15].
Considering this background, results of long-term field trials based on the exact knowledge of crop rotations and management can be of advantage in deepening the survey investigations and farm analyses of agricultural practice in many ways. For this purpose, it will be most successful if the trials, oriented to the example of practice, can represent a very broad differentiation of farming systems. In accordance with these aspects, several partly extensive long-term field trials were set up and evaluated on different sites and climatic conditions. In these field trials, the questions investigated concerned how these cultivation systems with forage and market crop production, different crop rotations, fertilizer types, and intensity levels affect the yields and quality of the plant species, the soil fertility, and the environment over a long period of time.
An important overview of relevant long-term experiments with the subject of organic farming can be found in [16,17], and a listing of farm studies of organic practice can be taken from [8,18]. In Part I of these summary surveys, the average widespread forms of organic farming are subjected to a detailed analysis [19].
The focus of the examinations in Part II is on the influences of increasing fertilization and the cultivation extent of legumes in crop rotations in comparison to results from agricultural practice, including environmental effects and climate change. In addition, some aspects of the future development of organic agriculture mentioned below are also discussed in detail [20,21,22,23,24,25,26,27,28,29,30,31,32]: sustainable or ecological intensification, conventionalization, food quality and security, resource protection, and climate change.
For this purpose, the investigations allow a comparative presentation of the results over a wide range of cultivation methods, which partly exceeds the usual extent of practical organic farming. In this review, both the manifold possibilities and the limits of intensification can therefore be examined and demonstrated precisely.

2. Description of Long-Term Field Trials Involved

The most important field trials that were used for these investigations can be seen in Table 1. They were carried out in different regions of Germany and included variants with widely varying amounts of organic fertilizer and legume shares ranging from less than 20% to over 50% of the crop rotations.

3. Farm Surveys of Agricultural Practice

The following studies were conducted as farm surveys on permanent test plots and other areas of cropland under organic farming cultivation conditions (for a more detailed description, see [19]):
Germany:
-
Ref. [43] Federal state of Saxony, 32 farms, 1200 arable and grassland plots;
-
ref. [44] 20 farms;
-
ref. [45] 82 farms;
-
ref. [18,46] 9 federal states, approx. 360 farms, approx. 7460 arable and grassland plots;
-
ref. [47] 15 farms;
-
ref. [6] 28 farms;
-
ref. [48] 39 farms;
-
ref. [3] 12 farms;
-
ref. [4,5] 16 farms;
-
ref. [49] 9 farms;
-
ref. [20] 26 farms;
-
ref. [50] 9 farms.
Other European countries:
-
ref. [51] Austria, 9 main growing areas;
-
ref. [52] Great Britain, 9 farms;
-
ref. [53] France; Germany, 16 farms;
-
ref. [54] Norway, 30 farms.

4. Methods of Soil and Plant Examination

Soil Testing Methods:
-
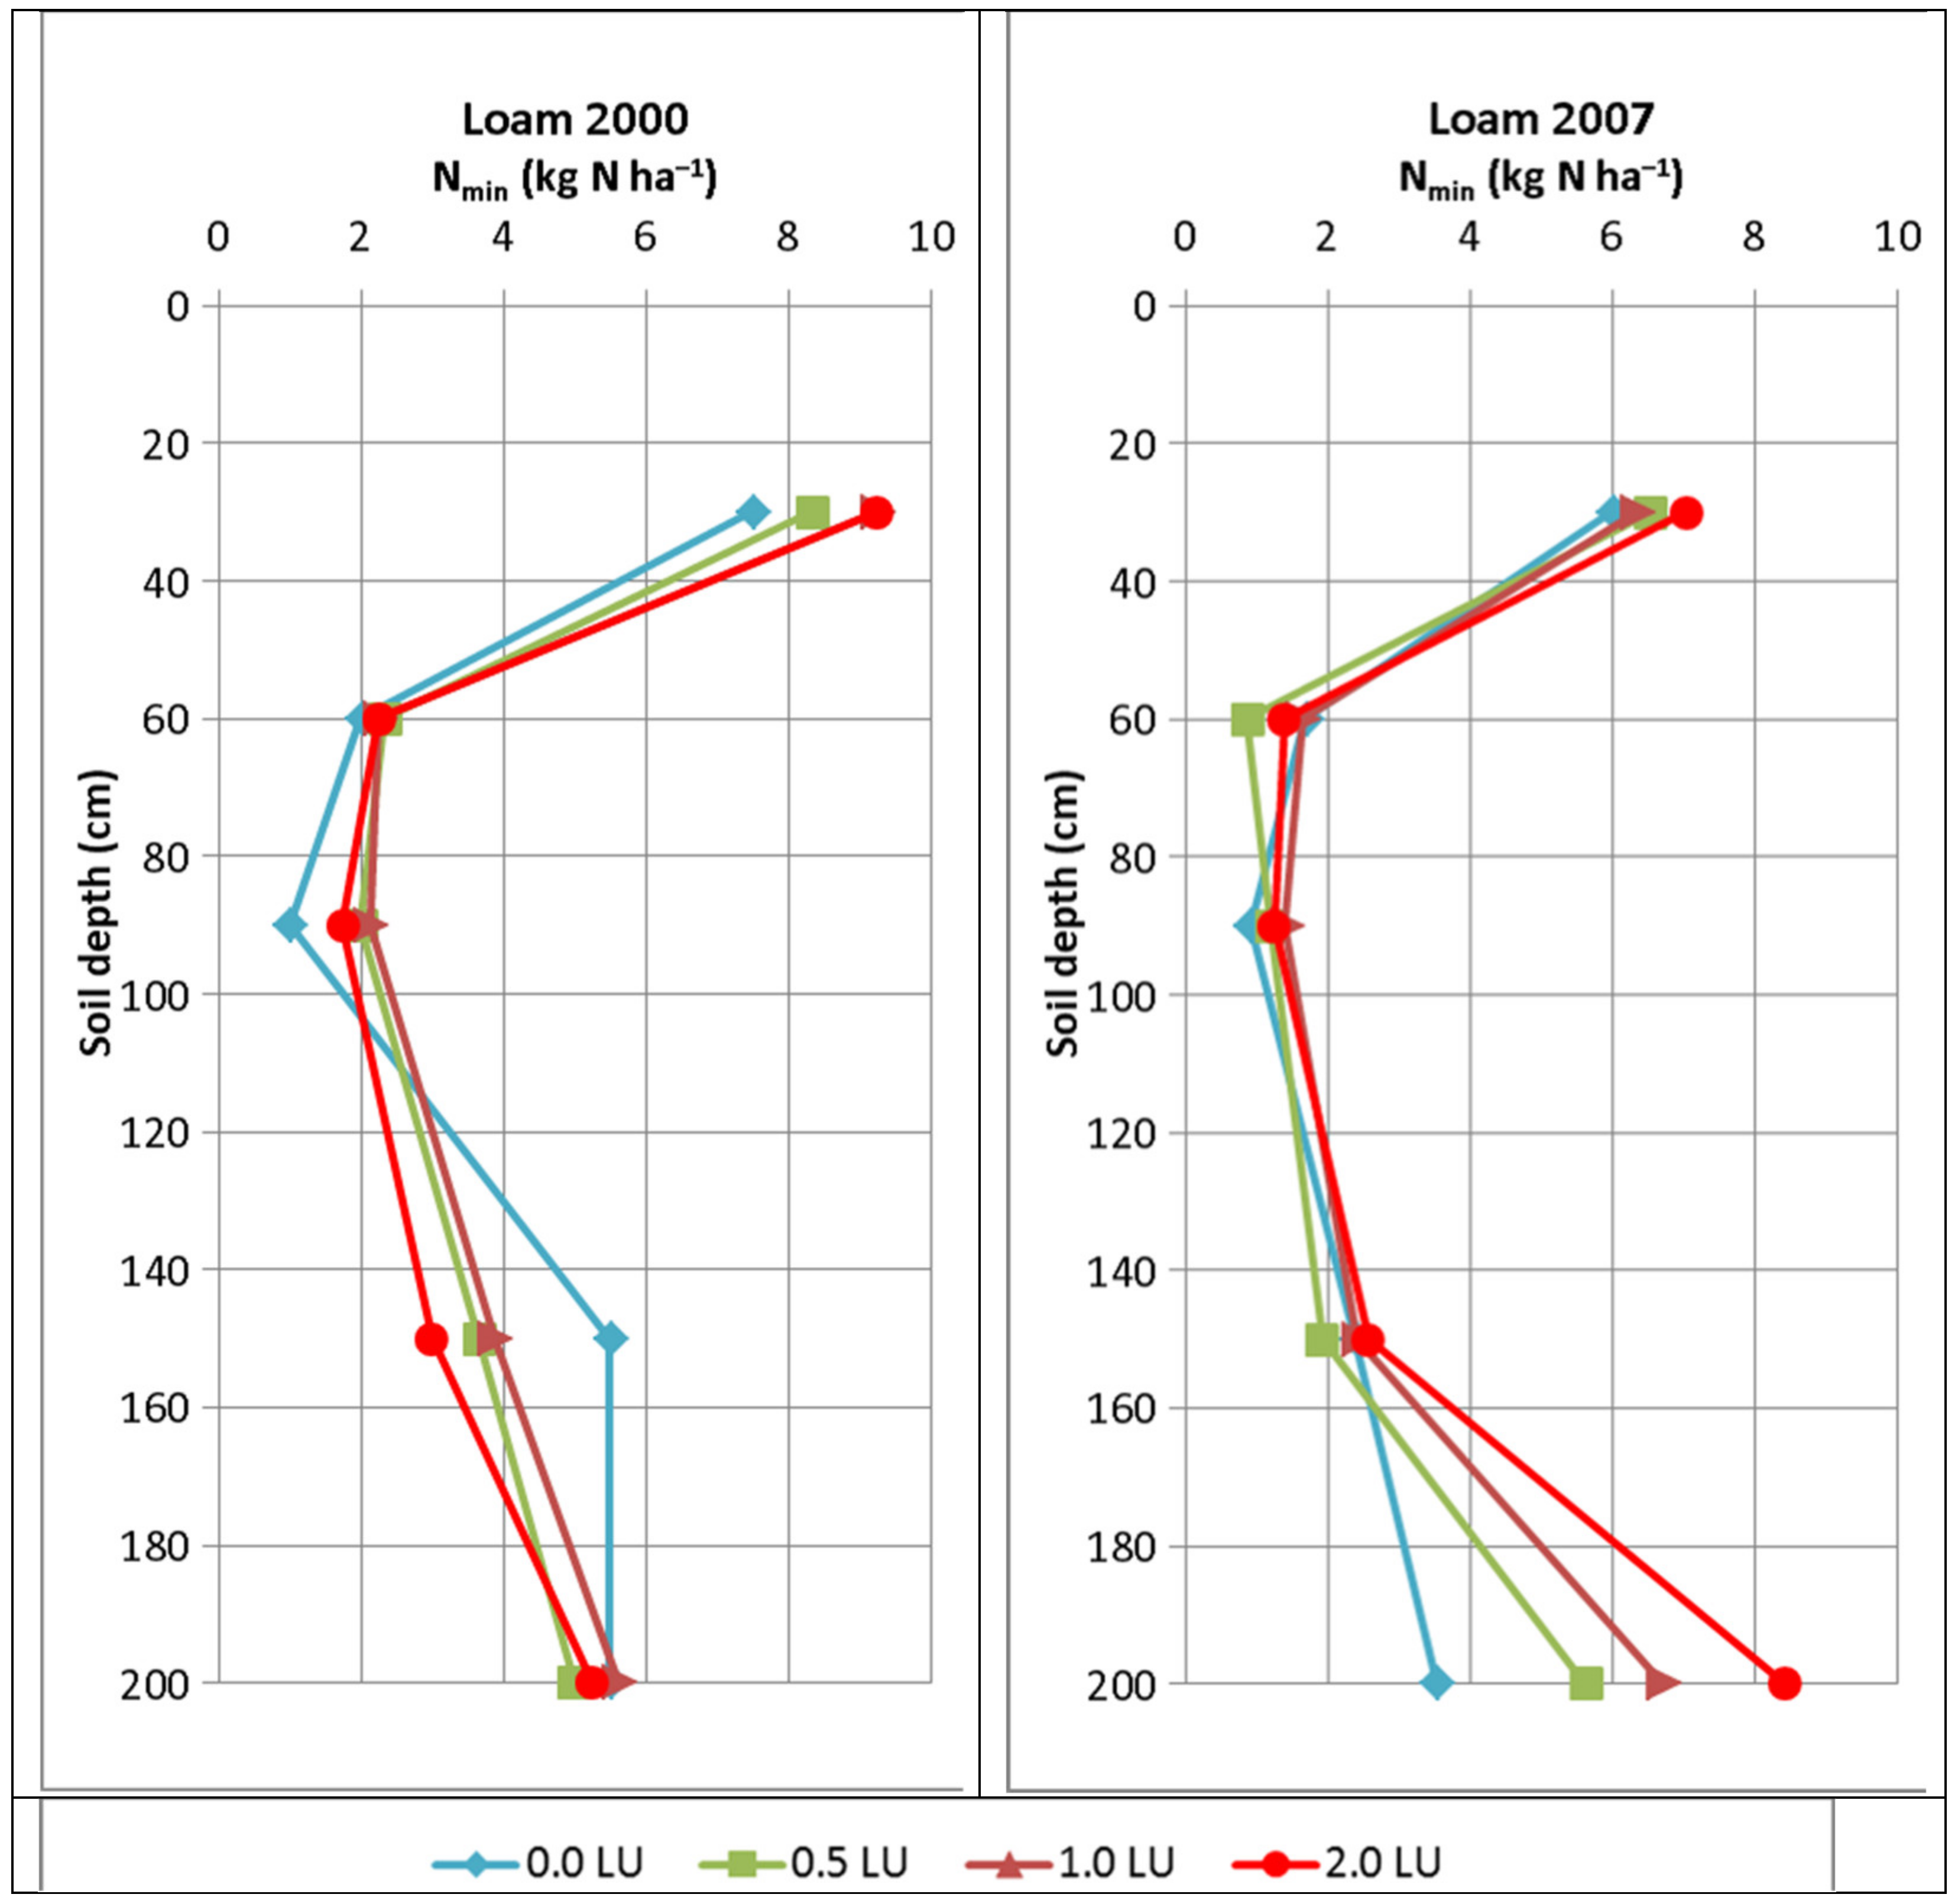
Nmin (kg N ha−1) as NH4- and NO3-nitrogen (N) in 0.0125 molar calcium chloride (CaCl2) solution at 0–90 cm soil depth or depth drilling at 90–200 cm with ram core probes (6 cm diameter) [55];
-
Smin as soluble sulfur (S) (kg S ha−1) at 0–90 cm soil depth, according to [56];
-
pH value at 0–30 cm depth in 0.01 molar calcium chloride solution (CaCl2) [57];
-
DL (double lactate) or CAL (calcium acetate lactate) soluble phosphate (P), and potassium (K) (mg 100 g−1) at 0–30 cm depth [58,59];
-
CaCl2-available magnesium (Mg) (mg 100 g−1) at 0–30 cm depth [60];
-
total organic carbon (Corg in % DM) at 0–30 cm depth with elemental analysis (DIN ISO 10694);
-
total N (Nt in % DM) at 0–30 cm depth, according to [56].
Methods of Plant Examination, Balancing, and Result Evaluation:
For methods of crop analysis, nutrient balancing, decomposable soil organic matter balancing (humus balance, in humus equivalents, kg HEQ ha−1), N2 fixation of legumes, calculation of grain equivalent units (GE) of crop species, calculation of N mineralization, and methods of result evaluation (supply grades A–E), see [19,40]. The supply level of organic fertilizers is defined according to the respective N concentrations as the total N supply on average in the crop rotation (kg N ha−1 year−1). The legume share factor was determined by calculating the sum of all annually cultivated crop species in a crop rotation (=100%) in relation to the sum of forage and grain legumes (%).

5. Biometric Evaluation

Statistical analysis was performed using the SPSS program. The following statistical procedures were used: mean (MV), rate of change per unit time with slope b, standard deviation s or mean standard deviation ms, correlation r, simple regression, multiple linear regression analysis, and significance limits: 10% = (*) (p < 0.10); 5% = * (p < 0.05); 1% = ** (p < 0.01); 0.1% = *** (p < 0.001).

6. Results of Increasing Intensities of Fertilization and Leguminous N2 Fixation

6.1. Influence of Average Intensities of Fertilization and Crop Rotation Shares of Legumes as a Basis for Comparison

In the last decades, organic farming cultivation systems, which are widely used in agricultural practice, have been studied by different authors for their effects on productivity and on-farm soil fertility as well as environmental impacts in Norway, the UK, Austria, Germany, and many other countries in Europe [6,18,43,52,54,61]. In addition, these cultivation methods were accompanied by intensive experimental activity [16].
Through the evaluation of results of certain variants of these long-term field trials, the findings of the practice could be completed and deepened [40,41,62,63,64,65,66,67,68]. Extensive comparative investigations, which have been presented in detail in the first review part by [19], led to the approximate conclusion that there is a relatively high agreement between the tested forage production and market crop systems, a corresponding organic fertilization around 0.5 LU ha−1 and a cultivation level of about 33% legumes in the crop rotations with the average situation in organic farms. Therefore, some key results, which have been summarized in Table 2, serve as absolute or relative baseline values for the comparative presentation of results on different cropping types and increasing intensities of organic farming in this article.

6.2. Influence of Low Intensities of Fertilization and without Livestock Farming

Crop Rotations with 33% Forage Legumes

It has been repeatedly reported for many years that farming types with higher specialization, on sites with low natural fertility and with very low fertilizer use, can have a potentially higher risk for maintaining soil fertility [39,52,70,71,72,73]. A large share of causes in this regard is attributed, for example, to mostly stockless farms, which enjoy widespread use today due to their simpler basic structures, but inaccuracies can arise in their delineation as market crops or arable farms.
For example, these cultivation forms include farms whose crop rotations may also include a higher proportion of field vegetables. The regular management of these crops is usually hardly possible without the supply of organic fertilizers. Therefore, simple sorting between forage and market crop farms may yield results that mean values in important soil fertility criteria sometimes hardly differ between these two types of cultivation (see [43]). If the field vegetable farms are listed separately, a more precise characterization of the farm types can be achieved [11,18].
A key characteristic of these arable, cash, or market crop farms is that very small amounts or no organic fertilizers are available compared to other widespread forms. Even with a few isolated additional fertilizer purchases, only relatively small amounts are used. Furthermore, it is noticeable on these farms that with their limited cultivation of often not economically usable legumes, especially fodder legumes, the level of N2 fixation is 5–15 kg N ha−1 year−1 lower than on the other farms [4,5,6,11,18].
In the long-term trials conducted by [40] on sandy and loamy soils in eastern Germany, the complete omission of organic fertilization led to a reduction in the legume content in the clover-grass mixture by 4–6%, especially on the market crop areas. In addition, a quite comparable absolute or relative decrease in legume N2 fixation by 2–12% was also determined on the stockless systems compared to the variants with a fertilization intensity around 0.5 LU ha−1. This average comparative system was characterized by a legume N2 fixation on the loam soil of 235 kg N ha−1 or of 130 kg N ha−1 on the sandy soil per cropping year of clover-grass. According to these results, the improvements in clover-grass cultivation and N2 fixation caused by a relatively low organic fertilization are sufficient to explain the decrease in the N2 fixation level in the absence of livestock (Table 2 in comparison to Table 3: organic fertilization).
However, due to the better marketing opportunities, it often happens in agricultural practice that the crop rotation share of forage legumes is reduced and that of grain legumes is increased, which can have an additional negative effect on the N2 fixation potential of the entire crop rotation. See a detailed discussion of the effects of the proportion of legumes in the crop rotation on various arable farming attributes in [39,72,74,75]. For example, pure seeds of alfalfa or red clover with values around 318 (±153) kg N ha−1 and 321 (±133) kg N ha−1, respectively, show considerably higher N2 fixation amounts (including rhizodeposition) than, e.g., the one-year cultivation of field bean with 254 (±81) kg N ha−1 or pea with 147 (±56) kg N ha−1 [76].
The absence of organic fertilization and the reduced legume N2 fixation not only have a clear effect on the results of N balancing, but a decrease in soil humus balances can also be observed in practice and in the experimental setups. N and humus balances are often closely related in this case. Under the cultivation conditions of practical market crop farms, N and humus balances are then often determined, which mostly still show low positive values and are then to be assigned to supply class C [4,5,6,18]. Compared to forage farms or the average of organic farms, N balances from these practical surveys decreased between 10–25 kg N ha−1. In the trials documented here, there were somewhat higher decreases after the absolute omission of organic fertilization, which amounted to about 25–35 kg N ha−1 compared to the 0.5 LU variant (Table 2 and Table 3). Zimmer and Dittmann [66] determined a decrease in N balances of 23 kg N ha−1 year−1 on sandy soils between cultivation systems with 0.7 LU ha−1 and without fertilization.
Depending on the basis of calculation, the values of humus balances in agricultural practice between the average of the farms and the pure market crop farms decreased between 70–190 kg HEQ ha−1 (=44–68% of the initial level). A decrease in the balances of 40–105 kg HEQ ha−1 (=approx. 46–75% of the initial level, cf. Table 2 and Table 3) was calculated between the respective trial variants. Only under the conditions of a more extreme humus balance method were the differences between forage and market crop farms more pronounced [6].
These differences are mainly based on a reduction in the DM supply via fertilization by 0.7–1.1 t DM ha−1 and year in the relevant variants of the long-term trials. The reduced supply of organic matter and the N contained therein also led to a slight decrease in the availability of Nmin in early spring by up to 5 kg N ha−1 (=89–100% compared to the initial level, cf. Table 2 and Table 3). The decrease in the fall Nmin values was similarly pronounced. On the loam soil, there was also a decrease in the calculated N mineralization of 8 kg N ha−1 (=86%) in the pure forage system and of 32 kg N ha−1 (=76%) in the market crop plots. On the sandy soil, the decreases were much smaller at 7 kg N ha−1 (=91%) and 10 kg N ha−1 (=93% compared to the mean initial level), respectively [40].
The potential for the translocation (0.90–2.0 m soil depth) and leaching of N was relatively similar between sites and cropping systems and only dropped to approximately 68–79%. The absolute amounts were at a very low level on the loam soil with a decrease of 1.6 kg N ha−1 from initial 7.6 kg N ha−1 and a decrease in leaching of 0.7 kg N ha−1, respectively. On the sandy soil, in contrast, a decrease of 4.4 kg N ha−1 in translocation from initial 20.0 kg N ha−1 and of 1.1 kg N ha−1 year−1 in the leached N amount was measured, each calculated for the experimental variants without fertilization compared to the mean level at 0.5 LU ha−1 (=100%). Even a slight decrease in organic fertilizer application of 33 kg N ha−1 led to a more pronounced decrease in soil N losses on the sandy soil.
As a result of the omission of organic fertilization and the associated reduction in the characteristics of soil fertility, an absolute decrease in the yield capacity of the crop rotations by 0.3–1.0 t GE ha−1 was determined in the trials, so that a relative yield level between 88–94% was achieved on the trial plots in the unfertilized variants (Table 2 compared to Table 3). Yield surveys have also been carried out in agricultural practice, where again very similar changes have been found. An exact comparison is, however, made more difficult by differences in the cultivated crop species and crop rotations. For example, [6] found a decrease in GE-yields of 0.6 t ha−1 (=86%) on organic pilot farms in Germany for livestock-less market crop farms compared to forage farms. In a 17-year comparison between large trial plots with and without livestock, average GE-yields on livestock-rich plots increased from 5.7 t ha−1 to 6.1 t ha−1, while on stockless plots they decreased from an initial 5.3 t ha−1 to 4.2 t ha−1 [41].
Between the cultivation methods of the estimated average in the comparison variants and the livestock-free systems, no major shifts in the qualities of the growing plant substances were determined. There may be slight decreases in the N or crude protein contents of cereal grain, corn grain, and potato tubers, and in the crude ash contents of clover-grass. In the case of potato tubers, the same is true for K, with the result that slightly higher values in the raw discoloration of the potato tissue may then occur in the livestock-less fields. Furthermore, the sedimentation values for assessing the baking quality of wheat have decreased between 3–5% between medium and livestock-free cropping conditions [40].
In order to achieve a better supply of available N, cultivation attempts on cereals, in particular on wheat with wider row spacings, can be helpful. Instead of 11–14 cm, a row spacing of 30–40 cm and a reduction in the seed rate by 30% are often recommended. With low yield losses, the concentrations of crude protein in the grain and thereby also the baking quality can often be raised markedly. Another possibility is the transfer fertilization (“cut and carry”), e.g., of clover-grass grown on other fields to improve the nutrient supply of different crop species [77,78,79,80,81,82].
In addition to the yield-limiting N, other important nutrients are also affected in the livestock-less cropping systems without organic fertilization. In the experiments presented here, a further decrease in the nutrient balances, which were already clearly negative at medium intensity, by 4–7 kg P ha−1 and even by 19–38 kg K ha−1 could be calculated. A change in the K balances occurred to a similar extent as that already determined for the N balances (Table 2 and Table 3).
In the farms studied, the lowest nutrient balances were also found after livestock-less management. Only the changes to more negative values between the average or the forage cropping and the stockless farms with a decrease of 3 kg P ha−1 and 4–14 kg K ha−1 were not quite as pronounced as in the long-term trials described. Consequently, the plant-available P and K contents in the topsoil also declined (Table 2 and Table 3). Since the P and also the K balances show clearly negative values, it can be assumed that over long periods of time a decrease in the P and, especially on the lighter soils, also in the available K content can be observed in the case of livestock-free farming (see [18,83]). In the DOK trial in Therwil (Switzerland), P balances of less than −20 kg P ha−1 year−1 were determined in the unfertilized variants over the course of more than 20 trial years. These results were also closely related to the decrease in the soil P extractable by different methods [64].
Table 4 shows an overview of the measured temporal changes of some important characteristics of the soil at this intensity level. Compared to average conditions in the supply of organic fertilizers [19], a smaller increase in the values for soil Corg and in N mineralization and a more pronounced decrease, especially in the soluble basic nutrients of the soil, can be observed. Based on the obtained soil humus and nutrient balances, the following changes in the soil contents of the arable topsoil can be calculated for a period of 10 years in the case of stockless cultivation (based on forage growing plots of the long-term trials):
-
Loamy soils: +0.031% Corg, −0.008% Nt, −1.24 mg P 100 g−1, −3.67 mg K 100 g−1 soil;
-
Sandy soils: +0.008% Corg, −0.009% Nt, −2.55 mg P 100 g−1, −2.35 mg K 100 g−1 soil.
Also, the changes in the Corg contents calculated on the basis of the humus balances until equilibrium is reached would still increase slightly in the following range: loam soil +0.068%, sandy soil +0.022% Corg.
In the results presented here, a distinction can be made between pure market crop systems without fertilization, in which the by-products remain on the fields, and forage cropping systems without any fertilization, in which, however, all by-products (straw; clover-grass growths) are harvested. As can be seen from Table 4, these variants, which are referred to as forage production, are characterized by even more extreme or clearly less favorable values in nutrient management and soil fertility for most of the listed characteristics.
Since such transitions between the two cropping systems also occur in practice, this should be noted in particular. For example, these livestock-less farms, which are characterized by a high level of cultivation of certain renewable resources and sale of the by-products such as the straw and the clover-grass growths, can have a particularly high risk potential for soil fertility and sustainability [75,84]. It can be concluded from these experimental data that the longer these deficit cropping conditions with clearly negative nutrient balances persist and the higher the yield level as a result of N-emphasized organic fertilization or an elevated legume cultivation in the crop rotations, respectively, the more the soil is depleted in basic nutrients. For example, very low soil P and K contents are often found in older organic farms and under intensified legume cultivation [11,18,44,85].

6.3. Market Crop Cultivation with Low Legumes Predominantly as Grain Legumes in Crop Rotations

6.3.1. Effects of 33% Legumes

In some trials, and also in practical surveys, livestock-free cropping systems with a reduced number of legumes in the crop rotations can also be documented. Since there is often no suitable use for the forage grass growths in the market crop systems, other legume species are substituted in practice, such as grain legumes, whose harvested products are subjected to a higher market valuation. Comprehensive comparative assessments of the long-term cultivation of grain legumes on yields, soil, and environment can be taken from the trials mentioned in Table 1.
As a first step towards these cultivation systems, a stepwise replacement of forage crops by the cultivation of grain legumes is investigated without changing the extent of legume production. In 15-year-old long-term trials on sandy to silty loam by [38] and on a clayey silt by [39] of only a 12-year duration, these systems were simulated. As the crop rotations, some of which differed greatly in length, had a similarly high cultivation level of legumes (33%) and left the by-products to a large extent on the fields as in the other studies shown here, the results of the variants with an average use of organic fertilizers of around 38 kg N ha−1 year−1 can be easily compared together. This enables an average supply level of the practice as well as in the presented long-term trials to be achieved (Table 2 and Table 5, variant 1). Based on this supply level (=100%), the following changes can be seen for the livestock-free cultivation systems by partial or complete replacement of leguminous forage cultivation by grain legumes (field bean, pea, and soybean) (Table 5, variant 1 compared to variants 2 and 3):
-
Decrease in average yield level with partial replacement to 87% and with complete replacement by grain legumes to an average of 74%.
-
The N2 fixation of legumes drops only slightly by up to 10%.
-
The gross N balances decrease from approx. +48 kg N ha−1 (=100%) with 33% clover-grass cultivation to +45 kg to +22 kg N ha−1 with 33% grain legumes.
-
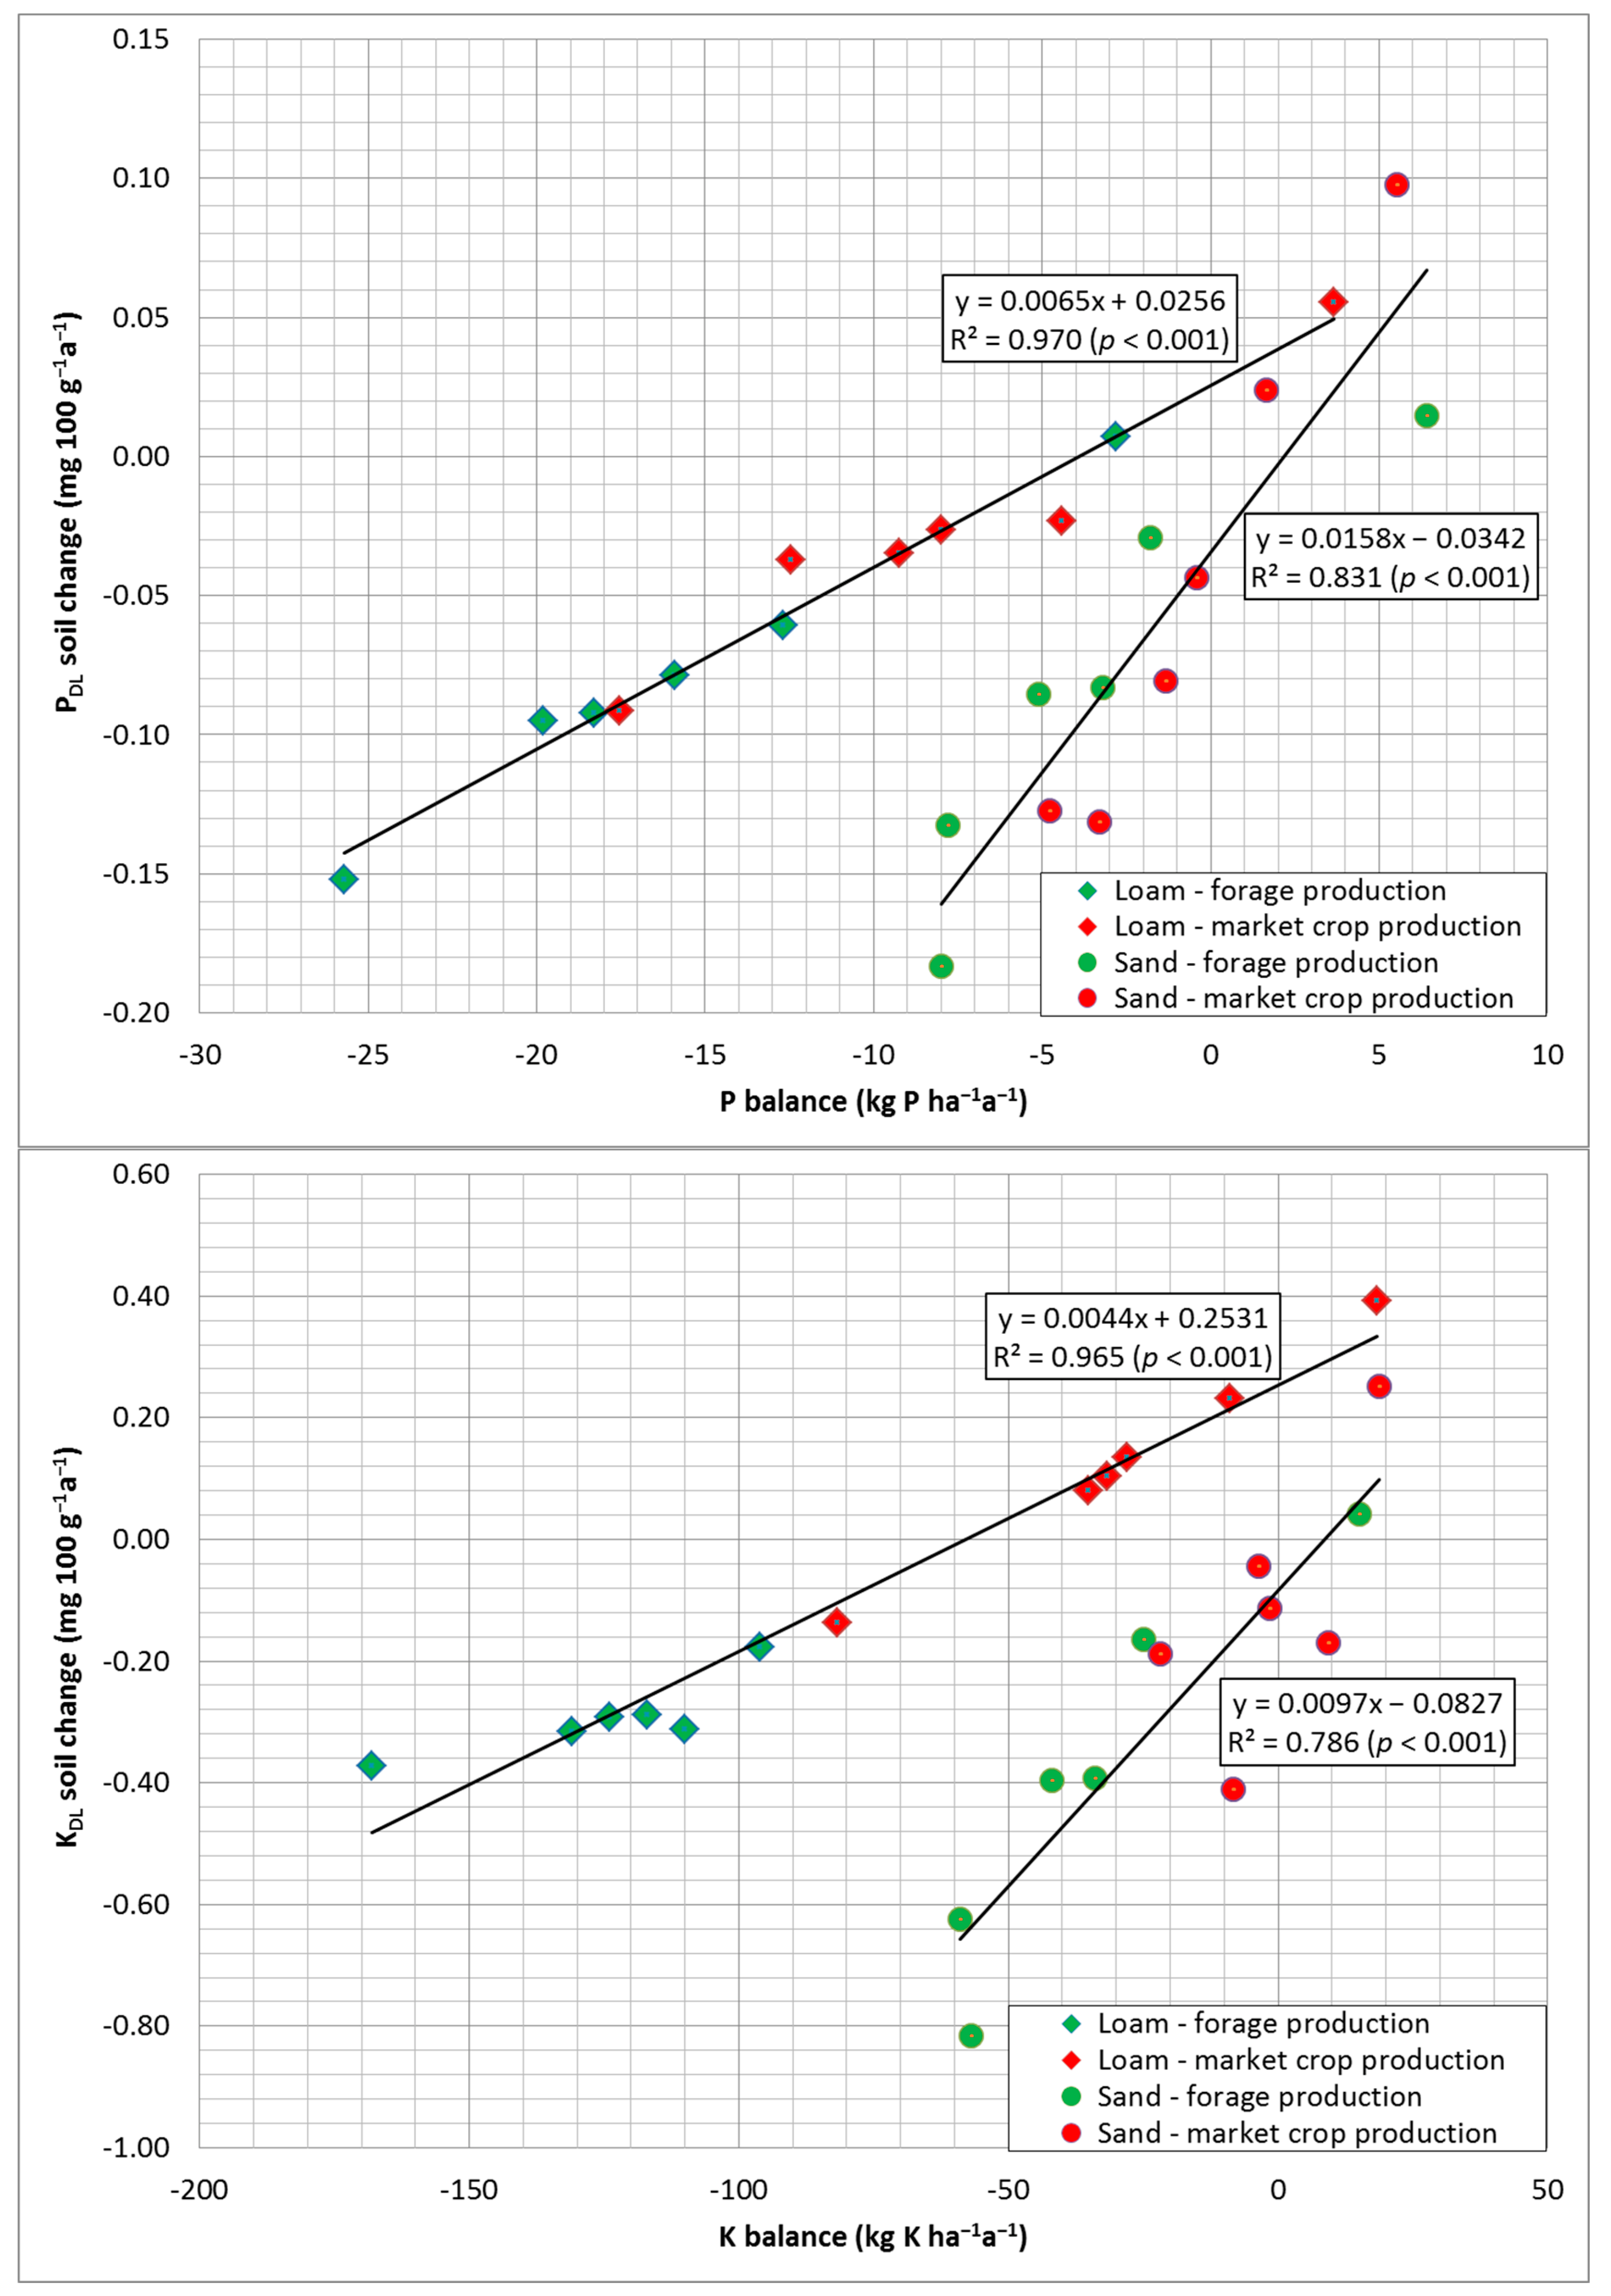
The increased removal of P-rich grain products and the reduction in K-rich clover-grass cultivation leads to a further strengthening of the negative P balances on one side and to an improvement of the negative K balances on the other side.
-
The stepwise reduced supply of crop and root residues due to the replacement of clover-grass by grain legumes causes an increasing reduction in the Corg contents of the soil, which can also be confirmed by humus balancing.
-
The extent of the soil Corg change until equilibrium is reached would be approximately as follows: variant 1 +0.124% Corg, variant 2 −0.090% Corg, and variant 3 −0.155% Corg.
-
Since there are clearly lower Nmin values under the clover-grass cultivation, a slight increase in the mean Nmin contents in the spring occurs due to the cultivation of grain legumes, but the Nmin values of the first and second after-crops are at the same high level or, after clover-grass mulch, at a slightly higher level.
-
The values of the crude protein contents or the sedimentation values of wheat also decrease by 10–15%, with the probability of achieving a sufficiently high baking quality being reduced (not included in Table 5).
The results of these trials consistently show a partly substantial decrease in both the yield and quality level of the succeeded non-legumes and in important characteristics of soil fertility caused by the alternative cultivation of grain legumes. Accordingly, these changes are even more severe than a market crop cultivation without livestock and organic fertilizers at a level of 33% clover-grass (see Table 3 and Table 5). However, it should be noted that a trial duration of only 12 years cannot be considered as sufficient for a well-founded evaluation of some characteristics (see detailed description of the trial duration in the first review [19]).
In a comparable trial on the organic experimental field at Roda, in Germany, the soil Corg content decreased in the first 10 years with a cultivation rate of, respectively, 16.7% clover-grass and grain legumes (−490 kg Corg ha−1 year−1), while a livestock-free cultivation with 33% clover-grass still led to an increase in the Corg content [41,87]. Considering a sufficiently long experimental phase, it can be expected that the relatively high average annual rates of change determined previously will then be weakened again accordingly until a new equilibrium is established. Therefore, the partly extreme results of [39,87] on the change of the soil Corg contents have to be put into a relative perspective. According to [88], lower values in Corg decomposition have already been determined after more recent analyses.
According to the differences in legume cultivation shown, the negative P balances become worse from variant 1 to variant 3 and the K balances, instead, improve from −50 kg K ha−1 in variant 1 to −29 kg K ha−1 in variant 3 (Table 5). With a clover-grass and grain legume share of each 20% in the livestock-free crop rotation, Emmerling and Schröder [73] calculated P balances of −11 to −14 kg ha−1 and K balances between −18 and −24 kg ha−1 year−1, which led to decreasing P and K concentrations in the soil.

6.3.2. Effect of 20% Legumes

In the farm surveys in eastern Germany, a total of eight farms were identified that have relatively low shares of legumes of less than 30% in the crop rotations [43]. Kolbe [18] lists a whole series of farms that have only 15–20% legume cultivation. According to a report from farms in Austria, forage and grain legumes are grown by 25% in crop rotations [89]. A number of long-term experiments also address questions regarding fertilization and cropping systems with and without livestock, where legume portions in the crop rotation can in some cases be below 20% [33,34,90,91,92,93].
With a legume share of 20% in each of the crop rotations, the long-term trials of [33], in Cologne-Auweiler on sandy loess loam, and [34], in Bernburg on silty loam including variants with and without removal of the by-products, provide a good data basis for describing these organic cultivation systems (see Table 1). Using the example of N supply, in particular through legume cropping, a comparison can be made with the mean cultivation level of the long-term trials covered.
By reducing the cultivation of forage legumes by 13%, the N2 fixation in these cropping systems is thereby decreased to values around 30 kg N ha−1 year−1. The difference of about 30–50 kg N ha−1 obtained in the trials with reduced legume share can be replaced by a corresponding additional organic fertilization, resulting in an intensity level that is comparable in many characteristics with those of Table 2 as well as Table 3 (Table 6, comparison 1). At 20% legume portion, an additional organic fertilization of about 40 kg N ha−1 must be applied to reach the stockless level in Table 3 (comparison 2) or an input of about 50 kg must be applied to reach approximately the mean level in Table 2 (relative comparison level = 100%). Based on these results, a reduction in the legume rotation can be compensated to a certain extent by an alternative organic fertilization in the amount of the lost N2 fixation to reach a comparable level in the yields as well as in the N and humus balances.
On the basis of these comparison levels, a reduction in the extent of legume cultivation to 20% of the crop rotations then leads to the following changes in the characteristics of crop yields, nutrient balances, and indicators of soil fertility (Table 6):
-
Variant 2 with clover-grass cultivation and organic fertilization by 30–40 kg N ha−1 year−1: yields −15%, N2 fixation −27%, N balance −44%, Corg content −2%, slightly positive humus balance.
-
Variant 3 with grain legume cultivation and similar high fertilization: yields −26%, N2 fixation ±0%, N balance −56%, Corg content −4%, still slightly positive humus balance.
-
Variant 4 with grain legume cultivation without organic fertilization: yields −31%, N2 fixation ±0%, N balance −16 kg ha−1, Corg content −10%, negative humus balance.
The changes determined are consistently more pronounced than with a higher extent of legume cultivation (cf. Table 3, Table 5 and Table 6). This is particularly true in market crop systems with exclusive cultivation of grain legumes and when no further nutrient supply takes place via organic fertilization. The Nmin contents are again slightly lower on average in the crop rotations with clover-grass than after cultivation of grain legumes. If only the first two years after legume cultivation are included in the mean Nmin amounts, hardly any differences are found between the treated intensities (not shown in Table 6).
In these extremely extensive cultivation forms with not more than 20% grain legumes, there is a distinct yield loss of 1.9 t DM ha−1 (to 62–75% of the comparative level in variant 1, Table 6). The N and humus balances reach clearly negative values and the soil Corg content declines. At this level, “good agricultural practice” is clearly no longer present. The values would be even more unfavorable with the removal of the by-products. However, even a small additional organic fertilizer application or slightly expanding legume cropping by introducing clover-grass cultivation and leguminous catch crops can help to mitigate or to compensate for some major unfavorable effects on yields and soil fertility [75].
Raussen et al. [94] arrives at a mean N balance of −20 kg ha−1 year−1 through survey investigations in agricultural practice for the federal state of Hesse in Germany. Particularly in regions with high shares of stockless organic farming, distinct negative N balances were determined in some cases. Through investigations at the practice level, a total of 17 organic farms could be located that, on average, had a similarly low level of forage or grain legume cultivation in the crop rotations and were nearly livestock-free [4,5,43,47,50,53,95,96]. The summarized results of these farms showed the following composition of characteristics (mean values and range of variation):
-
Legume portions and composition: 12 (0–19)% clover-grass, 9 (0–25)% grain legumes, 21 (10–27)% proportions per crop rotation;
-
legume N2 fixation: 31 (4–48) kg N ha−1 year−1;
-
animal husbandry: 0.08 (0–0.8) LU ha−1;
-
organic fertilization: 8 (0–50) kg N ha−1 year−1;
-
Gross N balance: +7 (−22 to +33) kg N ha−1 year−1;
-
humus balance: −63 (−250 to +187) HEQ ha−1 year−1.
A comparison with the values in Table 6 in particular shows very good agreement between the results from the practical farms and the exact trials at 20% legume shares in the crop rotations. Therefore, it can also be expected that the yield level of the crop species, which is often difficult to determine comparatively in practice surveys because of the strong regional differences in yield level and cropping sequences, will also change to the extent shown in these cropping regimes. However, the results also show that these systems are not commonly widespread. Therefore, the strong negative effects with exclusive cultivation of grain legumes on total yields of crop rotations and soil fertility presented by [39] can be somewhat mitigated, as they seem to occur only rarely in this pure form in practice. Nevertheless, it has to be pointed out that these, in part, clearly imbalanced forms of cultivation are capable of endangering the existence of farms in the long run.
Moreover, the results for the market crop systems cannot hide the fact that satisfying humus and N balances can still be achieved on the basis of the estimated legume cultivation and recycling of the by-products, as is also the case, for example, with biogas production through clover-grass and silage maize cultivation. Important other characteristics of soil fertility, such as a sufficiently high supply and availability of basic nutrients with P, K, or even S, are not usually so easy to achieve, especially on lighter soils. As the results also show, the reasons for this include the far too negative nutrient balances, which can be explained by comparatively high nutrient exports via sales products, the relatively low values of nutrient mobilization and resupply, and clearly too low nutrient inputs from outside.
As a result of insufficient humus turnover and nutrient mineralization in the soil, nutrient levels can fall below certain minimum available levels. This increases the probability that the plants will no longer be able to consistently cover the nutrient uptake required for their development. Consequently, the growth of the crop is generally inhibited, and yield fluctuations and yield losses then occur to an increasing extent on each affected field (minimum law, [97]).
Under the cultivation conditions of organic farming, these minimum values are below a CAL-soluble P content of approx. 2.5 mg P 100 g−1 and for K on medium soils below 6.5 mg K 100 g−1 soil. In an extensive study involving many organic field trials, it was determined in this regard that average yield losses of 7–9% for P and, depending on the plant species, up to 30% on average for K can then occur with increasing deficiency [98]. The annual fluctuation ranges of the yield losses can also assume considerable proportions.
In a detailed field plot-specific analysis of survey data from agricultural practice in eastern Germany, it was found that such minimum threshold values for the basic nutrients and the pH value had already been fallen below on more than 65% of the arable fields on average of the organic farms investigated. This is especially true for the (livestock-less) arable farms. It was concluded that such deficiencies in nutrient management, which evidentially lead to yield losses, are more widespread in practice than previously assumed. Calculations have shown that yield losses of 18% (10–32%) on average can then occur on the affected areas. A detailed presentation and discussion of these results can be found in [11,19].

6.4. Effect of High to Very High Intensities with 33% Legume Cultivation in the Crop Rotations

In contrast to the systems described above, more intensive forms of organic farming often show a significant increase in organic fertilizer application. This higher amount of fertilizer, except for the forms with field vegetable cultivation through additional fertilizer purchase, is mostly based on an increasing emphasis on various forms of animal husbandry. Certain changes in the composition of crop rotations can also be seen in many cases.

6.4.1. Effects of Intensities around 1.0 LU ha−1

Based on a collection of eight investigated farms from eastern Germany [43] with livestock intensities around 1 LU ha−1, the following characteristics of nutrient management can be listed (in parentheses: change compared to the average of 32 organic farms = 100%):
-
N supply from organic manures: 65 kg N ha−1 (=245%);
-
legume N2 fixation: 70 kg N ha−1 (=139%);
-
N removal through crop yields: 121 kg N ha−1 (=136%);
-
N balance: 58 kg N ha−1 (=180%);
-
P balance: −3.2 kg P ha−1;
-
K balance: −38 kg K ha−1.
These farms, which are mostly attributed to the forage production systems, show a higher organic fertilization compared to the average. At the same time, there is a somewhat larger extent of legume cultivation and, with 70 kg N ha−1, a clearly higher legume N2 fixation was calculated. These improved intensities have also had the effect of increasing the crop yield levels. At the same time, however, the N balances are already above the average of the farms investigated. Other survey studies from different countries also come to roughly comparable results for farms of forage production of this higher intensity level [3,5,45,48,50,52,99]. At the Scheyern experimental farm in southern Germany, N2 fixation values of 83 kg N ha−1, an input from organic fertilization of 79 kg N ha−1, and N balances of 38 kg N ha−1 were calculated for an organic crop rotation with approximately 30% legume grass [100].
When comparing these values with the results of corresponding long-term trials, it becomes clear that many of the listed characteristics from practice are also to be located within the range of variation of the trial results of variants with an organic fertilization of around 1.0 LU ha−1. This is especially true for the absolute level as well as for the changes compared to the average of organic fertilization and for the level of the nutrient balances (see Table 2 and Table 7). N balances are obtained that are clearly above the relatively low level recorded for the average intensities. In some cases, they already show mean values of over 50 kg N ha−1, which must then be classified as questionable due to their negative environmental effects (class D). In certain cultivation conditions, the same already applies to the calculated humus balances, which have also increased compared to a medium intensity.
Since GE-yields in the trials between these two intensity levels increased only slightly by up to 3% on average for the crop rotations, it can be expected that this would also result in a corresponding decrease in the calculated N efficiencies. Contrary to these results, the yield level between the average of the farm surveys and the selected farms calculated on the basis of N removal has increased to a more pronounced extent with 121 kg N ha−1 to 136% [43].
In the trials presented here, only minor yield increases occurred at this intensity level for cereals and clover-grass. In addition, the legume N2 fixation had already decreased somewhat due to the slightly increased N availability in the soil (see Table 7: Nmin values) and the approx. 7–16% increase in N mineralization. In comparison, this increased nutrient supply resulted in a considerably higher yield increase in some cases for the cultivation of root crops (potatoes) or silage maize. Since such an increase in yield can hardly be investigated in exact trials under normal, constant cultivation conditions, it can be assumed that, in addition to the influence of the site, these clear yield advantages in practice can also be explained by shifts in the crop rotations.
In view of the increase in the soluble N content of the soil and the extent of mineralization of nutrients, effects on the quality of the harvested products can also be demonstrated. For example, the sedimentation values used to assess the baking quality of wheat increased by 24%, especially on light soil. However, the N contents tended to be only slightly higher in the cereal grain. Overall, there were only relatively minor effects on the quality of the crop products [40].
As a result of the increased N supply and N availability and the clear increase in N release from the soil Corg turnover, the N translocation into the subsoil in the long-term trials increased by 18–20% and the calculated N leaching amounts by 5–40%, compared to an average intensity level. The transferred N amounts are already nearly twice as high on sandy soils and the leached N amounts on average of the trials are about 40% higher than on the loamy soils (Table 7).
Although there is a clear enrichment of Corg in the soil at both sites, the Nt soil balances in forage production still show negative values with −5 kg N on loamy soils and −13 kg N ha−1 on sandy soils, so that the Nt contents of the soil have still decreased even at this intensity level. Only under the higher supply of by-products do the Nt reserves in the market crop systems investigated already reach slightly positive values with +14 kg N ha−1 on loamy soils and an almost balanced value on light soils (Table 7).
On the basis of the documented improvements, at this intensity level with approx. 1 LU ha−1 of animal husbandry and use of the resulting organic fertilizers on the trial plots, there was a somewhat marked reduction in the negative P and K balances. At the level now reached, certain balance thresholds for these nutrients could be exceeded, at least after leaving the by-products on the plots (Table 7). Accordingly, an average P balance of −3 kg P and of −38 kg K ha−1 year−1 was also determined under the practical conditions of the farms investigated with similar intensity levels [11]. The values achieved should already be able to contribute to an end of the decrease in the P and K contents, at least on the better soils, under consideration of the nutrient resupply from these soils. In these forage production systems, the by-products and clover-grass growths are usually harvested first, as they are used in animal feeding and stable manure production. As farm manure, they are then returned to the cropland.
The calculated humus balances on the forage cultivation variants with 202–295 kg HEQ ha−1 are still in the supply range C (Table 7). In a long-term trial on silty loam, Schulz et al. [101] reported a similarly high annual Corg enrichment of 233 kg ha−1 and correspondingly high humus balances in systems of forage production with comparable values of legume cultivation and manure supply. In a study by [75], with an animal husbandry level of 1 LU ha−1, it was also possible to calculate a grade C in the majority of the humus supply. Between the investigated sites, however, values ranging from −57 kg ha−1 to +378 kg ha−1 HEQ in the slurry system and from −110 kg ha−1 to +319 kg ha−1 HEQ in the case of solid manure management were determined. According to these results, the sites are characterized by distinct differences in the humus balance levels depending on their turnover conditions and yield potentials.
In Table 8, the effects of this intensity level on average of different organic fertilizers (stable manure, cattle slurry, and green manure) on the temporal change of important characteristics of the soil were compiled. Compared to no fertilization (see Table 4), improved values are found in the accumulation of soil Corg and in the expected annual N mineralization. In contrast, in most cases, still decreasing values in the soluble basic nutrients of the soil are analyzed. At an intensity level around 1.0 LU ha−1, the following changes can be expected in the arable topsoil in 10 years based on the humus and nutrient balances calculated from the results of the long-term experiments on the basis of the forage cropping systems:
-
Loamy soils: +0.077% Corg, −0.004% Nt, −0.26 mg P 100 g−1, −1.30 mg K 100 g−1 soil;
-
sandy soils: +0.040% Corg, −0.004% Nt, −1.13 mg P 100 g−1, +0.29 mg K 100 g−1 soil.
Based on the close relationships between the experimentally determined annual Corg differences and humus balances, the following trends can be estimated until an equilibrium state is reached: loam soil +0.167% Corg, sandy soil +0.115% Corg.
On the market crop areas of the trials, the added fertilizers can primarily also be regarded as purchased fertilizers. Since all by-products remained as additional fertilizers, the improvement of the nutrient balances was so pronounced that only positive balances were achieved and the contents in the soil increased to a higher extent than on the forage crop areas (Table 7 and Table 8). The humus balances also increase more strongly in these systems and can already reach undesirably high values on the better soils (class E).

6.4.2. Effects of High Intensities around 2.0 LU ha−1

Compared to the previous intensity level, the basic composition of the crop rotations and the treatment of the by-products were also maintained in the trials at this level of cultivation, which again covers a wide range of possible applications in practice. These trial variants with 2.0 LU ha−1 are characterized by a further doubling of the organic fertilizer supply (cf. Table 7 and Table 9). Sometimes, it was already difficult from an experimental point of view to distribute the total amounts of fertilizers effectively in the crop rotations [40].
In the experiments, the absolute quantities added were not limited by the usual organic farming rules of the EU or the farmers’ associations, so that both the amount and the type of fertilizer used could be deliberately exceeded. In this way, it was possible that the effects in the crop cultivation systems and on the environment could be better documented. In addition, examples from the practice of organic farming can certainly still be found in this regard (see next section).
With the organic fertilization doubled again, between 126–134 kg N ha−1 were supplied on the site with loam soil and between 111–122 kg N ha−1 year−1 on the sandy soil. This increased the total supply of N in these variants to 244–275 kg N ha−1 on the heavy soils and between 205–216 kg N ha−1 year−1 on the light soil. As a result, the total supply increased by approx. 155–165% between the average cultivation level of 0.5 LU and the 2.0 LU variants (see Table 2 and Table 9).
Such trial management practices have led to a significant increase in humus balances by 154–351%, resulting in an increased achievement of supply grades D and E. The annual calculated N mineralization has increased in the course of the vegetation in the market crop variants by 125% and in the forage crop plots between 139–151%. The Nmin contents in early spring also increased by 104–150% and after harvest in the fall by 118–141% compared to the average level (Table 9 in comparison to Table 2).
Because of this substantial increase in total input and the resulting rise in the amount of N available in the soil, only a very modest improvement was achieved in the crop rotation average, both in the GE-yields of between 102–105% (i.e., only 0.1–0.4 t GE ha−1) and in the N removal of between 101–107% on the sandy and of 107–113% on the loamy soils. As a result of stepwise fertilizer application, a clearly visible diminishing yield increase could be observed for almost all cultivated crop species. The highest increases were often registered between the variants 0.0–0.5 LU ha−1; the lowest increases occurred in the test members between 1.0–2.0 LU ha−1. On average, maximum yields were already recorded in the 2.0 LU variants of the crop rotations.
However, for certain crop species that require a relatively high nutrient uptake for yield formation, such as corn and potatoes, in contrast to cereals and clover-grass, the nutrient supply of N was already insufficient at a medium intensity level, indicating a yield limitation of these crops in particular. As a result of further increasing fertilization levels, root crops and corn also responded with a more pronounced increase in yield than the other species tested here. In organic farming, the nutrient N consequently also proves to be a yield-limiting influencing factor, as has already been shown in other experimental work [102,103,104,105,106].
Accordingly, the increase in yield was strongly dependent on the species of crop cultivated. The cereals (winter and spring wheat, triticale) showed the lowest changes with only 101–102% yield increase as a result of increasing fertilizer intensification. Frequently, a decrease in yield stability and even declining effects were observed, which was reflected in an increased lodging tendency of the cereals and could also be attributed, for example, to an outbreak of leaf powdery mildew (Blumeria graminis) [40].
In conventional agriculture, a so-called “intensification spiral” became known, according to which an increased N supply led to an elevated disease infestation or to a reduction in plant vitality and related yield limitation [107,108]. Consequently, a higher use of plant protection products followed, so that an increase in yield was made possible again by an intensified nutrient supply. The described relationship between fertilization and crop protection was one of the major factors behind the enormous yield increases in the conventional intensification phase. However, since this development has inevitably led to today’s widespread problems in environmental protection, biodiversity, and plant quality, great care should be taken in organic farming to ensure that the same mistakes are not made during a planned intensification.
The cultivation of clover-grass was also characterized by only very low yield increases of 101–103%. For these forage crops, a high yield level was already present at low fertilization levels. The improved N availability in the soil caused both the proportion of legumes in the mixture and the legume N2 fixation at high intensity to drop by 4–8%. The largest yield increases were recorded by the cultivation of potatoes and silage maize, with average differences in yields between 105% and 108% caused by the increased organic fertilization.
In the context of the balancing measures, N removals between the investigated cropping systems also increased only slightly. On the loam soil, maximum values of 191 kg N ha−1 (=107%) were recorded in forage production and 77 kg N ha−1 (=113%) in the market crop systems. On the sandy soil, it was only 115 kg N ha−1 (=101%) and 41 kg N ha−1 (=107%), respectively, compared to a moderate fertilizer supply in the 0.5 LU variant. Due to these relatively low yield improvements, very high N balances of 84–101 kg N ha−1 were determined on the forage cropping systems and even values between 162–167 kg N ha−1 on the market crop areas (Table 2 and Table 9).
Even when subtracting the amounts of N recycled during the mulching of clover-grass growth, the market crop areas can still be estimated to have somewhat higher values than in the comparative systems. Overall, the N balances have increased strongly over-proportional with 192–721% compared to a moderately high supply. The N utilization (without consideration of the Nt soil balance) on the example of the forage crop areas has dropped from initial values, between approx. 100% and 89% at a medium intensity of the 0.5 LU variant by this intensification, to values between 70% on loamy soils and 53% on the sandy soils. On the market crop areas, the efficiency values are correspondingly even lower. In addition, these intensive cultivation methods have increased both the amounts of N transferred to soil depths up to 2.00 m by between 145% and 150% and also the calculated values for N leaching by 95–219%. Compared to these results, the absolute amounts leached are still on a comparatively very low level with 4–6 kg N ha−1 year−1.
In a study by [109], maximum values for N removal of 141 kg N ha−1 were determined under practical conditions of organic farming. These values resulted in gross balances in the range of 60 kg N ha−1, Nmin values around 57 kg N ha−1, and leaching amounts of up to 34 kg N ha−1 year−1. Except for the N leaching, which was also still at a relatively low level, value ranges were determined that in some parts had already risen to the level of conventional farm evaluations.
Despite the high amounts of fertilizer added, the quality of the crop products also changed only slightly at this intensity level. For example, the values of crude protein could only be raised between 101–104% and the sedimentation values of wheat between 107–127%. On average, these results show that there is only a little possibility of specifically influencing the quality of the crop types using organic fertilizers.
As a result of the extensive supply of organic matter, the Corg contents in the topsoil of the long-term experiments were steadily increased over the course of the trial period. On the loam soil, for example, the values of 1.112% Corg at average cultivation compared to the intensity level of the 2.0 LU variants increased by +0.105% Corg (=109%) after 16 years of different cultivation. On the sandy soil, the increase from an initial 0.771% Corg in the lower intensity level was +0.058% Corg (=108%) after 14 years of experimental duration. Despite the assumption that the soil Corg equilibrium of 85–95% has not yet been reached during the trial period (see [19]), the average soil Corg differences achieved by the high organic fertilization rates are on a relatively modest level.
Despite the relatively small changes in the Corg contents, the calculated humus balances at the present intensity were at a very high level in almost all cropping systems with supply grades between D and E. Moreover, the humus balances reflected the range of N balances quite well. Both characteristics have reached a supply range, which cannot be recommended any more without restrictions from the point of view of well-managed land use (values far above 50 kg N ha−1 and above 300 kg HEQ ha−1 are increasingly questionable = supply class D, values above 80 kg N ha−1 and above 500 kg HEQ ha−1 are not acceptable = class E; see [18,43]).
The rates of change in some important soil properties determined during the trials can be seen in Table 10. At this high intensity level, almost exclusively positive changes in the concentrations of nutrients in the soil are analyzed, which is now also true for the basic nutrients. In summary, based on the obtained humus and nutrient balances, the following changes in the soil can be calculated for a range of 10 years:
-
Loamy soils: +0.108% Corg, +0.002% Nt, +0.84 mg P 100 g−1, +1.74 mg K 100 g−1 soil;
-
sandy soils: +0.058% Corg, ±0.000% Nt, +0.45 mg P 100 g−1, +2.36 mg K 100 g−1 soil.
Until equilibrium is reached, based on the obtained values in the humus balancing, a change of +0.233% Corg on the loam site and +0.163% Corg on sandy soils can be expected at maximum. Only a fertilizer supply of 2.0 LU ha−1 ensures with relatively high certainty that no more decreasing contents of the soluble basic nutrients are detected in the soil (Table 10).

6.5. Systems with 50% Legume Cultivation and Very High Organic Fertilization

In an extensive study by [18], the average farm legume shares within the usual crop rotations of agricultural practice showed a very high variation between 13–60%. In a study of eastern Germany, Meyer et al. [43] was able to determine a portion of more than 40% grain and forage legumes in 14 organic farms. According to these investigations in agricultural practice, there is a whole series of farms on which the extent of legume cultivation in the crop rotations is in some cases far above the average values determined.
However, because of the possible occurrence of various diseases of “legume fatigue”, such a high level of cultivation is already considered problematic by the authors (see [10]). In this respect, the selection and sequence of both forage and grain legumes must be made very consciously and coordinated with each other so that no disease symptoms occur over time.
Similarly, in the experimental research, test elements with partly very high legume shares in the crop rotations have long been established. However, on this basis only a few questions in the field of fertilization are located in special long-term trials [41,42,92,110,111].
From these trials, on the one hand, the results of a 17-year organic experimental field at Roda in eastern Germany with 33% clover-grass and up to 1.0 LU ha−1 of organic manure (cattle slurry, stable manure) as well as livestock-less plots with 46% legumes (28% clover-grass, 18% grain legumes as field bean) by [41] were used for these investigations. On the other hand, at the same location on loess loam with a 6-field crop rotation, the results of a 12-year exact long-term experiment on basic fertilization with 50% legumes (33% clover-grass, 17% field bean) and 0.0–2.7 LU ha−1 organic fertilization by [42] were included in the comparison (see Table 1). In these trials, the planned fertilizer rates could also be applied to the variants in full. In the highest fertilization level, 13.7 m3 of cattle slurry and 12.5 tons of stable manure per hectare were applied per year (Table 11).
The large plot experiment with 33% legume proportions showed an organic fertilization of 45 kg N ha−1 year−1 and could therefore again be used as a comparison variant for a medium supply, according to Table 2. Based on this supply level (variant 1 = 100%), the following results can be derived for cropping systems with a high legume share and strongly increasing organic fertilization (Table 11):
-
Although the legume share in the crop rotation increases by approx. 17% between variants 1–3, only an additional legume N2 fixation of approx. 5–20 kg N ha−1 is still achieved.
-
The increased legume cultivation can therefore only save a small amount of organic N fertilization between 0–40 kg ha−1, so that between variant 1 and around variants 3–4, an equal level of yields in the crop species and in the soil supply is ensured.
-
A legume share of 46% in the crop rotation is still not sufficient in variant 2 with additional leaving of the by-products and mulching of the clover-grass growth on the plots to achieve a level of congruence with variant 1 in many characteristics.
-
Between variant 1 and 2, the proportion of deep-rooted clover-grass has been reduced by 5%, the balances are 12 kg N ha−1 higher, with decreasing Nmin values up to 90 cm depth, the N transfer potential between 0.90–2.50 m depth has been increased by 12 kg, and up to 4.00 m soil depth in variant 2 by 9 kg N ha−1.
-
With increasing organic fertilization, the legume share in the clover-grass mixture obviously drops from 58% without fertilization (variant 3) to 49% with 2.7 LU ha−1 organic fertilization (variant 6) more clearly than at the level of 33% legume cultivation in the crop rotation.
-
The legume N2 fixation increases by 32% overall up to the 1.3 LU ha−1 organic fertilization stage (variant 1 compared to variant 5) and then drops again by about 4% at the very high fertilization of variant 6.
-
At the stage of 50% legumes in the crop rotation, the N2 fixation level increases by only 15% due to organic fertilization (variant 3 compared to variant 5).
-
The yield increase in all crops with increasing fertilization clearly follows the law of diminishing yield growth and already reaches a maximum at the level of 1.3 LU ha−1 (cf. variant 1 and variant 5: +15% yield increase); only for potatoes is an additional rise of +17% in tuber yield achieved, up to 2.7 LU ha−1 (variant 6, not shown).
-
While at a legume level of 33% a yield increase of approx.. 20% can still be achieved up to the 2.7 LU ha−1 stage; with high legume cultivation an increase in yield of only 17% up to the 1.3 LU ha−1 stage occurs due to increasing fertilization, and with further doubling of fertilization already drops again by 4%.
-
Although the crop yield has been significantly increased as a result of fertilization, the N balances have risen considerably more in line with the fertilization level; from variant 5 and especially from variant 6, it can no longer be assumed that a well-managed agricultural land use is taking place, even if the Nt reserves in the soil are taken into account, as the balances rise to values of over 150 kg N ha−1.
-
Nmin amounts in the spring also increased over-proportionally between variants 1 and 6 by up to 32% reaching 90 kg N ha−1.
-
Due to the higher N availability, the contents of crude protein of winter wheat have also increased by relatively 12% to over 12.1% crude protein in the DM of the grains.
-
The Corg contents in the soil have increased very strongly in the topsoil as a result of the organic fertilization; a further aspect to consider is the still relatively short period of 12 years that has been taken into account.
-
The calculated humus balances have developed largely parallel to the Corg levels as a result of increasing fertilization, but cultivation methods of variants 1 and 3 mark a lower end (supply grade B), and for variant 6, the upper end, of well-managed cultivation (grade D).
-
The P and K balances have also changed as a result of increasing fertilization, although at the same fertilization level (variant 1 compared to variant 4) there has been hardly any change in the often clearly negative balances as a result of the increased proportion of legumes (P: −6 to −14 kg ha−1; K: −57 to −76 kg ha−1 year−1), while after high fertilization in variant 6 there have been equally clear positive balances with +10 kg P ha−1 and +52 kg K ha−1.
In the comparison between a legume share of 33% and 50% including a high fertilization of up to 2.7 LU ha−1, there was a further increase in the nutrient and humus balances due to the somewhat higher supply values of the N2 fixation and organic fertilization (Table 9 and Table 11). In relation to the crop species, yields did not increase to a comparable extent. In variant 6, probably due to higher disease incidence, there was even a slight decrease, especially in the yields of the cereal species. Because of this contrary development between the nutrient supply and the yields, the nutrient balances increased clearly disproportionally.
Based on the mathematical-statistical relationships between the calculated nutrient balances and the changes in soil nutrients determined in the experiment (Table 11), the following values for the development of the topsoil Corg and nutrient contents were obtained for a range of 10 years on the loamy soils:
-
Variant 3: +0.094% Corg, ±0.000% Nt, −0.29 mg P 100 g−1, +0.29 mg K 100 g−1 soil.
-
Variant 4: +0.109% Corg, +0.001% Nt, −0.05 mg P 100 g−1, +0.74 mg K 100 g−1 soil.
-
Variant 5: +0.127% Corg, +0.002% Nt, +0.30 mg P 100 g−1, +1.53 mg K 100 g−1 soil.
-
Variant 6: +0.157% Corg, +0.005% Nt, +1.00 mg P 100 g−1, +3.11 mg K 100 g−1 soil.
The following values were determined for the changes in the Corg content until equilibrium is reached, calculated on the basis of the results of humus balancing: variant 3: −0.015% Corg, variant 4: +0.061% Corg, variant 5: +0.123% Corg, and variant 6: +0.260% Corg.
Through the high annual balances or rates of change, a distinctly higher enrichment of the contents and composition of the soil Corg, as well as of the soluble soil nutrients [42], occurred in the highest fertilization variant on the areas without by-product return than in the long-term trials presented, with 2.0 LU ha−1 year−1 in the forage production system. On the market crop areas, similarly high accumulations of P and K occurred (Table 9 and Table 10). The extremely high N balances in variant 6 (Table 11) also contributed to a stronger transfer of N to deeper soil layers. Based on 50% legume content in the crop rotations, for most of the described attribute results, especially for variant 6 of these trials, questions exist concerning good organic management.
In the agricultural practice of organic farming, up to now only little knowledge has been available regarding the extent and supply level of farms which, beside high legume cultivation in the crop rotations, are additionally characterized by intensive animal husbandry. In most cases, the animal stocking rate is already clearly limited by the fertility level of the site, since the majority of feed material has to be produced on the farm itself due to the rule on area-dependent animal husbandry. From a Germany-wide compilation on nutrient management by [18], the following mean maximum values of farms can be compiled for some characteristics (in brackets: difference compared to the respective average of the surveys = 100%):
-
N supply of organic fertilizer: 112 kg N ha−1 (=267%);
-
legume share in the crop rotation: 48% (=146%);
-
legume N2 fixation: 96 kg N ha−1 (=185%);
-
humus balance: ~564 kg HEQ ha−1 (approx. 397%, supply grade E);
-
N balance: 80 kg N ha−1 (=296%);
-
P balance: +7 kg P ha−1;
-
K balance: +35 kg K ha−1.
In several studies from Germany and other European countries, higher values than 160 kg N ha−1 supply via organic fertilizers, as well as N balances of more than 100 kg N ha−1 year−1, were determined in individual farms [18,44,48,50,95,112,113]. According to Haas and Deittert [20] (see also [53]), N balances of up to 85 kg N ha−1 year−1 were also calculated in intensive dairy farms, where milk yields up to 9000 kg cow−1 year−1 are common, by purchasing high amounts of fodder concentrates and other special feeds. In both studies, however, nutrient losses and no N deposition were taken into account in the farm gate balances, so that the real values are likely to be even higher.
Between these values, which are occasionally observed in intensive types of farming practice, and the attribute compositions noted in the trials, high correspondences are found both in the absolute values and in the relative changes. These results are especially true for the last-mentioned long-term experiments with a legume cultivation of 33–50% in the crop rotations. For example, the level found in practice with an average maximum fertilizer application of 112 kg N ha−1 year−1 already comprises the lower range, which was also experimentally simulated via the trials (variants 5–6, Table 11 as well as Table 9).
The nutrient balances determined between farm surveys and the trial results also agree quite well. The clearly positive N balances, as well as those of the nutrients P and K, indicate a positive Nt development in the soil and also a partly distinct increase in the plant-available P and K concentrations in the soil. Thereby, also for the basic nutrients, the supply classes C and D can be reached and exceeded to a higher extent. Through organic fertilization in particular, the supply of micronutrients to the soil was also improved in the long term.
Such positive effects of organic fertilization not only on the Corg supply, but also on soil fertility indicators of basic and micronutrients, can be derived from many conventional and organic long-term experiments [114,115,116]. However, in the case of long-term very high fertilization, e.g., with special farm manure or commercial fertilizers, this can result not only in the nutrient N, but also, for example, in a strong increase in P and some trace elements in the soil. As a result of the increased annual mineralization, the well-known problems in water protection and other surrounding natural compartments can then arise, as has become known in many ways from conventional agriculture [109,117,118].
There have recently been reports on this subject, according to which even under organic cultivation conditions, a sometimes-unbalanced high organic fertilization can lead to a critical nutrient enrichment, e.g., with P in the soil, not only under the conditions of vegetable cultivation in greenhouses, but also, for example, with increased field vegetable cultivation [7,15,119]. The evaluations have shown that in these intensive cropping systems, with high proportions of grain crops removed, there can be specific K enrichment, and after increased cultivation and the removal of vegetative plant material by clover-grass and silage maize there can also be P accumulation in the soil. The cultivation of these special crops is in part only economically successful (crop yield and quality) through high fertilization. Often, there is a lack of suitable organic fertilizers with specific nutrient compositions.

7. Summary Effects of Fertilization Intensity Using Nitrogen as an Example

7.1. Long-Term Influence of Fertilization on N2 Fixation and Legume Proportions in Clover-Grass

The effect of the organic fertilizer types mainly applied in organic farming on soils and plants was described in the first review article [19]. Through the permanent application of these fertilizers, there has been a specific change in both the legume fractions in the clover-grass and the N2 fixation levels of the leguminous stands in the long-term field trials. This influence can be determined by calculating the leguminous N2 efficiency. The calculated values of the N2 efficiency, shown as a proportion in the N removals (=100%) of the crop species in the rotation (values in parentheses), developed as follows (%) as a result of the fertilizers applied in comparison to the variants without fertilization (=100%):
Intensity Level:0.0 LU ha−10.5 LU ha−11.0 LU ha−12.0 LU ha−1
-
Stable manure
100 (64.9)1049788
-
Green manure
100 (123)989594
-
Cattle slurry
100 (84.4)888581.
According to these results, the long-term application of solid organic fertilizers, including green manures, results in only minor changes, whereby the portions of legume N2 fixation in the total N removals of the crop rotations have decreased only relatively slightly as a result of strongly increasing fertilizer application. After low fertilizer application, there is often even an improvement in N2 efficiency, as can be seen here in the example of stable manure. With an application of 2.0 LU ha−1, this ratio was reduced by 6–12% compared to the variants without fertilization (on average by 4–5% for the fertilization variants). According to calculations by [42], there were also hardly any changes in the proportion of N2 fixation in the N removal of the crop rotations.
In addition to yields and legume type, changes in the proportion of legumes in the legume-grass mixture or the amounts of reactive N in the soil also affect the N2 fixation rates in the calculation. These indicators have been changed much more unfavorably by the permanent added slurry or other liquid fertilizers with high amounts of soluble N than after the addition of the solid organic fertilizers, although these fertilizers have not been applied directly to the legume-grass part of the crop rotations. Consequently, there has been a pronounced decrease in the amounts of N2 fixation and in the calculated proportions of N removal from the crop rotation. In this way, losses of N2 fixation of legumes due to long-term high slurry applications can be observed, which on average can lead to a decrease in N2 efficiency of 15–20% in crop rotations. With higher periodic application rates in particular, solid organic fertilizers might therefore be more suitable than the usual liquid fertilizers.

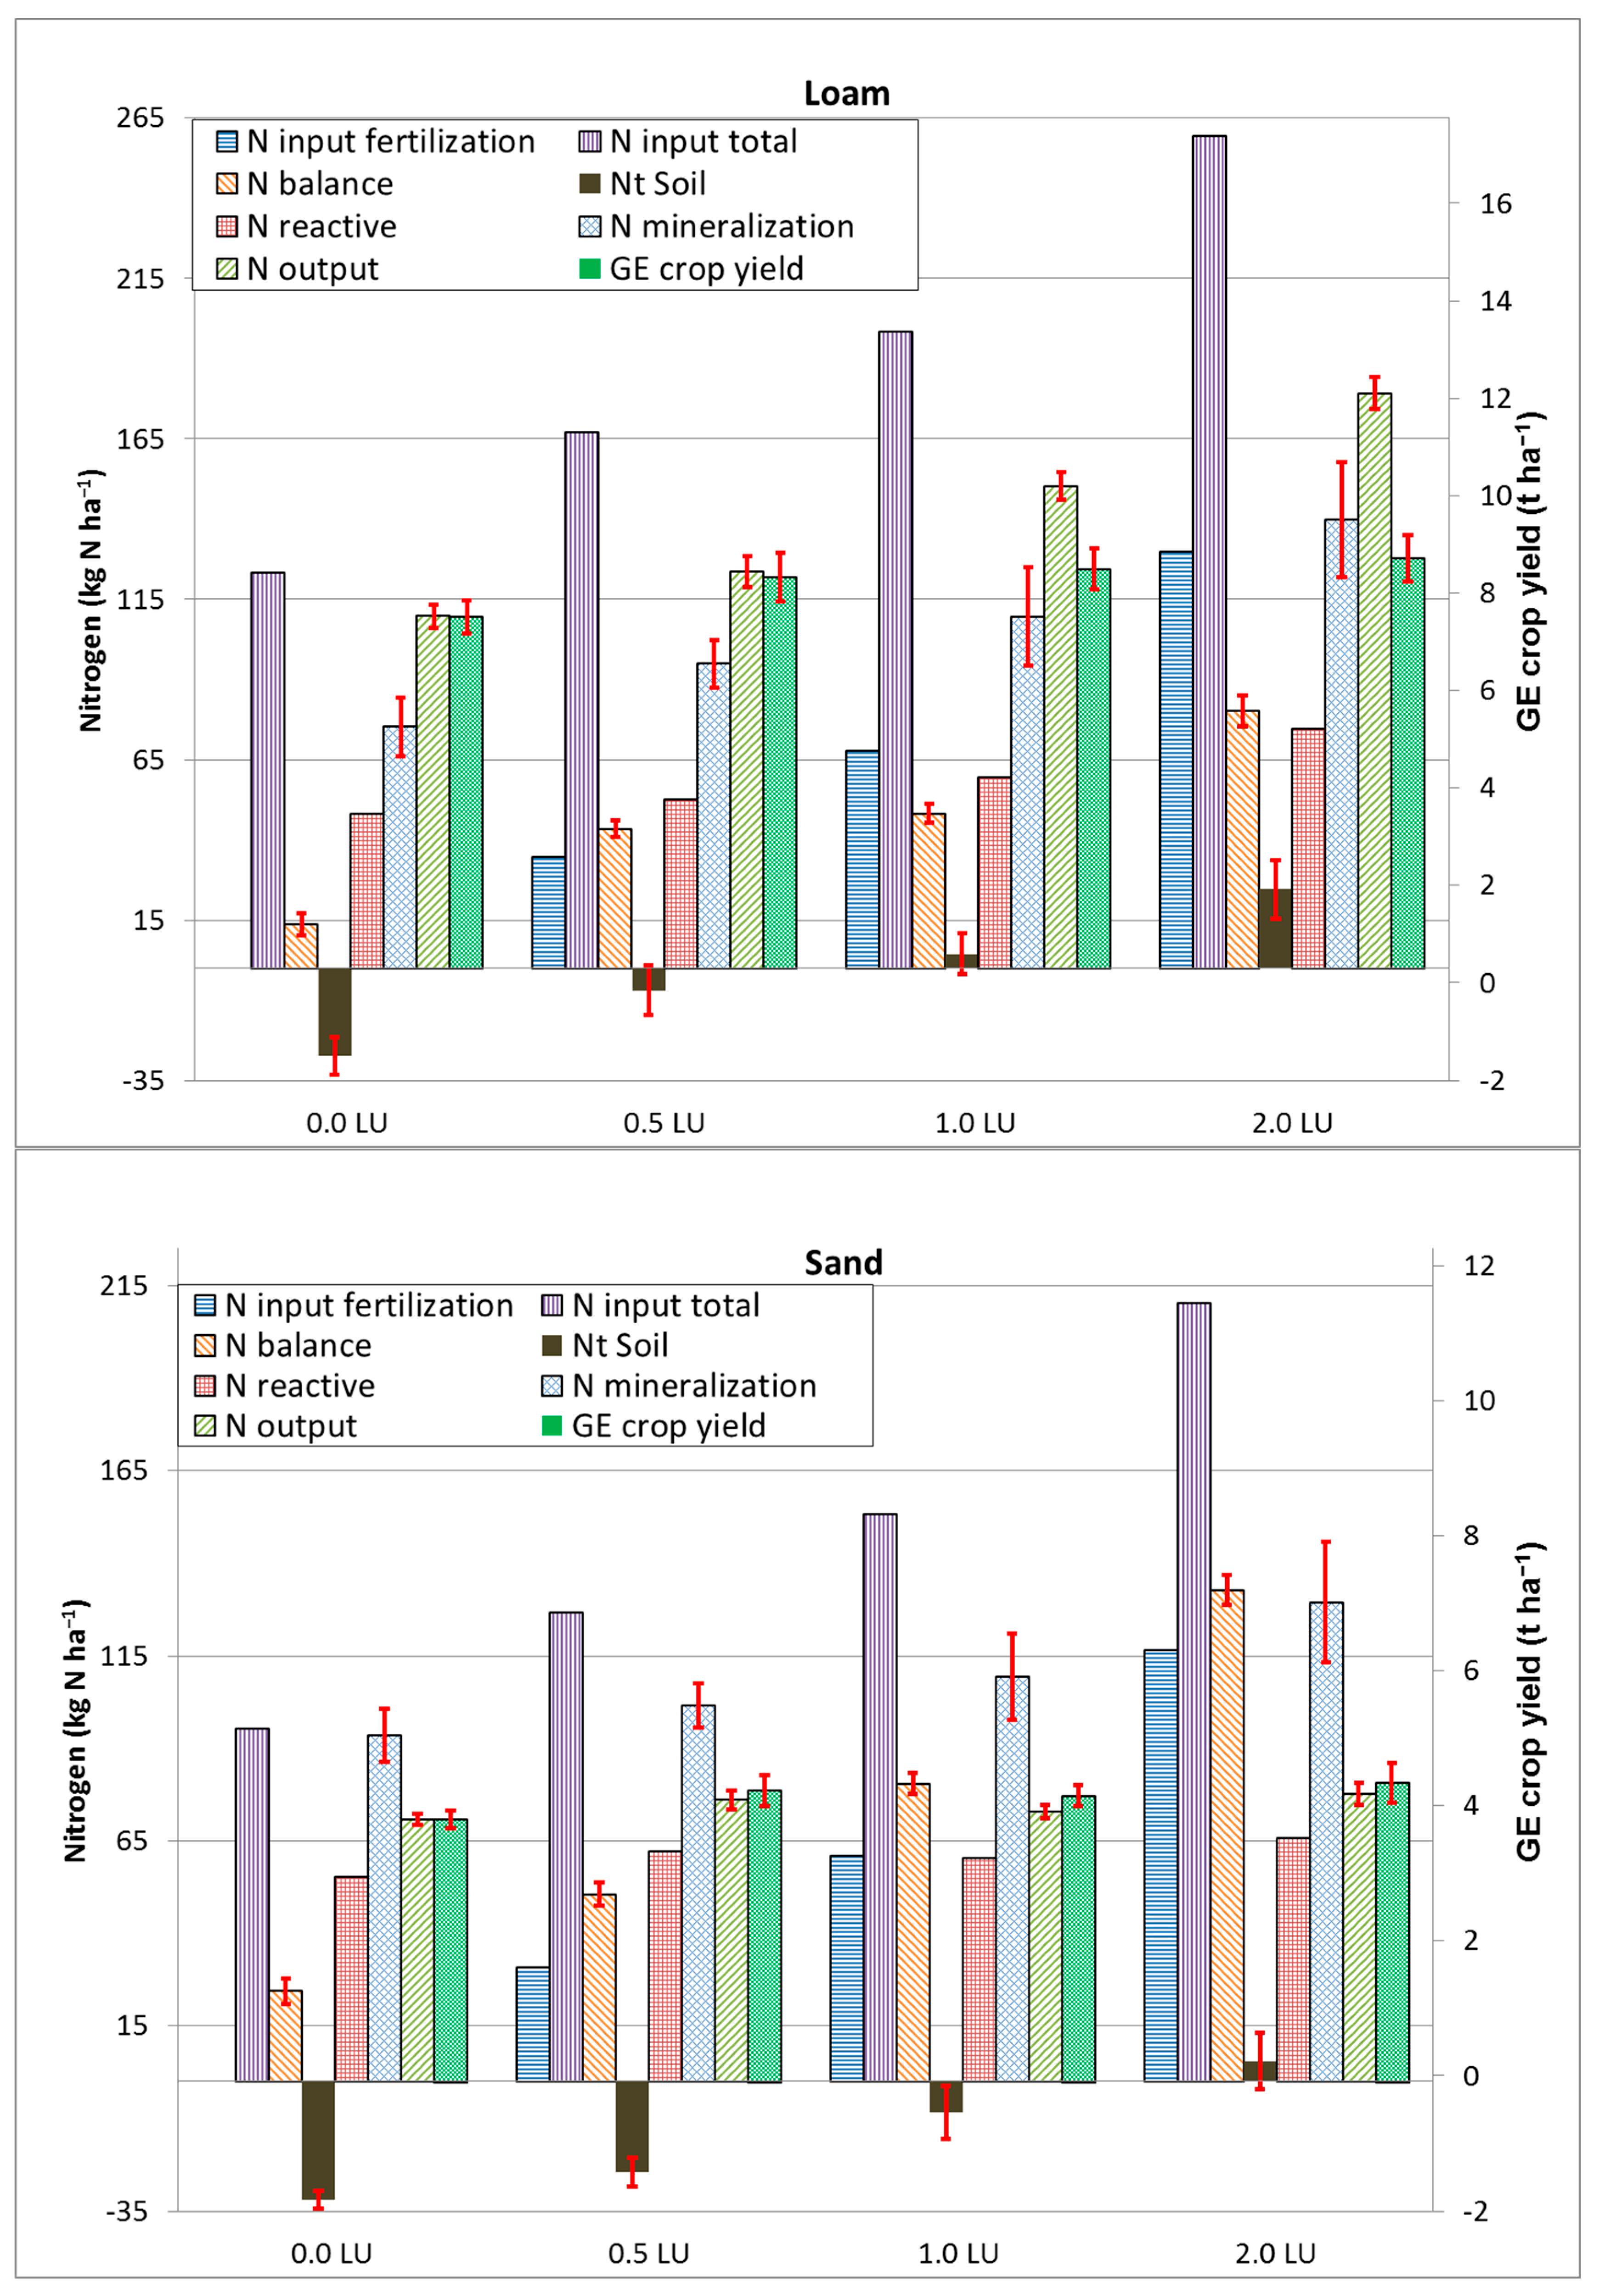
7.2. Relationships between Components of N Balancing and GE-Yields on Sites with Light and Heavy Soils

Taking N as an example, the complex influences between increasing intensity on some important characteristics of nutrient balancing and soil as well as GE-yields are shown graphically in order to further highlight certain properties for this nutrient. In Figure 1, based on the long-term experiments presented here (see Table 1), the following seven characteristics of N (averaged over the forage and market crop systems) have been listed for each of the four intensity levels (0.0–2.0 LU ha−1 year−1):
-
Balance criteria (input, output, balance);
-
the sum of reactive N (=Nmin quantities after harvest up to 0.90 m + 0.90–2.00 m in the depth profile + calculated N leaching quantity);
-
the calculated N mineralization;
-
a relative comparison between the amount of N removed with the harvests and the GE-yield.
As the evaluations have revealed, a corresponding range of intensity levels was also found in the agricultural practice of organic farming. Through the doubling of fertilization carried out for each step (on average of stable manure, green manure, and slurry), the highest variant results in an N supply of approx. 130 kg N ha−1 at the loam and of 117 kg N ha−1 at the sandy site. Considering that there was already a total N supply of between 95 kg and 123 kg N/ha via the crop rotation (N2 fixation), the fertilization resulted in an increase of up to almost 260 kg N ha−1 on the loam soil and up to 210 kg N ha−1 year−1 in the total N supply on the sandy soil (Figure 1).
When the crop rotations are not changed accordingly as a result of increasing intensity, there is a rise in yield, which is still visible at both sites, especially between the stages without fertilization and 0.5 LU ha−1 (Figure 1). However, the increase in yield becomes smaller with each step (diminishing increase in yield). Between the variants with 1.0 LU ha−1 and 2.0 LU ha−1, only very slight increases in yield are recorded at both sites, so that for the highest stage it can be roughly assumed that a maximum level has been reached.
The relations between N exports and GE-yields indicate that a certain level of N enrichment in the harvested products also occurred in organic farming as a result of increasing intensities. However, the extent is small and, in these experiments, occurred only on the loam soil in the intensity studies (Figure 1) and at both sites in the fertilizer type studies [19].
At both sites with no additional fertilization, the cultivation conditions in the plots were already sufficiently high for the nutrient balance to be slightly positive at 14–24 kg N ha−1. What is usually not considered in these rather extensive cultivation forms, however, is the in part severe depletion of soil fertility. This is visible here, for example, in the clearly negative Nt reserves of the soil organic matter content of 28–32 kg N ha−1 year−1, which is particularly evident on the lighter sandy soils (Figure 1). According to these results, the calculated N balances must therefore be increased by these values, since they are not included in the usual procedure for nutrient balancing.
With rising intensity, there is a slightly disproportionate increase in N balances at both sites, which can of course be attributed to the decreasing yield growth. Due to the unfavorable growing conditions, this is particularly pronounced on the sandy soil and the lack of an adequate water supply. In the highest stage, N balances in these soils can also reach values of over 130 kg N ha−1. A certain amount of recycled N via the repeatedly mulched clover-grass growth in the market crop system must be taken into account, with this to be subtracted from the corresponding balances.
Following the increasing intensification from the variant with 1.0 LU ha−1 on the loam and from 2.0 LU ha−1 on the sandy soil, a net enrichment in the Nt soil fund is still achieved. If these quantities are offset in each case at the various intensity levels with the N balances determined (addition of negative and subtraction of positive Nt levels), balancing values are obtained which are then determined quite well for most intensity levels with the values summed up here for residual Nmin in the fall, in the depth profile, and of N leaching quantities. Because of the high mobility and chemical reactivity, these quantities of N in the sum can also be referred to as “reactive N” (Figure 1). The N gross balance corrected in this way can then be used as a good indicator value for this source of N.
After high organic fertilization, the N balance also increased only moderately. As at this intensity level a partly considerable amount of N in the soil fund of the organic matter is already withdrawn from the usual nutrient balance, a further decrease in the reactive N fraction in the soil takes place. Overall, it can be stated that as a result of a strong increase in intensity due to the use of organic fertilizers, only relatively small changes occur in the fraction of reactive N in the soil [40]. The Nmin fall values and the translocation and leaching potentials remain at relatively low levels (Figure 2).
While on the loam soil, the Nmin quantities in the rootable area of 0.60–1.50 m depth have tended to decrease over the course of seven years, the translocation capacity in the subsoil has increased to varying degrees according to the fertilization intensity (Figure 2). On the sandy soil, the transferred N quantities were on a higher level overall and there was already a slight accumulation in the rootable area down to below 0.9 m depth, which increased even further in the depth profile. A clear differentiation in intensity could only be determined as a tendency (not shown).
Similarly measured in relation to the total N supply, the experiments showed that the reactive N fraction did not change proportionally as a result of increasing intensity by organic fertilizers, but largely under-proportionally (loam soil) or hardly at all (sandy soil). This finding is not only of interest for the listed N loss sources, but also for the occurrence of climate-damaging trace gases, such as N2O.

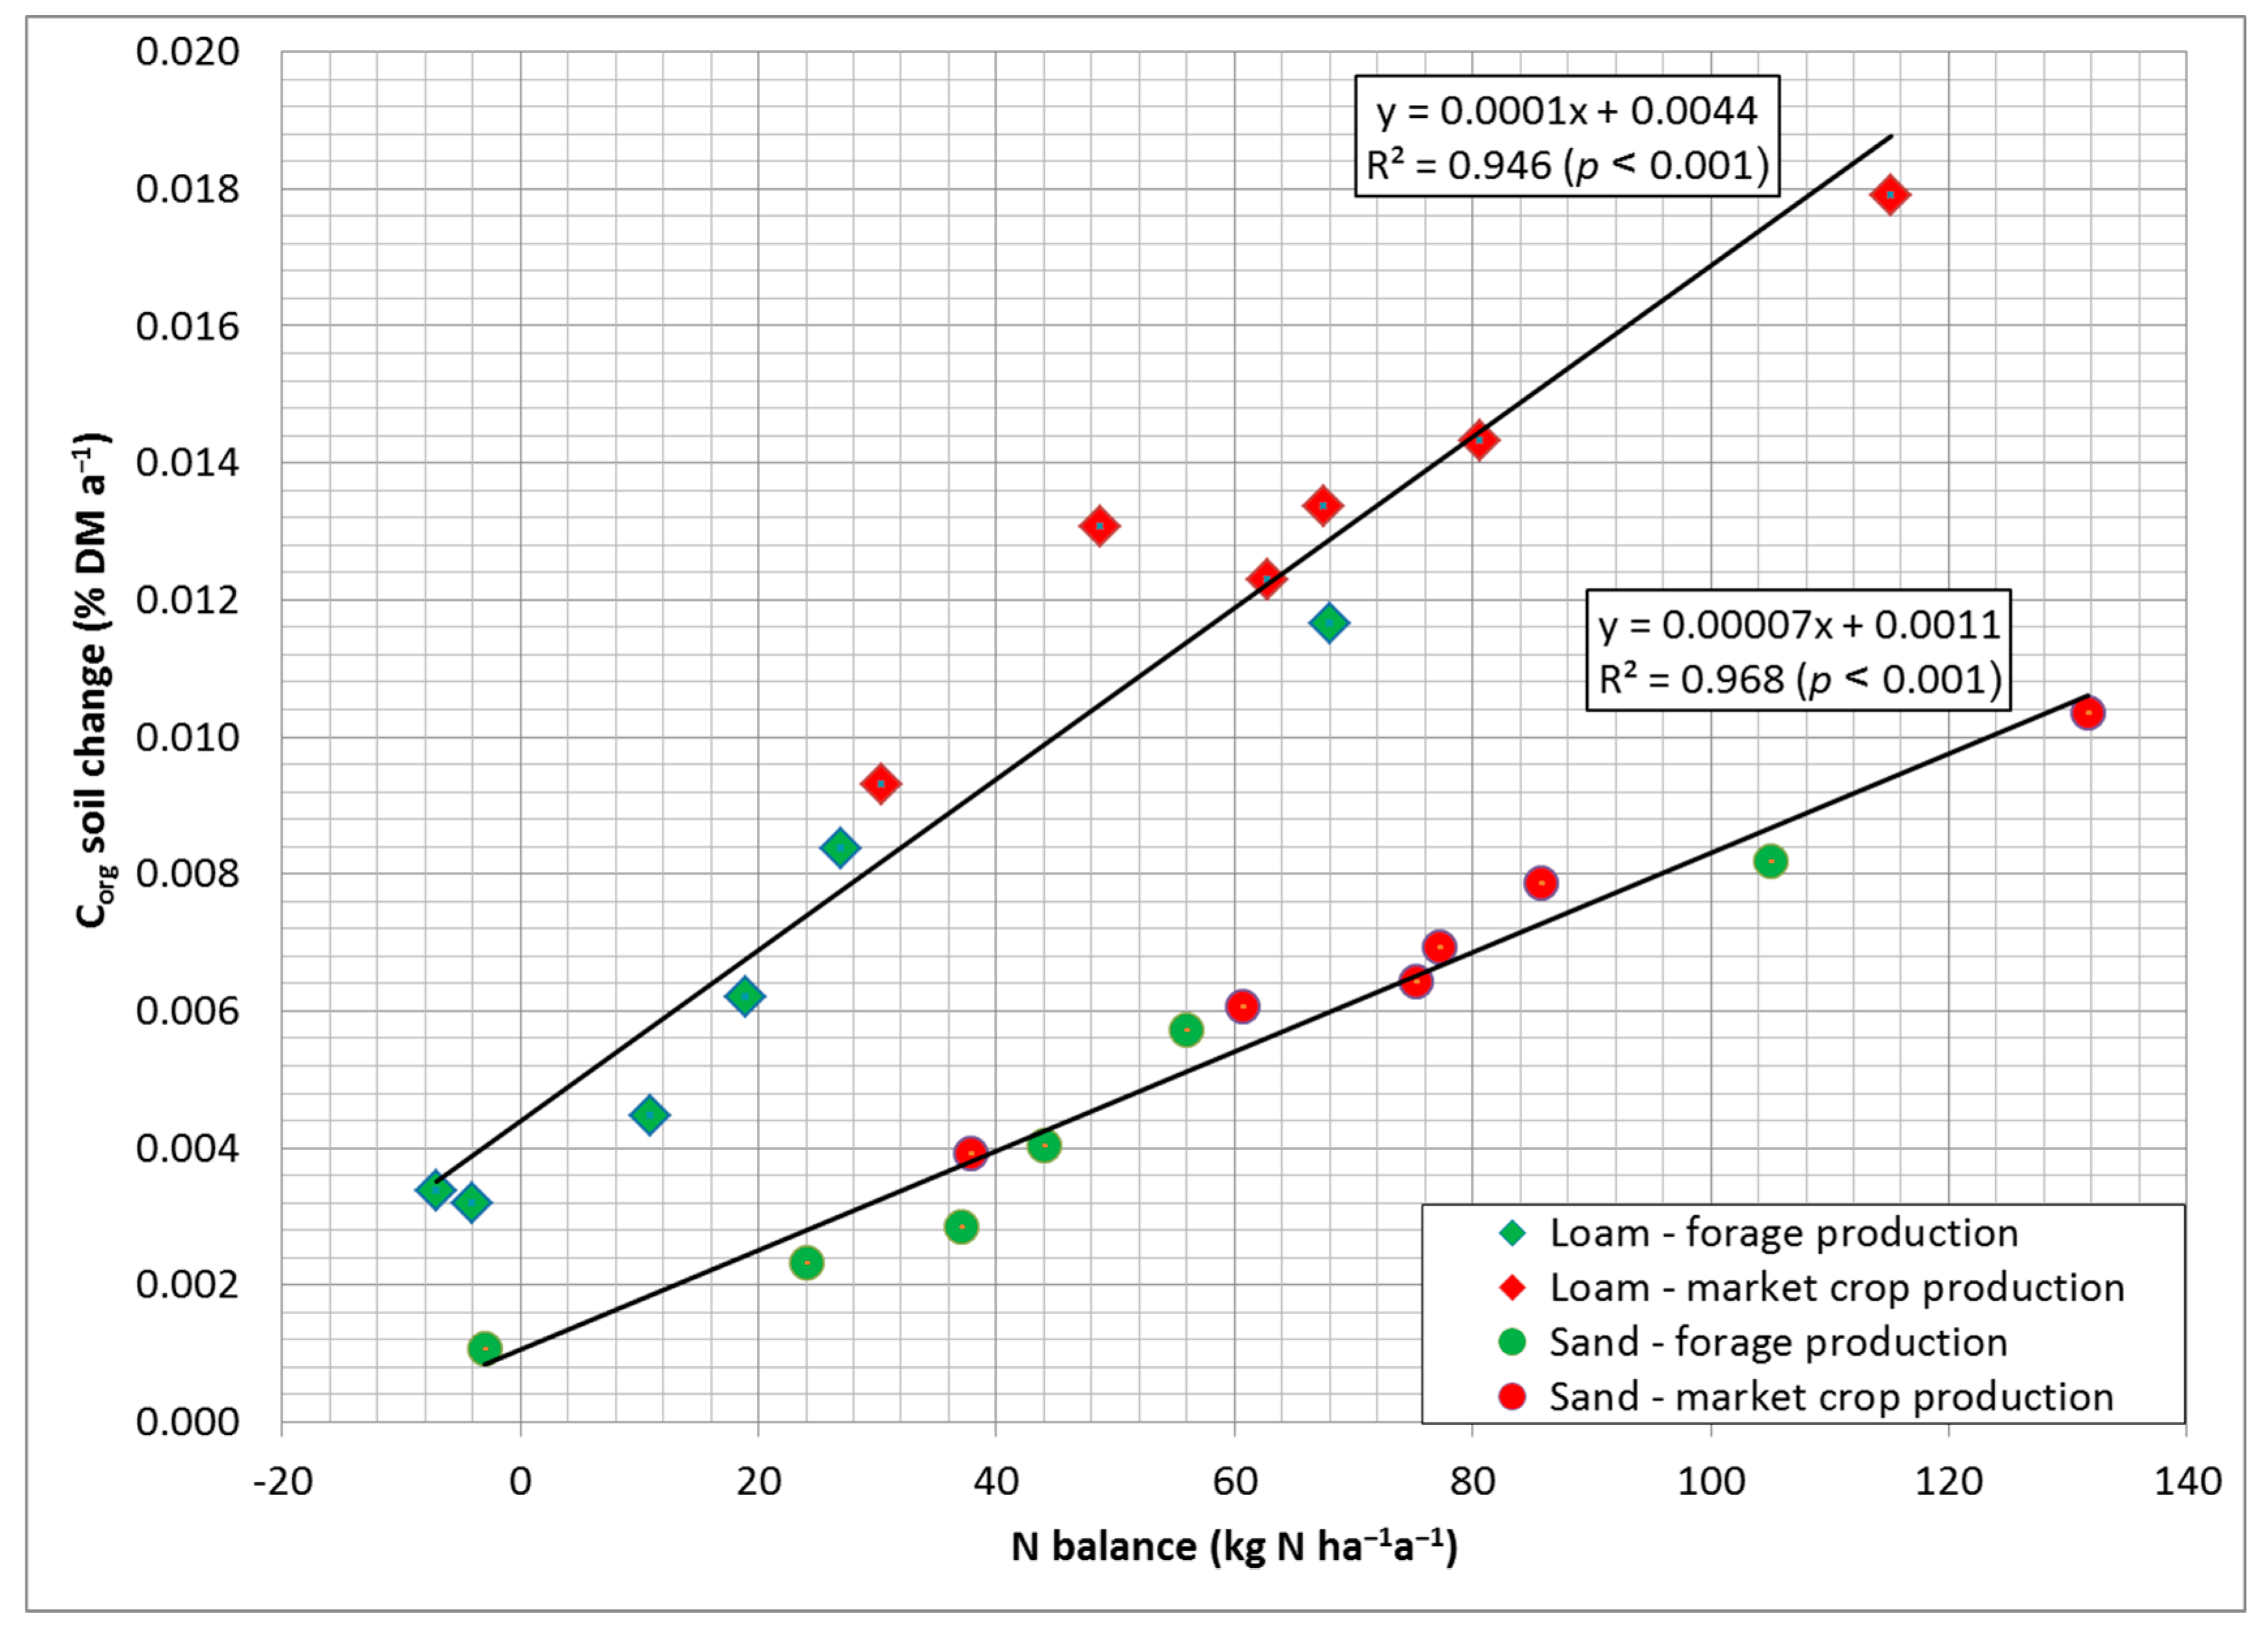
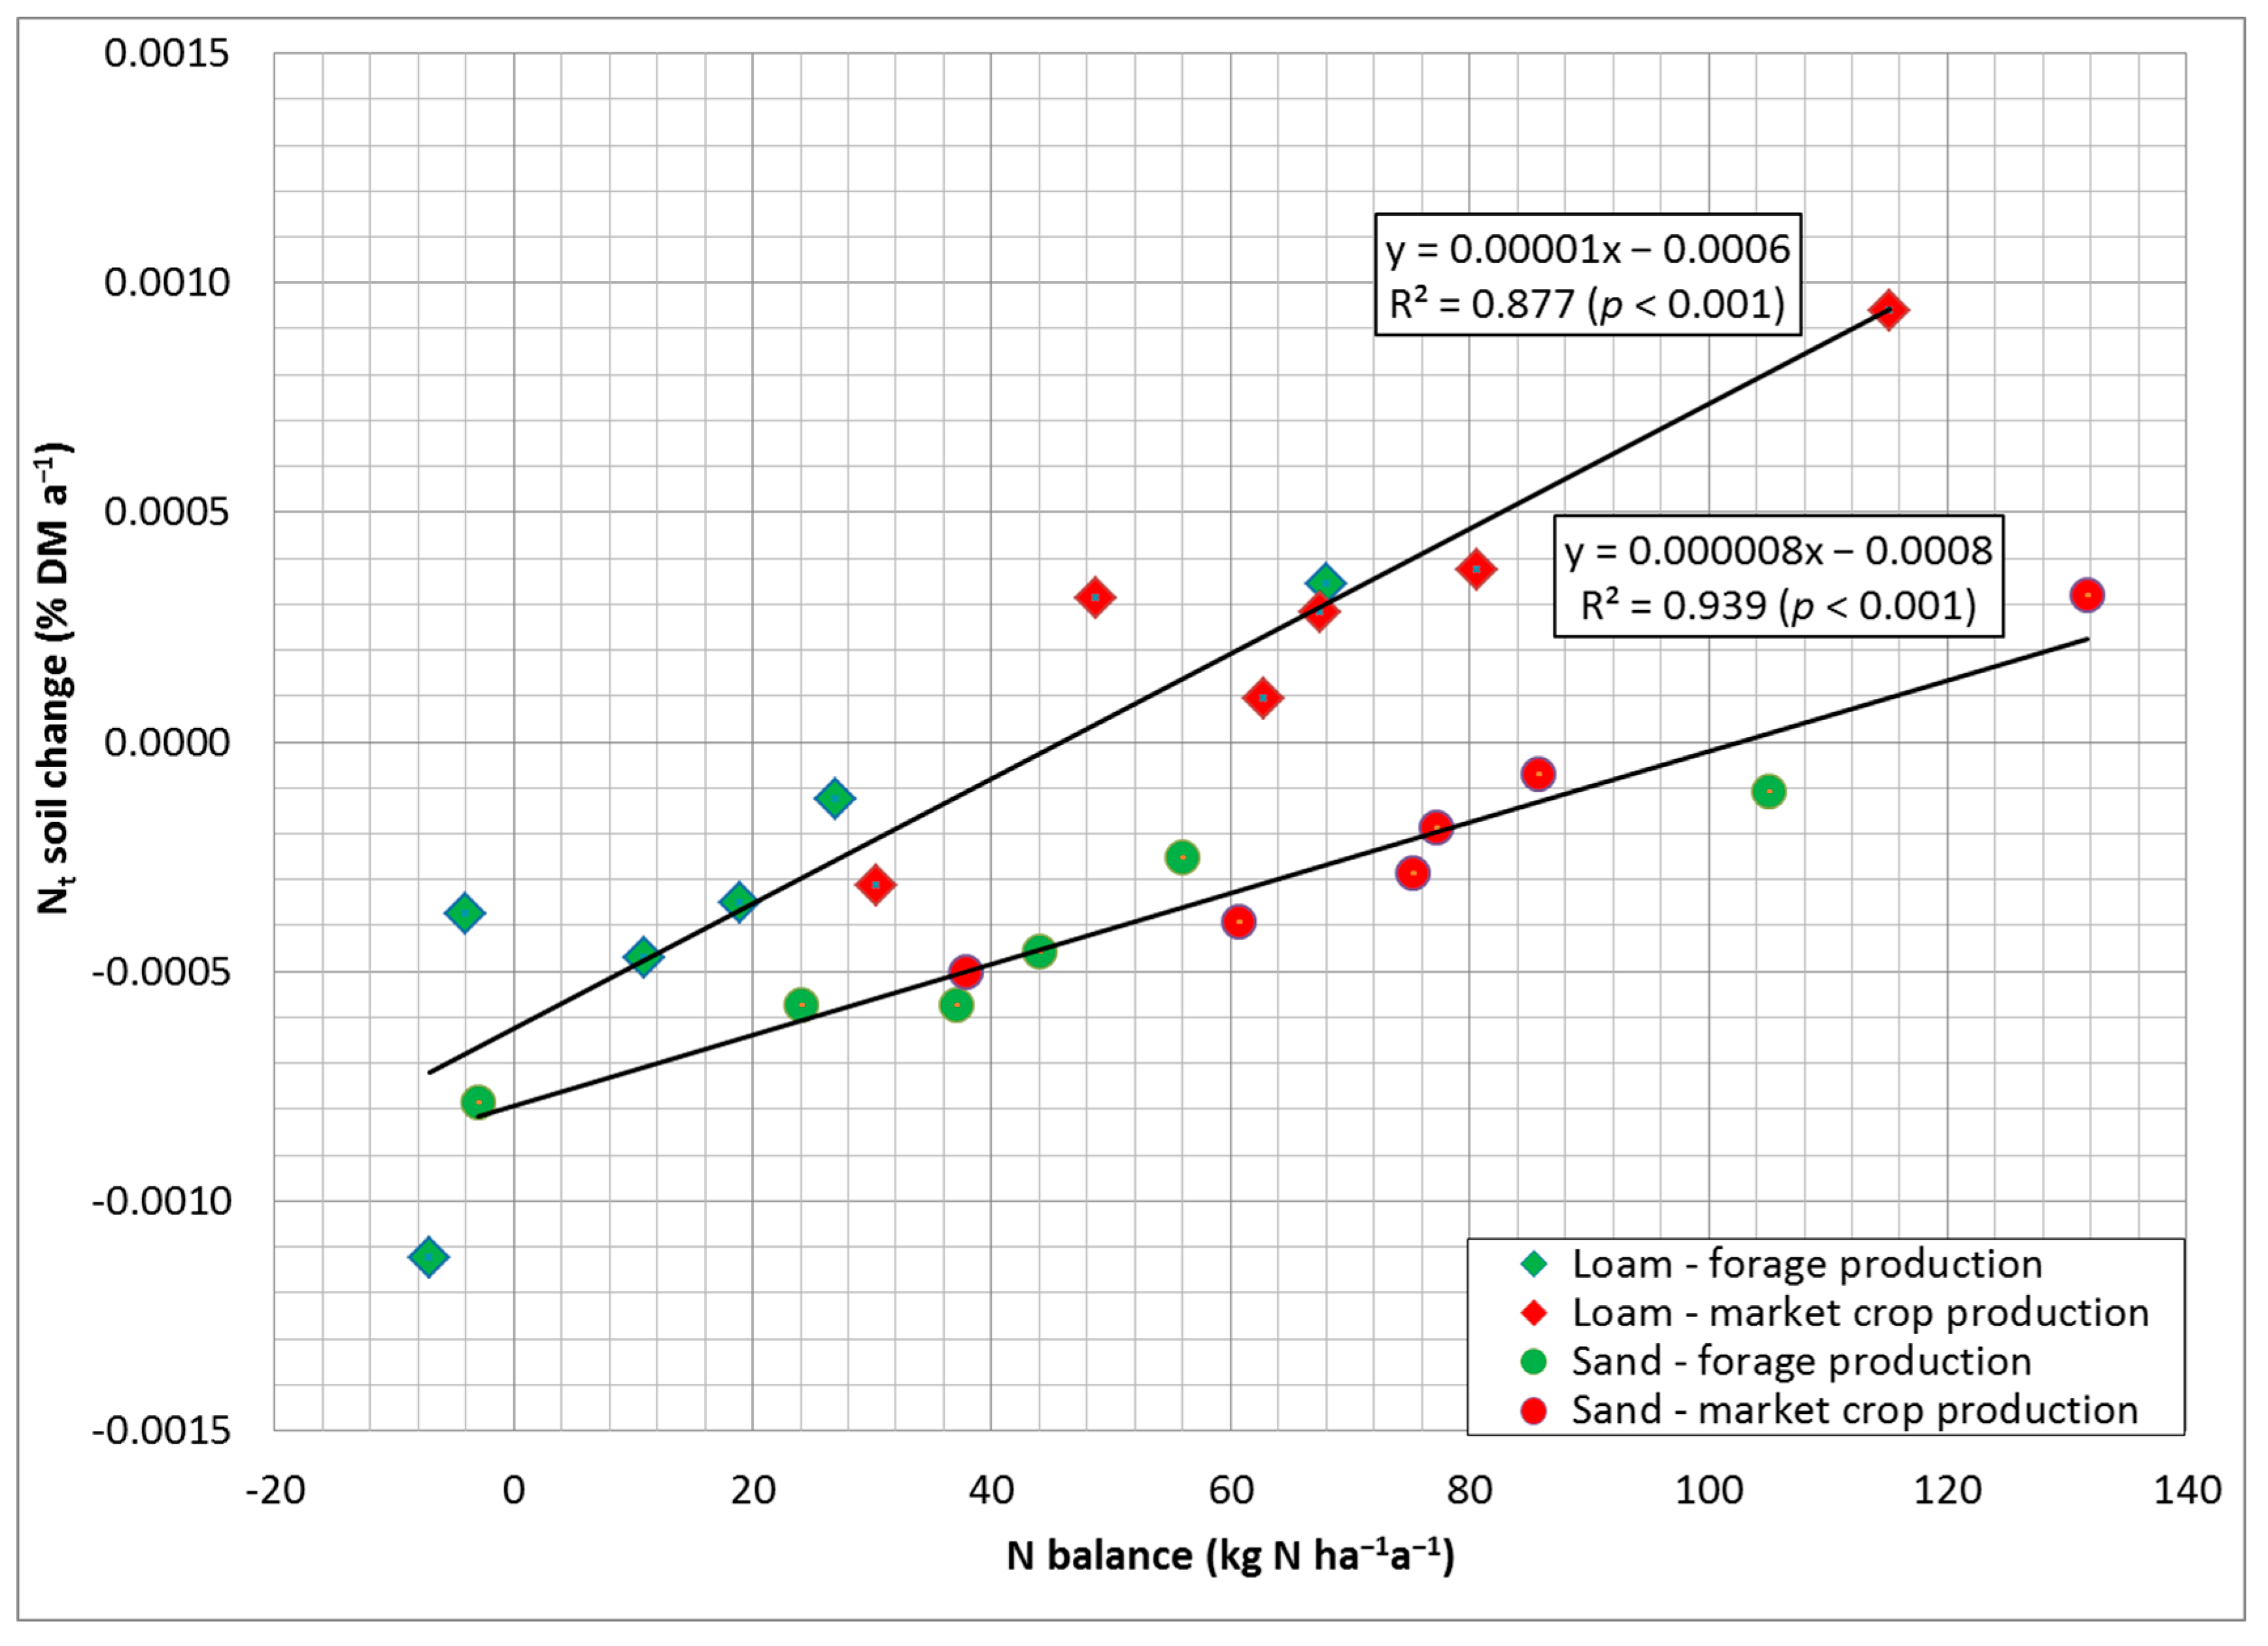
8. Validity of Relations between Nutrient Balances and Development of Soil Fertility Characteristics

It has been known for some time now that relatively close mathematical-statistical relationships exist between the carefully determined nutrient balances and the temporal change of certain soil fertility parameters [19,40,120]. If the recycled nutrient fraction, after the repeated mulching of clover-grass growths, is correctly accounted for in the nutrient balances, then, depending on the soil type, largely linear relationships exist between the determined nutrient balances in forage growing and market crop systems of organic agriculture and the annual change in these soil characteristics.
As a result of increasing N balances, a much clearer Corg enrichment and Nt change in the soil can be seen on the loamy soils than on the sandy soils (Figure 3). When analyzed statistically in detail, the only feature that occurs is a slightly curvilinear accumulation of the soil Corg (loam: R2 = 0.958, p < 0.001; sand: R2 = 0.970, p < 0.001, cf. Figure 3), whereby a lower supply leads to a slightly greater Corg change than a high supply. This rising Corg turnover, as a result of increasing organic material supply, could be generally demonstrated in evaluation work of results from long-term experiments for different organic fertilizer types [121,122].
While in the course of the trials there was an increase in Corg from the beginning onwards, this is not true for the Nt content in the soil. In accordance with the often-intensive conventional pre-cultivation, there was a continuous Nt decrease in the soil over a wide N balance range in the trials, as is also known from other studies and from organic practice. An enrichment of the Nt reserves of the soil only takes place at N balances around 50 kg ha−1 on loam and 100 kg N ha−1 upwards on the sandy site.
Depending on the soil type, there are also very close statistical relationships for the basic nutrients P and K (and Mg, without representation) between the respective nutrient balances and the annual soil change of these nutrients (Figure 4). On the loamy soils, P balances must not fall below about −3 kg to −5 kg P ha−1 to prevent decreasing DL-soluble P levels in the topsoil. On the more permeable sandy soils, positive values of at least between 2–4 kg P ha−1 upwards are required in order to keep the P concentrations at the same level or to raise them over the years. Due to the high capacity for resupply, the DL-soluble K concentrations of the loamy soils only drop when the determined K balances fall below values around 60 kg ha−1. On the sandy soils, in contrast, positive balances around 10 kg K ha−1 are required for the soluble K concentrations in the soil to at least remain stable.
In contrast to the soil Corg content and also to the maintenance of the N supply by a sufficiently high cultivation of legumes, according to these results, it is much more difficult under the conditions of organic farming to ensure an optimal supply of P, K, and also Mg on the light soils in particular, due to the widespread, often clearly negative, nutrient balances, in order to counteract yield fluctuations and yield losses [11]. Through a wrongly understood ecological nutrient management, on the one hand, an increased cultivation of legumes can even lead to an intensification of the deficiency of basic nutrients. On the other hand, the evaluations have shown that a steady supply of organic fertilizers of well over 1.0 LU ha−1 to about 2.0 LU ha−1 year−1 is necessary to ensure a sufficiently high supply and to prevent the soluble concentrations of basic nutrients in the soil from declining further.

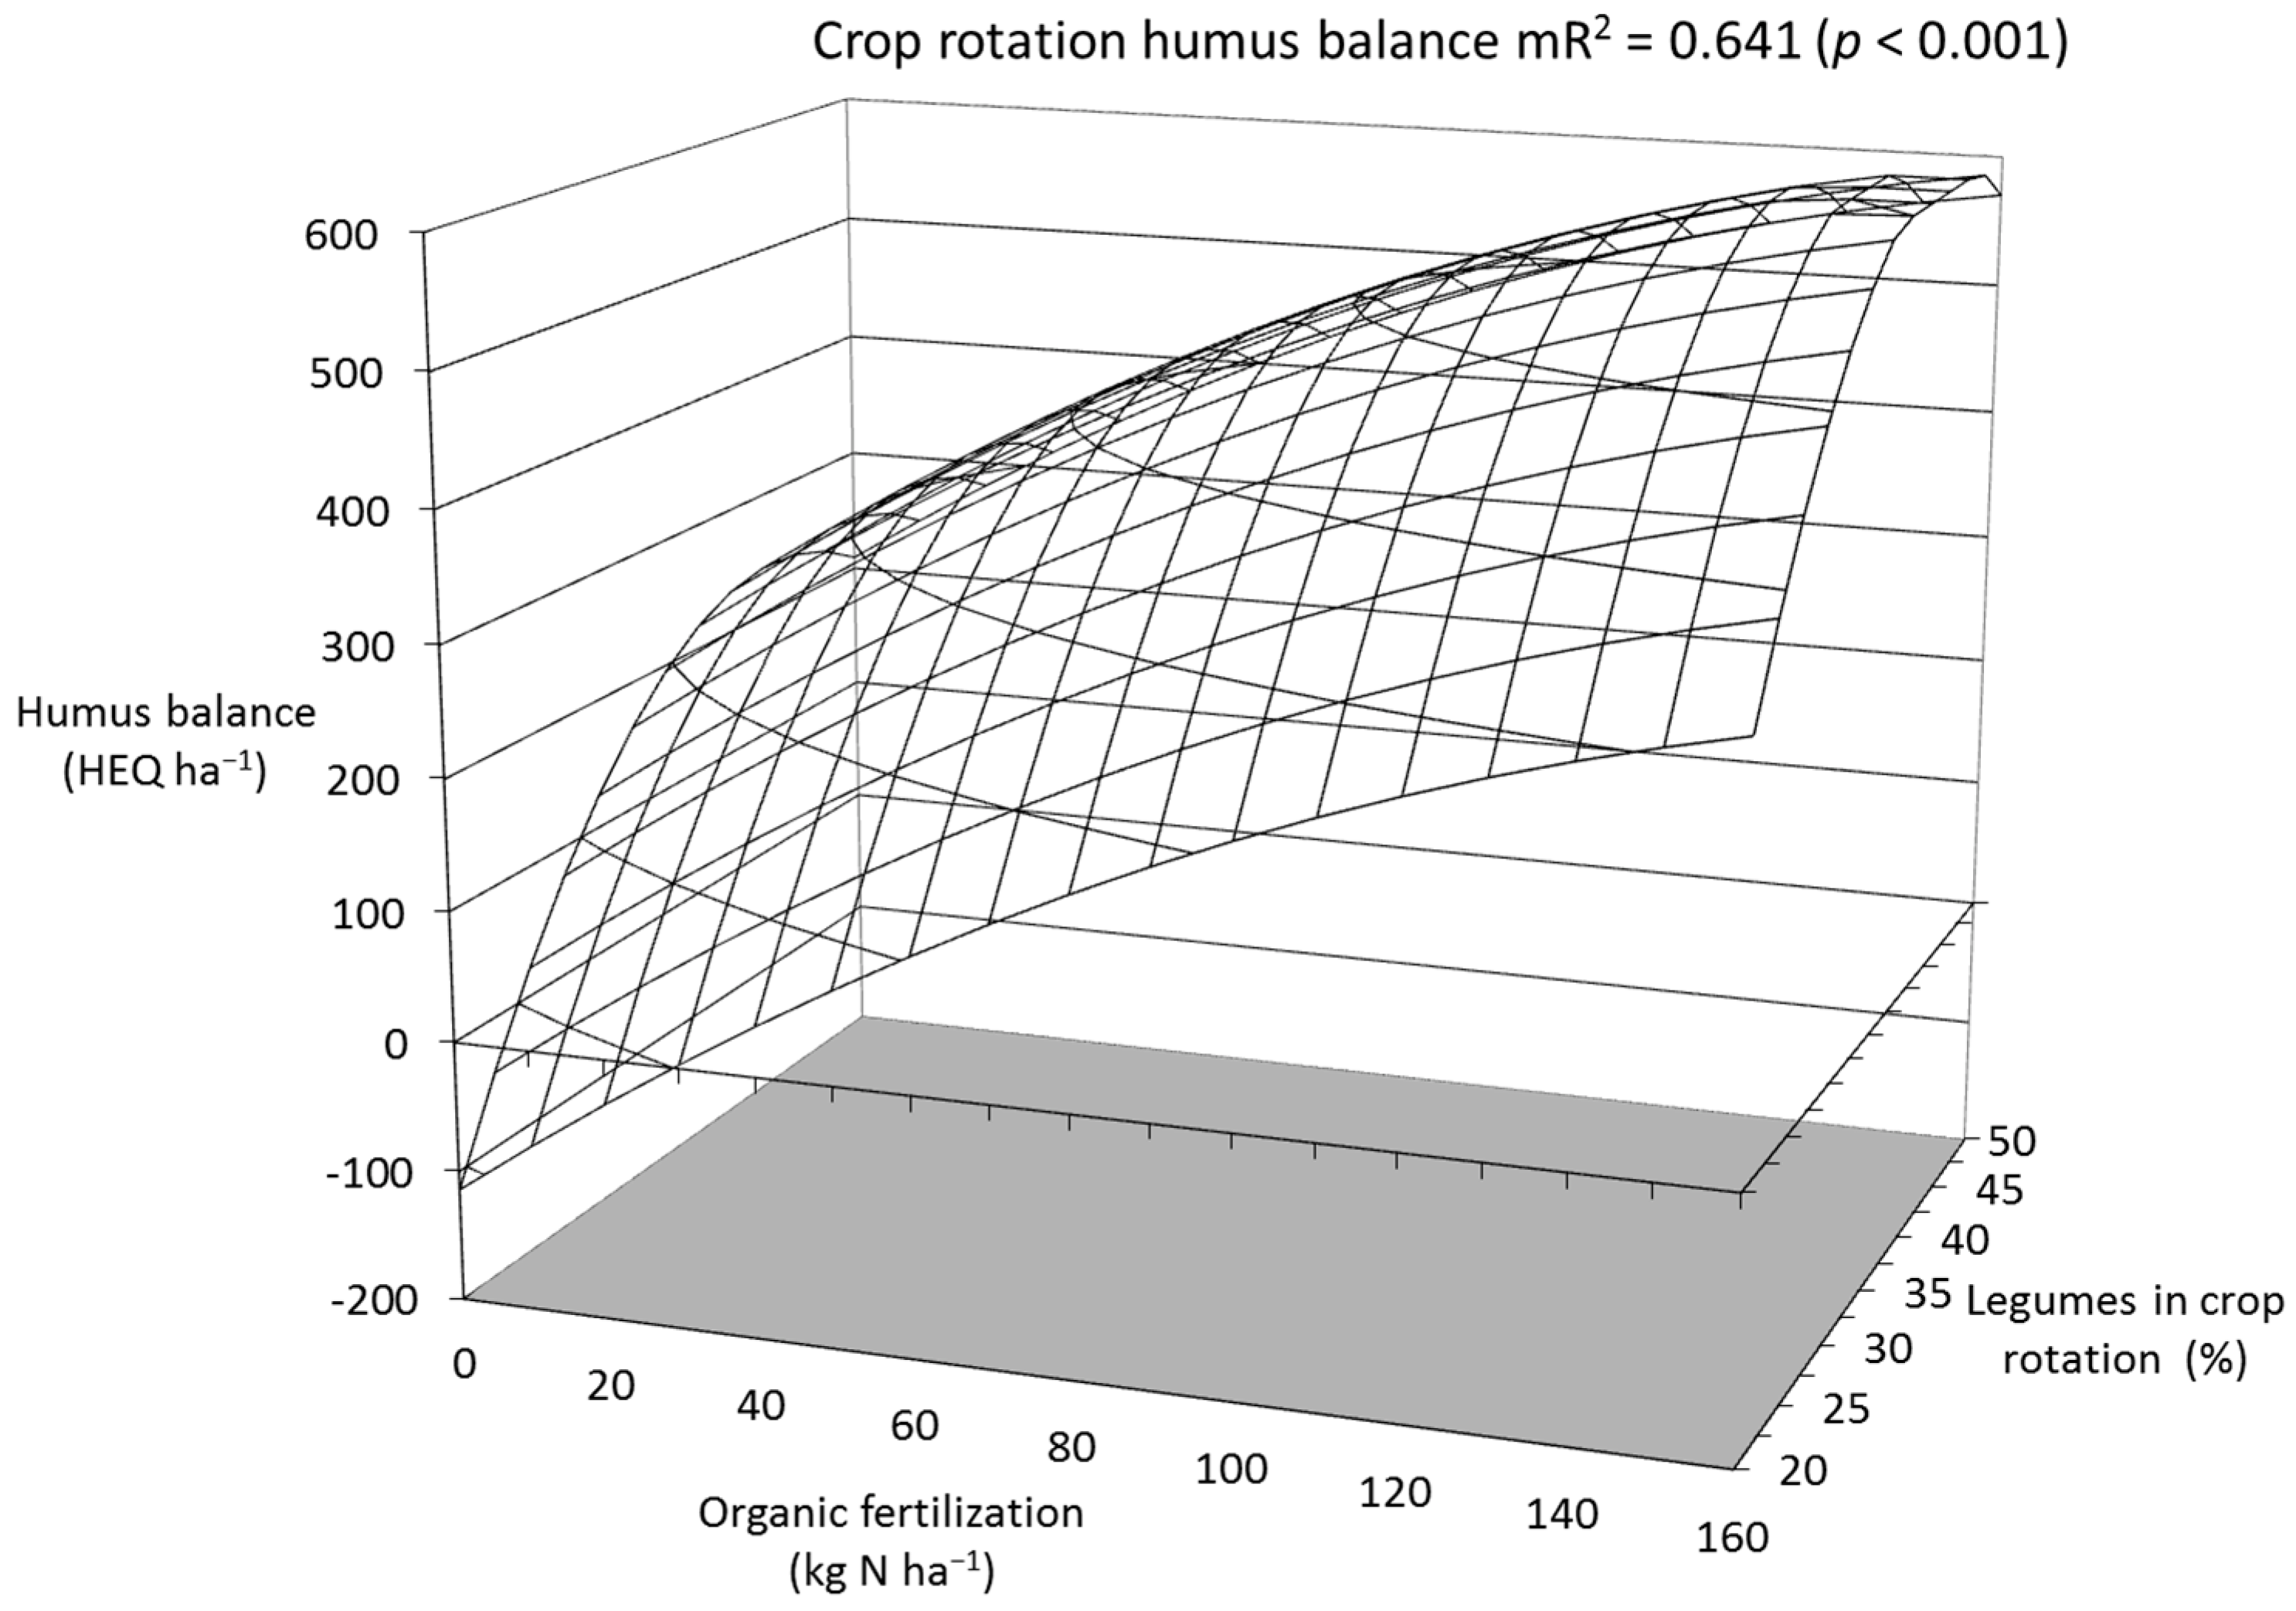
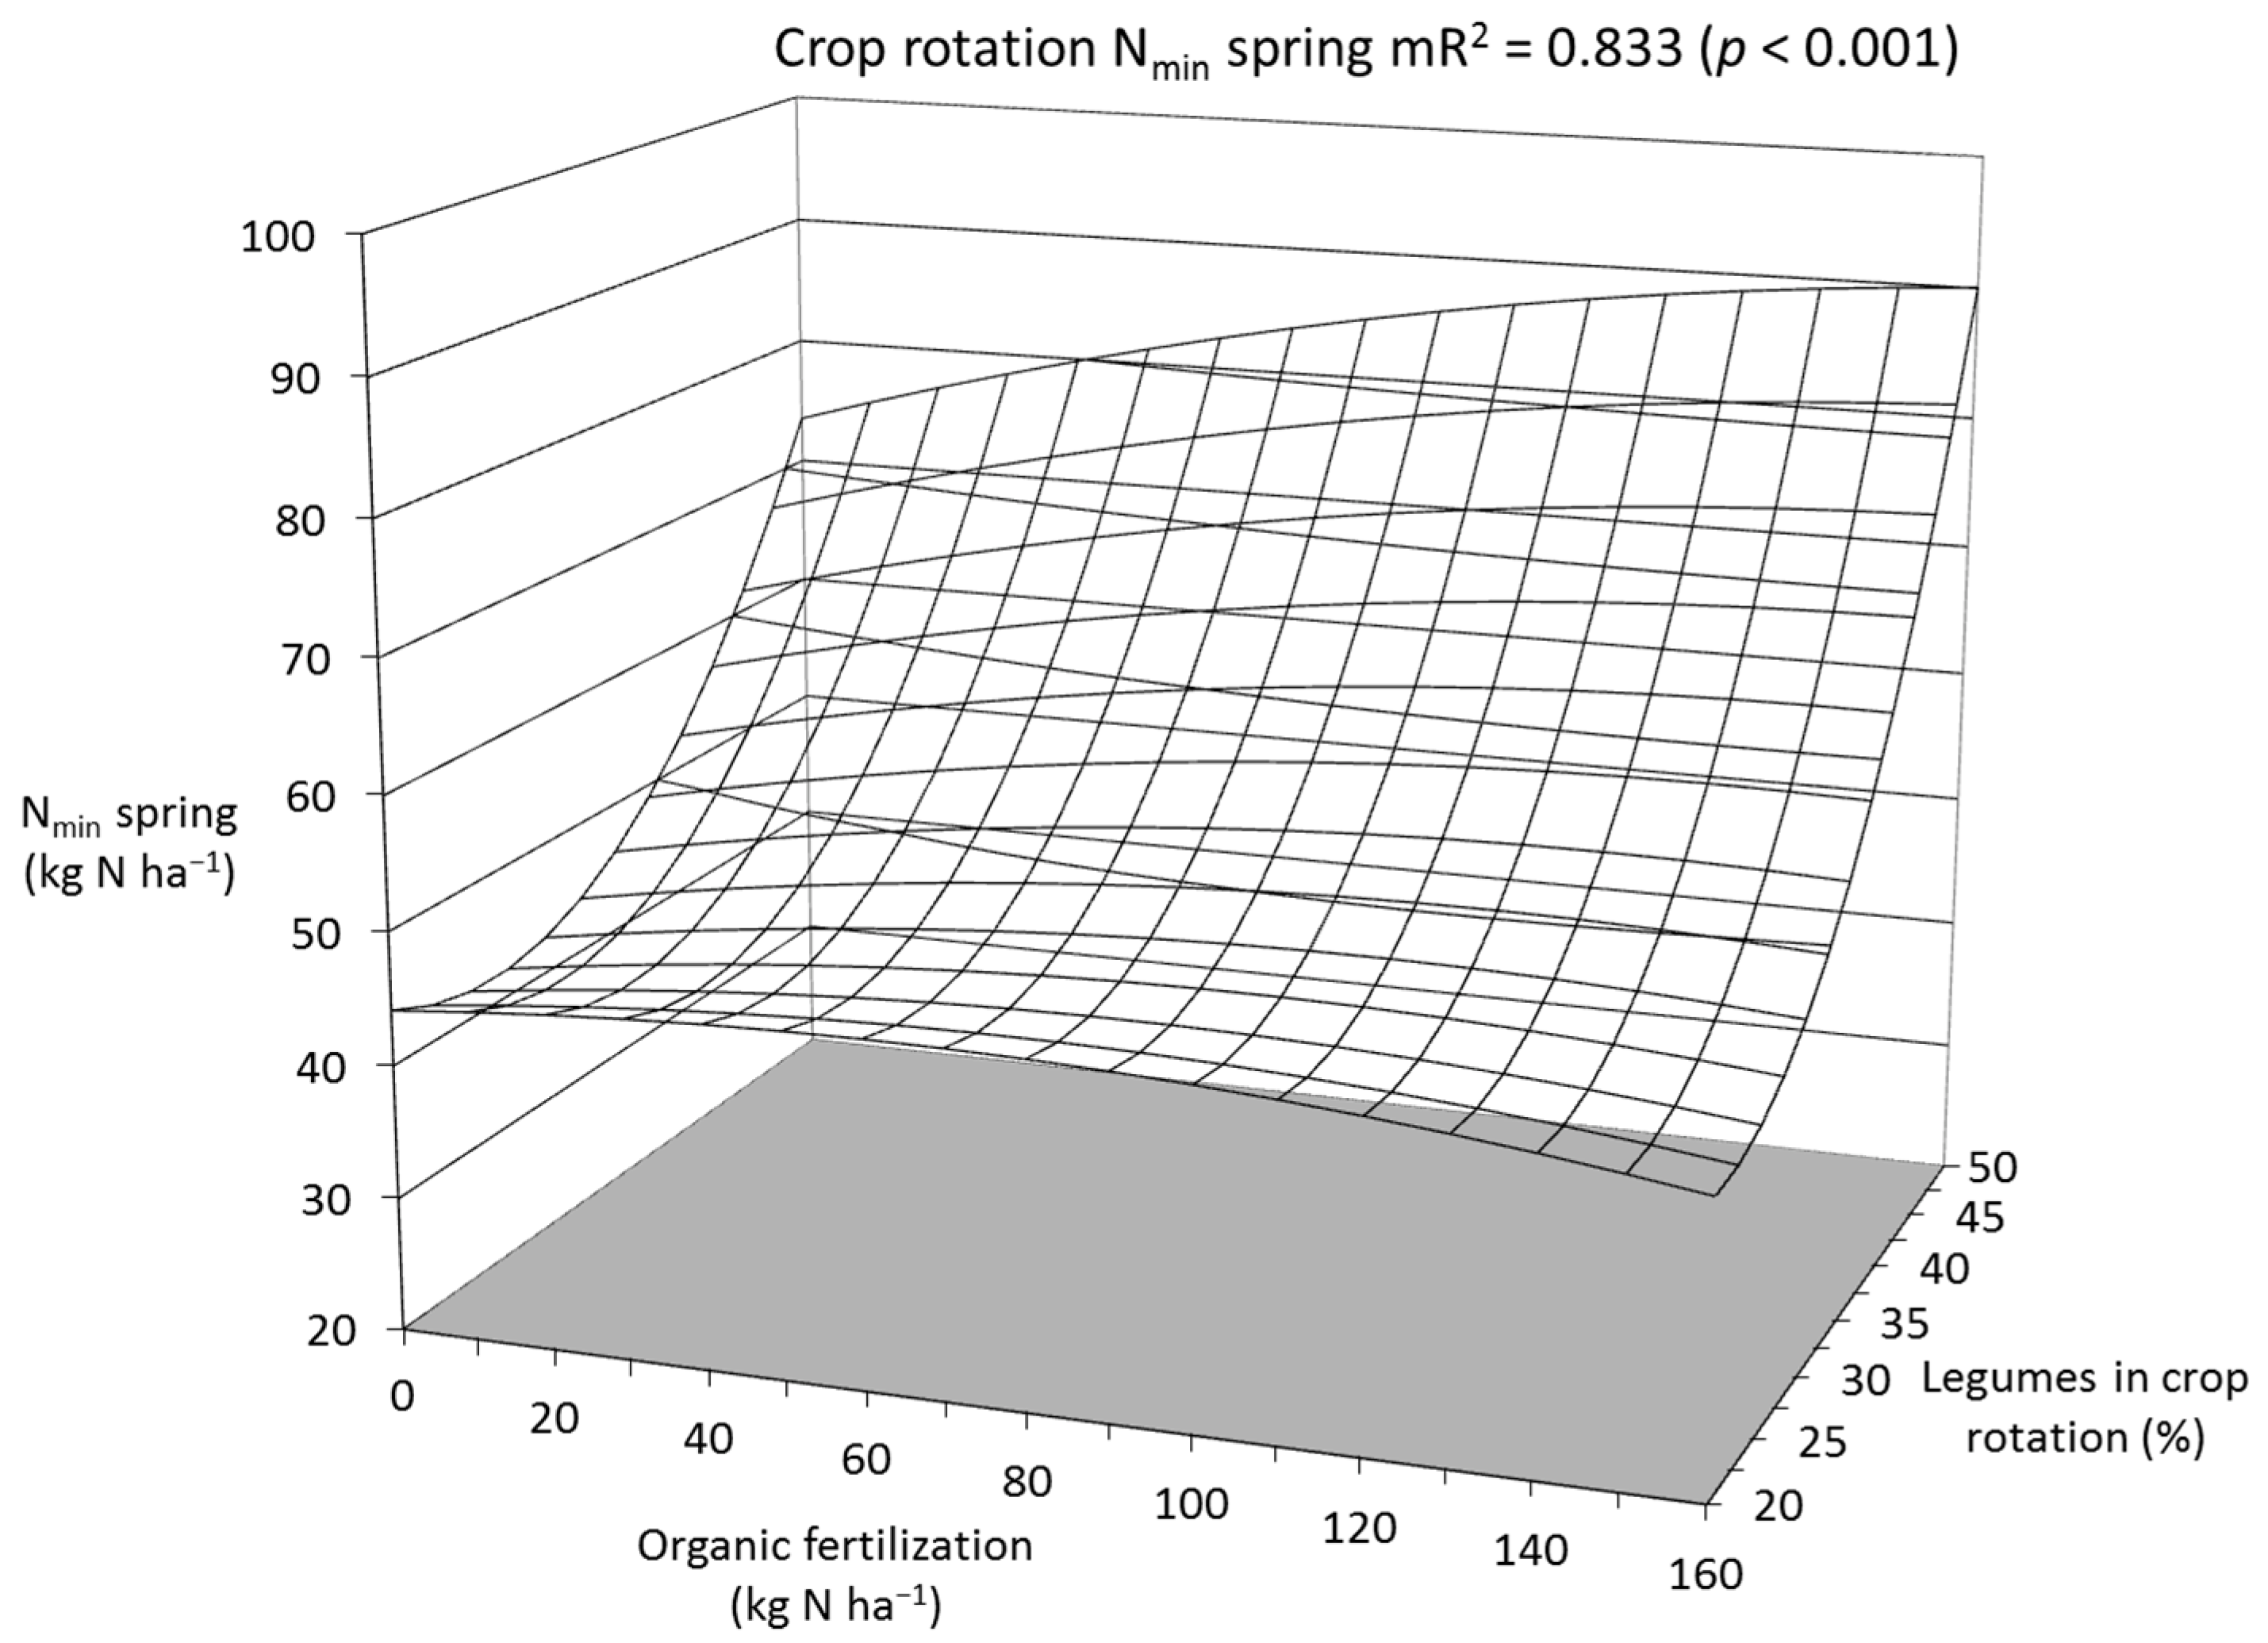
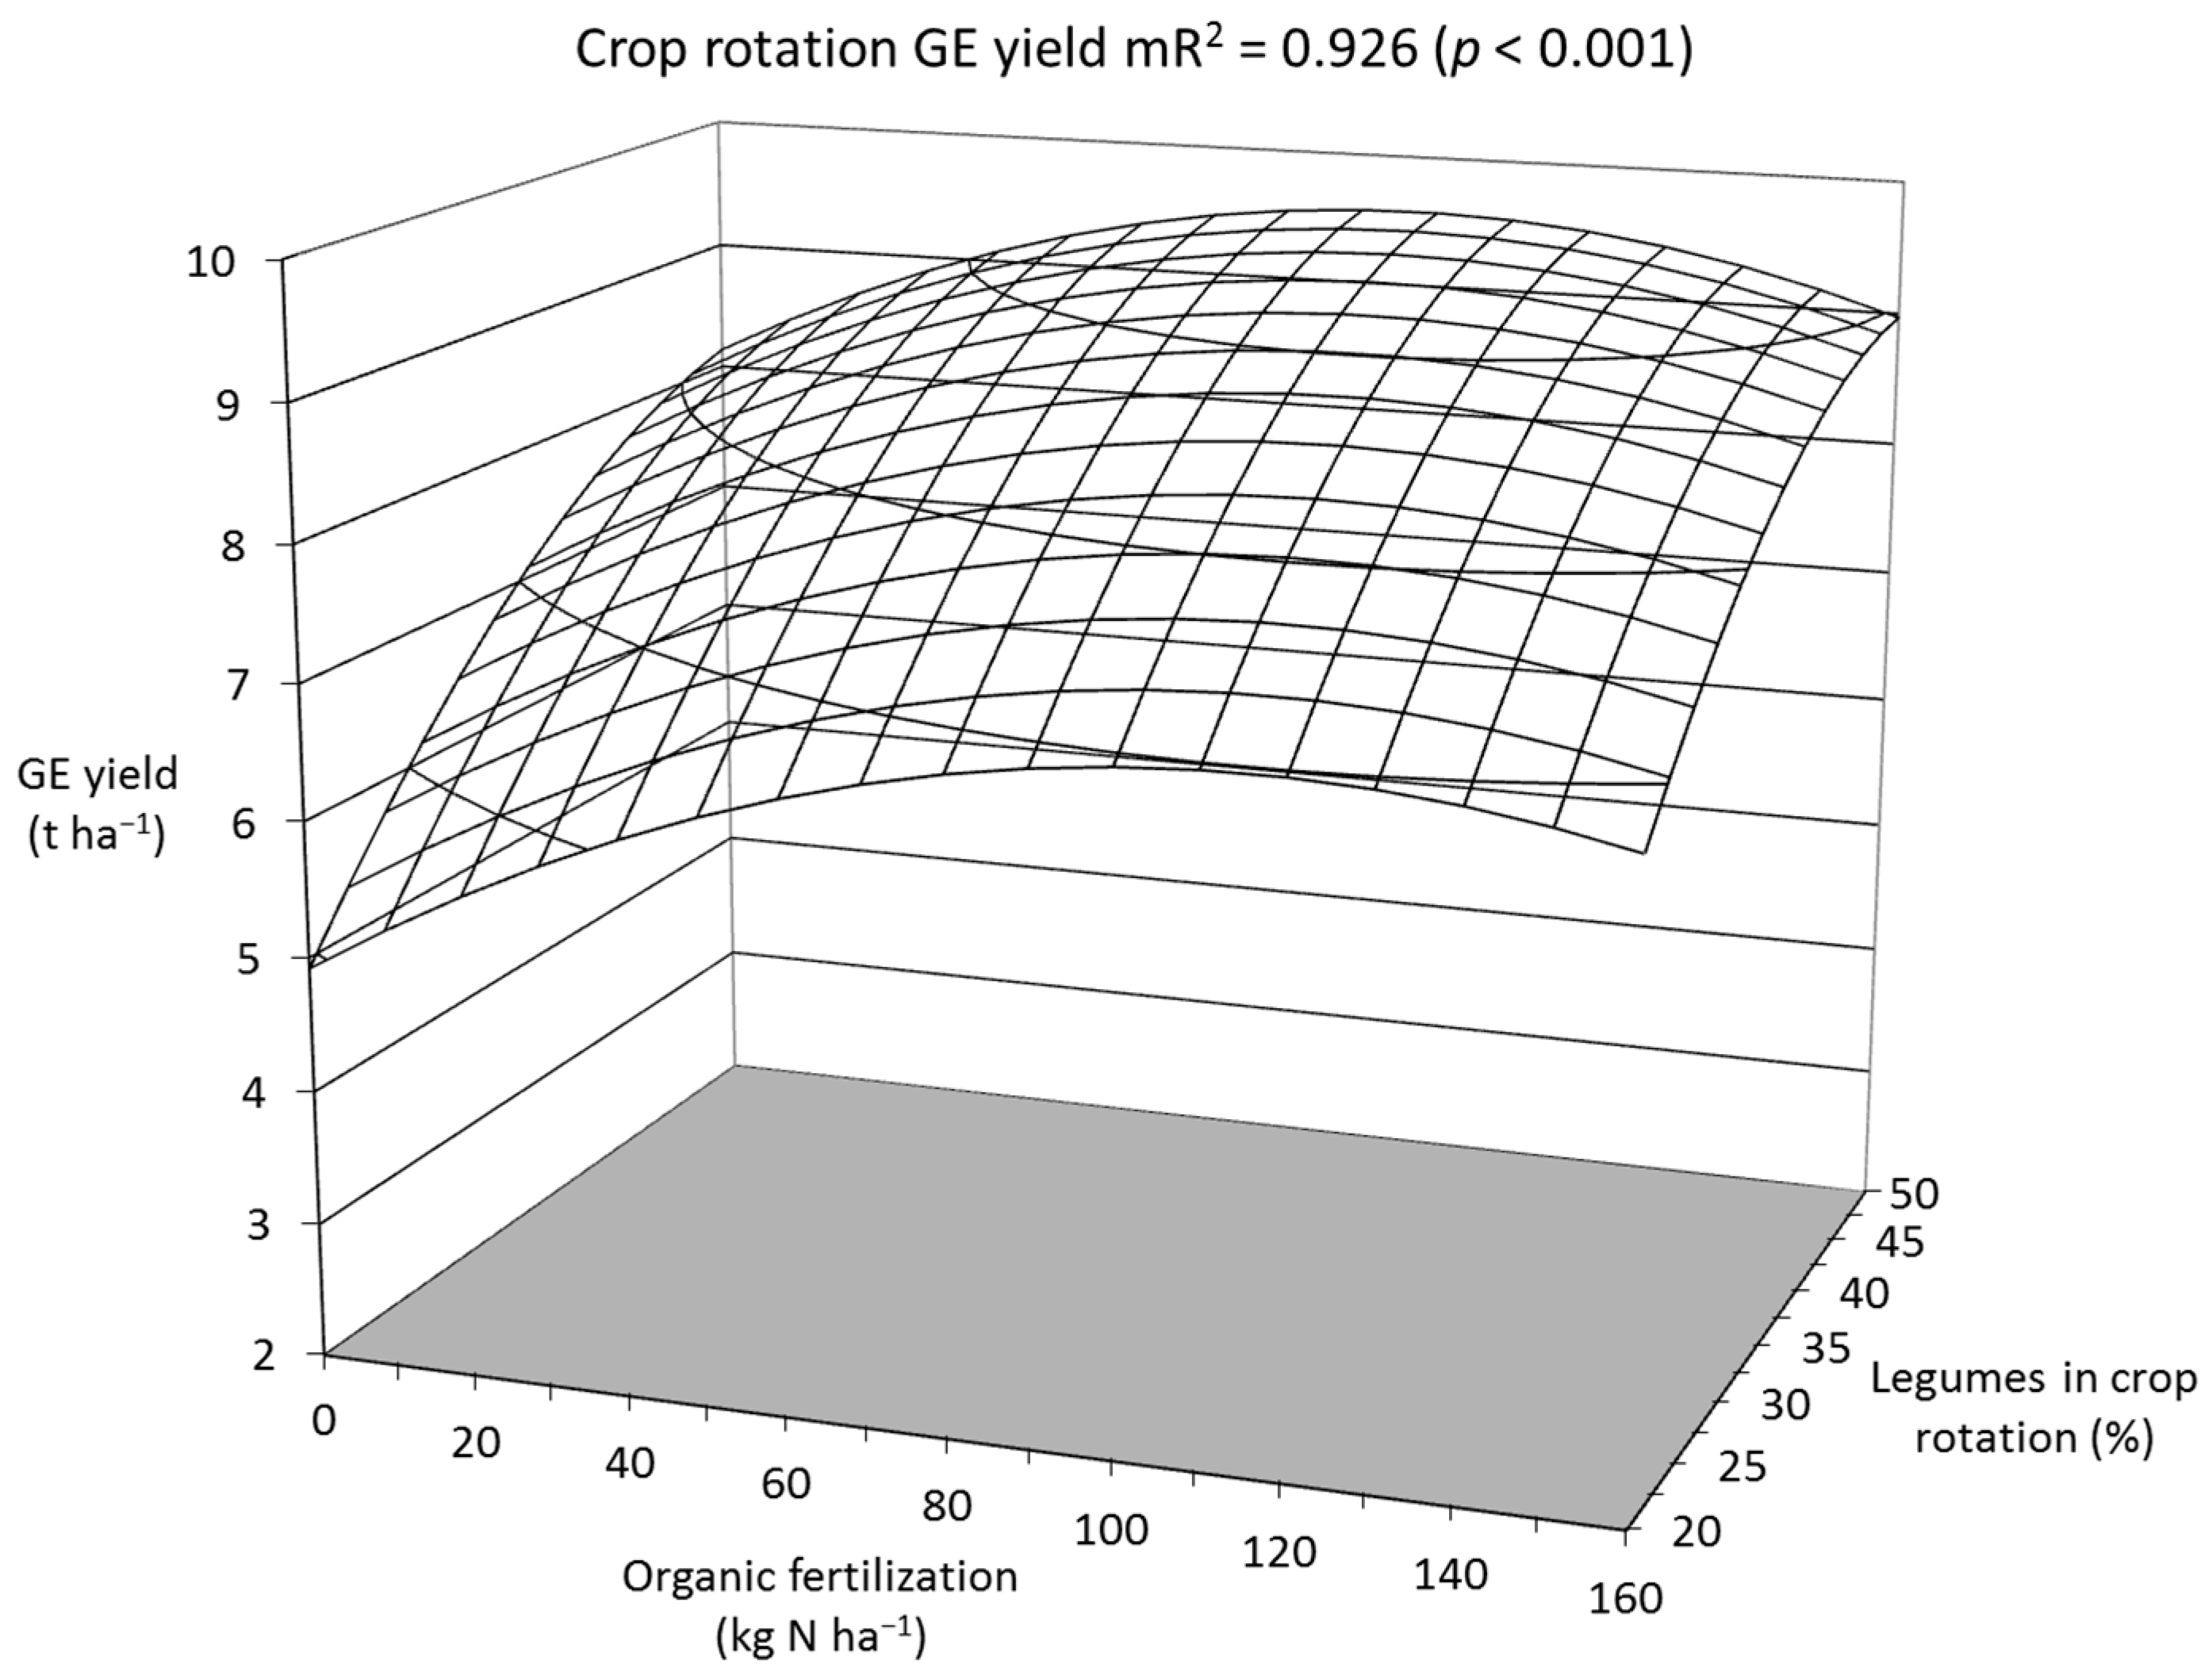
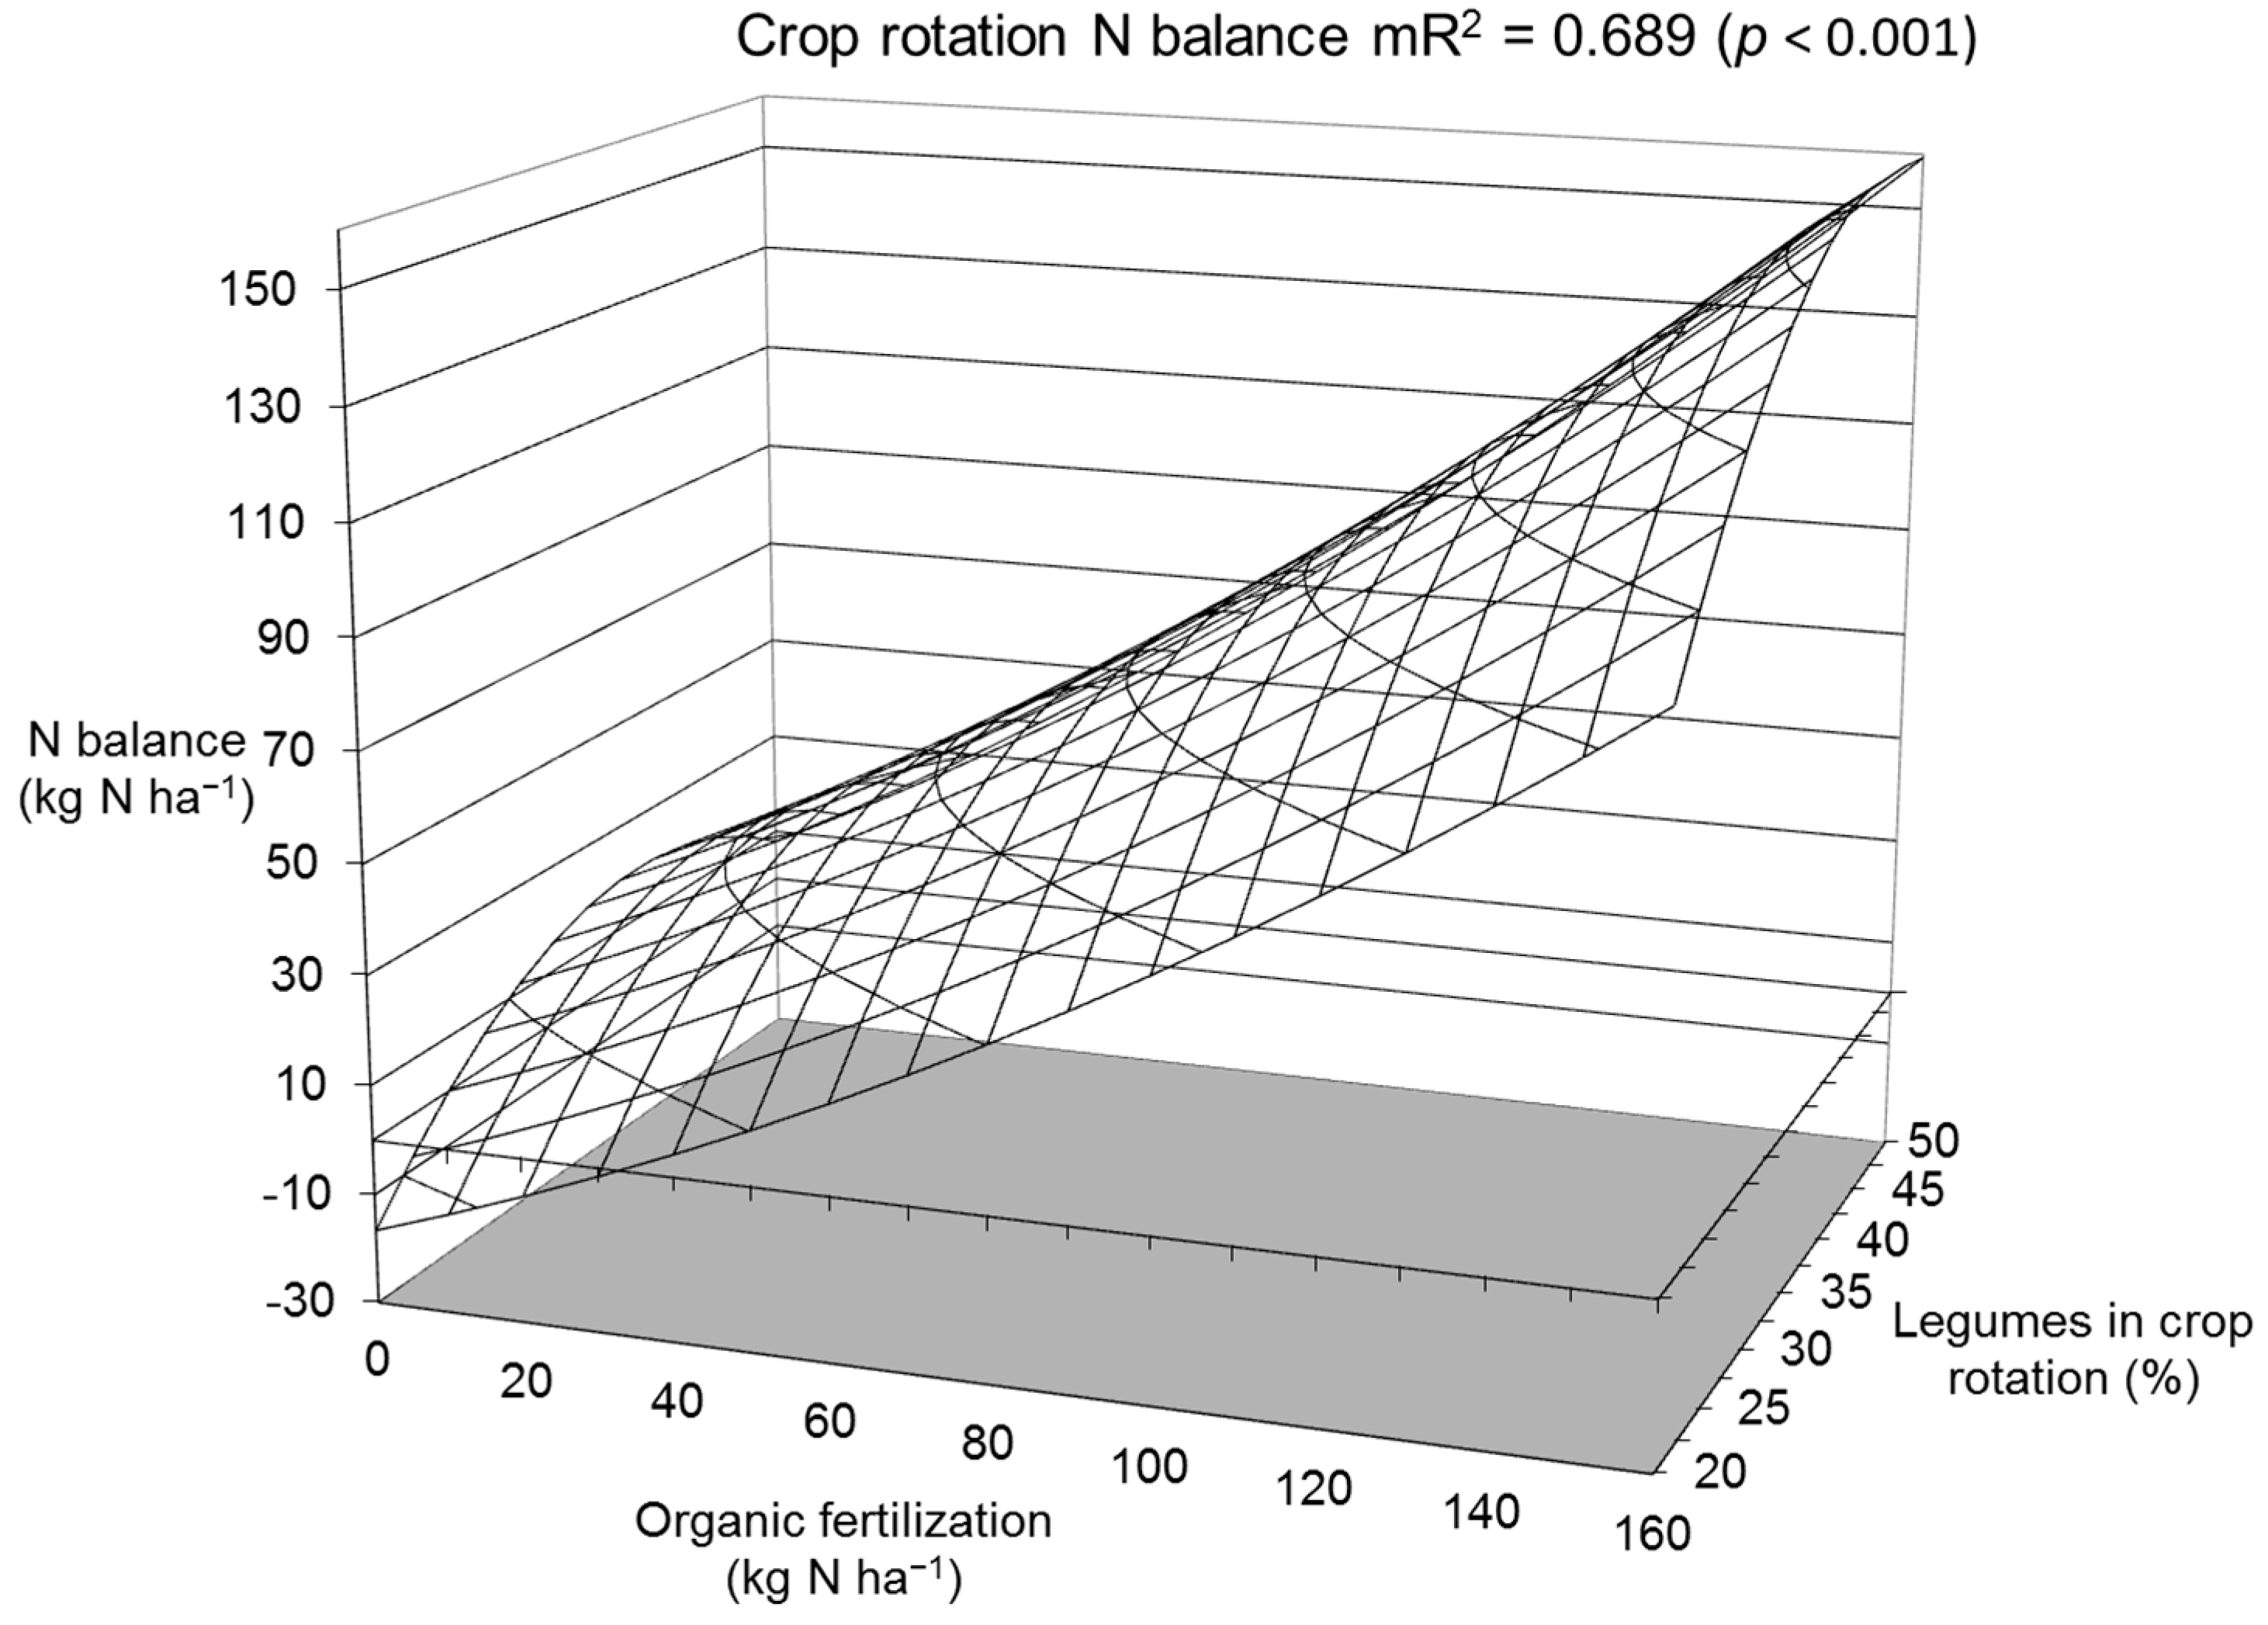
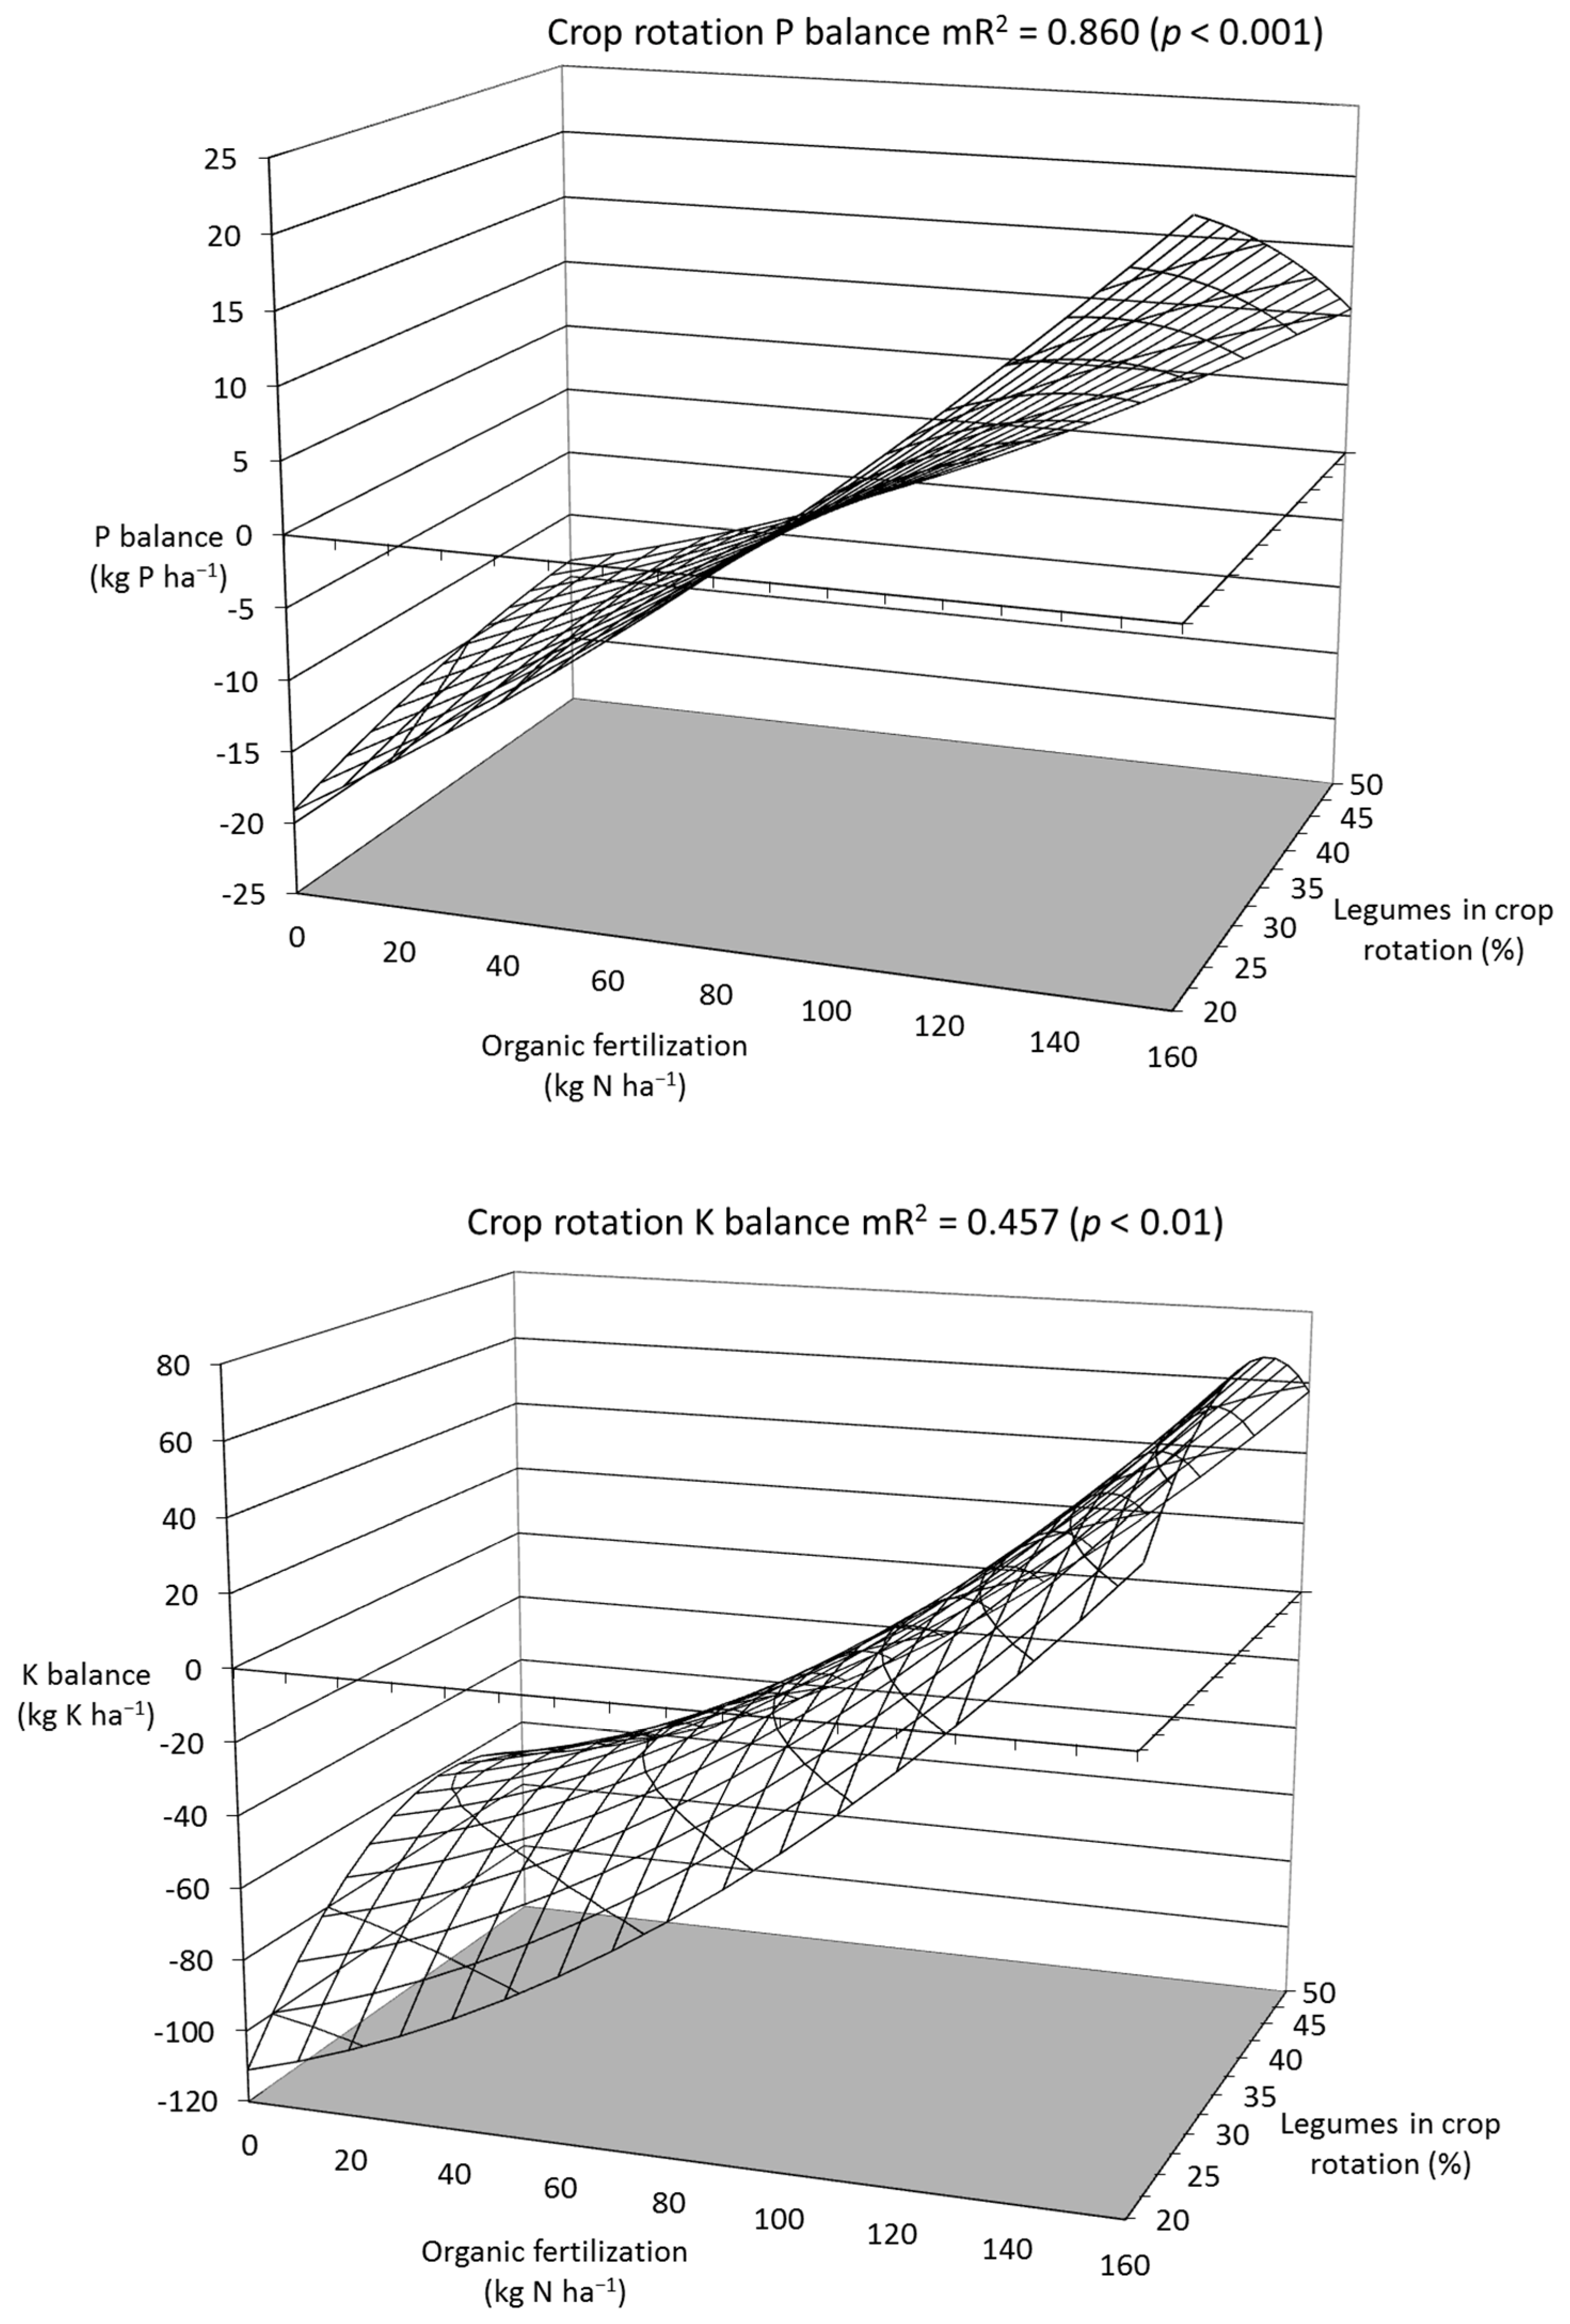
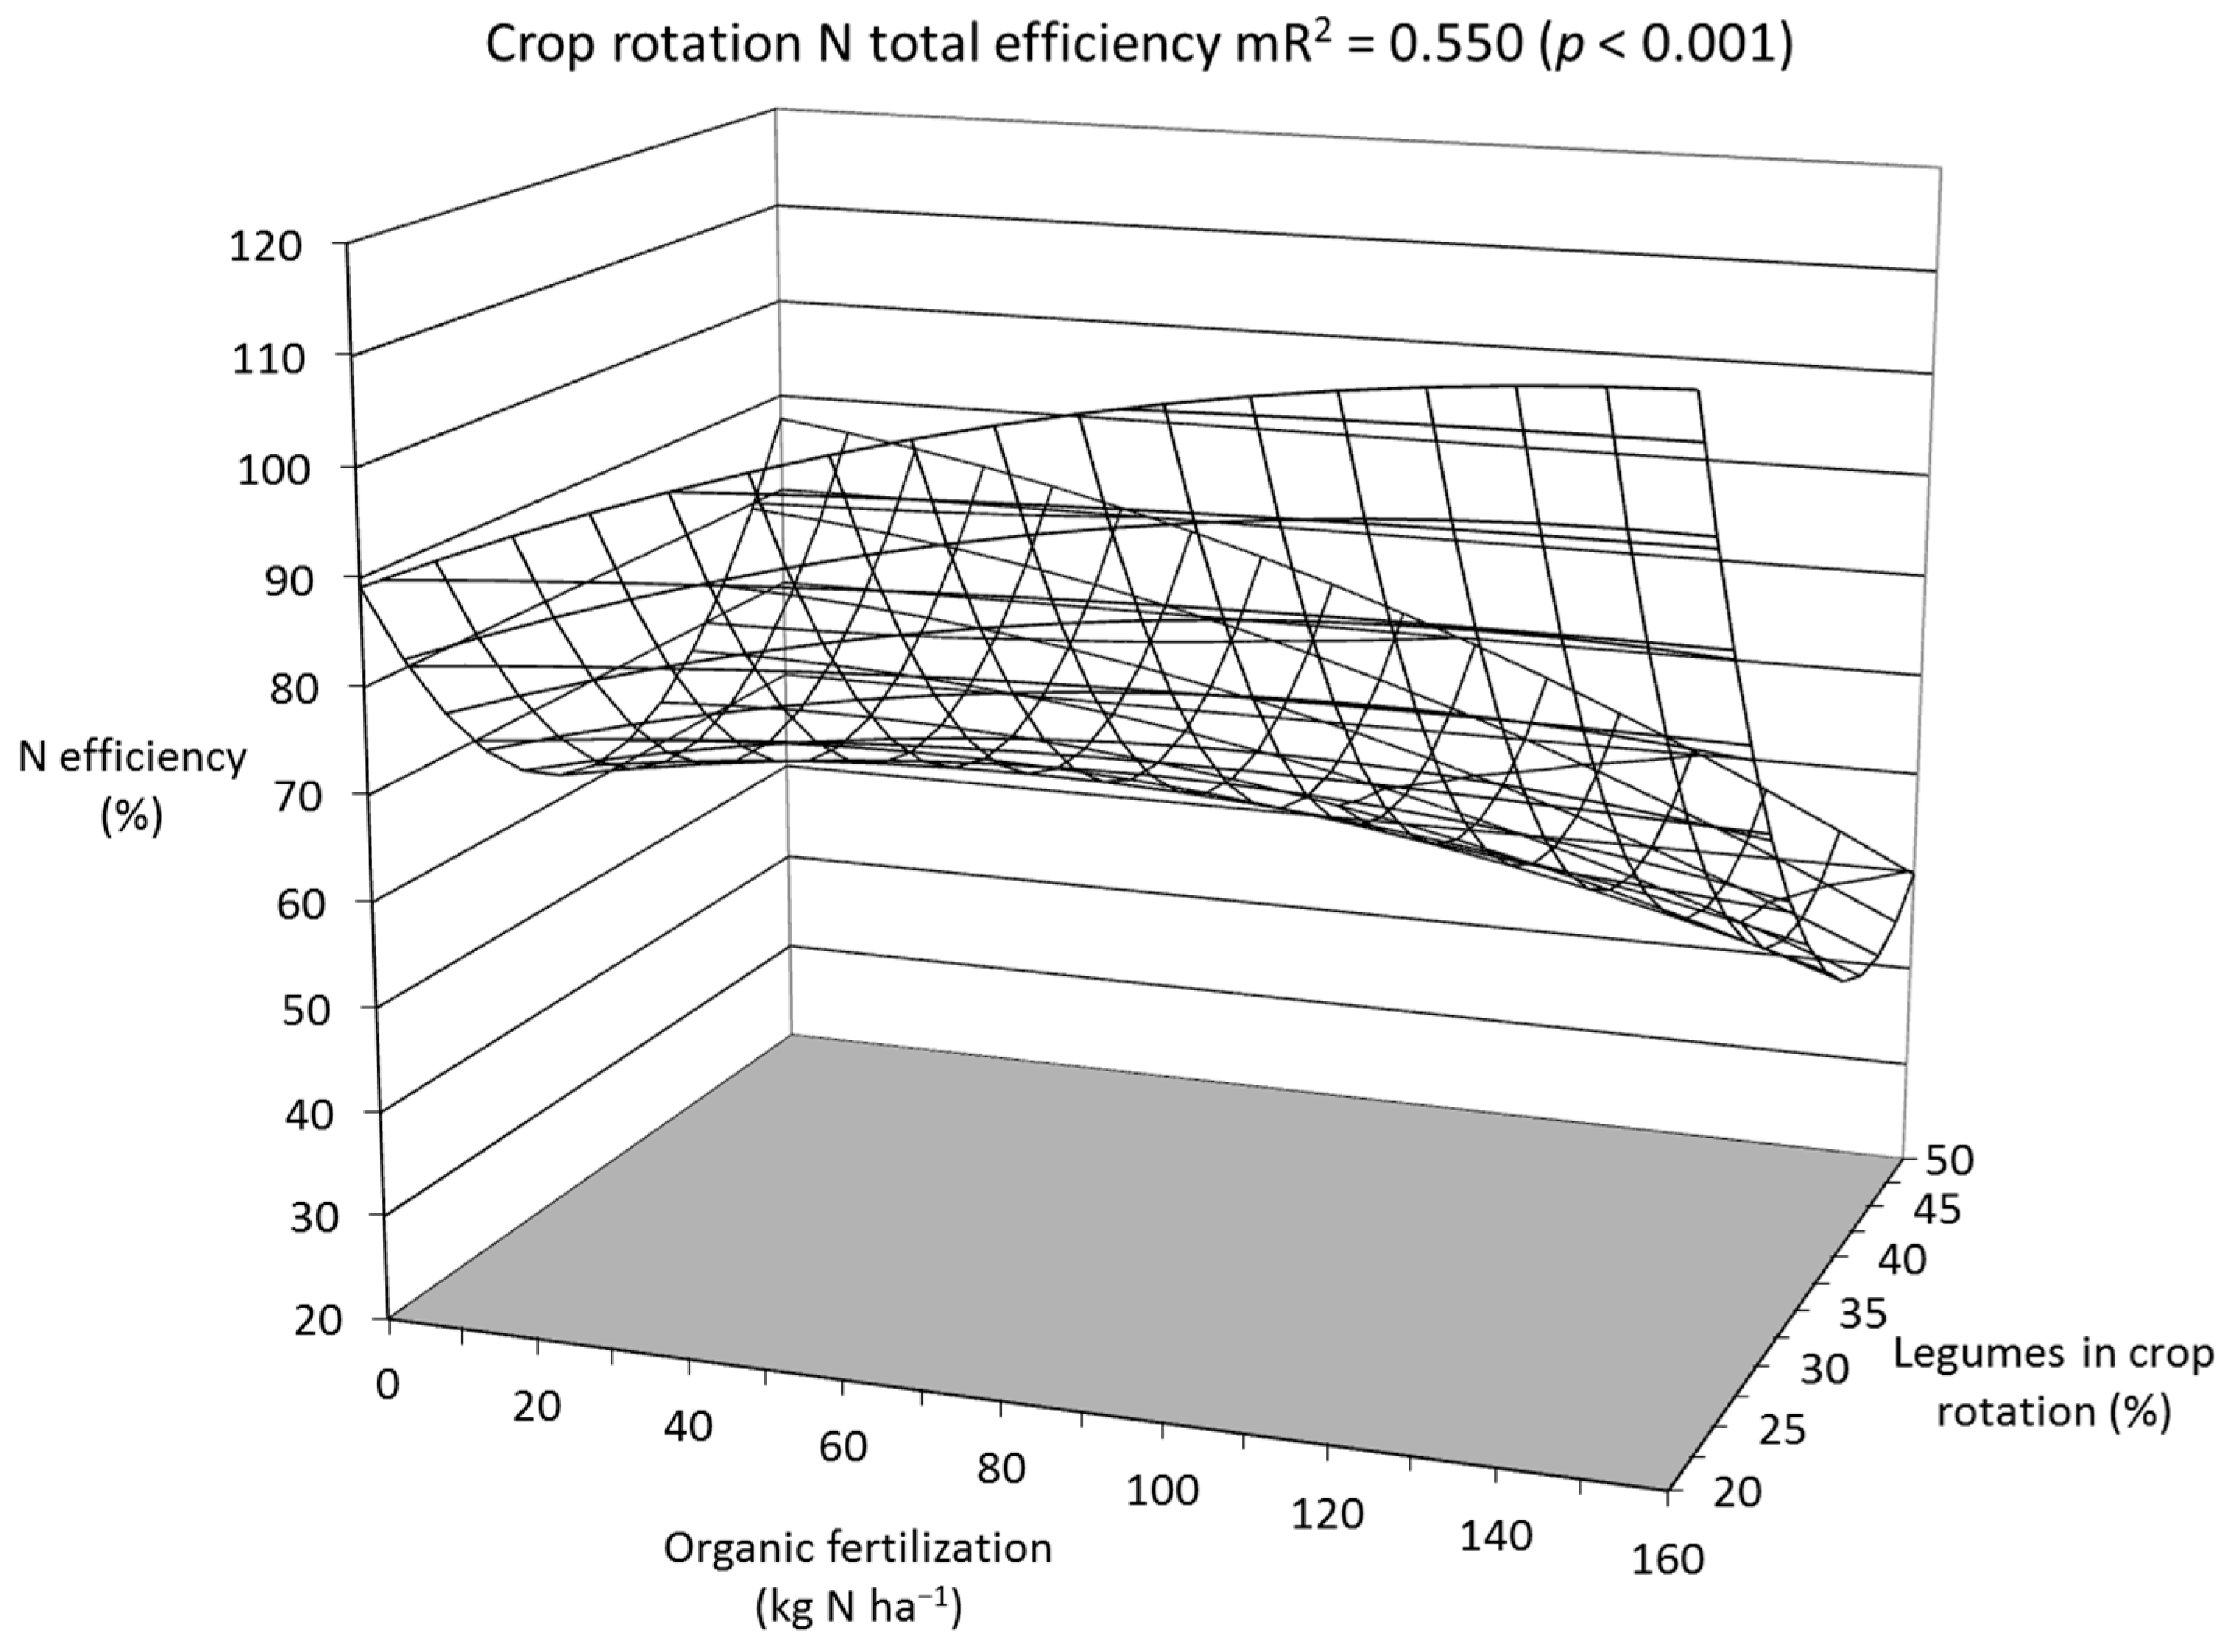
9. Quantitative Relation between Intensity of Organic Fertilization and Legume Cultivation, Using the Example of Heavy Soils (Loam)

Based on the extensive data material presented and processed here from long-term trials and field surveys, it was possible, by applying multiple mathematical-statistical analyses, to establish three-dimensional relationships between the factors of increasing legume cultivation (forage legumes and mixtures with grasses; grain legumes) in the crop rotation and a widely differentiated organic fertilization (stable manure, green manure, and slurry) in the form of the N supply (see Section 4) and the long-term expected effects on various characteristics of nutrient balancing, soil fertility, and crop rotation yields. The extent of legume cultivation included portions between 20–50% in the crop rotations, mostly in the form of clover or alfalfa grass. Grain legumes were also grown only in the range around 20% and around 50%. The average supply of organic manure has been between the livestock-less systems without a supply and up to a level of 2.7 LU ha−1 (about 160 kg N ha−1).
By applying humus balancing methods, the supply level of decomposable organic matter of cropping systems can be calculated. The results represent a general evaluation criterion of the yield potential and the soil fertility. Taking heavy soils (loam) as an example, the following equation for determining the humus balances of crop rotations (y, HEQ ha−1) was obtained (r = 0.801, p < 0.001) between the N supply from organic fertilization (x1, kg N ha−1) and the extent of legume cultivation in the crop rotation (x2, %), as well as the interaction (WW) between x1 and x2, using multiple regression analysis:
-
y = −985.91 + 4.48035x1 − 0.00924x12 + 56.69970x2 − 0.65578x22 − 0.01492x1x2.
As can be seen from Figure 5, both the extent of legume cultivation and the organic fertilization have clearly increased the humus balances. Negative humus balances are only determined a cultivation between 20% and slightly more than 25% legumes in the crop rotations and an organic fertilization between 0–30 kg N ha−1. In calculation examples for crop rotation design, Kolbe [75] came to the same results. Furthermore, a high site dependence was found in the results for humus balancing. For instance, Surböck et al. [123] also found negative humus balances (HE method) with total rotational legume shares of 33%.
With increasing legume portions in the crop rotation, a largely linear increase in the humus balances has not occurred, since at the level of around both 20% and 50% the forage legumes have been partially replaced by the cultivation of grain legumes, which are characterized by a lower organic matter input. Similarly, as a result of rising fertilization, a slight non-linear slope is associated with an increasingly flattening course of the humus balances (Figure 5).
A clear interaction between legume extent and organic fertilization (x1x2) cannot be noted. For organic farming, the optimum humus supply level (=supply grade C) is between 0–300 HEQ ha−1. With a high legume cultivation range, it can be seen that the probability of exceeding this optimal supply clearly becomes higher with increasing fertilization. For example, an organic fertilization of more than 40 kg N ha−1 can lead to a latent oversupply of decomposable organic matter with a cultivation volume of between 30–35% of legumes. According to these calculations, however, a clear oversupply of more than 500 HEQ ha−1 (grade E) is only achieved by a relatively small extent of cultivation. Kolbe [75] also came to similar conclusions when evaluating crop rotation compositions by humus balancing.
Although methods of varying accuracy were used for humus balancing, a sufficiently good agreement was obtained with the annual soil Corg rates of change determined in the experiments. The data material for the quantification of the Corg development still needs to be supplemented and is, therefore, without presentation. A more pronounced interaction was found between legume levels and organic N fertilization. According to this, rising organic fertilization leads to a pronounced increase in the soil Corg content over time when legumes are grown at low levels and to a smaller increase when they are grown at a high level. Apparently, a relatively higher soil Corg effect generally occurs on a low supply rather than on a high supply of organic materials. The following equation was obtained (y = Corg difference, kg C ha−1 year−1; r = 0.791, p < 0.001):
-
y = −582.85 + 8.69935x1 − 0.00356x12 + 19.36387x2 + 0.00102x22 − 0.14583x1x2.
In principle, the Nt contents of the soil reacted similarly to the Corg contents (not shown). With the increasing cultivation of legumes, the Nt values increased only slightly with low fertilization, whereas they tended to drop somewhat with high organic N supply. The influence of legume cultivation was much less pronounced than that of increasing organic N fertilization. Relatively independent of the extent of legume cultivation, up to an organic fertilization of about 30 kg N ha−1 there is a decrease in soil Nt reserves of up to 20 kg N ha−1 year−1 in the area without fertilization. After a consistently high N supply of 160 kg ha−1, a similarly high annual Nt accumulation in the soil occurs.
In the DOK trial in Switzerland, partly high Nt losses of more than 30 kg N ha−1 year−1 were found in variants without fertilization [124]. Similar to the soil Corg contents, a new equilibrium in the soil Nt contents is also established over time according to the intensity of the preceding cultivation. This equilibrium has apparently not yet been reached in a large supply area, even after 35 years of experimentation in the DOK trial. The following mathematical equation was determined based on the presented experimental results for the Nt computation (y = Nt difference, kg N ha−1 year−1; r = 0.784, p < 0.001):
-
y = 43.84 + 1.09191x1 − 0.000893x12 − 4.78565x2 + 0.07597x22 − 0.01659x1x2.
Figure 6 shows the effect of rising organic fertilization (x1) and the cultivation of forage and grain legumes of 20–50% in the crop rotations (x2) of the better soils on the annual N2 fixation rates of the legumes. Approximately parallel to the extent of cultivation, the legume N2 fixation increases from below 20–30 kg N ha−1 at low to up to well over 100 kg N ha−1 at a cultivation portion of about 50% legumes in the crop rotations. Up to an N supply between 30 kg ha−1 and about 80 kg ha−1 via organic fertilization, an increase in legume N2 fixation is still caused by an improved growth of the legume stands, especially at high cultivation extents.
With low to medium legume cultivation, N2 fixation is apparently no longer promoted even after relatively low fertilization. With further rising N supply, there is even a reduction in the N2 fixation, since the plants then increasingly use the available N from the soil. In addition, there is then a greater promotion of non-legumes in the cultivated mixtures. The following mathematical equation with high statistical confidence was calculated (y = legume N2 fixation, kg N ha−1 year−1; r = 0.939, p < 0.001):
-
y = −101.35 − 0.03893x1 − 0.00153x12 + 8.22668x2 − 0.08806x22 + 0.00720x1x2.
According to analyses by [41], see also [38,125,126], the lowest Nmin values are determined under clover and alfalfa grass, while the values remain at a somewhat higher level under the cultivation of grain legumes. After tilling the stands, the Nmin values increase sharply and already reach the highest values on the lighter and medium soils in the first year of cultivation after legumes, due to the high soil turnover activity. On the heavy soils, the highest Nmin levels are usually reached in the second year following legumes and then decrease again in the following years as the crop rotations progress on all soils. From these crop rotation investigations of the Nmin amounts in the spring (mostly 0–90 cm soil depth) characteristic temporal courses can be determined, which could be used to establish suitable crop rotation systems [127,128].
In the organic farming systems, the influence of the number of legumes on the Nmin values in the spring is very clear (Figure 7). It is the main function in the mathematical equation shown. From initial values around 40–45 kg N ha−1 with a cultivation extent of 20% grain or fodder legumes, the contents increase with an extent around 50% legumes up to values of 75–90 kg N ha−1. In the range shown, the Nmin values will rise by more than 13 kg N ha−1 if the extent of legume cultivation is increased by 10% in the crop rotations. The somewhat higher Nmin values in the crop rotations, which are caused by the increased decomposition of crop and root residues during and after the cultivation of grain legumes, can also be taken from Figure 6, because correspondingly somewhat increased values are determined at both 20% and 50% legume cultivation.
In contrast, the influence of a strong increase in organic fertilization with farmyard manure and slurry is hardly noticeable because the Nmin values are only increased by a few kilograms of N with low legume cultivation, while with a high level of cultivation the increase as a result of rising organic N fertilization also only covers a maximum of about 15 kg Nmin ha−1. Organic fertilization, instead, results in N fixation in the Nt pool of the soil because initially a stronger soil Corg enrichment takes place. As the results further showed, the crop and root residues of clover-grass and grain legumes are converted more quickly, and a lower Nt fixation in the organic matter occurs. Therefore, the Nmin values already increase rapidly in the early spring in parallel to the cultivation extent in the soil. The following equation was obtained between organic fertilization and the extent of the cultivation of legumes in multiple regression analysis to determine the Nmin values in the spring (y = Nmin quantity, kg N ha−1; r = 0.913, p < 0.001):
-
y = 80.68 − 0.02214x1 − 0.000454x12 − 2.94914x2 − 0.05613x22 + 0.00396x1x2.
Since N can also be considered one of the limiting nutrients in organic farming, it is not surprising that there is a relatively close visual correspondence between both the reported soil Nmin and the N2 fixation levels of legumes and the expected long-term GE-yields of the crop rotations (see Figure 6, Figure 7 and Figure 8). It can be clearly seen that the extent of legume cultivation contributed substantially to yield formation by increasing the supply of N. In this context, an expansion of the legume scope by 10% led to an approximate yield increase of 1.0 t GE ha−1.
After the continuous application of a strongly increasing organic fertilization, there was also a yield increase of about 2.0 t GE ha−1 in total. However, parallel to rising fertilizer application, a clearly diminishing yield increase occurred, so that maximum yields are achieved in each case at about 110 kg N ha−1 with low cultivation and already after 80–90 kg ha−1 N fertilization and high legume cultivation in the long term (Figure 8). At a higher input than about 2.0 LU ha−1 (120 kg N ha−1 from stable manure and slurry), declining yields are to be expected regardless of the extent of legumes, especially in the cultivation of cereal crops. As the studies have shown, higher nutrient applications can only be utilized favorably if a changed cropping structure is realized with an increasing amount of, for example, root crops and silage maize instead of cereals in the crop rotations.
The analyzed relationship between fertilization and legume cultivation for a quantitative description of the rotational GE-yields obtained a very high statistical confidence and can be calculated with the following mathematical equation (y = GE-yield, t ha−1; r = 0.962, p < 0.001):
-
y = 3.34 + 0.39234x1 − 0.00153x12 + 2.78015x2 − 0.02438x22 − 0.00192x1x2.
Even without organic fertilization, increasing the extent of legume cultivation led to a high yield level for the cereals grown. For example, in field trials on loam soil in eastern Germany, winter wheat yields of well over 6.0 t ha−1 were not uncommon, while only relatively low yields of below 25.0 t ha−1 tubers on average were the rule in potato cultivation [41]. At the same site, potatoes only developed closed plant stands and tuber yields of 35.0 t ha−1 to over 40.0 t ha−1 when a high application of solid organic fertilizers was applied prior to planting [106].
It was observed temporarily in these trials that a relatively high level of legume cultivation in the crop rotations sometimes resulted in extremely high Nmin values in the soil. After special weather conditions with long-lasting dry phases and high temperatures, peak Nmin values of well over 150 kg N ha−1 developed, especially in the fall tests. This was always observed when high organic fertilization was also present at the same time [41,42]. From these results, the conclusion can also be drawn for these reasons listed that legume proportions of more than 40% can no longer be considered a well-managed land use (see [43]).
The influence of a strongly varying legume extent in the crop rotations is also shown in the calculated N balances of the organic farming systems (Figure 9). An expansion of the cultivation of legumes by 10% results in an increase in the mean N balances by 25–35 kg N ha−1. In comparison, the increase is, however, much more pronounced in systems with strongly varying levels of organic fertilization. Due to the diminishing yield growth, a clearly disproportionate increase in the N balances can be seen. By increasing the N supply by 50 kg ha−1, an increase in the balances of about 40 kg ha−1 can be expected.
Negative balances are only registered in a relatively small range between about 25% legume cultivation with no fertilization and 20% legumes with N supply around 30 kg ha−1. Surböck et al. [123], in Austria, also still determined slightly negative N balances with a low cultivation of forage and grain legumes of around 25%. According to examinations by [124], N balances of up to −25 kg N ha−1 year−1 were calculated in the DOK trial in Switzerland in variants without fertilization and a cultivation extent of approx. 29% legumes.
Following the established evaluation system for N [18,19,43], the acceptable N balances in organic farming should reach at least positive values on average for the crop rotations. According to clear experimental findings, the occurrence of permanently negative balances is likely to result in partly severe yield losses [18,69]. Between 0 kg N ha−1 and about 50 kg N ha−1, an optimal yield level can be guaranteed even for organic farming conditions. Balance values well above 50 kg N ha−1 lead to maximum yields and can no longer be accepted because of excessive N losses and associated negative environmental effects.
With a relatively low legume share of 20%, an additional organic fertilization of about 110 kg N ha−1 can be made possible. This range coincides quite well with the application level of organic fertilizers allowed by some organic farming associations. However, with increasing legume cultivation, the N supply should then be reduced to about 50 kg N ha−1, in order to avoid permanently exceeding a limit of about 50 kg ha−1 in the N balance. Particularly extreme N balances are achieved with a high legume extent and large amounts of fertilizer (positive interaction).
According to these findings, higher organic fertilization only makes sense if the number of legumes is reduced accordingly (or omitted completely). Only in these special cropping sequences with very low legume cultivation and expanded portions of root crops and field vegetable species can a nutrient removal be made possible with a correspondingly high yield level, so that nutrient balances of below 50 kg N ha−1 can still be guaranteed on average over the years. Through these obtained results, higher fertilization rates of up to 170 kg N ha−1, according to certain EU regulations [1], are therefore to be critically questioned and probably only accepted on especially favorable growing sites.
However, a certain amount of Nt has to be taken into account, which is to be regarded as an intermediate N depot caused by the partly considerable soil Corg enrichment mentioned, until an equilibrium is reached. With a high fertilization, a quantity of approx. 20 kg ha−1 Nt per year may be estimated which can still be deducted from the N balances obtained because this N is not regarded as being reactive. Between the organic fertilization (x1) and the extent of legume cultivation (x2), the following mathematical equation was calculated to determine the N balances (y = N balance (gross), kg N ha−1; r = 0.830, p < 0.001):
-
y = −132.88 + 0.29868x1 + 0.00165x12 + 7.81346x2 − 0.09995x22 + 0.00768x1x2.
The P and K balances determined from the long-term trials behave in a similar way, as already described for the N balances of the organic farming systems, as a result of increasing legume cultivation and organic fertilization (cf. Figure 9 and Figure 10). In contrast, for P and K, larger intensity ranges with partly clearly negative balances are found. For example, P balances of −19 kg to +6 kg P ha−1 and K balances of −80 kg to +15 kg K ha−1 were also calculated in the DOK trial on loam soil in Switzerland after 35 years, with a determined soil resupply of 50 kg K ha−1 year−1 [129].
Naturally, however, a considerable increase in the P and K balances, comparable to the N, does not take place in case of a high extent of legume cultivation. Nevertheless, an improvement in the negative P balances by 5–7 kg P ha−1 and in the strongly negative K balances even by 50 kg K ha−1 year−1 can be determined by the increased legume cultivation, especially when a low organic fertilization is presented, although at the same time a higher nutrient removal by the yield effects can be observed (see Figure 8).
However, as a result of clear negative interactions between legume cultivation and organic fertilization, these nutrient improvements cannot be determined with high organic fertilization. Whether the cultivation of forage legumes in particular also contributed to an additional benefit in P and K supply, apart from N, cannot be conclusively determined from these results. It seems to be possible, however, that a higher remobilization of soil nutrients can also occur from the subsoil by cultivating deep-rooted plants than when a large supply is present, especially in areas of relatively low nutrient supplies [130,131].
Based on these results for nutrient balancing, the following additional organic fertilizer quantities are required in the area of relatively low legume cultivation in order to achieve at least a balanced nutrient supply in the long term without leading to a change in the solid or soluble soil contents, taking into account the nutrient resupply that can usually be observed in these heavy soils (see also Figure 3 and Figure 4):
-
Soil organic matter and N: organic fertilization with approx. 30 kg N ha−1 required for equalized N and humus balances (Figure 5 and Figure 9).
-
P with a maximum of 5 kg P ha−1 resupply: organic fertilization with an equivalent of approx. 60 kg N ha−1 required (Figure 10, above).
-
K with a maximum of 60 kg K ha−1 delivery: organic fertilization with an equivalent of at least 70–80 kg N ha−1 year−1 required (Figure 10, below).
In the context of the soil organic matter turnover, these basic nutrients are released into the plant-available soluble forms in certain relations between nutrient balance and soil concentration change, so that no further soil chemical methods are usually required by their determination (cf. [64,132,133]). For example, in the case of soil P, the ratios between the different soluble nutrient fractions change relatively uniformly as a function of the amount added or the P balances determined. However, it is clear from this comparative analysis that the conditions for proper nutrient management are much more difficult to fulfill for basic nutrients than for N or the Corg supply (see [44]).
The following mathematical-statistical relationships were determined between organic fertilization (x1) and legume cultivation (x2) to calculate P balances (y1 = P balance, kg P ha−1 year−1; r = 0.927, p < 0.001) and K balances (y2 = K balance, kg K ha−1 year−1; r = 0.676, p < 0.01):
-
y1 = −26.67 + 0.29259x1 + 0.000411x12 + 0.45648x2 − 0.00393x22 − 0.00414x1x2;
-
y2 = −251.61 + 0.51302x1 + 0.00369x12 + 9.30328x2 − 0.11358x22 − 0.00607x1x2.
Taking N as an example, Figure 11 shows results of the following two types of nutrient balancing and subsequent corresponding determination of the nutrient efficiencies:
-
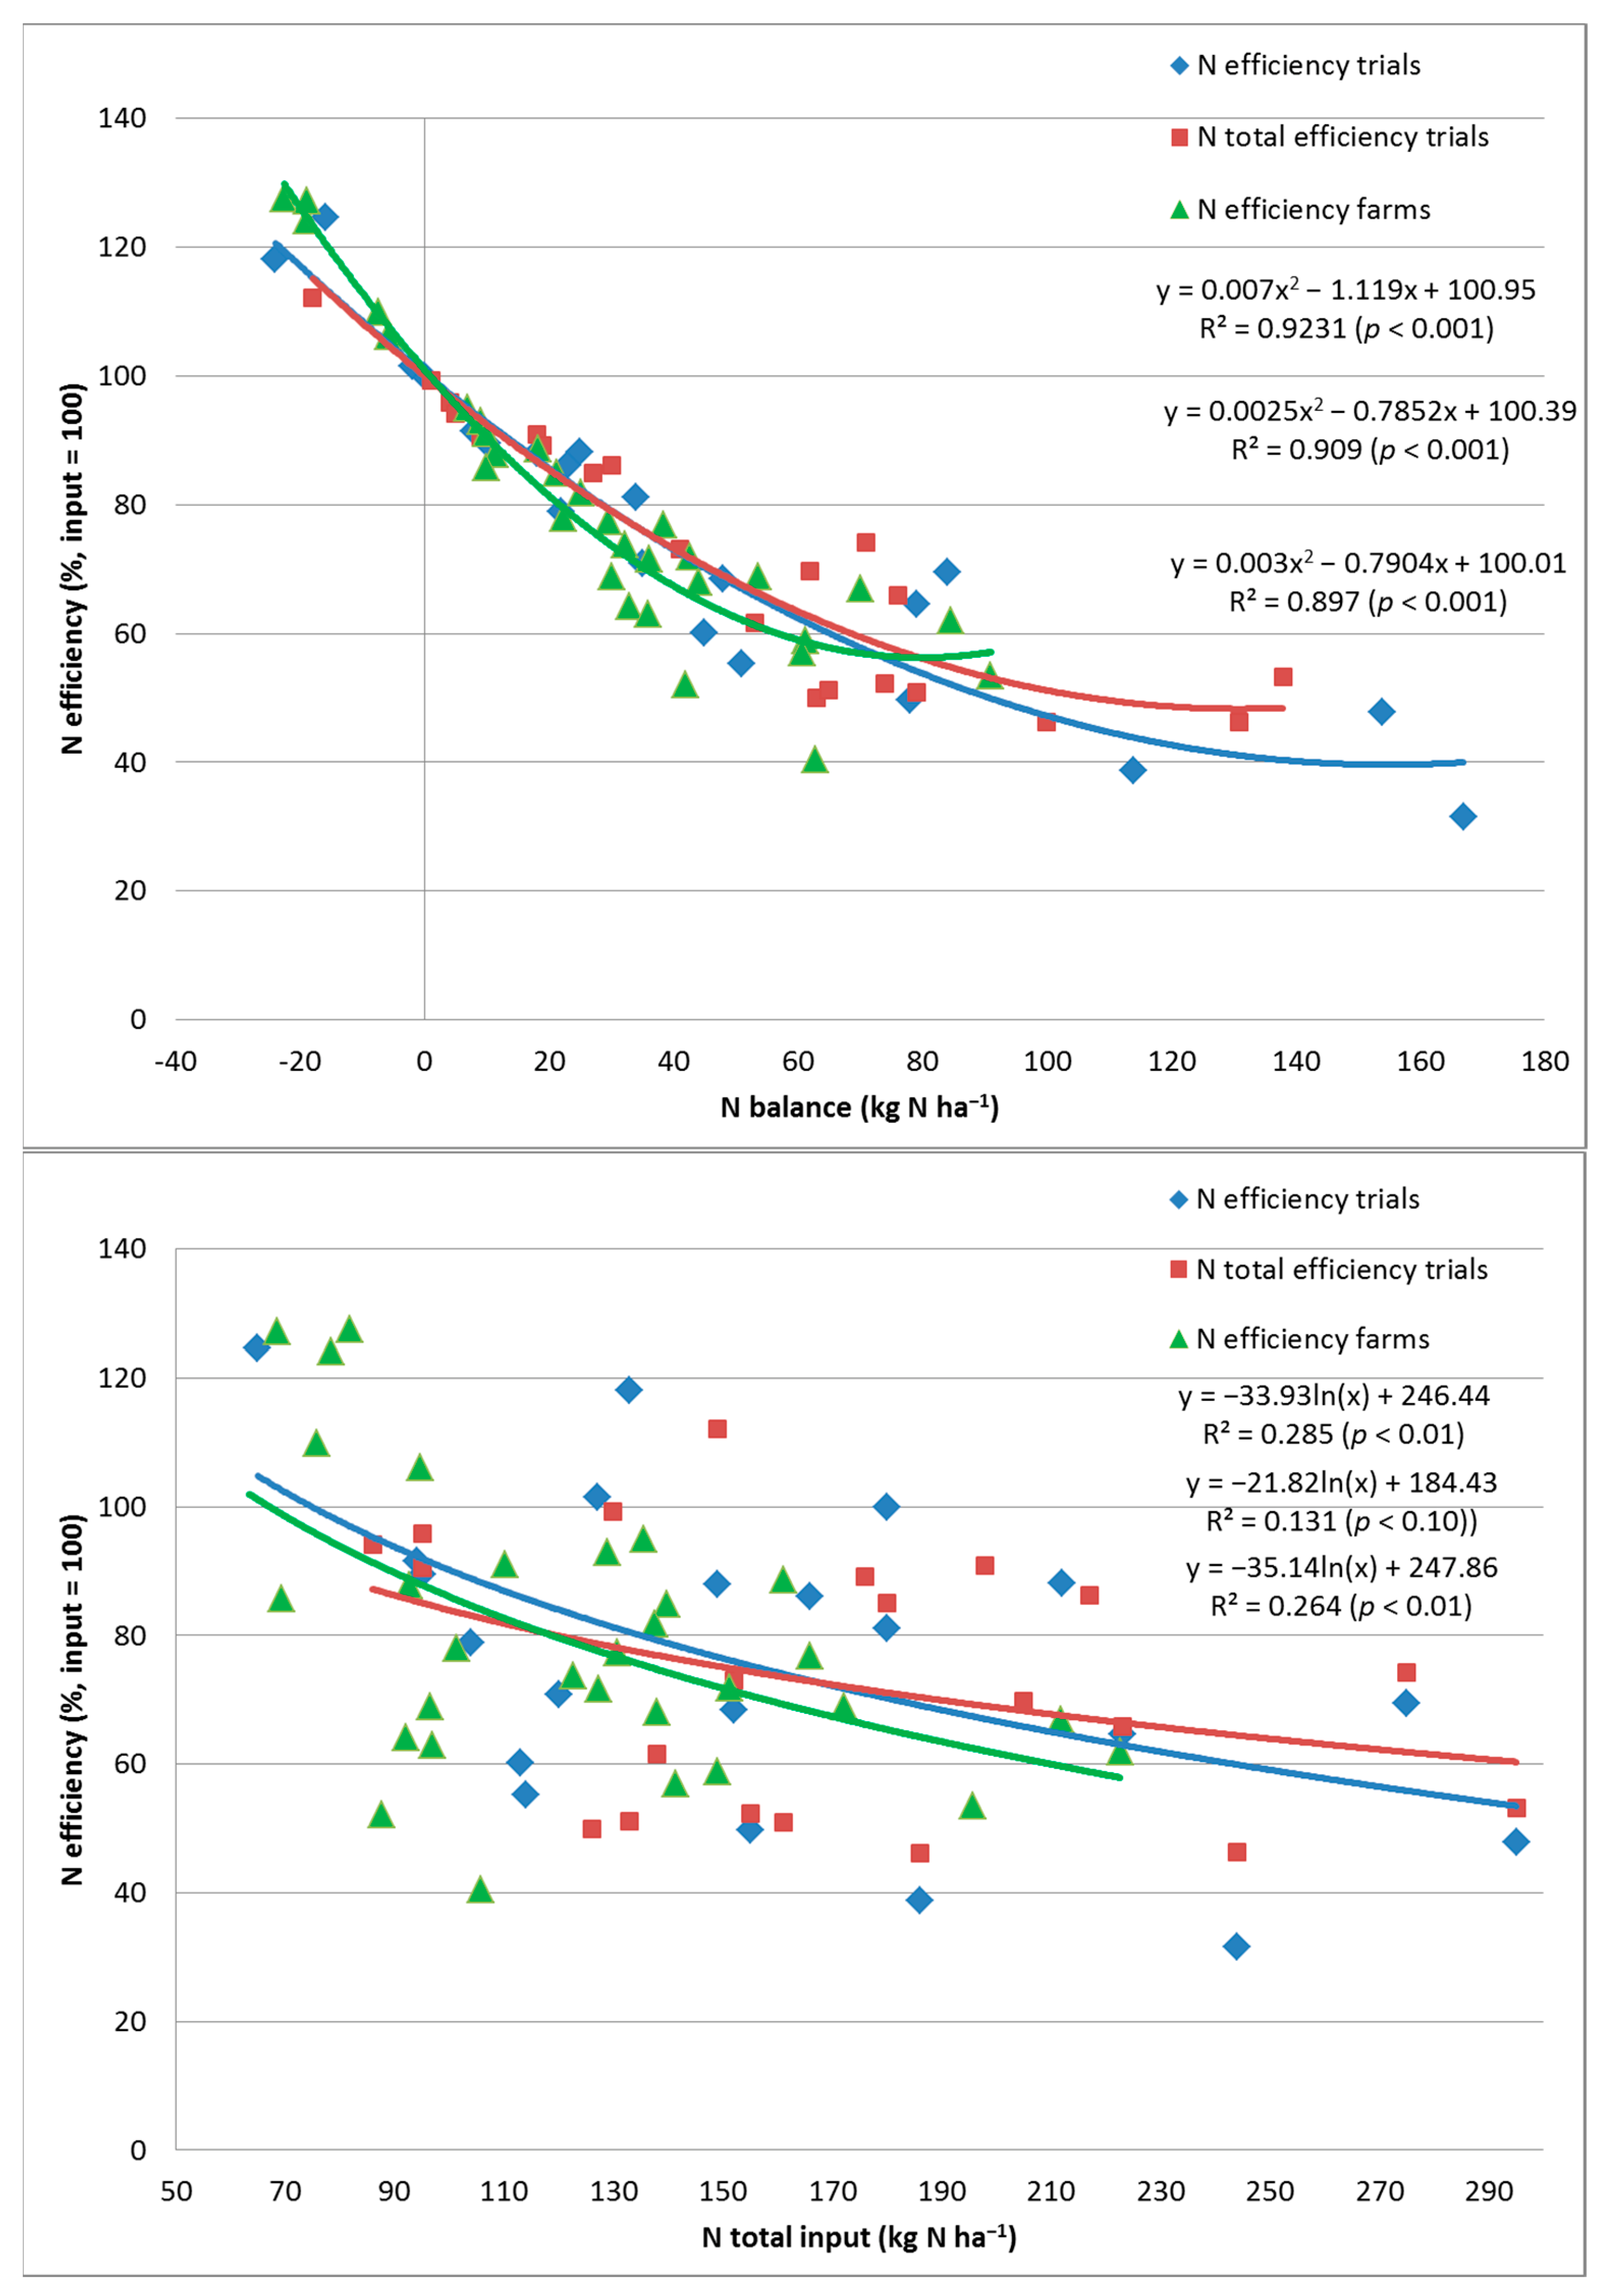
Ordinary gross balancing including N deposition and determination of N balances and (apparent) N efficiencies (N efficiency trials; N efficiency farms).
-
Ordinary gross balancing with additional accounting of negative soil Nt balances in nutrient inputs and positive balances in outputs and determination of total balances and total efficiency (total N efficiency trials).
In comparison to the calculated N balances, very close statistical relationships are generally found with the expected nutrient utilization results for these highly differentiated organic farming systems. It can be seen that both types of balancing are well-suited to produce results that are clearly in agreement over a wide range (Figure 11, above).
The pure gross balancing leads to somewhat more extreme results than the total balancing taking into account soil Nt differences, as has already been determined in other experiments [41,124]. Furthermore, a much broader range of legume cultivation and nutrient supply was considered in the studies summarized here. Negative nutrient balances with efficiencies of over 100% are calculated with both types. In this case, a supply range is represented that leads to a reduction or depletion in the soil’s nutrient reserves and therefore, characterizes an insufficient nutrient supply over time.
This range can therefore be described as low or very low when using the well-established A–E classification system of VDLUFA in Germany (range B: −29 to −1; range A: <−30 kg N ha−1; see [6,18,134]). Figure 11 (above) can help to more accurately align the classifications between the N balances and the N efficiencies.
With an increasing nutrient supply, a range follows which guarantees a sufficient N supply to achieve optimum yields up to a balance around 50 kg N ha−1. This range between 0–50 kg N ha−1 can therefore be assigned as supply grade C. Up to this balance range, relatively consistent N efficiencies of 100% to approximately at least 60% are obtained with both types of determination. With further rising N balances, visibly higher values are then determined by calculating total efficiencies, which take into account the positive Nt values of the soil fund. These Nt values do not represent losses, but are to be regarded as temporary N reserves of the soil Corg. At later times, these reserves are released again as part of the Corg turnover and then contribute to plant nutrition.
With a further rising nutrient supply, whereby an organic fertilization from 1.0–1.5 LU ha−1 upwards have been applied and/or a high extent of legumes have been cultivated in the crop rotations, a nutrient efficiency of below 60% is achieved. Values in organic farming of below 40% can also be obtained, as the results of the studies have shown (Figure 11, above). In this supply range, maximum yields are reached or already exceeded. Consequently, an oversupply is the result because visibly higher losses of N are recorded which are also no longer stored in the meantime as Nt reserves of the soil. Therefore, N balances of more than 50 kg N ha−1 must be assigned to grade levels D–E, which are to be avoided.
When comparing the obtained efficiency values with the increasing N inputs, characteristic decreasing N efficiencies are also obtained in both the results from the trials and the farm surveys (Figure 11, below). A considerable variation in efficiency values becomes apparent, with a high agreement between the point clouds (s = ±25 kg N ha−1). The farm point cloud and regression curve are at somewhat lower levels. In relation to the N supplies, slightly lower N efficiencies are obtained in the farms than in the trials.
According to detailed investigations, yield-limiting influences due to nutrient supply insufficient by 11% were determined in these farms [11]. With appropriate corrections of the yield losses, higher classifications and consequently no more efficiency differences between the farms and the trials are then obtained (not shown). These results show that the representations presented can ultimately be used for testing optimization work.
According to extensive studies in agricultural practice, average N efficiencies for organic farming can be estimated to range from about 60% to close to 100% [4,6,11,18,44,48,52,95,100,109,112,113,135,136]. In the surveys of [43], N efficiencies between 41–128% were analyzed with N balances ranging from −23 kg N ha−1 up to 91 kg N ha−1. With a similar statistical certainty and scatter range, a high agreement of the N efficiencies was found almost in the entire range, as it was also documented in the trial results summarized here (integrated in Figure 11).
The mean value over all farms investigated was 78% N efficiency; in the trials it was 76% with an N balance of 45 kg N ha−1. Forage farms with 75% and farms with integrated field vegetable production with 74% showed slightly lower values. For the market crop farms, better N efficiencies were determined with 88%, although a somewhat higher number of farms with an N utilization of over 100% must then also be considered.
In the studies of [9], an average N efficiency of slightly over 90% (64–121%) was determined. Such high mean values have scarcely been described in any other work. Since the values of conventional comparative farms, for which many other study results are available (including [4,134,137]), were also determined with very high mean values around 79% N efficiency, there are obviously methodological differences in the calculation. Both cropping systems may also be farms that have to be counted to a higher standard in some way and do not document the average of agricultural practice.
As the results in Figure 11 show, in some forms of organic farming which involve a high level of legumes and correspondingly extreme organic fertilization, N balances are found to be just as high and, consequently, efficiencies just as low as is also common in intensive forms of conventional farming. Only if errors in nutrient management are not recognized in time and other factors of production fall to levels below the minimum (minimum law, [97]), such as water and nutrients in trials and practice plots studied here on sandy soils in eastern Germany or sulfur and other nutrients on the Gladbacherhof farm in western Germany, can N efficiencies quickly drop to values below 55% even with an obviously medium nutrient supply [22]. N efficiencies around 45% can be determined in relative, intensively managed, organic dairy farms with high values in fodder purchase [3]. To clarify such low values, the influence of recycled N on the balance formation in livestock farms should be subjected to a closer analysis.
Using the example of the total N efficiency determined here, an attempt was also made for the first time to use multiple regression analysis to quantitatively calculate the relationship between the increasing fertilization level (x1) and legume rotation proportion (x2) of organic farming systems. Although the data material may not yet be extensive enough for such complex relationships, some basic relations can still be derived from the results of Figure 12 if certain extreme areas, especially in the periphery of the plot, are disregarded.
From initial values between 70–90%, through the largest supply range, the N efficiency basically drops with rising legume shares and also with increasing organic fertilization. Because of a pronounced interaction between both factors, a particularly sharp decrease occurs as a result of high legume cultivation and very high fertilization, and values of below 50% N efficiency are then reached. High percentages of grain legumes (20% and 50% range) apparently lead to somewhat higher efficiency values compared to exclusive forage legume cultivation (25–45% range).
According to these results, particularly high N efficiencies occurred after very low legume cultivation. Almost only in this area, utilization rates of more than 100% can also occur in connection with organic fertilization. Because of the reduction in the Nt contents of the soil, this can lead to a decrease in the soil Corg quality as well as to a decline of the soil fertility in the long run. The obligation to cultivate legumes is therefore also correctly chosen based on these results [1]. However, depending on the (intensive conventional) pre-cultivation, the results do not suggest negative effects on the Corg quality in the long run for the very largest range of organic cultivation systems (Figure 12).
The total nutrient efficiency as a function of organic fertilization in the form of N (x1, kg N ha−1) and crop rotation legume percentage (x2, %) can be calculated according to the following mathematical-statistical equation (y = total efficiency for N, %, nutrient supply = 100%; r = 0.742, p < 0.001):
-
y = 209.81 + 0.57091x1 − 0.000913x12 − 8.42298x2 + 0.11956x22 − 0.01323x1x2.

10. Discussion and Conclusions

Even in organic farming, N supply is considered one of the most important limiting factors for crop yield formation [103,104,106,138]. The nutrient N can be supplied by legume N2 fixation and by fertilization measures. In this review article, results from specific long-term field trials and a large number of farm surveys were compiled, compared, and subjected to an evaluation in terms of productivity, soil fertility, and environmental impact. Cropping systems of forage production with the removal of by-products, market crop systems leaving the by-products and with clover-grass mulching and increasing intensities of up to 2.7 LU ha−1 supply of solid or liquid organic fertilizers, and cropping systems with forage and grain legumes between 20–50% in the crop rotations were recorded. The results from long-term trials available today have made it possible to cover and deepen the diversity of cultivation and the range of intensities occurring in agricultural practice.
Finally, for the described livestock-free cropping systems generally without or with low organic fertilization and grain or fodder legumes from 20% in the crop rotations, the conclusion can be drawn that there is generally a good comparability between the results obtained here from the long-term trials and the practical surveys. These pure cash or market crop farms can be described as extensive organic practices with modest yield potential, which at the same time are also characterized by relatively high values in environmental protection (N, P, and water conservation).
However, increasing nutrient management deficiencies can lead to the substantial long-term depletion of certain nutrients, resulting in yield losses that, in some cases, significantly reduce the crop and economic efficiency of these cropping systems. Accordingly, these stockless systems require more efforts to control and correct soil fertility than cropping systems with livestock [32,41].
Inadequate N and humus balances can in many cases be corrected by on-farm practices, in particular, by changing crop rotations, increasing legume cultivation in main crops and catch crops, and returning the by-products to the fields. However, the widespread insufficient levels of plant-available basic nutrients in the soil can decrease even further as a result, so that the nutrient cycles open up even more. Deficiencies in the basic nutrients P, K, Mg, and S, therefore, usually require external supply through fertilization with organic fertilizers and, in certain cases, also with mineral fertilizers.
In order to avoid yield losses in the sense of the minimum requirement, nutrient concentrations of the soil that lead to an optimal yield level (e.g., in Germany and Austria the supply classes C) must be aimed for and secured in the long term. To fix the supply classes exactly, a special experimental activity under organic growing conditions is necessary [11,98]. As a result, a reduction in the soil nutrient contents of P, K, or Mg, which are considered optimal in conventional farming, by one supply grade can often be seen. These reductions alone can lead to a decrease in leaching, erosion, and silting of the soil by up to 50% [139,140,141,142]. The resulting improvements in environmental and resource protection can thereby also be remarkable in the case of basic nutrients.
If additional fertilization is required, organic fertilizers are well-suited to achieve an increase in the soil contents. For these special cases, it should be considered whether farms can also make higher inputs from outside than allowed by the upper limit of 40 kg N ha−1 year−1 of organic fertilizers common in Germany, for example. The additional purchase can also be handled by feed delivery and manure purchase communities.
As the next intensity levels, widespread systems with medium cultivation of mostly clover and alfalfa grasses, around 30–40% in the crop rotations, and fertilization levels around 0.5 LU ha−1 of organic fertilizers were investigated. At the same time, these farming combinations can be considered as largely average intensities in many countries of Central Europe. Compared to livestock-less market crop cultivation, in these systems a significant increase in the yield of all crop species of the rotations occurs as a result of improved values in soil fertility. Since nutrient losses are low and hardly change, there are still excellent values in the environmental protection of these cultivation systems.
Overall, it can be stated that farms with an animal stocking rate of around 0.5–1.0 LU ha−1 and corresponding inputs via the farm’s own manure show many positive effects on characteristics of the yield capacity of the soils, coverage of the fodder requirement, and useful utilization of the clover-grass growths. The humus and nutrient balances reach a level that also enable the soil fertility and sustainability of the farms to be largely secured and also improved.
Therefore, if these management intensities persist for long periods of time, most of the assessed characteristics also reach the supply grades C–D, which include a large extent of well-managed practices. Moreover, this intensity level can still be realized by relatively low negative impacts on environmental compatibility. However, especially on light soils, on the one hand, in some cases, unfavorable impacts may already occur, as for example, on N efficiency, N translocation, and leaching. On the other hand, negative trends on the development of the soluble nutrients P, K, and Mg in the soil are still possible. Overall, farm nutrient management is usually much easier to regulate in these cropping systems.
As the results from agricultural practice and the trials show, in cultivation methods with a medium to high legume ratio of up to 50% including a very high supply of organic fertilizers of more than 2.0 LU ha−1, only relatively low additional yields and quality gains (baking value) are achieved for cereal species and in the cultivation of clover-grass (legume N2 fixation). Root crops such as potatoes, corn, and also certain field vegetables have proven to be more advantageous in the utilization of the fertilizers applied. Depending on the crop rotation, however, these fertilizer amounts must increasingly be classified as questionable, since overall nutrient utilization decreases significantly in these intensive cultivation forms. As a result, nutrient balances and supply levels of humus were determined that often can no longer be described as acceptable (classes D and E). Moreover, this can already be proven to lead to a partly significant increase in harmful environmental effects.
The amounts of fertilizer realized in the long-term trials were in some cases much higher in these intensive cropping systems than the input limits to be observed by some farmers’ associations. For example, the Bioland and Naturland associations in Germany require a maximum N supply of 112 kg N ha−1 as a result of a maximum livestock density of up to approx. 2 LU ha−1 year−1. Based on the trial results presented here, these upper limits seem to be quite well-established for most growing areas in Central Europe, and no changes can be recommended in this respect. A different conclusion can already be reached if the cropping systems are adjusted to the permitted supply level of 170 kg N ha−1, according to the EU regulation for organic farming [1,143].
It is evident from the results presented that the translocation and leaching of nutrients at these highest intensity levels realized in the trials are characterized by a markedly disproportionate increase, as it continues to be the case in conventional cultivation methods [109,118]. In addition, the yields of certain crop species (e.g., cereals) would have to be stabilized by the use of special plant protection products (haulm shortening agents; fungicides) to ensure that useful cultivation can still be achieved. However, these conventional farming tools should also be clearly avoided in the future.
However, it can also be seen from the strong increase in the balance values that, particularly on the light soils, a limit of responsible intensification has been reached or already exceeded. On these soils, more significant side effects on the environment can easily occur, especially if, for example, no irrigation is possible (see [116]). Since such a high animal stocking density is usually not possible on these unfavorable sites due to the lack of fodder, the high supply of fertilizers could essentially only be achieved by additional purchases. Therefore, reasonable limits of additional purchase have also been set by the cultivation associations for this purpose [143], which can be confirmed in principle on the basis of the trial results. If a corresponding optimal supply with all key factors of soil fertility cannot be guaranteed, a certain limitation of the supply level on these soils may have to be considered.
As the investigations show, a very high intensity in the organic cultivation methods is mostly only useful on favorable sites, such as the deep loamy soils. On these soils, over a high yield level, an appropriately high nutrient utilization, and relatively low environmental pollution can still be ensured. Further increases in yield, however, can usually only be achieved by specific adjustments in the crop rotations.
The goal of sustainable or even ecological intensification is to develop cropping systems that are highly productive and environmentally friendly at the same time [29,30,31,144,145]. Nevertheless, one conclusion of the discussion on achieving environmentally sound intensification is that improving nutrient efficiency often appears to be possible only to a limited extent from a practical point of view. Such theses often raise high expectations in the biological environment, which often have to be disappointed in reality. For example, limits are often overlooked which are essentially set by the law of diminishing yield growth.
The results clearly show that as a consequence of increasing legume cultivation in crop rotations and through animal husbandry, applied organic fertilizers in a very wide range of investigations are essentially associated with both decreasing nutrient efficiency and mostly also with rising negative environmental impacts. These results regarding different intensification treatments could be manifested not only from the extensive evaluation work of long-term experiments, but also from survey data of the organic farming practice. To date, there are no cultivation methods known whose results clearly deviate from this described trend of showing possibilities and limits of intensification.
Furthermore, there are also possibilities for an ecological intensification, which could arise from constant research and further practical developments of strategies for the optimization of agricultural production methods. Today, the focus is more on aspects of resource scarcity, environmental protection, and climate change. Finally, some of the important possibilities that can be derived from the above descriptions should be briefly outlined at this point:
-
Cultivation of mixed crops;
-
cultivation of second crops;
-
better use of breeding progress;
-
cultivation and crop rotation optimization depending on the intensity level of the farm;
-
reduction in application losses during the storage and application of fertilizers;
-
use of fertilizers with low contents of readily available and reactive nutrient components;
-
prevention of yield losses caused by the minimum law for nutrients, pH value, organic matter, water supply, etc.

Funding

This research received no external funding.

Institutional Review Board Statement

Not applicable.

Informed Consent Statement

Not applicable.

Conflicts of Interest

The author declares no conflict of interest.

References

  1. Regulation (EU) 2018/848 of the European Parliament and of the Council of 30 May 2018 on organic production and labelling of organic products and repealing Council Regulation (EC) No 834/2007. Off. J. Europ. Union 2018, L150, 1–92.
  2. Organic Farming Statistics. Eurostat Statistics Explained. 2021. Available online: https://ec.europa.eu/eurostat/statistics-explained/index.php?title=Organic_farming_statistics#Organic_production (accessed on 19 July 2022).
  3. Haas, G.; Deittert, C.; Köpke, U. Farm-gate nutrient balance assessment of organic dairy farms at different intensity levels in Germany. Renew. Agric. Food Syst. 2007, 22, 223–232. [Google Scholar] [CrossRef]
  4. Kelm, M.; Hüwing, H.; Kemper, N. COMPASS Vergleichende Analyse der Pflanzlichen Produktion auf Ökologischen und Konventionellen Praxisbetrieben in Schleswig-Holstein; Endbericht; Christian-Albrechts-Universität: Kiel, Germany, 2007; Available online: https://www.grassland-organicfarming.uni-kiel.de/de/pdf/COMPASS%20Endbericht.pdf (accessed on 19 July 2022).
  5. Kelm, M.; Loges, R.; Taube, F. N-Auswaschung unter ökologisch und konventionell bewirtschafteten Praxisflächen in Norddeutschland–Ergebnisse aus dem Projekt COMPASS. Beitr. Wiss. Tag. Ökol. Landbau Hohenh. 2007, 9, 29–32. [Google Scholar]
  6. Hülsbergen, K.-J.; Rahmann, G. Klimawirkungen und Nachhaltigkeit Ökologischer und Konventioneller Betriebssysteme–Untersuchungen in Einem Netzwerk von Pilotbetrieben; Abschlussbericht Förderkennzeichen 06OE160 (TUM) und 06OE353 (TI); Thünen Report 8; Johann Heinrich v. Thünen-Institut: Braunschweig, Germany, 2013. [Google Scholar]
  7. Möller, K. Nährstoffstatus und Nährstoffbilanzen im Ökologischen Gemüsebau. In KTBL-Fachgespräch Organische Handelsdünger im Ökologischen Landbau, Stand des Wissens und Forschungsbedarf; Bioland Treffpunkt: Fulda, Germany, 2014; Available online: https://www.ktbl.de/fileadmin/user_upload/Allgemeines/Download/Handelsduenger/Naehrstoffstatus-Naehrstoffbilanzen.pdf (accessed on 19 July 2022).
  8. Cooper, J.; Reed, E.Y.; Hörtenhuber, S.; Lindenthal, T.; Loes, A.-K.; Mäder, P.; Magid, J.; Oberson, A.; Kolbe, H.; Möller, K. Phosphorus availability on many organically managed farms in Europe. Nutr. Cycl. Agroecosyst. 2018, 110, 227–239. [Google Scholar] [CrossRef]
  9. Chmelikova, L.; Schmid, H.; Anke, S.; Hülsbergen, K.-J. Nitrogen-use efficiency of organic and conventional arable and dairy farming systems in Germany. Nutr. Cycl. Agroecosyst. 2021, 119, 337–354. [Google Scholar] [CrossRef]
  10. Kolbe, H.; Meyer, D.; Schmidtke, K. Schlaggenaue Analyse von 32 Betrieben des ökologischen Landbaus im Freistaat Sachsen: Fruchtfolgegestaltung. Ber. Landwirtsch. 2021, 99 (Suppl. S1), 1–28. [Google Scholar]
  11. Kolbe, H.; Meyer, D. Schlaggenaue Analyse von 32 Betrieben des ökologischen Landbaus im Freistaat Sachsen: Nährstoff- und Humusmanagement. Ber. Landwirtsch 2021, 99 (Suppl. S2), 1–38. [Google Scholar]
  12. Böhm, H.; Buchecker, K.; Dresow, J.; Dreyer, W.; Landzettel, C.; Mahnke-Plesker, S.; Westhues, F. Optimierung der ökologischen Kartoffelproduktion; Landbauforschung Sonderheft 348. Johann Heinrich von Thünen-Institut (vTI), Institut für Ökologischen Landbau: Westerau, Germany, 2011. [Google Scholar]
  13. Seufert, V.; Ramankutty, N.; Foley, J.A. Comparing the yield of organic and conventional agriculture. Nature 2012, 485, 229–232. [Google Scholar] [CrossRef]
  14. Recknagel, J.; Nußbauer, H. Ertragsentwicklung langjährig viehlos bewirtschafteter Öko-Ackerflächen am Oberrhein. Beitr. Wiss.-Tagung Ökol. Landbau Freising-Weihenstephan 2017, 14, 330–331. Available online: https://orgprints.org/id/eprint/31552/ (accessed on 19 July 2022).
  15. Zikeli, S.; Deil, L.; Möller, K. Nährstoffmanagement in ökologisch bewirtschafteten Gewächshäusern in Südwest-Deutschland: Bedingt der Anbauverband die Düngestrategie? Beitr. Wiss.-Tagung Ökol. Landbau Eberswalde 2015, 13, 280–283. Available online: https://orgprints.org/id/eprint/27137/ (accessed on 19 July 2022).
  16. Urbatzka, P.; Cais, K.; Rehm, A.; Rippel, R. Status-Quo-Analyse von Dauerversuchen: Bestimmung des Forschungsbedarfes für den ökologischen Landbau; Bayer. Landesanstalt für Landwirtschaft, Institut Agrarökologie, Ökologischen Landbau Bodenschutz: Freising, Germany, 2011; Available online: https://orgprints.org/id/eprint/19317/ (accessed on 19 July 2022).
  17. Mayer, J.; Mäder, P. Langzeitversuche–Eine Analyse der Ertragsentwicklung. In Ökologischer Landbau–Grundlagen, Wissensstand und Herausforderungen; Freyer, B., Ed.; UTB: Stuttgart, Germany, 2016; pp. 421–445. [Google Scholar]
  18. Kolbe, H. Wie ist es um die Bodenfruchtbarkeit im Ökolandbau bestellt: Nährstoffversorgung und Humusstatus. In Bodenfruchtbarkeit–Grundlage erfolgreicher Landwirtschaft, Proceedings of the Tagung d. Verbandes d. Landwirtschaftskammern (VLK) Bundesarbeitskreises Düngung (BAD) in Würzburg; Bundesarbeitskreis Düngung: Frankfurt am Main, Germany, 2015; pp. 89–123. Available online: https://orgprints.org/id/eprint/29539/ (accessed on 19 July 2022).
  19. Kolbe, H. Comparative Analysis of Soil Fertility, Productivity, and Sustainability of Organic Farming in Central Europe−Part 1: Effect of Medium Manifestations on Conversion, Fertilizer Types and Cropping Systems. Agronomy 2022, 12, 2001. [Google Scholar] [CrossRef]
  20. Haas, G.; Deittert, C. Stoffflussanalyse und Produktionseffizienz der Milchviehhaltung Unterschiedlich Intensiver ökologisch Wirtschaftender Betriebe; Forschungsbericht FKZ 020E462; Institut für Organischen Landbau: Bonn, Germany, 2004; Available online: https://orgprints.org/id/eprint/5163/ (accessed on 19 July 2022).
  21. Damhofer, I.; Lindenthal, T.; Zollitsch, W.; Bartel-Kratochvil, R. Konventionalisierung: Notwendigkeit einer Bewertung mittels Indikatorsystem, basierend auf den IFOAM-Prinzipien. Beitr. Wiss. Tag. Ökol. Landbau Zürich 2009, 10, 514–517. [Google Scholar]
  22. Sommer, H. Untersuchungen zur Steigerung der Produktionsintensität im ökologischen Landbau am Beispiel des Lehr- und Versuchsbetriebes Gladbacherhof; Giessener Schriften Ökologischen Landbau 3; Dr. Köster Verlag: Berlin, Germany, 2010. [Google Scholar]
  23. Niggli, U. Ökolandbau: Alle Zeichen stehen auf Intensivierung. Mit mehr Forschung ist reichlich Potenzial zu heben. Lebendige Erde 2013, 5, 1. Available online: http://www.lebendigeerde.de/index.php?id=hintergrund_135 (accessed on 19 July 2022).
  24. Kühling, I.; Hess, J.; Trautz, D. Nachhaltige Intensivierung und Ökolandbau–passt das zusammen? Ökol. Landbau 2015, 3, 18–20. [Google Scholar]
  25. Sommer, H.; Krutzinna, C.; Keil, J.; Heß, J. Intensivierung einer Fruchtfolge unter ökologischen Bewirtschaftungsbedingungen–Bewertung der Auswirkungen auf die Nachhaltigkeit. Beitr. Wiss.-Tagung Ökol. Landbau Eberswalde 2015, 13, 1–4. Available online: https://orgprints.org/id/eprint/27159/ (accessed on 19 July 2022).
  26. Freyer, B. Ernährungssicherung. In Ökologischer Landbau–Grundlagen, Wissensstand und Herausforderungen; Freyer, B., Ed.; UTB-Verlagsgruppe, Haupt Verlag: Bern, Switzerland, 2016; pp. 183–191. [Google Scholar]
  27. Freyer, B.; Klimek, M.; Fiala, V. Ethik im Ökologischen Landbau–Grundlagen und Diskurs. In Ökologischer Landbau–Grundlagen, Wissensstand und Herausforderungen; Freyer, B., Ed.; UTB-Verlagsgruppe, Haupt Verlag: Bern, Switzerland, 2016; pp. 44–79. [Google Scholar]
  28. Köpke, U. Ressourcenschutz und ökologische Leistungen. In Ökologischer Landbau–Grundlagen, Wissensstand und Herausforderungen; Freyer, B., Ed.; UTB-Verlagsgruppe, Haupt Verlag: Bern, Switzerland, 2016; pp. 590–612. [Google Scholar]
  29. Blumenstein, B. Sustainable Intensification of Organic and Low-Input Agriculture through Integrated Bioenergy Production; Kassel University Press: Kassel, Germany, 2017. [Google Scholar]
  30. Muller, A.; Schader, C.; El-Hage Scialabba, N.; Brüggemann, J.; Isensee, A.; Erb, K.-H.; Smith, P.; Klocke, P.; Leiber, F.; Stolze, M.; et al. Strategies for feeding the world more sustainably with organic agriculture. Nat. Commun. 2017, 8, 1–13. Available online: https://www.nature.com/articles/s41467-017-01410-w.pdf (accessed on 19 July 2022). [CrossRef]
  31. Haller, L.; Moakes, S.; Niggli, U.; Riedel, J.; Stolze, M.; Thompson, M. Entwicklungsperspektiven der ökologischen Landwirtschaft in Deutschland; Texte 32; Umweltbundesamt: Dessau-Roßlau, Germany, 2020. [Google Scholar]
  32. Rempelos, L.; Baranski, M.; Wang, J.; Adams, T.N.; Adebusuyi, K.; Beckman, J.J.; Brockbank, C.J.; Douglas, B.S.; Feng, T.; Greenway, J.D.; et al. Integrated soil and crop management in organic agriculture: A logical framework to ensure food quality and human health? Agronomy 2021, 11, 2494. Available online: https://doi.org/10.3390/agronomy11122494 (accessed on 19 July 2022). [CrossRef]
  33. Hof-Kautz, C. Wie Entwickeln Sich Langjährige Viehlose Fruchtfolgen Unter den Bedingungen des Ökologischen Landbaus? Landwirtschaftskammer (LWK) Nordrhein-Westfalen: Köln-Auweiler, Germany, 2019; written communication. [Google Scholar]
  34. Koch, W. Grundbodenbearbeitung, Fruchtfolgegestaltung und Düngung im ökologischen viehlosen Ackerbau der Magdeburger Börde. In Jahrestagung Ökologischer Landbau 5; Landesanstalt Landwirtsch., Forsten Gartenb.: Bernburg-Strenzfeld, Germany, 2012. [Google Scholar]
  35. Koch, W. Ertragstrends in modellhaften Fruchtfolgen im mitteldeutschen Trockengebiet–Ergebnisse aus dem Versuch Leistungsfähigkeit verschiedener Landbausysteme am Standort Bernburg. In Internat. Arbeitsgemein. Bodenfruchtbarkeit; written communication; LTFE-Meeting: Gießen, Germany, 2019. [Google Scholar]
  36. Koch, W. Versuch Anbausysteme-Vergleich Bernburg. In DLG-Anbausysteme-Vergleich; written communication; Agritechnica: Hannover, Germany, 2019. [Google Scholar]
  37. Schneider, R.; Salzeder, G.; Schmidt, M.; Wiesinger, K.; Urbatzka, P. Einfluss verschiedener Fruchtfolgen viehhaltender und viehloser Systeme auf Ertrag und Produktivität: Ergebnisse eines Dauerfeldversuches. Beitr. Wiss. Tag. Ökol. Landbau Bonn 2013, 12, 54–57. [Google Scholar]
  38. Castell, A.; Eckl, T.; Schmidt, M.; Beck, R.; Heiles, E.; Salzeder, G.; Urbatzka, P. Fruchtfolgen im Ökologischen Landbau–Pflanzenbaulicher Systemvergleich in Viehhausen und Puch. Zwischenbericht 2005–2013; Schriftenr. Bayer. Landesanstalt Landwirtsch. 9; Freising-Weihenstephan, Germany. 2016. Available online: https://www.lfl.bayern.de/mam/cms07/publikationen/daten/schriftenreihe/fruchtfolgen-oekologischer-landbau_pflanzenbaulicher-systemvergleich_lfl-schriftenreihe.pdf (accessed on 19 July 2022).
  39. Schulz, F. Vergleich Ökologischer Betriebssysteme mit und ohne Viehhaltung bei Unterschiedlicher Intensität der Grundbodenbearbeitung. Effekte auf Flächenproduktivität, Nachhaltigkeit und Umweltverträglichkeit. Ph.D. Thesis, University, Gießen, Germany, 2012. [Google Scholar]
  40. Kolbe, H. Berichte aus dem Ökolandbau 2022–Möglichkeiten und Grenzen der Intensivierung. Zusammenführung der Ergebnisse von komplexen Dauersystemversuchen zur Untersuchung ökologischer Anbau- und Düngungsverfahren in zwei Anbausystemen (Marktfrucht und Futterbau) auf Ertrag, Produktqualität, Bodenfruchtbarkeit und Umweltwirkungen auf einem Sand- und Lößboden in Sachsen; Dr. H. Kolbe: Schkeuditz, Germany, 2022; pp. 1–444. Available online: https://nbn-resolving.org/urn:nbn:de:bsz:14-qucosa2-784857 (accessed on 19 July 2022).
  41. Meyer, D.; Kolbe, H.; Schuster, M. Berichte aus dem Ökolandbau 2021–Das Ökofeld Roda. Ergebnisse zur langjährigen Bewirtschaftung von Feldversuchsflächen der Versuchsstation Roda in Sachsen; Dr. H. Kolbe: Schkeuditz, Germany, 2021; pp. 1–139. Available online: https://nbn-resolving.org/urn:nbn:de:bsz:14-qucosa2-766432 (accessed on 19 July 2022).
  42. Farack, K.; Müller, P.; Schliephake, W.; Kolbe, H. Berichte aus dem Ökolandbau 2021–Dauerversuch zur organischen und mineralischen Grunddüngung. Einfluss steigender organischer sowie mineralischer P- und K-Düngung auf Merkmale der Bodenfruchtbarkeit, Ertrag und Qualität der Fruchtarten in einem ökologischen Dauerversuch auf Lehmboden; Dr. H. Kolbe: Schkeuditz, Germany, 2021; pp. 1–112. Available online: https://slub.qucosa.de/api/qucosa%3A76876/attachment/ATT-0/ (accessed on 19 July 2022).
  43. Meyer, D.; Schmidtke, K.; Wunderlich, B.; Lauter, J.; Wendrock, Y.; Grandner, N.; Kolbe, H. Berichte aus dem Ökolandbau 2021–Nährstoffmanagement und Fruchtfolgegestaltung in sächsischen Ökobetrieben. Analyse des Nährstoff- und Humusmanagements sowie der Fruchtfolgegestaltung in 32 Betrieben des ökologischen Landbaus im Freistaat Sachsen; Dr. H. Kolbe: Schkeuditz, Germany, 2021; pp. 1–104. Available online: https://nbn-resolving.org/urn:nbn:de:bsz:14-qucosa2-769182 (accessed on 19 July 2022).
  44. Reimer, M.; Hartmann, T.E.; Oelofse, M.; Magid, J.; Bünemann, E.K.; Möller, K. Reliance on biological nitrogen fixation depletes soil phosphorus and potassium reserves. Nutr. Cycl. Agroecosyst. 2020, 118, 273–291. [Google Scholar] [CrossRef]
  45. Leisen, E. Hoftor-Bilanz von Phosphor- und Kalium in Öko-Milchviehbetrieben. Beitr. Wiss. Tag. Ökol. Landbau Freis. Weihensteph. 2017, 14, 376–377. Available online: https://orgprints.org/id/eprint/31553/ (accessed on 19 July 2022).
  46. Kolbe, H. Nährstoff- und Humusversorgung im Ökolandbau. Über die unterschiedlichen Entwicklungstendenzen bei der Bodenfruchtbarkeit. In Der kritische Agrarbericht 2016; AgrarBündnis, Konstanz; ABL Bauernblatt Verlag: Hamm, Germany, 2016; pp. 168–173. [Google Scholar]
  47. Brock, C.; Oltmanns, M.; Spiegel, A.-K. Humusmanagement und Humusbilanz hessischer Öko-Betriebe; Broschüre; Landesbetrieb Landwirtschaft Hessen (LLH): Kassel, Germany, 2013; Available online: https://orgprints.org/id/eprint/22605/ (accessed on 19 July 2022).
  48. Hülsbergen, K.-J.; Schmid, H. Treibhausgasemissionen ökologischer und konventioneller Betriebssysteme. Emissionen landwirtschaftlich genutzter Böden. KTBL Schrift 2010, 483, 229–483. [Google Scholar]
  49. Quirin, M.; Emmerling, C.; Schröder, D. Phosphorgehalte und -bilanzen konventionell, integriert und biologisch bewirtschafteter Acker- und Grünlandflächen und Maßnahmen zum Phosphorabbau hoch versorgter Flächen. Pflanzenbauwiss 2006, 10, 60–65. [Google Scholar]
  50. Gutser, R.; Reents, H.J.; Rühling, I.; Schmid, H.; Weinfurtner, K.H. Flächen- und betriebsbezogene Indikatoren auf der Grundlage des Langzeitmonitorings. In Forschungsverbund Agrarökosysteme München Jahresbericht: 2002; Forschungsverbund Agrarökosysteme München: München, Germany, 2002; pp. 147–159. Available online: https://mediatum.ub.tum.de/doc/1304992/document.pdf (accessed on 19 July 2022).
  51. Friedel, J.; Kasper, M.; Schmid, H.; Hülsbergen, K.-J.; Freyer, B. Need for phosphorus input in Austrian organic farming? Proc. ISOFAR Sci. Conf. Istanb. Turk. 2014, 4, 37–40. [Google Scholar]
  52. Berry, P.M.; Stockdale, E.A.; Sylvester-Bradley, R.; Philipps, L.; Smith, K.A.; Lord, E.I.; Watson, C.A.; Fortune, S. N, P and K budgets for crop rotations on nine organic farms in the UK. Soil Use Manag. 2003, 19, 112–118. [Google Scholar] [CrossRef]
  53. Vetter, R.; Miersch, M.; Weissbart, J.; Freyer, B.; Rennenkampff, K. Stickstoffversorgung und -Dynamik in Fruchtfolgen Vieharmer Betriebe des Ökologischen Landbaus; Abschlussbericht; ITADA-Sekretatiat: Colmar, France, 2000; Available online: https://orgprints.org/id/eprint/2439/ (accessed on 19 July 2022).
  54. Asdal, A.; Bakken, A.K. Nutrient balances and yields during conversion to organic farming in two crop rotation systems. In Designing and Testing Crop Rotations for Organic Farming: Proceedings from an International Workshop; Olesen, J.E., Eltun, R., Gooding, M.J., Jensen, E.S., Köpke, U., Eds.; Danish Research Centre for Organic Farming (DARCOF): Tjele, Denmark, 1999; pp. 125–132. [Google Scholar]
  55. Wehrmann, J.; Scharpf, H.C. Der Mineralstickstoffgehalt des Bodens als Maßstab für den Stickstoffdüngebedarf (Nmin-Methode). Plant Soil 1979, 52, 109–126. [Google Scholar] [CrossRef]
  56. Hoffmann, G. Die Untersuchung der Böden. In VDLUFA-Methodenbuch 1; VDLUFA-Verlag: Darmstadt, Germany, 1991. [Google Scholar]
  57. Kerschberger, M.; Deller, B.; Hege, U.; Heyn, J.; Kape, H.-E.; Krause, O.; Pollehn, J.; Rex, M.J.; Severin, K. Bestimmung des Kalkbedarfs von Acker- und Grünlandböden; Standpunkt; VDLUFA: Darmstadt, Germany, 2000. [Google Scholar]
  58. Egner, H.; Riehm, H. Die Doppellactatmethode, zit; Methodenbuch, I., von Thun, R., Hermann, R., Knickmann, E., Eds.; Neumann-Verlag: Berlin, Germany, 1955. [Google Scholar]
  59. Schüller, H. Die CAL-Methode, eine neue Methode zur Bestimmung des pflanzenverfügbaren Phosphates in Böden. Z. Pflanzenern. Bodenkde. 1969, 123, 48–63. [Google Scholar] [CrossRef]
  60. Schachtschabel, P. Die Magnesiumversorgung nordwestdeutscher Böden und seine Beziehungen zum Auftreten von Mangelsymptomen an Kartoffeln. Z. Pflanzenern. Bodenkde. 1956, 74, 202–219. [Google Scholar] [CrossRef]
  61. Kasper, M.; Freyer, B.; Amon, B.; Hülsbergen, K.-J.; Schmid, H.; Friedel, J.K. Modellberechnungen für treibhausgasrelevante Emissionen und Senken in landwirtschaftlichen Betrieben Ost-Österreichs. Beitr. Wiss. Tag. Ökol. Landbau Gießen 2011, 11, 177–180. [Google Scholar]
  62. DOK Versuch. Schweiz; Landwirtschaftl. Forsch., Sonderausgabe 1995; Eidgenöss. Forschungsanstalt Agrikulturchemie Umwelthygiene (FAC): Liebefeld, Switzerland, 1995.
  63. Mäder, P.; Fliessbach, A.; Dubois, D.; Gunst, L.; Fried, P.; Niggli, U. Soil fertility and biodiversity in organic farming. Science 2002, 296, 1694–1697. [Google Scholar] [CrossRef]
  64. Oehl, F.; Oberson, A.; Tagmann, H.U.; Besson, J.M.; Dubois, D.; Mäder, P.; Roth, H.-R.; Frossard, E. Phosphorus budget and phosphorus availability in soils under organic and conventional farming. Nutr. Cycl. Agroecosyst. 2002, 62, 25–35. [Google Scholar] [CrossRef]
  65. Zimmer, J.; Dittmann, B. Nährstoffbilanzen im ökologischen Landbau unter Berücksichtigung unterschiedlicher Bewirtschaftungssysteme. In VDLUFA-Schriftenreihe; Kongressband: Bonn, Germany, 2004; Volume 59, pp. 75–83. [Google Scholar]
  66. Zimmer, J.; Dittmann, B. Nährstoffbilanzen im Ökologischen Landbau Unter Berücksichtigung Unterschiedlicher Bewirtschaftungssysteme; LVL Brandenburg: Güterfelde, Germany. Available online: https://gruendungsnetz.brandenburg.de/sixcms/media.php/4055/N%C3%A4hrstoffbilanzen%20im%20%C3%B6kologischen%20Landbau.pdf (accessed on 19 July 2022).
  67. Köpke, U.; Dahn, C.; Täufer, F.; Zaller, J. Soil fertility properties in a long-term field experiment with organic and biodynamic farmyard manure amendment. In Long Term Field Experiments in Organic Farming; Raupp, J., Pekrun, C., Oltmanns, M., Köpke, U., Eds.; ISOFAR Scientific Series 1; Verlag Dr. Köster: Berlin, Germany, 2006; pp. 33–40. [Google Scholar]
  68. Gruber, H.; Thamm, U. Standortspezifische Auswirkungen Einer Langjährigen Ökologischen Bewirtschaftung auf Acker- und Pflanzenbauliche Sowie Umweltrelevante Parameter; Forschungsbericht 22/04; Landesforschungsanstalt für Landwirtschaft Fischerei: Gülzow, Germany, 2005; Available online: https://orgprints.org/id/eprint/9346/ (accessed on 19 July 2022).
  69. Kolbe, H. Zusammenführende Untersuchungen zur Genauigkeit und Anwendung von Methoden der Humusbilanzierung im konventionellen und ökologischen Landbau. In Bilanzierungsmethoden und Versorgungsniveau für Humus; Schriftenr; Landesamt für Umwelt, Landwirtschaft und Geologie (LfULG): Dresden, Germany, 2012; Volume H19, pp. 4–85. Available online: https://orgprints.org/id/eprint/20826/ (accessed on 19 July 2022).
  70. Alvermann, G. Muss ich dem Boden etwas zurückgeben. Bioland 1990, 5, 6–7. [Google Scholar]
  71. Schmidt, H. Viehlose Fruchtfolge im Ökologischen Landbau. Auswirkungen Systemeigener und Systemfremder Stickstoffquellen auf Prozesse im Boden und die Entwicklung der Feldfrüchte. Ph.D. Thesis, Univ. Gesamthochschule, Kassel, Germany, 1997. [Google Scholar]
  72. Schmidt, H. Viehloser Öko-Ackerbau; Verlag Dr. Köster: Berlin, Germany, 2004. [Google Scholar]
  73. Emmerling, C.; Schröder, D. Ist viehlose Wirtschaft im ökologischen Landbau nachhaltig? In Kongressband 2000; VDLUFA-Schriftenr; Kongressband: Darmstadt, Germany, 2000; Volume 55, pp. 61–67. [Google Scholar]
  74. Schmidtke, K.; Rauber, R. Stickstoffeffizienz von Leguminosen im Ackerbau. In Stickstoffeffizienz Landwirtschaftlicher Kulturpflanzen; Möllers, C., Ed.; Initiativen Umweltschutz 21; E. Schmidt Verlag: Berlin, Germany, 2000; pp. 48–69. [Google Scholar]
  75. Kolbe, H. Anwendungsbeispiele zur standortangepassten Humusbilanzierung im ökologischen Landbau. In Standortangepasste Humusbilanzierung im Ökologischen Landbau. Informationen für Praxis, Beratung und Schulung; Landesamt für Umwelt, Landwirtschaft und Geologie (LfULG): Dresden, Germany, 2013; Available online: https://orgprints.org/id/eprint/23098/ (accessed on 19 July 2022).
  76. Kolbe, H. Vergleich von Methoden zur Berechnung der biologischen N2-Fixierung von Leguminosen zum Einsatz in der landwirtschaftlichen Praxis. Pflanzenbauwiss 2009, 13, 23–36. [Google Scholar]
  77. Richter, S.; Debruck, J. Einfluss der Reihenweite auf Ertrag und Qualität von Winterweizen. Beitr. Wiss.-Tag. Ökol. Landbau Freis. Weihensteph. 2001, 6, 233–236. [Google Scholar]
  78. Neumann, H.J. Optimierungsstrategien für den Getreideanbau im Ökologischen Landbau: System “weite Reihe” und Direktsaat in Ausdauernden Weißklee (Bi-cropping). Ph.D. Thesis, Universität, Kiel, Germany, 2005. [Google Scholar]
  79. Becker, K.; Leithold, G. Ausweitung des Anbaukonzeptes Weite Reihe bei Winterweizen auf Roggen, Hafer, Raps und Körnererbsen. Eine pflanzenbauliche und betriebswirtschaftliche Untersuchung unter Berücksichtigung der Vorfruchtwirkungen; Forschungsprojekt 03OE100; JLU Universität Gießen: Gießen, Germany, 2007; Available online: https://orgprints.org/id/eprint/14858/ (accessed on 19 July 2022).
  80. Stumm, C.; Köpke, U. Optimierung des Futterleguminosenanbaus im viehlosen Acker- und Gemüsebau. Beitr. Wiss. Tag. Ökol. Landbau Eberswalde 2015, 13, 1–4. Available online: https://orgprints.org/id/eprint/27196/ (accessed on 19 July 2022).
  81. Casper, S.; Heß, J.; Bruns, C. Transferdüngung mit Kleegras: Auswirkungen verschiedener Düngesubstrate und -stufen auf den Kornertrag von Winterweizen. Beitr. Wiss. Tag. Ökol. Landbau Kassel 2019, 15, 1–4. Available online: https://orgprints.org/id/eprint/36240/ (accessed on 19 July 2022).
  82. Gengenbach, H.; Haase, T. Strategien zur Erzeugung von Qualitätsgetreide in viehlosen/-armen Marktfruchtbetrieben. Beitr. Wiss. Tag. Ökol. Landbau Kassel 2019, 15, 1–5. Available online: https://orgprints.org/id/eprint/36259/ (accessed on 19 July 2022).
  83. Askegaard, M.; Eriksen, J.; Olesen, J.E. Exchangeable potassium and potassium balances in organic crop rotations on a coarse sand. Soil Use Manag. 2006, 19, 96–103. [Google Scholar] [CrossRef]
  84. Kolbe, H. Einfluss des Klimawandels auf Humus- und Stickstoffvorräte im Boden sowie Kompensationsmöglichkeiten durch Umstellung auf den Ökologischen Landbau am Beispiel von Sachsen, Schriftenr, Landesamt für Umwelt, Landwirtschaft und Geologie (LfULG): Dresden, Germany, 2011, H6, 4–15. Available online: https://orgprints.org/id/eprint/19353/ (accessed on 19 July 2022).
  85. Schulte, G.; Schröder, D. P-und K-Extraktionsverfahren zur Kennzeichnung des Versorgungsgrades unterschiedlich lange ökologisch bewirtschafteter Böden in Rheinland-Pfalz. In Kongressband 1996; VDLUFA-Schriftenr; Kongressband: Darmstadt, Germany, 1996; Volume 44, pp. 437–440. [Google Scholar]
  86. Leithold, G.; Hülsbergen, K.-J.; Michel, D.; Schönmeier, H. Humusbilanz–Methoden und Anwendung als Agrar-Umweltindikator. In Initiativen Umweltschutz 5; Zeller Verlag: Osnabrück, Germany, 1997; pp. 43–54. [Google Scholar]
  87. Kolbe, H. Leistungsfähigkeit von Merkmalen der Bodenfruchtbarkeit für das Nährstoffmanagement des ökologischen Landbaus. In Vortragsveranstaltung mit Feldtag “Forschung zum Ökologischen Landbau in Sachsen”; Sächsische Landesanstalt für Landwirtschaft: Roda, Germany, 2006; Available online: https://orgprints.org/id/eprint/8975/ (accessed on 19 July 2022).
  88. Schulz, F.; Brock, C.; Knebl, L.; Leithold, G. Gemischtbetrieb mit Viehhaltung vs. viehloser Ökolandbau. 3. Rotation im Dauerfeldversuch Gladbacherhof. Beitr. Wiss. Tag. Ökol. Landbau Freis. Weihensteph. 2017, 14, 286–289. Available online: https://orgprints.org/id/eprint/31955/ (accessed on 19 July 2022).
  89. Friedel, J.K. HUMUS–Datengrundlage für Treibhausrelevante Emissionen und Senken in Landwirtschaftlichen Betrieben und Regionen Österreichs; Endbericht; Department für Nachhaltige Agrarsysteme, Institut für Ökologischen Landbau, Universität für Bodenkultur: Wien, Austria, 2012. [Google Scholar]
  90. Auerswald, K.; Kainz, M.; Scheinost, A.C.; Sinowski, W. The Scheyern experimental farm: Research methods, farming system and definition of site properties and characteristics. In Ecosystem Approaches to Landscape Management in Central Europe; Tenhunen, J.D., Lenz, R., Hantschel, R., Eds.; Springer Science & Business Media: Berilin, Germany, 2001; Volume 147, pp. 183–194. [Google Scholar]
  91. Raupp, J. Forschungsthemen und Ergebnisse eines Langzeitdüngungsversuchs in zwei Jahrzehnten, ein Beitrag zur Bewertung von pflanzenbaulichen Langzeitversuchen. Ber. Landwirtsch. 2001, 79, 71–93. [Google Scholar]
  92. Reents, H.J.; Kimmelmann, S.; Kainz, M.; Hülsbergen, K.-J. Biogas-Fruchtfolgeversuch Viehhausen –Versuchsanlage sowie Ertrag- und Qualitätseffekte bei Winterweizen. Beitr. Wiss. Tag. Ökol. Landbau Gießen 2011, 11, 76–80. [Google Scholar]
  93. Schrama, M.; de Haan, J.J.; Kroonen, M.; Verstegen, H.; Van der Putten, W.H. Crop yield gap and stability in organic and conventional farming systems. Agric. Ecosyst. Environ. 2018, 256, 123–130. [Google Scholar] [CrossRef]
  94. Raussen, T.; Richter, F.; Kern, M.; Müller, H.-J.; Gottschall, R.; Bruns, C. Nährstoffrückführung durch Biogut-und Grüngutkomposte in den Ökologischen Landbau Hessens (Öko-Kompost); Endbericht; Hessisches Ministerium für Umwelt, Klimaschutz, Landwirtschaft und Verbraucherschutz (HMUKLV): Wiesbaden, Germany, 2019.
  95. Harzer, N. Humus-und Nährstoffhaushalt Ökologischer Betriebe und Systemversuche im Land Sachsen-Anhalt. Diploma Thesis, Universität, Halle-Wittenberg, Germany, 2006. [Google Scholar]
  96. Engelmann, K. Ökologisch nachhaltiges Betriebsmanagement mit dem Modell REPRO. In Naturland Ackerbautagung Würzburg; Naturland: Gräfelfing, Germany, 2010. [Google Scholar]
  97. Mitscherlich, E.A. Das Gesetz vom Minimum und das Gesetz des abnehmenden Bodenertrages. Landwirtsch. Jahrb. 1909, 38, 537–552. [Google Scholar]
  98. Kolbe, H. Einfluss mineralischer P- und K-Düngung auf die Ertragsreaktion der Fruchtarten in Abhängigkeit von der Nährstoffversorgung des Bodens unter den Anbaubedingungen des ökologischen Landbaus in Deutschland. J. Kulturpflanz. 2019, 71, 161–181. [Google Scholar]
  99. Van der Werff, P.A.; Baars, A.; Oomen, G.J.M. Nutrient balances and measurement of nitrogen losses on mixed ecological farms on sandy soils in the Netherlands. In Nitrogen Leaching in Ecological Agriculture; Kristensen, L., Stopes, C., Kølster, P., Granstedt, A., Eds.; Proceedings Internat. Workshop; University: Copenhagen, Denmark, 1995; pp. 41–50. [Google Scholar]
  100. Küstermann, B.; Christen, O.; Hülsbergen, K.-J. Modelling nitrogen cycles of farming systems as basis of site- and farm-specific nitrogen management. Agric. Ecosyst. Environ. 2010, 135, 70–80. [Google Scholar] [CrossRef]
  101. Schulz, F.; Brock, C.; Leithold, G. Viehhaltung im Ökologischen Landbau–ja oder nein? Effekte auf Bodenfruchtbarkeit, N-Bilanzen und Erträge. Beitr. Wiss. Tag. Ökol. Landbau Bonn 2013, 12, 20–23. Available online: https://orgprints.org/id/eprint/21379/ (accessed on 19 July 2022).
  102. Van Delden, A. Yield, and growth components of potato and wheat under organic nitrogen management. Agron. J. 2001, 93, 1370–1385. [Google Scholar] [CrossRef]
  103. Berry, P.M.; Sylvester-Bradley, R.; Philipps, L.; Hatch, D.J.; Cuttle, S.P.; Rayns, F.W.; Gosling, P. Is the productivity of organic farms restricted by the supply of available nitrogen? Soil Use Manag. 2002, 18, 248–255. [Google Scholar] [CrossRef]
  104. Gunst, L.; Richner, W.; Mäder, P.; Mayer, J. DOK-Versuch: Nährstoffversorgung in Winterweizen–Wo wird es eng? Agrarforsch. Schweiz 2013, 4, 74–81. [Google Scholar]
  105. Möller, K.; Friedel, J.K. Pflanzenernährung und Düngung. In Ökologischer Landbau–Grundlagen, Wissensstand und Herausforderungen; Freyer, B., Ed.; UTB-Verlagsgruppe, Haupt Verlag: Bern, Switzerland, 2016; pp. 467–485. [Google Scholar]
  106. Kolbe, H. Berichte aus dem Ökolandbau 2021–Nährstoffumsatz, Ertrag und Qualität von Kartoffeln. Einfluss mineralischer und organischer Düngemittel auf den Nährstoffumsatz im Boden sowie Ertrag und Qualität von Kartoffeln im Ökologischen Landbau; Dr. H. Kolbe: Schkeuditz, Germany, 2021; pp. 1–144. Available online: https://nbn-resolving.org/urn:nbn:de:bsz:14-qucosa2-767203 (accessed on 19 July 2022).
  107. Schuphan, W. Mensch und Nahrungspflanze. Der Biologische Wert der Nahrungspflanze in Abhängigkeit von Pestizideinsatz, Bodenqualität und Düngung; Dr. W. Junk Publishers: The Hague, The Netherlands, 1976. [Google Scholar]
  108. Kolbe, H. Acker- und pflanzenbaulicher, Ökologischer und Ökonomischer Vergleich Verschiedener Landwirtschaftlicher Bewirtschaftungssysteme Unterschiedlicher Intensität und Schlußfolgerungen für Weitere Notwendige Untersuchungen Unter Besonderer Berücksichtigung der Landwirtschaftlichen Bedingungen in den Neuen Bundesländern; Literaturstudie; Institut für Bodenkultur und Pflanzenbau, Sächsische Landesanstalt für Landwirtschaft: Leipzig, Germany, 1993; unpublished. [Google Scholar]
  109. Kolbe, H. Landnutzung und Wasserschutz. Der Einfluss von Stickstoff-Bilanzierung, Nmin-Untersuchung und Nitrat-Auswaschung Sowie Rückschlüsse für die Bewirtschaftung von Wasserschutzgebieten in Deutschland. Land Use and Water Protection. Effects on Nitrogen Budget, Nmin-values, Nitrate Content and Leaching in Germany; WLV Wissenschaftliches Lektorat & Verlag: Leipzig, Germany, 2000. [Google Scholar]
  110. Hoffmann, H.; Hübner, W. Ökologischer Landbau auf leichten Böden–Ertragsparameter und Bodenfruchtbarkeitskennziffern aus dem Demonstrationsversuch Ackerbausysteme in Blumberg bei Berlin. Beitr. Wiss. Tag. Ökol. Landbau Freis. Weihensteph. 2001, 6, 171–174. [Google Scholar]
  111. Loges, R.; Taube, F. Nitratauswaschung, Ertrag und N-Bilanz zweier Fruchtfolgen mit unterschiedlichem Leguminosenanteil im mehrjährigen Vergleich. Beitr. Wiss. Tag. Ökol. Landbau Gießen 2011, 11, 89–92. [Google Scholar]
  112. Watson, C.A.; Bengtsson, H.; Ebbesvik, M.; Loes, A.-K.; Myrbeck, A.; Salomon, E.; Schroder, J.; Stockdale, E.A. A review of farm-scale nutrient budges for organic farms as a tool for management of soil fertility. Soil Use Mangag. 2002, 18, 264–273. [Google Scholar] [CrossRef] [Green Version]
  113. Reimer, M.; Möller, K.; Hartmann, T.E. Meta-analysis of nutrient budgets in organic farms across Europe. Org. Agric. 2020, 10, 65–77. [Google Scholar] [CrossRef]
  114. Abele, U. Einfluss mineralischer und organischer Düngung sowie der biologisch-dynamischen Präparate auf Qualitätsmerkmale pflanzlicher Produkte und auf Bodeneigenschaften. Schriftenr. Bundesminister Ernährung, Landwirtsch. Forsten; Reihe A. Angew. Wiss. 1987, 345. [Google Scholar]
  115. Köppen, D. Langjährige Entwicklung des Gehaltes an pflanzenverfügbaren Nährstoffen in unterschiedlichen Bodennutzungssystemen. Beitr. Wiss. Tag. Ökol. Landbau Bonn 1997, 4, 122–128. [Google Scholar]
  116. Kolbe, H.; Beckmann, U. Einfluss extrem unterschiedlich hoher mineralischer und organischer Düngung und Beregnung auf Ertragsleistung der Kulturarten, Bodenfruchtbarkeit und Umweltverträglichkeit eines Sandbodens. In Umweltwirkungen von Extensivierungsmaßnahmen; Schriftenr, Sächsische Landesanstalt für Landwirtschaft (LfL): Dresden, Germany, 2003; Volume 8, H6, pp. 1–41. Available online: https://publikationen.sachsen.de/bdb/artikel/14035/documents/16492 (accessed on 19 July 2022).
  117. Sauerbeck, D. Funktion, Güte und Belastbarkeit des Bodens aus Agrikulturchemischer Sicht; Verlag W. Kohlhammer: Stuttgart, Germany, 1985. [Google Scholar]
  118. Meyer, D.; Kolbe, H. Improvement of nitrogen-fertilizer recommendation by consideration of long-term site and cultivation effected mineralization. Agronomy 2021, 11, 2492. Available online: https://doi.org/10.3390/agronomy11122492 (accessed on 19 July 2022). [CrossRef]
  119. Zikeli, S.; Gottschlich, H.; Fürnkranz, M.; Szin, S. Gemüsebau. In Ökologischer Landbau–Grundlagen, Wissensstand und Herausforderungen; Freyer, B., Ed.; UTB-Verlagsgruppe, Haupt Verlag: Bern, Switzerland, 2016; pp. 367–391. [Google Scholar]
  120. Kolbe, H.; Köhler, B. Erstellung und Beschreibung des PC-Programms BEFU, Teil Ökologischer Landbau. Verfahren der Grunddüngung, legumen N-Bindung, Nährstoff-und Humusbilanzierung. In BEFU–Teil Ökologischer Landbau; Schriftenr, Landesamt für Umwelt, Landwirtschaft und Geologie (LfULG): Dresden, Germany, 2008; Volume H36, pp. 1–256. Available online: https://orgprints.org/id/eprint/15101/ (accessed on 19 July 2002).
  121. Kolbe, H. Site-adjusted organic matter-balance method for use in arable farming systems. J. Plant Nutr. Soil Sci. 2010, 173, 678–691. [Google Scholar] [CrossRef]
  122. Kolbe, H.; Meinck, S.; Rikabi, F.; Schließer, I. Einfluss von Boden, Klima und Bewirtschaftung auf Corg, Nt und N-Effizienz im Ackerbau. Mathematisch-statistische Auswertungen von Ergebnissen aus Dauerversuchen in Mitteleuropa; Dr. H. Kolbe: Schkeuditz, Germany, 2022; in preparation. [Google Scholar]
  123. Surböck, A.; Heinzinger, M.; Schmid, H.; Friedel, J.K.; Freyer, B. Auswirkungen unterschiedlicher Leguminosenanteile in der Fruchtfolge auf Humus- und Stickstoffhaushalt. Beitr. Wiss. Tag. Ökol. Landbau Bonn 2013, 12, 164–165. [Google Scholar]
  124. Mayer, J.; Jarosch, K.A.; Hammelehle, A.; Dubois, D.; Gunst, L.; Bosshard, C.; Frossard, E.; Mäder, P.; Oberson, A. Stickstoffbilanzen in biologischen und konventionellen Anbausystemen–Das Effizienz-Nachhaltigkeits-Dilemma. Beitr. Wiss. Tag. Ökol. Landbau Freis. Weihensteph. 2017, 14, 828–831. Available online: https://orgprints.org/id/eprint/31925/ (accessed on 19 July 2022).
  125. Solberg, S.O. Influence of crops and cultivation magagement on the nitrogen leaching potential on ecological farms in south east Norway. In Nitrogen Leaching in Ecological Agriculture; Kristensen, L., Stopes, C., Kølster, P., Granstedt, A., Eds.; Proceedings Internat. Workshop; University of Copenhagen: Copenhagen, Denmark, 1995; pp. 115–121. [Google Scholar]
  126. Gruber, H. Auswirkungen Einer Langjährigen Ökologischen Bewirtschaftung auf Acker-und Pflanzenbauliche Sowie Umweltrelevante Parameter am Standort Gülzow; Abschlussbericht Forschungs-Nr. 4/02; Landesforschungsanstalt für Landwirtschaft und Fischerei Mecklenburg-Vorpommern; Institut für Acker- und Pflanzenbau: Gülzow, Germany, 2013. [Google Scholar]
  127. Kolbe, H. Fruchtfolgegestaltung im ökologischen und extensiven Landbau: Bewertung von Vor-fruchtwirkungen. Pflanzenbauwiss 2006, 10, 82–89. [Google Scholar]
  128. Kolbe, H. Fruchtfolgegrundsätze im Ökologischen Landbau; Faltblatt; Sächsisches Landesamt für Umwelt, Landwirtschaft und Geologie: Dresden, Germany, 2008; Available online: https://orgprints.org/id/eprint/15100/ (accessed on 19 July 2022).
  129. Jarosch, K.A.; Gunst, L.; Dubois, D.; Mäder, P.; Mayer, J. Phosphor- und Kalium-Bilanzen über 35 Jahre DOK-Versuch & geschätzte K-Nachlieferungsraten auf einem Lössboden. Beitr. Wiss. Tag. Ökol. Landbau Freis. Weihensteph. 2017, 14, 318–321. Available online: https://orgprints.org/id/eprint/31861/ (accessed on 19 July 2022).
  130. Thorup-Kristensen, K.; Dresboll, D.B.; Kristensen, H.L. Crop yield, root growth, and nutrient dynamics in a conventional and three organic cropping systems with different levels of external inputs and N re-cycling through fertility building crops. Eur. J. Agron. 2012, 37, 66–82. [Google Scholar] [CrossRef]
  131. Paulsen, H.M.; Böhm, H.; Freyer, B. Fruchtfolgen. In Ökologischer Landbau–Grundlagen, Wissensstand und Herausforderungen; Freyer, B., Ed.; UTB-Verlagsgruppe, Haupt Verlag: Bern, Switzerland, 2016; pp. 336–366. [Google Scholar]
  132. Steffens, D.; Leppin, T.; Luschin-Ebengreuth, N.; Yang, Z.M.; Schubert, S. Organic soil phosphorus considerably contributes to plant nutrition but is neglected by routine soil-testing methods. J. Plant Nutr. Soil Sci. 2010, 173, 765–771. [Google Scholar] [CrossRef]
  133. Eichler-Löbermann, B.; Winklhofer, P.; Zicker, T.; Freitag, F. Phosphorus pools in the soil profile–results of different fertilizer practices over 20 years. In Internat. Arbeitsgemein. Bodenfruchtbarkeit; LTFE-Meeting: Gießen, Germany, 2019; written communication. [Google Scholar]
  134. Meyer, D.; Grandner, N.; Kolbe, H. Strategien zur Optimierung betrieblicher Kohlenstoff- und Stickstoffkreisläufe von landwirtschaftlichen Anbausystemen in Sachsen. In Optimierung von Kohlenstoff- und Stickstoffkreisläufen; Schriftenr, Landesamt für Umwelt, Landwirtschaft und Geologie (LfULG): Dresden, Germany, 2019; Volume H15, pp. 1–138. Available online: https://publikationen.sachsen.de/bdb/artikel/34764/documents/54109 (accessed on 19 July 2022).
  135. Watson, C.A.; Atkinson, D.; Gosling, P.; Jackson, L.R.; Rayns, F.W. Managing soil fertility in organic farming systems. Soil Use Manag. 2002, 18, 239–247. [Google Scholar] [CrossRef]
  136. Engelmann, K.; Hülsbergen, K.-J. Stickstoffkreislauf und Stickstoffeffizienz. Nat. Nachr. 2012, 1, 15–17. [Google Scholar]
  137. Häußermann, U.; Bach, M.; Klement, L.; Breuer, L. Stickstoff-Flächenbilanz für Deutschland mit Regionalgliederung Bundesländer und Kreise–Jahre 1995 bis 2017. Methodik, Ergebnisse und Minderungsmaßnahmen. In Texte 131; Umweltbundesamt: Dessau-Roßlau, Germany, 2019. [Google Scholar]
  138. Möller, K.; Habermeyer, J.; Zinkernagel, V.; Reents, H.-J. Impact and interaction of nitrogen and Phytophtora infestans as yield-limiting and yield-reducing factors in organic potato (Solanum tuberosum L.) crops. Potato Res. 2007, 49, 281–301. [Google Scholar] [CrossRef]
  139. Schulz, V. Pflanzenverfügbares Kalium in norddeutschen Sandböden als Grundlage Umweltschonender Kalium-Düngung von Ackerkulturen. Ph.D. Thesis, University of Göttingen, Göttingen, Germany, 1994. [Google Scholar]
  140. Auerswald, K.; Kainz, M.; Angermüller, S.; Steindl, H. Influence of exchangeable potassium on soil erodibility. Soil Use Manag. 1996, 12, 117–121. [Google Scholar] [CrossRef]
  141. Wulff, F.; Schulz, V.; Jungk, A.; Claassen, N. Potassium fertilization on sandy soils in relation to soil test, crop yield and K-leaching. Z. Pflanzenernähr. Bodenk. 1998, 161, 591–599. [Google Scholar] [CrossRef]
  142. Nieder, R. Nährstoffanreicherung in Ackerkrumen vor dem Hintergrund des Boden-, Klima- und Gewässerschutzes. Z. Kulturtechn. Landentw. 2000, 41, 49–56. [Google Scholar]
  143. Unterschiede Zwischen der EU-Verordnung Ökologischer Landbau und den Richtlinien der Anbauverbände Bioland, Naturland und Demeter; Umweltinstitut München: München, Germany, 2014; Available online: https://www.umweltinstitut.org/fileadmin/Mediapool/Downloads/07_FAQ/Lebensmittel/vergleich_richtlinien.pdf (accessed on 19 July 2022).
  144. The Royal Society. Reaping the Benefits: Science and the Sustainable Intensification of Global Agriculture. 2009. Available online: https://royalsociety.org/~/media/royal_society_content/policy/publications/2009/4294967719.pdf (accessed on 19 July 2022).
  145. Meemken, E.-M.; Qaim, M. Organic agriculture, food security, and the environment. Ann. Rev. Resour. Econ. 2018, 10, 39–63. [Google Scholar] [CrossRef] [Green Version]
Figure 1. Changes in some balance criteria, mineralization and reactive N, and GE-yield as a function of four intensity levels (in LU ha−1) from long-term experiments on loamy (above) and sandy soils (below) in absolute values and standard deviations.
Agronomy 12 02060 g001
Figure 2. Temporal change of Nmin amounts in the depth profile between the years 2000 (on the left) and 2007 (on the right) according to differentiated fertilization intensity (in LU ha−1) on loam soil (ms = ±1.20 kg N ha−1).
Agronomy 12 02060 g002
Figure 3. Relationship between increasing N balances and the annual change in Corg (above) and Nt, concentrations (below) of loamy and sandy soils in organic farming systems with 33% forage legumes in the crop rotations.
Agronomy 12 02060 g003aAgronomy 12 02060 g003b
Figure 4. Relationship between increasing P and K balances and the annual change in PDL (above) and KDL (below) concentrations of loamy and sandy soils in organic farming systems with 33% forage legumes in the crop rotations.
Agronomy 12 02060 g004
Figure 5. Effects of increasing organic N fertilization and legume proportions in crop rotations on the results of humus balancing on heavy soils.
Agronomy 12 02060 g005
Figure 6. Effects of increasing organic N fertilization and legume proportions in crop rotations on the calculated N2 fixation levels of legumes on heavy soils.
Agronomy 12 02060 g006
Figure 7. Effects of increasing organic N fertilization and legume proportions in crop rotations on soil Nmin contents in early spring on heavy soils.
Agronomy 12 02060 g007
Figure 8. Effects of increasing organic N fertilization and legume proportions of the crop rotation GE yield on heavy soils.
Agronomy 12 02060 g008
Figure 9. Effects of increasing organic N fertilization and legume proportions in crop rotations on the N balances of crop rotations on heavy soils.
Agronomy 12 02060 g009
Figure 10. Effects of increasing organic N fertilization and legume proportions in crop rotations on P balances (above) and K balances (below) of crop rotations on heavy soils.
Agronomy 12 02060 g010
Figure 11. Relationship between N balances (above) or N supply (below) and the determined N efficiencies in the trial studies presented here on heavy soils and in organic farming practice.
Agronomy 12 02060 g011
Figure 12. Effects of increasing organic N fertilization and legume proportions in crop rotations on the total N efficiency of organic farming systems on heavy soils.
Agronomy 12 02060 g012
Table 1. Location, site, soil, and cropping factors of the participating long-term field trials with different amounts of legumes in the crop rotations.
Legume Content up to 20%Legume Content Approx. 33%Legume Content around 50%
Location
Trial siteKöln-AuweilerBernburgViehhausenVillmarMethauSprödaRodaRoda
Altitude (m above sea level)4880480160–170265120224224
Trial typeExact experimentExact experimentExact experimentExact experimentExact experimentExact experimentLarge plot experimentExact experiment
Climate
Mean precipitation (mm per year)750469797649693547711711
Mean annual temperature (°C)9.59.17.59.58.48.88.68.6
Soils
Soil typeSandy loamSilty loamSandy loamStrong clayey siltLoamPoor loamy sandLoamLoam
Soil quality index65–7085–96616670/6330/336868
Clay content (%)-222524–3215–185–712–1513
Cultivation and fertilization system
Cultivation systemMarket crop system with field vegetablesConventional and organic systems with and without livestock6 crop rotation systems in comparisonForage production, market crop and soil cultivation systems, partial clover-grass mulching, straw fertilizationForage production (by-products removed),
market crop systems (by-products remain, clover-grass mulching)
Forage production (by-products removed),
market crop systems (by-products remain, clover-grass mulching)
Typical livestock-less and livestock-rich cropping systemsLegume-rich cropping and fertilization systems
Fertilization system
(fertilizer types, amount) (1)
Organic commercial fertilizers
0.0, 0.3 LU ha−1
Stable manure
0.0, 1.0 and 1.5 LU ha−1
Slurry, stable manure
0.0, 0.8 LU ha−1
Stable manure
0.0, 0.8 LU ha−1
Stable manure, slurry, green manure
0.0, 0.5, 1.0 and 2.0 LU ha−1
N-mineral fertilization
Stable manure, slurry, green manure
0.0, 0.5, 1.0 and 2.0 LU ha−1
N-mineral fertilization
Stable manure, slurry
0.0 and 1.0 LU ha−1
Stable manure, slurry
0.0, 0.7, 1.3 and 2.7 LU ha−1
Crop rotation
Clover-grass, grain legumes (share per crop rotation) (%)Clover-grass, grain legumes
20
Clover-grass, grain legumes
25
Clover-grass, grain legumes
33–40
Clover-grass, grain legumes
33
Clover-grass
34
Clover-grass
33
Clover-grass, grain legumes
33–50
Clover-grass, grain legumes
50
Cereals (share per crop rotation) (%)Wheat, winter rye
20–40
Winter wheat, spring barley, winter rye
63
Winter wheat, spring barley
33–66
Winter wheat, winter rye, oats
50
Winter wheat, spring wheat
33
Winter wheat, triticale
34
Winter wheat, spring barley, winter barley, winter rye
33–50
Winter wheat, winter barley
33
Root crops, corn, field vegetables (share per crop rotation) (%)Potatoes
20 + field vegetables
Potatoes
12
Potatoes
0–33
Potatoes
17
Potatoes, corn
33
Potatoes, corn
33
Potatoes
17
Potatoes
17
Literature sources[33][34,35,36][37,38][39][40][40][41][42]
(1) Fertilization systems: livestock units (LU), 1 LU ha−1 = 60 kg N ha−1 year−1.
Table 2. Mean values, standard deviation (s), and supply classes (1) of some important characteristics of fertilization and soil fertility of forage and market crop systems with legumes around 33% in rotations and fertilization around 0.5 LU ha−1 on loamy and sandy soils.
Trial VariantOrganic FertilizationGE-YieldN BalanceP BalanceK BalanceHumus Balance (2)Nmin SpringPCALKCALN Translocation
[kg N ha−1][t GE ha−1][kg N ha−1][kg P ha−1][kg K ha−1][kg HEQ ha−1/Class][kg N ha−1 0–90 cm Soil Depth][mg P 100 g−1/Class][mg K 100 g−1/Class][kg N ha−1, 90–200 cm Depth]
Loamy soils
Forage production, by-products removed378.2 ± 0.49+0 ± 2.5−17 ± 3.4−120 ± 19.0+158 C ± 25.5ca. 45 ± 6.13.9 C ± 0.127.4 C ± 0.138.1 ± 0.40
Market crop systems, by-products remain, clover-grass mulching337.8 ± 0.58+87 ± 4.5−7 ± 2.3−14 ± 17.8+433 D ± 8.538 ± 2.24.3 C ± 0.2611.6 D ± 0.217.0 ± 0.62
Sandy soils
Forage production, by-products removed324.4 ± 0.23+14 ± 3.1−10 ± 1.1−89 ± 16.1+82 C ± 12.740 ± 2.45.2 D ± 0.2810.4 D ± 0.7818.1 ± 5.3
Market crop systems, by-products remain, clover-grass mulching304.3 ± 0.18+83 ± 3.4−2 ± 1.5−1 ± 9.1+214 C ± 25.545 ± 2.87.0 D ± 0.1210.7 D ± 1.12ca. 19.0 ± 3.2
Mean values (ms)336.2 ± 0.3746 ± 3.4−9 ± 2.1−56 ± 15.5+222 C ± 18.042 ± 3.45.1 ± 0.1910.0 ± 0.5613.1 ± 2.4
(1) Supply classes: undersupply (A, B), optimal supply (C) and oversupply (D, E). (2) Soil organic matter (humus) balance—Corg difference per year: there is a close correlation of r = 0.744 (p < 0.001) between humus balance of the STAND method and Corg change [69].
Table 3. Mean values, absolute (italics) and relative change (in parentheses) compared to a mean intensity [=100%, see Table 2], and supply classes (1) of several important characteristics of yields, nutrient balances, and soil fertility in pure forage and market crop systems without fertilization from long-term trials on loamy and sandy soils.
Trial VariantOrganic FertilizationGE-YieldN BalanceP BalanceK BalanceHumus Balance (2)Nmin SpringPCALKCALN Translocation
[kg N ha−1][t GE ha−1][kg N ha−1][kg P ha−1][kg K ha−1][kg HEQ ha−1/Class][kg N ha−1][mg P 100 g−1/Class][mg K 100 g−1/Class][kg N ha−1, 90–200 cm Depth]
Loamy soils
Forage production, by-products removed0
−37
7.2
−1.0
(88%)
−24

−24
−23
−6
(−135%)
−141
−21
(−118%)
+119 C
−39
(75%)
41
−4
(91%)
3.9 C
±0
(100%)
7.2 C
−0.2
(97%)
7.0
−1.1
(86%)
Market crop systems, by-products remain, clover-grass mulching0
−33
7.3
−0.5
(94%)
+51
−36
(59%)
−14
−7
(−200%)
−52
−38
(−371%)
+328 D
−105
(76%)
35
−3
(92%)
4.2 C
−0.1
(98%)
11.1 D
−0.5
(96%)
4.9
−2.1
(70%)
Sandy soils
Forage production, by-products removed0
−32
4.0
−0.3
(93%)
−13
−27
−14
−4
(−140%)
−111
−22
(−125%)
+38 C
−44
(46%)
ca. 40
±0
(100%)
4.9 D
−0.3
(94%)
8.7 C
−1.7
(84%)
15.0
−3.1
(83%)
Market crop systems, by-products remain, clover-grass mulching0
−30
3.8
−0.5
(88%)
+58
−25
(70%)
−6
−4
(−300%)
−20
−19
(−2000%)
+139 C
−75
(65%)
ca. 40
−5
(89%)
4.8 D
−2.2
(69%)
9.5 C
−1.2
(89%)
16.2
−2.8
(85%)
Mean values
(ms)
0
−33
5.6 ± 0.3+18 ± 4.6−14 ± 3.8−81 ± 21.0+156 ± 54.239 ± 4.64.5 ± 0.449.1 ± 0.8810.8 ± 1.6
(1) Supply classes: undersupply (A, B), optimal supply (C) and oversupply (D, E). (2) Soil organic matter (humus) balance—Corg difference per year: there is a close correlation of r = 0.744 (p < 0.001) between humus balance of the STAND method and Corg change [69].
Table 4. Effects of the supply of organic materials in variants without fertilization on the annual change of certain characteristics from long-term experiments on loamy and sandy soils (accounting period: loam = 15 years, sand = 13 years, mean standard error regression, ms).
AttributeLoamy SoilsSandy Soils
Forage CropMarket CropmsForage CropMarket Cropms
DM inputs (t ha−1)
clover-grass mulch
straw
organic fertilizer
0.05.56-0.02.13-
0.02.08-0.01.00-
0.00.0-0.00.0-
GE-yield (t ha−1)0.00150.1093±1.69−0.06790.0021±1.97
Corg (% DM)0.0033750.009313±0.1110.0010710.003929±0.102
Nt (% DM)−0.001125−0.000312±0.0186−0.000786−0.000500±0.0212
N mineralization (kg ha−1)0.4237.460±61.5−3.6281.305±54.6
Nmin spring (kg ha−1)−1.083−0.295±24.71.3931.255±31.1
Nmin fall (kg ha−1)0.5831.487±15.24.0472.620±57.9
PDL (mg 100 g−1)−0.095000−0.037143±0.52−0.183438−0.127188±0.82
KDL (mg 100 g−1)−0.3121430.080714±2.07−0.816667−0.188438±1.31
MgCaCl2 (mg 100 g−1)−0.24107−0.003125±0.54−0.395833−0.044844±0.80
Table 5. Mean values, absolute (italics) and relative change (in parentheses) compared to a mean intensity [=100%, see Table 2], and supply classes (1) of important characteristics of fertilization and soil fertility in market crop systems with 33% rotation share of legumes from clover-grass or grain legumes, respectively, in long-term trials on loamy soils.
Trial VariantOrganic FertilizationCrop Yield
(Main Product)
Legume N2 FixationN BalanceP BalanceK BalanceCorg DifferenceHumus Balance (HE) (2)Nmin Spring
(0–90 cm)
[kg N ha−1][t DM ha−1][kg N ha−1][kg N ha−1][kg P ha−1][kg K ha−1][kg Corg ha−1 year−1][HEQ ha−1/Class][kg N ha−1]
1
Comparison 1
33% clover-grass
38
(=100%)
4.9
(=100%)
89
(=100%)
+48
(=100%)
−10
(=100%)
−50
(=100%)
+218
(=100%)
+541 E
(=100%)
41
(=100%)
2
16.7% clover-grass,
16.7% grain legumes
04.3
−0.6
(78–95%)
88
−1
(99%)
+45
−3
(=94%)
−12
−2
−33
+17
−158
−376
+315 D
−226
50
+9
(122%)
3
33% grain legumes
03.6
−1.3
(65–83%)
79
−10
(89%)
+22
−26
−13
−3
−29
+21
−274
−492
−155 B
−696
47
+6
(115%)
ms-±0.16----±74-±3.1
(1) Supply classes: undersupply (A, B), optimal supply (C) and oversupply (D, E). (2) HE: humus balance, according to [86]: there is no significant relationship between humus balance and Corg change with r = 0.22 n.s. [69].
Table 6. Mean values, absolute (italics) and relative (in parentheses) change compared to a medium intensity [comparison 1 = 100%, see Table 2] or low livestock-less intensity [comparison 2, see Table 3], and supply classes (1) of some important characteristics of fertilization and soil fertility in market crop systems with 20% rotation share of legumes from clover-grass or grain legumes from long-term trials on loamy soils.
Trial VariantOrganic FertilizationCrop Yield
(Main Products)
Legume N2 FixationN BalanceCorg Content Trial EndHumus Balance Supply Level (HE) (2)Humus Balance (HE) (2)Nmin Spring
(0–90 cm)
[kg N ha−1][t DM ha−1][kg N ha−1][kg N ha−1][% DM][%][HEQ ha−1/Class][kg N ha−1]
1
Comparison 1
20% clover-grass, by-products removed
8461
(=100%)
ca. 30
(=100%)
+18
(=100%)
ca. 1.77
(=100%)
137+180 C
(=100%)
-
2
Comparison 2
20% clover-grass,
by-products ½ removed
385.2
−0.9
(85%)
22
−8
(73%)
+10
−8
(56%)
1.74
−0.03
(98%)
121+20 C
−160
39
(100%)
3
20% grain legumes,
by-products remain
294.5
−1.6
(69–79%)
30
±0
(100%)
+8
−10
(44%)
1.69
−0.14
(96%)
96+78 C
−93
50
+11
(128%)
4
20% grain legumes,
by-products remain
04.2
−1.9
(62–75%)
30
±0
(100%)
−16
−34
1.59
−0.15
(90%)
44−176 B
−356
47
+8
(121%)
ms-±0.18-±3.03±0.08-±12.0±3.5
(1) Supply classes: undersupply (A, B), optimal supply (C) and oversupply (D, E). (2) HE: humus balance, according to [86].
Table 7. Mean values, absolute (italics) and relative change (in parentheses) compared to an average intensity [=100%, see Table 2], and supply classes (1) of some important characteristics of yields, nutrient balances, and soil fertility of forage cropping and market crop systems of long-term field trials around 1.0 LU ha−1 on loamy and sandy soils.
Trial VariantOrganic FertilizationGE-YieldN BalanceP BalanceK BalanceHumus Balance (2)Nmin SpringPCALKCALN Translocation
[kg N ha−1][t GE ha−1][kg N ha−1][kg P ha−1][kg K ha−1][kg HEQ ha−1/Class][kg N ha−1][mg P 100 g−1/Class][mg K 100 g−1/Class][kg N ha−1, 90–200 cm Depth]
Loamy soils
Forage production, by-products removed718.4+25−8−87+295 C464.1 C7.4 C9.8
+34+0.2+25+9+33+137+1+0.2±0.0+1.8
(192%)(102%) (47%)(73%)(187%)(102%)(105%)(100%)(121%)
Market crop systems, by-products remain, clover-grass mulching658.0+114+1+27+505 E474.5 C13.0 D8.4
+32+0.2+27+8+41+72+9+0.2+1.4+1.4
(197%)(103%)(131%) (117%)(124%)(105%)(112%)(120%)
Sandy soils
Forage production, by-products removed634.3+48−5−51+202 C505.4 D12.4 D19.7
+31±0.0+34+5+38+120+10+0.2+2.0+1.6
(197%)(100%)(343%)(50%)(57%)(246%)(125%)(104%)(119%)(109%)
Market crop systems, by-products remain, clover-grass mulching594.3+111+2+23+277 C517.8 D11.3 D19.8
+29±0.0+28+4+24+63+6+0.8+0.6+0.8
(197%)(100%)(134%) (129%)(113%)(111%)(106%)(104%)
Mean values
(ms)
656.3 ± 0.27+75 ± 2.8−3 ± 3.4−22 ± 26.5+320 ± 47.949 ± 6.45.5 ± 0.4911.0 ± 0.6514.4 ± 5.1
(1) Supply classes: undersupply (A, B), optimal supply (C) and oversupply (D, E). (2) Humus balance—Corg difference per year: there is a close correlation of r = 0.744 (p < 0.001) between humus balance of the STAND method and Corg change [69].
Table 8. Effect of the supply of organic materials in variants with organic fertilization corresponding to 1.0 LU ha−1 on the annual change of certain characteristics from long-term trials of loamy and sandy soils (accounting period: loam = 15 years, sand = 13 years, standard error regression, ms).
AttributeLoamy SoilsSandy Soils
Forage CropMarket CropmsForage CropMarket Cropms
DM inputs (t ha−1)
clover-grass mulch
straw
organic fertilizer
0.05.83-0.02.26-
0.02.17-0.01.01-
1.371.76-1.951.59-
GE-yield (t ha−1)0.09570.1456±1.99−0.04400.0711±2.00
Corg (% DM)0.0083750.014313±0.1140.0057140.007857±0.080
Nt (% DM)−0.0001250.000375±0.0195−0.000250−0.000071±0.0190
N mineralization (kg ha−1)1.80011.939±63.3−3.0212.902±53.2
Nmin spring (kg ha−1)0.2720.895±27.81.6451.297±22.2
Nmin fall (kg ha−1)2.0082.472±17.71.3812.237±47.5
PDL (mg 100 g−1)−0.060781−0.023259±0.70−0.0290630.023958±1.01
KDL (mg 100 g−1)−0.2877680.230804±2.04−0.163958−0.170156±1.42
MgCaCl2 (mg 100 g−1)−0.0084820.043750±0.70−0.007500−0.002083±0.67
Table 9. Mean values as well as absolute (italic) and relative change (in brackets) compared to a mean intensity [=100%, see Table 2], and supply classes (1) of some characteristics of crop yields, nutrient balances, and soil fertility of forage and market crop systems at a fertilization level around 2.0 LU ha−1 from long-term field trials on loamy and sandy soils.
Trial VariantOrganic FertilizationGE-YieldN BalanceP BalanceK BalanceHumus Balance (2)Nmin SpringPCALKCALN Translocation
[kg N ha−1][t GE ha−1][kg N ha−1][kg P ha−1][kg K ha−1][kg HEQ ha−1/Class][kg N ha−1][mg P 100 g−1/Class][mg K 100 g−1/Class][kg N ha−1, 90–200 cm Depth]
Loamy soils
Forage production,
by-products removed
1348.6+84+9−18+411 D474.8 D8.8 C9.0
+97+0.4+84+26+102+253+2+0.9+1.4+1.0
(362%)(105%) (260%)(104%)(123%)(119%)(111%)
Market crop systems,
by-products remain, clover-grass mulching
1268.2+167+15+107+631 E575.4 D15.2 D13.1
+93+0.4+80+22+121+198+19+1.1+3.6+6.1
(382%)(105%)(192%) (154%)(150%)(126%)(131%)(187%)
Sandy soils
Forage production,
by-products removed
1224.4+101+5−4+288 C545.5 D14.1 D18.7
+90+0.1+87+15+85+206+14+0.3+3.7+0.6
(381%)(102%)(721%) (351%)(135%)(106%)(136%)(103%)
Market crop systems,
by-products remain, clover-grass mulching
1114.5+162+9+63+365 D528.5 D12.5 D19.1
+81+0.2+79+11+64+151+7+1.5+1.8+0.1
(370%)(105%)(195%) (171%)(116%)(121%)(117%)(101%)
Mean values(ms)1236.4 ± 0.35+129 ± 7.1+10 ± 3.9+37 ± 32.8+424 ± 59.653 ± 7.66.1 ± 0.5012.7 ± 1.5215.0 ± 4.9
(1) Supply classes: undersupply (A, B), optimal supply (C) and oversupply (D, E). (2) Humus balance—Corg difference per year: there is a close correlation of r = 0.744 (p < 0.001) between humus balance of the STAND method and Corg change [69].
Table 10. Effect of the supply of organic materials with an organic fertilization corresponding to 2.0 LU ha−1 on the annual change of certain characteristics from long-term experiments on loamy and sandy soils (accounting period: loam = 15 years, sand = 13 years, mean standard error regression, ms).
AttributeLoamy SoilsSandy Soils
Forage CropMarket CropmsForage CropMarket Cropms
DM inputs (t ha−1)
clover-grass mulch
straw
organic fertilizer
0.05.89-0.02.41-
0.02.16-0.01.02-
2.603.39-3.772.99-
GE-yield (t ha−1)0.11310.1752±1.97−0.02640.0755±2.15
Corg (% DM)0.0116560.017906±0.1190.0081790.010357±0.072
Nt (% DM)0.0003440.000938±0.0195−0.0001070.000321±0.0181
N mineralization (kg ha−1)3.25115.903±59.8−2.2955.065±52.7
Nmin spring (kg ha−1)0.3811.107±29.80.1611.095±27.5
Nmin fall (kg ha−1)2.6623.247±24.12.1202.875±55.3
PDL (mg 100 g−1)0.0072320.055357±0.930.0145830.097604±1.35
KDL (mg 100 g−1)−0.1769200.392857±1.910.0416670.251563±2.75
MgCaCl2 (mg 100 g−1)0.0381700.075446±0.630.0107290.018750±0.64
Table 11. Mean values as well as absolute (italics) and relative change (in parentheses) compared to a mean intensity [comparison 1 = 100%, see Table 2], and supply classes (1) of some important characteristics of plant and soil fertility of cropping systems with up to 50% crop rotation shares of forage and grain legumes and additional organic fertilization up to 160 kg N ha−1 year−1 from long-term field trials.
Trial Variant (2)Organic FertilizationCrop Yield
(Main Product)
Legume N2 FixationN BalanceCorg DifferenceHumus BalanceNt DifferenceNmin Spring
(0–90 cm)
Crude Protein
Wheat
[kg N ha−1][t DM ha−1][kg N ha−1][kg N ha−1][kg ha−1 year−1][kg HEQ ha−1/Class][kg N ha−1 year−1][kg N ha−1][% DM]
1 = Comparison 1
33% Clover-grass,
by-products removed
455.3
(=100%)
71
(=100%)
+23
(=100%)
±0
(=100%)
−41 B
(=100%)
−39
(=100%)
68
(=100%)
10.8
(=100%)
2
28% clover-grass + 18% grain legumes,
by-products remain, clover-grass mulches
05.2
−0.1
(98%)
75
+4
(106%)
+35
+12
+540
+138 C
+179
−18
+21
64
−4
(94%)
10.0
−0.8
(93%)
3
33% clover-grass + 17% grain legumes,
by-products removed
0
0.0 LU ha−1
5.2
−0.1
(98%)
82
+11
(116%)
−2
+25
+349−27 B
+14
−3
+36
75
+7
(110%)
11.2
+0.4
(104%)
4 =
Comparison 2
33% clover-grass + 17% grain legumes,
by-products removed
40
0.7 LU ha−1
5.9
+0.6
(111%)
90
+19
(127%)
+34
+11
+445+107 C
+148
+7
+46
80
+12
(118%)
11.6
+0.8
(107%)
5
33% clover-grass + 17% grain legumes,
by-products removed
80
1.3 LU ha−1
6.1
+0.8
(115%)
93
+22
(131%)
+79
+56
+413+217 C
+258
+3
+42
83
+15
(122%)
12.0
+1.2
(111%)
6
33% clover-grass + 17% grain legumes,
by-products removed
160
2.7 LU ha−1
5.9
+0.6
(111%)
90
+19
(127%)
+154
+131
+571+458 D
+499
+16
+55
90
+22
(132%)
12.1
+1.3
(112%)
ms-±0.29±4.9±11.5-±55.0-±5.9±0.21
(1) Supply classes: undersupply (A, B), optimal supply (C) and oversupply (D, E). (2) Clover-grass = clover or alfalfa grass.
Publisher’s Note: MDPI stays neutral with regard to jurisdictional claims in published maps and institutional affiliations.

