Article

Land Use, Temperature, and Nitrogen Affect Nitrous Oxide Emissions in Amazonian Soils

by
Nauara M. Lage Filho
1,
Abmael da S. Cardoso
2,
Jorge C. de Azevedo
1,3,
Cristian Faturi
1,3,
Thiago C. da Silva
3,
Felipe N. Domingues
4,
Ana C. Ruggieri
5,
Ricardo A. Reis
5 and
Aníbal C. do Rêgo
1,3,*
1
Faculty of Veterinary Medicine, Federal University of Pará, Castanhal 68746-360, Brazil
2
Institute of Food and Agricultural Sciences, University of Florida, Ona, FL 33865, USA
3
Institute of Health and Animal Production, Federal Rural University of Amazon, Belém 66077-830, Brazil
4
Institute of Agrarian Science, Federal University of Jequitinhonha and Mucuri Valleys, Unaí 38610-000, Brazil
5
Department of Animal Science, São Paulo State University, Jaboticabal 14884-900, Brazil
*
Author to whom correspondence should be addressed.
Agronomy 2022, 12(7), 1608; https://doi.org/10.3390/agronomy12071608
Submission received: 12 April 2022 / Revised: 17 June 2022 / Accepted: 27 June 2022 / Published: 4 July 2022
(This article belongs to the Section Agricultural Biosystem and Biological Engineering)

Abstract

:
Nitrous oxide (N2O) is one of the main gases emitted from soils, and the changes in land use in the Amazon may alter gas emission patterns. The objective of this study was to evaluate the effects of land use, temperature, and nitrogen on N2O emissions in soils in the Amazon. For this, three treatments randomized, with five repetitions, were incubated to quantify N2O emissions: (i) three different land uses (wet rainforest, pasture, and agriculture); (ii) different temperatures (25, 30, 35, and 40 °C); and (iii) different nitrogen additions to the soil (0, 90, 180, and 270 kg of N ha−1). Our results show that land use alters the flux of N2O, with the highest emissions observed in agricultural soils compared to that in forest and pasture areas. The change in soil temperature to 30 °C increased N2O emissions with land use, at which the emission of N2O was higher in the pasture and agriculture soils. Our results showed that the emission of N2O in the soil of the Amazon rainforest was low regardless of the temperature and nitrogen treatment. Therefore, the change in land use alters the resilience of the ecosystem, providing emissions of N2O.

Graphical Abstract

1. Introduction

The Amazon is an important global ecosystem composed of rich biodiversity that contributes to the global rainfall cycle and ecosystem services. Hydrologically, this is one of the three main regions of air updraft in the tropics. The humid rainforest receives approximately 2200 mm of rainfall annually throughout the basin [1]. However, mining activity and illegal logging have historically initiated and accelerated the suppression of forest areas [2,3], contributing to the expansion of the deforestation arc in the Amazon [4]. Successive to these disturbances, the introduction of agriculture and livestock has altered land use in the region as income-generating activities [1]. Although these land-use changes can affect greenhouse gas emissions [5], these processes need to be better understood comprehensively.
Among the main greenhouse gases, nitrous oxide (N2O) is the third-largest contributor to climate change. The heating power of this gas is 265 times greater than that of carbon dioxide and is involved in chemical processes that are harmful to the ozone layer [5]. N2O emissions originate from natural sources such as edaphoclimatic variations and anthropogenic sources linked to agriculture, the application of fertilizers, and animal feces [6].
Forest depletion and climate change have directly affected the temperature of the environment and, consequently, soil [7]. Nevertheless, the resilience of forests allows them to adapt rapidly to new environmental conditions because of higher increased levels of carbon in the soil from the high deposition of organic matter, making it possible for them to be restored to their previous state [8,9]. In the soil, the temperature is known to be a key variable influencing N2O emissions, regulating microbial growth and activity [10], which in turn boosts N2O emissions either through nitrification or denitrification [11]. The increases in temperature-induced soil respiration lead to the depletion of oxygen concentrations and increase soil anaerobiosis, the latter being a precursor and primary inductor of N2O emissions [10].
The amount of mineral N present in the soil determines the magnitude of N2O production in the atmosphere [12]. The response of soil to the addition of N depends on the type of management or condition of the soil and its intending purpose. Native forests usually undergo burning processes to form pastures or agricultural areas, and at first, the availability of N in the soil increases due to mineralization caused by fire [13]. In the pasture areas, nitrogen fertilization and excreta from grazing animals increase the supply of ammonium (NH4+-N) and nitrate (NO3-N) for denitrifying organisms [12]. Agricultural areas with annual crops have high levels of nitrogen fertilization, applied annually, resulting in characteristics similar to those observed in pasture areas.
Several studies have addressed the effect of land-use changes on gas emissions in different ecosystems of South America, such as the Cerrado [14], Caatinga [15], and Pampas [16]. In the Amazon region, studies analyzed N2O emissions in primary forest, secondary forest, pasture, and degraded pasture [17]. However, studies that objectively identify the drivers of N2O emissions, such as temperature and nitrogen concentrations on soil in the Brazilian Amazon, are restricted, especially in the deforestation arc. Therefore, it is necessary to study the Amazon biome to understand how these ecosystems have been affected by disturbances and to develop N2O mitigation strategies in these areas.
We hypothesized that: (i) soils in agricultural areas emit more N2O into the atmosphere than forest and pasture soils; (ii) the increase in soil temperature increases the emission of N2O; and (iii) the addition of nitrogen in the soil enhances the emission of N2O. Therefore, incubation studies were carried out to evaluate the emissions of N2O in soils from (i) different forms of land use, (ii) increasing soil temperature, and (iii) nitrogen addition to the soil.

2. Materials and Methods

2.1. Experimental Site, Sampling, and Soil Characteristics

Soil evaluation was conducted in 2019 in areas with three different land-use systems, that is, wet rainforests, pastures, and agriculture. To this end, an area located in the deforestation arc of the Brazilian Amazon was selected [4] in the municipality of Nova Esperança do Piriá, Pará, Brazil (2°19’ S, 46°56’’ W, altitude of 70 m). According to Köppen’s classification, the climate of this region is Am [18]. The average annual precipitation in the study region is 2.104 mm, with an average annual temperature of 26 °C, and soils are mainly classified as Oxisols [19].
Soil samples were collected at 0–20 cm depth to determine the physicochemical characteristics (Table 1) and subsequent incubation tests. In this case, the collected soil was homogenized and macerated using a roller for 72 h to break the lumps.
The chosen forest area corresponds to a section of an intact humid rainforest representative of the region’s biome. The pasture evaluated was formed by a monoculture of Urochloa brizantha cv. Marandú was formed in 2012 from burning processes and was annually mowed to control weeds. Previously, there was a forest in this area that was suppressed by felling and burning in 1988 to cultivate cassava, which lasted for 24 years. In 2016, the pasture was treated with reactive natural phosphate at a dose of 90 kg P2O5 ha−1. The agricultural area was cultivated in 2012 with a semi-perennial culture of pepper-of the kingdom (Piper nigrum) with a 2 × 2 m spacing. In this area, pepper was previously cultivated, a pasture of Urochloa brizantha cv. Marandú burned for the formation of agricultural cultures. At the time of collection, the crop was in the fifth year of cultivation and was fertilized annually with 130, 80, and 200 kg ha−1 of nitrogen, phosphorus (P2O5), and potassium (KCl), respectively.

2.2. Experimental Design

Emissions and gas fluxes were quantified on site in the land-use systems, and interactions with temperature rise and nitrogen (N) input in the soil were quantified in three incubation tests.
(a)
Incubation 1
A completely randomized design was used to evaluate the N2O emissions in three different land-use systems (wet rainforest, pasture, and agriculture) with five replications.
(b)
Incubation 2
A completely randomized design was used in a 3 × 4 factorial arrangement to evaluate the N2O emissions in three land-use systems (wet rain forest, pasture, and agriculture) with four days of temperature and soil incubation (25; 30; 35 and 40 °C), with five repetitions per set.
(c)
Incubation 3
A completely randomized design was used in a 3 × 4 factorial arrangement to evaluate the N2O emissions in three different land-use systems (wet rain forest, pasture, and agriculture) and four nitrogen inputs into the soil (0; 90; 180, and 270 kg of N ha−1), with five repetitions per set.

2.3. Soil Preparation and Incubation

In all incubations, 100 g of dry soil was added to 500 mL closed static chambers (plastic bottles with a lid). Thereafter, it was added to the treatments that provided for the use of nitrogen, a solution of urea according to soil moisture. Weak soil moisture was corrected by monitoring the weight of the vials.
Incubations were conducted under controlled conditions, except for the factors that contributed to the treatments. Soil moisture was maintained at 33% of the soil water-holding capacity. Soil moisture was adjusted three days before the beginning of the study so that there was a growth of soil microorganisms involved in the emission of N2O. The temperature was maintained at 25.0 ± 1.0 °C, with the exception of that of incubation 2, as this was an evaluated factor. A water solution containing the proportional dose of 50 kg of N ha−1 was added to each jar to stimulate the microbial population of the soil, except in incubation 3, because nitrogen dose was evaluated as a factor.
In incubation 2, each jar was kept in a constant temperature chamber according to treatment with forced air circulation at 25, 30, 35, or 40 °C and was removed only for gas collection. In incubation 3, water solutions were applied to each vial corresponding to dose proportions of 0, 90, 180, or 270 kg N ha−1. The non-N treatment only received water.

2.4. N2O Measurements and Soil Analysis

The emission of N2O was evaluated using standard procedures, and chambers were kept closed. The chambers were bottles with a volume of 400 mL of free space. The flux of N2O was measured over 25 days for incubation 1 and 28 days of incubation for incubations 2 and 3. In all incubations, daily measurements were made in the initial seven days and every two days until the end of the incubation. In this case, sampling was carried out between 9:00 a.m. and 10:00 a.m. [20].
To measure the N2O fluxes, the chambers were opened to air renewal within the headspace of the chambers. Next, they were closed for 30 min to evaluate the gas production in this period. Five samples of ambient gas were collected before closing the chambers to quantify the initial concentration of N2O. After 30 min, a sample per chamber was collected using a 50 mL polypropylene syringe.
The gas samples were transferred to 20 mL pre-evacuated vials (Shimadzu®) for analysis of N2O in a gas chromatograph (Shimadzu Green House Gas Analyzer GC-2014®; Kyoto, Japan) set to the following conditions: injector 250 °C, column at 80 °C, drag gas N2 (30 mL min−1), and electron detector at 325 °C.
The calculations of gas flux (unit: ng N g−1 dry soil day−1) assumed a linear increase in the concentration of N2O over time. The concentrations of the gas samples were adjusted to the gas dissolved in the soil solution using the Bunsen coefficient [21]. Cumulative emissions were calculated by tracing the daily flux over the incubation time, with linear interpolation between them, and then integrating the data.
Soil mineral N content was measured at the end of the incubation period after extraction with 2 M KCl and colorimetric analysis to determine ammonium [22] and nitrate content [23].

2.5. Data Analysis

All data were analyzed for normality and homogeneity of variance following the Shapiro–Wilk and Levene tests, respectively. In the three incubation tests, analysis of variance (ANOVA) was performed. When significant for land use, the means were compared using the Tukey test, considering p < 0.05 as a significant difference. When a difference was observed by ANOVA for temperature and nitrogen variation, regression adjustment was performed to identify the effect of treatments. All statistical analyses were performed using the statistical program R (version 4.0.2; R Core Team, 2014).

3. Results

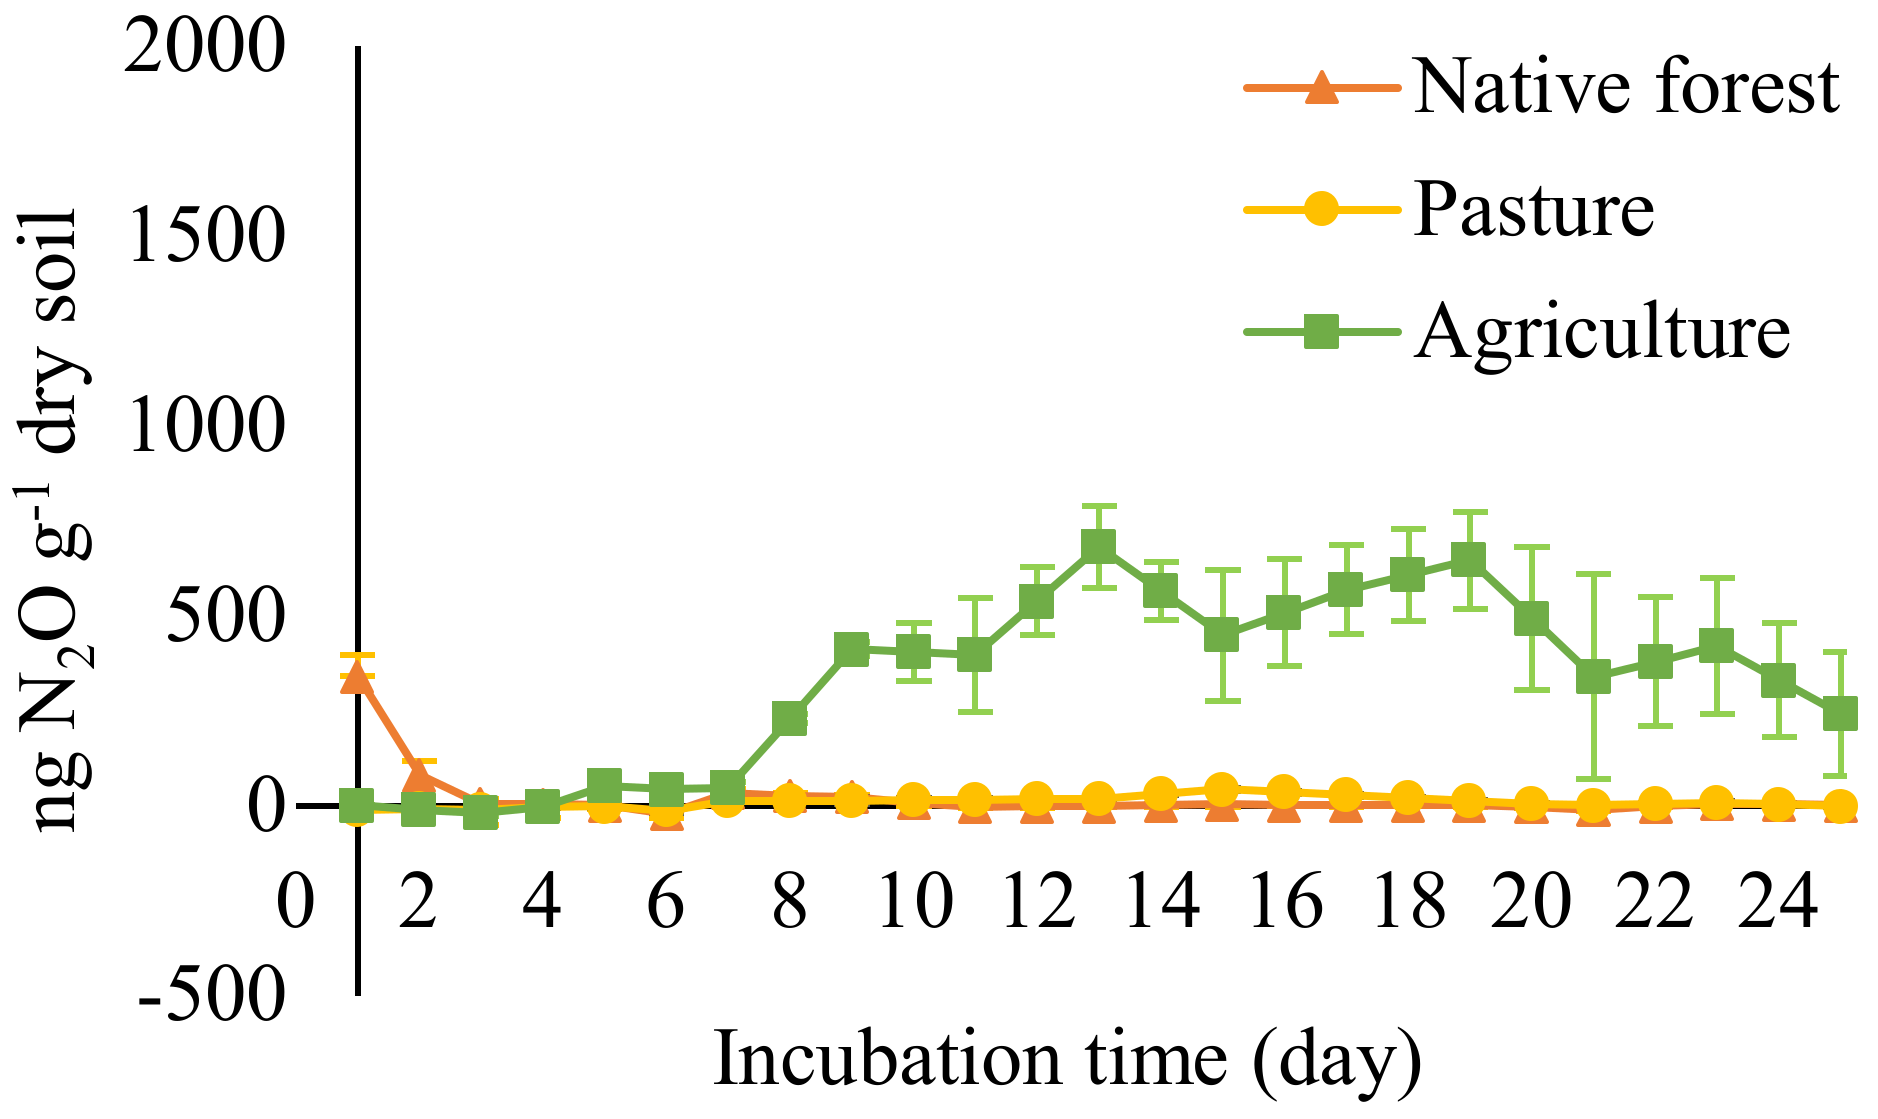
3.1. Effect of Land Use on N2O Emission

When evaluating the effect of land use, greater total N2O emissions were observed (p < 0.01) in the agricultural soil (200 μg N2O g−1 of dry soil; Figure 1) compared to that in the other two soils. In contrast, N2O emissions in wet tropical forest soils (12 μg N2O g−1 dry soil) and pastures (6 μg N2O g−1 of dry soil) were minimal and did not differ (p > 0.05) among them. The total emissions of N2O in the agricultural soil were approximately 17 and 33 times higher than those in the forest and pasture soils, respectively. Regarding temporal variation in the N2O emissions over 25 days of incubation, we observed an increase in the fluxes after the 8th day in the agricultural soil (Figure 2), with the topmost flux occurring on the 13th day (681 μg N2O g−1 dry soil). Thereafter, we measured an increased flux emission between days 8 and 13, which was maintained until the 19th day, followed by a decrease until the end of the incubation period (Figure 2). The low N2O emissions in forest and pasture soils result in an almost undetectable flux over the 25 days of incubation (Figure 2).

3.2. Effects of Incubation Temperature on N2O Emission

The effect of temperature on N2O was dependent on soil land use (p = 0.0197) from the soil. The forest treatment presented the lowest N2O emissions of all three types and uses regardless of the temperature evaluated and does not differ (p > 0.05). In the pasture soil, a quadratic effect (p < 0.01) was observed in gas emissions as a function of temperature. In contrast, in the agricultural soil, a linear decrease (p < 0.01) was found with an increase in incubation temperature regarding the total emission of N2O at different temperatures, only incubations maintained at 25 °C (p = 0.01) and 30 °C (p < 0.01) differed between the land uses. At 25 °C, the forest and pasture soils present lower N2O emissions than the agricultural soil. However, by raising the temperature to 30 °C, the total emission of N2O in the pasture soil increased to a similar level to that in the agricultural soil. Regardless of the land-use system, when the soils were incubated at 40 °C, the emissions were low and did not exceed 5 μg N2O g−1 dry soil (Table 2).
Altogether, there was a slight variation in the flux of N2O in forest soils. The soil of the forest area was incubated at temperatures between 25 °C and 40 °C (Figure 3A). The highest gas flux occurred between the seventh and 11th incubation day at 35 °C, with a peak production of ~373 ng N2O g−1 day−1 compared to the almost undetectable fluxes on the other incubation days. N2O production was observed in the pasture soil only at 30 °C and 35 °C (Figure 3B). Under these temperatures, the flux of N2O was greater at 30 °C compared to that at 35 °C. At both incubation temperatures, the flux commenced on the ninth day; however, a maximum production was observed on the 19th day at 30 °C, corresponding to 1099 ng N2O g−1 of soil day−1. When the soil was maintained at 35 °C, we observed flux increases until the 15th day, remaining constant until the 19th day. At both temperatures, the flux decreases after the 19th day of incubation. In the incubations maintained at 25 °C and 40 °C, the fluxes were minimal and remained constant throughout the incubation. In the agricultural soil, no significant flux of N2O was observed except at 40 °C (Figure 3C). In the agricultural soil maintained at 25 °C, the flux of gas began on the third day, reaching a peak on the 13th day (1135 ng N2O g−1 dry soil day−1). At this temperature, a second lower peak is observed on the 17th day (981 ng N2O g−1 dry soil day−1), with a gradual reduction until the end of the incubation period. When agricultural soils were maintained at 30 °C and 35 °C, the production of N2O peaked in the first third of the incubation period and then gradually decreased.

3.3. Effect of Nitrogen Inputs to the Soil on N2O Emission

A significant interaction (p < 0.01) of land use × nitrogen in the soil on the total emission of N2O was found. The addition of nitrogen to the soil did not affect (p > 0.05) the total emission of N2O in the forest soil, which in turn did not exceed 36 μg N2O g−1 of dry soil. An increasing linear effect was found in the total N2O emissions in pasture (p < 0.01) and agricultural (p < 0.01) soils with the addition of nitrogen. With the addition of 90 kg N ha−1, no difference was observed in the total emission of N2O in any of the different land uses. However, 180 and 270 kg N ha −1 exerted a significant effect on the emission of N2O on the three soils (p < 0.01 for both concentrations). At both nitrogen concentrations in the soil, the forest soil has lower N2O emissions compared to that of pastures and agricultural soil (Table 3).
In the forest soil, only the treatment of 270 kg N ha−1 altered the N2O fluxes. At this concentration, the highest flux was observed on the 13th day of incubation (~561 ng N2O g−1). With the other levels of nitrogen addition, there is no significant N2O production (Figure 4A). In the pasture soil, an increase in the N2O emission flux was observed with the addition of nitrogen (Figure 4B). In addition, two N2O peaks were observed in the treatment of 270 kg N ha−1, with the first occurring on the 13th day (~1581 ng N2O g−1 day−1) and the second on the 17th day (~1531 ng N2O g−1 day−1). Similar proportional flux patterns are observed with the additions of 90 and 180 kg N ha−1. In both nitrogen additions, the peak emission occurred on the 13th day of incubation, even when the N2O emissions started on the seventh day of incubation for the 180 and 270 kg N ha−1 treatments. In soils where no nitrogen was added, the N2O emission was minimal. In the agricultural soil, an increase in the magnitude of the N2O flux was observed with the addition of nitrogen (Figure 4C). The N2O fluxes from the treatments 180 and 270 kg N ha−1 started on the fourth day of incubation. As in the pasture soil, with an addition proportional to 270 kg N ha−1, two emission peaks of N2O were observed, with the first occurring on the 13th day (~1112 ng N2O g−1 day−1) and the second on the 17th day (~1105 ng N2O g−1 day−1). After the addition of 180 kg N ha−1, the N2O flux is less intense and more variable than that after 270 kg N ha−1; however, the maximum emission also occurs on the 13th day of incubation. When 90 kg N ha−1 was added to the soil, the lowest flux was measured on the 11th day of incubation (~384 ng N2O g−1 day−1) compared to that of the other treatments. In addition, after the 14th day, the flux remains low until the end of the incubation period.

3.4. Mineral Nitrogen Concentration

The average concentrations of N-mineral N in the soils of humid tropical forests, pasture, and agriculture before and after the incubation period are presented in Table 4. The lowest ammonium soil content was observed in agriculture at 0 and 90 kg N ha−1 (7.50 mg N NH4 kg−1 dry soil) and the highest in the treatment forest at 25 °C (30.0 mg N NH4 kg−1 dry soil). The lowest nitrate soil content was found in the treatment forest (0.30 mg N NO3 kg−1 dry soil) and the highest in the treatment pasture, 180 kg N ha−1 (12.5 mg N NO3 kg−1 dry soil).

4. Discussion

Land-use systems, as well as their management, are considered one of the main factors that can influence greenhouse gas emissions. In the Brazilian Amazon, especially in the deforestation arc, recent changes in land use have advanced with the suppression of humid tropical forest areas [4,24,25]. In part of these areas, the insertion of agricultural and livestock production systems can directly influence the emission of greenhouse gases into the atmosphere, such as N2O [26,27]. Therefore, the results obtained in the present study contribute to the understanding of the importance of these changes.

4.1. Effect of Land Use on N2O Emission

Regarding different land-use systems evaluated in the present work, we found the highest emissions of N2O in the agricultural soils (Figure 1). These high emissions are likely due to the N fertilization used in this area. In agricultural areas, such as pepper cultivation, the fertilization and periodic maintenance of the crop increases N in the soil and, consequently, the emission of N2O from the system [26,28]. Another essential aspect is the presence of soil discovered between crop lines due to the spacing between plants contributing to the emission of N2O, which in this study was 2 × 2 m in the cultivation of pepper. Other studies have shown that corn and beans caused high emissions of N2O after harvest due to the lack of vegetation at the end of cultivation [29]. Areas of humid tropical forests are resilient; that is, they are able to restore the original characteristics after some disturbance, whether internal or external for example, the forest ecosystem will be lesser affected by variations in temperature and precipitation, usually the main driver of the N2O production [8,30]. Resilience characteristics provide forest soils with the ability to reduce greenhouse gas emissions [31], explaining the observed results. The data found in the present study are in agreement with the literature, in which soils of native forests in South America presented lower N2O emissions than those of agricultural areas [14,15,16].
With regard to pasture soils, the lowest emissions of N2O may be explained by the age of the pasture, which was approximately six years. The f pasture age after establishment is a factor that influences the emission of N2O at a time that alters the rate of soil denitrification. These changes tend to increase up to 2.8 times the emitted N2O and pasture soils with more than 10 years of use [32]. In addition to the age of the pasture, the low availability of nutrients in the soil explains the lower emission of N2O since the last fertilization was applied in 2016 with reactive natural phosphate and in the absence of nitrogen [12,33].
The mineral N present in the soil is directly related to N2O [34]. Acid soils typically result in higher concentrations of NH4+-N compared to NO3, which lead to higher gas emissions [6]. In Brazil, we observe different edaphoclimatic conditions, whether in tropical or subtropical environments, but nitrification is still the main emission route of N2O from the soils of the Amazon. Nitrification is the primary emission route of N2O from the soils of the Amazon in line with different edaphoclimatic conditions observed in tropical or subtropical environments of Brazil [35,36], Cerrado [37], and Atlantic Forest [38].
The concentration of N in the soil influence N2O emissions, as they can directly affect soil microbiological dynamics [12,26,29,32], especially nitrification and denitrification [39]. In addition to these factors, soil moisture and temperature also cause changes in the proliferation of these microorganisms and, consequently, changes in flux and N2O emissions. In the present study, the soils were moistened only during incubation, which justifies the beginning of the gas emission activities in the agricultural soil, starting only after the eighth day (Figure 2). Therefore, after soil humidification and the addition of nitrogen in an environment with adequate temperature, ideal moisture and substrate were provided for nitrifying and denitrifying bacteria to gradually activate the production of N2O [39]. Therefore, in addition to the favorable microbial conditions, it is also possible that the diversity of these microorganisms is related to the land-use system and justifies the different patterns of N2O emissions in the three soils studied. Based on what has been presented, it is likely that some of the ideal conditions for bacterial proliferation have not been met in the forest and pasture soils, explaining the low fluxes during incubation.

4.2. Effects of Temperature on N2O Emission

The phenomena linked to the emission of N2O as a function of soil temperature are important, as such variations are increasingly frequent due to changes in ambient temperature resulting from global warming [10,40]. Therefore, the interaction between the land-use system and soil temperature on the emission of N2O observed in the present study (Table 2) demonstrates that this is a sensitive and regulating factor that acts differently on the activity of microorganisms in different ecosystems [12,36,41]. In addition, it is important to mention that the plant cover of the system and soil moisture also influence soil temperature [42] and, therefore, the emission of N2O. Therefore, the high emissions of N2O with a temperature of 35 °C can be explained because autotrophic nitrification occurs in the range of 15–35 °C, which increases as temperature increases [43,44].
The lower N2O emissions in soils incubated at 40 °C can be explained by altering the reactions in the nitrogen cycle and, consequently, the nitrification and denitrification pathways that are linked to the microbial metabolism in the soil [45,46]. At temperatures above 35 °C, the occurrence of greater depolymerization of soil organic matter is favored because of the more intense activity of enzymes that produce amino acids in the soil [47], resulting in mineralization and unavailability of N for emission.
The highest N2O emissions in agricultural soils maintained at 25 °C were due to disturbances in agricultural ecosystems (plowing, harrowing, and fertilization), leading to more sensitive and rapid changes in the abundance and structure of the microbial community. In addition, research has shown that there are more intense changes in the stock of organic C and N in this land-use system and an increase in the activity of microorganisms. Moreover, plowing increased soil aeration and temperature, which leads to microorganism growth [48]. These variations induce higher emissions of N2O from the soil compared to that of pastures and forests [49]. Nevertheless, an increase in soil temperature to 30 °C can lead to a greater proliferation of specific microorganisms that can cause changes in nitrification [32]. In the case of pasture soil, this explains the fact that the emission of N2O was high (270 μg N2O g−1 of dry soil) and similar to that of the agricultural soil when incubated at 30 °C. Following the same reasoning, at low temperatures (25 °C), the emissions of N2O in pasture soils were low (8 μg N2O g−1 of dry soil) and did not differ from the emissions from the forest soil.
The only N2O emission peak that occurred in the forest soils at 35 °C is probably justified by the higher values of NO3 (Figure 3A). In addition, the resilience of the forest allows it to adapt rapidly to new environmental conditions [8], resulting in almost undetectable N2O fluxes after the first day and other incubation temperatures. The emission flux of N2O in agricultural soil was maintained at 25, 3, or 35 °C started in the first and third days of incubation, probably because the conditions for the onset of microbial activity in the soil were ideal for the growth of microorganisms [39], not being observed in the other systems. Emissions of N2O in soil incubated at 30 and 35 °C started first compared to the soil incubated at 25 °C because the microbial community is diverse, and its development is dependent on the ideal temperature for each microorganism [50].

4.3. Effect of Nitrogen Addition to the Soil on N2O Emission

The interaction of the land-use system and the addition of nitrogen to the soil on the emission of N2O observed in the present study (Table 3) confirms its regulatory role in the emission of this gas, being directly related to nitrification and denitrification processes according to the ecosystem [6,12,33]. Further, the crop management adopted in the sampled areas explains the similar and more intense emission of N2O from agricultural soils and pastures that is equivalent to 180 and 270 kg of N ha−1. Therefore, despite the use of black pepper in the agricultural area, the application of fertilization is more frequent than that of the pastures; that is, the presence of grazing animals promotes the deposition of feces and urine, which in turn are sources of N2O [51]. Studies have reported that urine is the main source of N2O in pasture areas, and the gas production was boosted by soil moisture, temperature, and available N [12,20,33,52,53]. On the other hand, the characteristic resilience of forest soils under disturbance [8] continues to be considered the main factor responsible for the low emission of N2O, even with the addition of nitrogen.
The slight variation observed in the flux of N2O in forest soils with nitrogen addition can also be related to the soil resilience, capable of resisting adverse edaphoclimatic variations, causing the soil to return to previous conditions after undergoing disturbance, that is, after deforestation [8]. Under cultivation, such as pastures or agricultural areas, the increase in nitrogen in the soil causes changes in NH4+ and NO3 levels, modifying the emission flux of N2O [54]. Therefore, this helps explain the growth patterns of the emission peaks of N2O in the present study as the addition of nitrogen to pasture and agriculture (Figure 4B,C) increases. If soil moisture and available carbon are not the limiting factors, variations in nitrogen availability in the soil can also induce N2O emissions [12,28,55].

5. Conclusions

From the results of our study, the following conclusions can be drawn:
Nitrous oxide emissions in wet tropical forest soils are lower and are not affected by nitrogen temperature and availability;
Agricultural soils emit more N2O than forest and pasture soils in the Brazilian Amazon;
When subjected to a temperature rise to 35 °C, pasture and agricultural soils in the Amazon increase emissions of N2O, reducing production significantly at 40 °C;
The addition of nitrogen to the soil increases the emission of N2O from pasture and agricultural soils in the Brazilian Amazon;
The results of this study could be used for modeling N2O in the function of the temperature and N input variation. Moreover, help to develop mitigation strategies regarding soil land use.

Author Contributions

Conceptualization, N.M.L.F., A.d.S.C., J.C.d.A., C.F., F.N.D., T.C.d.S., R.A.R. and A.C.d.R.; Data Curation, N.M.L.F., A.d.S.C. and J.C.d.A.; Formal Analysis, N.M.L.F. and A.d.S.C.; Funding Acquisition, N.M.L.F., A.d.S.C., A.C.d.R., R.A.R. and A.C.d.R.; Investigation, N.M.L.F., A.d.S.C. and J.C.d.A.; Methodology, N.M.L.F., A.d.S.C. and J.C.d.A.; Project Administration, N.M.L.F., A.d.S.C., A.C.R., R.A.R. and A.C.d.R.; Supervision, A.d.S.C., C.F., F.N.D., T.C.d.S. and A.C.d.R.; Validation, N.M.L.F., A.d.S.C., C.F., F.N.D., T.C.d.S. and A.C.d.R.; Visualization, N.M.L.F., A.d.S.C., C.F., F.N.D., T.C.d.S., A.C.R., R.A.R. and A.C.d.R.; Writing—Original Draft Preparation, N.M.L.F., A.d.S.C. and A.C.d.R.; Writing—Review and Editing, N.M.L.F., A.d.S.C. and A.C.d.R. All authors have read and agreed to the published version of the manuscript.

Funding

This study was financed in part by the Coordenação de Aperfeiçoamento de Pessoal de Nível Superior—Brasil (CAPES)—Finance Code 001 and by the grants 2017/11272-5 and 2018/16273-0, São Paulo Research Foundation (FAPESP).

Acknowledgments

We would like to thank the Study Group on Ruminants and Forage Production of the Amazon (GERFAM) and the Study Groups on Forage (UnespFor) for their support in conducting the experiments. To Federal University of Pará (UFPA) for the support on the project execution and financial of Qualified Publication Support Program (PAPQ/UFPA – 02/2022).

Conflicts of Interest

The authors declare no conflict of interest. The funders had no role in the design of the study, in the collection, analyses, or interpretation of data, in the writing of the manuscript, or in the decision to publish the results.

References

  1. Gatti, L.V.; Basso, L.S.; Miller, J.B.; Gloor, M.; Domingues, L.G.; Cassol, H.L.G.; Tejada, G.; Aragon, L.E.O.C.; Nobre, C.; Peters, W.; et al. Amazon as a carbon source linked to deforestation and climate change. Nature 2020, 595, 388–408. [Google Scholar] [CrossRef] [PubMed]
  2. Sonter, L.J.; Herrera, D.; Barrett, D.J.; Galford, G.L.; Moran, C.J.; Soares-Filho, B.S. Mining drives extensive deforestation in the Brazilian Amazon. Nat. Comun. 2017, 8, 1013. [Google Scholar] [CrossRef] [PubMed] [Green Version]
  3. Hansen, M.C.; Potapov, P.V.; Hancher, M.; Turubanova, S.A.; Tykavina, A.; Thau, D.; Stehman, S.V.; Goetz, S.J.; Loveland, T.R.; Kommareddy, A.; et al. High-resolution global maps of 21st-century forest cover change. Science 2013, 342, 850–853. [Google Scholar] [CrossRef] [PubMed] [Green Version]
  4. Silva, F.F.; Fulgitini, L.E.; Perrin, R. The cost the forest preservation in the Brazilian Amazon: The “arc od deforestation”. J. Agric. Resour. Econ. 2019, 44, 497–512. [Google Scholar] [CrossRef]
  5. IPCC. Refinement to the 2006 IPCC guidelines for national greenhouse gas inventories. In Guidelines for National Greenhouse Gas Inventories; Chapter 11; International Panel on Climate Change (IPCC): Geneva, Switzerland, 2019; Volume 4. [Google Scholar]
  6. Wang, Y.; Guo, J.; Vogt, R.D.; Mulder, J.; Wang, J.; Zang, X. Soil pH as the chief modifier for regional nitrous oxide emission: New evidence and implications for global estimates and mitigation. Glob. Chang. Biol. 2017, 24, e617–e626. [Google Scholar] [CrossRef]
  7. Almeida, C.T.; Oliveira-Júnior, J.F.; Delgado, R.C.; Cubo, P.; Ramos, M.C. Spatiotemporal rainfall and temperature trends throughout the Brazilian Legal Amazon, 1973–2013. Int. J. Climatol. 2017, 37, 2013–2026. [Google Scholar] [CrossRef]
  8. Ghazoul, J.; Burivalova, Z.; Garcia-Ulloa, J.; King, L.A. Conceptualizing forest degradation. Trends Ecol. Evol. 2015, 30, 622–632. [Google Scholar] [CrossRef]
  9. Sun, L.; Sang, C.; Wang, C.; Fan, Z.; Peng, B.; Jiang, P.; Xia, Z. N2O production in the organic and mineral horizons of soil had different responses to increasing temperature. J. Soils Sediments 2019, 19, 3499–3511. [Google Scholar] [CrossRef]
  10. Cardoso, A.S.; Junqueira, J.B.; Reis, R.A.; Ruggieri, A.C. How do greenhouse gas emissions vary with biofertilizer type and soil temperature and moisture in a tropical grassland? Pedosphere 2020, 30, 607–617. [Google Scholar] [CrossRef]
  11. Lai, T.V.; Farquharson, R.; Denton, M.D. High soil temperatures alter the rates of nitrification, denitrification and associated emissions of N2O. J. Soils Sediments 2019, 19, 2176–2189. [Google Scholar] [CrossRef]
  12. Raposo, E.; Brito, L.F.; Janusckiewicz, E.R.; Oliveira, L.F.; Versuti, J.; Assumpção, F.M.; Cardoso, A.S.; Siniscalchi, D.; Delevaatti, L.M.; Malheiros, E.B.; et al. Greenhouse gases emissions from tropical grasslands affected by nitrogen fertilizer management. Agron. J. 2020, 112, 4666–4680. [Google Scholar] [CrossRef]
  13. Zhang, M.; Wang, W.; Wang, D.; Heenan, M.; Xu, Z. Short-term responses of soil nitrogen mineralization, nitrification and desnitrification to prescribed burning in a suburban forest ecosystem of subtropical Australia. Sci. Total Environ. 2018, 642, 879–886. [Google Scholar] [CrossRef]
  14. Figueiredo, C.C.; Oliveira, A.D.; Santos, I.L.; Ferreira, E.A.B.; Malaquias, J.V.; Sá, M.A.C.; Carvalho, A.M.; Santos-Júnior, J.D.G. Relationships between soil organic matter pools and nitrous oxide emissions of agroecosystems in the Brazilian Cerrado. Sci. Total Environ. 2018, 618, 1572–1582. [Google Scholar] [CrossRef]
  15. Ribeiro, K.; Sousa Neto, E.R.; Carvalho Junior, J.A.; Lima, J.R.S.; Menezes, R.S.C.; Duarte Neto, P.J.; Guerra, G.S.; Ometto, J.P.H.B. Land cover changes and greenhouse gas emissions in two different soil covers in the Brazilian Caatinga. Sci. Total Environ. 2016, 571, 1048–1057. [Google Scholar] [CrossRef] [Green Version]
  16. Alvarez, C.; Costantini, A.; Alavres, C.R.; Alves, B.J.R.; Jantalia, C.P.; Martelloto, E.; Urquiaga, S. Soil nitrous oxide emissions under different management practices in the semiarid region of the Argentinian Pampas. Nutr. Cycl. Agroecosyst. 2012, 94, 209–220. [Google Scholar] [CrossRef]
  17. Verchot, L.V.; Davidson, E.A.; Cattânio, J.H.; Ackerman, I.L.; Erickson, H.E.; Keller, M. Land use change and biogeochemical controls of nitrogen oxide emissions from soils in eastern Amazonia. Global Biogeochem. Cycles 1999, 13, 31–46. [Google Scholar] [CrossRef]
  18. Alvares, C.A.; Stape, J.L.; Sentelhas, P.C.; Gonçalves, J.L.M.; Sparovek, G. Koppen’s climate classification map for Brazil. Meteorol. Zeitschift 2013, 22, 711–728. [Google Scholar] [CrossRef]
  19. USDA. Soil Survey Manual, 18th ed.; USDA-United States Department of Agriculture: Washington, DC, USA, 2017. [Google Scholar]
  20. Cardoso, A.S.; Quintana, B.G.; Janusckiewicz, E.R.; Brito, L.F.; Morgado, E.S.; Reis, R.A.; Ruggieri, A.C. N2O emissions from urine-treated tropical soil: Effects of soil moisture and compaction, urine composition, and dung addition. Catena 2017, 157, 325–332. [Google Scholar] [CrossRef] [Green Version]
  21. Moraghan, J.T.; Buresh, R.J. Chemical reduction of nitrite and nitrous oxide by ferrous iron. Soil Sci. Soc. Am. J. 1977, 41, 47–50. [Google Scholar] [CrossRef]
  22. Forster, J.C. Soil nitrogen. In Methods in Applied Soil Microbiology and Biochemistry, 1st ed.; Alef, K., Nannipieri, P., Eds.; Academic Press: London, UK, 1995; pp. 79–87. [Google Scholar]
  23. Doane, T.A.; Horwath, W.R. Spectrophotometric determination of nitrate with a single reagent. Anal. Lett. 2003, 36, 2713–2722. [Google Scholar] [CrossRef]
  24. Marengo, J.A.; Souza, C.M., Jr.; Thonicke, K.; Burton, C.; Halladay, K.; Betts, R.A.; Alves, L.A.; Soares, W.R. Changes in Climate and Land Use Over the Amazon Region: Current and Future Variability and Trends. Front. Earth Sci. 2018, 6, 228. [Google Scholar] [CrossRef]
  25. Castle, L.; Macedo, M. Large-scale degradation of Amazonian fresh water Ecosystem. Glob. Chang. Biol. 2016, 22, 990–1007. [Google Scholar] [CrossRef]
  26. Huddell, A.; Neil, C.; Santos, L.M.; Cerri, C.E.P.; Menge, D. Nitric and nitrous oxide fluxes from intensifying crop agriculture in the seasonally dry tropical Amazon–Cerrado border region. Agric. Ecosyst. Environ. 2021, 4, e20169. [Google Scholar] [CrossRef]
  27. Sapkota, T.K.; Khanam, F.; Mathivanan, G.P.; Vetter, S.; Hussain, S.G.; Pilat, A.L.; Shahrin, S.; Hossain, M.K.; Sarker, N.R.; Krupnik, T. Quantifying opportunities for greenhouse gas emissions mitigation using big data from smallholder crop and livestock farmers across Bangladesh. Sci. Total Environ. 2021, 786, 147344. [Google Scholar] [CrossRef] [PubMed]
  28. Lyianage, A.; Grace, P.R.; Scheer, C.; Pink, D.; Ranwala, S.; Rowlings, D.W. Carbon limits non-linear response of nitrous oxide (N2O) to increasing N inputs in a highly-weathered tropical soil in Sri Lanka. Agric. Ecosyst. Environ. 2020, 292, 106808. [Google Scholar] [CrossRef]
  29. Wachiye, S.; Merbold, L.; Vesala, T.; Rime, J.; Rasanen, M.; Laitner, S.; Pellikka, P. Soil greenhouse gas emissions under different land-use types in savanna ecosystems of Kenya. Biogeosciences 2020, 17, 2149–2167. [Google Scholar] [CrossRef] [Green Version]
  30. Albirich, K.; Rammer, W.; Turner, M.G.; Ratajczak, Z.; Braziunas, K.H.; Hansen, W.D.; Seidl, R. Simulating forest resilience: A review. Glob. Ecol. Biogeogr. 2020, 29, 2082–2096. [Google Scholar] [CrossRef]
  31. Peri, P.L.; López, D.R.; Rusch, V.; Rusch, G.; Rosas, Y.M.; Pastur, G.M. State and transition model approach in native forests of Southern Patagonia (Argentina): Linking ecosystem services, thresholds and resilience. Int. J. Biodivers. Sci. Ecosyst. Serv. Manag. 2017, 13, 105–118. [Google Scholar] [CrossRef] [Green Version]
  32. Meurer, K.H.E.; Franko, U.; Stange, C.F.; Rosa, J.D.; Madari, B.E.; Jungkunst, H.F. Direct nitrous oxide (N2O) fluxes from soils under different land use in Brazil—A critical review. Environ. Res. Lett. 2016, 11, 023001. [Google Scholar] [CrossRef]
  33. Corrêa, D.C.C.; Cardoso, A.S.; Ferreira, M.R.; Siniscalchi, D.; Toniello, A.D.; Lima, G.C.; Reis, R.A.; Ruggieri, A.C. Are CH4, CO2, and N2O emissions from soil affected by the sources and doses of nin warm-season pasture? Atmosphere 2021, 12, 697. [Google Scholar] [CrossRef]
  34. Sato, J.H.; Carvalho, A.M.; Figueiredo, C.C.; Coser, T.R.; Sousa, T.T.; Vilela, L.; Marchão, R.L. Nitrous oxide fluxes in a Brazilian clayey oxisol after 24 years of integrated crop-livestock management. Nutr. Cycl. Agroecosyst. 2017, 108, 55–68. [Google Scholar] [CrossRef]
  35. Abalos, M.; Orbe, C.; Kinnison, D.E.; Plummer, D.; Oman, L.D.; Jockel, P.; Morgenstern, O.; Garcia, R.R.; Zeng, G.; Stone, K.A.; et al. Future trends in stratosphere-to-troposphere transport in CCMI models. Atmos. Chem. Phys. 2020, 20, 6883–6901. [Google Scholar] [CrossRef]
  36. Mazzetto, A.M.; Barneze, A.S.; Feigl, B.J.; Van Groeningen, J.W.; Oenema, O.; Cerri, C.C. Temperature and moisture affect methane and nitrous oxide emission from bovine manure patches in tropical conditions. Soil Biol. Biochem. 2014, 76, 242–248. [Google Scholar] [CrossRef]
  37. Cardoso, A.S.; Brito, L.F.; Janusckiewicz, E.R.; Morgado, E.S.; Barbero, R.P.; Korckeck, J.F.W.; Reis, R.A.; Ruggieri, A.C. Impact of grazing intensity and seasons on greenhouse gas emissions in tropical grassland. Ecosystems 2016, 20, 845–859. [Google Scholar] [CrossRef]
  38. Jantalia, C.P.; Santos, H.P.; Urquiaga, S.; Boddey, R.M.; Alves, B.J.R. Fluxes of nitrous oxide from soil under different crop rotations and tillage systems in the South of Brazil. Nutr. Cycl. Agroecosyst. 2008, 82, 161–173. [Google Scholar] [CrossRef]
  39. Wu, D.; Dong, W.; Oenema, O.; Wan, G.Y.; Trebs, I.; Hu, C. N2O consumption by low-nitrogen soil and its regulation by water and oxygen. Soil Biol. Biochem. 2017, 60, 165–172. [Google Scholar] [CrossRef]
  40. Ri, X.; Prentice, C.; Spahni, R.; Niu, H.S. Modelling terrestrial nitrous oxide emissions and implications of climate feedback. New Phytol. 2012, 196, 472–488. [Google Scholar] [CrossRef]
  41. Cui, P.; Fan, F.; Yin, C.; Song, A.; Huang, P.; Tang, Y.; Zhu, P.; Peng, C.; Li, T.; Wakelin, S.A.; et al. Long-term organic and inorganic fertilization alters temperature sensitivity of potential N2O emissions and associated microbes. Soil Biol. Biochem. 2016, 93, 131–141. [Google Scholar] [CrossRef]
  42. Parra, J.L.; Pulido, M.; Fondón, C.L.; Schnabel, S. How do soil moisture and vegetation cover influence soil temperature in drylands of Mediterranean regions? Water 2018, 10, 1747. [Google Scholar] [CrossRef] [Green Version]
  43. Zhang, Y.; Wang, J.; Dai, S.; Sun, Y.; Chen, J.; Cai, Z.; Zhang, J.; Muller, C. Temperature effects on N2O production pathways in temperate forest soils. Sci. Total Environ. 2019, 691, 1127–1136. [Google Scholar] [CrossRef]
  44. Taylor, A.; Giguere, A.; Zoebelein, C.; Myrold, D.D.; Bottomley, P.J. Modeling of soil nitrification responses to temperature reveals thermodynamic differences between ammonia-oxidizing activity of archaea and bacteria. ISME J. 2017, 11, 896–908. [Google Scholar] [CrossRef]
  45. Grant, R.F.; Pattey, E. Temperature sensitivity of N2O emissionsfrom fertilized agricultural soils: Mathematical modeling in ecosys. Glob. Biogeochem. Cycles 2008, 22, GB4019. [Google Scholar] [CrossRef]
  46. Dai, Z.; Yu, M.; Chen, H.; Zhto, H.; Huang, Y.; Su, W.; Xia, F.; Chang, S.; Brookes, P.C.; Dahlgren, R.A.; et al. Elevated temperature shifts soil N cycling from microbial immobilization to enhanced mineralization, nitrification and denitrification across global terrestrial ecosystems. Glob. Chang. Biol. 2020, 26, 5267–5276. [Google Scholar] [CrossRef]
  47. Guntinãs, M.E.; Leirós, M.C.; Trasar-Cepeda, C.; Sotes, F.G. Effects of moisture ana temperature on net soil nitrogen mineralization: A laboratory study. Eur. J. Soil Biol. 2012, 48, 73–80. [Google Scholar] [CrossRef]
  48. Zinn, Y.L.; Marrenjo, G.J.; Silva, C.A. Soil C:N ratios are unresponsive to land use change in Brazil: A comparative analysis. Agric. Ecosyst. Environ. 2018, 255, 62–72. [Google Scholar] [CrossRef]
  49. Krauss, M.; Ruser, R.; Muller., T.; Hansen., S.; Mader, P.; Gattinger, A. Impact of reduced tillage on greenhouse gas emissions and soil carbon stock in an organic grass-clover ley-winter wheat cropping sequence. Agric. Ecosyst. Environ. 2017, 239, 324–333. [Google Scholar] [CrossRef]
  50. Borowik, A.; Wyszkowska, J. Soil moisture as a factor affecting the microbiological and biochemical activity of soil. Plant Soil Environ. 2016, 62, 250–255. [Google Scholar] [CrossRef]
  51. Klein, C.A.M.; Weerden, T.J.C.D.; Lo, J.; Cameron, K.C.; Di, H.J. A review of plant options for mitigating nitrous oxide emissions from pasture-based systems. N. Z. J. Agric. Res. 2020, 63, 29–43. [Google Scholar] [CrossRef]
  52. Lessa, A.C.R.; Madari, B.; Walls, D.S.; Boddey, R.M.; Urquiaga, S.; Jantalia, C.P.; Alves, B.J.R. Bovine urine and dung deposited on Brazilian savannah pastures contribute differently to direct and indirect soil nitrous oxide emissions. Agric. Ecosyst. Environ. 2014, 190, 104–111. [Google Scholar] [CrossRef]
  53. Cardoso, A.S.; Oliveira, S.C.; Janusckiewicz, E.R.; Brito, L.F.; Morgado, E.S.; Reis, R.A.; Ruggieri, A.C. Seasonal effects on ammonia, nitrous oxide, and methane emissions for beef cattle excreta and urea fertilizer applied to a tropical pasture. Soil Tillage Res. 2019, 194, 104341. [Google Scholar] [CrossRef]
  54. Signor, D.; Cerri, C.E.P. Nitrous oxide emissions in agricultural soils: A review. Pesq. Agropec. Trop. 2013, 43, 322–338. [Google Scholar] [CrossRef]
  55. Xie, B.; Gu, J.; Yu, J.; Han, G.; Zheng, X.; Xu, Y.; Lin, H. Effects of N fertilizer on soil N2O emissions and CH4 uptake: A two-year study in an apple orchard in -eastern China. Atmosphere 2017, 8, 181. [Google Scholar] [CrossRef] [Green Version]
Figure 1. Total N2O emissions (µg N2O g−1 of dry soil) in soil submitted to land-use systems in the Brazilian Amazon. Different lowercase letters represent the differences evaluated by the Tukey test (p < 0.05).
Agronomy 12 01608 g001
Figure 2. N2O fluxes (ng N2O g−1 dry soil day−1) in different land uses in the Brazilian Amazon.
Agronomy 12 01608 g002
Figure 3. N2O fluxes (ng N2O g−1 dry soil day−1) in different land uses (A) forest; (B) pasture; and (C) agriculture in the Brazilian Amazon, incubated at different temperatures.
Agronomy 12 01608 g003
Figure 4. N2O fluxes (ng N2O g−1 dry soil day-1) in different land uses (A) forest; (B) pasture; (C) agriculture in the Brazilian Amazon, subjected to the addition of nitrogen.
Agronomy 12 01608 g004
Table 1. Soil physical-chemical characteristics in different land-use systems.
Land UsepHOMP *CaMgKAlH%VSandSiltClay
CaCl2g dm−3mg dm−3mmolC dm−3%
Forest4.32310420.3143810671122
Pasture4.81011241.00234281415
Agriculture4.713111750.51264678517
* Used the resin method followed by spectrometry, OM: organic matter; %V: base saturation.
Table 2. Total N2O emissions (μg N2O g−1 dry soil) in different land-use systems, subjected to temperature levels.
Land UseTemperature (°C)AverageModel of RegressionR2
25303540
Forest−0.2 b−0.2 b16.4−3.63.1Y = 3.1-
Pasture7.6 b270.2 a137.64.0104.9Y = −4.0X² + 254.7X − 3863.084
Agriculture230.4 a176.2 a108.65.2130.1Y = −14.9X + 613.298
Average79.3148.787.51.9
Different lowercase letters within a column represent differences from each other according to Tukey’s test (p < 0.05).
Table 3. Total N2O emissions (μg N2O g−1 dry soil) in different land-use systems in the Brazilian Amazon, subjected to the addition of nitrogen in the soil.
Land UseNitrogen in Soil (kg N ha−1)AverageModel of RegressionR2
090180270
Forest4.87.412.0 b35.8 b15.0Y = 15.0-
Pasture20.467.8215.4 a323.2 a156.7Y = 1.2X − 1.797
Agriculture15.636.6196.2 a263.4 a127.9Y = 1.0X − 7.593
Average13.637.3141.2207.5
Different lowercase letters within a column represent differences from each other according to Tukey’s test (p < 0.05).
Table 4. Concentrations of ammonium (mg N NH4 kg−1 dry soil) and nitrate (mg N NO3 kg−1 dry soil) in soils of different land-use systems under incubation temperature and nitrogen input.
Land Use
ForestPastureAgriculture
Initial
Ammonium22.632.111.1
Nitrate0.31.61.4
Incubation 1
Ammonium38.428.717.7
Nitrate0.62.42.4
Incubation 2
Ammonium 25 °C30.022.518.0
Nitrate 25 °C0.30.40.3
Ammonium 30 °C26.323.115.1
Nitrate 30 °C0.30.50.3
Ammonium 35 °C25.327.114.8
Nitrate 35 °C2.30.62.1
Ammonium 40 °C23.713.515.6
Nitrate 40 °C1.41.51.5
Incubation 3
Ammonium 0 kg N12.27.87.5
Nitrate 0 kg N2.38.36.9
Ammonium 90 kg N20.410.17.5
Nitrate 90 kg N2.411.814.2
Ammonium 180 kg N25.214.220.5
Nitrate 180 kg N1.912.57.1
Ammonium 270 kg N43.426.137.3
Nitrate 270 kg N2.86.24.8
Publisher’s Note: MDPI stays neutral with regard to jurisdictional claims in published maps and institutional affiliations.

