Article

Straw-Based Biopurification Systems to Remove Ibuprofen, Diclofenac and Triclosan from Wastewaters: Dominant Microbial Communities

by
Laura Delgado-Moreno
,
Pieter van Dillewijn
,
Rogelio Nogales
and
Esperanza Romero
*
Department of Environmental Protection, Estación Experimental del Zaidín-Consejo Superior de Investigaciones Científicas (EEZ-CSIC), C/Profesor Albareda 1, 18008 Granada, Spain
*
Author to whom correspondence should be addressed.
Agronomy 2021, 11(8), 1507; https://doi.org/10.3390/agronomy11081507
Submission received: 27 May 2021 / Revised: 19 July 2021 / Accepted: 26 July 2021 / Published: 29 July 2021

Abstract

:
The continued discharge of pharmaceuticals and personal care products (PPCPs) into the environment due to their widespread use and the lack of effective systems for their removal from water is a global problem. In this study, the dissipation of ibuprofen, diclofenac and triclosan added simultaneously in biopurification systems (BPSs) with different compositions and their effect on the microbial community structure was analysed. Three BPSs, constituted by mixtures of soil (S), peat (P), or raw wet olive mill cake (A) or its vermicompost (V) and straw (S) were prepared (SPS, SAS and SVS). Sorption and degradation experiments were carried out. After 84 days of incubation, more than 85% of each PPCP applied had dissipated. Methyl-triclosan was determined to be highest in the SVS biomixture. Biomixtures with lower C/N ratio and higher alpha diversity were the most effective in the removal of PPCPs. Initially, the BPS biomixtures showed a different microbial structure dominated by Proteobacteria, Actinobacteria and Bacteroidetes but after addition of PPCPs, a similar pattern was observed in the relative abundance of the phylum Chloroflexi, the class Sphingobacteriia and the genus Brevundimonas. These biopurification systems can be useful to prevent point source contamination due to the disposal of PPCP-contaminated waters.

1. Introduction

The growing global consumption of medicines, which reached some 4.5 trillion doses in 2020, their continued release into the environment and the lack of knowledge about their behaviour and toxicity, are a cause for concern worldwide [1,2,3]. Pharmaceuticals, widely used in human and veterinary practices, and personal care products (PPCPs) are biologically highly active chemicals, with different physicochemical properties and frequently detected in different environmental compartments [3,4,5]. Among the PPCPs, the non-steroidal anti-inflammatory drugs (NSAIDs) ibuprofen (IBP) and diclofenac (DCF) and the antimicrobial triclosan (TCS) are frequently detected in surface and ground waters all over the world and sometimes their concentrations exceed ecotoxicity endpoints. Diclofenac is toxic to fish and was related to the extinction of the vulture in India and Pakistan [6,7]. Ibuprofen affects the growth and reproduction of aquatic species and had genotoxic effect for fish at concentrations of ng L−1 [8]. This pharmaceutical and its hydroxyl and carboxyl derivatives are frequently detected in waters [9]. Triclosan, widely used in household and personal care products, poses a serious environmental risk to algae [10] and can lead to resistance, which is one of the greatest global health threats today. In addition, metabolites of these PPCPs were also detected in the environment [11,12] being able to cause even more toxicity than its parents. For example, methyl-triclosan (M-TCS), triclosan metabolite, loses its antibacterial property but acquires stronger lipophilicity (log Kow = 5.2), bioaccumulation, and environmental persistence, as compared with TCS [12,13,14,15]. Consequently, it is important to develop sustainable systems to remove the polluting load from wastewaters by treatment plants (WWTP) as well as from effluents from pharmaceutical industries, hospitals and animal or fish farms [9,15].
Biobed biopurification systems are designed to collect and mitigate pesticide spills on farms avoiding point source contamination of soil and water. These BPS are being investigated in different countries around the world due to their numerous advantages such as low cost, easy implementation, versatility and efficiency [16,17,18]. Recently, Delgado-Moreno et al. [16] demonstrated for the first time that these biopurification systems (BPSs) composed of soil mixed with olive oil wastes and olive pruning as a texturizing product can be a low-cost alternative to eliminate PPCPs from waters. The effectiveness of this biotechnology has been related to the composition of the BPS biomixtures as well as with their microbial community structure [17]. It is expected that systems containing straw, a readily biodegradable carbon source, can stimulate microbial community development and oxidative enzyme production [18]. These carbon sources can serve as electron donors facilitating PPCP degradation by cometabolism [11,19,20]. Besides, it may confer stability, resistance and adaptability to the microbial community against pollutants such as pesticides and promote high detoxification potential for many toxic chemicals [21,22]. Fungi and bacteria have been implicated in the degradation of NSAIDs, but much less is known about the biodegradation of these compounds by bacteria and even less in biopurification systems [17,20]. Some authors [23] described that the addition of oxytetracycline to biopurification systems did not affect the efficiency of pesticide removal or microbial community (bacterial and fungal) structure. In a previous study with a biopurification system composed of soil with vermicompost of olive oil mill cake and olive prune (SVP) we determined that bacterial communities were more affected by incubation time than by PPCPs, which affected the composition and relative abundance of bacteria taxa [17]. However, information on the influence of the composition of the biomixture and the role of the bacterial microbial community structure on the efficacy of BPS in removing PPCPs is still not readily available. It could be expected that the inherent differences in the microbial communities of the biomixtures will also affect their responses to the addition of PPCPs.
The aim of the present study was to investigate the efficacy of three BPS microcosms containing soil mixed with three organic substrates of different maturity and with straw. The sorption and dissipation of three PPCP (ibuprofen, diclofenac and triclosan) were studied in the three biopurification systems when those compounds were applied simultaneously. The degradation products were determined. The bacterial community structure of these biopurification systems was analyzed, before and after the addition of PPCPs, at two different incubation times, to determine the most abundant and representative bacteria involved in their removal.

2. Material and Methods

2.1. Soil, Organic Material and Preparation of Biomixtures

The agricultural soil was collected from an olive grove in Granada, southeastern Spain (S2, 0436148-4211209, zone 30S). The soil sample from the plow layer (0–25 cm) was sieved at 4 mm. This chromic vertisol had a silty clay loam texture with 39.1% carbonates, 23 g kg−1 organic carbon (OC), 2.1 g kg−1 nitrogen, and pH 8.2. The wet olive cake or alperujo, which is the main organic waste generated during the two-phase continuous centrifugation system used for the olive-oil extraction, had a pH 5.2, 470 g kg−1 total organic carbon, and 9.8 g kg−1 of nitrogen. The mature vermicompost from wet olive cake, which was obtained after a vermicomposting process, using the earthworm Eisenia fetida, as described elsewhere [24], had a pH 7.8, 274 g kg−1 OC, and 19 g kg−1 of nitrogen. The peat was obtained from Turbera del Agia (Padul, Granada, Southern Spain) and it had a pH of 4.5, 301 g kg−1 total organic carbon, and 8 g kg−1 of nitrogen. The barley straw used as texturing agent had 571 g kg−1 and 1.8 g kg−1 of organic carbon and nitrogen, respectively. All organic materials assayed were passed through a 4-mm sieve.
Three biopurification systems at microcosms scale were prepared in glass containers (7.5 cm × 8.5 cm) using abundant local and low-cost wastes from agricultural and agroindustrial activity in the region. The first system was composed of soil, wet olive cake or alperujo and straw from barley (SAS). The second consisted of soil, mature vermicompost and barley straw (SVS) and the third was composed of soil, peat and barley straw (SPS). All biomixtures mixed in a 1:1:2 (v:v:v) ratio to obtain aerobic conditions [18], humified at 80% of their field capacity and then stabilized for one and a half month at 20 °C under greenhouse conditions and finally air-dried and homogenized by mixing. The main physicochemical properties of the biomixtures determined using validated methods described in previous studies [16,25], are given in Table 1.

2.2. Chemicals

Diclofenac sodium salt (DCF) (2-[2-[(2,6-dichlorophenyl)amino]phenyl]acetic acid), ibuprofen (IBP) ((RS)-2-(4-(2-methylpropyl)phenyl)propanoic acid), triclosan (TCS) 5-chloro-2-(2,4-dichlorophenoxy)phenol) and methyl-triclosan (M-TCS) with purities greater than 97% were purchased from Sigma–Aldrich (St. Louis, MO, USA). Sodium DCF, IBP and TCS have pka values of 4, 4.91 and 8.0, respectively and log Kow values of 0.7, 1.16 and 4.76, respectively. Standard solutions of IBP, DCF and TCS were prepared in acetone, by adding the PPCPs individually or in mixture, at 1 g L−1 each. Solutions were stored at 4 °C. Ultra-pure water was obtained from a Milli-Q water purification system. Acetonitrile and acetone were of chromatography quality and purchased from Scharlau (Barcelona, Spain).

2.3. Adsorption of PPCPs in the Biomixtures

The sorption process was carried out using the batch equilibrium method. Samples of each biomixture (0.5 g), in triplicate, were placed in glass tubes and spiked with aliquots of the individual PPCP standards or the mixture solution to obtain final concentrations of 25, 50, 100, 200 and 250 mg Kg−1 each. The samples were placed in a fume hood to evaporate the solvent and then agitated end-over-end with 25 mL Milli-Q water in a thermostatic chamber at 20 °C under dark conditions for 24 h (time enough to reach equilibrium). Afterwards, samples were centrifuged at 3000 rpm for 5 min. The PPCP residues remaining in the biomixtures after centrifugation were extracted with the method described in the extraction and analysis section. Aliquots of the supernatants (1 mL) were diluted with 1 mL of acetonitrile before analysis. All samples were passed through 0.45 µm PTFE filters before HPLC analysis.

2.4. Dissipation Study in Microcosm Biopurification System

Aliquots of the standard solutions of IBP, DCF and TCS were applied to 1 g of silica sand, previously washed with 1N HCl and autoclaved. After solvent evaporation, the contaminated sand was mixed homogenously with each biomixture (40 g air-dried) in duplicate to reach up to a concentration of 20 µg g−1 of each chemical. These biomixtures were set up in a microcosm biopurification system (BPS), moistened at 75% of their field capacities with milliQ water and then incubated for 3 months at 20 °C in a thermostatic chamber under dark conditions. The moisture content in the biomixture was kept constant by weight control. Dissipation experiments were also run in parallel on sterile microcosm biopurification systems. For abiotic control, biomixture samples of 1 kg were placed in a cotton bag, sealed and submitted to tindalization at 95 °C for 45 min and then left at room temperature for 24 h. The tindalization was repeated for three consecutive days and thereafter samples were left at room temperature for one week. This procedure was carried out three times to control biological degradation. The moisture of these sterilized biomixtures was adjusted along the incubation time with milliQ water containing sodium azide at 25 g L−1 to prevent the development of microorganisms.
Sampling was carried out from each microcosm BPSs in duplicate after PPCP application at 0, 3, 5, 10, 21, 42 and 84 days (i.e., 4 samples analysed per treatment and time). The samples were extracted as described below to determine the residual amount of each PPCP and the presence of their metabolites. To determine the degradation kinetic parameters for the PPCPs in each biomixture, a single first-order dissipation kinetics (Ct = Co × e−kt) was used [16].

2.5. Analysis of the PPCPs and Their Metabolites

Samples of each biomixture (0.5 g) from the adsorption experiment were extracted with QuEChERS and analysed according to the method described previously by Delgado-Moreno et al. [16]. The limit of detection was 0.20 mg L−1 and the limit of quantification was 0.3 mg Kg−1. Recoveries of the extraction accounted for 105–115%, 90–92% and 82–91% for IBP, DCF and TCS, respectively, depending on the biomixture.
Biomixture samples (3 g dry weight) from each microcosm biopurification system of the dissipation study were extracted in duplicate following also the QuEChERS method published elsewhere [16]. The recoveries for DCF, IBP and TCS were 87–90%, 87–105% and 82–93% respectively, depending on the biomixture. The metabolite methyl-triclosan M-TCS was extracted by using the QuEChERS method with some modifications. After sample centrifugation, an aliquot of the supernatant was concentrated to dryness by a N2 stream, redissolved in 1 mL of acetonitrile: water (1:1), and filtered through 0.45 μm PTFE filters to be analysed by HPLC. Recoveries for M-TCS in SAS, SVS and SPS were 77% ± 2%, 74% ± 3% and 76% ± 3%, respectively.
The PPCPs and the metabolite M-TCS were analysed by reverse-phase on a HPLC equipped with a DAD detector (series 1100, Agilent Technologies, Santa Clara, CA, USA). The separation was conducted on a Zorbax RX-C8 column (5 mm, 2.1 mm × 150 mm) (Agilent Technologies, Santa Clara, CA, USA) connected to an Eclipse XDB-C8 (5 mm, 2.1 mm × 12.5 mm) precolumn (Agilent Technologies, Santa Clara, CA, USA). The mobile phase was acetonitrile: MilliQ water at pH 3 (1:1) at a flow rate of 0.2 mL min−1, the injection volume was 10 µL and the column temperature 40 °C. DCF was determined at a wavelength of 275 nm and IBP and TCS at 225 nm. The same HPLC conditions were used for M-TCS but with ACN:MilliQ water at pH 3 (70:30) as mobile phase. The wavelength for M-TCS was set to 205 nm. The limit of detection was 0.20 mg L−1. The metabolite was identified by comparing the HPLC retention times and UV-visible spectra with those of the external standards and confirmed by GC/MS using a gas chromatograph Varian Model 480 GC coupled to a 240 MS detector (Agilent Technologies, Santa Clara, CA, USA). Other metabolites of DCF, IBP and TCS were identified in the extracts from samples of these biomixtures by ultra-high performance liquid chromatography with quadrupole time-of-flight mass spectrometry (UPLC-Q-TOF-MS) as described by Delgado-Moreno et al. [16].

2.6. DNA Extraction and Microbial Identification

Fresh biomixture samples (250 mg dry weight) were collected from each microcosm biopurification system, before PPCP application (BC, uncontaminated biomixture) and at 10 and 84 days after PPCP application. For DNA extraction, the Power soil® DNA isolation kit (Mo Bio Laboratories, Inc., Carlsbad, CA, USA) was used according to the manufacturer’s instructions. DNA quality and quantity was checked with a Nanodrop ND-1000 spectrophotometer (Thermo Fisher Scientific Wilmington, DE, USA). Samples of 22 µL with the extracted DNA were kept at −20 °C and sent to the Research and Testing Laboratory (RTL Genomics Lubbock, Texas, USA) for the amplification and iTag sequencing process, which was done using Illumina Miseq equipment and Illumina Miseq Reagent kit v3 at a depth of 5000 reads per sample. All sequence files were submitted to the National Center for Biotechnology Information (NCBI) and can be accessed in BioProject PRJNA732830 (https://www.ncbi.nlm.nih.gov/bioproject/?term=PRJNA732830 (accessed on 26 May 2021)). Bacterial DNA were amplified by polymerase chain reaction (PCR) using the 16S primers pairs 515F (5′-GTGCCAGCMGCCGCGGTAA-3′) and 806R (5′-GGACTACHVGGGTWTCTAAT-3′) which target the V4 region of the 16S SSU rRNA. Sequence data were processed using a Research and Testing pipeline that is described at http://www.researchandtesting.com/docs/Data_Analysis_Methodology.pdf (accessed on 26 May 2021). Briefly, the cleaned and conditioned sequences were grouped by clustering at 96% homology, using the USEARCH alignment algorithm and then into operational taxonomic units (OTUs) using the UPARSE algorithm [26]. Subsequently, using the USEARCH alignment algorithm, they were re-analysed against a database of sequences derived from the NCBI database to assign taxonomic information to each OTU. Diversity was examined from two perspectives. (1) The overall richness (i.e., the number of distinct organisms present within the microbiome), was expressed as the number of OTUs, and was quantified using the Chao 1 richness estimator, and (2) the overall diversity was expressed as Shannon diversity.

2.7. Data Analysis

The Modelmaker 4.0 modelling program (Cherwell Scientific Ltd., Oxford, UK) was used to select the best degradation model to describe the dissipation kinetics for the PPCPs. One-way analysis of variance (ANOVA) was used to determine significant differences between the kinetic parameters and the relative abundance of bacteria between the samples and between sampling times at the phylum level. Hierarchical clustering was determined with the method that uses an average linkage between groups and Euclidean squared distances. The statistical analysis was performed using SPSS (IBM SPSS, Statistics 24). Principal coordinate analyses (PCoA) based on Bray-Curtis distances and Non-metric Multidimensional Scaling (NMDS) ordination and hierarchical cluster analysis of bacterial community composition at the genus level based on the Bray-Curtis similarity were determined using PAST software version 3.21 (https://folk.uio.no/ohammer/past/ (accessed on 26 March 2021)).

3. Results and Discussion

3.1. Comparison of Chemical Properties of Uncontaminated Biomixtures

The hierarchical cluster analysis based on squared Euclidean distances was made with the chemical properties of the biomixtures to understand the relationship between them (Supplementary Figure S1). This analysis reveals significant differences between the properties of the three biomixtures (F = 27, p = 0.001). The SAS biomixture (cluster 1) had TC, TOC, FA, WSC, hemicellulose, and cellulose values higher than the arithmetic average of the properties measured (Table 1). The SVS biomixture (cluster 2) showed intermediate values but had the highest values of total Kjeldahl nitrogen (TKN) and lignin. The SPS biomixture (cluster 3) had the lowest values compared to the total average but had a higher content of extractable carbon (TEC) and humic acids (HA) (Supplementary Figure S1). The main cluster showed the largest Euclidean distance (25) for the three biomixtures. Within this group, the SAS and SVS biomixtures clustered together with a shorter distance (14). This clustering indicates that the chemical properties of the biomixture including peat (SPS) differed from the biomixtures including raw or vermicomposted wet olive cake (SAS, SVS respectively).

3.2. PPCP Adsorption in the Biomixtures

The experimental data from the adsorption isotherms of ibuprofen, diclofenac and triclosan by the biomixtures followed a linear adsorption equation with determination coefficients (R2) > 0.94 (Table 2). This type of isotherm reveals that the adsorption sites exposed by the biomixtures were not totally occupied and suggests a dominance of a partitioning adsorption mechanism where the adsorbate molecules are distributed between the interfacial phase and the solution phase without any specific bonding between the adsorbate and the adsorbent. The adsorption distribution coefficients (Kd) revealed that triclosan was strongly adsorbed by the three biomixture while the other PPCPs were comparatively much less adsorbed (Table 2). Kd values for ibuprofen in SVS were significantly smaller with respect to SAS and SPS biomixtures, while for diclofenac they were similar in the three biomixtures. Kd values determined for ibuprofen and triclosan in SAS were greater than in SVS, which can be due in part to its high organic carbon content (Table 1). In fact, the organic carbon normalized distribution coefficient (Koc) determined for ibuprofen and triclosan in both biomixtures were not significantly different (Table 2). However, in SVS and SPS, with similar organic carbon content, the variability in adsorption coefficients must be attributed to the different characteristics of the organic carbon fractions, due to vermicompost and peat properties. Triclosan was almost totally adsorbed by the three biomixtures (≥95% of the initial amount) meanwhile the relative amount adsorbed for diclofenac and ibuprofen were 4 and 8 times lower, respectively. In general, the adsorption capacity of the PPCPs by the biomixture follows the sequence SPS ≥ SAS > SVS. This sequence may be associated in part with the total extractable carbon (TEC) and humic content which were highest in SPS but lowest in SVS (Table 1). The pH value of the biomixtures was also important to understand the sorption process when PPCPs such as ibuprofen and sodium diclofenac have a dissociation constant (pKa) of 4.15 and 4, respectively. Both pharmaceuticals, in the biomixtures with pH > 7 were mainly in anionic forms due to the dissociation of the carboxylic group [27]. Consequently, repulsive interactions will dominate between these molecules and the surfaces of the adsorbent and would explain the lower adsorption of these anionic compounds. However, the triclosan molecule with a pKa value of 7.8 is in a non-dissociated state and due to its aromaticity and hydrophobic character, it can interact by several mechanisms such as hydrophobic interactions and hydrogen bonding between the chloride atom and the hydrogen from the organic fractions or between the hydroxyl group and electronegative elements on the surface of the adsorbent.
In our study, the Kd values of triclosan were more than 3-fold the values determined for a sandy loam soil or a silt loam soil [28]. This was due partly to the high organic matter and humic acid content in the biomixtures [29]. In agricultural soils, the adsorption of ibuprofen, diclofenac and triclosan correlated with the organic carbon content [30]. The log Koc values reported for these compounds in those soils were comparable to those determined in these biomixtures (Table 2). Previous studies with other types of biomixtures also suggest that the quantity and quality of the organic carbon in the biomixture affects adsorption interactions for PPCPs [16]. The adsorption coefficients reveal that the assayed biomixtures had a high adsorption capability to retain simultaneously the three PPCPs despite their different chemical structures and properties.

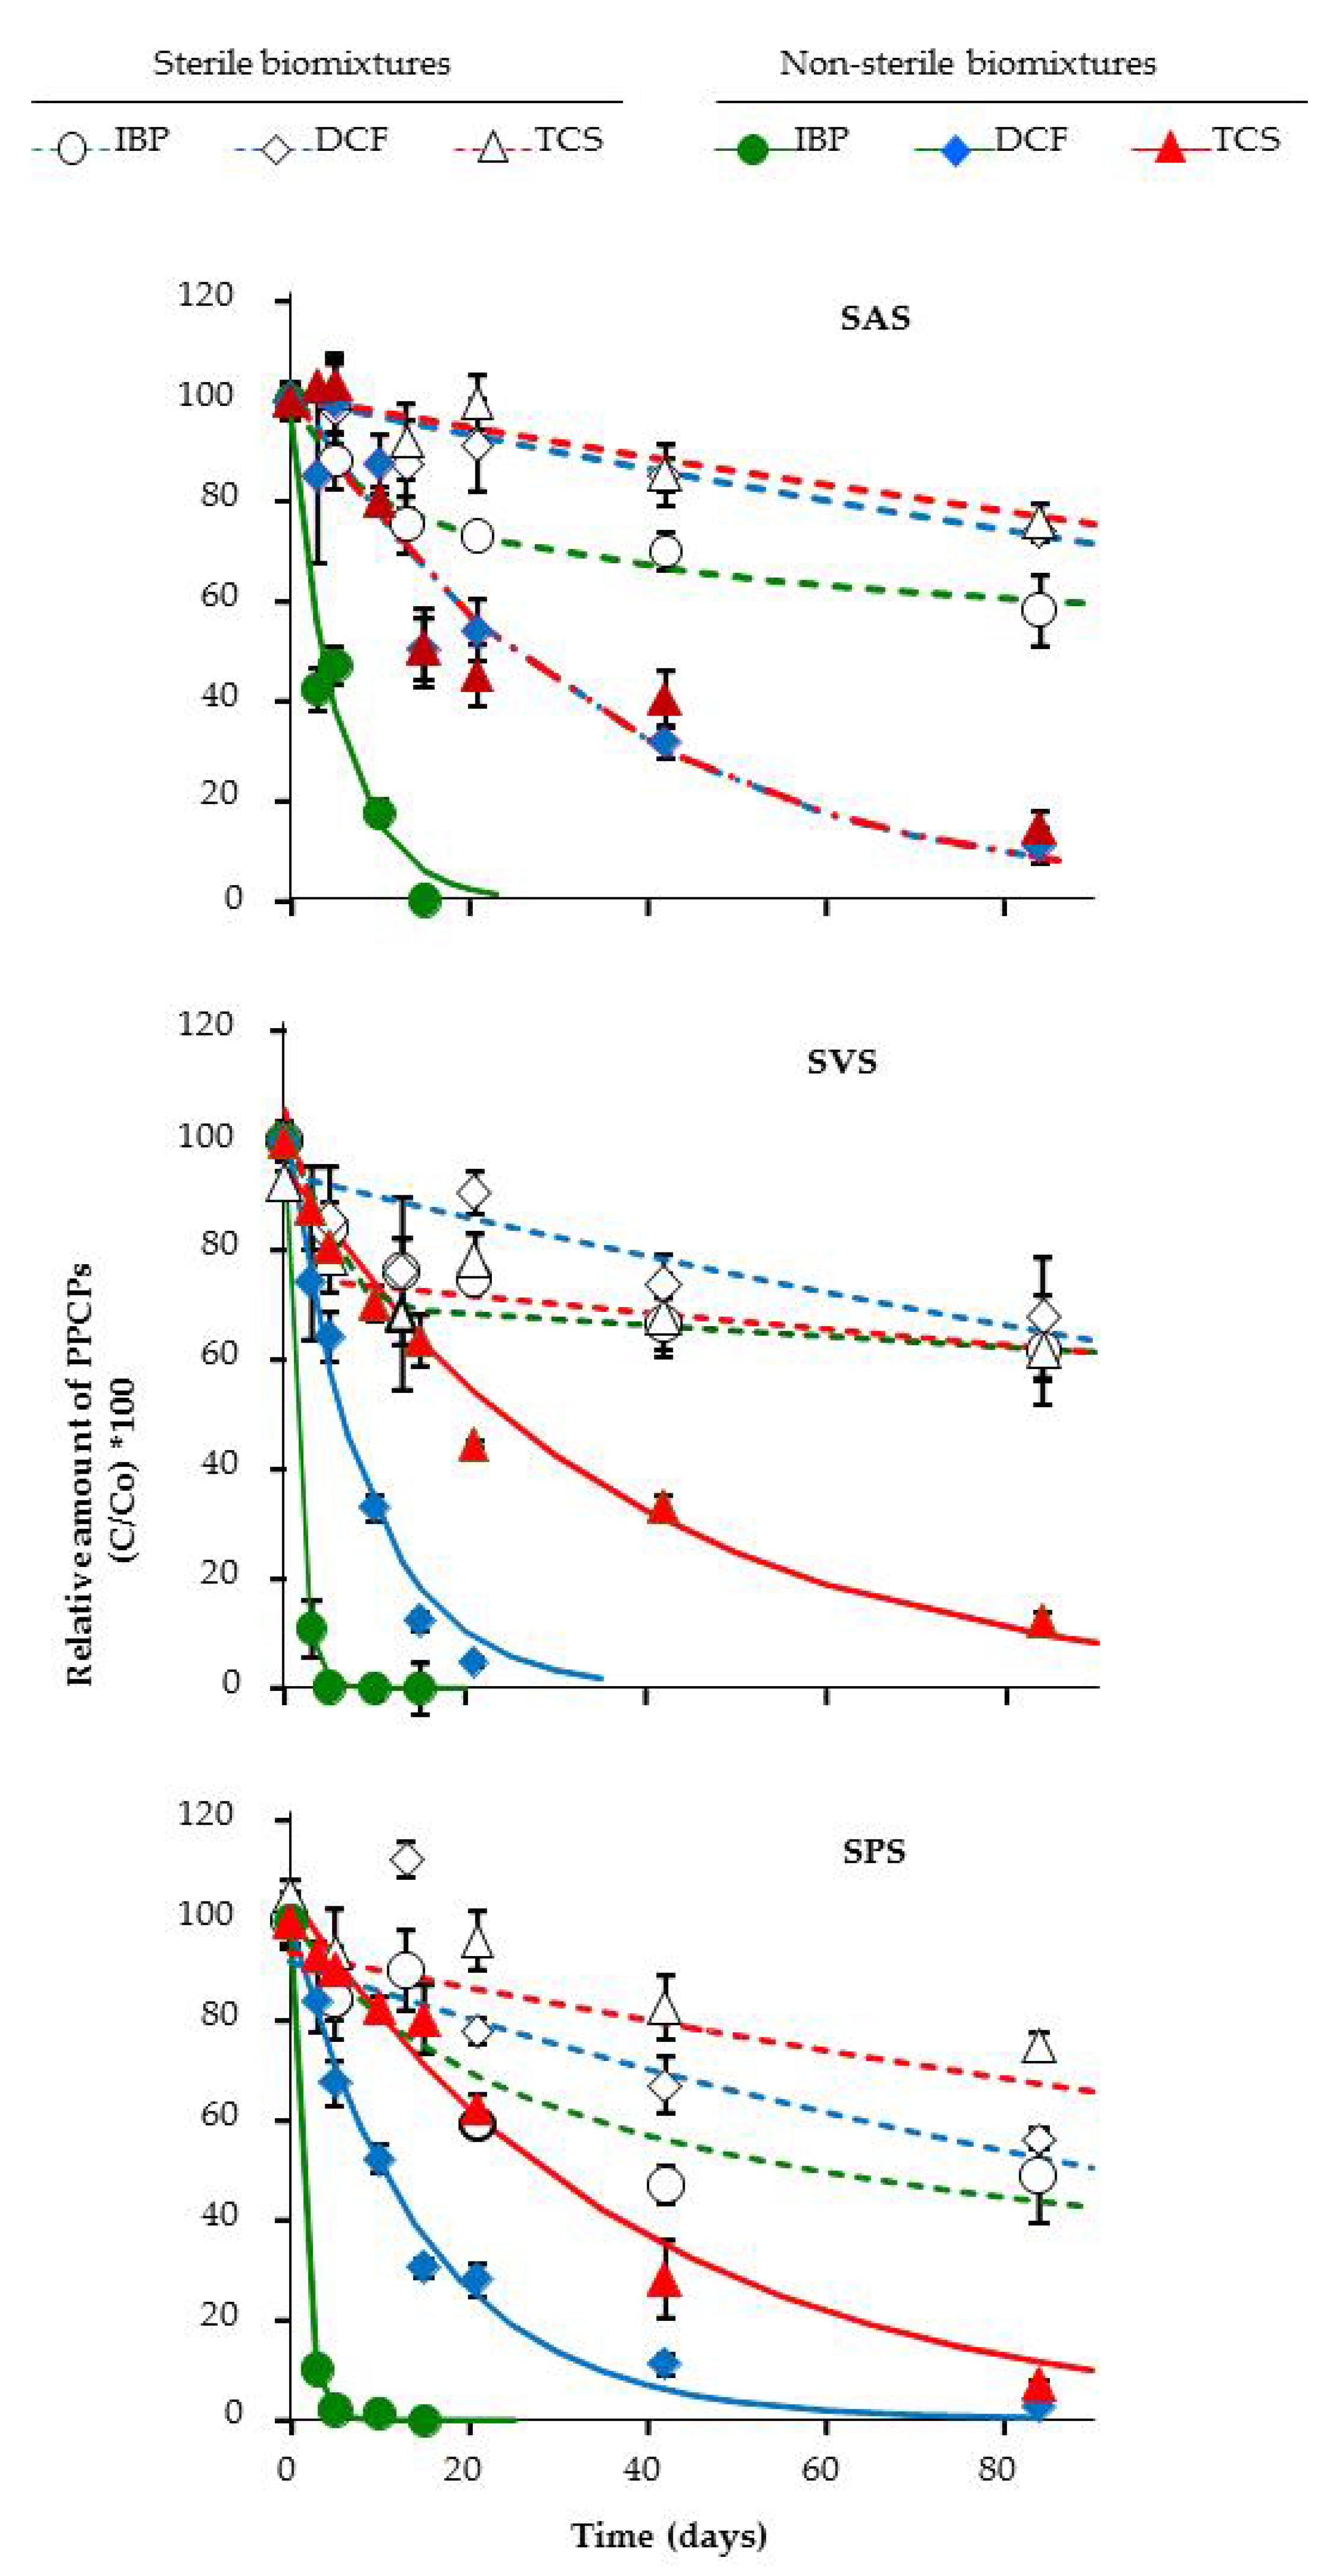
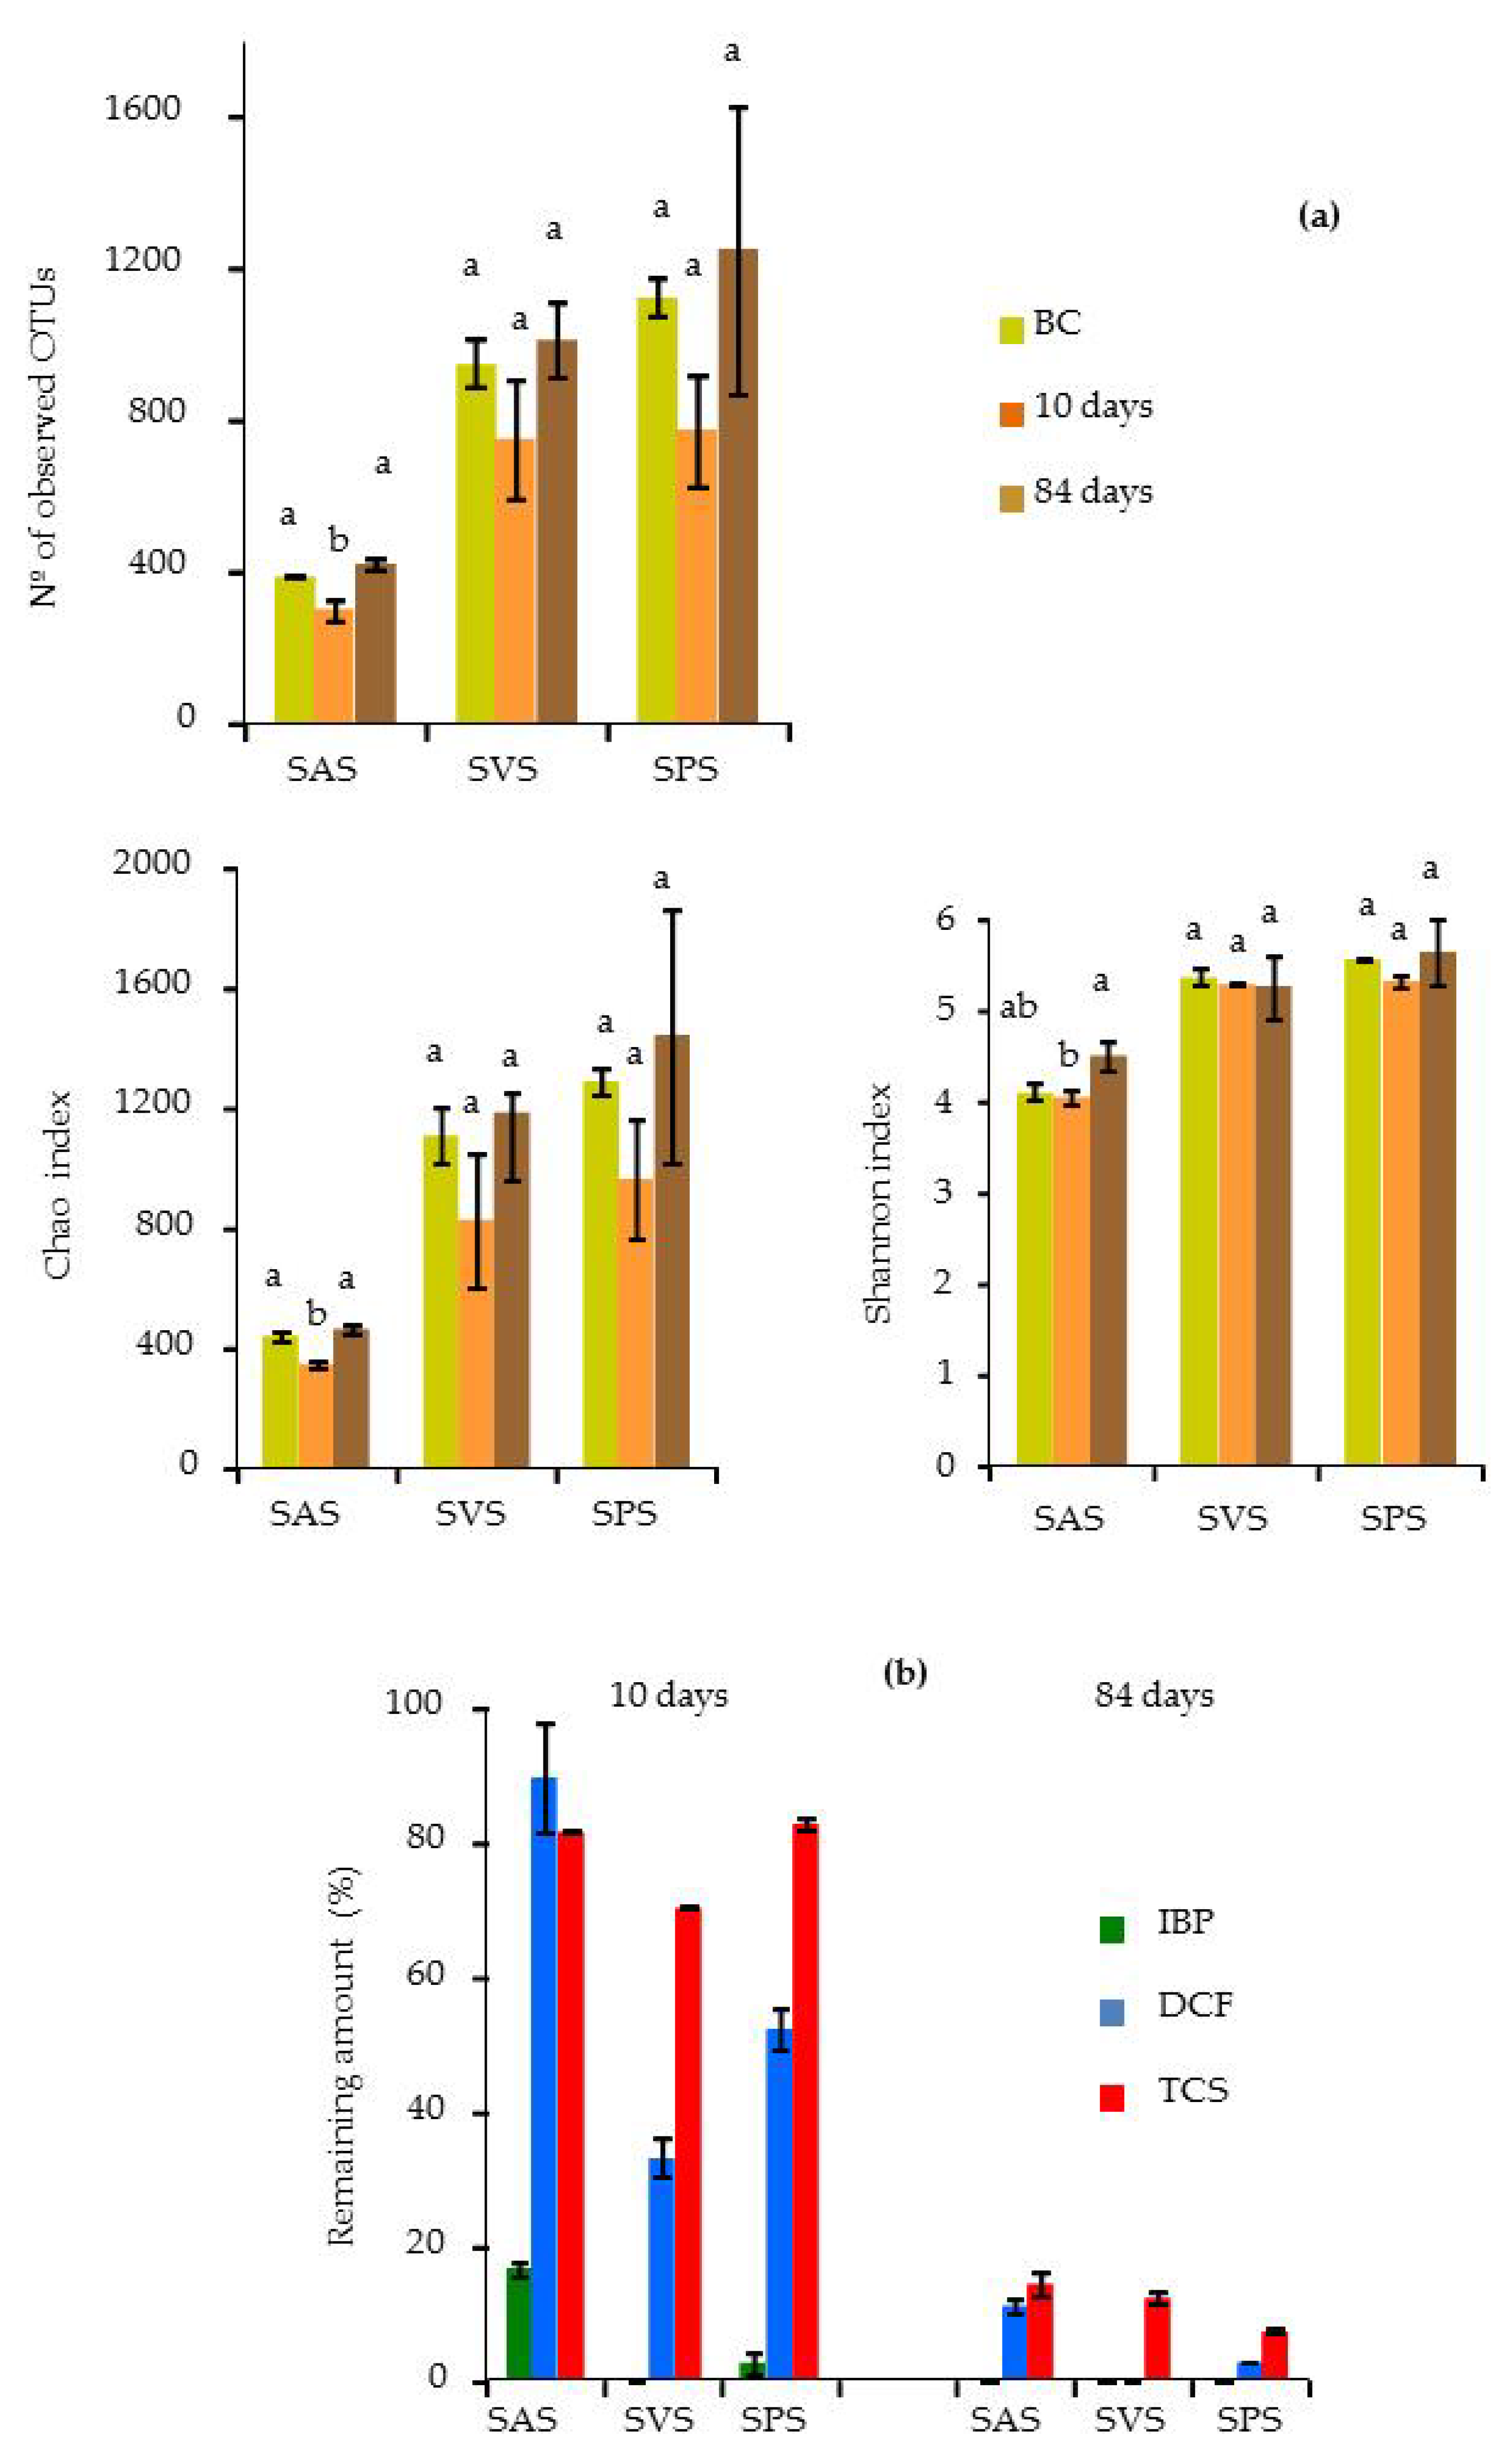
3.3. Dissipation of PPCPs in the Microcosm Biopurification Systems

Experimental kinetic data of the dissipation of PPCPs in the biopurification systems containing non-sterile and sterile biomixtures are shown in Figure 1. In the sterile systems, the determined dissipation with respect to the initial amount of ibuprofen added to SAS, SVS and SPS was 42%, 38%, and 51%, respectively. The amount of diclofenac eliminated was 29%, 32% and 44% and of triclosan 24%, 33% and 29%, respectively. These results revealed that the highest abiotic dissipation corresponded to ibuprofen and especially in the biomixture SPS while the lowest amount corresponded to triclosan, especially in SAS. The abiotic dissipation of the three compounds was similar in SVS. The abiotic elimination of PPCPs can be attributed to incomplete sterilization of the samples [16] because some microorganisms can subsist under sterile conditions [31] or due to photodegradation that can occur during sample processing mediated by reactions catalysed by the clay minerals from the soil [17]. Recently, a new route of abiotic transformation of micropollutants and pharmaceuticals has been described as hydroxylation indirectly mediated by hydroxylamine released by aerobic ammonia oxidizers [32,33].
In the biopurification systems, the exponential single first order (SFO) model described closely the dissipation kinetics of these PPCPs with determination coefficients (R2), in most cases, higher than 0.94 (Table 3). Ibuprofen showed the fastest dissipation in the three biomixtures and after 21 days of incubation, residues of this PPCP were no longer detected. However, its dissipation rate constant (k) varied depending on the biomixture type (Table 3). Thus, at 10 days of incubation 82% of ibuprofen had dissipated in SAS, while in SVS and SPS it had dissipated almost completely (Figure 1). The low persistence of ibuprofen in these systems could be associated, on the one hand, with abiotic dissipation processes and on the other hand with the low adsorption capacities of the biomixtures (Table 2), which contributed to a higher bioavailability of ibuprofen molecules for biodegradation. Iranzo et al. [34] revealed that ibuprofen, in the presence of other pharmaceuticals, added at 1.5 g kg−1 in a sewage sludge composting process with an initial C/N < 24, similar to SVS and SPS biomixtures (Table 1), was completely degraded in 21–25 days, but its dissipation was delayed at higher C/N ratios, as occurred in the biopurification system composed of SAS (Table 1 and Table 2 and Figure 1).
The k values of diclofenac showed significant differences depending on the biomixture. The DT90 values in SVS revealed that 90% of diclofenac had dissipated in 20 days, but in SPS and SAS it required more than 1 and 2.5 months, respectively. At the end of the incubation period (84 days), 89% of diclofenac had dissipated in SAS but it was almost completely dissipated in SVS and SPS (Table 3). In this case, the different dissipation capacity for diclofenac in the biomixtures cannot be associated with their adsorption capacity since Kd values were not significantly different (Table 2). The presence of readily accessible carbon sources, which could serve as an electron donor, may enhance the degradation of this PPCP by cometabolism, as has been described for diclofenac in culture media supplemented with glucose [19,20]. On the contrary, it is also possible that its removal by cometabolism could be inhibited by the presence of some carbon sources, by a preferential consumption of an easily degradable carbon source, or by the transformation products. Furthermore, the presence of phenolic compounds in the olive mill cake [35] could be implicated in the observed general delay in the degradation of PPCPs in SAS and especially of diclofenac.
The dissipation constants k determined for triclosan was the lowest, especially in SPS (Table 3). According to the DT90 values, triclosan was the most persistent, although at the end of the incubation period more than 91% of the initial content had dissipated in all three biopurification systems, similar to diclofenac. However, it is noteworthy that the k values of triclosan were comparable to those of diclofenac in the SAS biomixture, despite their different adsorption coefficients (Table 1 and Table 2). Thus, the sorption data may partially explain its dissipation in the biopurification systems. In soils enriched with sewage sludge, a low effect of high triclosan adsorption on the degradation process was also observed [36]. This suggests that triclosan molecules despite their high hydrophobic character (log Kow = 4.76) predominantly adsorbed on bioaccessible sites [16]. Thus, as was discussed for diclofenac, the removal efficiency determined in SVS and SPS biomixtures for triclosan cannot be explained solely by their ability to adsorb PPCPs.
Within the biotic degradation processes which play an important role in the removal of the assayed PPCPs in biopurification systems, especially for ibuprofen, their removal efficiency must be related to the resilience, resistance and adaptation of the microbial population inhabiting each biomixture. Recently, some groups of degrading bacteria that are affected by the addition of PPCPs have been described in another type of biopurification system, which may explain why PPCP dissipation is slower when applied as mixtures instead of separately [17]. It should also be noted that, in general, in the biopurification systems with the SVS biomixture, PPCPs seem to degrade faster than in the systems with SAS. The favourable role of vermicompost from olive oil wastes, compared to other organic materials, in the decontamination efficiency of biomixtures has also been described for the removal of pesticides applied at high loads in microcosm biopurification systems [25]. However, the differences in the dissipation rate of these compounds may also be related to the bacterial microbial community developed in the different biomixtures, a topic scarcely studied.

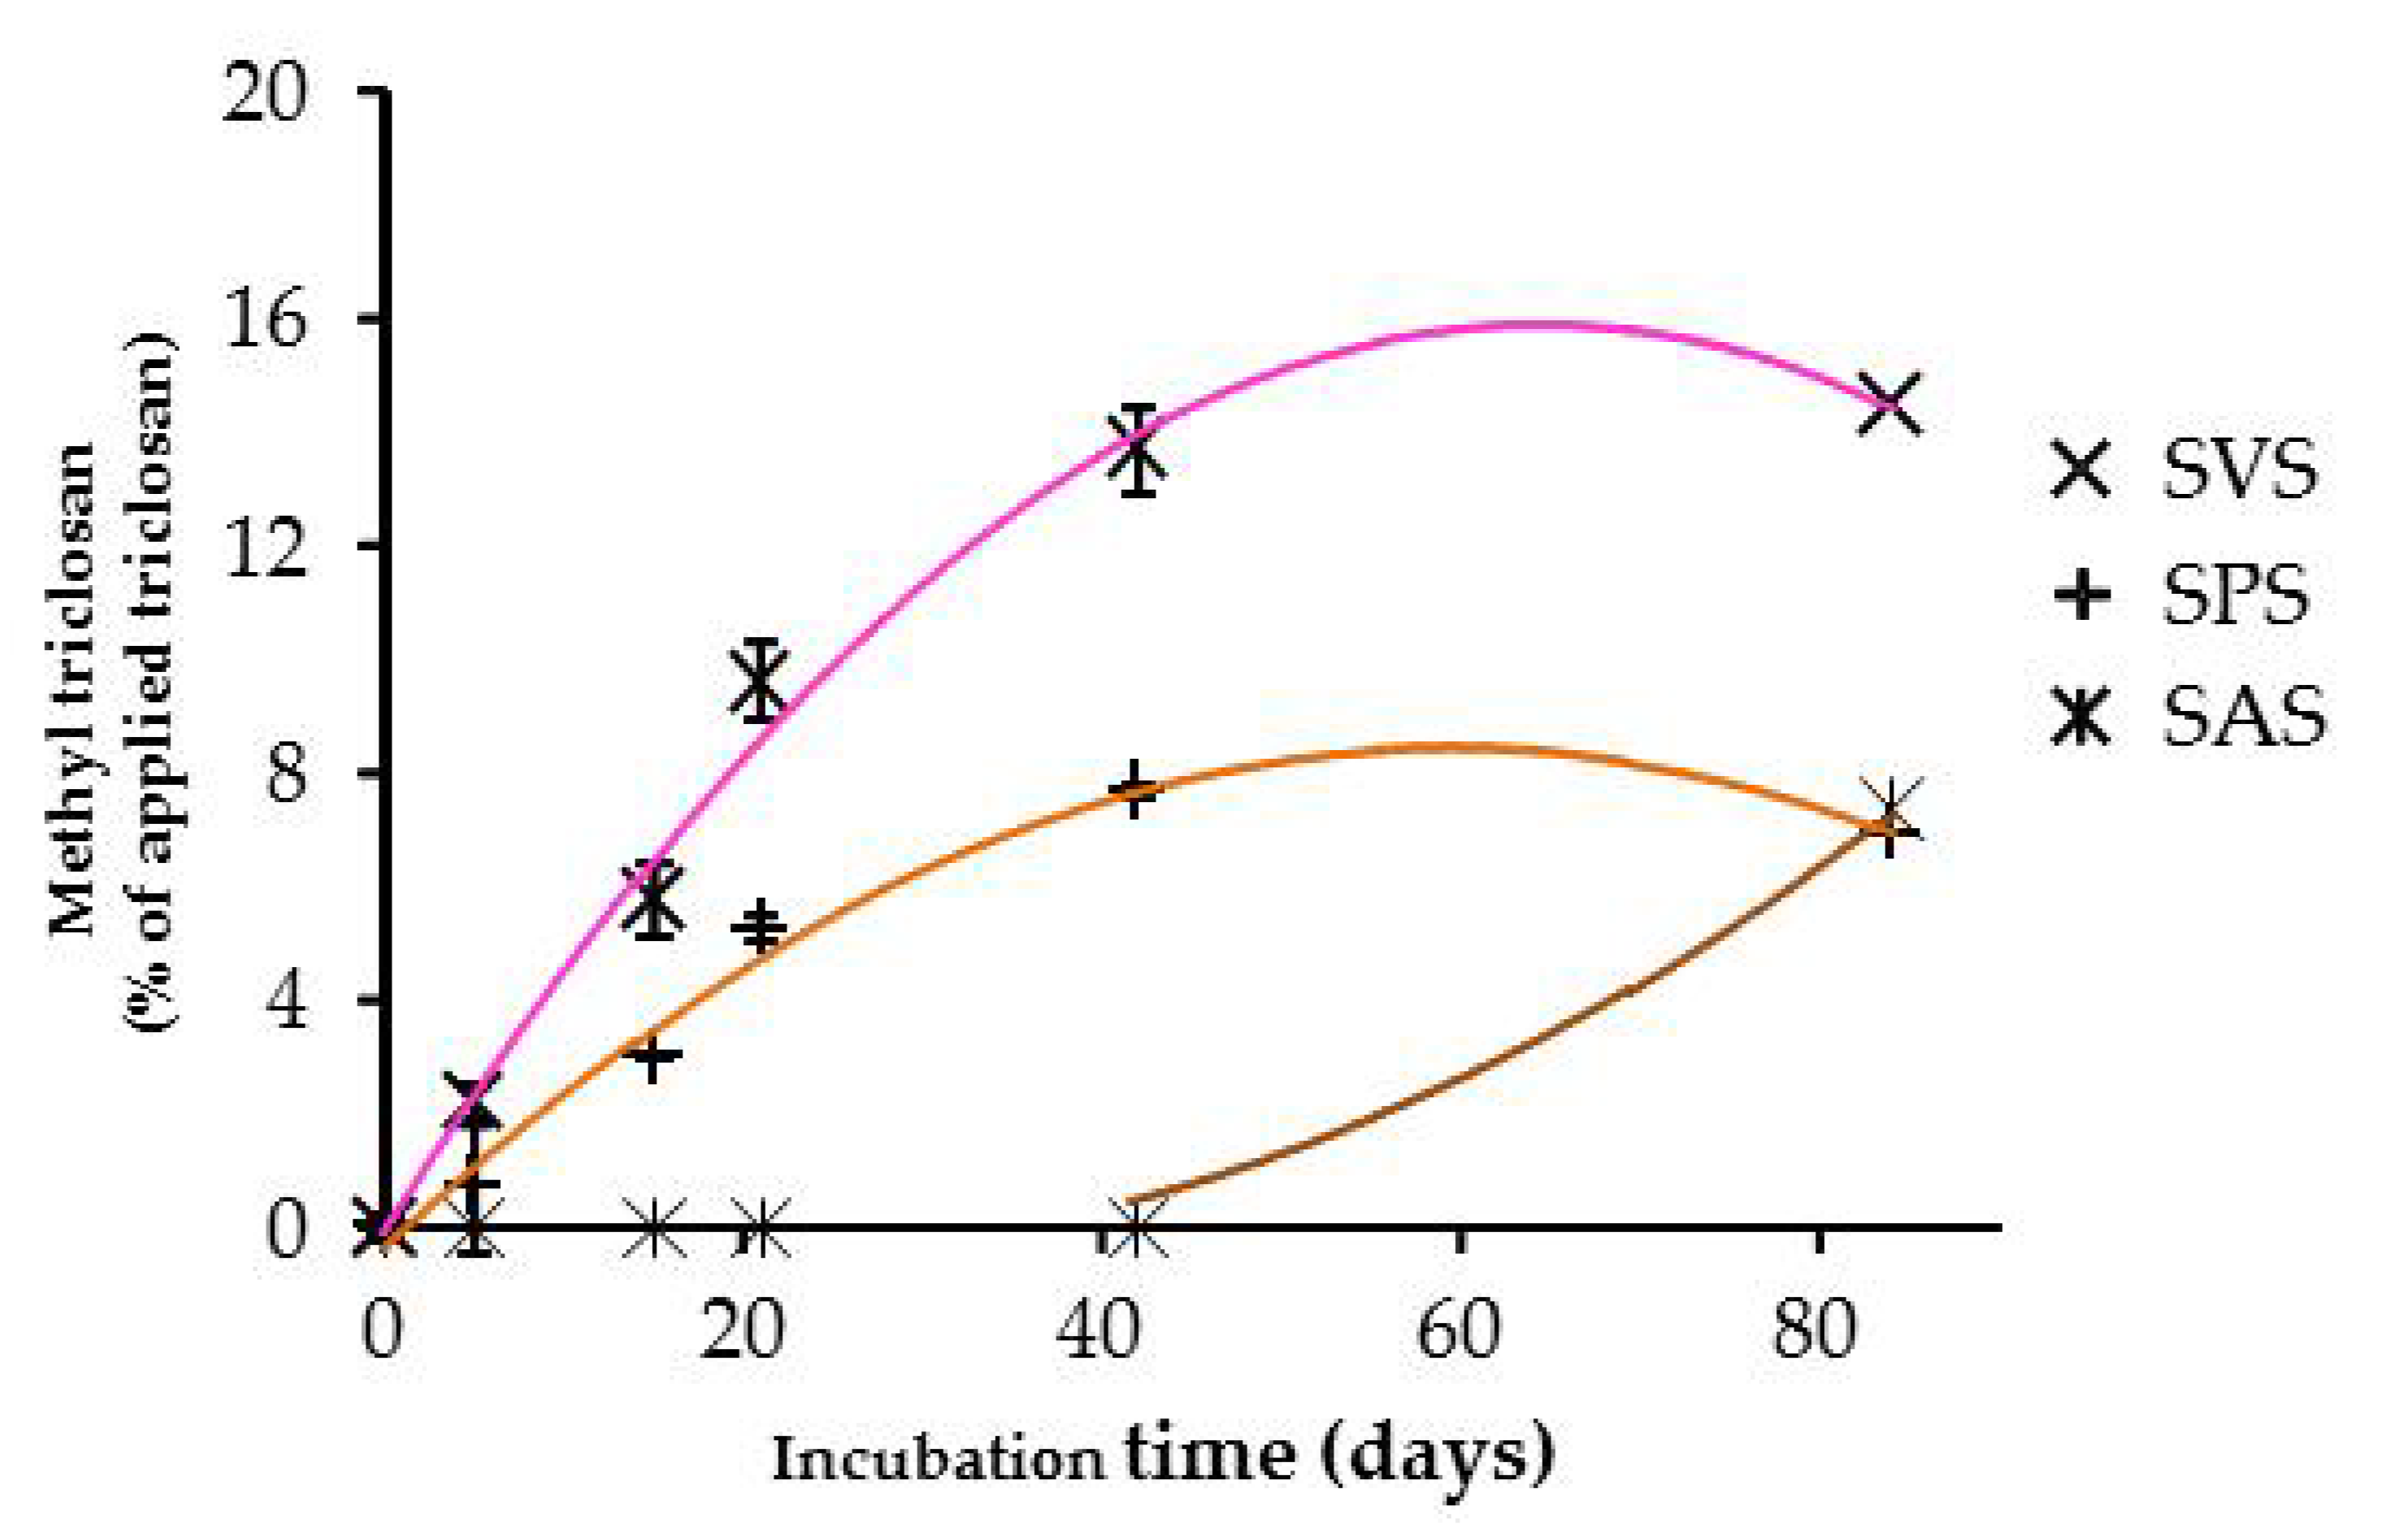
3.4. Degradation Products

The dissipation of triclosan was accompanied by the production methyl-triclosan (M-TCS). This metabolite was only determined in the non-sterile samples (Figure 2). The formation of M-TCS, in contrast to the degradation kinetics of TCS (Figure 1), increased with the incubation time. In the SVS microcosms, the greatest amount of M-TCS (14–15% of the applied triclosan) was reached at 42–84 days with a concentration of 2.5 ± 0.1 µg g−1 at the end of the incubation period. The kinetics of M-TCS formation was significantly slower in samples from the SPS system, with final concentrations about 1.7 times less than those determined in SVS (Figure 2). In the SAS samples, M-TCS was only determined at 84 days (0.6 ± 1 µg g−1) with relatively low values (7% of the applied triclosan), which suggests that microorganisms with triclosan methylation capacity are only active in SAS at the end of the incubation period. M-TCS which is the most persistent metabolite of triclosan [37], is formed by O-methylation, which occurs when a methyl group is attached to the hydroxyl group on the triclosan molecule through replacement of the hydroxyl group with methoxy. M-TCS and its degradation has also been observed under aerobic conditions during wastewater treatment and in soils receiving sewage sludge [14]. This metabolite also denotes a reduction of the biocidal action of triclosan [38] and possibly the growth of some microorganisms in the biomixtures. Consequently, this detoxification mechanism may have partly influenced the dissipation rate of the triclosan in the biomixtures (Table 3). However, the low percentages of M-TCS detected cannot explain the total degradation of triclosan observed in the BPSs, so other degradation pathways must take place. Some information about the hydroxylated, dechlorinated and cyclized products of these PPCPs has been described in previous work for biopurification systems composed of similar types of biomixtures [16].

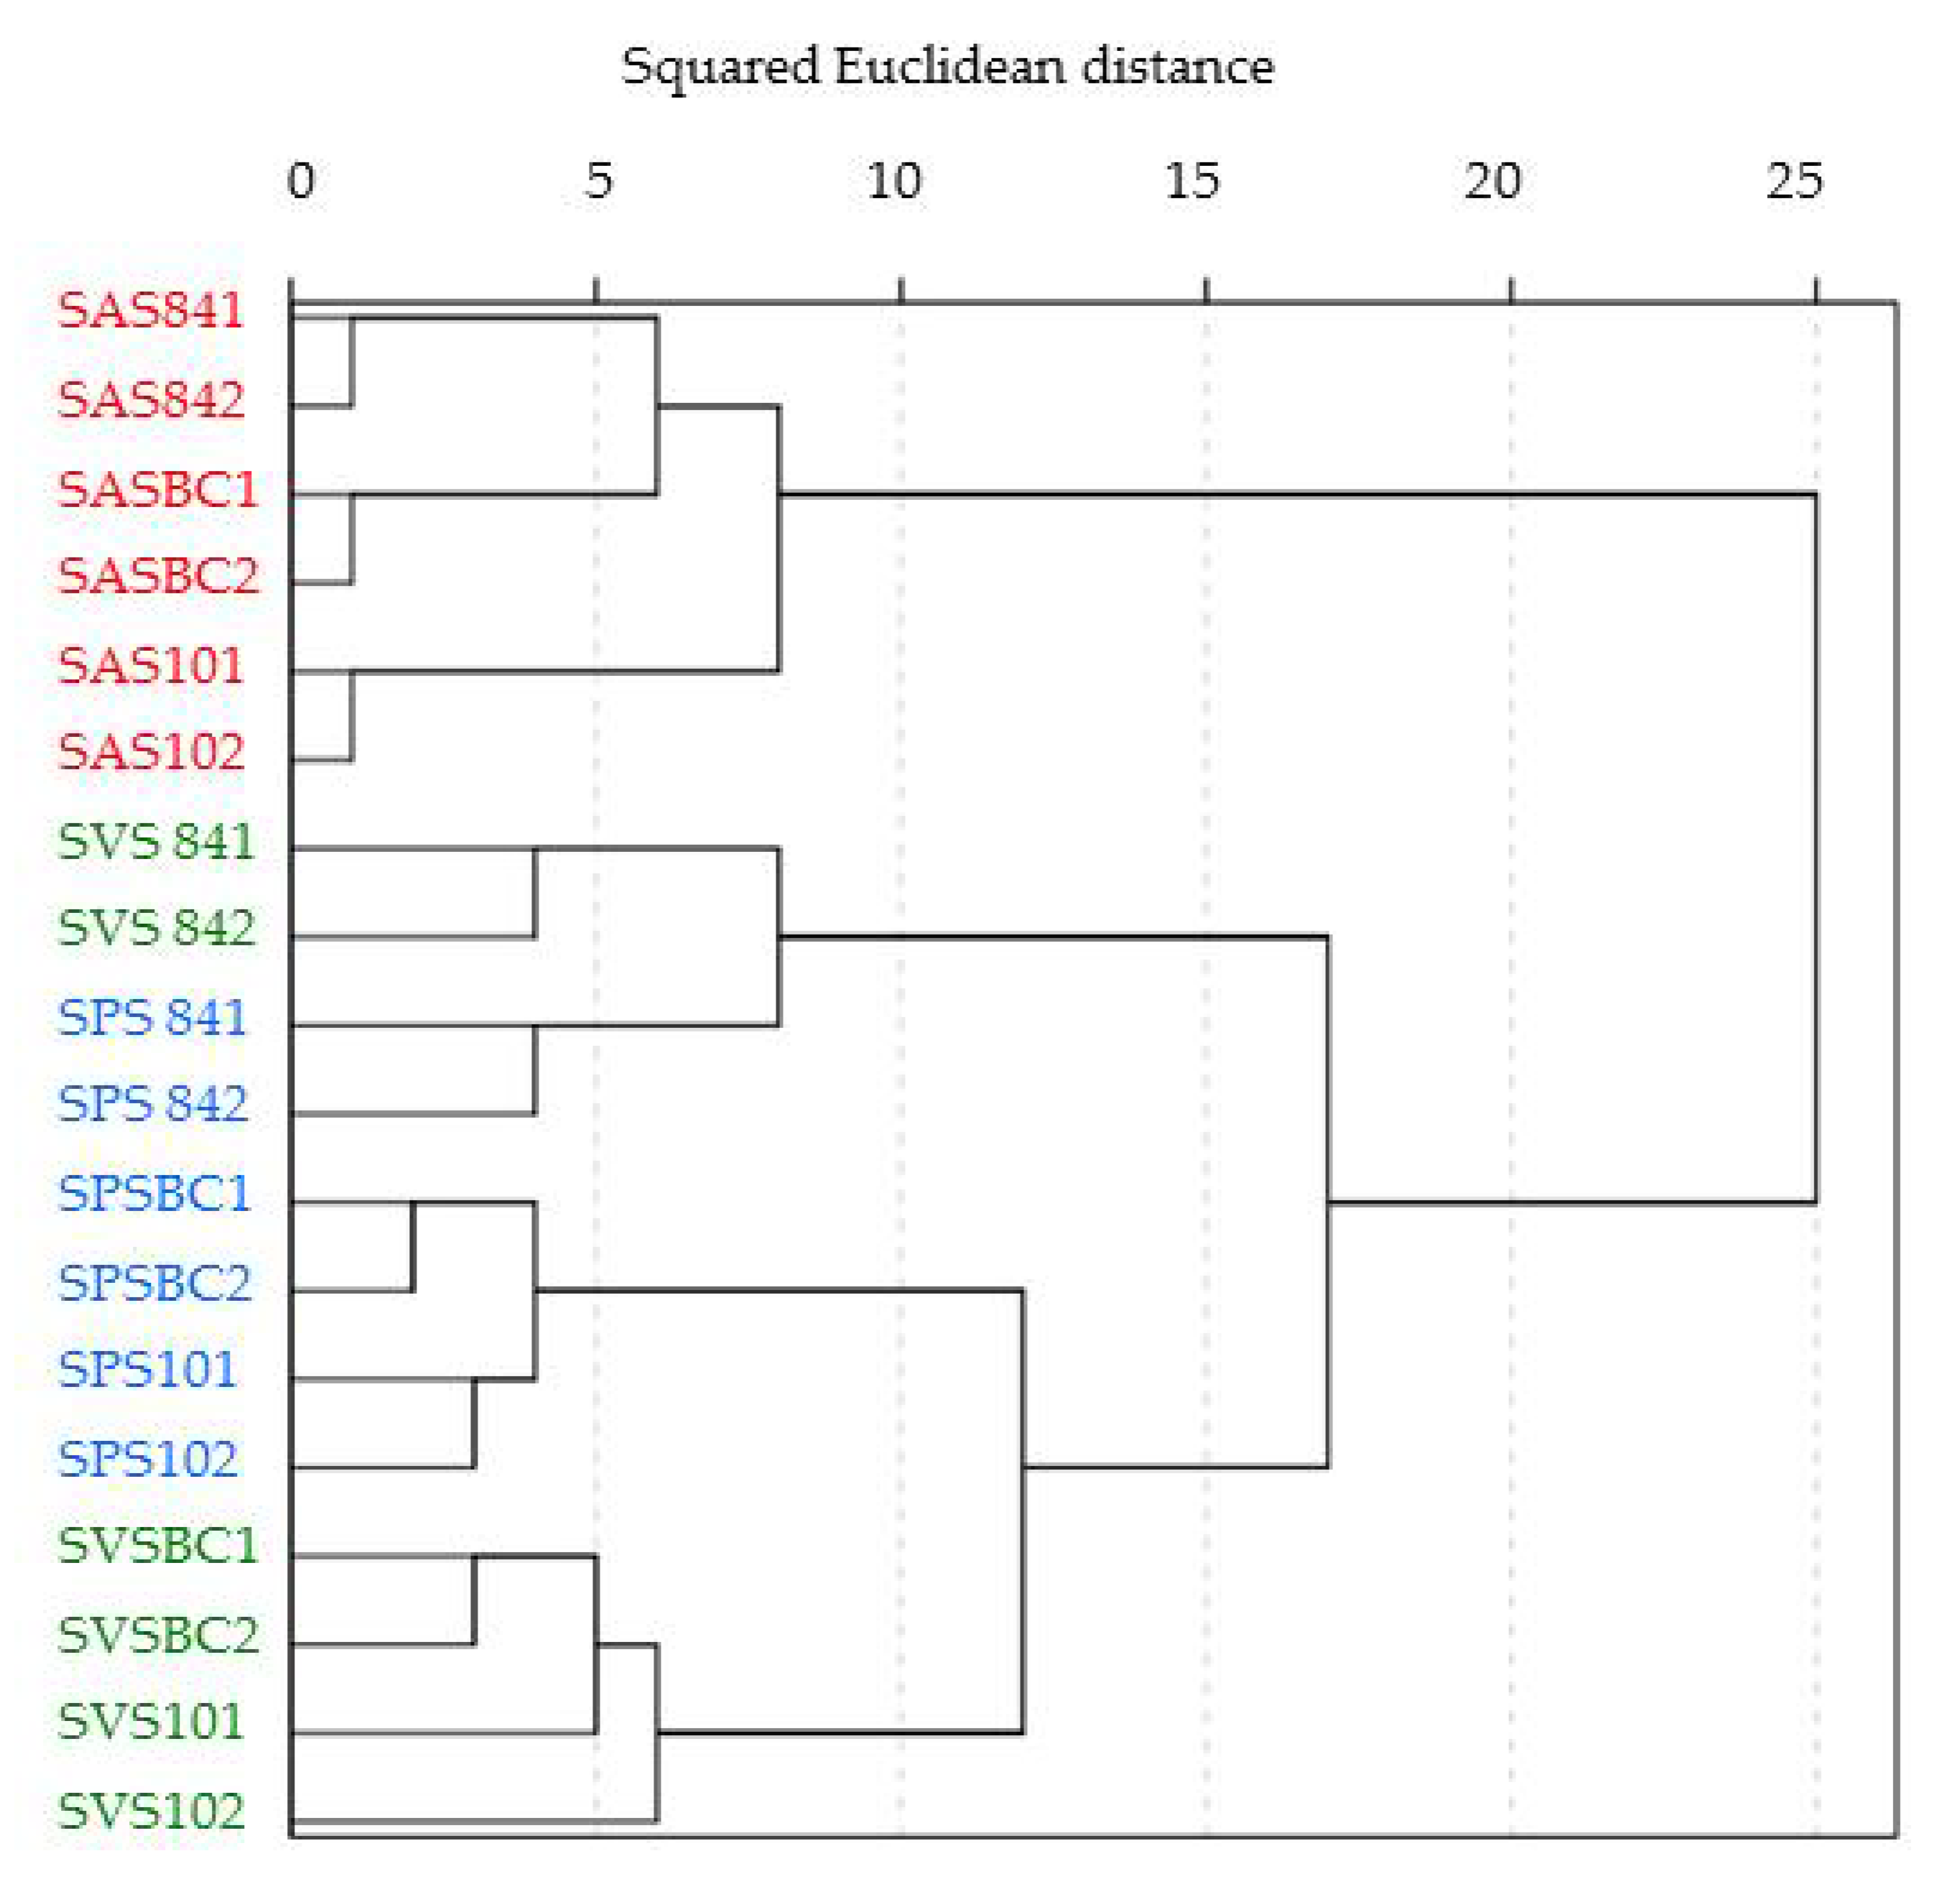
3.5. Bacterial Community Structure and Composition in Microcosm Biopurification Systems

3.5.1. Bacterial Diversity in the Microcosm Biopurification Systems

The total numbers of sequences obtained after quality control and denoising in the biomixtures SAS, SVS and SPS were 111,462, 94,263 and 98,893, respectively. These reads ranged from 7208 to 33,363. The rarefaction curves (Supplementary Figure S2) reveal that the sequencing depth was sufficient to cover the wide diversity within the samples.
The alpha diversity indices of the bacterial communities determined in the three biopurification systems before contamination (BC) and at 10 and 84 days after the addition of the PPCPs is shown in Figure 3a. Before contamination, samples from the SAS biomixture showed a significant lower number of species (number of observed OTUs = 388 ± 4; F = 24.106, p < 0.001), richness (Chao index = 438 ± 19; F = 24.181; p < 0.001) and biodiversity (Shannon index = 4.1 ± 0.1; F = 68.989; p < 0.000) than the SVS and SPS biomixtures. 10 days after the application of the PPCPs, a significant reduction in the number of observed OTUs and richness (Chao index) of OTUs was observed in the SAS biomixture, but at 84 days all the indices had recovered (Figure 3a). The same tendency was observed for the SVS and SPS biomixtures, although no significant differences were found 10 days after the addition of PPCPs, which may be due to the variability of the measurements. The reduction in the number of OTUs and Chao index at 10 days could be explained by the toxic effects caused by the addition of the PPCPs which, especially in SAS, still contain high levels of diclofenac and triclosan (Figure 3b). Oh et al. [39] reported that triclosan applied at subinhibitory levels to activated sludge as an environmental stressor produced a dramatic reduction in the number of OTUs and in the alpha diversity by 20–30% with respect to the control. The relatively low alpha diversity indices in the SAS biomixture may be due to the composition of this biomixture. Gongora-Echevarria et al. [22] described that the composition of biomixtures has a significant influence on their diversity and richness of microorganisms. The SAS biomixture included wet olive cake, a waste that contains antimicrobial phenolic compounds, which may be responsible for the lower alpha diversity values determined in SAS. The higher bacterial diversity in SVS than in SAS could also be related to the depletion of phenolic compounds, due to the activity of dioxygenase enzymes during the vermicomposting process of wet olive cake [31,40]. Furthermore, the activity of the earthworms during the vermicomposting process of the wet olive cake may stimulate microbial activity and increase their numbers [41].
The Shannon diversity indexes showed values greater than 4 which would imply that the three biopurification systems had high biodiversity. At 10 and 84 days after the addition of PPCPs, no significant changes in Shannon’s indexes were observed in the SVS and SPS biomixtures but a significant increase was observed in the SAS biomixture. Jiang et al. [42] reported that addition of ibuprofen, diclofenac and naproxen, at environmental concentrations, increased the Shannon diversity index in an activated sludge. However, our results suggest that the addition of the selected PPCPs resulted in minimal changes in the presence or absence of bacterial groups, but it is expected to affect their relative abundance according to Holmsgaard et al. [21]. In a previous study, where olive pruning was used instead of barley straw in a BPS, and where these PPCPs were added separately or simultaneously at levels similar to those used in this study, it was observed that the PPCPs differentially affected the composition and relative abundance of bacterial taxa but when these PPCPs were applied together, the adverse effect of triclosan on the bacterial community was offset by the increase in richness and bacterial biodiversity caused by diclofenac and ibuprofen [17]. Consequently, the observed fluctuations in the alpha diversity indices and in the number of OTUs with the incubation times in these BPS could be related to the synergic or antagonists effects of the PPCPs on the bacteria which can partly explain the recovery of the biodiversity in the BPSs. However, the type of biomixture should also be considered as well as the presence of bacteria with metabolic capacities to degrade ibuprofen, diclofenac or triclosan which can facilitate the recovery and development of the entire bacterial community in the biopurification system.

3.5.2. Distribution of Bacterial Phyla in Biomixtures from Microcosm Biopurification Systems

The relative abundance of bacterial phyla in the SAS, SVS and SPS biomixtures before contamination (BC) and at 10 and 84 days after the addition of the PPCPs is shown in Table 4. In all uncontaminated biomixtures, Proteobacteria was the dominant bacterial phyla followed by Actinobacteria and Bacteroidetes, whereas Cloroflexi, Firmicutes, Planctomycetes, Verrucomicrobia and Acidobacteria were less abundant. Analysis of variance of all the bacterial phyla revealed significant differences between the three biomixtures (F > 5.358, p < 0.018). These differences may be due, in part, to the different initial bacterial community structure of each biomixture. Thus, before contamination (BC), in the SAS biomixture, the sum of the relative abundance of Proteobacteria, Actinobacteria and Bacteroidetes reached 92% ± 2%. However, in SVS and SPS the relative abundance of these phyla was much lower (61% ± 2% and 65% ± 4%, respectively). In contrast, the sum of the relative abundances of Crenarchaeota (Archaea), Acidobacteria, Chloroflexi, Firmicutes, and Planctomycetes in SAS accounted for a total abundance of 3.19%, which was much lower than in SVS (19.36%) and SPS (16.47%) biomixtures (Supplementary Figure S3). Hierarchical cluster analysis of the bacterial community structure in the biomixtures before contamination (BC) revealed that SVS and SPS shared a more similar bacteria community composition than that of SAS (Figure 4). This association is in agreement with the relatively higher number of OTUs and Chao and Shannon indexes recorded for SVS and SPS biomixtures (Figure 3a). However, this relationship disagrees with the grouping obtained according to their physico-chemical properties (Supplementary Figure S1). These could be attributed as was discussed above to the relatively lower number of species determined in SAS may be due to presence of phenolic compounds which are abundant in the raw wet olive cake. The PCoA confirmed that the bacterial community structure is mainly determined by the composition of the biomixture (Figure S4).

3.5.3. Impact of PPCP Application on Bacterial Phyla Composition of Biomixtures from Microcosm Biopurification Systems

In the samples from the SAS microcosms, a significant increase in the relative abundance of Proteobacteria and Verrucomicrobia populations of 38% and 97%, respectively, was observed at 10 days after the application of PPCPs, as compared to the uncontaminated system (Table 4). In contrast, the relative abundance of Actinobacteria and Firmicutes significantly decreased by 49% for both phyla. At 84 days, Proteobacteria decreased significantly, while the relative abundance of the other bacterial phyla increased and significantly so as in the case of Chloroflexi.
In the SVS microcosms, the relative abundance of most of the bacterial phyla remained almost constant at 10 days after the application of PPCPs, except Bacteroidetes and Verrucomicrobia, which significantly increased by 15% and 57%, respectively, with respect to the uncontaminated system (Table 4). At 84 days, the archaea (Crenarchaeota), Chloroflexi and Planctomycetes increased significantly by 262%, 94% and 35%, respectively, with respect to the uncontaminated biomixture. However, the relative abundances of Bacteroidetes and Verrucomicrobia decreased significantly, whereas a less noticeable decline of Proteobacteria was recorded. The trend for Firmicutes was to increase at 10 and 84 days, although these increases were not significant.
In the samples from the SPS microcosms, no significant increases in relative abundances of any bacterial phylum were observed at 10 days after the application of PPCPs, as compared with the uncontaminated biomixture (Table 4). At 84 days, the changes in the relative abundances of each of the bacterial phyla were, with some exceptions, similar to those recorded in the SVS system.
As indicated in Section 3.2, most of the ibuprofen had dissipated at 10 days after PPCP addition, and only in the SAS biomixture could ibuprofen residues (3.4 µg g−1) be detected (Figure 3b). On the contrary, diclofenac and triclosan were partially dissipated, and therefore, significant amounts of residues of both PPCPs were determined, especially in the SAS biomixture. The increases of relative abundance of some bacterial phyla such as Proteobacteria in SAS, Verrumicrobia in SAS and SVS and Firmicutes in SVS and SPS as recorded at 10 days, could be related to the ability of members of these phyla to degrade ibuprofen and/or to resist high concentrations of diclofenac and triclosan. In a previous study, with biopurification systems composed of a soil-based biomixture with vermicompost and olive pruning instead of barley straw, ibuprofen caused only slight changes in Proteobacteria [17]. In sediments under aerobic conditions, the relative abundance of Proteobacteria tended to increase in the presence of ibuprofen [43], as was the case of the SAS biomixture. In agricultural soils, the enrichment of Proteobacteria was also related to diclofenac degradation [44]. However, in our study, the increase in Proteobacteria abundance in SAS did not correspond with a high rate of DCF degradation since only less than 20% of the added DCF had been removed, while in SVS and SPS the residual amount of DCF was <50% (Figure 3b). In addition, it is also possible that the co-application with triclosan could affect the bacterial population implicated in the dissipation of diclofenac as was observed by Aguilar-Romero et al. [17]. On the contrary, a significant detrimental effect was observed at 10 days after PPCP addition in the relative abundance of Actinobacteria and Firmicutes in the SAS biomixture. A decline in the Firmicutes population was previously observed in a river biofilm community exposed to ibuprofen [45]. Bacteria belonging to Firmicutes are known carriers of drug-resistant genes, which serve a vital function in the treatment of sewage containing antibiotics [42,46]. This characteristic and the relatively higher initial abundance of Firmicutes in SVS and SPS, which also increase along the incubation time, may partly explain the faster biodegradation of the PPCPs in these biomixtures with respect to the SAS biomixture.
At 84 days after PPCP addition, only residual amounts of diclofenac and triclosan were detected in the biomixtures, with the highest concentrations being found in the SAS biomixture (around 2.8 µg g−1) (Figure 3b). In a previous bioremediation study, ibuprofen, diclofenac and triclosan applied separately or simultaneously produced a detrimental effect on Bacteroidetes [17]. This detrimental effect was also observed in our study, in which Bacteroidetes abundance was significantly reduced by about 50% in the SVS and SPS biomixtures. However, in the SAS biomixture, the Bacteroidetes population remained almost unchangeable along the incubation time, which suggests a strong influence of other factors, such as the nutrients or carbon sources contained in that biomixture, which would mitigate the adverse effect of PPCPs on this bacterial phylum. Bacteroidetes and many members of Actinobacteria and Proteobacteria are copiotrophic organisms that thrive in environments rich in nutrients and available carbon sources and are involved in the degradation of complex organic materials such as lignin, cellulose and hemicellulose [31,42,47] On the other hand, it was observed that the response of Chloroflexi over the incubation time followed a similar pattern in the three biomixtures (Table 4). The Chloroflexi population at 10 days was resilient to the addition of PPCPs and its proliferation at 84 days reached levels of 10, 2 and 3 times its original abundance in SAS, SVS and SPS, respectively (Table 4). Chloroflexi has traditionally been associated with extreme habitats and is one of the most dominant phyla found in sediments and wetland soils exposed to PPCPs [48,49]. A gradual increment of Chloroflexi and Firmicutes was also observed in bioreactors incubated for 130 days with activated sludge, after the addition of a mixture of pharmaceuticals including ibuprofen and diclofenac [42]. The increase in relative abundance observed could be associated with a possible adaptation of both phyla when contaminants were kept below inhibition levels. Besides, some members of Chloroflexi are obligate organohalide respirers that can use a diverse array of halogenated chemicals, including mixtures of organochloride compounds [50,51]. This may be due to Chloroflexi being more resistant than other bacteria to the biocidal action of triclosan. In fact, triclosan induces an enrichment of Dehalococcoides-type Chloroflexi in anaerobic soils at relevant concentrations [52]. Therefore, the existence of heterogeneous environments in the biomixtures could facilitate the dehalogenation of the PPCPs by Chloroflexi.
In general, our results showed a recovery of the abundance of most of the bacterial phyla in the three biopurification systems at 84 days after addition of PPCPs. Tortella et al. [53] observed in a microcosms biopurification system that repeated addition of atrazine at high concentrations on the microbial community, had a temporary negative effect, since the community recovered after a period of time. This recovery was also suggested by the hierarchical clustering, where the SAS biomixture, uncontaminated (SASBC) or at 84 days after contamination (SAS84) appeared to group together (Figure 4). This could only be possible if the PCPPs’ toxicity does not hamper microbial activity [54] or, as was suggested by Butler et al. [55], in triclosan treated-soil an acclimatization of the microbial population occurs after the addition of PPCPs. In contrast, the SVS and SPS biomixtures at 84 days appear to cluster together but not with the samples collected before contamination or at 10 days, suggesting a slower recovery than in the SAS biomixture. This clustering could also suggest the existence of a succession, which probably led to the displacement of some microbial group by the addition of PPCPs, as well as to the formation of microbial communities resistant to (or capable of degrading) PPCPs.

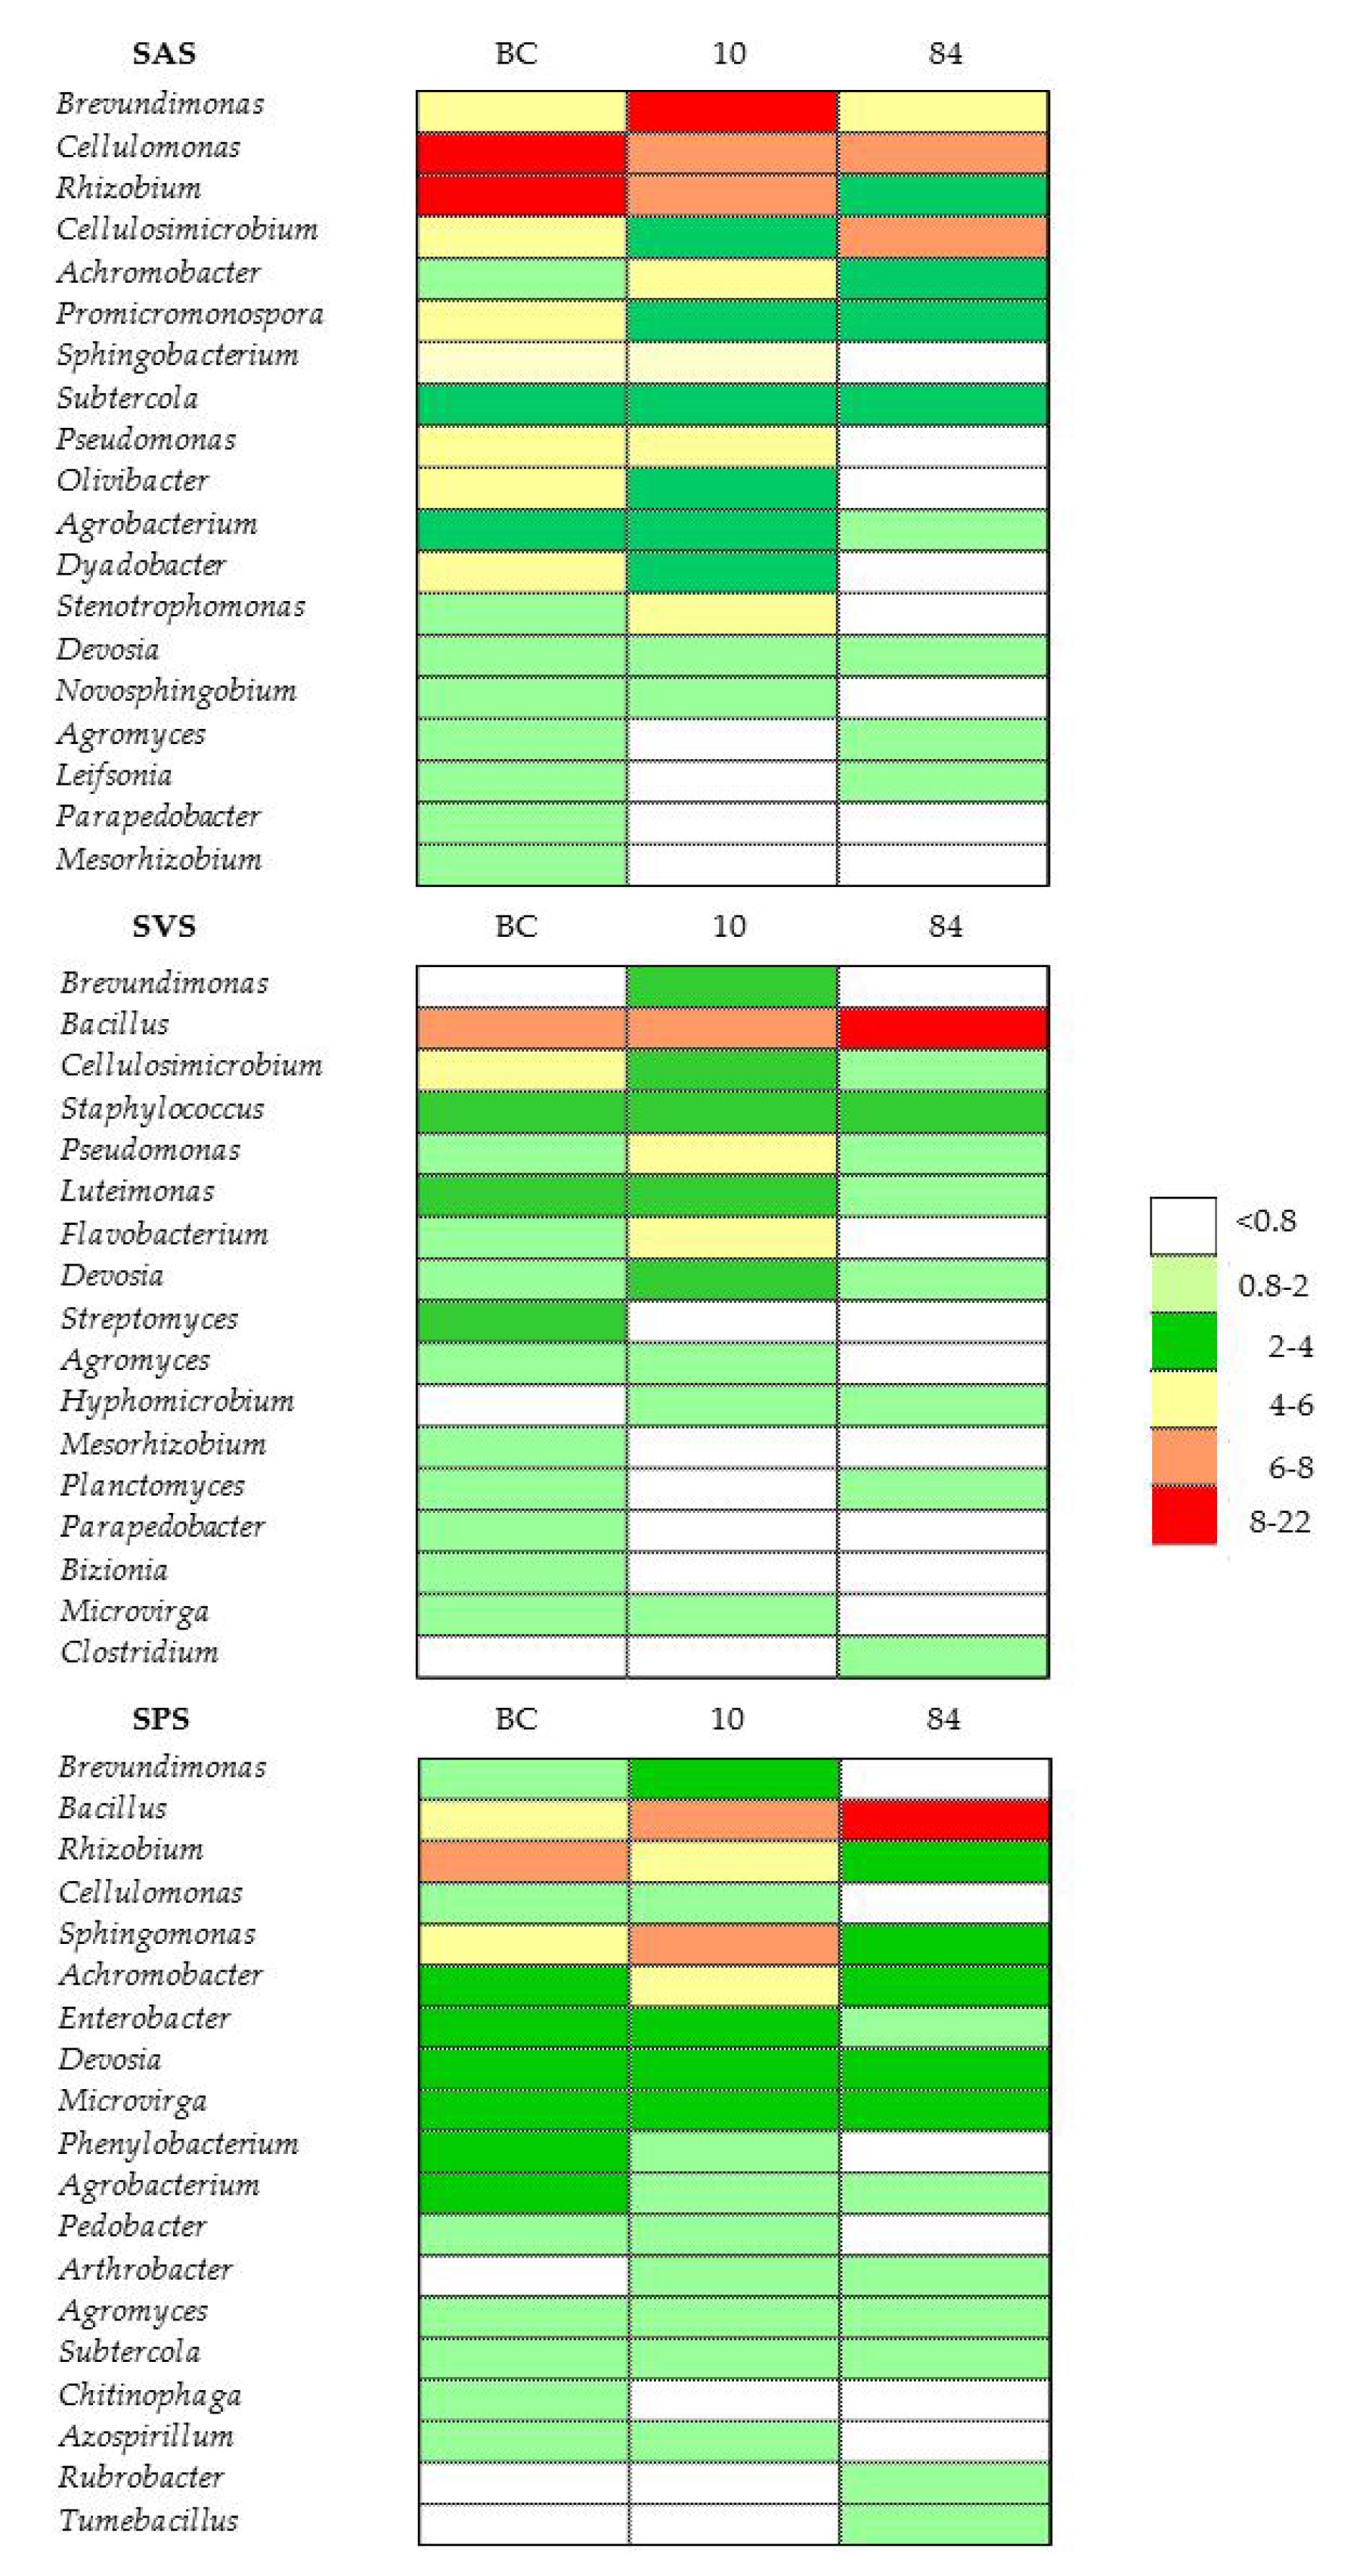
3.5.4. Bacterial Classes and Genera in Microcosm Biopurification Systems

The dissimilarity observed in the Proteobacteria phylum and in other phyla between the biomixtures after addition of PPCPs can also be explained by the shifts in the relative abundance observed at the class level. At 10 days, the Alpha- and especially Betaproteobacteria increased significantly in the SAS biomixture. However, the Betaproteobacteria showed only a slight increment in the SVS and SPS biomixtures (Table 4). The class Sphingobacteriia (phylum Bacteroidetes), which showed significant and similar changes in the three biomixtures appears to be resistant to the addition of PPCPs, decreasing significantly after 84 days when the concentration of PPCPs had diminished (Supplementary Figure S5). Anaerolineae and Caldilineae, which belong to the phylum Chloroflexi, showed similar abundances in SVS and SPS, increasing at 84 days (Supplementary Figure S5). The elimination of ibuprofen, diclofenac and triclosan in different media has been related to Proteobacteria (Alpha-, Beta- and Gamma classes) which are often sensitive to process conditions and variations. The differences in the dominance of some Proteobacteria classes in bioremediation studies have also been related to the concentration levels of the contaminants [54]. Beta- and Gamma-proteobacteria and Sphingobacteriia increased in constructed wetland exposed to triclosan [56]. Guo et al. [57] observed, in aerobic water sediment systems, in a weak alkaline environment (pH 8–9), that Alphaproteobacteria might be resistant to triclosan or even capable of triclosan biodegradation. Martin et al. [58] indicated that the detrimental effect of triclosan was more apparent on the abundance of OTUs associated with Alphaproteobacteria. Lawrence et al. [45] observed that ibuprofen exposure at 10 g L−1 enhanced the relative abundance of Betaproteobacteria populations in a riverine biofilm community, indicating that these microorganisms belonging to this class may play a role in the elimination of this PPCP.
Univariate analysis of the relative abundance of OTUs (at the genus level) with incubation time revealed significant differences in the abundance of some bacterial genera (Figure 5). At 10 days after PPCP application, the population of Achromobacter and Stenotrophomonas increased significantly (p < 0.001) by 3 and 4 times in the SAS biomixture compared to the uncontaminated biomixture. In SVS, the genera Flavobacterium and Devosia increased significantly (p < 0.049) by 4.7 and 1.8 times. The Pseudomonas genus (Gammaproteobacteria class) also increased by 4 times, which can mainly be attributed to the specie P. stutzeri which showed a marked increase of 2.8 times at 10 days. P. stutzeri strains which showed elevated tolerance to triclosan have been isolated from industrial sources and their tolerance was associated with their methylation capability [38,59]. On the other hand, a P. stutzeri OTU was identified as a biomarker for ibuprofen-treated biomixture [17]. In the SPS biomixture, Sphingomonas (Alphaproteobacteria class) increased significantly (p < 0.028) by 19% with respect to its original population in the uncontaminated biomixture. Sphingomonas strains have been described which degrade ibuprofen [60,61] and a Sphingomonas OTU was also identified as a biomarker for ibuprofen-treated biomixture [17]. These results confirm that different bacterial genera may have developed in each biopurification system to remove PPCPs. However, there are also genera which show similar tendencies in the different biomixtures, for instance, Bacillus which increased along the time in both SVS and SPS microcosms. Many Bacillus strains have been reported to degrade or transform a wide range of compounds including 4-chloro-2-nitrophenol, insecticides, pesticides, herbicides, explosives, drugs, polycyclic aromatic compounds, heavy metals, azo dyes and aromatic acids [62]. Moreover, the hydroxylation of ibuprofen into 2-hydroxyibuprofen by aliphatic monooxygenase has been attributed to the species of B. thuringiensis B1 [63]. The relative abundance of Brevundimonas (Alphaproteobacteria class) also increased in SAS, SVS and SPS at 10 days, by 3.6, 15.2 and 1.9 times respectively compared to the uncontaminated biomixtures. These data support that Brevundimonas may have a specific response to the PPCPs. Bacterial strains Brevundimonas sp., Achromobacter sp. and Bacillus sp. were previously isolated from a vermicompost-based olive cake biomixture and identified as potential degraders of recalcitrant pesticides such as oxyfluorfen which has a diphenyl ether structure and a log Kow value (4.73) similar to triclosan [24]. Moreover, the genera Brevundimonas and Pseudomonas have been associated with the biodegradation of pharmaceuticals (diclofenac), antibiotics and aromatic hydrocarbons [34,64,65]. Furthermore, the strain Brevundimonas naejangsanensis was reported to be able to use ibuprofen and other pharmaceuticals at high concentrations as carbon sources during the composting of sludge with rice straw [34]. NMDS results constrained by the most dominant bacteria mentioned above confirm their association with the composition of the biomixtures (Figure S6).
Finally, it cannot be overlooked that the addition of PCPPs leads to a reduction in the relative abundance of some bacterial strains, but there was also a percentage of unaccounted for, unclassified bacterial strains and other bacteria that may also be involved in the elimination of these PCPPs and contribute to counteracting the loss of biodiversity in the different biomixtures.

4. Conclusions

The adsorption potential for PPCPs of the biomixtures studied in this work is mainly attributable to the different quantities and qualities of their organic carbon content. However, this adsorption process does not condition the availability of the PPCPs to be degraded, which is also attributable, on the one hand, to the chemical characteristics of the PPCPs, mainly their pKa and lipophilic characteristics, and on the other hand, to the development of a specific microbial community in each biomixture which seems partly attributable to the C/N ratio of each biomixture. The original archaeal and bacterial community structure in the biomixtures were significantly different from each other. This highlights their resilience or adaptive capacity against PCPPs in each biomixture. Furthermore, the relatively faster transformation of triclosan into methyl-triclosan in SVS and SPS suggests a lower toxic effect on their microbial population, which may partly explain their higher degradation rate of PPCPs compared to SAS, as well as the reduction of shifts in their microbial structure after the addition of these contaminants. In general, SVS and SPS biomixtures supported a relatively higher alpha diversity and higher degradation rate than SAS. The changes observed in the population of Crenarchaeota (Archaea) and some bacterial groups at 10 and 84 days after the addition of the PCPPs could be attributed, on the one hand, to the abundance and development of autochthonous bacterial phyla in each type of biomixture conditioned by their original specific composition, as well as to their resilience or capacity to metabolize and/or cometabolize ibuprofen, diclofenac and triclosan in each biomixture. Despite of the diverse microbial community determined in each biomixture, in all three BPSs, a similar pattern in the relative abundance with time was observed in general in the phylum Chloroflexi, in the class Sphingobacteriia (phylum Bacteroidetes) and in the Brevundimonas genus (Alphaproteobacteria class) and particularly of the genus Bacillus (Firmicutes phylum) and the class Caldilineaea (Chloroflexi phylum), in SVS and SPS, and of Achromobacter in SAS and SPS, highlighting their resistance and/or adaptation to PCPPs and their possible involvement in their elimination. Our results demonstrate that the biopurification systems contain diverse microbial populations capable of degrading PPCPs molecules with different properties. This promising technology is at an early stage of development and requires further research to be used in situ.

Supplementary Materials

The following are available online at https://www.mdpi.com/article/10.3390/agronomy11081507/s1, Figure S1: Hierarchical cluster analysis (a) and principal coordinate analysis (b) based on Euclidean distances for chemical properties of biomixtures consisting of soil, wet olive cake or alperujo and barley straw (SAS), soil, vermicompost and barley straw (SVS) and soil, peat and barley straw (SPS), Figure S2. Rarefaction curves for duplicate SAS, SVS and SPS biomixtures, before contamination (BC) and at 10 and 84 days after the addition of PPCPs, Figure S3. Relative abundance of the most dominant phyla (>1% in any sample) in samples of biomixtures (SAS), (SVS) and (SPS) before contamination (BC) and at 10 and 84 days after the addition of PPCPs, Figure S4. Principal coordinate analyses (PCoA) of the bacterial community structure in the biomixtures based on Bray-Curtis distances. Circles indicate samples before contamination and open squares at 10 and open diamonds at 84 days after the addition of PPCPs, Figure S5. Relative abundance (%) of the most dominant bacterial classes (>1% in any sample) in the SAS, SVS and SPS biomixtures before contamination (BC) and at 10 and 84 days after the addition of the PPCPs, Figure S6. Non-metric multidimensional scaling (NMDS) of the bacterial community at genus level in samples of contaminated biomixtures (SAS), (SVS) and (SPS) constrained by the most dominant genera.

Author Contributions

Conceptualization, L.D.-M., P.v.D., R.N. and E.R.; methodology, L.D.-M., R.N. and E.R.; software, L.D.-M. and E.R.; validation, L.D.-M., P.v.D., R.N. and E.R.; formal analysis, L.D.-M. and E.R.; investigation, L.D.-M., P.v.D., R.N. and E.R.; resources, P.v.D., R.N. and E.R.; data curation, P.v.D. and E.R.; writing—original draft preparation, E.R.; writing—review and editing, P.v.D., R.N. and E.R.; visualization, L.D.-M. and E.R.; supervision, P.v.D., R.N. and E.R.; project administration, P.v.D., and E.R.; funding acquisition, P.v.D., R.N. and E.R. All authors have read and agreed to the published version of the manuscript.

Funding

This work was funded by project CTM2017-86504-R of the Agencia Estatal de Investigación (AEI) of Spain and the European Regional Development Fund (FEDER).

Institutional Review Board Statement

Not applicable.

Informed Consent Statement

Not applicable.

Data Availability Statement

Not applicable.

Acknowledgments

Romeroliva S.L. (Deifontes, Granada-Sapin) and Turbera Agia (Padul, Granada-Spain) kindly supplied the wet olive mill cake waste and the peat respectively. The authors thank Celia Cifuentes for technical support.

Conflicts of Interest

The authors declare that there is no conflict of interest.

References

  1. Aus der Beek, T.; Weber, F.A.; Bergmann, A.; Hickmann, S.; Ebert, I.; Hein, A.; Küster, A. Pharmaceuticals in the environment-Global occurrences and perspectives. Environ. Toxicol. Chem. 2016, 35, 823–835. [Google Scholar] [CrossRef]
  2. Fekadu, S.; Alemayehu, E.; Dewil, R.; Van der Bruggen, B. Pharmaceuticals in freshwater aquatic environments: A comparison of the African and European challenge. Sci. Total Environ. 2019, 654, 324–337. [Google Scholar] [CrossRef]
  3. Rivera-Utrilla, J.; Sánchez-Polo, M.; Ferro-García, M.Á.; Prados-Joya, G.; Ocampo-Pérez, R. Pharmaceuticals as emerging contaminants and their removal from water. A review. Chemosphere 2013, 93, 1268–1287. [Google Scholar] [CrossRef]
  4. Grenni, P.; Ancona, V.; Barra Caracciolo, A. Ecological effects of antibiotics on natural ecosystems: A review. Microchem. J. 2018, 136, 25–39. [Google Scholar] [CrossRef]
  5. Santos, L.H.M.L.M.; Araújo, A.N.; Fachini, A.; Pena, A.; Delerue-Matos, C.; Montenegro, M.C.B.S.M. Ecotoxicological aspects related to the presence of pharmaceuticals in the aquatic environment. J. Hazard. Mater. 2010, 175, 45–95. [Google Scholar] [CrossRef] [Green Version]
  6. Oaks, J.L.; Gilbert, M.; Virani, M.Z.; Watson, R.T.; Meteyer, C.U.; Rideout, B.A.; Shivaprasad, H.L.; Ahmed, S.; Chaudhry, M.J.I.; Arshad, M.; et al. Diclofenac residues as the cause of vulture population decline in Pakistan. Nature 2004, 427, 630–633. [Google Scholar] [CrossRef]
  7. Lonappan, L.; Brar, S.K.; Das, R.K.; Verma, M.; Surampalli, R.Y. Diclofenac and its transformation products: Environmental occurrence and toxicity—A review. Environ. Int. 2016, 96, 127–138. [Google Scholar] [CrossRef] [Green Version]
  8. Almeida, B.; Oehmen, A.; Marques, R.; Brito, D.; Carvalho, G.; Barreto Crespo, M.T. Modelling the biodegradation of non-steroidal anti-inflammatory drugs (NSAIDs) by activated sludge and a pure culture. Bioresour. Technol. 2013, 133, 31–37. [Google Scholar] [CrossRef] [PubMed]
  9. Gros, M.; Petrovic, M.; Barceló, D. Wastewater treatment plants as a pathway for aquatic contamination by pharmaceuticals in the Ebro river basin (northeast Spain). Environ. Toxicol. Chem. 2007, 26, 1553–1562. [Google Scholar] [CrossRef] [PubMed]
  10. Thomaidi, V.S.; Matsoukas, C.; Stasinakis, A.S. Risk assessment of triclosan released from sewage treatment plants in European rivers using a combination of risk quotient methodology and Monte Carlo simulation. Sci. Total Environ. 2017, 603–604, 487–494. [Google Scholar] [CrossRef] [PubMed]
  11. Quintana, J.B.; Weiss, S.; Reemtsma, T. Pathways and metabolites of microbial degradation of selected acidic pharmaceutical and their occurrence in municipal wastewater treated by a membrane bioreactor. Water Res. 2005, 39, 2654–2664. [Google Scholar] [CrossRef] [PubMed]
  12. Macherius, A.; Lapen, D.R.; Reemtsma, T.; Römbke, J.; Topp, E.; Coors, A. Triclocarban, triclosan and its transformation product methyl triclosan in native earthworm species four years after a commercial-scale biosolids application. Sci. Total Environ. 2014, 472, 235–238. [Google Scholar] [CrossRef]
  13. Ding, T.; Lin, K.; Bao, L.; Yang, M.; Li, J.; Yang, B.; Gan, J. Biouptake, toxicity and biotransformation of triclosan in diatom Cymbella sp. and the influence of humic acid. Environ. Pollut. 2018, 234, 231–242. [Google Scholar] [CrossRef] [PubMed]
  14. Butler, E.; Whelan, M.J.; Sakrabani, R.; Van Egmond, R. Fate of triclosan in field soils receiving sewage sludge. Environ. Pollut. 2012, 167, 101–109. [Google Scholar] [CrossRef]
  15. Macedo, S.; Torres, T.; Santos, M.M. Methyl-triclosan and triclosan impact embryonic development of Danio rerio and Paracentrotus lividus. Ecotoxicology 2017, 26, 482–489. [Google Scholar] [CrossRef] [PubMed]
  16. Delgado-Moreno, L.; Bazhari, S.; Nogales, R.; Romero, E. Innovative application of biobed bioremediation systems to remove emerging contaminants: Adsorption, degradation and bioaccesibility. Sci. Total Environ. 2019, 651. [Google Scholar] [CrossRef] [PubMed]
  17. Aguilar-Romero, I.; Romero, E.; Wittich, R.M.; van Dillewijn, P. Bacterial ecotoxicity and shifts in bacterial communities associated with the removal of ibuprofen, diclofenac and triclosan in biopurification systems. Sci. Total Environ. 2020, 741. [Google Scholar] [CrossRef]
  18. Castillo, M.D.P.; Torstensson, L.; Stenström, J. Biobeds for environmental protection from pesticide use—A review. J. Agric. Food Chem. 2008, 56, 6206–6219. [Google Scholar] [CrossRef]
  19. Larcher, S.; Yargeau, V. Biodegradation of 17α-ethinylestradiol by heterotrophic bacteria. Environ. Pollut. 2013, 173, 17–22. [Google Scholar] [CrossRef] [PubMed]
  20. Aissaoui, S.; Ouled-Haddar, H.; Sifour, M.; Harrouche, K.; Sghaier, H. Metabolic and co-metabolic transformation of diclofenac by enterobacter hormaechei D15 isolated from activated sludge. Curr. Microbiol. 2017, 74, 381–388. [Google Scholar] [CrossRef]
  21. Holmsgaard, P.N.; Dealtry, S.; Dunon, V.; Heuer, H.; Hansen, L.H.; Springael, D.; Smalla, K.; Riber, L.; Sørensen, S.J. Response of the bacterial community in an on-farm biopurification system, to which diverse pesticides are introduced over an agricultural season. Environ. Pollut. 2017, 229, 854–862. [Google Scholar] [CrossRef] [PubMed]
  22. Góngora-Echeverría, V.R.; Quintal-Franco, C.; Arena-Ortiz, M.L.; Giácoman-Vallejos, G.; Ponce-Caballero, C. Identification of microbial species present in a pesticide dissipation process in biobed systems using typical substrates from southeastern Mexico as a biomixture at a laboratory scale. Sci. Total Environ. 2018, 628–629, 528–538. [Google Scholar] [CrossRef]
  23. Castro-Gutiérrez, V.; Masís-Mora, M.; Carazo-Rojas, E.; Mora-López, M.; Rodríguez-Rodríguez, C.E. Impact of oxytetracycline and bacterial bioaugmentation on the efficiency and microbial community structure of a pesticide-degrading biomixture. Environ. Sci. Pollut. Res. 2018, 25, 11787–11799. [Google Scholar] [CrossRef]
  24. Castillo Diaz, J.M.; Delgado-Moreno, L.; Núñez, R.; Nogales, R.; Romero, E. Enhancing pesticide degradation using indigenous microorganisms isolated under high pesticide load in bioremediation systems with vermicomposts. Bioresour. Technol. 2016, 214. [Google Scholar] [CrossRef] [PubMed]
  25. Delgado-Moreno, L.; Nogales, R.; Romero, E. Biodegradation of high doses of commercial pesticide products in pilot-scale biobeds using olive-oil agroindustry wastes. J. Environ. Manag. 2017, 204. [Google Scholar] [CrossRef] [PubMed]
  26. Edgar, R.C. UPARSE: Highly accurate OTU sequences from microbial amplicon reads. Nat. Methods 2013, 10, 996–998. [Google Scholar] [CrossRef]
  27. Delgado-Moreno, L.; Bazhari, S.; Gasco, G.; Méndez, A.; El Azzouzi, M.; Romero, E. New insights into the efficient removal of emerging contaminants by biochars and hydrochars derived from olive oil wastes. Sci. Total Environ. 2021, 752, 141838. [Google Scholar] [CrossRef] [PubMed]
  28. Karnjanapiboonwong, A.; Morse, A.N.; Maul, J.D.; Anderson, T.A. Sorption of estrogens, triclosan, and caffeine in a sandy loam and a silt loam soil. J. Soils Sediments 2010, 10, 1300–1307. [Google Scholar] [CrossRef]
  29. Behera, S.K.; Oh, S.Y.; Park, H.S. Sorption of triclosan onto activated carbon, kaolinite and montmorillonite: Effects of pH, ionic strength, and humic acid. J. Hazard. Mater. 2010, 179, 684–691. [Google Scholar] [CrossRef]
  30. Xu, J.; Wu, L.; Chang, A.C. Degradation and adsorption of selected pharmaceuticals and personal care products (PPCPs) in agricultural soils. Chemosphere 2009, 77, 1299–1305. [Google Scholar] [CrossRef]
  31. Castillo, J.M.; Romero, E.; Nogales, R. Dynamics of microbial communities related to biochemical parameters during vermicomposting and maturation of agroindustrial lignocellulose wastes. Bioresour. Technol. 2013, 146. [Google Scholar] [CrossRef]
  32. Yu, Y.; Han, P.; Zhou, L.J.; Li, Z.; Wagner, M.; Men, Y. Ammonia monooxygenase-mediated cometabolic biotransformation and hydroxylamine-mediated abiotic transformation of Micropollutants in an AOB/NOB Coculture. Environ. Sci. Technol. 2018, 52, 9196–9205. [Google Scholar] [CrossRef]
  33. Wu, G.; Geng, J.; Xu, K.; Ren, H. Removal of pharmaceuticals by ammonia oxidizers during nitrification. Appl. Microbiol. Biotechnol. 2021, 105, 909–921. [Google Scholar] [CrossRef] [PubMed]
  34. Iranzo, M.; Gamón, M.; Boluda, R.; Mormeneo, S. Analysis of pharmaceutical biodegradation of WWTP sludge using composting and identification of certain microorganisms involved in the process. Sci. Total Environ. 2018, 640–641, 840–848. [Google Scholar] [CrossRef]
  35. Romero, E.; Salido, A.; Cifuentes, C.; Fernández, J.-D.; Nogales, R. Effect of vermicomposting process on pesticide sorption capability using agro-industrial wastes. Int. J. Environ. Anal. Chem. 2006, 86. [Google Scholar] [CrossRef]
  36. Wu, C.; Spongberg, A.L.; Witter, J.D. Adsorption and degradation of triclosan and triclocarban in soils and biosolids-amended soils. J. Agric. Food Chem. 2009, 57, 4900–4905. [Google Scholar] [CrossRef]
  37. Fu, Q.; Sanganyado, E.; Ye, Q.; Gan, J. Meta-analysis of biosolid effects on persistence of triclosan and triclocarban in soil. Environ. Pollut. 2016, 210, 137–144. [Google Scholar] [CrossRef] [Green Version]
  38. Clayborn, A.B.; Toofan, S.N.; Champlin, F.R. Influence of methylation on the antibacterial properties of triclosan in Pasteurella multocida and Pseudomonas aeruginosa variant strains. J. Hosp. Infect. 2011, 77, 129–133. [Google Scholar] [CrossRef] [Green Version]
  39. Oh, S.; Choi, D.; Cha, C.J. Ecological processes underpinning microbial community structure during exposure to subinhibitory level of triclosan. Sci. Rep. 2019, 9, 1–12. [Google Scholar] [CrossRef] [PubMed] [Green Version]
  40. Saavedra, M.; Benitez, E.; Cifuentes, C.; Nogales, R. Enzyme activities and chemical changes in wet olive cake after treatment with Pleurotus ostreatus or Eisenia fetida. Biodegradation 2006, 17, 93–102. [Google Scholar] [CrossRef] [PubMed]
  41. Vivas, A.; Moreno, B.; Garcia-Rodriguez, S.; Benitez, E. Assessing the impact of composting and vermicomposting on bacterial community size and structure, and microbial functional diversity of an olive-mill waste. Bioresour. Technol. 2009, 100, 1319–1326. [Google Scholar] [CrossRef] [PubMed]
  42. Jiang, C.; Geng, J.; Hu, H.; Ma, H.; Gao, X.; Ren, H. Impact of selected non-steroidal anti-inflammatory pharmaceuticals on microbial community assembly and activity in sequencing batch reactors. PLoS ONE 2017, 12, e0179236. [Google Scholar] [CrossRef] [PubMed] [Green Version]
  43. Rutere, C.; Knoop, K.; Posselt, M.; Ho, A.; Horn, M.A. Ibuprofen degradation and associated bacterial communities in hyporheic zone sediments. Microorganisms 2020, 8, 1245. [Google Scholar] [CrossRef]
  44. Thelusmond, J.R.; Kawka, E.; Strathmann, T.J.; Cupples, A.M. Diclofenac, carbamazepine and triclocarban biodegradation in agricultural soils and the microorganisms and metabolic pathways affected. Sci. Total Environ. 2018, 640–641, 1393–1410. [Google Scholar] [CrossRef]
  45. Lawrence, J.R.; Swerhone, G.D.W.; Wassenaar, L.I.; Neu, T.R. Effects of selected pharmaceuticals on riverine biofilm communities. Can. J. Microbiol. 2005, 51, 655–669. [Google Scholar] [CrossRef]
  46. Xia, Z.; Xiao-chun, W.; Zhong-lin, C.; Hao, X.; Qing-fang, Z. Microbial community structure and pharmaceuticals and personal care products removal in a membrane bioreactor seeded with aerobic granular sludge. Appl. Microbiol. Biotechnol. 2015, 99, 425–433. [Google Scholar] [CrossRef]
  47. Fierer, N.; Lauber, C.L.; Ramirez, K.S.; Zaneveld, J.; Bradford, M.A.; Knight, R. Comparative metagenomic, phylogenetic and physiological analyses of soil microbial communities across nitrogen gradients. ISME J. 2012, 6, 1007–1017. [Google Scholar] [CrossRef] [Green Version]
  48. Nega, M.; Braun, B.; Künzel, S.; Szewzyk, U. Evaluating the impact ofwastewater effluent on microbial communities in the Panke, an Urban River. Water 2019, 11, 888. [Google Scholar] [CrossRef] [Green Version]
  49. Zhang, D.; Luo, J.; Lee, Z.M.P.; Maspolim, Y.; Gersberg, R.M.; Liu, Y.; Tan, S.K.; Ng, W.J. Characterization of bacterial communities in wetland mesocosms receiving pharmaceutical-enriched wastewater. Ecol. Eng. 2016, 90, 215–224. [Google Scholar] [CrossRef]
  50. Krzmarzick, M.J.; Crary, B.B.; Harding, J.J.; Oyerinde, O.O.; Leri, A.C.; Myneni, S.C.B.; Novak, P.J. Natural niche for organohalide-respiring chloroflexi. Appl. Environ. Microbiol. 2012, 78, 393–401. [Google Scholar] [CrossRef] [Green Version]
  51. Krzmarzick, M.J.; Taylor, D.K.; Fu, X.; McCutchan, A.L. Diversity and niche of archaea in bioremediation. Archaea 2018, 2018. [Google Scholar] [CrossRef] [PubMed] [Green Version]
  52. Mcnamara, P.J.; Krzmarzick, M.J. Triclosan enriches for Dehalococcoides-like Chloroflexi in anaerobic soil at environmentally relevant concentrations. FEMS Microbiol. Lett. 2013, 344, 48–52. [Google Scholar] [CrossRef]
  53. Tortella, G.R.; Mella-Herrera, R.A.; Sousa, D.Z.; Rubilar, O.; Acuña, J.J.; Briceño, G.; Diez, M.C. Atrazine dissipation and its impact on the microbial communities and community level physiological profiles in a microcosm simulating the biomixture of on-farm biopurification system. J. Hazard. Mater. 2013, 260, 459–467. [Google Scholar] [CrossRef] [Green Version]
  54. Barra Caracciolo, A.; Topp, E.; Grenni, P. Pharmaceuticals in the environment: Biodegradation and effects on natural microbial communities. A review. J. Pharm. Biomed. Anal. 2015, 106, 25–36. [Google Scholar] [CrossRef]
  55. Butler, E.; Whelan, M.J.; Ritz, K.; Sakrabani, R.; Van Egmond, R. Effects of triclosan on soil microbial respiration. Environ. Toxicol. Chem. 2011, 30, 360–366. [Google Scholar] [CrossRef]
  56. Zhao, C.; Xie, H.J.; Xu, J.; Xu, X.; Zhang, J.; Hu, Z.; Liu, C.; Liang, S.; Wang, Q.; Wang, J. Bacterial community variation and microbial mechanism of triclosan (TCS) removal by constructed wetlands with different types of plants. Sci. Total Environ. 2015, 505, 633–639. [Google Scholar] [CrossRef]
  57. Guo, Q.; Yan, J.; Wen, J.; Hu, Y.; Chen, Y.; Wu, W. Rhamnolipid-enhanced aerobic biodegradation of triclosan (TCS) by indigenous microorganisms in water-sediment systems. Sci. Total Environ. 2016, 571, 1304–1311. [Google Scholar] [CrossRef]
  58. Martin, E.K.; Kemal, S.; Henrik, N.R.; Alexander, E.; Natalia, C.; Henrik, J.C.; Thomas, B.; Hans, B.; Erik, K. Triclosan changes community composition and selects for specific bacterial taxa in marine periphyton biofilms in low nanomolar concentrations. Ecotoxicology 2020, 29, 1083–1094. [Google Scholar] [CrossRef]
  59. Lear, J.C.; Maillard, J.Y.; Dettmar, P.W.; Goddard, P.A.; Russell, A.D. Chloroxylenol- and triclosan-tolerant bacteria from industrial sources. J. Ind. Microbiol. Biotechnol. 2002, 29, 238–242. [Google Scholar] [CrossRef] [PubMed]
  60. Murdoch, R.W.; Hay, A.G. Formation of catechols via removal of acid side chains from ibuprofen and related aromatic acids. Appl. Environ. Microbiol. 2005, 71, 6121–6125. [Google Scholar] [CrossRef] [PubMed] [Green Version]
  61. Aulestia, M.; Flores, A.; Mangas, E.L.; Pérez-Pulido, A.J.; Santero, E.; Camacho, E.M. Isolation and genomic characterization of the ibuprofen-degrading bacterium Sphingomonas strain MPO218. Environ. Microbiol. 2021, 23, 267–280. [Google Scholar] [CrossRef]
  62. Arora, P.K. Bacilli-Mediated Degradation of Xenobiotic Compounds and Heavy Metals. Front. Bioeng. Biotechnol. 2020, 8, 1–28. [Google Scholar] [CrossRef] [PubMed]
  63. Marchlewicz, A.; Guzik, U.; Smułek, W.; Wojcieszyńska, D. Exploring the Degradation of Ibuprofen by Bacillus thuringiensis B1(2015b): The New Pathway and Factors Affecting Degradation. Molecules 2017, 22, 1676. [Google Scholar] [CrossRef] [PubMed]
  64. Yang, C.W.; Hsiao, W.C.; Fan, C.H.; Chang, B.V. Bacterial communities associated with sulfonamide antibiotics degradation in sludge-amended soil. Environ. Sci. Pollut. Res. 2016, 23, 19754–19763. [Google Scholar] [CrossRef] [PubMed]
  65. Kraigher, B.; Mandic-Mulec, I. Influence of diclofenac on activated sludge bacterial communities in fed-batch reactors. Food Technol. Biotechnol. 2020, 58, 402–410. [Google Scholar] [CrossRef]
Figure 1. Degradation of ibuprofen, diclofenac and triclosan in non-sterilized and sterilized biopurification systems consisting of biomixtures of soil, wet olive cake or alperujo and barley straw (SAS), soil, vermicompost and barley straw (SVS) and soil, peat and barley straw (SPS). Symbols and lines represent the experimental data and the fit to the single first order kinetic model, respectively. Error bars indicate the standard deviation (n = 3).
Agronomy 11 01507 g001
Figure 2. Percentages of the metabolite methyl-triclosan determined at different incubation time in SAS, SVS and SPS biomixtures from different biopurification systems. Error bars indicate the standard deviation (n = 3).
Agronomy 11 01507 g002
Figure 3. (a) Observed OTUs and alpha diversity indices (Chao 1, Shannon) in biopurification systems composed of SAS, SVS and SPS biomixtures, before the contamination (BC) and at 10 and 84 d after the addition of the PPCPs. Different letters in the same biomixture refer to significant differences among times (p < 0.01). (b) Percentage of each PPCP remaining in the SAS, SVS and SPS biomixtures after 10 and 84 days.
Agronomy 11 01507 g003
Figure 4. Dendrogram of the hierarchical cluster analysis based on Euclidean distances (average linkage method) of bacterial communities in biopurification systems composed of SAS, SVS and SPS biomixtures, before the contamination (BC) and at 10 and 84 days after the addition of the PPCPs.
Agronomy 11 01507 g004
Figure 5. Heatmap showing the relative abundance of OTUs at the genus level in the biopurification systems composed of SAS, SVS and SPS biomixtures, before contamination (BC) and at 10 and 84 d after the addition of the PPCPs. Only OTUs with a relative abundance >1% in at least one sample are shown. The color code indicates the range of relative abundance for a given genus.
Agronomy 11 01507 g005
Table 1. Chemical properties (mean ± SD, n = 3) of the three assayed biomixtures: soil, wet olive cake or alperujo and barley straw (SAS), soil, vermicompost and barley straw (SVS) and soil, peat and barley straw (SPS).
PropertiesUnitSASSVSSPS
pH 8.30 ± 0.01 c8.17 ± 0.02 b7.04 ± 0.02 a
EC(dS m−1)2.23 ± 0.02 b2.06 ± 0.04 a3.00 ± 0.03 c
TC(g kg−1)219.7 ± 7.60 b180.0 ± 6.2 a178.0 ± 1.00 a
TKN(g kg−1)7.76 ± 0.19 a10.46 ± 0.45 b7.31 ± 0.18 a
TOC(g kg−1)183.7 ± 5.50 b154.0 ± 8.70 a149.0 ± 10.40 a
C/N 28.33 ± 1.65 c17.24 ± 1.32 a24.36 ± 0.54 b
TEC(g kg−1)3.18 ± 0.02 b2.32 ± 0.03 a5.87 ± 0.02 c
HA(g kg−1)1.15 ± 0.06 b0.81 ± 0.06 a3.92 ± 0.02 c
FA(g kg−1)2.03 ± 0.05 b1.51 ± 0.08 a1.96 ± 0.02 b
WSC(g kg−1)14.68 ± 0.57 c6.50 ± 0.20 b1.66 ± 0.27 a
Lignin(g kg−1)57.41 ± 1.09 b69.99 ± 3.72 c24.06 ± 1.10 a
Hemicellulose(g kg−1)95.23 ± 10.94 b82.49 ± 12.35 b28.88 ± 9.40 a
Cellulose(g kg−1)71.98 ± 3.62 c42.96 ± 1.89 b17.32 ± 0.25 a
EC: electrical conductivity, TC: total carbon, TKN: total Kjeldahl nitrogen, TOC: total organic carbon, TEC: total extractable carbon, HA: humic acids, FA: fulvic acids, WSC: water-soluble carbon. Different superscript letters in the same row refer to significant differences among biomixtures for each property (p < 0.05).
Table 2. Distribution (Kd), determination (R2) coefficients, coefficient normalized by the organic carbon content (Koc) and total amount adsorbed (%) for the adsorption of ibuprofen, diclofenac and triclosan in SAS, SVS and SPS biomixtures.
SASSVSSPS
Ibuprofen
Kd ± SE (L kg−1)3.7 ± 0.2 b2.1 ± 0.5 a3.8 ± 2.3 b
R20.950.990.98
Koc± SE20 ± 1 a18 ± 1 a25 ± 1 b
Adsorption (%)6 ± 15 ± 17 ± 1
Diclofenac
Kd ± SE (L kg−1)12.3 ± 0.5 a13.2 ± 0.5 a14.9 ± 8.3 a
R21.000.971.00
Koc ± SE67 ± 3 a86 ± 3 b100 ± 3 b
Adsorption (%)20 ± 220 ± 325 ± 3
Triclosan
Kd ± SE (L kg−1)1371 ± 81 b1049 ± 11 a1278 ± 759 a,b
R20.940.970.99
Koc ± SE7465 ± 436 a,b6809 ± 71 a8579 ± 104 b
Adsorption (%)96 ± 195 ± 197 ± 1
SE: standard error. Different superscript letters in the same row refer to significant differences among biomixtures for each PPCP (p < 0.01).
Table 3. Degradation parameters from the single first-order degradation model of each PPCP, in SAS, SVS and SPS biomixtures.
SASSVSSPS
Ibuprofen
C0 ± sd(%)98 ± 3100 ± 1100 ± 1
k × 102 ± sd(d−1)18.7 ± 1.7 a75.9 ± 4.5 b75.9 ± 2.4 b
R2 0.940.990.99
DT50(d)411
DT90(d)1233
D ± sd(% at 10 d)82 ± 3100 ± 097 ± 1
Diclofenac
C0 ± sd(%)104 ± 3102 ± 299 ± 2
k × 102 ± sd(d−1)3.0 ± 0.3 a11.5 ± 0.6 c6.7 ± 0.3 b
R2 0.910.970.98
DT50(d)23610
DT90(d)772034
D ± sd(% at 84 d)89 ± 495 ± 197 ± 0
Triclosan
C0 ± sd(%)102 ± 395 ± 2106 ± 2
k × 102 ± sd(d−1)2.9 ± 0.3 b2.9 ± 0.2 b2.6 ± 0.2 a
R2 0.890.960.95
DT50(d)242426
DT90(d)797989
D ± sd(% at 84 d)96 ± 191 ± 194 ± 1
Sd: standard deviation. D: Percentage of PCPP dissipated. Different upper letters in the same row refer to significant differences among biomixtures for each PPCP (p < 0.01).
Table 4. Percentages of the relative abundance of bacterial phyla and bacterial classes in the biopurification systems assayed before contamination (BC) and at 10 and 84 days after the addition of the PPCPs.
SASSVSSPS
Time (days)BC1084BC1084BC1084
Archaea
Crenarchaeota0.070.010.070.55 a0.76 a1.99 b1.37 a0.64 a2.83 b
Bacteria Phylum
Proteobacteria39.2 a54.1 b31.9 a23.427.522.144.5 b44.5 b33.5 a
Actinobacteria32.6 b16.7 a29.4 b19.411.111.29.998.258.54
Bacteroidetes19.820.519.018.7 a,b21.5 b8.5 a10.5 b9.3 a,b5.2 a
Chloroflexi0.25 a0.11 a2.49 b4.8 a4.0 a9.3 b3.2 a1.3 a9.4 b
Firmicutes0.99 b0.50 a0.66 a,b11.412.827.06.810.515.9
Planctomycetes0.490.461.364.9 a,b2.4 a6.6 b3.82.55.8
Verrucomicrobia1.63 a3.2 b3.99 b1.34 a2.11 b0.79 a3.3 b3.6 b1.8 a
Acidobacteria0.010.000.041.170.631.791.21.91.4
Bacteria Classes
Alphaproteobact28.8 b36.4 c21.2 a11.814.012.330.1 b29.8 b20.3 a
Betaproteobact2.65 a8.01 b3.45 a0.610.950.674.916.514.83
Sphingobacteriia14.2 b15.2 b12.3 a5.2 b6.5 b2.8 a7.0 b6.5 b2.8 a
Anaerolineae0.00.01.11.91.22.01.5 a0.4 a4.4 b
Caldilineae0.00.00.41.9 a1.5 a6.0 b0.7 a0.3 a3.0 b
Bacilli0.80.50.510.911.925.06.38.014.7
Different upper letters refer to significant differences among times for each biomixture (p < 0.05).
Publisher’s Note: MDPI stays neutral with regard to jurisdictional claims in published maps and institutional affiliations.

