Article

Optimizing Sowing Date and Planting Density Can Mitigate the Impacts of Future Climate on Maize Yield: A Case Study in the Guanzhong Plain of China

1
Key Laboratory for Agricultural Soil and Water Engineering in Arid Area of Ministry of Education, Northwest A&F University, Yangling, Xianyang 712100, China
2
Institute of Water-Saving Agriculture in Arid Areas of China, Northwest A&F University, Yangling, Xianyang 712100, China
3
Patent Examination Cooperation Sichuan Center of the Patent Office, China National Intellectual Property Administration, Shuangliu, Chengdu 610200, China
4
New South Wales Department of Primary Industries, Wagga Wagga Agricultural Institute, Wagga Wagga, NSW 2650, Australia
5
Climate Change Research Centre, University of New South Wales, Sydney, NSW 2052, Australia
6
College of Land Science and Technology, China Agricultural University, Beijing 100193, China
7
State Key Laboratory of Soil Erosion and Dryland Farming on the Loess Plateau, Institute of Soil and Water Conservation, Northwest A&F University, Yangling, Xianyang 712100, China
8
College of Agronomy, Northwest A&F University, Yangling, Xianyang 712100, China
9
Key Laboratory of Biology and Genetic Improvement of Maize in Arid Area of Northwest Region, Ministry of Agriculture, Yangling, Xianyang 712100, China
*
Author to whom correspondence should be addressed.
These authors contributed equally to this work.
Agronomy 2021, 11(8), 1452; https://doi.org/10.3390/agronomy11081452
Submission received: 30 May 2021 / Revised: 16 July 2021 / Accepted: 16 July 2021 / Published: 21 July 2021
(This article belongs to the Special Issue Progress in Plant Bioclimatic Modelling under Global Climate Change)

Abstract

:
We used the APSIM-Maize model to simulate maize potential yield (Yp) and rain-fed yield (Yw) when adaptation options of sowing date and planting density were adopted under Representative Concentration Pathway (RCP) 4.5 and 8.5 in the Guanzhong Plain of China. The results showed that Yp would decrease by 10.6–14.9% and 15.0–31.4% under RCP4.5 and RCP8.5 for summer maize, and 13.9–19.7% and 18.5–36.3% for spring maize, respectively. The Yw would decrease by 17.1–19.0% and 23.6–41.1% under RCP4.5 and RCP8.5 for summer maize, and 20.9–24.5% and 27.8–45.5% for spring maize, respectively. The loss of Yp and Yw could be reduced by 2.6–9.7% and 0–9.9%, respectively, under future climate for summer maize through countermeasures. For spring maize, the loss of Yp was mitigated by 14.0–25.0% and 2.0–21.8% for Yw. The contribution of changing sowing date and plant density on spring maize yield was more than summer maize, and the optimal adaptation options were more effective for spring maize. Additionally, the influences of changing sowing date and planting density on yields become weak as climate changes become more severe. Therefore, it is important to investigate the potential of other adaptation measures to cope with climate change in the Guanzhong Plain of China.

1. Introduction

It has been estimated that the global average surface temperature will increase by 0.3–4.8 °C by the end of the 21st century [1]. Food security under global warming is currently one of the top priorities on the political agenda [2]. Climate change has seriously affected agricultural production, especially in developing countries such as China [3,4,5]. Therefore, it is urgent to develop various agronomic management practices to cope with the negative impacts of climate change on crop production to ensure global food security.
Maize is one of the three major food crops in the world. The yield of maize rose by 66.9 kg ha−1 year−1 since 1961 and the total production became the largest among the three main food crops since 2001 in the world [6]. China is one of major maize producers around the world and contributes to 22.8% of global maize production. The yield per hectare has improved in recent years (1961–2017) due to breeding improvement, advanced tillage systems, cultivation techniques, and the increasing use of agricultural machinery [7]. However, the harvested areas of maize decreased obviously in China. This was mainly because of the national policy on optimizing the planting structure and reducing inefficient crop planting areas [8].
The fifth assessment report of the Intergovernmental Panel on Climate Change (IPCC) indicated that climate change has adversely affected maize yields in many regions [9,10,11]. Numerous studies have further verified the phenomena in recent years. For example, Ramirez et al. [11] reported that maize production would reduce by 12–40% under climate change in Africa. Deryng et al. [12] found that extreme heat stress at anthesis under a high emission scenario of RCP8.5 (Representative Concentration Pathway 8.5) led to doubling loss of global maize yield. Rosenzweig et al. [13] reported that maize yields in low-latitude areas decreased more under RCP8.5 because the tropical areas were more vulnerable to climate change. Ureta et al. [14] projected that the maize rain-fed yields would decline in the future in Mexico due to increased extreme heat events. In China, Chen and Liu [15] found that maize yield would decrease mainly due to a shortened growth period of maize caused by warming temperatures.
Climate change has become a major obstacle to safeguard the supply of maize. Many researchers have used crop models to study the responses of maize yield to different management measures to cope with the negative impacts of climate change. In Mozambique, Harrison et al. [16] reported that farmers can avoid some yield losses through delaying planting dates and adopting longer-season maize varieties. Cuculeanu et al. [17] indicated that delaying the sowing date to the last week of April with a planting density of 5 plants m−2 is able to cope with negative impacts of climate change on maize in Romania.
In recent years, the Agricultural Production Systems sIMulator (APSIM) model has become a powerful tool to study the effects of climate change on crop yields. For example, Traore et al. [18] found early planting and mineral fertilizer at recommended rates can buffer the loss in maize yield in southern Mali based on the simulations with the APSIM model. However, they cannot fully offset the adverse impacts of future climate change. Seyoum et al. [19] used the APSIM model to study the potential of changing maize genotype to increase maize yield under different environmental conditions in Ethiopia. Lv et al. [20] also used the APSIM-Maize model to simulate the potential and attainable yields of spring maize from 1961 to 2009 in Northeast China. They found that historical climate change had a negative effect on maize yield. In general, the APSIM model has been widely used to study and predict the impacts of climate change on crops.
In China, many researchers have also found that adjusting sowing date or planting density was advisable to improve crop yield. For example, Ren et al. [21] demonstrated increasing planting density has a great potential to increase maize yield in the Loess Plateau of China. This is mainly because higher plant populations increase the number of maize ears. Sun et al. [22] indicated that keeping sowing date in a certain range after June can increase the summer maize yield in the North China Plain. However, most previous studies only focused on a single countermeasure without considering the interaction with climate change (e.g., increasing temperature and CO2 fertilization). Cuculeanu et al. [17] suggested that an interaction of several management measures instead of a single measure is more effective to mitigate the negative impacts of climate change on crop production. Therefore, it is necessary to test the potential of multiple adaption options to mitigate the impacts of future climate on maize yield in China.
In our study, the APSIM-Maize model, driven by historical and projected future climate data, was used to explore the impacts of future climate change on maize yield with different agronomic options in the Guanzhong Plain of China. Our main objectives were to (1) evaluate the performance of the APSIM-Maize model in simulating the growth of spring and summer maize in the study area, (2) explore the impacts of future climate change on maize potential and rain-fed yields, and (3) investigate the capacity of optimizing sowing dates and planting densities to cope with the adverse impacts of climate change on maize yield.

2. Materials and Methods
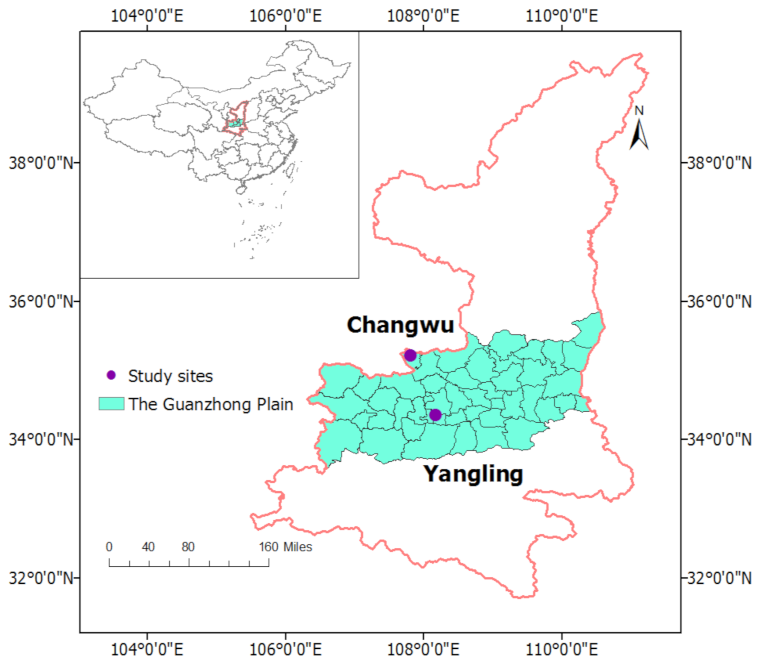
2.1. Study Sites

The Guanzhong Plain is located in Shaanxi Province, China. Wheat-maize rotation is the main cropping system for grain production in the Guanzhong Plain [23]. We selected two representative sites, Yangling (108°10′ E, 34°21′ N, 455 m) and Changwu (107°49′ E, 35°13′ N, 1152 m) in the Guangzhong Plain for our study (Figure 1).
Summer maize (growth period of June to October) was planted in Yangling and spring maize (growth period of April to October) in Changwu. Both sites had typical continental monsoon climates with an average rainfall of 360–470 mm and an average temperature of 17.8–24.1 °C during the maize growth period (Table 1).

2.2. Field Experimental Data

The field experiments were carried out with summer maize cultivar of “Zhengdan 958” at Yangling in 2009–2012 and spring maize cultivar of “Xianyu 335” at Changwu in 2017–2018 (Figure 1 and Table 2).
The basic information of the summer maize experiment included row space of 60 cm, sowing dates of June 10th to 13th, planting densities of 6 and 7.5 plants m−2, irrigations available during growing seasons, and basal fertilizer and top dressing applied during growing seasons. The basic information of spring maize experiment included row space of 60 cm and 40 cm, sowing date of April 26, no irrigation available during growing seasons, and one-time basal fertilizer at the beginning of growing season. Each treatment had three replicates and all the experimental plots were randomly distributed. The observation data included phenology date (i.e., emergence, anthesis, and maturity) and grain yield, which were mainly used to calibrate and validate the APSIM-Maize model. More details about field experiments can be found in Table 2. The soil parameters of each site were obtained through on-site sampling, including bulk density (g cm−3), wilting point (mm3 mm−3), field capacity (mm3 mm−3), saturation (mm3 mm−3), organic carbon content (%), and total nitrogen content (%) in continuous soil layers (Table 3).

2.3. Climate Data

Daily climate data of the two representative sites from 1971 to 2010 were obtained from the Chinese Meteorological Data Service Center (CMDC; https://data.cma.cn/, accessed 19 June 2020), including daily rainfall (mm), solar radiation (calculated based on the sunshine hours using the Angstrom formula, MJ m−2 day−1) [24], and daily maximum and minimum temperatures (°C).
For future climate projections, a total of 36 global climate models (GCMs) (Table 4) were used from the Coupled Model Intercomparison Project phase 5 (CMIP5) dataset. Two emission scenarios of Representative Concentration Pathway (RCP) (4.5 and 8.5) [9] were considered. Two future time periods (2031–2060, 2050s) and (2071–2100, 2090s) were used.
Monthly gridded climate data from the 36 GCMs (Table 4) were statistically downscaled using the method of Liu and Zuo [25] to produce daily temperature, rainfall, and solar radiation in the two future periods at the two study sites. Firstly, gridded data were statistically downscaled to site scale through the inverse distance-weighted interpolation method [25]. Then, a bias correction was conducted to contrast and analyze the observed GCMs monthly data for the baseline. Finally, we used the modified WGEN (stochastic weather generator) to generate the daily climate data for each study site [26]. Detailed descriptions of the statistical downscaling method can be found in Liu and Zuo [25], including inverse distance-weighted interpolation, the procedure of bias correction, and temporal downscaling. This statistical downscaling method has been widely used in the study of climate change impact assessment around the world [27,28,29,30,31].

2.4. Model Simulations

2.4.1. APSIM-Maize Model

The APSIM-Maize model is a sub-model of the APSIM model, which is a daily-stepped mechanism model developed by the Australian Agricultural Production Systems Research Group (APSRU) to simulate crop growth and development processes. It is a powerful modeling tool to simulate the effects of climate, soil, agronomic management practices, and genotypes on crop production [32]. Its core modules include soil, crop, management options, and climate [33]. Input data include daily weather data, soil data, crop parameters, and management settings. This model has been widely tested and applied worldwide [21,22,34,35]. In our study, the APSIM-Maize version 7.7 (https://www.apsim.info/download-apsim/downloads/, accessed 10 July 2019) was used to simulate maize yields for different management scenarios (i.e., planting densities and sowing dates) under climate change in the Guanzhong Plain.

2.4.2. Model Calibration and Validation

We used the trial-and-error method to adjust the relevant crop parameters with an objective to make the observed emergence, anthesis, maturity date, and yield close to those simulated by the APSIM-Maize model during the processes of model calibration and validation [36]. The model was calibrated with the experimental data of emergence, anthesis, maturity dates and grain yields at Yangling in 2009–2010 and at Changwu in 2017. Then, it was validated with the experimental data of anthesis, maturity dates and grain yields at Yangling in 2011–2012 and at Changwu in 2018, respectively.

2.4.3. Simulation Scenarios

Potential yield (Yp) is defined as the maximum yield that a crop variety can reach without water and nutrient stresses, and only being affected by meteorological conditions. Rain-fed yield (Yw) is the potential yield under rain-fed conditions. The difference between Yp and Yw is the yield gap (Yg), which indicates the achievable yield through full irrigation [37,38]. The values of Yp and Yw are mainly determined by solar radiation, temperature, and soil properties, while Yw is also affected by rainfall [39]. In our study, the validated APSIM-Maize model was used to simulate maize Yp and Yw at the two selected representative sites under different scenarios. The simulation of all scenarios for 1971–2100 was based on current maize cultivar with summer maize “Zhengdan 958” at Yangling and spring maize “Xianyu 335” at Changwu. The simulated management scenarios were set as follows.
(1) Initial conditions
The initial soil water content was set as evenly distributed throughout the soil profile at 75% of the plant available water capacity (PAWC) to avoid the failure of emergence, where PAWC is defined as the difference between field capacity and wilting point. According to the measured data of the soil samples, the initial NO3 and NH4 were set to 20 ppm and 10 ppm throughout the soil profile, respectively.
(2) Irrigation
The irrigation scenarios include full irrigation (Yp) and rain-fed condition (Yw). Under full irrigation scenarios, automatic irrigation was conducted to eliminate the water stress when soil water content was 20 mm less than PAWC.
(3) Fertilization
Adequate one-time fertilization of 250 kg N ha−1 was applied in each simulation scenario. We have tested the simulated yields and found that yields did not change much when the amount of fertilizer was above that value. Other management practices were the same as those performed by local farmers.
(4) Planting densities × Sowing dates
According to our field experiment [40,41], we took 6 plants m−2 as the local normal planting density, and 8 June for summer maize and 19 April for spring maize as the normal sowing dates, respectively. Then we set a planting density gradient of 4, 6, 8, and 10 plants m−2 and sowing dates at a one-week interval, namely 25 May (S1), 1 June (S2), 8 June (S3), 15 June (S4), and 22 June (S5) for summer maize at Yangling; 5 April (S1’), 12 April (S2’), 19 April (S3’), 26 April (S4’), and 3 May (S5’) for spring maize at Changwu. There were 20 combinations of sowing dates and densities in total.
In the crop module of the APSIM-Maize model, atmospheric CO2 concentration ( C co 2 ) affects crop radiation use efficiency, transpiration efficiency, and critical leaf nitrogen concentration [27]. However, the model cannot directly calculate the dynamic time-series value of C co 2 [42]. In our study, we used empirical equations obtained through nonlinear least-squares regression to calculate the C co 2 during 1971–2100 under the RCP4.5 (Equation (1)) and RCP8.5 (Equation (2)) scenarios [43].
C co 2 = 650.18 + 0.000075326 y 0.16276 0.00022299 727.97 y 2 0.00018747 ( y 2045 ) 3
C co 2 = 1034.3 + 267.78 1.6188 y 4.0143 + y 53.342 5.2822 + 21.746 ( y 2010 100 ) 3 + 100.65 ( y 1911 100 ) 3
where y is the calendar year from 1971 to 2100, i.e., y = 1971, 1972, …, and 2100.

2.5. Data Analysis

A multiple linear regression model was established to quantify the effects of climatic factors including mean temperature (°C), rainfall (mm), solar radiation (MJ m−2), and CO2 concentration C co 2 (ppm) on future maize yield (Equation (3)).
Δ Y = a Δ T + b Δ R + c Δ S + d C co 2
where ΔY, ΔT, ΔR, ΔS, and C co 2 were the changes in maize yield, mean temperature, rainfall, solar radiation, and C co 2 during maize growing seasons in the 2050s and 2090s relative to the baseline of 1971–2010 under RCP4.5 and RCP8.5 for all of the 36 GCMs; a, b, c, and d were model coefficients.

2.6. Statistical Indices for Model Evaluation

To evaluate the model performance in simulating maize growth in the Guanzhong Plain, we used three statistics in the processes of model calibration and validation, including root mean squared error (RMSE; Equation (4)), normalized root mean squared error (NRMSE; Equation (5)), and determination coefficient (R2; Equation (6)) [44,45].
RMSE = 1 n i = 1 n ( S i O i ) 2
NRMSE = 1 n i = 1 n ( S i O i ) 2 X ¯ × 100 %
R 2 = i = 1 n ( S i S ¯ ) 2 i = 1 n ( O i O ¯ ) 2
where O i is the observed value; S i is the simulated value; O ¯ and S ¯ are the average values of the observed and simulated values, respectively; n  is the number of samples.

3. Results

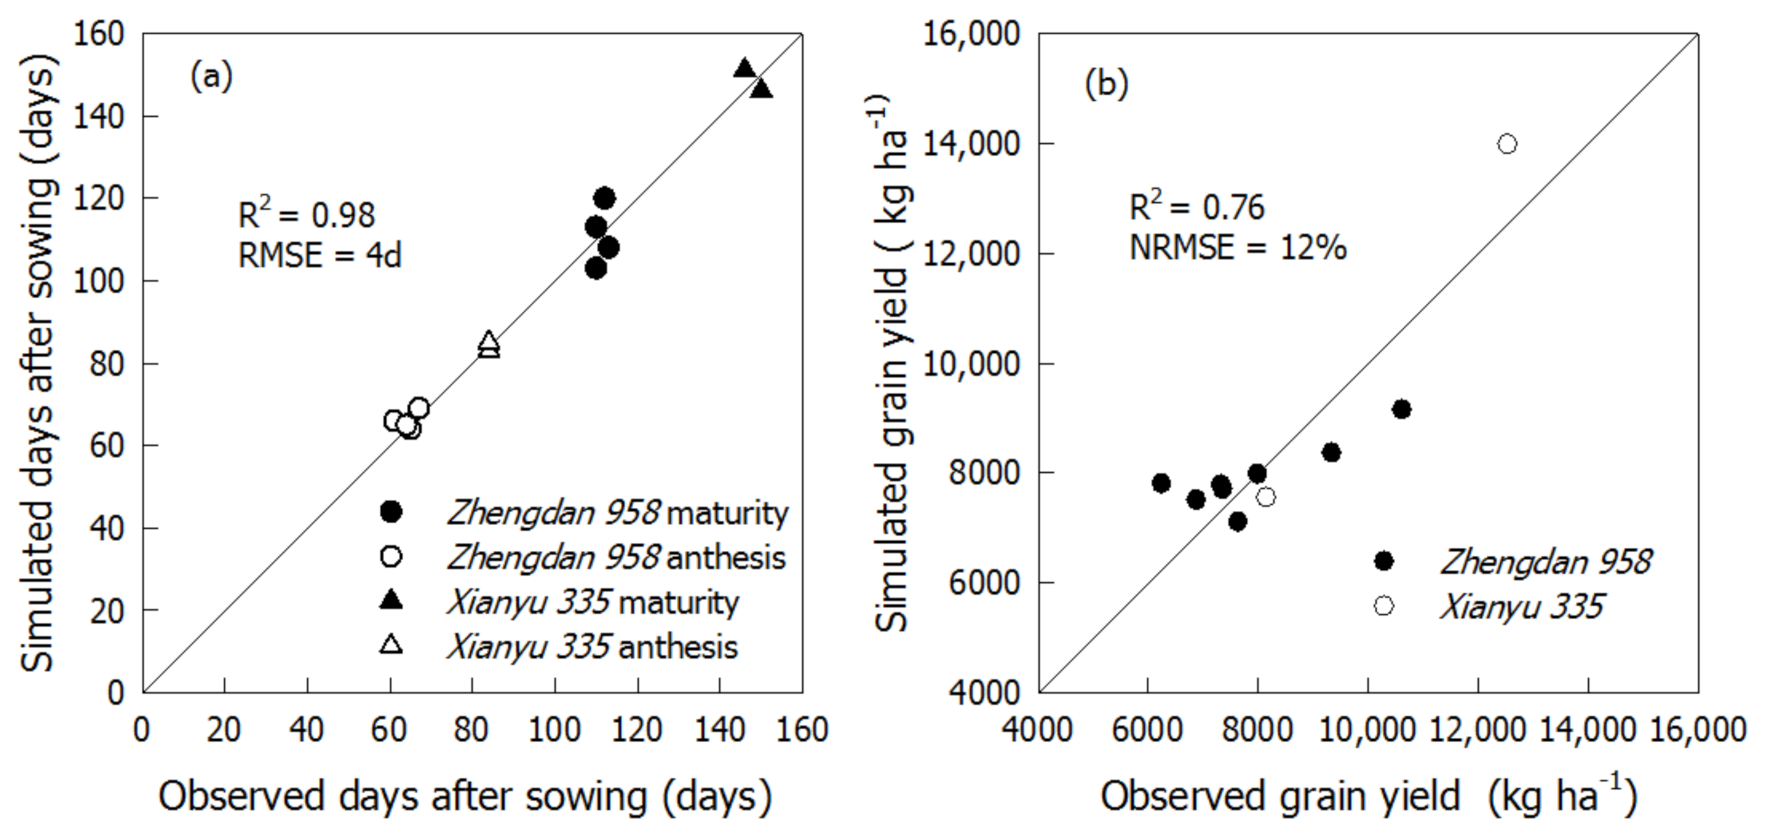
3.1. Model Calibration and Validation

The simulated dates of anthesis and maturity were consistent with the observed dates based on model calibration and validation results (Figure 2a).
The R2 between simulated and observed phenology dates was 0.98 and RMSE was 4 d. The simulated yields also closely followed the observations, with R2 = 0.76 and NRMSE = 12%. It is worth noting that the observed yields of spring maize at Changwu differed greatly in 2017 and 2018. Nevertheless, the yields were still well simulated with the calibrated APSIM-Maize model. Therefore, the results indicated that the APSIM-Maize model could effectively simulate maize growth and development under irrigation and rain-fed conditions in the Guanzhong Plain of China. The calibrated parameters for summer and spring maize are shown in Table 5.

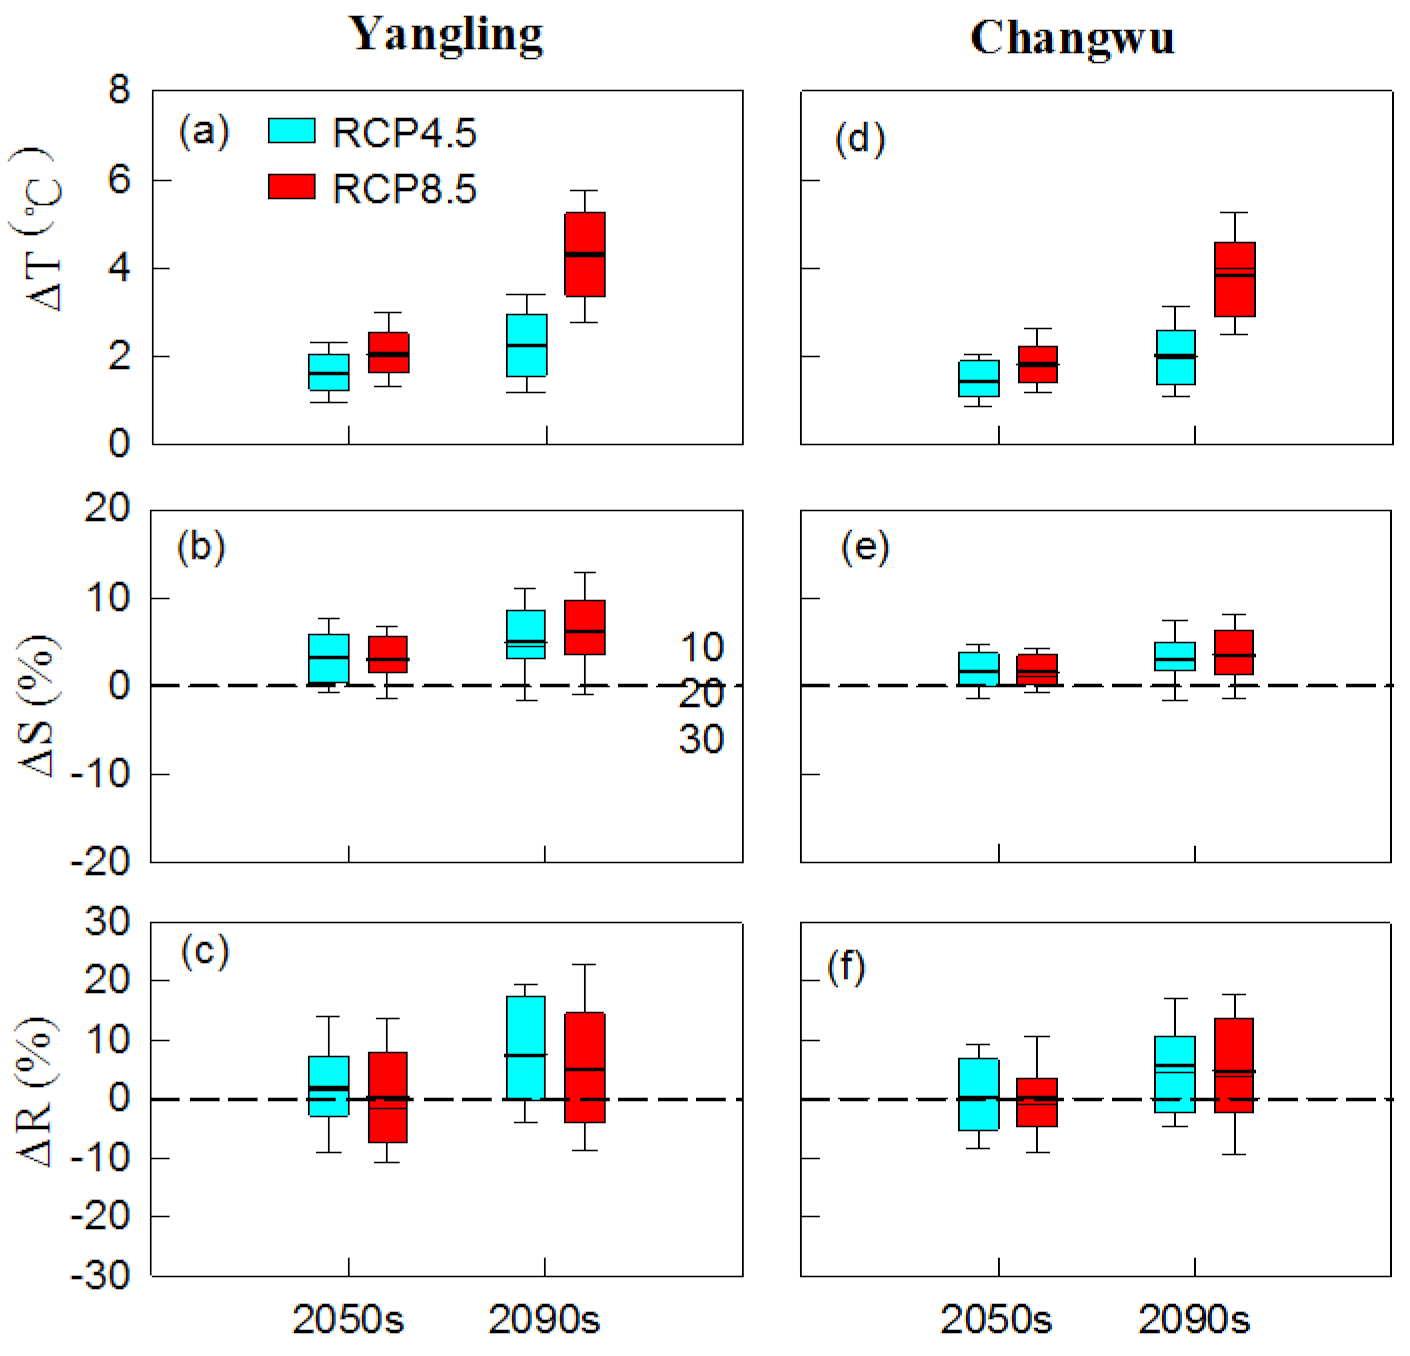
3.2. Climate Change in Maize Growth Period

Compared with the baseline of 1971–2010, projected changes of mean temperature, solar radiation, and rainfall in the maize growing season were calculated at two sites in the 2050s and 2090s under RCP4.5 and RCP8.5 (Figure 3).
In general, all 36 GCMs projected that mean temperature would increase in both sites (Figure 3a,d). Multi-model mean changes were +1.6 °C in the 2050s and +2.3 °C in the 2090s under RCP4.5, and +2.1 °C and +4.3 °C under RCP8.5 in the 2050s and 2090s, respectively, at Yangling. For Changwu, growing season temperature changes were +1.4 °C and +2.0 °C under RCP4.5 and +1.8 °C and +3.8 °C under RCP8.5 in the 2050s and 2090s, respectively. Solar radiation was also projected to increase in the future relative to the baseline according to most GCMs under both RCPs (Figure 3b,e). For Yangling, the multi-model mean increases were 3.2% in the 2050s and 5.0% in the 2090s under RCP4.5, and 3.1% and 6.1% under RCP8.5 in the 2050s and 2090s, respectively. For Changwu, the multi-model mean increases were 1.7% and 3.0% under RCP4.5 and 1.6% and 3.6% under RCP8.5.
The multi-model mean changes of rainfall were similar to other climatic factors and increases were also projected at two sites under both RCPs (Figure 3c,f). In the 2050s and 2090s, there could be an increase of 1.8% and 7.5%, respectively, for Yangling under RCP4.5, and 0.3% and 5.2%, respectively, under RCP8.5. For Changwu, the increases were 0.3% and 5.6% under RCP4.5, and 0.3% and 4.8% under RCP8.5. It should be noted that the projected change of rainfall tended to have wider ranges (10th to 90th) compared with temperature and solar radiation, which means that rainfall projections from the 36 GCMs had large variations.

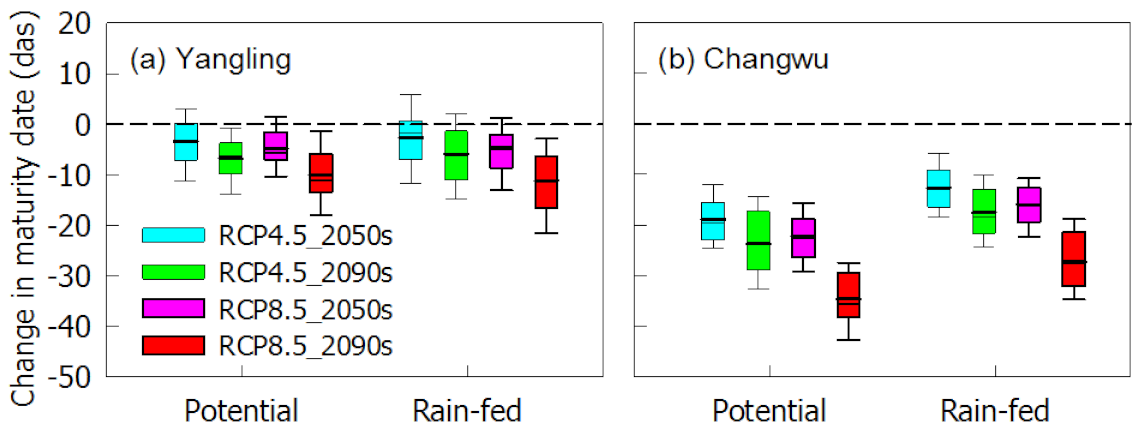
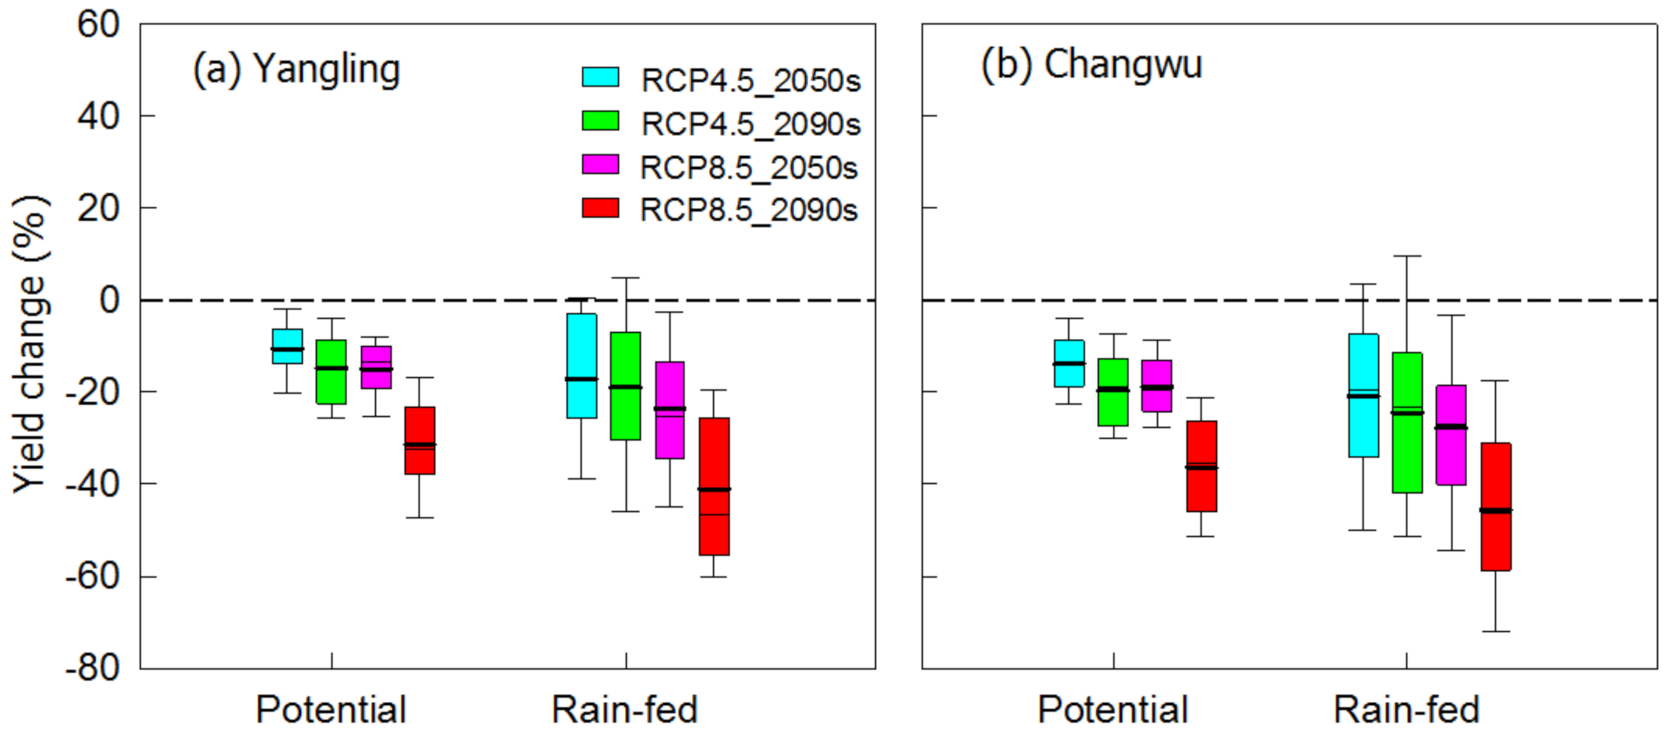
3.3. Impacts of Climate Change on Maize Phenology and Yield

The maize growth period from sowing to maturity shortened at both sites in the future, which was mainly due to the increase in temperature (Figure 4).
In the 2050s and 2090s, the multi-model mean changes of maturity date were −3.5 and −6.8 days under RCP4.5, respectively, −4.8 and −10.0 days under RCP8.5 for summer maize in potential conditions, −2.7 and −6.0 days under RCP4.5, and −4.9 and −11.2 days under RCP8.5 in rain-fed conditions. For spring maize, the multi-model mean changes of maturity date were −18.9 and −23.7 days under RCP4.5, −22.3 and −34.7 days under RCP8.5 in potential conditions, −12.7 and −17.5 days under RCP4.5, and −15.9 and −27.3 days in rain-fed conditions. The shortening of the growth period was more obvious for spring maize in Changwu than for summer maize in Yangling. This was because spring maize was more sensitive to rising temperatures (Table 6). For spring maize, the growth period would shorten by 10.0 and 7.6 days under potential and rain-fed conditions respectively as the mean temperature in growing season increased by one degree, while it would shorten by 2.4 days for summer maize (Table 6).
Future climate change had negative impacts on maize yields at study sites (Figure 5).
In the 2050s and 2090s, the multi-model mean showed that Yp would decrease by −10.6% and −14.9% under RCP4.5 respectively, and −15.0% and −31.4% under RCP8.5 at Yangling. Similarly, Yw would decrease by −17.1% and −19.0% under RCP4.5 and −23.6% and −41.1% under RCP8.5. For Changwu, the multi-model mean showed that Yp would decrease by −13.9% in the 2050s and −19.7% in the 2090s under RCP4.5 and −18.7% and −36.3% under RCP8.5. Yw decreased by −20.9% and −24.5% under RCP4.5 and −27.8% and −45.5% under RCP8.5. Additionally, the changes of yield among 36 GCMs showed a larger variation under rain-fed conditions than that under potential conditions, which was mainly due to the larger variations in projected rainfall change (Figure 3). The results of multiple linear regression analysis indicated that the changes of Yw at the two sites were significantly positively correlated with rainfall change and negatively correlated with temperature change (Table 7). Additionally, we found that there was a significantly negative correlation between changes of Yw and solar radiation at Changwu. Changes in CO2 concentration had no significant effects on maize yield change at the two sites.

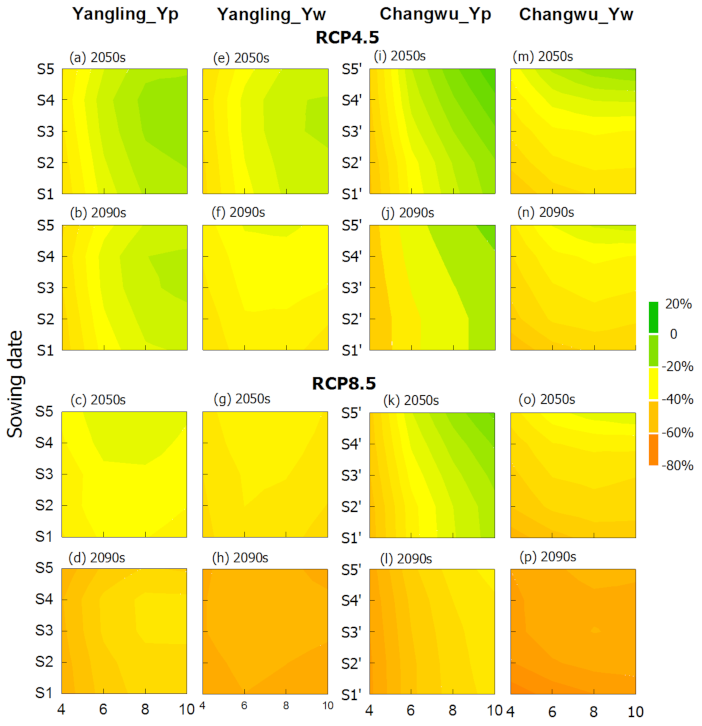
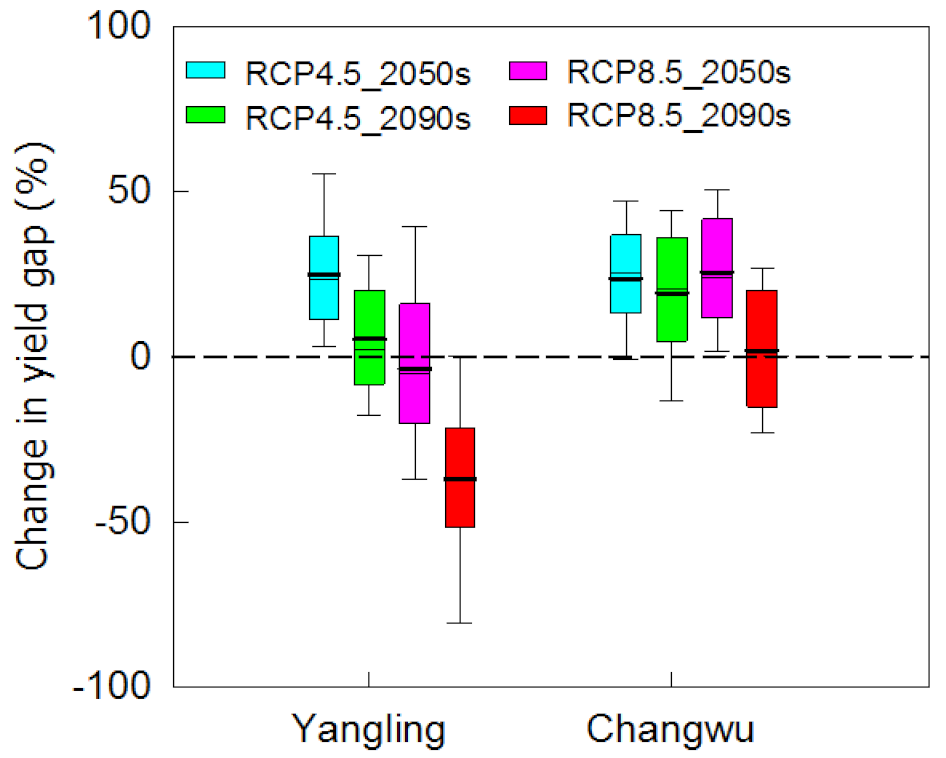
3.4. The Impacts of Interactions of Sowing Dates and Planting Densities on Maize Yield

According to the yield changes under 20 different combinations of sowing dates and planting densities in the future, we found that the negative impacts of climate change could be mitigated or offset by a delayed sowing date and increased planting density across most scenarios for both sites (Figure 6). However, as time advanced from the 2050s to 2090s and projected greenhouse gas concentrations increased from RCP4.5 to RCP8.5, the mitigation efficiency gradually weakened. The optimal combination was delaying sowing time by 1–2 weeks and increasing planting density to 8–10 plants m−2 for summer maize at Yangling (Figure 6). The projected Yp and Yw would still decrease by 0.9–26.9% and 7.2–41.1% under the optimal combination relative to the baseline of 1971–2010 under normal combination. The Yp loss on account of climate change could be alleviated by 2.6–9.7%, and Yw loss could be alleviated by 0–9.9%.
However, the optimal combination for spring maize at Changwu was delaying sowing by two weeks and increasing planting density to 8–10 plants m−2 in all scenarios. The Yp loss due to climate change would be offset completely in the 2050s and 2090s under RCP4.5 and in the 2050s under RCP 8.5 with an increase by 3.2–11.1% compared to the baseline under the normal combination, while the Yp would decrease by 22.3% in the 2090s under RCP8.5. The Yw loss would be offset completely in the 2050s under RCP4.5 with an increase by 0.9%, while the Yw would decrease by 10.1–43.5% in other scenarios. Overall, the Yp and Yw would increase by 14.0–25.0% and 2.0–21.8% under the optimal combination relative to the normal combination in the future for spring maize at Changwu. It was notable that the increase of Yp was more remarkable than Yw across most scenarios, which was because water stress restricted the maize growth and yield improvement under rain-fed conditions. Overall, delaying the sowing date and increasing planting density appropriately would be an effective measure to address the negative impacts of climate change in the future in the Guanzhong Plain.
The Yg between Yp and Yw would increase across most scenarios under the optimal combination relative to the baseline of 1971–2010 under the normal combination. This was because the magnitude of Yp increase with full irrigation was more obvious than Yw with rain-fed conditions under the optimal combination. However, the relative change of Yg would decline as time advanced and projected greenhouse gas concentration increased in the future, especially for summer maize at Yangling (Figure 7). The multi-model mean changes of Yg would be +24.9% in the 2050s and +5.3% in the 2090s under RCP4.5, and −3.7% and −37.2% under RCP8.5 for summer maize in Yangling. At Changwu, Yg would increase by +23.5% in the 2050s and +19.2% in the 2090s under RCP4.5, and +25.4% and +1.8% under RCP8.5 for spring maize.

4. Discussion

4.1. Performance of the APSIM-Maize Model

Our calibrated results showed that the APSIM model simulated maize anthesis and maturity was consistent with the observed values in our study. The determination coefficient R2 for the phenology was 0.98 and the RMSE was 4 days. Similar results were reported for maize in northeast China [35]. Additionally, there is a good agreement between simulated and observed maize yields (R2 = 0.76 and NRMSE = 12%). This is also comparable to previous studies. For example, Ren et al. [21] reported that the APSIM-Maize model performed well in simulating maize yield in the northwest of China (R2 = 0.83–0.95, NRMSE < 20%). Overall, our calibrated results showed that the APSIM-Maize model could effectively simulate the irrigated and rain-fed maize in the Guanzhong Plain.

4.2. Impacts of Future Climate Change on Maize

In our study, many GCMs were used to capture the variations in future climate projections. We found that the mean temperature in maize growing season would increase by 1.4–4.3 °C. The solar radiation and rainfall would increase by 1.6–6.1% and 0.3–7.5%, respectively. The results were consistent with previous studies. Zhang and Liu [46] reported a 2.3–5.3 °C rise in temperature for 2070–2099 relative to the baseline of 1950–1999 in the Guanzhong Plain of China. Zhang et al. [47] projected the solar radiation for 2021–2100 would increase by 0–0.8 MJ m−2 from May to September based on 28 GCMs in the Northeast China Plain. Yu and Xiang [48] projected about 10% increase for area-averaged precipitation for 2046–2065 compared to the baseline of 1986–2005 in the northwest China.
The growth periods for summer and spring maize would be shortened due to climate warming in the future. The results were consistent with a previous study by Tao and Zhang [49], which indicated that the growing season of irrigated maize would be shortened by 4.2%−30.3% with a temperature rise of 1–3 °C in China. The irrigated maize was shortened more than rain-fed maize, which is mainly caused by the interactions between temperature rising and water stress. Drought stress during the growth period is likely to prolong the growth period of maize [50].
Furthermore, we found that spring maize was shortened more than summer maize because spring maize was more sensitive to warming than summer maize (Table 6). Although the increase of CO2 content and rainfall can improve the photosynthetic rate and produce higher yields [51], increased temperature has negative impacts on maize yield as it accelerates phenological development, resulting in less intercepted nutrition and radiation, decrease of photosynthesis, and an increase of respiration [52,53]. Overall, the simulated maize yield for both varieties would decline across all future scenarios with a more obvious variability for Yw among GCMs than Yp. The decrease of Yw for both varieties was also more than Yp under all scenarios. This showed that there are drought stresses for rain-fed maize in the Guanzhong Plain, and future temperature rising will aggravate the drought stress of rain-fed maize. We used the multiple linear regression analysis to quantify how each climatic factor change would affect yield change. The results showed that the changes of Yw for both varieties were significantly negatively correlated with rising temperatures, and positively correlated with increased rainfall. Therefore, the decreased rain-fed yield was mainly due to the negative impacts of rising temperatures outweighing the positive effects of increased rainfall. Using longer-season maize cultivars should be a priority for the Guanzhong Plain.

4.3. Impacts of Sowing Dates and Planting Densities on Maize

It is of great significance to explore agronomic countermeasures for coping with the negative impacts of future climate change on maize growth. Sowing date is generally determined by local agricultural climatic resources [54]. Appropriate sowing dates are able to take full advantage of local ecological resources such as precipitation and light and avoid adverse conditions in the maize growing season [55]. Additionally, optimizing planting density is likely to improve crop canopy structure, distribution of light, and heat resources [56].
In this study, we found that properly delaying the sowing date and increasing planting density could effectively offset the negative effects of future climate change. The optimal combination was delaying the sowing date by 1–2 weeks with a planting density of 8–10 plants m−2. The loss of Yp and Yw on account of climate change could be reduced by 2.6–9.7% and 0–9.9% for summer maize, and by 14.0–25.0% and 2.0–21.8% for spring maize, respectively. The influence of the optimal combination was more obvious for Yp. This is mainly because increasing density will require more water for maize growth. Water stress is still a key factor to limit yield increase under rain-fed conditions although the optimal combination has a potential to optimize local climatic resources in the maize growth period. It shows that drought stress will not only directly affect the growth and development of maize, but also restrain the effects of optimal measures. Our adaptation options contributed more to yield increase for spring maize than summer maize under potential and rain-fed conditions. This indicated that the optimal combinations are more effective for spring maize with a longer growth period. Additionally, we found that the efficiency of optimal combinations will weaken when climate changes become more severe. Therefore, it is important to breed adapted varieties with a longer growing season. This was consistent with the study of Harrison et al. [16], which reported that the use of maize varieties with a longer growing season can avoid maize yield loss under future climate change.
Our results showed that the yield gap between potential yield and rain-fed yield would increase in most scenarios under future optimal combinations, because the YP increased more than Yw. In other words, it was possible for a considerable increase in maize yield through irrigation under future climate scenarios. Additionally, previous studies found that plastic film mulching and stubble mulching were effective ways to increase crop water productivity and save water [57,58]. Therefore, it is important to consider water retention strategies to explore the response of yield to climate change. However, the yield gap would decline with time period and emission scenarios, especially for summer maize. This is likely because the effect of optimal combination on Yw is more than Yp under the high emission scenario RCP8.5 at Yangling.

4.4. Limitations of This Study

In this study, we evaluated the possible changes in maize yield simulated by the APSIM-Maize model under future climate change based on a total of 36 GCMs under two greenhouse emission scenarios of RCP4.5 and RCP8.5. However, there are some uncertainties and limitations in our study, similar to most studies on climate change impacts on crop production with biophysical models. Firstly, only one crop model was used. The current results based on a single crop model are likely to be overestimated or underestimated [59]. Multiple crop model simulations have been proposed as a more robust approach for assessing climate change impacts on crop yields [60,61]. Meanwhile, we simulated maize growth under full irrigation and rain-fed conditions with current maize varieties, and we did not consider cultivar shift and the impacts of extreme climate events, weeds, and pests. Furthermore, the climate characteristics such as precipitation show large spatial differences in northwest China [62]. We only selected two sites, which may not reflect the spatial variance in terms of yield response to future climate change.

5. Conclusions

In this study, we used field experimental data to validate the APSIM-Maize model and found it performed well in the Guanzhong Plain of China. Our modeling results showed that climate change would have adverse impacts on maize yield in the study area. Therefore, it is necessary to investigate the potential of adaptation measures to cope with these negative impacts. We found that delaying the sowing date by 1–2 weeks and increasing plant density to 8–10 plants m−2 could effectively mitigate the negative impacts of climate change in the Guanzhong Plain. The loss of potential and rain-fed yield could be mitigated by 2.6–9.7% and 0–9.9% for summer maize and by 14.0–25.0% and 2.0–21.8% for spring maize, respectively. The contribution of optimal sowing date and plant density on yield increases was more for spring maize than summer maize under both potential and rain-fed conditions. Therefore, our adaption options were more effective for spring maize with a longer growing season. To maintain or increase yield potential in response to the projected climate change, it is important to use a longer season maize cultivar under optimal sowing date and plant density for the Guanzhong Plain. Additionally, we found that the influences of changing sowing date and planting density on maize yield become weak as climate changes become more severe in the future. Therefore, it is necessary to investigate the potential of other adaptation measures to cope with climate change in the Guanzhong Plain of China.

Author Contributions

Conceptualization, B.W., D.L.L. and J.H.; methodology, B.W., D.L.L., J.H. and F.X.; software, B.W., D.L.L. and F.X.; validation, F.X., C.H., P.F. and N.Y.; formal analysis, J.H.; investigation, J.H., J.X., R.Z., S.X. and F.X.; resources, J.H., J.X., R.Z. and S.X.; data curation, B.W., D.L.L., J.H., J.X., R.Z., F.X. and S.X.; writing—original draft preparation, F.X.; writing—review and editing, B.W., J.H. and P.F.; visualization, F.X.; supervision, J.H.; project administration, J.H., H.F. and Q.Y.; funding acquisition, J.H., H.F. and Q.Y. All authors have read and agreed to the published version of the manuscript.

Funding

This research was funded by the Natural Science Foundation of China, grant number 52079115 and 41961124006; the Key Research and Development Program of Shaanxi, grant number 2019ZDLNY07-03.

Acknowledgments

We thank Bernie Dominiak for his editing and review to improve the readability of the manuscript.

Conflicts of Interest

The authors declare no conflict of interest.

References

  1. Stocker, T. Climate Change 2013: The Physical Science Basis: Working Group I Contribution to the Fifth Assessment Report of the Intergovernmental Panel on Climate Change; Cambridge University Press: Cambridge, UK, 2014. [Google Scholar]
  2. Reynolds, M.P.; Reynolds, M.P. Climate Change and Crop Production; Centre for Agriculture and Bioscience International: Wallingford, UK, 2010. [Google Scholar]
  3. Piao, S.; Ciais, P.; Huang, Y.; Shen, Z.; Peng, S.; Li, J.; Zhou, L.; Liu, H.; Ma, Y.; Ding, Y. The impacts of climate change on water resources and agriculture in China. Nature 2010, 467, 43–51. [Google Scholar] [CrossRef]
  4. Tao, F.; Yokozawa, M.; Hayashi, Y.; Lin, E. Future climate change, the agricultural water cycle, and agricultural production in China. Agric. Ecosyst. Environ. 2003, 95, 203–215. [Google Scholar] [CrossRef]
  5. Xu, Z.; Yagasaki, Y.; Ito, S.; Zheng, Y.; Zhou, G. Interactive Effects of Elevated CO, Drought, and Warming on Plants. J. Plant Growth Regul. 2013, 32, 692–707. [Google Scholar] [CrossRef]
  6. FAO. FAOSTAT—Agriculture Database. 2016. Available online: http://faostat.fao.org/ (accessed on 15 March 2020).
  7. Dai, J. From the Past Centennial Progress to More Brilliant Achievements in the Future: The History and Prospects of Maize Industrialization in China. J. Agric. 2018, 8, 74–79, (In Chinese with English Abstract). [Google Scholar]
  8. National Statistical Bureau of China. China Rural Statistical Yearbook 2017; China Statistics Press: Beijing, China, 2017. [Google Scholar]
  9. IPCC. Climate change 2014: Impacts, adaptation, and vulnerability. In Part A: Global and Sectoral Aspects. Contribution of Working Group II to the Fifth Assessment Report of the Intergovernmental Panel on Climate Change; Field, C.B., Barros, V.R., Dokken, D.J., Mach, K.J., Mastrandrea, M.D., Bilir, T.E., Chatterjee, M., Ebi, K.L., Estrada, Y.O., Genova, R.C., Eds.; IPCC: Geneva, Switzerland, 2014. [Google Scholar]
  10. Kassie, B.T.; Asseng, S.; Rotter, R.P.; Hengsdijk, H.; Ruane, A.C.; Ittersum, M.K.V. Exploring climate change impacts and adaptation options for maize production in the Central Rift Valley of Ethiopia using different climate change scenarios and crop models. Clim. Chang. 2015, 129, 145–158. [Google Scholar] [CrossRef]
  11. Ramirez, V.J.; Thornton, P.K. Climate Change Impacts on African Crop Production; Agriculture and Food Security (CCAFS) Working Paper; CGIAR Research Program on Climate Change: Copenhagen, Denmark, 2015; Volume 119, pp. 1–25. [Google Scholar]
  12. Deryng, D.; Conway, D.; Ramankutty, N.; Price, J.; Warren, R. Global crop yield response to extreme heat stress under multiple climate change futures. Environ. Res. Lett. 2014, 9, 034011. [Google Scholar] [CrossRef] [Green Version]
  13. Rosenzweig, C.; Elliott, J.; Deryng, D.; Ruane, A.C.; Müller, C.; Arneth, A.; Boote, K.J.; Folberth, C.; Glotter, M.; Khabarov, N. Assessing agricultural risks of climate change in the 21st century in a global gridded crop model intercomparison. Proc. Natl. Acad. Sci. USA 2014, 111, 3268–3273. [Google Scholar] [CrossRef] [Green Version]
  14. Ureta, C.; González, E.J.; Espinosa, A.; Trueba, A.; Piñeyro-Nelson, A.; Álvarez-Buylla, E.R. Maize yield in Mexico under climate change. Agric. Syst. 2020, 177, 102697. [Google Scholar] [CrossRef]
  15. Chen, P.; Liu, Y. The impact of Climate Change on Summer Maize Phenology in the Northwest Plain of Shandong Province under the IPCC SRES A1B Scenario; IOP Publishing: Bristol, UK, 2014; p. 012053. [Google Scholar]
  16. Harrison, L.; Michaelsen, J.; Funk, C.; Husak, G. Effects of temperature changes on maize production in Mozambique. Clim. Res. 2011, 46, 211–222. [Google Scholar] [CrossRef] [Green Version]
  17. Cuculeanu, V.; Marica, A.; Simota, C. Climate change impact on agricultural crops and adaptation options in Romania. Clim. Res. 1999, 12, 153–160. [Google Scholar] [CrossRef] [Green Version]
  18. Traore, B.; Descheemaeker, K.; Van Wijk, M.T.; Corbeels, M.; Supit, I.; Giller, K.E. Modelling cereal crops to assess future climate risk for family food self-sufficiency in southern Mali. Field Crop. Res. 2017, 201, 133–145. [Google Scholar] [CrossRef] [Green Version]
  19. Seyoum, S.; Rachaputi, R.; Chauhan, Y.; Prasanna, B.; Fekybelu, S. Application of the APSIM model to exploit G×E×M interactions for maize improvement in Ethiopia. Field Crop. Res. 2018, 217, 113–124. [Google Scholar] [CrossRef]
  20. Lv, S.; Yang, X.G.; Lin, X.M.; Liu, Z.J.; Zhao, J.; Li, K.N.; Mu, C.Y.; Chen, X.C.; Chen, F.J.; Mi, G.H. Yield gap simulations using ten maize cultivars commonly planted in Northeast China during the past five decades. Agric. For. Meteorol. 2015, 205, 1–10. [Google Scholar] [CrossRef]
  21. Ren, X.; Sun, D.; Wang, Q. Modeling the effects of plant density on maize productivity and water balance in the Loess Plateau of China. Agric. Water Manag. 2016, 171, 40–48. [Google Scholar] [CrossRef]
  22. Sun, H.; Zhang, X.; Wang, E.; Chen, S.; Shao, L.; Qin, W. Assessing the contribution of weather and management to the annual yield variation of summer maize using APSIM in the North China Plain. Field Crop. Res. 2016, 194, S0378429016301526. [Google Scholar] [CrossRef]
  23. Duan, M. Study on Nutrients Management and High Yield of Wheat and Maize in Guan Zhong Area of Shaanxi Province; Northweast A & F University: Yangling, China, 2020. [Google Scholar]
  24. Angstrom, A.S. Solar and terrestrial radiation. Report to the international commission for solar research on actinometric investigations of solar and atmospheric radiation. Q. J. R. Meteorol. Soc. 1924, 50, 121–126. [Google Scholar] [CrossRef]
  25. Liu, D.; Zuo, H. Statistical downscaling of daily climate variables for climate change impact assessment over New South Wales, Australia. Clim. Chang. 2012, 115, 629–666. [Google Scholar] [CrossRef]
  26. Richardson, C.W.; Wright, D.A. WGEN: A Model for Generating Daily Weather Variables; US Department of Agriculture, Agricultural Research Service: Washington, DC, USA, 1984; p. 83.
  27. Liu, D.L.; Zeleke, K.T.; Wang, B.; Macadam, I.; Scott, F.; Martin, R.J. Crop residue incorporation can mitigate negative climate change impacts on crop yield and improve water use efficiency in a semiarid environment. Eur. J. Agron. 2017, 85, 51–68. [Google Scholar] [CrossRef] [Green Version]
  28. Wang, J.; Wang, E.; Luo, Q.; Kirby, M. Modelling the sensitivity of wheat growth and water balance to climate change in Southeast Australia. Clim. Chang. 2009, 96, 79–96. [Google Scholar] [CrossRef]
  29. Wang, B.; Liu, D.L.; Asseng, S.; Macadam, I.; Qiang, Y. Impact of climate change on wheat flowering time in eastern Australia. Agric. For. Meteorol. 2015, 209-210, 11–21. [Google Scholar] [CrossRef]
  30. Yang, Y.; Liu, D.L.; Anwar, M.R.; Zuo, H.; Yang, Y. Impact of future climate change on wheat production in relation to plant-available water capacity in a semiaridenvironment. Theor. Appl. Climatol. 2014, 115, 391–410. [Google Scholar] [CrossRef]
  31. Yang, Y.; Liu, D.L.; Anwar, M.R.; O’Leary, G.; Macadam, I.; Yang, Y. Water use efficiency and crop water balance of rainfed wheat in a semi-arid environment: Sensitivity of future changes to projected climate changes and soil type. Theor. Appl. Climatol. 2016, 123, 565–579. [Google Scholar] [CrossRef]
  32. Keating, B.A.; Carberry, P.S.; Hammer, G.L.; Probert, M.E.; Robertson, M.J.; Holzworth, D.; Huth, N.I.; Hargreaves, J.N.G.; Meinke, H.; Hochman, Z. An overview of APSIM, a model designed for farming systems simulation. Eur. J. Agron. 2003, 18, 267–288. [Google Scholar] [CrossRef] [Green Version]
  33. Mccown, R.L.; Hammer, G.L.; Hargreaves, J.N.G.; Holzworth, D.P.; Freebairn, D.M. APSIM: A novel software system for model development, model testing and simulation in agricultural systems research. Agric. Syst. 1996, 50, 255–271. [Google Scholar] [CrossRef]
  34. Liu, Z.; Yang, X.; Hubbard, K.G.; Lin, X. Maize potential yields and yield gaps in the changing climate of Northeast China. Glob. Chang. Biol. 2012, 18, 3441–3454. [Google Scholar] [CrossRef]
  35. Liu, Z.J.; Yang, X.G.; Wang, J.; Shuo, L.; Ke-Nan, L.I.; Xun, X. Adaptability of APSIM Maize Model in Northeast China. Acta Agron. Sin. 2012, 38, 740–746. [Google Scholar] [CrossRef]
  36. He, D.; Wang, E.; Wang, J.; Lilley, J.; Luo, Z.; Pan, X.; Pan, Z.; Yang, N. Uncertainty in canola phenology modelling induced by cultivar parameterization and its impact on simulated yield. Agric. For. Meteorol. 2017, 232, 163–175. [Google Scholar] [CrossRef]
  37. Evans, L.T.; Fischer, R.A. Yield potential: Its definition, measurement, and significance. Crop Sci. 1999, 39, 1544–1551. [Google Scholar] [CrossRef]
  38. Grassini, P.; Yang, H.; Cassman, K.G. Limits to maize productivity in Western Corn-Belt: A simulation analysis for fully irrigated and rainfed conditions. Agric. For. Meteorol. 2009, 149, 1254–1265. [Google Scholar] [CrossRef] [Green Version]
  39. Van Ittersum, M.K.; Rabbinge, R. Concepts in production ecology for analysis and quantification of agricultural input-output combinations. Field Crop. Res. 1997, 52, 197–208. [Google Scholar] [CrossRef]
  40. Ma, G.; Xue, J.; Lu, H.; Zhang, R.; Tai, S.; Ren, J. Effects of planting date and density on population physiological indices of summer corn in central Shaanxi irrigation area. Chin. J. Appl. Ecol. 2007, 18, 1247–1253, (In Chinese with English abstract). [Google Scholar]
  41. Zhang, R.; Wang, B.; Yang, Y.; Yang, X.; Ma, X.; Zhang, X.; Hao, Y.; Xue, J. Characteristics of dry matter and nitrogen accumulation for high-yielding maize production under irrigated conditions of Shaanxi. Sci. Agric. Sin. 2017, 50, 2238–2246, (In Chinese with English Abstract). [Google Scholar]
  42. Wang, B.; Liu, D.L.; Asseng, S.; Macadam, I.; Yu, Q. Modelling wheat yield change under CO2 increase, heat and water stress in relation to plant available water capacity in eastern Australia. Eur. J. Agron. 2017, 90, 152–161. [Google Scholar] [CrossRef]
  43. Liu, D.L.; Anwar, M.R.; O’Leary, G.; Conyers, M.K. Managing wheat stubble as an effective approach to sequester soil carbon in a semi-arid environment: Spatial modelling. Geoderma 2014, 214-215, 50–61. [Google Scholar] [CrossRef]
  44. Wallach, D.; Goffinet, B. Mean Squared Error of Prediction in Models for Studying Ecological and Agronomic Systems. Biometrics 1987, 43, 561–573. [Google Scholar] [CrossRef]
  45. Willmott, C.J. Some comments on the evaluation of model performance. Bull. Am. Meteorol. Soc. 1982, 63, 1309–1313. [Google Scholar] [CrossRef] [Green Version]
  46. Zhang, X.C.; Liu, W.-Z. Simulating potential response of hydrology, soil erosion, and crop productivity to climate change in Changwu tableland region on the Loess Plateau of China. Agric. For. Meteorol. 2005, 131, 127–142. [Google Scholar] [CrossRef]
  47. Zhang, H.; Zhou, G.; Li Liu, D.; Wang, B.; Xiao, D.; He, L. Climate-associated rice yield change in the Northeast China Plain: A simulation analysis based on CMIP5 multi-model ensemble projection. Sci. Total Environ. 2019, 666, 126–138. [Google Scholar] [CrossRef]
  48. Yu, E.; Xiang, W. Projected climate change in the northwestern arid regions of China: An ensemble of regional climate model simulations. Atmos. Ocean. Sci. Lett. 2015, 8, 134–142. [Google Scholar]
  49. Tao, F.L.; Zhang, Z. Impacts of climate change as a function of global mean temperature: Maize productivity and water use in China. Clim. Chang. 2011, 105, 409–432. [Google Scholar] [CrossRef]
  50. Song, L.; Yao, N.; Feng, H.; Bai, J.; Wu, S.; He, J. Effects of water stresses at different growth stages on development and yields of summer maize in arid region. J. Maize Sci. 2016, 24, 63–73, (In Chinese with English Abstract). [Google Scholar]
  51. Walker, B.H. Global change strategy options in the extensive agriculture regions of the world. Clim. Chang. 1994, 27, 39–47. [Google Scholar] [CrossRef]
  52. Abbas, G.; Ahmad, S.; Ahmad, A.; Nasim, W.; Fatima, Z.; Hussain, S.; Rehman, M.H.U.; Khan, M.A.; Hasanuzzaman, M.; Fahad, S. Quantification the impacts of climate change and crop management on phenology of maize-based cropping system in Punjab, Pakistan. Agric. For. Meteorol. 2017, 247, 42–55. [Google Scholar] [CrossRef]
  53. Shang, Z. The Potential Impacts of Global Climate Change on Spring maize Growth in Shenyang. Acta Bot. Sin. 2000, 42, 300–305. [Google Scholar]
  54. Waha, K.; Van Bussel, L.; Müller, C.; Bondeau, A. Climate-driven simulation of global crop sowing dates. Glob. Ecol. Biogeogr. 2012, 21, 247–259. [Google Scholar] [CrossRef]
  55. Lu, H.; Xue, J.; Zhang, D.; Ma, G.; Wang, L. Potentials and Approaches to Maize Super High Yield in Different Ecotopes of Shaanxi Province. J. Xi’ Univ. Arts Sci. 2007, 10, 20–24, (In Chinese with English Abstract). [Google Scholar]
  56. Casal, J.J.; Deregibus, V.A.; Sánchez, R.A. Variations in tiller dynamics and morphology in Lolium multiflorum lam. Vegetative and reproductive plants as affected by differences in red/far-red irradiation. Ann. Bot. 1985, 56, 553–559. [Google Scholar] [CrossRef]
  57. Li, S.; Wang, Y.; Fan, T.; Wang, L.; Zhao, G.; Tang, X.; Dang, Y.; Wang, L.; Zhang, J. Effects of different plastic film mulching modes on soil moisture, temperature and yield of dryland maize. Sci. Agric. Sin. 2010, 43, 922–931. [Google Scholar]
  58. Liu, Q.; Du, S.; Yin, H.; Wang, J. Relationship between Water and Carbon Utilization under Different Straw Mulching and Plant Density of Summer Maize in North China Plain. IOP Conf. Ser. Mater. Sci. Eng. IOP Conf. 2018, 322, 042005. [Google Scholar] [CrossRef]
  59. Mao, X.; Yang, J.; Zhu, X.; He, C.; Feng, H.; He, J. Simulation accuracy of growth and development of winter rape in Guanzhong plain with different crop models. Trans. Chin. Soc. Agric. Mach. 2019, 50, 306–314. [Google Scholar]
  60. Webber, H.; Martre, P.; Asseng, S.; Kimball, B.; White, J.; Ottman, M.; Wall, G.W.; De Sanctis, G.; Doltra, J.; Grant, R. Canopy temperature for simulation of heat stress in irrigated wheat in a semi-arid environment: A multi-model comparison. Field Crop. Res. 2017, 202, 21–35. [Google Scholar] [CrossRef]
  61. Yin, X.; Kersebaum, K.C.; Kollas, C.; Baby, S.; Beaudoin, N.; Manevski, K.; Palosuo, T.; Nendel, C.; Wu, L.; Hoffmann, M. Multi-model uncertainty analysis in predicting grain N for crop rotations in Europe. Eur. J. Agron. 2017, 84, 152–165. [Google Scholar] [CrossRef]
  62. Zhang, Z.; Chen, S.; Yang, X.; Li, Q. Precipitation change in eastern part of northwest China: Spatial distribution and mutation characteristics. J. Agric. 2017, 70, 84–89, (In Chinese with English Abstract). [Google Scholar]
Figure 1. Locations of the two representative experimental sites of Yangling and Changwu in the Guanzhong Plain of Shaanxi Province, China.
Agronomy 11 01452 g001
Figure 2. Simulated and observed durations from sowing to anthesis and maturity (a) and yields (b) for “Zhengdan 958” at Yangling and “Xianyu 335” at Changwu in the Guanzhong Plain of China.
Agronomy 11 01452 g002
Figure 3. Changes in growing season mean temperature (ΔT; a,d), solar radiation (ΔS; b,e), and rainfall (ΔR; c,f) in the 2050s and 2090s under RCP4.5 and RCP8.5 based on 36 GCMs relative to the baseline of 1971–2010 for Yangling (June–October; a–c) and Changwu (April–October; d–f) in the Guanzhong Plain of China. The box boundaries indicate the 25th and 75th percentiles; the black thin and thick lines within the box mark the median and mean, respectively; whiskers below and above the box indicate the 10th and 90th percentiles.
Agronomy 11 01452 g003
Figure 4. Changes in maize growth period under potential and rain-fed conditions with normal sowing dates and planting density in the 2050s and 2090s under RCP4.5 and RCP8.5 scenarios based on the 36 GCMs relative to the baseline of 1971–2010 for Yangling (a) and Changwu (b) in the Guanzhong Plain of China. The box boundaries indicate the 25th and 75th percentiles; the black thin and thick lines within the box mark the median and mean, respectively; whiskers below and above the box indicate the 10th and 90th percentiles.
Agronomy 11 01452 g004
Figure 5. Changes in maize potential yield and rain-fed yield with normal sowing date and planting density in the 2050s and 2090s under RCP4.5 and RCP8.5 scenarios based on the 36 GCMs relative to the baseline of 1971–2010 for Yangling (a) and Changwu (b) in the Guanzhong Plain of China. The box boundaries indicate the 25th and 75th percentiles; the black thin and thick lines within the box mark the median and mean, respectively; whiskers below and above the box indicate the 10th and 90th percentiles.
Agronomy 11 01452 g005
Figure 6. Changes in maize potential yield (Yp) and rain-fed yield (Yw) under 20 combinations of sowing dates and planting densities in the 2050s and 2090s under the RCP4.5 and RCP8.5 scenarios based on the 36 GCMs compared to the baseline of 1971–2010 under normal combination for Yangling (a–h) and Changwu (i–p) in the Guanzhong Plain of China. The y-axis indicates five sowing dates, 25 May (S1), 1 June (S2), 8 June (S3), 15 June (S4), and 22 June (S5) for summer maize at Yangling, and 5 April (S1’), 12 April (S2’), 19 April (S3’), 26 April (S4’), and 3 May (S5’) for spring maize at Changwu.
Agronomy 11 01452 g006
Figure 7. Changes in yield gap under optimal combination of sowing date and planting density in the 2050s and 2090s under RCP4.5 and RCP8.5 scenarios based on the 36 GCMs relative to baseline of 1971–2010 under normal combination for Yangling and Changwu in the Guanzhong Plain of China. The box boundaries indicate the 25th and 75th percentiles; the black thin and thick lines within the box mark the median and mean, respectively; whiskers below and above the box indicate the 10th and 90th percentiles.
Agronomy 11 01452 g007
Table 1. Average temperature (°C), rainfall (mm), and solar radiation (MJ m−2) during the growing seasons of summer maize (June–October) and spring maize (April–October) at Yangling and Changwu.
SiteMaize TypeLatitude
(°N)
Longitude
(°E)
Tmean
(°C)
Rainfall
(mm)
Solar Radiation
(MJ m−2)
YanglingSummer34.35108.1724.1136218.12
ChangwuSpring35.21107.8117.8046918.74
Table 2. Detailed information for field experiments at Yangling and Changwu.
SiteVarietyYearSowing Date
(dd/mm)
Maturity Date
(dd/mm)
Fertilization
(kg N ha−1)
Irrigation
(mm)
Density
(plants m−2)
YanglingZhengdan 958
(summer maize)
2009–201210/06–13/0629/09–02/1013740–506; 7.5
ChangwuXianyu 335
(spring maize)
2017–201826/0417/09–23/0922506.5
Table 3. Soil properties at Yangling and Changwu.
SitesSoil Layer
(cm)
Bulk Density
(g cm−3)
Wilting Point
(mm3 mm−3)
Field Capacity
(mm3 mm−3)
Saturation
(mm3 mm−3)
Organic Carbon
(%)
Total Nitrogen
(%)
Yangling0~201.260.150.250.430.760.10
20~401.350.160.260.450.680.10
40~601.300.160.260.440.610.09
60~801.320.140.290.350.540.08
80~1001.350.150.240.300.550.08
Changwu0~201.270.110.280.510.850.10
20~401.350.100.280.480.630.09
40~601.300.090.290.480.550.08
60~801.250.110.290.470.580.06
80~1001.250.090.270.460.580.06
Table 4. List of the 36 global climate models (GCMs).
IDCodeNameInstituteCountry
1AC1ACCESS1-0CSIRO and BoMAustralia
2AC2ACCESS1-3CSIRO and BoMAustralia
3BC1BCC-CSM1.1(m)BCCChina
4BC2BCC-CSM1.1BCCChina
5BNUBNU-ESMGCESSChina
6CaECanESM2CCCMACanada
7CCSCCSM4NCARUSA
8CE1CESM1(BGC)NSF-DOE-NCARUSA
9CE2CESM1(BGC)NSF-DOE-NCARUSA
10CE5CESM1(BGC)NSF-DOE-NCARUSA
11CM2CESM1(CAM5)NSF-DOE-NCARUSA
12CM3CESM1(WACCM)NSF-DOE-NCARUSA
13CN1CNRM-CM5CNRM-CERFACSFrance
14CSICSIRO-Mk3.6.0CSIRO-QCCCEAustralia
15ECEEC-EARTHEC-EARTHEurope
16FIOFIO-ESMFIOChina
17GE1GISS-E2-HNASA GISSUSA
18GE2GISS-E2-H-CCNASA GISSUSA
19GE3GISS-E2-RNASA GISSUSA
20GF2GFDL-CM3NOAA GFDLUSA
21GF3GFDL-ESM2GNOAA GFDLUSA
22GF4GFDL-ESM2MNOAA GFDLUSA
23HA5HadGEM2-AONIMR/KMAKorea
24HA6HadGEM2-CCMOHCUK
25INCINM-CM4INMRussia
26IP1IPSL-CM5A-LRIPSLFrance
27IP2IPSL-CM5A-MRIPSLFrance
28IP3IPSL-CM5B-LRIPSLFrance
29MI2MIROC5MIROCJapan
30MI3MIROC-ESMMIROCJapan
31MI4MIROC-ESM-CHEMMIROCJapan
32MP1MPI-ESM-LRMPI-MGermany
33MP2MPI-ESM-MRMPI-MGermany
34MR3MRI-CGCM3MRIJapan
35NE1NorESM1-MNCCNorway
36NE2NorESM1-MENCCNorway
Table 5. Genetic parameters for summer and spring maize.
Cultivar Parameter NameDescriptionValues
Zhengdan 958Xianyu 335
tt_emerg_to_endjuv, °C dThermal accumulation from emergence to end of jointing170120
tt_endjuv_to_init, °C dThermal accumulation from end of jointing to early flowering3030
tt_flower_to_start_grain, °C dThermal accumulation from flowering to start of grain filling200120
tt_flower_to_maturity, °C dThermal accumulation from flowering to maturity600900
head_grain_no_max, kernel head−1The maximum kernel per plant700660
grain_gth_rate, mg grain−1 day−1Potential rate of grain filling9.57.1
photoperiod_slope, °C hours−1Photoperiod of slope108
Table 6. Coefficients in the linear regression analyses on the impacts of mean temperature change (°C) on maize growth period change (days).
SitesScenarioCoefficientsR2
YanglingPotential−2.4 ***0.64
Rain-fed−2.4 ***0.56
ChangwuPotential−10.0 ***0.97
Rain-fed−7.6 ***0.97
*** indicates significance level at p < 0.001.
Table 7. Coefficients in the multiple linear regression analyses on the impacts of change in growing season mean temperature (ΔT), solar radiation (ΔS), rainfall (ΔR), and CO2 content ( C co 2 ) on maize rain-fed yield change (%).
SitesΔT (°C)ΔR (%)ΔS (%) Δ C co 2   ( 100   ppm ) R2
Yangling−7.11 ***0.89 ***−0.69−2.780.89
Changwu−8.00 ***0.95 ***−2.90 ***−2.560.88
*** indicates significance level at p < 0.001.
Publisher’s Note: MDPI stays neutral with regard to jurisdictional claims in published maps and institutional affiliations.

