Article

Characterization of Soil Organic Matter Individual Fractions (Fulvic Acids, Humic Acids, and Humins) by Spectroscopic and Electrochemical Techniques in Agricultural Soils

by
Aleksandra Ukalska-Jaruga
1,*,
Romualda Bejger
2,
Guillaume Debaene
1 and
Bożena Smreczak
1
1
Department of Soil Science and Land Protection, Institute of Soil Science and Plant Cultivation, State Research Institute, Czartoryskich 8, 24-100 Puławy, Poland
2
Department of Bioengineering, West Pomeranian University of Technology in Szczecin, Papieża Pawła VI No. 3, 71-459 Szczecin, Poland
*
Author to whom correspondence should be addressed.
Agronomy 2021, 11(6), 1067; https://doi.org/10.3390/agronomy11061067
Submission received: 15 April 2021 / Revised: 21 May 2021 / Accepted: 23 May 2021 / Published: 26 May 2021
(This article belongs to the Special Issue Humic Substances: A Novel Eco-Friendly Fertilizer)

Abstract

:
The objective of this paper was to investigate the molecular characterization of soil organic matter fractions (humic substances (HS): fulvic acids-FAs, humic acids-HAs, and humins-HNs), which are the most reactive soil components. A wide spectrum of spectroscopic (UV–VIS and VIS–nearIR), as well as electrochemical (zeta potential, particle size diameter, and polydispersity index), methods were applied to find the relevant differences in the behavior, formation, composition, and sorption properties of HS fractions derived from various soils. Soil material (n = 30) used for the study were sampled from the surface layer (0–30 cm) of agricultural soils. FAs and HAs were isolated by sequential extraction in alkaline and acidic solutions, according to the International Humic Substances Society method, while HNs was determined in the soil residue (after FAs and HAs extraction) by mineral fraction digestion using a 0.1M HCL/0.3M HF mixture and DMSO. Our study showed that significant differences in the molecular structures of FAs, Has, and HNs occurred. Optical analysis confirmed the lower molecular weight of FAs with high amount of lignin-like compounds and the higher weighted aliphatic–aromatic structure of HAs. The HNs were characterized by a very pronounced and strong condensed structure associated with the highest molecular weight. HAs and HNs molecules exhibited an abundance of acidic, phenolic, and amine functional groups at the aromatic ring and aliphatic chains, while FAs mainly showed the presence of methyl, methylene, ethenyl, and carboxyl reactive groups. HS was characterized by high polydispersity related with their structure. FAs were characterized by ellipsoidal shape as being associated to the long aliphatic chains, while HAs and HNs revealed a smaller particle diameter and a more spherical shape caused by the higher intermolecular forcing between the particles. The observed trends directly indicate that individual HS fractions differ in behavior, formation, composition, and sorption properties, which reflects their binding potential to other molecules depending on soil properties resulting from their type. The determined properties of individual HS fractions are presented as averaged characteristics over the examined soils with different physico-chemical properties.

1. Introduction

Soil organic matter (SOM) is a complex mixture of polyelectrolytes produced by the profound biotic and abiotic alteration/degradation of plant and animal-derived organic substances [1,2,3,4,5]. SOM consists of different organic compounds with chemical structures and its relative proportions change over time. Recent evidence indicates that the physicochemical nature of SOM depends on diagenetic conditions, the composition of the mineral matrix, biomass input, land use practices, and microflora abundance and quality [1,2,4,5,6,7,8].
A substantial portion of the organic matter pool in soils are humic substances (up to 85%), microorganisms (5%), and plant roots (10%) [1,7,8]. The International Humic Substances Society defines humic substances (HS), as the largest part of SOM, which can be operationally divided into three fractions, according to their solubility in water at various pH, e.g., fulvic acids (FAs, soluble at all pH values), humic acids (HAs, soluble in alkaline media and insoluble at pH 1.0), and humins (HNs, insoluble at all pH values). These organic fractions may exist in a dissolved form, as discrete particles, or as coatings on mineral surfaces [3,8]. The remnants of lipids, proteins, plant waxes, pectins, polysaccharides, lignin, and other biopolymers can also be identified due to the stabilizing role in the HS structure [1,2,5,6,7,8,9]. To study structure and function of soil organic matter fractions, scientists have performed alkaline extractions for more than 200 years [5,10]. However, recently in the literature critical views about the extraction and the study of humic substances have appeared [11,12,13]. Critics have claimed that alkali-extractable fractions are laboratory artifacts, hence unsuitable for studying natural organic matter structure and function in field conditions. Nevertheless, this point of view is disputable and does not gain the approval of many specialists dealing with SOM research [5,10,14,15].
The structure of HS has been discussed from different aspects, including molecular conformation, molecular aggregation, macromolecularity, supramolecular characteristics, domain mobility, and many others [1,3,8,16,17,18,19,20]. Until now, the individual concepts appear partly contradictory, although each viewpoint provides important information on the structural and functional properties of HS. As previously defined [1,3,8,20], the basis of the structure of HS are aliphatic chains or aromatic rings bridged by O-, N=, =NH, -[CH2]n-, and -S- molecules, which also contain various functional groups (e.g., -COOH, -OH, =C=O) that are responsible for chemical reactivity. Lehmann et al. [21] pointed out that soil organic matter containing different ratios of the four classes of aromatic C clusters include some areas with little amounts of aromatic C. This variability confirms the diversity of the structure of the SOM which include predominantly large polymers of somewhat similar composition [13], as well as a variety of biomolecules and products of abiotic reactions.
Molecular sizes, chemical structures, redox-active functional groups, complexing sites, aromaticity, hydrophobicity, and polyelectrolytic characteristics depend on the individual HS fraction and affect their sorption properties [1,8,9]. Therefore, HS are generally more chemically reactive than nonhumified materials [1,5,8,10,22,23,24]. Despite its heterogeneity, generalized statements can specify the interactions of various HS fractions with other chemical molecules existing in the soil environment (e.g., organic pollutants, pesticides, and metal ions), indicating the behavior of HS. A number of studies have reported that HS derived in terrestrial have a greater reactivity than in aquatic environments [23] and HS with larger molecular sizes may sorb more strongly than do those with smaller molecular sizes [16]. Several authors noted that pesticides tend to have a greater affinity for HA than FA, and a greater affinity for HS richer in aromatic C than in aliphatic C [15,22,24,25], while strongly hydrophobic compounds such as persistent organic pollutants exhibited high sorption affinity to HN through hydrophobic interactions [17,18,26,27,28]. The retention of metal ions by HS is largely dependent on the association with carboxyl and hydroxyl weak acid groups [28,29,30,31].
While general information about differences between various HS factions has been previously analyzed [17,18,20,27,30], the operationally separated HS may have strictly specific characteristic that promote their transformations, interactions, and behavior with other soil components. The complex nature of HS and their certain fractions make it difficult to obtain precise information on their chemical directly defined structure and properties.
Therefore, the objective of this study was to investigate the molecular characterization of individual humic substances (FAs, HAs, and HNs), which consist of the most reactive components of SOM. A wide spectrum of spectroscopic (UV–VIS, VIS–nearIR), as well as electrochemical, methods (zeta potential, particle size diameter, and polydispersity index) were applied to find the relevant differences in the behavior, formation, composition, and sorption properties of the HS derived from various soil types. Research was conducted in 30 soil samples; therefore, the obtained results accurately reflect the properties of the analyzed fractions and allow for the presentation of credible conclusions.

2. Materials and Methods
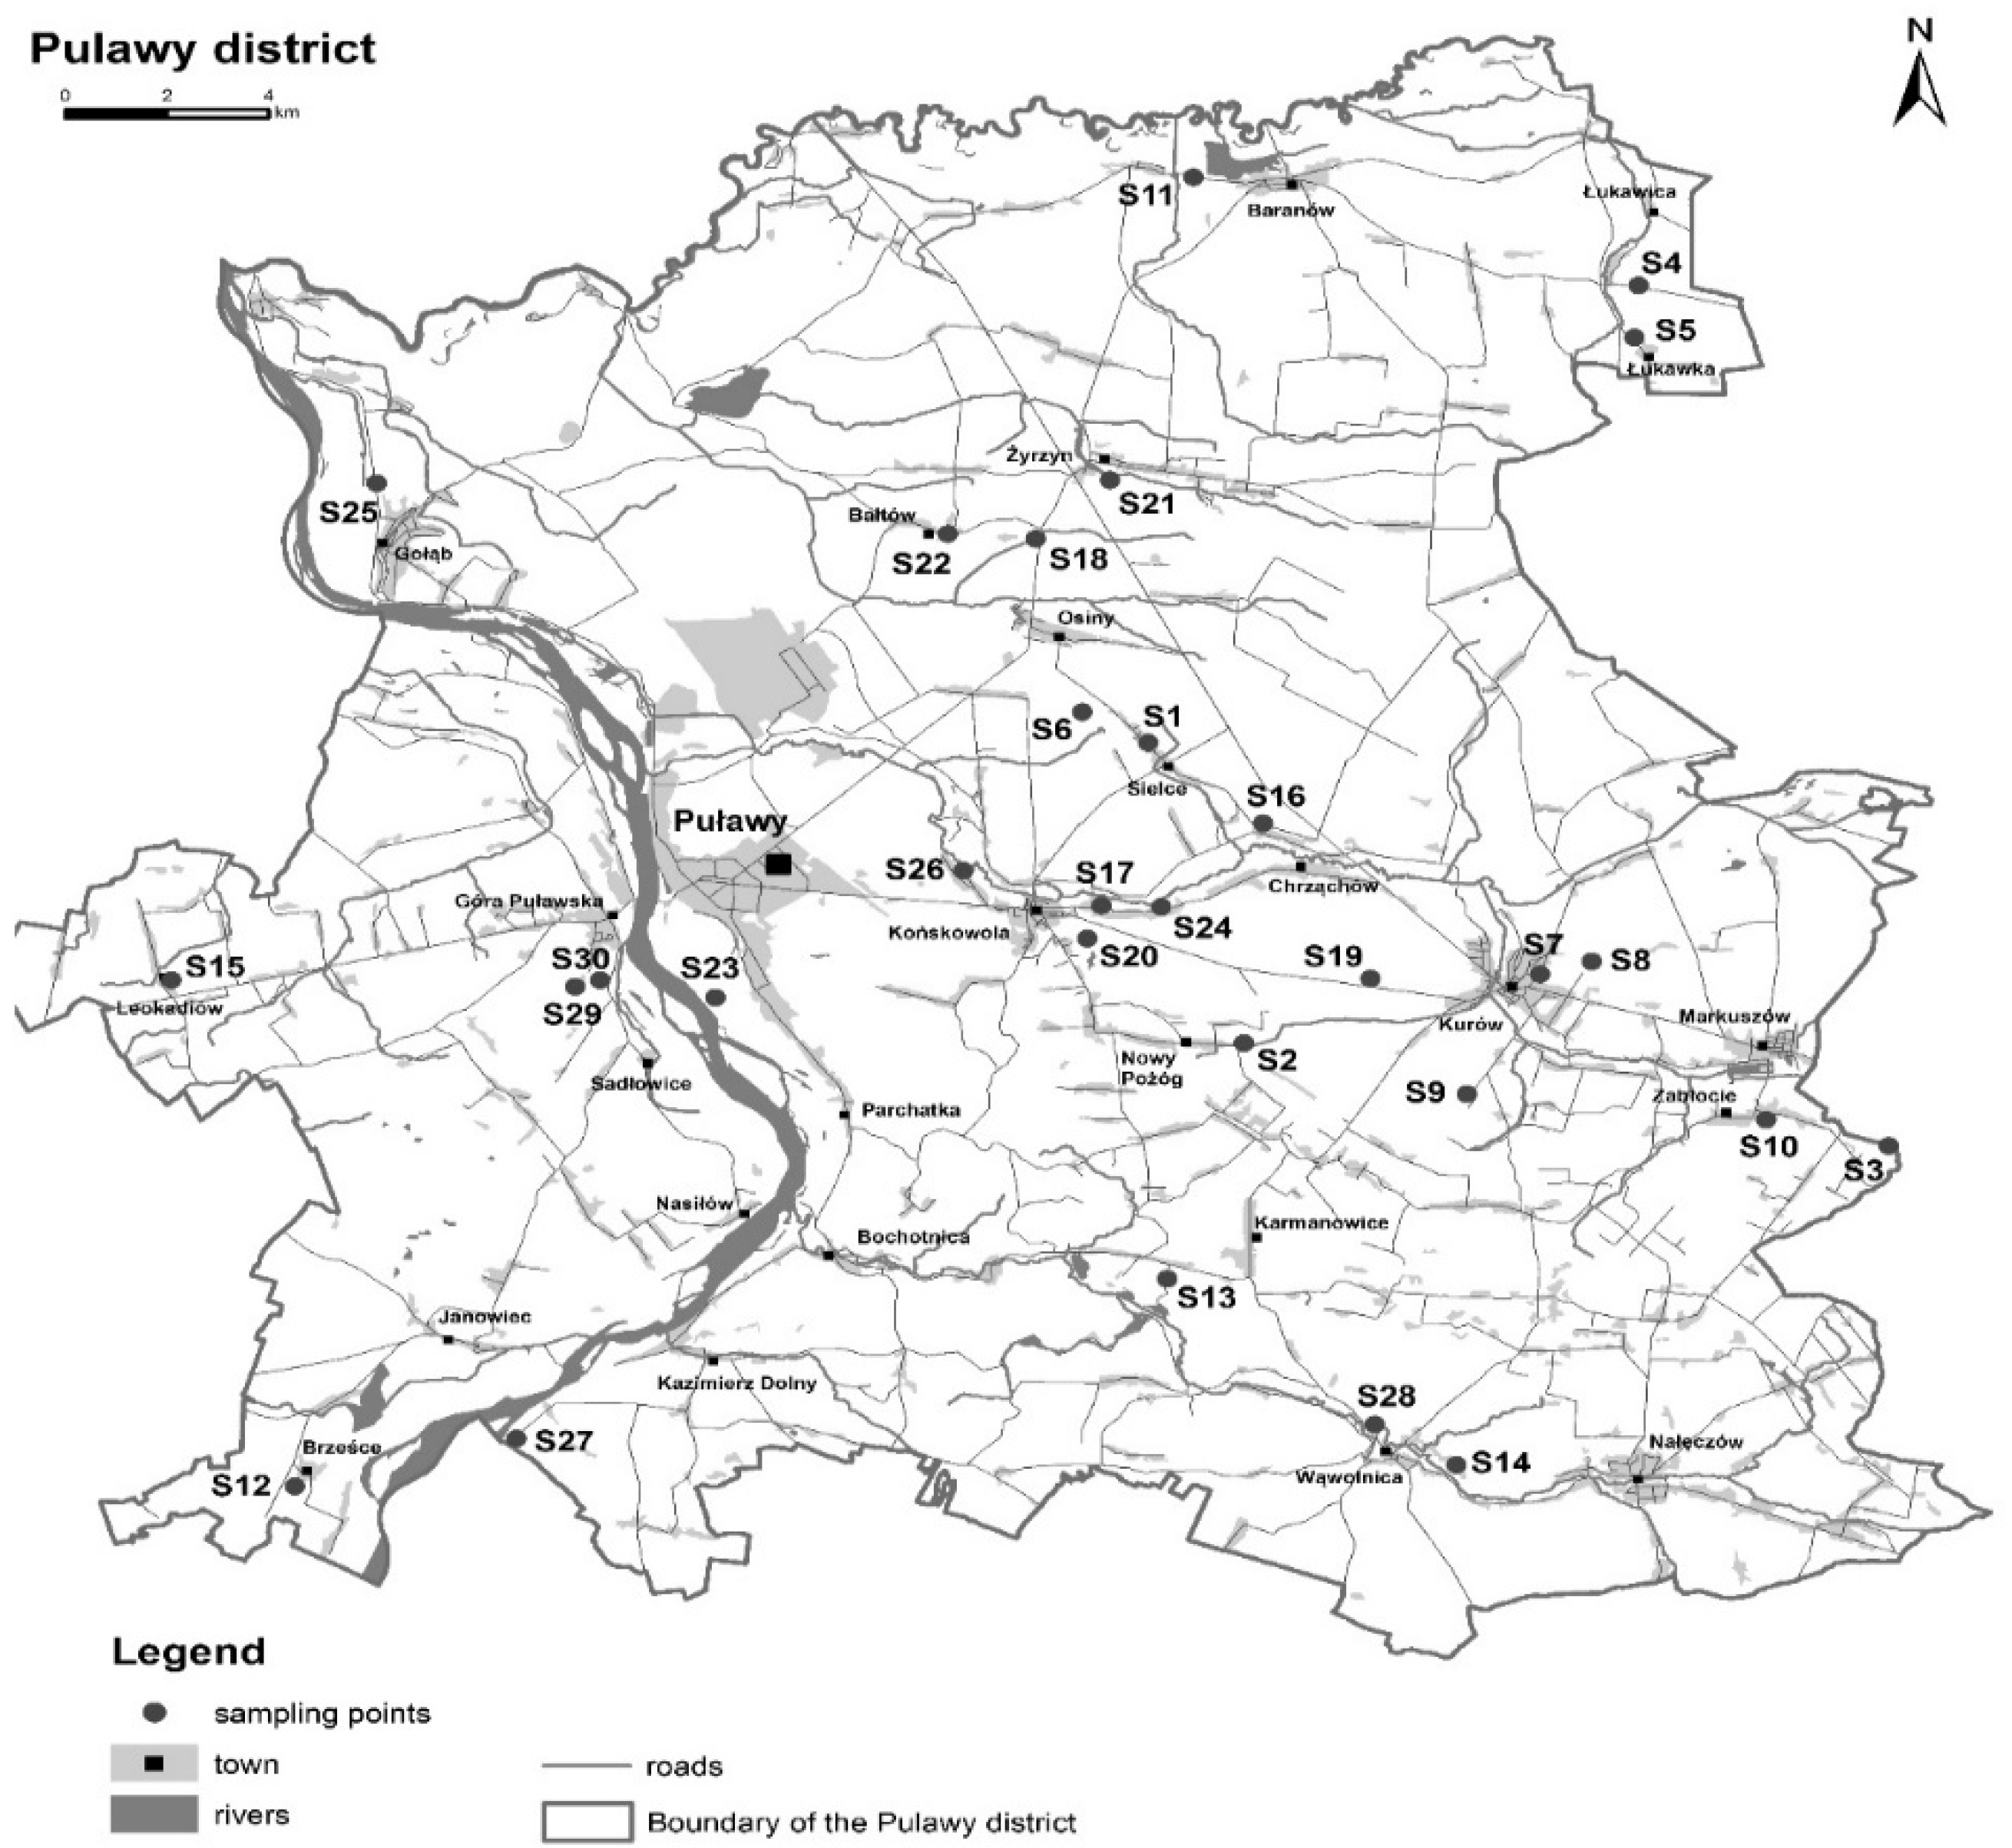
2.1. Study Area

The study area was located in the eastern part of Poland (Figure 1), characterized with heterogeneous soil covering. The sampling sites were located within the Puławy district, which is a unit of territorial administration and local government situated in the northwest outskirts of the Lublin Upland, Lublin Voivodeship.
The district covers an area of 933 km2, with a total population of 132 persons per km2. It has a continental humid climate with a mean annual precipitation of 600 mm, average annual temperature of +7.8 °C and vegetation period from 218 to 220 days (http://www.imgw.pl, accessed on 30 April 2021). The sampling points covered. six types of soils such as Luvisols (36%—11 samples), Arenosols (23%—7 samples) Fulvisols (17%—5 samples), Cambisols (10%—3 samples), Chernozems (7%—2 samples), and Phaeozems (7%—2 samples). The variety of relief and terrain cover contributed to the considerable diversity of the meso-topo and microclimatic conditions of the study area. Regarding specific forms of relief, plateaus, slopes, and valley bottoms, were characterized by different thermal and humidity conditions, which were the result of air circulation on the micro scale, as well as differences in solar radiation, shading, and exposure to rainfall. Therefore, the sampling sites intended to encompass potentially wide diversity for properties of organic matter and its individual fractions.

2.2. Soil Sampling

Samples were collected from the upper layer (0–30 cm) of the agricultural soils (n = 30 samples). Geographical reference of the sampling points were designated according to the information included in the numeric soil–agricultural map (1:25.000 scale; database of the Institute of Soil Science and Plant Cultivation), and detailed specified by the GPS technique. The sampling points were scattered randomly to reflect different types and properties of soils as well as corresponded to the localization of agricultural areas in the studied region (Figure 1). At each sampling site, three subsamples were collected with a dedicated soil cane, and mixed after the removal of organic vegetative materials in order to provide a bulked sample. The ISO 10381-1 methodology was used for this purpose. Soil samples were air dried and passed through a 2 mm mesh sieve [28].

2.3. Determination of Soil Basic Physico-Chemical Properties

The determination of basic soil physico-chemical properties covered several characteristics included: soil acidity expressed by pH in KCl, clay minerals (φ < 0.002 mm) content, total nitrogen (TN) and carbon (TC) content as well as total organic carbon (TOC) concentration. The reaction was measured potentiometrically in 1 mol L−1 KCl solution (PN-ISO10390, 1997) with the soil to the solution ratio at 1:2.5 while the clay content was analyzed using aerometric method according to PN-R-04032 (1998). The nitrogen and carbon content were determined in a Vario Macro Cube elementar analyser (C-N Elementar Analysensysteme GmbH) while organic carbon content was identified by sulfochromic oxidation followed by the K2Cr2O7 titration with FeSO4(NH4)2SO4·6H2O (PN-ISO 14235, 2003).

2.4. Isolation and Determination of Humic Substances

The SOM fractionation was based on the isolation of the HS of individual fractions, comprising FAs, HAs. and HNs. The procedure was carried out by an adapted ISO 12782-4 method (ISO 12782-4, 2012), approved by the International Humic Substances Society [1,2]. The soil samples were acidified by 0.1 M HCl to pH 1 (1:10 w/v soil to solution ratio), shaken for 1 h in a laboratory shaker and then centrifuged. The supernatant containing the first extract of the low molecular fulvic fraction was removed from the residue by decantation and discarded. The remains of the soil sample were neutralized with 0.1 M NaOH and then extracted with 1 M NaOH (1:10 w/v at pH > 12) overnight by continuous shaking. The decanted supernatant containing extracted FAs + HAs were acidified with 6 M HCl to gravimetrically precipitate HAs. The FAs were purified on DAX -8 polymer resin, while HAs were de-ashed with 0.1M HCL/0.3M HF. The extraction of FA and HA is also described in our previous papers [26,27,32].
The HNs content was determined in the remaining soil solid residue after FA and HA extraction by the repeated digestion of the mineral fraction using a 0.1M HCL/0.3M HF mixture (each by 24 h) until the ash content was below 15%. Subsequently, HNs were dissolved in DMSO for purification and the organic solvent was evaporated on the Büchi evaporation system (modified methodology based on the Song et al., 2008, Song et al., 2011 [33,34]. The separated FAs, HAs, and HNs fractions were freeze-dried and stored in a desiccator. Concentrations of organic carbon in the extracted HS fractions were determined by a C-N analyzer (Multi N/C 2100/2100S Jena Analytics).

2.5. Structural Characterization of Humic Substances

2.5.1. UV–VIS Analysis

The UV–VIS spectra were recorded for determination of the molecular structure diversity in the form of aromaticity and maturity degree of the individual HS fraction. The spectra were measured using the solutions of FAs, HAs, and HNs with concentrations of 0.01 g dm−3 in 0.01 M NaOH (FAs and HAs) and benzene (HNs). Analyses were performed by Lambda UV–VIS Spectrophotometer Perkin Elmer in the wavelength range of 200–900 nm. Absorption coefficients E2/E4, E2/E6, and E4/E6, with an absorbance ratio of 280 to 465 nm, 280 to 665 nm, and 465 to 665 nm, respectively, were calculated from the absorbance of FAs, HAs, and HNs at established wavelengths.

2.5.2. VIS–nearIR Analysis

The VIS–nearIR spectra were recorded for determination of molecular structure diversity of HS The VIS–nearIR analysis were very useful for indication slight differences in individual spectra by assigning them specific properties reflecting the functional group of the HS individual compounds.
Spectral measurements were performed using a PSR-3500® spectroradiometer (Spectral Evolution, Lawrence, KS, USA) in the near-IR spectral range (700–2500 nm). The instrument had a 2 nm sampling interval and a spectral resolution of 3.5, 10, and 7 nm from 700 to 1000 nm, 1500 nm and 2100 nm, respectively. Data were interpolated to 1 nm. The scanning involved the use of a cuvette bundle for near-IR measurements (absorption–transmission mode). The calibration solution (used every 5 samples) was 0.01M HCl. The cuvette was placed under a cover to avoid interferences with outside light. The VIS–nearIR analysis for HS research is also described in other papers of Ukalska-Jaruga et al. [26,32]. The spectra were measured using the solutions of FAs, HAs, and HNs with concentrations of 0.01 g dm−3 in 0.01M NaOH (FAs and HAs) and benzene (HNs).

2.5.3. Electrochemical Analysis

The electrochemical analysis, based on the characteristic of the zeta potential, particle size diameter and polydispersity index, were performed to determine the molecular structure diversity in the form of the charge (zeta potential) related to the sorption affinity and size/shape (particle size diameter, polydispersity index), and with the mobility of separated fractions of humic substances. The particle size diameter (PSD) was analyzed by a dynamic light scattering (DLS) technique. For size determination, the instrument was adopted to measure the particle-size standards (polystyrene microspheres in water, 60 and 220 nm, Nanosphere™ Size Standards, Duke Scientific Corporation, USA). Ten replicates for each solution (FAs, HAs, and HNs) were performed and the average size value was calculated. The polydispersity index (PDI) was also calculated from the intensity the autocorrelation function.
Zeta potential (ZP) was measured by the electrophoretic light scattering (ELS) method and calculated from the electrophoretic mobility of particles using the Henry’s equation, while taking into consideration the Smoluchowski approximation. Three replicates of each sample were tested with a minimum of six measurements each at two minute intervals. PSD, PDI, and ZP parameters were determined using the Litesizer™ 500 Anton Paar instrument to characterize nano and microparticles in dispersions and solutions. The methods are described in further detail by Ukalska-Jaruga et al. [32].

2.6. Statistics

The software package Statistica (Dell Statistica, version 13.1) was used for statistical analysis. Basic statistical parameters, such as average (Aver), median (Med), extreme values (Min and Max), lower (LQ), and upper (UQ) quartile, 5th, and 95th percentiles, and coefficient of variation (CoV), were analyzed for soil organic matter fractional composition and other analyzed soil parameters. The mean value adopted for the general characteristics of individual fractions was expressed as the median after rejecting the significantly outlier results based on the analysis of variance. The chi-squared test was applied to check the normal distribution of the obtained results. One-way analysis of variance (ANOVA) and Mann–Whitney U test were applied to test for significant (p ≤ 0.05) differences between determined spectral and electrochemical parameters for the HS analyzed fractions. The Principal Component Analysis (PCA) was used to investigate the influence of soil type on spectral and electrochemical properties of soils. PCA was used to evaluate the inter-relationships and hidden structures in measured variables in order to identify the essential structure of their correlations. Additionally the r- Spearman’s correlations were carried out in order to demonstrate the additional influence of soil properties on the determined parameters of HS.

3. Results and Discussion

3.1. Soil Physico-Chemical Properties and HS Fractional Composition

The collected soils exhibited a reaction, with pH in KCl values ranging from 4.8 to 7.5, a maximum carbonate content of 2.7% and a low clay content (fr < 0.002 mm) with a mean value of 3.2% (CoV = 154%), as in Table 1. TOC concentration, which strictly reflects the content of organic matter, ranged from 6.4 to 58.7 g kg−1 (CoV = 67%), indicating the various degrees of supply, inflow, and accumulation of organic carbon in agricultural soils. Concentrations of TC and TN were in the range of 7.4–75.4 g kg−1 and 0.7–6.6 g kg−1, respectively. The proportions of TC:TN were in the range of 8.9–42.3 (CoV = 48%), which indicates a varying degree of organic matter decomposition in the soils from the studied area [3]. Moreover, low TC:TN ratios (below 10) imply prevailing decomposition processes of SOM, while higher ratios represent the accumulation of fresh, undecomposed C derived from organic materials [3].
The content of individual HS fractions was highly diversified (Table 2) and was not dependent on the total content of organic matter. A substantial part of the HS was constituted of HNs (2.8–54.5 g kg−1), as compared to HAs (1.1–6.8 g kg−1) and FAs (0.5–1.8 g kg−1). A general share of individual fractions (in total SOM content) followed the overall trend of HNs (36–93% of TOC) > HAs (7–40% of TOC) > FAs (2–13% of TOC). The mutual proportions between HAs and FAs were above 1 for all soil samples (HAs:FAs = 1.3–5.6), while the ratio of (FAs + HAs)/HNs were between 0.1 and 1.4.
The proportions between HAs and FAs, expressed as a humification index, indicate the potential mobility of C in the soil system and a lower intensity of humification processes, while the proportion of (HAs + FAs)/HNs show the degree of organic matter transformation to the stable C forms [3,27,35]. Higher values of the above parameters suggest a lower mobility of organic matter and its susceptibility to degradation. Moreover, the predominant content of the labile fractions (FAs and HAs) in agricultural soils may be caused by specific management practices based on the incorporation of external organic matter derived from natural or organic fertilizers, manure or compost [8,36,37]. According to Dou et al. [36], higher contents of HAs are mainly related to the decomposing post-harvest residue left on the field after the growing season. The authors also pointed out that HAs are mainly formed from FAs during the inception phase and affirms the advancement of humification processes. Therefore, the differences in organic matter composition and concentration predominantly results from land use practice, crop production, and soil conditions [1,3,7,8,35].
The ash content in the individual HS samples was below 10% (for FAs ranged from 0.55 to 1.20%; for HAs ranged from 0.75 to 2.0%; for HNs ranged from 7.33 to 9.97%), which proves that the mineral parts had been washed properly and proves the high quality of obtained preparations for further experiments.

3.2. Structural Characterization of Soil Organic Matter Fractions

3.2.1. UV–VIS Analysis: Determination of Aromaticity and Maturity Degree

The absorption properties of HAs have been investigated by a number of scientists [37,38,39,40,41] who stated that the intensity of light sorption was characteristic of the type and molecular weight of HS. Therefore, the values of the several indexes (E2/E4, E2/E6, and E4/E6) were determined in this study (Table 3). According to literature data [37,41] absorbance at 280 nm provides the percentage of lignin structures; absorbance at 465 nm expresses the share of low molecular FAs and HAs with a low transformation degree; and absorbance at 665 nm informs the share of macromolecular or condensed FAs and HAs [8,9,38].
The results revealed a general trend of changes in the values of absorbance ratios in the UV–VIS range as follows: FAs > HAs > HNs. FAs were characterized by the average highest value of the E2/E4 = 38.8, E2/E6 = 42.6, and E4/E6 = 7.9 ratios, as compared to HAs, E2/E4 = 3.6, E2/E6 = 24.1, and E4/E6 = 3.4. According to literature data [9,39] the absorbance at 240, 250, and 280 nm could be due to lignin and quinone moieties, i.e., the material at the very beginning of organic matter transformation. Therefore, the calculated parameters proves the higher values of lignin-like substances and quinone units in structures of FAs compared to HAs. [9,38]. Nevertheless, it may be related to the low intensity of observed peaks at 465 and 665 nm resulting from a very low concentration of FAs. HNs exhibited the lowest value of the determined coefficients (E2/E4 = 1.31, E2/E6 = 2.01, and E4/E6 = 1.47), reflect the high optical density, indicating a greater conjugation of double bonds, the highest humification degree towards stable forms and molecular weight of these compounds. The high value of E2/E4 parameter, especially for FAs, results from the agricultural origin of analyzed soils. The crop residues increase the content of low molecular compounds and lignin-like substances, which are derived from the decomposition of remaining post-harvest residues [9,38,39,40,41,42]. Baglieri et al. (2007) [42] stated that the chemically ‘younger’ HS had a lower optical density, as compared to the ‘more mature’ HS. This is due to the large condensation of the aromatic nucleus in ‘mature’ HS, as compared to ‘younger’ molecules, due to the greater number of side chains [42]. Additionally, Tan (2014) [3] noticed that HS, with high molecular weights (m.w. > 30,000 Da), have lower E4/E6 values (3.3–5.0) than HS with lower molecular weights (E4/E6 = 6.0–9.0; m.w. ≈ 15,000 Da). This statement is supported by the data obtained in this study, in which the molecular mass increases from FAs to HAs and then HNs. Moreover, in our study, several HA samples exhibited values of E2/E4 that were slightly above five (13% of samples), which is consistent with the abundance of aliphatic carboxyl groups that were substituted on aromatic rings. The E2/E6 ratios (average value of 24.1 for HAs; Table 3) also confirm this assumption (absorption by multiple bond substituents). HNs are characterized by very pronounced strong concentration/condensation of organic structures associated with the molecular structure of the HNs molecule “core” and its high molecular weight [3,41].
The UV/VIS spectroscopy was used to characterize and classify the humic compound fractions, based on their optical properties, which constitute the effective indicators of organic matter transformations [38,39,40]. The presence of the specific regions (chromophores) in the FAs, HAs, and HNs particles, including aromatic or aliphatic groups with various degrees and types of substitution, allow for an evaluation of the substantial changes that occur under the influence of the environment.

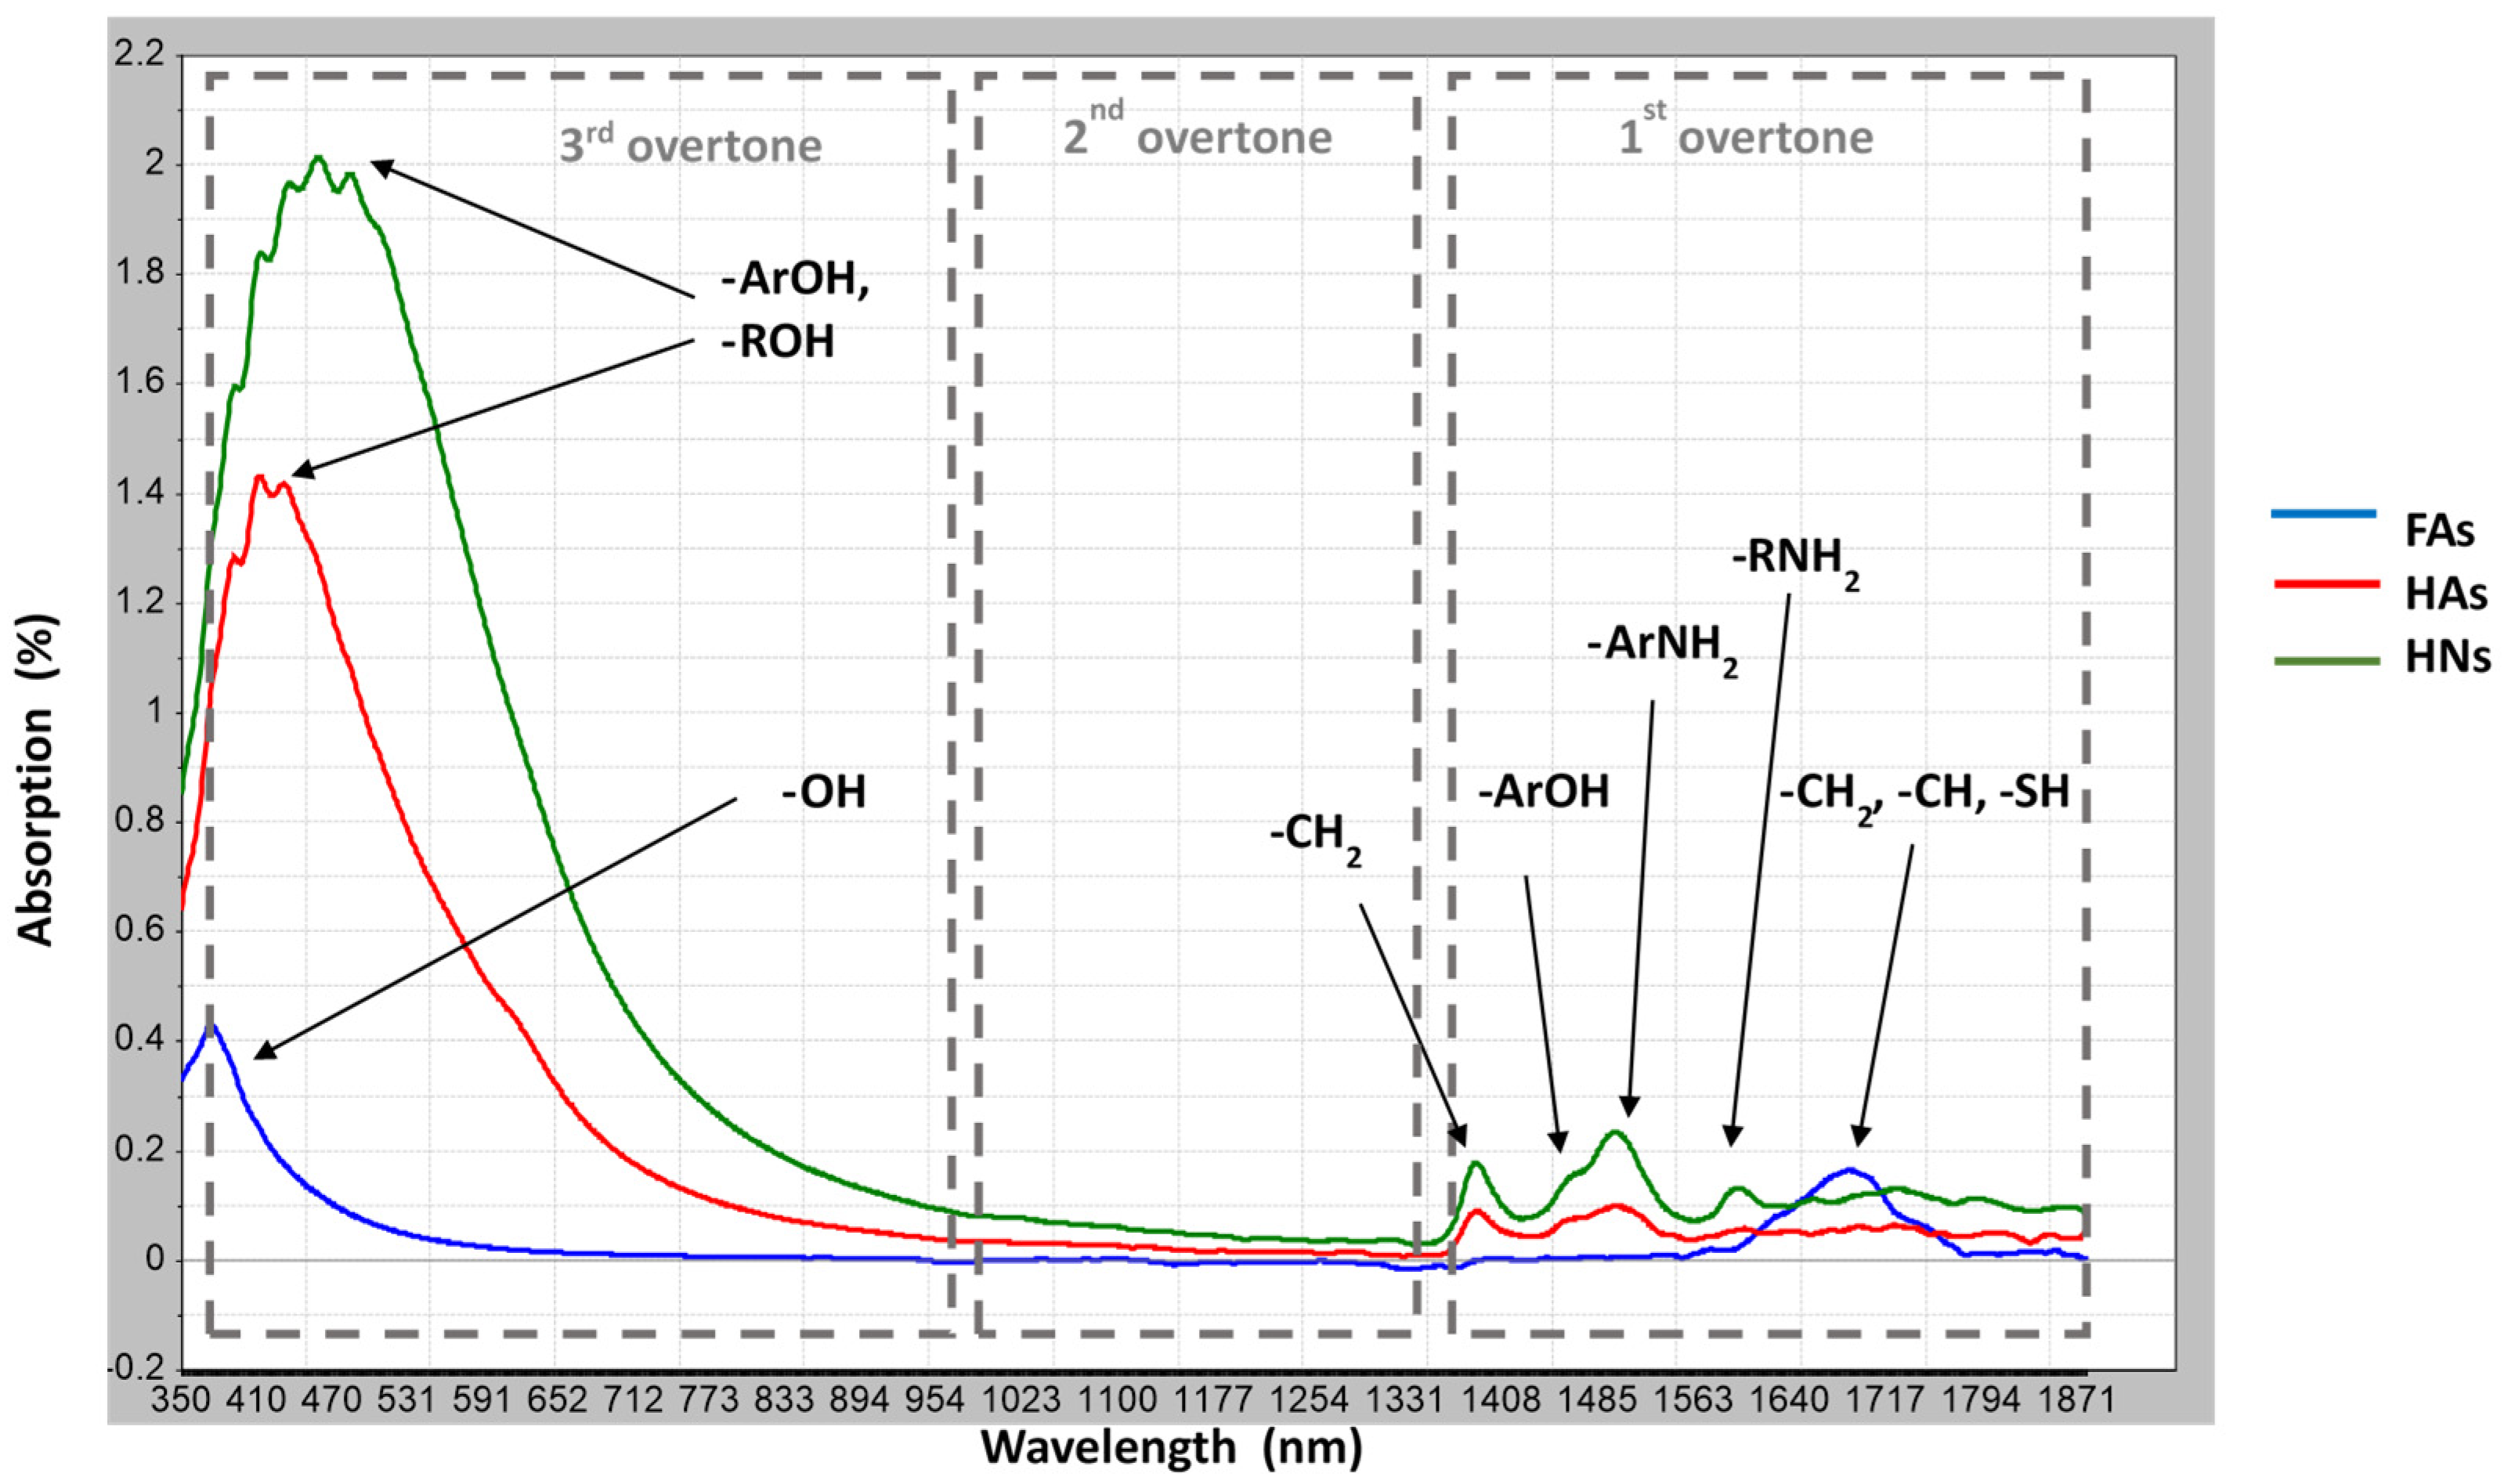
3.2.2. VIS–nearIR Analysis: Functional Group Identification

The visible region was characterized by a lower absorption (0.5%) for the FAs fraction and a higher absorption (2%) for the HNs fraction (data not presented). The HAs spectra were similar to that of the HNs, but had a slightly lower absorption (1.5%). Figure 2 presents the mean spectra (700–1880 nm) for each of the HS analyzed fractions. That range encompasses the first, second, and third overtones from the nearIR region. It is worth noticing that these overtones are slightly overlapping. Each presented spectra constituted the mean of the 30 samples of the isolated HS. The spectra were truncated at 1880 nm, due to the very high absorption of water in the later spectral range. This was already observed by other authors [43,44] for that kind of solution.
The obtained mean spectra for the three HS fractions differed significantly (Figure 2). HNs show higher absorptions, as compared to HAs and FAs in all the spectra ranges. This is probably related to the broad absorption bands that are dominated by chromophores and are also caused by the darkness of the HNs.
The third overtone (700–1000 nm), related to the C–H stretching mode, mostly contains information on the mutual conjugations and does not contain clear changes in all bands of HS. The peaks in the second overtone (1000–1400 nm) were not observed associations [44,45]. The first overtone (1400–1880 nm) indicates the vibration of C–H, N–H, O–H, and S–H bonds and the stretching of multiple bonds (e.g., C=O) [43]. In this region occurred the greatest differences between the HS factions. A wide band of minor vibrations at 1400–1550 nm in HAs and HNs indicates the occurrence of amine functional groups (–R–NH2), primary amide moieties (–R–C=O–NH2), and secondary amide moieties (–R–C=O–NH–R) on the aliphatic chains [43,45]. FAs in this region only show one prominent band around 1650–1700 nm, which is characteristic of the first overtone of C–H stretching vibration of methyl (–CH2), methylene (=CH2), and ethenyl (–CH=CH2) groups on the aliphatic chains while HAs and HNs exhibited clearly marked peaks that were affected by molecule vibrations in condensed aromatic rings. The spectra of other authors demonstrate the differences between the compositions of HAs with strong aromatic carboxylic and carbohydrate contents dominated by aliphatic hydrocarbon structures such as fatty acid components. In our research, such dependencies are not clearly visible.
The functional group composition has been widely used for the characterization of humic substances [1,2,23,31,46,47] and our research confirms previous reports. The chemical reactions characteristic of HS are attributed, for the most part, to the occurrence of a particular group composition or units created by atoms. The oxygen-containing groups considered to decrease upon humification of HS to metoxyl, –OCH3, and –C=O groups [29,46,47,48,49]. The alcoholic and phenolic groups (–OH) are also most important functionalities for HS chemical behavior. Schnitzer [8] noted that FAs are more abundant in –OH functional groups on aliphatic chains, whereas HAs contain more –OH groups on the aromatic ring. The strongly developed structure of HNs, causes that this compounds are more abundant in acidic groups, but at the same time they also contain significant amounts of amino groups-directly related to their richness in lipids, polysaccharides, or waxes [2,3,28].
The alcoholic/phenolic and carboxylic groups provide mainly the capacity for interaction reactions of HS because these are considered to be the major contributors to the cation exchange capacity (CEC) of the soil organic matter and they contribute by complexation, chelation, and organic pollutants or metal ion binding [1,8,46,47].

3.2.3. Electrochemical Analysis: Charge and Size Evaluation

In this part of the research, the zeta potential (ZP), particle size diameter (PSD), and polydispersity (PDI) of HS particles were investigated. The results indicated the significant differences (p < 0.05) between FAs, HAs, and HNs regarding individual parameters (Table 4). The ZP found for FAs was characterized by low and bivalent values (negative and positive) from −6.4 to +8.7 mV, where the majority of the particles (more than 70% of sample) exhibited a negative charge. Other HS fractions were characterized by reverse ZP values. HAs exhibited negative potentials from −47.8 to −5.3 mV, while HNs demonstrated a positive potential from +45.5 to +140.2 mV. The measured ZP values for FAs and HAs are consistent with the results of other authors [41,50,51,52], while there is no literature data available for HNs.
According to Hunter [53], ZP provides information on the sorption properties of individual molecules that are related to their functional group reactivity. This assumption states that ZP > 0 indicates molecules with a positively charged particle surface caused by the dissociation of negatively charged functional groups, whereas ZP < 0 refers to a negatively charged particle surface and the dissociation of positively charged functional groups [53]. The observed trend directly indicates that individual HS fractions differ in the properties of sorption surfaces, which reflect their binding affinity and potential. Nevertheless, the HS ability to complex a large amount of ions and other substances (e.g., metals, pesticides, polycyclic aromatic hydrocarbons, and polychlorinated biphenyls) in soil depends on pH and other environmental conditions [54]. Klucakova and Kalina [41] and Jovanovic et al. [51] stated that the drop of ZP, with increasing pH, is the result of the dissociation of the positively charged functional groups and consequently formation of extra negative charges on HS surfaces. To explain the increase of the zeta potential at higher pH values, they assumed that there are two simultaneous processes—dissociation of acidic functional groups and disaggregation caused by H-bonds breaking of humic—aggregates into smaller molecular associations and humic molecules having the opposite effects on the value of the zeta potential [55]. In the alkaline solutions, dissociation of the proton from acidic groups predominates, causing an increase in the negative charge. At lower pH values disaggregation prevails, resulting in the fragmentation of the HS molecules and the decrease of their particle sizes [28,41,52,55]. In our study, HS fractions were analyzed in alkaline (HAs and HNs) and acidic (FAs) solutions; therefore, both processes might have affected the results. Additionally, the high values of ZP (positive or negative) recorded for HAs and HNs indicate the higher colloidal stability and aggregation capacity of these molecules, as compared to FAs.
The differences in properties of HS are related to their shapes and sizes. Chemically isolated fractions of HS included particles with diversified diameters caused by multi-modal records. We observed two or three particle size groups within an individual HS factions. These findings confirmed the results of previous studies [41,51,52,56], indicating that HS creates a complex mixture of molecules that differ in size and mobility. Statistical evaluation indicated the significant differences among PSD average values of HS individual fractions, following the order: HNs > FAs > HAs (Table 4). Moreover, it indicated a very wide range of molecules, the creation of certain fractions that exhibited a particle size diameter of 0.22–39.54 µm, 0.70–15.89 µm, and 0.66–21.05 µm for FAs, HAs, and HNs, respectively.
Despite the differences in the particle diameter size, the polydispersity index was at a comparable level for all fractions (PDI for FAs = 19–35%; PDI for HAs = 20–34%; PDI for HNs = 28–32%), which indicates a similar molecular diversity of individual fractions. According to the obtained data, FAs were characterized by the largest range of hydrodynamic diameter, as compared to HAs and HNs, which may indicate the aliphatic character (confirmed by UV–VIS analysis) and ellipsoidal shape of these molecules. HAs and HNs revealed a smaller particle diameter, but it could be caused by the increased intensity of the intermolecular interaction forcing between particles or the ability to combine into spherical aggregates (confirmed by ZP values) or the breakdown of humic macro-aggregates. Moreover, the bigger diameters of particles observed for FAs could be caused by higher amounts of ionizable functional groups that allow for the greater expansion of fulvic aggregates [43].
Similar findings were also obtained by Klucakova [52], Esfahani et al. [55], and Tarasevich et al. [57]. Tarasevich et al. [57] analyzed the HA standard from Aldrich and divided the analyzed particles into three fractions called nano-particles (30–150 nm), submicro-particles (200–700 nm), and micro-particles (1.6–5.6 μm). Klucakova [52] showed that FAs and HAs particles were bigger in water and had a more concentrated solution than in an alkaline solution, which is related to the suppression of dissociation processes. Therefore, spatial arrangement of the HS molecules depend on the ionic strength of the solvent. The Cameron et al. [56] studied the molecular shape and conformations of HS in alkali solutions by the fractionated humic molecules. They results indicated that the humic macromolecules in solution was not strongly condensed spheres as has often been proposed in the literature data, but smaller particles congregations dependent on the charge characteristics. Both, the number-average (Mn) and weight-average (Mw) molecular weights were also reported in the literature by McAdams et al. (2018) [58]. The authors reported Mn and Mw values that were determined using the most recent methods in high-performance size exclusion chromatography (HPSEC) for eight samples of FA. The average Mn and Mw values were 627 ± 181 Da and 1394 ± 468 Da, respectively. It is clear that HS may also contain little, if any, large macromolecular components, speaking against a large macromolecular structure [58]. According to Cameron et al. [56], as well as Hayes and Swift [46], the molecular structure of HS consists of many of segments with different charge related to their reactivity. The segments interpenetrate each other and bend randomly with respect to time and space to form a coil with a roughly spherical molecular shape [13]. Thus, the shape of the molecule in solution is roughly spheroidal, but not rigid or condensed, which affects the significant polydispersity of HS individual fractions [13,56].
Although, the spatial structure of HS molecules present in the soil in a solid state will depend on many environmental factors and may not necessarily correspond to the HS structure in solution, this type of analysis are very important for the correct interpretation of laboratory study on the HS reactivity conducted mainly in its soluble state. All of these findings prove that PSD and ZP are very sensitive parameters and are suitable for comparative and demonstrative analyses rather than specific conclusions on the HS character. Nevertheless, the recognition of the shape and charge of HS is very important from an environmental point of view, due to its ability to bind pollutants and affect their bioavailability. Contaminants binding by dissolved HS with small particles can support the mobility of pollutants, and in some cases, their bioavailability, which depends on the bond strength between pollutant and FAs, HAs, and HNs. The complexation of pollutants by bigger humic particles is usually connected with their lower mobility.

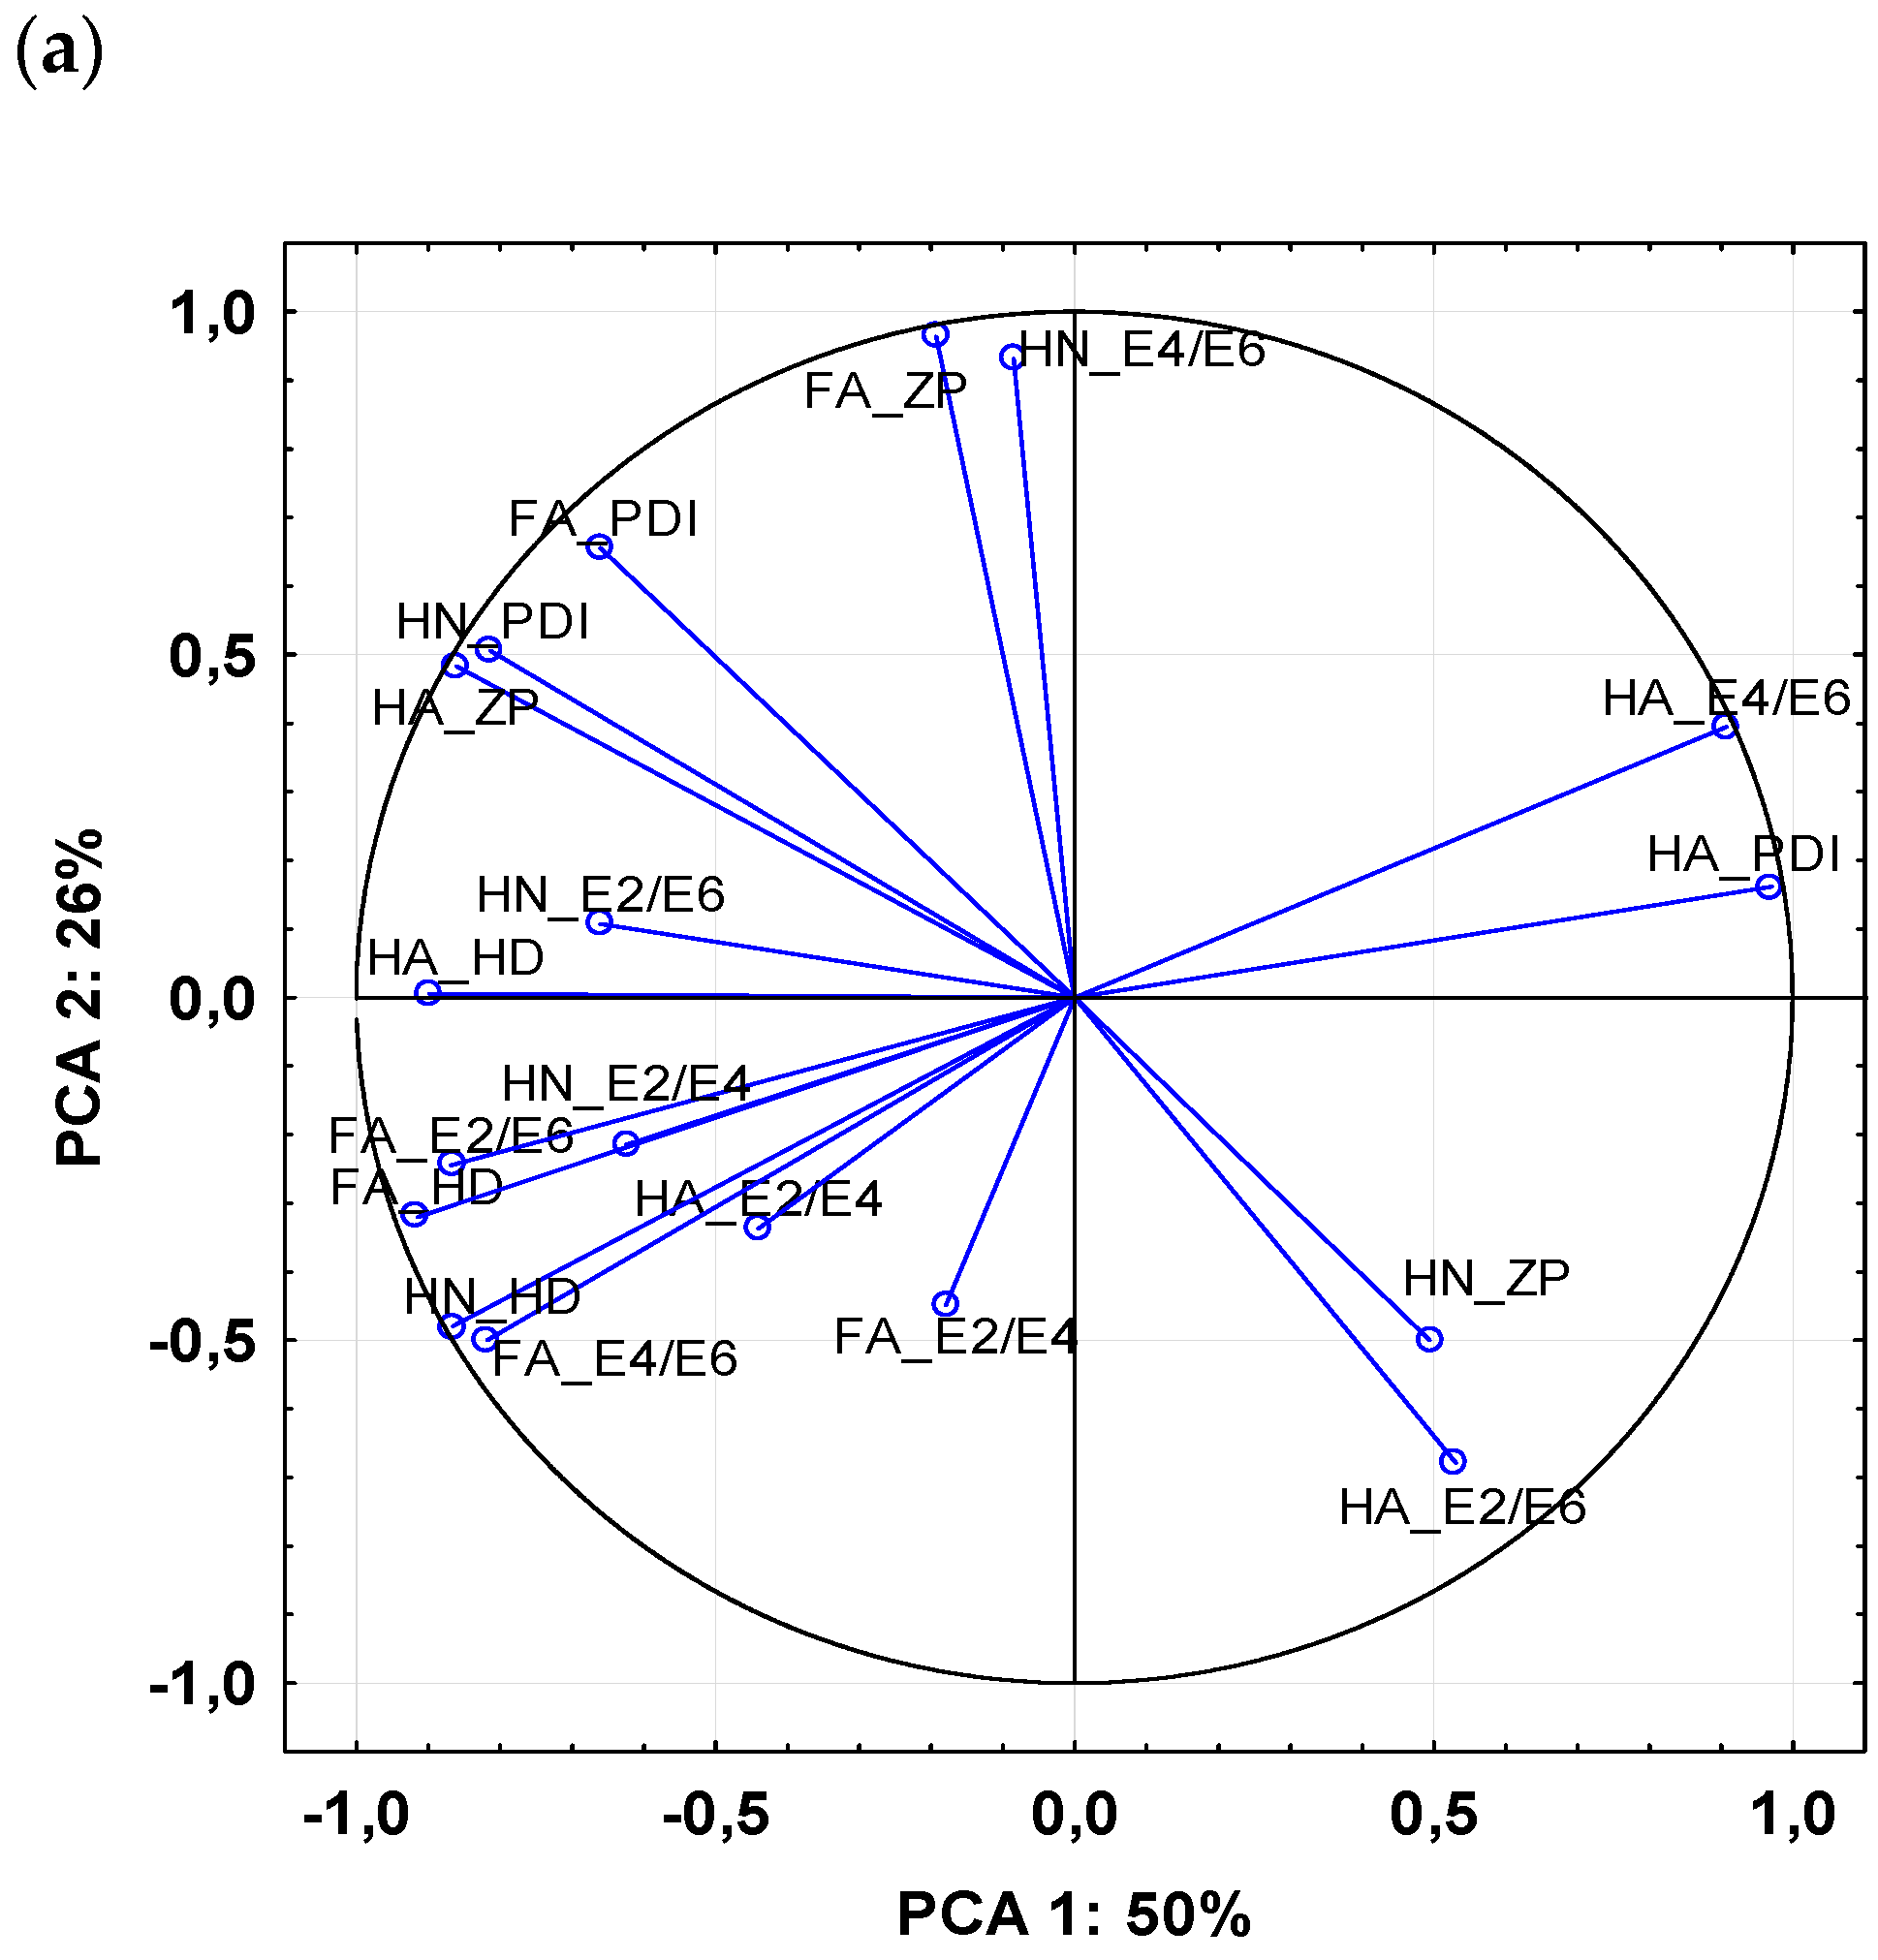
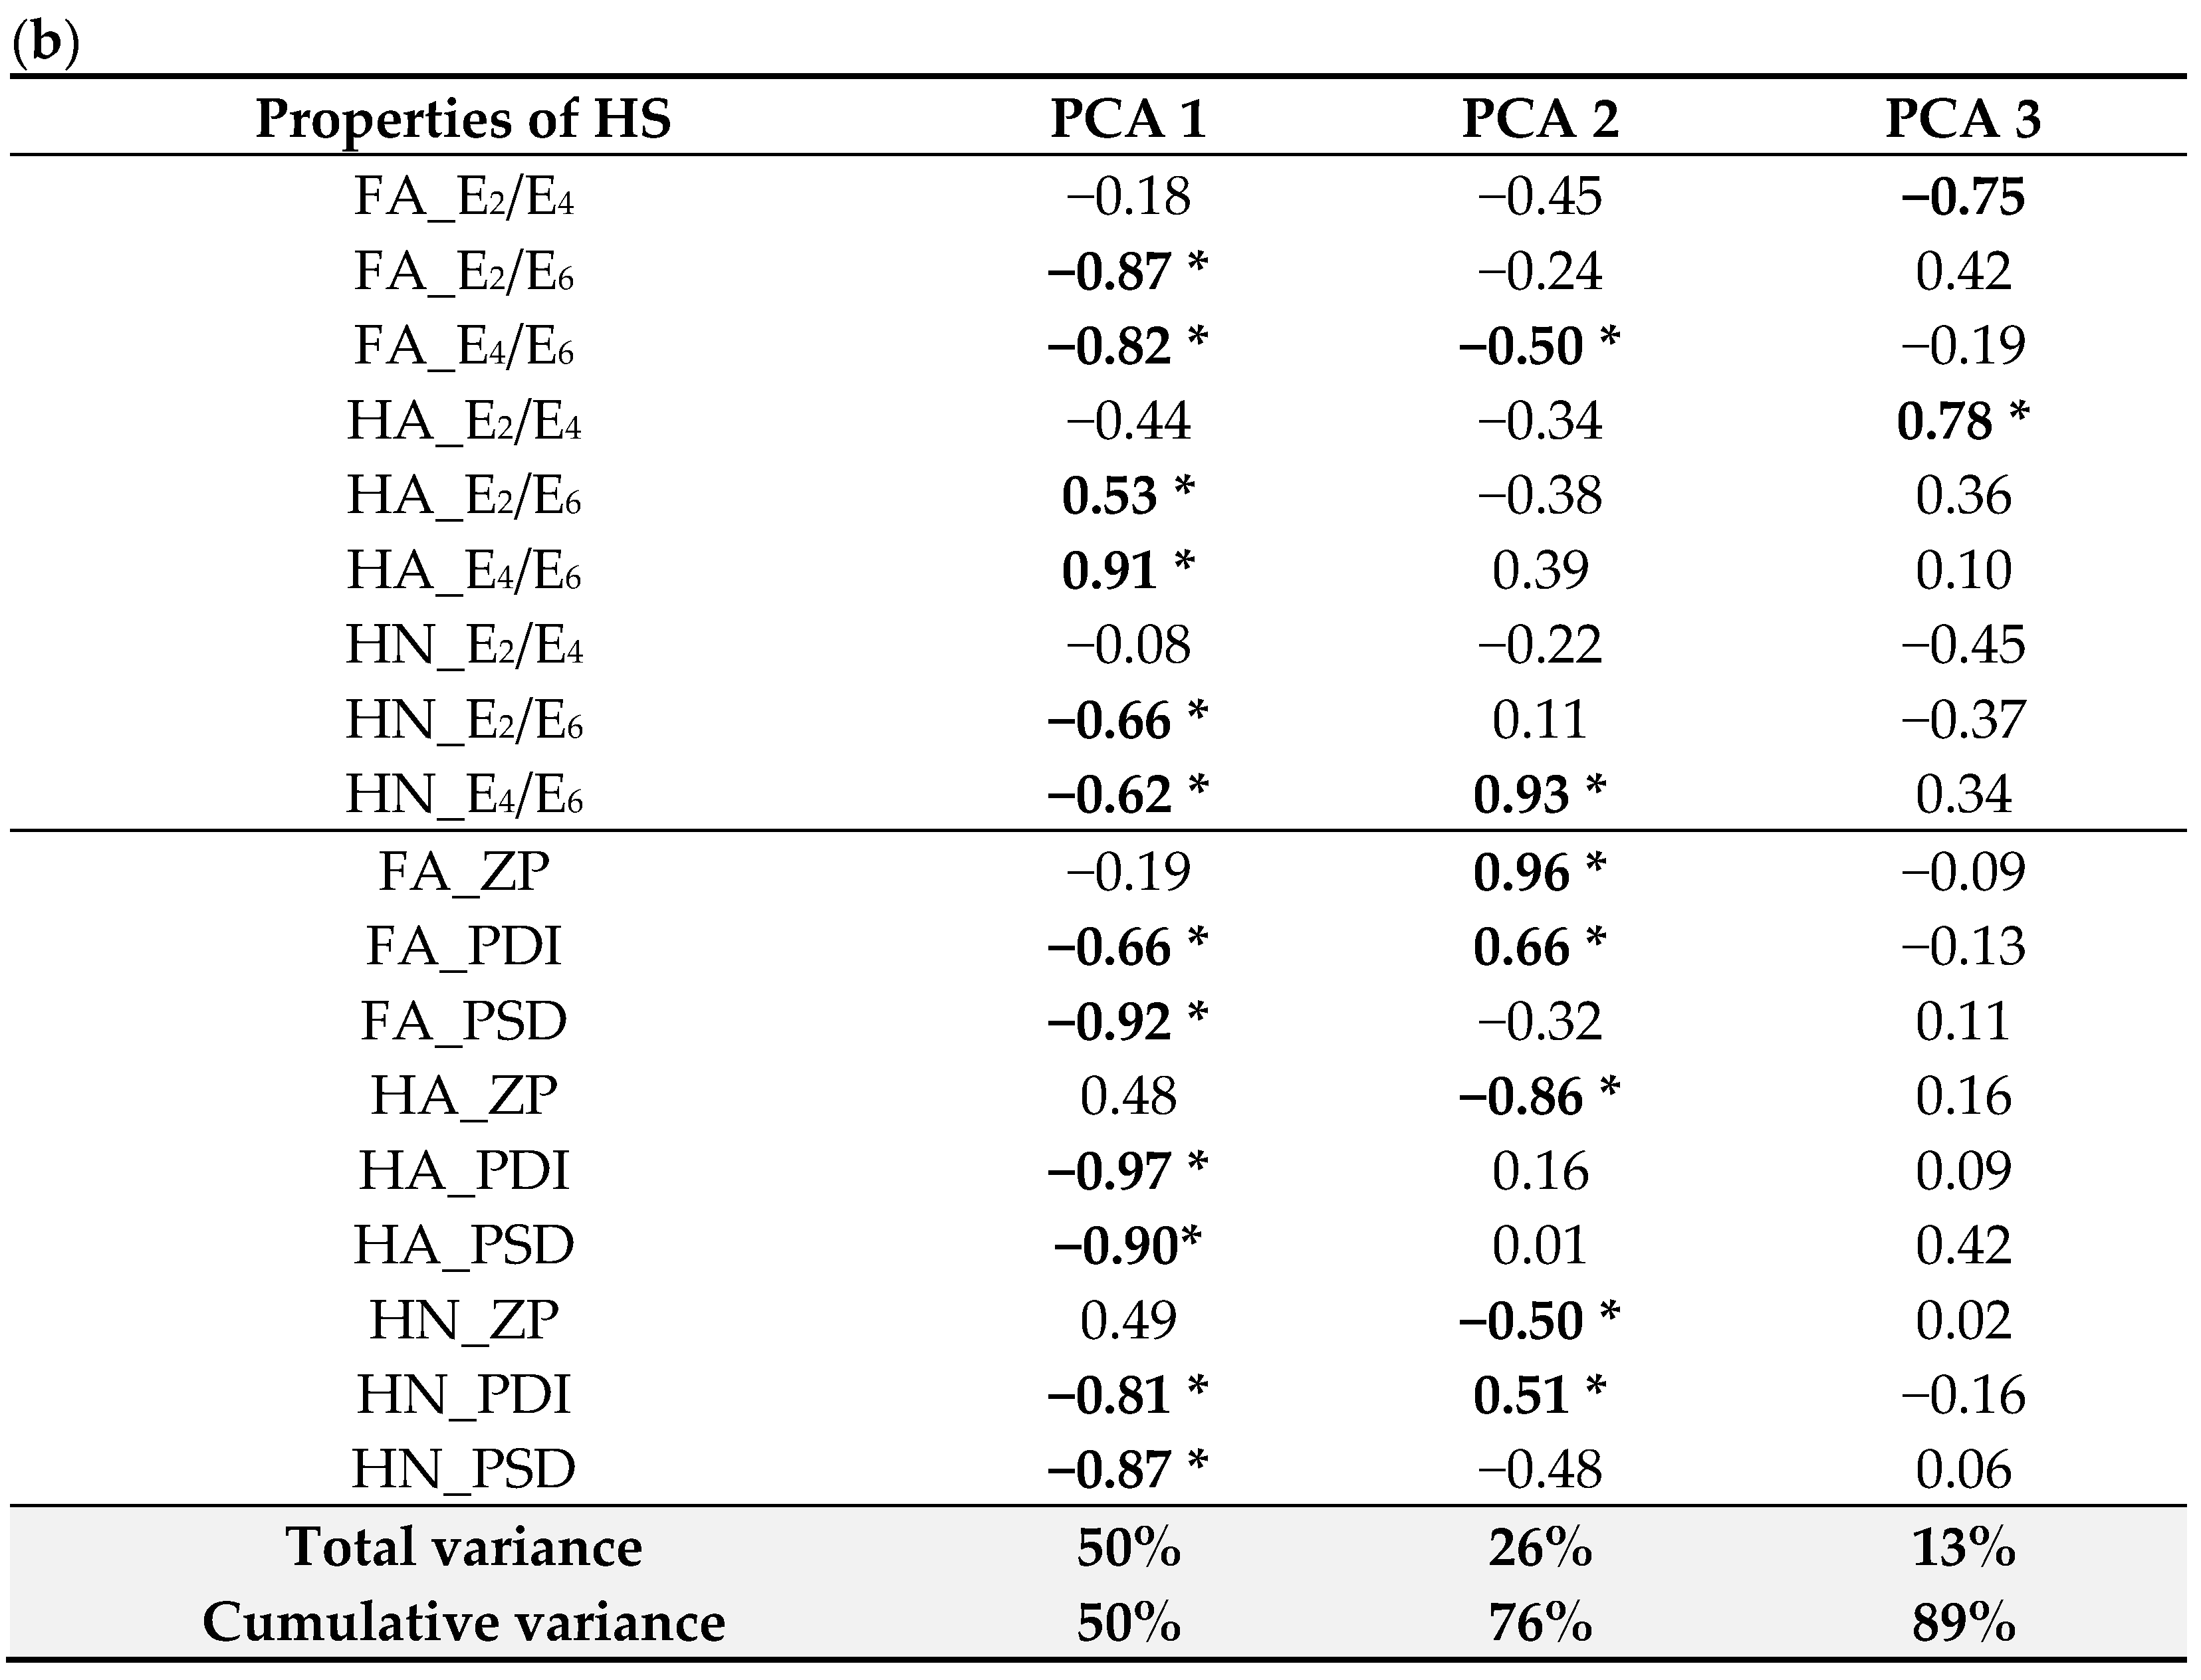
3.3. Relations between Soil Physico-Chemical Properties and Determined Characteristics of HS Fractions

As presented in the previous chapters, individual fractions of humic substances differ in terms of structure and chemical properties which may be related to the properties of the analyzed soils (Table 1) corresponding to the dominant soil formation process. Therefore, PCA analysis was carried out to define a particular relationships between HS properties and the types of analyzed soils (Figure 3).
The first three principal components explained 86% of the total variance of the results (Figure 3), whereas up to 76% of variance is explained by the first two factors. The first PCA component (PCA 1), which accounted for 50% of variance was significantly correlated with spectroscopic indexes such as E2/E6 (r = −0.87; r = 0.53; r = −0.66 for FAs, HAs, and HNs, respectively) and E4/E6 (r = −0.82; r = 0.91; r = −0.62 for FAs, HAs, and HNs, respectively) as well as electrochemical parameters such as PDI (r = −0.66; r = −0.97; r = −0.81 for FAs, HAs, and HNs, respectively) and HD (r = −0.92; r = −0.90; r = −0.87 for FAs, HAs, and HNs, respectively). The second PCA component (PCA 2), which represented merely 26% of data variance, was significantly correlated with E4/E6 ratio of FA (r = −0.50) and HN (r = 0.93) as well as ZP (r = 0.96, r = 0.86, r = −0.50 for FAs, HAs, and HNs, respectively) and PDI (r = 0.66, r = 0.51 for FAs and HNs, respectively) while the third component (PCA 3) was related with E2/E4 ratio observed for FA and HA.
Additionally, the influence of soil properties on determined HS parameters were assessed on the basis of a correlation analysis (Table 5).
The obtained results indicated that optical and electrochemical properties of labile HS fractions such as FA and HA are mainly related with the carbon (TC, TOC) and nitrogen content (TN) as well as their mutual proportions (TC:TN) describing the overall content, quality, and transformation of organic matter. This is consistent with literature reports, Ref. [3,13,27] pointed out that humification or mineralization processes of organic matter closely affect conversion of structural characterization of individual humic substances. In our research, the relatively high TC: TN (values from 9 to 42) ratios imply prevailing organic matter formation processes [3,7,59]. Zhang et al. [60] proved that during humification increasing the aromatic compounds and polycondensation structures in HA and FA. In addition, they confirmed by spectroscopic methods that protein-like groups in FA were degraded and HA compounds were formed. Directions of rotation of humic substances could be also related to other factors such as microbial activity, different pathways of organic matter decomposition, and various types of plant residues deposited in soil, especially in agricultural areas.
Among all analyzed HS fractions, only HNs exhibited significant relations with the soil particle composition, which may indicate that this type of soil (expressed based on the particle size distribution) has a strongly significant impact on the formation of resistant fractions of organic matter and their stability in soil. This thesis could be additionally confirmed by the Torres-Sallan et al. [61] who proved that stable organic matter fractions with a long turnover time are mainly associated with the formation of soil aggregates formed by the binding of small fractions of mineral particles, i.e., clay and silt by organic matter. The physical occlusion of organic matter in the aggregates leads to its greater protection from decomposition through the interactions between mineral and organic surfaces. These processes allow for the stabilization and transformation of humic fractions towards stable forms such as HN [3,13,59,61].
This relations indicates that chemical properties of HS individual fractions are related to the soil type and organic matter formation processes. Accordingly, the type of soil can determine the direction of HS transformation (humification/mineralization) by indirect influence on their characteristics [3,59]. Moreover, the properties of soil, i.e., the content of organic matter and its turnover cycle significantly affects the interactions between individual fractions and its conversions [10,35,59]. Nevertheless, this issue requires more extensive research on a wider scale considering larger number of soil and soil factors.

4. Conclusions

Our study showed significant differences in the molecular structure between FAs, HAs, and HNs presented as characteristics of HS fractions averaged over the examined soils. The spectroscopic and electrochemical methods allowed for the direct determination of diversity in the molecular aromaticity, type of functional group, maturity degree, and sorption potential expressed by reactivity group content of individual HS fractions. According to our results, FAs and HAs exhibited lower optical density, which proves their ‘youth’, compared to ‘more mature’ HNs. The difference is due to the large condensation of the aromatic nucleus in ‘mature’ humins, whereas, in ‘younger’ acids, there is a predominance of the greater number of side chains. An optical analysis confirmed the strongly aliphatic structure of FAs and the aliphatic–aromatic structure of HAs, whereas HNs were characterized by the very pronounced strong condensed conformation associated with the highest molecular weight.
The different reactivity of humic substances may be primarily caused by the content of functional groups and charge. HA and HN molecules exhibited an abundance of acidic (–COOH. –COH) and alcoholic/phenolic (–OH) as well as amine (–R–NH2), primary amide (–R–C=O–NH2) and secondary amide moieties (–R–C=O–NH–R) at the aliphatic chains and benzene rings. The small contributions of C-H groups in hydrophobic compounds of HN structures indicate the occurrence of additional compounds that stabilize their structure, such as lipids, proteins, plant waxes, polysaccharides, lignin, fatty acids, and other biopolymers. FAs exhibited the slight vibration of acidic and phenolic groups and higher signals of methyl (–CH2), methylene (=CH2), and ethenyl (–CH=CH2) reactive groups. The dissociation of functional groups can affect the charge of individual molecules. Thus, FAs exhibited bivalent charge values that determined their relative high sorption capacity to cations and anions. HAs were characterized by negative charge value (zeta potential), whereas HNs were characterized by positively charged particles.
The behavior of HS may also be related to their shapes and sizes. In our study, isolated HS fractions included particles with diversified diameters caused by multi-modal records. It indicates that HS contains few fractions of molecules with different sizes and mobilities. FAs were characterized by the largest range of particle diameter, compared to HAs and HNs, which indicated the ellipsoidal shape of these molecules related to their long aliphatic chains. HAs and HNs revealed smaller particle diameters that could be caused by the increased intensity of the intermolecular interaction forcing between particles or the ability to combine into spherical aggregates (and a more spherical shape) or the breakdown of humic macro-aggregates.
In addition, the conducted research shows that the properties of the soils related with grain size distribution as well as quality of organic matter expressed by nitrogen (TN) and carbon (TC, TOC) concentrations and their mutual proportions can significantly affect the chemical structure and behavior of HS.
The observed trends directly indicate that individual fractions differ in the behavior, formation, composition, and sorption properties, which reflect their binding potential to other molecules, e.g., organic contaminants, metal ions, or other particles.

Author Contributions

Data curation. A.U.-J. and R.B.; Formal analysis. A.U.-J.; Investigation. A.U.-J., R.B., and G.D.; Methodology. A.U.-J., R.B., and G.D.; Project administration. A.U.-J. and B.S.; Supervision. A.U.-J.; Visualization. G.D.; Writing—original draft. A.U.-J.; Writing—review and editing. A.U.-J., R.B., G.D., and B.S. All authors have read and agreed to the published version of the manuscript.

Funding

The Polish National Science Centre grant no. UMO-2018/29/N/ST10/01320. “Analysis of the fractional composition and sorption properties of humic substances in relation to various groups of organic contaminants.”

Institutional Review Board Statement

Not applicable.

Informed Consent Statement

Not applicable.

Data Availability Statement

The raw data presented in this study are available on request from the corresponding author. The data are not publicly available due to intellectual property.

Acknowledgments

We gratefully acknowledge the Anton Paar Poland sp.zoo for the technical and scientific support with electrochemical method application to our research. Best thanks to Kamil Kruk, Helena Bogusz and Rafał Flamholc.

Conflicts of Interest

The authors declare no conflict of interest.

References

  1. Schnitzer, M. Humic substances: Chemistry and reactions. In Soil Organic Matter; Schnitzer, M., Khan, S.U., Eds.; Elsevier: Amsterdam, The Netherlands, 1978; pp. 1–64. [Google Scholar]
  2. Stevenson, F.J. Humus Chemistry. Genesis. Compositions. Reactions; Wiley: New York, NY, USA, 1982. [Google Scholar]
  3. Tan, K.H. Humic Matter in Soil and the Environment: Principles and Controversies; CRC Press Taylor & Francis Group: Boca Raton, FL, USA, 2014. [Google Scholar]
  4. Paul, E.A. The nature and dynamics of soil organic matter: Plant inputs, microbial transformations and organic matter stabilization. Soil Biol. Biochem. 2016, 98, 109–126. [Google Scholar] [CrossRef] [Green Version]
  5. Olk, D.C.; Bloom, P.R.; Perdue, E.M.; McKnight, D.M.; Chen, Y.; Farenhorst, A.; Senesi, N.; Chin, Y.-P.; Schmitt-Kopplin, P.; Hertkorn, N.; et al. Environmental and agricultural relevance of humic fractions extracted by alkali from soils and natural waters. J. Environ. Qual. 2019, 48, 217–232. [Google Scholar] [CrossRef] [PubMed]
  6. Schulten, H.-R.; Leinweber, P. New insights into organic-mineral particles: Composition. properties and models of molecular structure. Biol. Fertil. Soils 2000, 30, 399–432. [Google Scholar] [CrossRef]
  7. Allen-King, R.M.; Grathwohl, P.; Ball, W.P. New modeling paradigms for the sorption of hydrophobic organic chemicals to heterogeneous carbonaceous matter in soils, sediments and rocks. Adv. Water Resour. 2002, 25, 985–1016. [Google Scholar] [CrossRef]
  8. Schnitzer, M.; Monreal, C.M. Quo vadis soil organic matter research? A biological link to the chemistry of humification. In Advances in Agronomy 113; Sparks, D.L., Ed.; Elsevier Academic Press Inc.: San Diego, CA, USA, 2011; pp. 139–213. [Google Scholar]
  9. Senesi, N. Humic substances as natural nanoparticles ubiquitous in the environment. In Molecular Environmental Soil Science at the Interfaces in the Earth’s Critical Zone; Xu, J., Huang, P.M., Eds.; Springer: Berlin/Heidelberg, Germany, 2010. [Google Scholar]
  10. Olk, D.C.; Bloom, P.R.; de Nobili, M.; Chen, Y.; McKnight, D.M.; Wells, M.J.M.; Weber, J. Using humic fractions to understand natural organic matter processes in soil and water: Selected studies and applications. J. Environ. Qual. 2019, 48, 1633–1643. [Google Scholar] [CrossRef] [Green Version]
  11. Lehmann, J.; Kleber, M. The contentious nature of soil organic matter. Nature 2015, 528, 60–68. [Google Scholar] [CrossRef]
  12. Lehmann, J.; Hansel, C.M.; Kaiser, C.; Kleber, M.; Maher, K.; Manzoni, S.; Nunan, N.; Reichstein, M.; Schimel, J.P.; Torn, M.S.; et al. Persistence of soil organic carbon caused by functional complexity. Nat. Geosci. 2020, 13, 529–534. [Google Scholar] [CrossRef]
  13. Schmidt, M.W.I.; Torn, M.S.; Abiven, S.; Dittmar, T.; Guggenberger, G.; Janssens, I.A.; Kleber, M.; Kögel-Knabner, I.; Lehmann, J.; Manning, D.A.C.; et al. Persistence of soil organic matter as an ecosystem property. Nature 2011, 478, 49–56. [Google Scholar] [CrossRef] [Green Version]
  14. Hayes, M.H.B.; Mylotte, R.; Swift, R.S. Humin: Its composition and importance in soil organic matter. In Advances in Agronomy; Sparks, D.L., Ed.; Academic Press: Burlington, NJ, USA, 2017; Volume 143, pp. 47–138. [Google Scholar]
  15. Janzen, H. The future of humic substances research: Preface to a debate. J. Environ. Qual. 2019, 48, 205–206. [Google Scholar] [CrossRef]
  16. Piccolo, A.; Celano, G.; de Simone, C. Interactions of atrazine with humic substances of different origins and their hydrolysed products. Sci. Total Environ. 1992, 117–118, 403–412. [Google Scholar] [CrossRef]
  17. Schaumann, G.E. Soil organic matter beyond molecular structure Part I: Macromolecular and supramolecular characteristics. J. Plant Nutr. Soil Sci. 2006, 169, 145–156. [Google Scholar] [CrossRef]
  18. Schaumann, G. E Soil organic matter beyond molecular structure Part II: Amorphous nature and physical aging. J. Plant Nutr. Soil Sci. 2006, 169, 157–167. [Google Scholar] [CrossRef]
  19. Pignatello, J.J.; Kwon, S.; Lu, Y. Effect of natural organic substances on the surface and adsorptive properties of environmental black carbon (Char): Attenuation of surface activity by humic and fulvic acids. Environ. Sci. Technol. 2006, 40, 7757–7763. [Google Scholar] [CrossRef] [PubMed]
  20. Pignatello, J.J. Dynamic interactions of natural organic matter and organic compounds. J. Soils Sediments 2012, 12, 1241–1256. [Google Scholar] [CrossRef]
  21. Lehmann, J.; Solomon, D.; Kinyangi, J.; Dathe, L.; Wirick, S.; Jacobsen, C. Spatial complexity of soil organic matter forms at nanometre scales. Nat. Geosci. 2008, 1, 238–242. [Google Scholar] [CrossRef]
  22. Kulikova, N.; Perminova, I. Binding of atrazine to humic substances from soil, peat, and coal related to their structure. Environ. Sci. Technol. 2002, 36, 3720–3724. [Google Scholar] [CrossRef]
  23. Niederer, C.; Schwarzen, R.; Goss, K. Elucidating differences in the sorption properties of 10 humic and fulvic acids for polar and nonpolar organic chemicals. Environ. Sci. Technol. 2007, 41, 6711–6717. [Google Scholar] [CrossRef]
  24. Chowdhury, R.; Atwater, J.; Hall, K. Role of soil humic and fulvic acid in the sorption of endosulfan (alpha and beta). Chem. Ecol. 2014, 30, 755–764. [Google Scholar] [CrossRef]
  25. Farenhorst, A.; Saiyed, I.; Gohm, T.; McQueen, P. The important characteristics of soil organic matter affecting the sorption of 2,4-dichlorophenoxyacetic acid sorption along a catenary sequence. J. Environ. Sci. Health Part B 2010, 45, 204–213. [Google Scholar] [CrossRef]
  26. Ukalska-Jaruga, A.; Debaene, G.; Smreczak, B. Dissipation and sorption processes of polycyclic aromatic hydrocarbons (PAHs) to organic matter in soils amended by exogenous rich-carbon material. J. Soils Sediments 2019, 20, 836–849. [Google Scholar] [CrossRef] [Green Version]
  27. Ukalska-Jaruga, A.; Klimkowicz-Pawlas, A.; Smreczak, B. Characterization of organic matter fractions in the top layer of soils under different land uses in Central-Eastern Europe. Soil Use Manag. 2019, 35, 595–606. [Google Scholar] [CrossRef]
  28. Di Donato, N.; Chen, H.M.; Waggoner, D.; Hatcher, P.G. Potential origin and formation for molecular components of humic acids in soils. Geochim. Cosmochim. Acta 2016, 178, 210–222. [Google Scholar] [CrossRef] [Green Version]
  29. Tiberg, C.; Sjostedt, C.; Gustafsson, J.P. Metal sorption to Spodosol Bs horizons: Organic matter complexes predominate. Chemosphere 2018, 196, 556–565. [Google Scholar] [CrossRef] [PubMed]
  30. Bloom, P.; Skyllberg, U. Soil pH and pH buffering. In Handbook of Soil Science, 2nd ed.; Huang, P.M., Li, Y., Sumner, M.E., Eds.; CRC Press: Boca Raton, FL, USA, 2012. [Google Scholar]
  31. Boguta, P.; Sokołowska, Z. Zinc binding to fulvic acids: Assessing the impact of pH. Metal concentrations and chemical properties of fulvic acids on the mechanism and stability of formed soluble complexes. Molecules 2020, 25, 1297. [Google Scholar] [CrossRef] [PubMed] [Green Version]
  32. Ukalska-Jaruga, A.; Debaene, G.; Smreczak, B. Particle and structure characterization of fulvic acids from agricultural soils. J. Soils Sediments 2018, 18, 2833–2843. [Google Scholar] [CrossRef]
  33. Song, G.; Novotny, E.H.; Simpson, A.J.; Clapp, C.E.; Hayes, M.H.B. Sequential exhaustive extraction of a Mollisol soil, and characterizations of humic components, including humin, by solid and solution state NMR. Eur. J. Soil Sci. 2008, 59, 505–516. [Google Scholar] [CrossRef]
  34. Song, G.; Hayes, M.H.B.; Novotny, E.H.; Simpson, A.J. Isolation and fractionation of soil humin using alkaline urea and dimethylsulphoxide plus sulphuric acid. Naturwissenschaften 2011, 98, 7–13. [Google Scholar] [CrossRef]
  35. Guimaraes, D.; Gonzaga, M.S.; da Silva, T.; da Silva Dias, T.; Matias, M.S. Soil organic matter pools and carbon fractions in soil under different land uses. Soil Till. Res. 2013, 126, 177–182. [Google Scholar] [CrossRef] [Green Version]
  36. Dou, S.; Zhang, J.J.; Li, K. Effect of organic matter applications on13C-NMR spectra of humic acids of soil. Eur. J. Soil Sci. 2008, 59, 532–539. [Google Scholar] [CrossRef]
  37. Mierzwa-Hersztek, M.; Gondek, K.; Kopeć, M.; Ukalska-Jaruga, A. Biochar changes in soil based on quantitative and qualitative humus compounds parameters. Soil Sci. Annu. 2018, 9, 234–242. [Google Scholar] [CrossRef] [Green Version]
  38. Senesi, N.; Miano, T.; Provenzano, M.; Brunetti, G. Characterization, differentiation, and classification of humic substances by fluorescence spectroscopy. Soil Sci. 1991, 152, 4. [Google Scholar] [CrossRef]
  39. Jiang, J.; Yu, H.; Xi, B.; Meng, F.; Zhou, Y.; Liu, H. UV-visible spectroscopic properties of dissolved fulvic acids extracted from salined fluvo-aquic soils in the Hetao Irrigation District. China Soil Res. 2011, 49, 670–679. [Google Scholar] [CrossRef]
  40. Enev, V.; Pospisilova, L.; Klucakova, M.; Liptaj, T.; Doskocil, L. Spectral characterization of selected humic substances. Soil Water Res. 2014, 9, 9–17. [Google Scholar] [CrossRef] [Green Version]
  41. Klucakova, M.; Kalina, M. Composition, particle size. charge. and colloidal stability of pH-fractionated humic acids. J. Soils Sediments 2015, 15, 1900–1908. [Google Scholar] [CrossRef]
  42. Baglieri, A.; Ioppolo, A.; Nègre, M.; Gennari, M. A method for isolating soil organic matter after the extraction of humic and fulvic acids. Org. Geochem. 2007, 38, 140–150. [Google Scholar] [CrossRef]
  43. Steinberg, C.E.W. Ecology of Humic Substances in Freshwaters; Springer Science and Business Media: Berlin, Germany, 2003. [Google Scholar]
  44. Mortimore, J.L.; Marshall, L.-J.R.; Almond, M.J.; Hollins, P.; Matthews, W. Analysis of red and yellow ochre samples from Clearwell Caves and Çatalhöyük by vibrational spectroscopy and other techniques. Spectrochim Acta Part A Mol. Biomol. Spectrosc. 2004, 60, 1179–1188. [Google Scholar] [CrossRef]
  45. Vaz, S. Analytical techniques. In Analytical Chemistry Applied to Emerging Pollutants; Vaz, S., Jr., Ed.; Springer Science and Business Media: Berlin, Germany, 2018; pp. 37–78. [Google Scholar]
  46. Swift, R. Organic matter characterization. In Methods of Soil Analysis Part 3—Chemical Methods; Sparks, D.L., Ed.; Soil Science Society of America: Madison, WI, USA; American Society of Agronomy: Madison, WI, USA, 1996; pp. 1011–1069. [Google Scholar]
  47. Swift, R. Fractionation of soil humic substances. In Humic Substances in Soil, Sediment and Water; Aiken, G., McKnight, D.M., Wershaw, R.L., MacCarthy, P., Eds.; Willey: New York, NY, USA, 1985; pp. 387–408. [Google Scholar]
  48. Hayes, M.; Swift, R. Genesis, isolation, composition and structures of soil humic substances. In Soil Colloids and Their Associations in Aggregates; De Boodt, M.F., Hayes, M.H.B., Herbillon, A., Eds.; Springer Science and Business Media: New York, NY, USA, 1990; pp. 245–305. [Google Scholar]
  49. Hu, W.; Mao, J.; Schmidt-Rohr, K.; Xing, B. NMR evidence for crystalline domains in humin substances. In Understanding Humic Substances, Advanced Methods, Properties and Applications; Ghabbour, E.A., Davies, G., Eds.; The Royal Society of Chemistry: Cambridge, UK, 2000; pp. 63–68. [Google Scholar]
  50. Alvarez-Puebla, R.A.; Garrido, J. Effect of pH on the aggregation of agray humic acid in colloidal and solid states. Chemosphere 2005, 59, 659–667. [Google Scholar] [CrossRef]
  51. Jovanovic, U.; Markovic, M.; Cupac, S.; Tomic, Z. Soil humic acid aggregation by dynamic light scattering and laser Doppler electrophoresis. J. Plant Nutr. Soil Sci. 2013, 176, 674–679. [Google Scholar] [CrossRef]
  52. Klucakova, M. Size and charge evaluation of standard humic and fulvic acids as crucial factors to determine their environmental behavior and impact. Front. Chem. 2018, 6, 235. [Google Scholar] [CrossRef]
  53. Hunter, R. Zeta potential in colloidal science. In Principles and Applications; Ottewill, R.H., Rowell, R.L., Eds.; Academic Press Harcourt: London, UK, 1988. [Google Scholar]
  54. Angelico, R.; Ceglie, A.; He, J.-Z.; Liu, Y.-R.; Palumbo, G.; Colombo, C. Particle size, charge and colloidal stability of humic acids coprecipitated with Ferrihydrite. Chemosphere 2014, 99, 239–247. [Google Scholar] [CrossRef]
  55. Esfahani, M.R.; Stretz, H.; Wells, M.J. Abiotic reversible self-assembly of fulvic and humic acid aggregates in low electrolytic conductivity solutions by dynamic light scattering and zeta potential investigation. Sci. Total Environ. 2015, 537, 81–92. [Google Scholar] [CrossRef] [PubMed]
  56. Cameron, R.; Thornton, B.; Swift, R.; Posner, A. Molecular weight and shape of humic acid from sedimentation and diffusion measurements on fractionated extracts. J. Soil Sci. 1972, 23, 394–408. [Google Scholar] [CrossRef]
  57. Tarasevich, Y.I.; Tryfonova, M.Y.; Dolenko, S.A.; Aksenenko, E. Adsorption-based approach to determine the size and mass of humic acids molecules. Adsorpt. Sci. Technol. 2016, 34, 125–133. [Google Scholar] [CrossRef]
  58. McAdams, B.C.; Aiken, G.R.; McKnight, D.M.; Arnold, W.A.; Chin, Y.P. High pressure size exclusion chromatography (HPSEC) determination of dissolved organic matter molecular weight revisited: Accounting for changes in stationary phases, analytical standards and isolation methods. Environ. Sci. Technol. 2018, 52, 722–730. [Google Scholar] [CrossRef] [PubMed]
  59. Guggenberger, G. Humification and mineralization in soils. In Microorganisms in Soils: Roles in Genesis and Functions, Soil Biology; Varma, A., Buscot, F., Eds.; Springer: Berlin/Heidelberg, Germany, 2005; Volume 3. [Google Scholar] [CrossRef]
  60. Zhang, J.; Lv, B.; Xing, M.; Yang, J. Tracking the composition and transformation of humic and fulvic acids during vermicomposting of sewage sludge by elemental analysis and fluorescence excitation-emission matrix. J. Waste Manag. 2015, 39, 111–118. [Google Scholar] [CrossRef] [PubMed]
  61. Torres-Sallan, G.; Schulte, R.; Lanigan, G.; Byrne, K.; Reidy, B.; Simó, I.; Six, J.; Creamer, R. Clay illuviation provides a long term sink for C sequestration in subsoils. Sci. Rep. 2017, 7, 45635. [Google Scholar] [CrossRef]
Figure 1. Location of sampling points in Puławy district (S1–S30) in Poland.
Agronomy 11 01067 g001
Figure 2. Mean VIS-NIR spectra of isolated FAs, HAs, HNs (n = 30) obtained by the Ward’s method.
Agronomy 11 01067 g002
Figure 3. (a) Principal Component Analysis (PCA) ordination biplot (PCA 1 vs. PCA 2), eigenvectors of correlation matrix used to generate PCA components representing impact of soil type on individual properties of humic substances for all data sets (n = 30). Arrows/lines in biplot represent variable loadings relative to each component. (b) Factor loading matrix; loading ≥0.5 in bold and marked by ‘*’.
Agronomy 11 01067 g003aAgronomy 11 01067 g003b
Table 1. Physicochemical properties of soils (n = 30).
MinMaxMedAverLQUQCoV
Clay (%)0221314145
Silt (%)0773235154863
Sand (%)0926259358042
pH in KCl4.87.56.96.66.07.312
TOC (g kg−1)6.458.712.114.39.614.966.9
TC (g kg−1)7.475.414.119.311.220.483.8
TN (g kg−1)0.76.61.31.51.01.768.5
TC:TN 9421112101247
TC—total carbon, TOC—total organic carbon, TN—total nitrogen; Min—minimum, Max—maximum, Med—median, Aver—average, LQ—lower quartil, UQ—upper quartil, CoV—coefficient of variance.
Table 2. Humic substances content in soils (n = 30).
MinMaxMedAverLQUQCoV
FA (g kg−1)0.51.80.91.00.81.334.3
HA (g kg−1)1.16.83.03.02.03.341.3
HN (g kg−1)2.854.56.49.74.99.3104.5
FA (% of TOC)2.113.47.88.16.79.031.6
HA (% of TOC)7.450.222.523.618.228.438.4
HN (% of TOC)35.692.756.162.647.565.350.1
HA/FA1.35.63.03.02.43.631.3
(HA+FA)/HN0.11.40.60.60.40.853.8
FAs—fulvic acids, HAs—humic acids, HNs—humins, TOC—total organic carbon; Min—minimum, Max—maximum, Med—median, Aver—average, LQ—lower quartil, UQ—upper quartil, CoV—coefficient of variance in %.
Table 3. Optical properties of individual humic substances (FA, HA, HN) (n = 30).
MinMaxMedAverLQUQCoV
FAE2/E4 10.564.738.238.8 a29.147.133.0
E2/E610.258.638.742.6 a22.959.656.0
E4/E66.29.78.07.9 a7.28.613.4
HAE2/E40.87.13.53.6 b2.84.639.7
E2/E614.134.423.424.1 b19.729.124.8
E4/E62.34.73.33.4 b3.13.615.5
HNE2/E4 0.982.011.041.31 c1.001.5430.95
E2/E61.064.201.622.01 c1.241.9456.49
E4/E61.052.091.261.47 c1.061.8729.32
FA—fulvic acids, HA—humic acids, HN—humins; Min—minimum, Max—maximum, Med—median, Aver—average, LQ—lower quartile, UQ—upper quartile, CoV—coefficient of variance; E2/E4, E2/E6, E4/E6 reflects absorbances ratio at 280 to 465 nm, at 280 to 665 nm, and at 465 to 665 nm wavelengths respectively; Lower letters indicate significant (p < 0.05) differences in average optical ratios between FA, HA and HN respectively, using ANOVA followed by Mann–Whitney U test.
Table 4. Electrochemical properties of individual HS fractions (FAs, HAs, and HNs) (n = 30).
MinMaxMedAverLQUQCoV
FAZP −6.4+8.7−2.3−1.3 c−3.9+0.4273.7
PSD0.2239.541.073.96 a0.393.670.22
PDI19352828 a263422
HAZP −47.8−5.3−30.4−29.0 b−36.5−24.735.2
PSD0.7015.890.160.74 c0.130.190.38
PDI20342827 a232611
HNZP +45.5+140.2+76.8+81.5 a+59.8+90.837.7
PSD0.6621.054.904.15 b0.804.420.04
PDI28322929 a29303
FAs—fulvic acids, HAs—humic acids, HNs—humins; Min—minimum, Max—maximum, Med—median, Aver—average, LQ—lower quartil, UQ—upper quartil, CoV—coefficient of variance in %; ZP—zeta potential in mV, PSD—particle size diameter in µm, PDI—polydispersity index in %; lower letters (a, b, c) indicate significant (p < 0.05) differences in the average electrochemical parameters between FAs, HAs, and HNs, respectively, using ANOVA, followed by the Mann–Whitney U test.
Table 5. Relations between basic soil physico-chemical properties and HS parameters calculated based on the Spearman’s correlation.
Sand (%)Silt (%)Clay (%)pHKClTOC
(g kg−1)
TN
(g kg−1)
TC
(g kg−1)
TC:TN
FA_E2/E4−0.010.04−0.24−0.08−0.43 *−0.42 *−0.49 *−0.57 *
FA_E2/E60.110.12−0.040.00−0.64 *−0.64 *−0.69 *−0.35
FA_E4/E60.29−0.33−0.13−0.160.140.040.100.32
HA_E2/E4−0.070.240.290.18−0.57 *−0.58 *−0.56 *−0.58 *
HA_E2/E6−0.120.050.080.14−0.56 *−0.27−0.31−0.05
HA_E4/E6−0.270.180.330.260.290.43 *0.41 *0.08
HN_E2/E40.60 *−0.100.310.36−0.20−0.200.100.60 *
HN_E2/E60.60 *−0.100.310.36−0.20−0.200.100.60 *
HN_E4/E60.300.70 *0.67 *0.21−0.10−0.10−0.30−0.20
FA_ZP0.100.000.030.060.120.120.140.24
FA_PDI−0.100.110.19−0.190.080.54 *0.02−0.10
FA_PSD−0.130.070.340.060.01−0.020.010.21
HA_ZP−0.240.280.240.36−0.26−0.21−0.26−0.27
HA_PDI−0.330.160.030.090.41 *0.51 *0.45 *0.12
HA_PSD−0.040.150.280.17−0.13−0.08−0.030.12
HN_ZP−0.60 *0.53 *−0.58 *−0.09−0.31−0.09−0.20−0.77 *
HN_PDI−0.09−0.090.030.110.140.56 *0.43 *0.60 *
HN_PSD0.54 *−0.71 *−0.58 *−0.29−0.14−0.260.030.66 *
TOC—total organic carbon, TC—total carbon, TN—total nitrogen pHKCl—reaction measured in KCL solution; ZP—zeta potential in mV, PSD—particle size diameter in µm, PDI—polydispersity index in %; E2/E4, E2/E6, E4/E6 reflects absorbances ratio at 280 to 465 nm, at 280 to 665 nm, and at 465 to 665 nm wavelengths, respectively; correlations statistically significant at p < 0.05 bold and marked by ‘*’.
Publisher’s Note: MDPI stays neutral with regard to jurisdictional claims in published maps and institutional affiliations.

