Review

Trends and Prospect of Machine Vision Technology for Stresses and Diseases Detection in Precision Agriculture

by
Jaemyung Shin
1,2,†,
Md. Sultan Mahmud
2,†,
Tanzeel U. Rehman
2,3,
Prabahar Ravichandran
2,4,
Brandon Heung
5 and
Young K. Chang
6,*
1
Department of Biomedical Engineering, Schulich School of Engineering, University of Calgary, Calgary, AB T2N 1N4, Canada
2
Department of Engineering, Faculty of Agriculture, Dalhousie University, Truro, NS B2N 5E3, Canada
3
Department of Biosystems Engineering, Auburn University, Auburn, AL 36849, USA
4
Department of Mechanical Engineering, Faculty of Engineering, Dalhousie University, Halifax, NS B3H 4R2, Canada
5
Department of Plant, Food, and Environmental Sciences, Faculty of Agriculture, Dalhousie University, Truro, NS B2N 5E3, Canada
6
Department of Agricultural & Biosystems Engineering, South Dakota State University, Brookings, SD 57006, USA
*
Author to whom correspondence should be addressed.
These authors contributed equally to this study.
AgriEngineering 2023, 5(1), 20-39; https://doi.org/10.3390/agriengineering5010003
Submission received: 8 November 2022 / Revised: 10 December 2022 / Accepted: 21 December 2022 / Published: 24 December 2022
(This article belongs to the Special Issue Computer Vision for Agriculture and Smart Farming)

Abstract

:
Introducing machine vision-based automation to the agricultural sector is essential to meet the food demand of a rapidly growing population. Furthermore, extensive labor and time are required in agriculture; hence, agriculture automation is a major concern and an emerging subject. Machine vision-based automation can improve productivity and quality by reducing errors and adding flexibility to the work process. Primarily, machine vision technology has been used to develop crop production systems by detecting diseases more efficiently. This review provides a comprehensive overview of machine vision applications for stress/disease detection on crops, leaves, fruits, and vegetables with an exploration of new technology trends as well as the future expectation in precision agriculture. In conclusion, research on the advanced machine vision system is expected to develop the overall agricultural management system and provide rich recommendations and insights into decision-making for farmers.

1. Introduction

The rapidly increasing economic, environmental, and population pressures have affected the global agricultural industry. Agriculture production faces many challenges in meeting the rapidly increased food demand from exponential population growth [1,2]. Hence, processes from cultivation to transportation need to be considered important and must be carefully monitored by experts to minimize yield losses. At the same time, the increasing environmental concerns should be reviewed, and ecological preservation practices need to be adopted [1]. These challenges should be solved by leveraging the sustainable technologies responsible for improving agricultural efficiency of inputs.
The current and newly developing agricultural technologies typically use machine vision systems along with the global positioning system to manage the spatiotemporal variations along farm fields [3,4]. Machine vision refers to a system that gives machines the vision and judgment capabilities humans have for image processing and data extraction; hence, it is a representative technology for industrial automation applications. To date, machine vision techniques in agriculture are frequently used for assessing crop seed quality, detecting water, nutrient, and pest stresses; and assessing crop quality. Furthermore, machine vision techniques can also be used for real-time field variable rate applications [5,6,7,8] or for collecting data for processing in a laboratory [9].
Previous reviews of machine vision techniques in precision agriculture were restricted to specific applications, such as fruit and vegetable quality evaluations [10], weed detection [11], plant stress detection at the greenhouse level [12], and autonomous agricultural vehicles [13]. However, not many (to the best of the authors’ knowledge) have reviewed the recent application of machine vision techniques combined with machine learning (ML), deep learning (DL), and other unique techniques. ML refers to a technology method in which a computer learns independently and improves the performance of artificial intelligence. DL is based on artificial neural network (ANN) models, which share similarities to human neurons and is about credit assignments in adaptive systems with long chains of potential links between actions and consequences. Both ML and DL are sub-concepts of artificial intelligence. The biggest difference is ML goes through explicit feature extraction/engineering processes, but DL solves the problems with a combination of layers and nonlinear functions. We focus on introducing the broad applications of machine vision techniques for various crops and provide a guide for specific imaging/ML techniques with applications in detecting plant stresses and diseases.
The following sections provide an overview of machine vision techniques used in agriculture. Section 2.1 provides an overview of methods for detecting stresses and deficiencies (e.g., water, nutrients, and pest). Section 2.2 provides an overview of methods for detecting diseases on plant leaves and fruit/vegetables. Section 3 describes the trends in machine vision research and Section 4 concludes the review by providing recommendations for technological development related to the detection of stresses and diseases, as well as their future contributions to precision agriculture. Overall, we approached this systematic review using the following three steps: (a) literature search and screening; (b) data analysis and extraction; and (c) reviewing the literature.

2. Machine Vision Techniques in Agriculture

2.1. Detection of Stresses
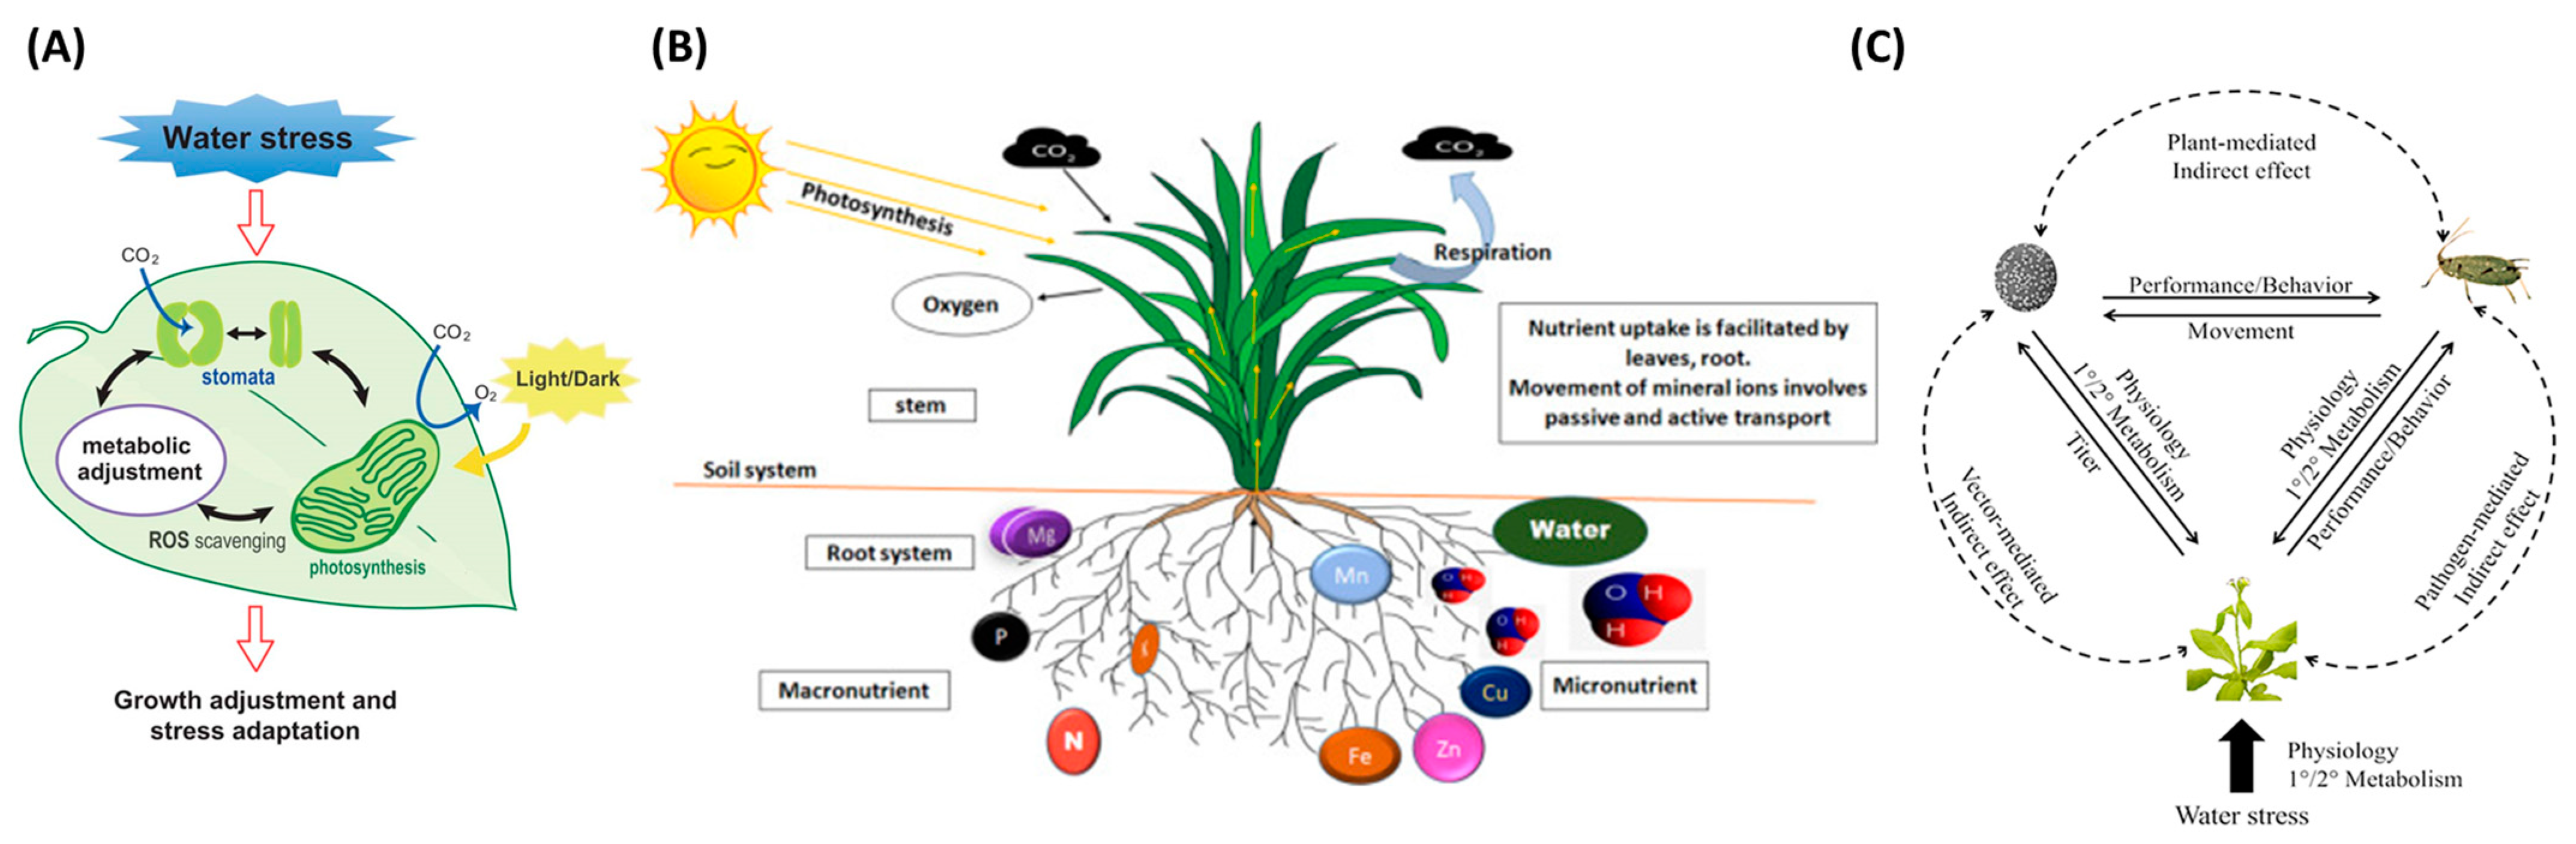
Crop stresses are significant constraints caused by biotic or abiotic factors that inauspiciously affect plant growth. When plants are stressed, different physiological symptoms may emerge; for example, water stress changes leaf color and limits water availability, thereby leading to stomata’s closing and impediment of photosynthesis and transpiration [14]. Figure 1 shows the representative stress types that can be occurred in plants. In Figure 1A, water stress is caused by a decrease in leaf water potential and stomatal heat, which leads to the down regulation in the availability of CO2, and is one of the main factors of excess light stress. Plant stomata change due to water stress, and metabolic changes occur. Plant roots absorb mineral elements from the soil; hence, Figure 1B demonstrates how mineral ions are absorbed and transported in the root system. Figure 1C shows direct and indirect interactions between insect vectors, pathogen-stressed plants, and hosts. The dotted line represents the indirect effect, and the solid line represents the direct effect.
Machine vision applications have been widely utilized for detecting plant stress, such as water stress [18,19,20], nutrient deficiency [21], and pest stress [22,23]. The mechanism of machine vision is to use a camera (sensors) to capture visual information, and then a combination of hardware and software processes the image the extracts the necessary data. Therefore, it is widely used in applications such as presence inspection, positioning, identification, defect detection, and measurement. Foucher et al. [24] measured plant stress using a perceptron with one hidden layer and imaging technique. The authors classified the pixels into a binary image (i.e., the plant in black and the background in white) to measure the shape parameters and defined the plant stress by characterizing the moment invariant, fractal dimension, and the average length of terminal branches. Chung et al. [25] evaluated a commercial smartphone to monitor vegetation health and stress rather than a near-infrared spectroscopy (NIR) spectrophotometer or a NIR camera, which was too costly. Ghosal et al. [26] demonstrated that a deep machine vision framework efficiently identified and classified the diverse stresses in soybean. With large datasets, the highest accuracy was 94.13% based on the confusion matrix, and the study’s outcomes could be used to detect plant stress in real-time on mobile applications. Elvanidi et al. [27] performed an ML technique with a hyperspectral sensor to provide remote visual data related to plant water and nitrogen deficit stress and achieved a classification accuracy of 91.4% when evaluated against an independent test dataset. Machine vision applications to detect stress on various targets, such as fruits, vegetables, pests, and plants summarized based on the alphabetical order of the target name (Table 1). The list includes information ranging from image processing technologies to recently emerging DL technologies. Water stress, nutrient deficiency, and pest stress are explored in order later in this Table.

2.1.1. Water Stress

Several studies have detected water stress using the movement of the plants and texture analysis. For example, Seginer et al. [41] used a machine vision system to track the vertical movement of leaf tips of four plants simultaneously for tomato plants. The results showed that the growing leaves had complex orientations, which were less useful for monitoring water stress levels, but fully expanded leaves were found to have linear vertical motions in response to the water stress level. Kacira et al. [18] used a machine vision technique for early and non-invasive detection of plant water stress using features derived from the top-projected canopy area (TPCA) of plants. The TPCA provides information about plant movement and canopy expansion. Although the use of projected canopy area-based features for detecting plant water stress was shown to be effective in the study, further research is needed to develop an earlier water stress detection system, which could be applied to a greater array of plants and their varieties. Ondimu and Murase [19] used color co-occurrence matrix (CCM), and grey-level co-occurrence matrix (GLCM) approaches to detect water stress in Sunagoka moss under natural growth environments. Six texture features were extracted, and multilayer perceptron neural network models were used to predict water stress in the study. The authors found that CCM texture features performed better than GLCM texture features and the features extracted from hue-saturation-intensity (HSI) color space was more effective and reliable in detecting water stress.
Few studies have detected water stress using optimization methods. For example, Hendrawan and Murase [40] determined water content by using bio-inspired algorithms to predict the water content of Sunagoke moss. Here, neural-discrete particle swarm optimization, neural-genetic algorithms, neural-ant colony optimization, and neural-simulated annealing algorithms were compared in their ability to identify the most important image features. The experimental outcome was obtained from the image features analysis, which consisted of eight colors, ninety textures, and three morphological features—the results showed that the neural-ant colony optimization algorithm was the most effective. The framework developed by Hendrawan and Murase [40] was useful as the symptoms of water stress vary from plant to plant, and it is challenging to identify the optimal feature set.
Multiple studies have detected water stress using DL; for example, An et al. [32] discovered that water stress influenced crop yield. They implemented convolutional neural networks (CNNs) to classify and identify water stress on maize to address the problem and demonstrated the DL-based approach was very promising. The ability of their approach towards identifying and classifying water stress had an accuracy of 98.14% and 95.95%, respectively. Ramos-Giraldo et al. [28] developed a machine vision system that measures water stress in corn and soybeans. Here, a transfer learning technique and a model based on DenseNet-12 were used to predict the drought responses with an image classification accuracy of 88%. Chandel et al. [33] used AlexNet, GoogLeNet, and Inception V3 to identify water stress on maize, okra, and soybean. The DL models were tested by collecting 1200 images of each crop, whereby the performance of GoogLeNet was found to be the best, with accuracy rates of 98.3%, 97.5%, and 94.1% for maize, okra, and soybean, respectively.
Multiple studies have used water stress detection for water management. Wakamori et al. [36] increased the precision of the estimation of the water stress and irrigation performance for high-quality fruit production. They used a multimodal neural network with a clustering-based drop to estimate the plant water stress. The proposed method improved the accuracy of water stress estimation by 21% and facilitated continuous fruit production by new farmers. Li et al. [38] stated that information on water stress is crucial to planning the irrigation schedule. They suggested an automated monitoring system of the water stress status for strawberries by combining red, green, and blue (RGB) and an infrared image. The single-point crop water stress index (CWSI) and area of CWSI were calculated, and their suitability as an indicator for the automatic diagnosis of plant stress was evaluated. The results showed that the area of CWSI was stable to use as a standard because the determination coefficient between the area CWSI and matching stomatal conductance were 0.8834, 0.8730, and 0.8851, which were greater than the results from using only the CWSI. Nhamo et al. [43] suggested that unmanned aerial vehicles improve agricultural water management and increase crop productivity. This research elucidates the role of unmanned aerial vehicles-derived normalized difference vegetation index in evaluating crop health as influenced by water stress and evapotranspiration.
Khanna et al. [39] focused on detecting the factors of stress and their combinations in crop production and curing them. They reconstructed a three-dimensional image of the plants to use as a benchmark and estimated the water, nitrogen, and weed stresses by using plant trait indicators. Mean cross-validation accuracies are 93%, 76%, and 83% for water, nitrogen, and weed stress severity, respectively.

2.1.2. Nutrient Deficiency

The nutrient can be classified as follows: water, proteins, vitamins, minerals, and bioactive substances such as antioxidants. In agriculture, minerals can be applied to the soil as fertilizers. The nutrient deficiency symptoms are mainly exhibited by the leaves via changes in color and texture [18]. Additionally, the symptoms of nutrient deficiency include the death of plant tissue, stunted growth, or yellowing of leaves due to reduced production of chlorophyll, which is required for photosynthesis.
Soils must have appropriate nitrogen, phosphorus, potassium, and other minerals. With the introduction of ML technologies, neural networks can figure out the soil composition and help farmers predict the quality of crop outcomes. Koley [44] used supervised ML and backpropagation neural networks to analyze organic matters, essential plant nutrients, and micronutrients that affect crop growth and significant components of soil and uncovered the relationship between these characteristics. Hetzroni et al. [45] revealed that plant nutrient deficiency of iron, zinc, and nitrogen, is characterized by plant size, color, and spectral features of individual lettuce plants. After collecting the images through image segmentation, the neural networks and statistical classifiers were used to determine the plant condition. Ahmad and Reid [31] detected color variations in stressed maize crops by measuring the variability of water and nitrogen levels. The authors evaluated the sensitivity of a machine vision system by comparing RGB, HSI, and chromaticity RGB coordinates color representations. The experimental results showed that the HSI color space could detect color variations more effectively than the RGB and chromaticity RGB coordinates. Mao et al. [46] recognized the deficiency of nitrogen and potassium in tomatoes by extracting their characteristics and features. The extracted features were combined and optimized to design the identifying system. Story et al. [29] developed a machine vision system to detect calcium deficiency in lettuce and were able to autonomously extract morphological, textual, and temporal characteristics of the plant.
Multiple studies have detected nutrient stress using combined image features and several different ML techniques. Xu et al. [21] analyzed the color and texture of tomato leaves to diagnose nutrient deficiency. A genetic algorithm was used to select features and obtain the most useful information from leaves for diagnosing deficiencies. Mao et al. [30] accurately predicted the nitrogen content of lettuce with 73 spectral data extracted using multiple sensors and by integrating spectroscopy and computer vision using an extreme learning machine model to measure the nitrogen content. Rangel et al. [47] used a machine vision system to diagnose and classify grapevine leaves with potassium deficiencies. Their results suggested that the k-nearest neighbors algorithm was more effective than a histogram-based method, especially with less controlled environment conditions (e.g., shadow).
Recently, multiple studies have detected nutrient stress using DL. Li et al. [48] reviewed the advantages and disadvantages of machine vision technology with non-destructive optical to monitor the nitrogen status of crops. Cevallos et al. [42] used CNN to detect nutrient deficiencies in tomato crops. They mainly focused on detecting nutrients, such as nitrogen, phosphorus, and potassium, and developed an automated nutrition monitoring system for tomatoes, achieving an accuracy of 86.57%. However, to increase robustness and accuracy, they collected more training data and made additional efforts to optimize lighting conditions. Han and Watchareeruetai [35] extracted features using ResNet-50 for six types of undernourished leaves, including old and young leaves, and calibrated logistic regression, support vector machines, and multilayer perceptron models. Among them, multilayer perceptron outperformed the other two methods with an accuracy of 88.33%.

2.1.3. Pest Stress

In addition to water and nutrient stress, pest stress is a significant concern for crop cultivation. Recently, machine vision applications have become more efficient in recognizing pest stress in agriculture. For example, Bauch and Rath [23] analyzed digital images of the plant to measure the density of an entomological pest and whiteflies using machine vision. Their study showed that the developed machine vision system could classify the captured objects into white flies. Similarly, Sena Jr. et al. [22] developed a machine vision algorithm for identifying the damage in maize plants from fall armyworm (Spodoptera frugiperda) pest damage using digital images. The original RGB images were transformed into index monochromatic images using the normalized excessive green index for experimentation and using the E_G = 2G-R-BR+G+B equation. The outcomes showed that the algorithm could perform with a classification accuracy of 94.72% using damaged and non-damaged maize plant images. Shariff et al. [37] used a digital image analysis algorithm based on fuzzy logic with digital values of color, shape, and texture features to identify pests in a paddy field where six types of pests were successfully categorized and detected. Boissard et al. [49] applied a cognitive machine vision technology to detect and count the whitefly at a mature stage of greenhouse crops. The image-processing algorithm was used with fine-tuned parameters and descriptor ranges for all relevant numerical descriptors for these applications. However, the outcomes of the study did not provide a satisfactory result because of the high false classification rate, which leads to erroneous pest density quantification. Muppala and Guruviah [50] detected the pest traps in the field using RGB images and summarized the machine vision technologies not only for pests but also for diseases and weeds detection. Rubanga et al. [34] used four pre-trained architectures (i.e., VGG 16, VGG 19, ResNet, and Inception-V3) to prevent and control Tuba absoluta, which causes 80 to 100 % cultivation loss problems in growing tomatoes. Among these, Inception-V3 had the highest accuracy of pest stress severity estimation.

2.2. Detection of Diseases

Machine vision processes and analyzes images captured from the environment and can detect disease through trained algorithms. Through this, many processes occurring in agriculture can be automated and controlled, and it is used to test the quality of the final product. There are five essential components in machine vision mechanisms. Firstly, appropriate illumination techniques (e.g., diffuse illumination, partial bright field illumination, dark field illumination, etc.) should be used to obtain important data from the sensor. Then, the image is captured through a lens and transmitted to an image sensor inside a camera. The image sensor inside a machine vision camera converts the light captured by the lens into a digital image. At this time, resolution, the number of pixels generated by the sensor, and sensitivity, the minimum quantity required to detect output change, are critical specifications for the image sensor. The machine vision system’s vision processing unit then uses algorithms to analyze the digital image produced by the sensor. It is processed with algorithms pre-programmed with ML and DL. The last is the communication system, where the decisions made by the vision processing unit are communicated to specific mechanical elements. In this section, studies that have applied the mechanisms mentioned above to disease detection are introduced. Table 2 and Table 3 show leaf disease detection and crop/vegetable disease detection, respectively, with an alphabetical order of target crop/plant name.

2.2.1. Disease Detection on Leaves

Plant leaf diseases have become a major challenge as they can substantially reduce the quality and quantity of horticultural crops [51]. Thus, many studies have explored the development of automated detection and classification techniques for plant leaf diseases using machine vision [52,53,54,55]. Al Bashish et al. [54] used k-means clustering and ANN image processing to cluster and classify disease-affected plant leaves, respectively. Their algorithm tested on five plant diseases (i.e., ashen mold, cottony mold, early scorch, late scorch, and tiny whiteness) and achieved a higher accuracy with ANN. The proposed technique was slower in computation and would not be appropriate for real-time application. An improvement of the methods from Al Bashish et al. [54] were made by Al-Hiary et al. [52] and achieved a 20% increase in computational efficiency. Using ANN, they developed a fast machine vision-based automatic detection system for plant leaf diseases based on images of infected plants. Although the authors successfully increased the accuracy in detection, the computation time for automatic detection was still high and remained unsuitable for real-time detection on a field scale. To further evaluate ANN approaches, Omrani et al. [56] proposed a radial basis function-based support vector regression approach, which proved to be more effective than a polynomial-based support vector regression and ANN for apple disease (i.e., black spot, apple leaf miner pest and Alternaria) detection. Arivazhagan et al. [53] identified early and late scorch and fungal diseases in beans by using texture features to detect the symptoms of the disease as quickly as they appear on plant leaves. The proposed system was developed with a software solution that extracted texture features from RGB images. Camargo and Smith [57] developed an image-processing-based algorithm for identifying disease symptoms from an analysis of color images in cotton crops. The results suggested that the I3 channel achieved an optimal pixel matching of 69.9% with the lowest level of misclassification of 8.7% than others. Chaudhary et al. [55] compared the effects of HSI, CIELAB, and YCbCr color space for disease spot segmentation in plant leaves using image processing techniques. A median filter was applied for image smoothing, and Otsu’s methods were used to calculate the threshold to find the disease spot.
Choudhary and Gulati [58] reviewed several studies that detected the scorch and spot diseases on several plant leaves, such as potatoes, using color, texture, and edge features with a combination of CCM and ANN. A k-means clustering was used for masking green pixels, which could remove the masked cells inside the boundaries of infected clusters. Kanjalkar and Lokhande [59] extracted color, size, proximity, and centroid features from leaves to detect four diseases in cotton and soybeans. The extracted features were classified using an ANN classifier and showed lower accuracy in all cases of leaf diseases. Naikwadi and Amoda [60] identified plant leaf diseases using the histogram matching technique. Histogram matching is based on edge detection technique and color texture due to the appearance of disease symptoms on leaves. Their study showed that the developed algorithm could successfully detect and classify diseases with precision between 83% and 94% [60]. Muthukannan et al. [61] proposed an ANN-based image processing technique with feed-forward neural network, learning vector quantization and radial basis function networks to assess diseased plants by processing the set of shape and texture features. Texture features were extracted from contrast, homogeneity, energy, correlation, and shape features from an area of the leaf surface. The experimental outcome revealed that the feed-forward neural network performed better with an overall detection accuracy of 90.7% in diseases that affect bean and bitter gourd leaves; however, learning vector quantization resulted in higher accuracy of 95.1% for bean leaves.
Wu et al. [62] used shape features with a probabilistic neural network to identify 32 species of Chinese plants from images of single leaves and compared the results against several other classifiers. The probabilistic neural network extracted 12 leaf features and reduced them to five principal variables, and finally, this algorithm can classify 32 plants with an accuracy of >90%. Singh and Misra [63] applied a genetic algorithm to detect plant diseases using the image segmentation process with soft computing techniques. Images were collected from banana, beans, jackfruit, lemon, mango, potato, tomato, and sapota plant species. The results showed that the support vector machine (SVM) classifier provided an accuracy of > 90% for rose, banana, lemon, and beans leaf disease classification. Kutty et al. [64] classified watermelon anthracnose and downy mildew leaf diseases using neural networks. The color features were extracted from the RGB color model, where the identified regions of interest were used to extract the RGB pixel color indices. Zhang et al. [65] carried out disease detection from images of cucumber leaves using sparse representation (SR) classification with the k-means clustering algorithm. The technique comprised a series of procedures, which included segmenting diseased leaf images by k-means clustering; extracting shape and color features from lesion information; and classifying diseased leaf images using SR. The technique was effective in identifying seven major cucumber diseases.
Recently, multiple studies have detected leaf diseases using DL. Sethy et al. [66] suggested that ResNet-50 and SVM were superior to the other 11 CNN models in classifying four kinds of rice leaf diseases. Karthik et al. [67] achieved an accuracy of 98% in detecting the three types of infection on the tomato leaves by using residual learning and a deep network. Xie et al. [68] used Faster R-CNN to detect four common leaf diseases in grapes and increased the image dataset from 4,449 to 62,286 using a data augmentation technique. Comprehensively, Jogekar and Tiwari [69] reviewed the studies that used DL techniques to identify and diagnose the disease on the plant leaves.
Table 2. Application of machine vision for disease detection on leaves.
TargetTechniquesResultsReferences
AppleColor and texture analysis using GLCM and wavelet transformationSupport vector machine (SVM) with radial basis function kernel showed a better relationship with disease (R2 = 0.963) than ANNOmrani et al., 2014 [56]
Banana, corn, cotton, soya, and alfalfaColor transformation from RGB and Image segmentationI3 channel achieved good pixel matching of 69.9% with the lowest level of misclassification among others Camargo & Smith, 2009 [57]
Banana, lemon, and beanCCM texture analysis with SVMYellow spots, brown spots, scorch, and late scorch were detected with an accuracy of 94%Arivazhagan et al., 2013 [53]
Bean and Bitter gourdColor and shape analysis92.1% and 89.1% accuracies were found for bean and bitter gourd diseases recognition with feed-forward neural network Muthukannan et al., 2015 [61]
Cherry, pine, and othersImage processing using morphological features analysis with probabilistic neural network An average accuracy of 90.312% for recognition of more than 30 different plantsWu et al., 2007 [62]
Cotton and soybeanColor transformation and segmentation with ANN for classification.Highest classification accuracy of 83% for angular leaf spot of cotton and 80% for soybeans leaf diseasesKanjalkar & Lokhande, 2013 [59]
CucumberColor and shape features analysis using sparse representation (SR)The overall recognition rate of 85.7% and the highest accuracy of 91.25% for grey mold diseases using SRZhang et al., 2017 [65]
GrapeVarious deep neural networks including a Faster R-CNN Deep learning-based Faster DR-IACNN model showed a precision of 81.1% mAP on grape leaf diseaseXie et al., 2020 [68]
Maize, cotton, blueberry, soybean, and others Image segmentation using RGB, YCbCr, HSI, and CIELAB color space‘a*’ component of CIELAB detected accurately of all cases disease spots instead of other color modelsChaudhary et al., 2012 [55]
No specific plant leavesHSI color system and segmentation by using Otsu’s methodA fast and accurate method to grade plant leaf spot diseases was developed by using the Sobel operatorWeizheng et al., 2008 [51]
No specific plant leavesCCM texture analysis with ANN classifierClassification of diseases with a precision between 83% and 94% Naikwadi & Amoda, 2013 [60]
No specific plantCCM for texture and shape analysisThe radial basis function of ANN showed 100% accuracy in scorch and spot classification of leavesChoudhary & Gulati, 2015 [58]
Rice13 CNN models for the identification of four kinds of rice leaf diseases ResNet-50 and SVM outperformed to other 11 CNN models by reporting an F1 score of 0.9838Sethy et al., 2020 [66]
Rose, bean, lemon, and bananaImage segmentation and soft computing techniquesSVM showed a higher overall accuracy of 95.71% than the Minimum Distance Criterion Singh & Mishra, 2017 [63]
TomatoResidual learning and deep network for detection of three types of tomato leaf diseasesThe proposed residual network achieved an accuracy of 98% to detect infection automaticallyKathiik et al., 2020 [67]
Tomato and othersCCM-based texture analysis with K-mean clustering and ANN classifierThe HS model performed better than the HSI model. Early scorch, cottony mold, ashen mold late scorch and tiny whiteness were recognized with the precision of around 93%Al Bashish et al., 2011 [54]
Tomato and othersCCM-based texture analysis with ANN and K-mean clusteringANN with HS model provided overall accuracy of 99.66% for early scorch, cottony mold, and normalAl-Hiary et al., 2011 [52]
WatermelonColor features analysis From regions of interest imagesANN achieved a classification accuracy of 75.9%Kutty et al., 2013 [64]

2.2.2. Diseases Detection on Fruits and Vegetables

Detecting defect affecting each fruit is critical for optimizing their market value and ensuring their quality to consumers. López-García et al. [70] detected the skin defects of citrus fruits using an algorithm combining multivariate image analysis and principal component analysis. The classification rate was acceptable, with an accuracy of 91.5%; however, the algorithm’s complexity constrained the recognition speed. Kim et al. [71] classified peel diseases in grapefruit using color co-occurrence matrix (CCM)-based color texture analysis with 39 features from HSI color space. Images were acquired from grapefruits with five common diseases: canker, copper, burn, melanosis, wind scar, and greasy spot peel conditions and normal. However, the model with 14 features achieved higher accuracy.
Qin et al. [72] applied hyperspectral images with 450-930 nm wavelengths in Ruby red grapefruit to detect citrus canker and other damages. The classification results yielded a 96% accuracy for differentiating the diseased, damaged, and healthy fruits using a spectral information divergence. Blasco et al. [73] developed a machine vision system using a region-growing segmentation algorithm. Images were taken with a Sony XC-003P camera and fluorescent tube light from mandarin fruit. The defective regions were determined and classified fruit into defective and non-defective classes. Blasco et al. [74] applied a multispectral inspection system to detect 11 types of defects in citrus. The results showed that severe defects were successfully detected in 94% of the cases, and most errors occurred due to confusion between the defects caused by medfly and oleocellosis disorder, which is caused by the presence of phytotoxic rind oils on the rind tissue.
Li et al. [75] used a hyperspectral imaging system to detect common skin defects in orange fruit. Principal component analysis was used to select the most discriminant wavelengths in the 400-1000 nm range. The results showed a better detection when using the third principal component images, which consisted of six wavelengths (630, 691, 769, 786, 810, and 875 nm) and the second principal component images, which consisted of two wavelengths (691 and 769 nm). The disadvantage of their approach was that it could not differentiate between different types of defects. In a subsequent study, Li et al. [76] combined lighting transformation and image ratio methods to detect common surface defects in oranges. Detection of defects, such as wind scarring, thrips scarring, scale infestation, dehiscent fruit, anthracnose, copper burn, and canker spot had higher accuracies. Rong et al. [77] experimented with a machine vision with segmentation algorithms to detect surface defects on oranges considering an uneven light distribution. The segmentation method was successfully performed with different surface defects, such as wind scarring, thrips scarring, insect injury, scale infestation, copper burn, canker spot, dehiscent fruit, and phytotoxicity.
Similar to evaluating citrus fruits, many studies have developed machine vision systems to detect the defects in apples via image processing techniques [78,79,80]. For example, Dubey and Jalal [81] classified diseases on apples using an image processing technique based on k-means clustering techniques for image segmentation. Color and texture features were extracted using four different techniques, such as global color histogram, color coherence vector, local binary pattern, and complete local binary pattern, to validate the accuracy and efficiency. Their study showed that their proposed technique could significantly support the accurate detection and automated classification of apple fruit diseases. Shahin et al. [79] applied neural networks to classify apples according to surface bruises, and discriminant analysis was used for selecting the salient features. Their study used line-scan X-ray imaging to examine new (1 day) and old (30 days) bruises in Golden and Red Delicious apples. They found that new bruises were not adequately separated using their methodology. Kleynen et al. [82] detected Jonagold apple defects using a correlation-based pattern-matching technique in a multispectral vision system. The results showed that 17% of defects were misclassified, and recognition rates for stems and calyxes were 91 and 92%, respectively. The authors suggested the pattern matching method has been widely applied for object recognition, but the major disadvantage is that of high dependency on the pattern used.
Machine vision is also used in the detection of blemishes on potatoes [83], tomatoes [84], and olives [85]. Barnes et al. [83] used a machine vision based accurate AdaBoost algorithm for potato defect classification. The minimalist classifiers with only ten selected features using the real AdaBoost algorithm showed detection accuracies of 89.6% and 89.5% for white and red potatoes, respectively, with less calculation requirement in the case of blemishes detection. Laykin et al. [84] used a color camera that captures images of the full view of an underlying tomato for automatic inspection. Four features were extracted: color, color homogeneity, bruise, and shape. The authors recorded different stages of tomato color development to measure the quality of the tomato. They also considered the color change of homogeneity between the harvest date and after storage. Diaz et al. [85] detected bruises and defects in olives by using a machine vision technique with three algorithms. The ANN algorithm classified olives with higher accuracy than partial least square regression and Mahalanobis algorithms. Ariana et al. [86] developed a machine vision system using near-infrared hyperspectral reflectance imaging for cucumber bruise detection. Three classification algorithms were tested, and the results showed that the band ratio and difference methods had similar performance but were better than the principal component analysis during classification. Wang et al. [87] used a liquid crystal tunable filter-based hyperspectral imaging system to detect sour skin, which is primarily a disease of onions. The experimental results suggested that the best contrast was in the spectral region of 1200-1300 nm and the sour skin infected region was darker than the healthy flesh region. In addition, the spectral range of 1400-1500 nm showed better contrast between the Vidalia sweet onion surface dry layer and fresh inner layer.
Recently, multiple studies have detected crop and vegetable diseases using DL. Elsharif et al. [88] used a deep CNN to identify four types of potatoes (red, red-washed, sweet, and white). The model’s validity was verified by obtaining an accuracy of 99.5% for the test set. Kukreja and Dhiman [89] achieved a classification accuracy of 67% in detecting normal and damaged citrus fruits using 150 original images. Subsequently, they showed a better performance of 89.1% by including data augmentation and by increasing the number of images to 1200. El-Mashharawi et al. [90] reported the potential of DL identifying the types of grapes with 4565 images and achieved 100% accuracy by using the image dataset from 30% of the validation set.
Table 3. Application of machine vision for disease detection on fruits and vegetables.
Crop/PlantTechniquesResultsReferences
AppleImage segmentation with fractal features and ANNDefect detection was effective with over 93% of accuracyLi et al., 2002 [78]
AppleX-ray imaging with ANN classifier90% and 83% for red and golden delicious apples and 93% of accuracy after threshold adjustment Shahin et al., 2002 [79]
AppleImage processing with multi-spectral opticsThe success rate was greater than 97.6% and wavebands were 740 nm, 950 nm and visible for surface defect detectionThroop et al., 2005 [80]
AppleAn image-based multi-spectral vision systemAccuracy of 100% for rejected apples and 98.2%, 94.5% and 55% for a recent bruise, serious and slight defect applesKleynen et al., 2005 [82]
AppleImage processing with K-mean clustering and multi-class SVMClassification accuracy was achieved up to 93%Dubey & Jalal, 2012 [81]
Citrus fruitsDense CNN algorithm used for the detection of citrus defects without pre-processing and data augmentation techniquesInitially, the proposed model achieved an accuracy of 67%, but the performance increased to an accuracy of 89.1% after the data augmentation techniqueKukreja & Dhiman, 2020 [89]
CucumberNear-infrared hyperspectral imaging with the spectral region of 900-1700 nmThe best band ratio of 988 nm and 1085 nm had identification accuracies between 82% and 93%Ariana et al., 2006 [86]
GrapeA machine learning-based approach for the identification of grape typesThis trained model reached an accuracy of 100% from 1146 images when testingEl-Mashharawi et al., 2020 [90]
GrapefruitCCM for color texture analysis with a discriminant function for classificationThe average classification accuracy was 96.0% and the best accuracy of 96.7% with 14 selected HSI featuresKim et al., 2009 [71]
GrapefruitHyperspectral reflectance imaging with spectral information divergenceOverall classification accuracy was 96.2%Qin et al., 2009 [72]
OlivesImage segmentation and ANN, Mahalanobis and least square discriminant classifiersANN with a hidden layer was classified as the defect and bruise of olives with an accuracy of over 90%Diaz et al., 2004 [85]
OnionLiquid crystal tunable filter based hyperspectral imaging systemThe spectral region of 1150-1280 nm was effective when onion was stored 3 days after being inoculatedWang et al., 2009 [87]
OrangeHyperspectral reflectance imaging with principal component analysis.The highest identification accuracy was 93.7% achieved for surface defects with no false positivesLi et al., 2011 [75]
OrangeComputer vision-based combined lighting transform and image ratio algorithm.An overall detection rate was 98.9% in the differentiation of normal and defective oranges.Li et al., 2013 [76]
OrangeImage processing-based window local segmentation algorithmThe image segmentation algorithm was able to correctly detect 97% of the defective orangeRong et al., 2017 [77]
Orange and MandarinComputer vision-based oriented region segmentation algorithmDetection results showed 100% of accuracy for medfly, sooty mold, green mold, stem end injury, phytotoxicity, anthracnose and stemBlasco et al., 2007 [73]
Orange and MandarinMultispectral imaging with morphological featuresThe overall success rate is about 86% with the highest success achieved in serious defectsBlasco et al., 2009 [74]
Orange and MandarinMultivariate image analysisAn accuracy of 91.5% for defect detection and 94.2% for damaged or sound fruitsLópez-García et al., 2010 [70]
PotatoMachine vision-based minimalist adaptive boosting algorithm (AdaBoost)Accuracy of 89.6% for white and 89.5% for red potato blemishes detectionBarnes et al., 2010 [83]
PotatoThe deep convolutional neural network was used to identify four types of potatoes (red, red-washed, sweet, and white)The trained CNN model achieved an accuracy of 99.5% from the test set among the 2400 image datasetElsharif et al., 2020 [88]
TomatoImage processing algorithm with color transformationHighest accuracy achieved of 100% for stem detection and 90% for both bruise and color homogeneity detectionLaykin et al., 2002 [84]

3. Trends in Machine Vision Research

A suite of research papers related to machine vision is summarized in this review and presented in three tables. Even though there were some challenges identified in the review process, such as the lack of skilled resources with emerging technologies; difficulties in acquiring the massive datasets in agriculture; and privacy and security issues when collecting the data, there has been abundant literature generated related to the use of ML, DL, and machine vision. In general, ML techniques were not the most commonly used technique to detect and classify diseases in agriculture. However, in recent years, DL techniques have become increasingly popular in the detection and identification of crops and pests, as well as in evaluating plant physiology. NIR, hyperspectral imaging system, and magnetic resonance imaging were also widely used in crop species identification. The hyperspectral camera could obtain luminosity for multiple consecutive spectral bands, and hyperspectral imaging was suitable for crop internal quality inspection.
Over the past three decades, the field of ML has matured and there has been tremendous progress made. However, since the 2000s, DL techniques have continued to emerge; yet it remains unclear whether ML or DL performs better. However, an essential difference between ML and DL is that the DL technique requires a large amount of data at least 10,000 observations to generate the complex model [91] whereby the larger the amount of data, the better the performance of DL [92].
Orlov et al. [93] designed an agricultural robot chassis and vehicle motion control for autonomous driving. They constructed an obstacle map on the ground using machine vision. As the number of people engaged in agriculture has decreased, machine vision is combined with robots to reduce labor costs and increase production efficiency. Machine visions are the ‘eyes’ of the robot and they can determine fruit ripeness and pick and transplant seedlings [94]. Qiu et al. [95] also developed a machine vision system by mounting an RGB camera and a computer to the transplanter to avoid obstacles in paddy fields. As such, the trend is to develop intelligent robots by combining cutting-edge DL algorithms with machines. Furthermore, the era of the 4th industrial revolution is the core of the development of the Internet of Things and mobile data. The development of mobile applications has changed greatly with the power of artificial intelligence, especially ML, DL, and machine vision technology [96]. As another approach, blockchain is being used to solve problems in various fields. In agriculture, in particular, it is being used in systems to improve food safety and efficiency of the food supply chain [97]. Lucena et al. [98] used blockchain technology to measure the quality of the grain throughout the transportation. As a preliminary result, they presented the blockchain-based certification that will lead to an additional assessment of approximately 15% for genetically modified free soybeans in the scope of Brazil’s grain export business network.

4. Conclusions

Machine vision is a promising technology that has rapidly advanced and developed during the past decades. It is expected that their developments will continue, providing cost-effective and robust technologies with sophisticated algorithmic solutions, enabling better crop state estimation [99]. The machine vision methods retain the ability to be non-destructive, persistent and rapid; hence, they are useful for reducing the need for labor to monitor the cultivation process. The machine vision techniques are robust and can account for the variability in light absorption characteristics of crops, vegetation, foods, and agricultural products, and can find a suitable solution for each specific problem. However, transferability, currently one of the challenges, is important in the machine vision field to improve the accuracy and speed of learning on a new task by transferring knowledge from a related task that has already been learned.
Among many imaging techniques, RGB was used as the most common method, which contains three additive primary colors and is widely used for the sensing and display of images in electronic systems, such as computers. Instead of RGB, spectral image processing uses tailored mathematical algorithms to manipulate and enhance data captured through techniques such as noise reduction and color correction. Hyperspectral imaging captures information from across the electromagnetic spectrum including spatial information of each pixel. Therefore, hyperspectral images have great advantages in finding objects, identifying materials, or detecting processes. In cultivation, the spectral imaging technique is especially used in inspecting the internal quality of the crops. In contrast, multispectral imaging can define the optimal bands more suitable for real-time or online applications. Specifically, several machine vision techniques have already been successfully applied to different crop cultivation practices. This review notably reveals the following:
  • Despite having some success in crop species identification by using RGB imaging with shape feature analysis, the newly developed deep CNN with RGB images would be a more appropriate solution for crop species identification.
  • Crop stress detection can be carried out through RGB and hyperspectral imaging.
  • The external crop defect can be detected successfully by RGB imaging, but this technique cannot detect internal defects.
  • The texture analysis of RGB images is a suitable tool for weed detection in the crop on a field scale.
  • Spectral imaging is a promising tool for crop internal quality inspection because the other imaging techniques have not been successful yet in this area of application. Magnetic resonance imaging also is a potential analytical technique for crop tissue damage detection; however, this technique is not fully matured yet for agricultural applications.
To date, many machine vision techniques have already been applied in agriculture; yet few applications were conducted in real-time in field conditions compared to the lab or controlled conditions. Based on current trends and limitations of machine vision technologies, the following can be expected in the future:
  • More optimized, targeted application of the currently available imaging equipment and established machine vision techniques to specific crop cultivation tasks.
  • Interconnected investigation of spatial, spectral, and temporal domains and incorporation of expert knowledge into machine vision application in agriculture.
  • Ensure the application of simplified multispectral imaging technology over hyperspectral imaging to reduce the cost and for convenient real-time application on a field scale.
  • Fast real-time and in-field image processing using hardware-based image processing devices (e.g., graphic processing unit, digital signal processor, and field-programmable gate array).
This review mainly evaluated, but was not limited to, RGB and spectral (hyperspectral, multispectral, and NIR) imaging instead of other imaging (e.g., X-ray, magnetic resonance) techniques in agricultural machine vision applications, as other imaging techniques had fewer applications and a lower success rate in agricultural cropping systems. Considering the image feature analysis, this review suggested that texture analysis is more successful and effective in specific crop cultivation tasks than color and shape analyses.

Author Contributions

Conceptualization, Y.K.C. and M.S.M.; resources, Y.K.C.; writing—original draft preparation, J.S., M.S.M., T.U.R. and P.R.; writing—review and editing, J.S., B.H. and Y.K.C.; supervision, Y.K.C. All authors have read and agreed to the published version of the manuscript.

Funding

This research received no external funding.

Institutional Review Board Statement

Not applicable.

Informed Consent Statement

Not applicable.

Data Availability Statement

Data sharing not applicable.

Conflicts of Interest

The authors declare no conflict of interest.

References

  1. Foley, J.A.; Ramankutty, N.; Brauman, K.A.; Cassidy, E.S.; Gerber, J.S.; Johnston, M.; Mueller, N.D.; O’Connell, C.; Ray, D.K.; West, P.C.; et al. Solutions for a cultivated planet. Nature 2011, 478, 337–342. [Google Scholar] [CrossRef] [PubMed] [Green Version]
  2. Baudron, F.; Giller, K.E. Agriculture and nature: Trouble and strife? Biol. Conserv. 2014, 170, 232–245. [Google Scholar] [CrossRef]
  3. Mavridou, E.; Vrochidou, E.; Papakostas, G.A.; Pachidis, T.; Kaburlasos, V.G. Machine vision systems in precision agriculture for crop farming. J. Imaging 2019, 5, 89. [Google Scholar] [CrossRef] [Green Version]
  4. Tian, H.; Wang, T.; Liu, Y.; Qiao, X.; Li, Y. Computer vision technology in agricultural automation—A review. Inf. Process. Agric. 2020, 7, 1–19. [Google Scholar] [CrossRef]
  5. Chattha, H.S.; Zaman, Q.U.; Chang, Y.K.; Read, S.; Schumann, A.W.; Brewster, G.R.; Farooque, A.A. Variable rate spreader for real-time spot-application of granular fertilizer in wild blueberry. Comput. Electron. Agric. 2014, 100, 70–78. [Google Scholar] [CrossRef]
  6. Chang, Y.K.; Zaman, Q.U.; Farooque, A.; Chattha, H.; Read, S.; Schumann, A. Sensing and control system for spot-application of granular fertilizer in wild blueberry field. Precis. Agric. 2017, 18, 210–223. [Google Scholar] [CrossRef]
  7. Rehman, T. Development of a Machine Vision Based Weed (Goldenrod) Detection System for Spot-Application of Herbicides in Wild Blueberry Cropping System. Master’s Thesis, Dalhousie University, Halifax, NS, Canada, 2017. [Google Scholar]
  8. Rehman, T.U.; Zaman, Q.U.; Chang, Y.K.; Schumann, A.W.; Corscadden, K.W.; Esau, T.J. Optimising the parameters influencing performance and weed (goldenrod) identification accuracy of colour co-occurrence matrices. Biosyst. Eng. 2018, 170, 85–95. [Google Scholar] [CrossRef] [Green Version]
  9. Farooque, A.A.; Chang, Y.K.; Zaman, Q.U.; Groulx, D.; Schumann, A.W.; Esau, T.J. Performance evaluation of multiple ground based sensors mounted on a commercial wild blueberry harvester to sense plant height, fruit yield and topographic features in real-time. Comput. Electron. Agric. 2013, 91, 135–144. [Google Scholar] [CrossRef]
  10. Cubero, S.; Aleixos, N.; Moltó, E.; Gómez-Sanchis, J.; Blasco, J. Advances in machine vision applications for automatic inspection and quality evaluation of fruits and vegetables. Food Bioprocess Technol. 2011, 4, 487–504. [Google Scholar] [CrossRef]
  11. Chang, Y.K.; Rehman, T.U. Current and future applications of cost-effective smart cameras in agriculture. In Robotics and Mechatronics for Agriculture, 1st ed.; Zhang, D., Wei, B., Eds.; CRC Press: Boca Raton, FL, USA, 2017; pp. 83–128. [Google Scholar]
  12. Lin, K.; Chen, J.; Si, H.; Wu, J. A review on computer vision technologies applied in greenhouse plant stress detection. In Proceedings of the Chinese Conference on Image and Graphics Technologies, Beijing, China, 2–3 April 2013. [Google Scholar]
  13. Li, M.; Imou, K.; Wakabayashi, K.; Yokoyama, S. Review of research on agricultural vehicle autonomous guidance. Int. J. Agric. Biol. Eng. 2009, 2, 1–16. [Google Scholar]
  14. Nilsson, H. Remote sensing and image analysis in plant pathology. Annu. Rev. Phytopathol. 1995, 33, 489–528. [Google Scholar] [CrossRef] [PubMed]
  15. Osakabe, Y.; Osakabe, K.; Shinozaki, K.; Tran, L.S.P. Response of plants to water stress. Front. Plant Sci. 2014, 5, 86. [Google Scholar] [CrossRef] [PubMed] [Green Version]
  16. Kumari, A.; Sharma, B.; Singh, B.N.; Hidangmayum, A.; Jatav, H.S.; Chandra, K.; Singhal, R.K.; Sathyanarayana, E.; Patra, A.; Mohapatra, K.K. Physiological mechanisms and adaptation strategies of plants under nutrient deficiency and toxicity conditions. In Plant Perspectives to Global Climate Changes; Academic Press: Cambridge, MA, USA, 2022. [Google Scholar]
  17. Szczepaniec, A.; Finke, D. Plant-vector-pathogen interactions in the context of drought stress. Front. Ecol. Evol. 2019, 7, 262. [Google Scholar] [CrossRef] [Green Version]
  18. Kacira, M.; Ling, P.P.; Short, T.H. Machine vision extracted plant movement for early detection of plant water stress. Trans. ASAE 2002, 45, 1147. [Google Scholar] [CrossRef]
  19. Ondimu, S.N.; Murase, H. Comparison of plant water stress detection ability of color and gray-level texture in Sunagoke moss. Trans. ASABE 2008, 51, 1111–1120. [Google Scholar] [CrossRef]
  20. Kim, Y.; Glenn, D.M.; Park, J.; Ngugi, H.K.; Lehman, B.L. Hyperspectral image analysis for water stress detection of apple trees. Comput. Electron. Agric. 2011, 77, 155–160. [Google Scholar] [CrossRef]
  21. Xu, G.; Zhang, F.; Shah, S.G.; Ye, Y.; Mao, H. Use of leaf color images to identify nitrogen and potassium deficient tomatoes. Pattern Recognit. Lett. 2011, 32, 1584–1590. [Google Scholar] [CrossRef]
  22. Sena, D.G., Jr.; Pinto, F.A.C.; Queiroz, D.M.; Viana, P.A. Fall armyworm damaged maize plant identification using digital images. Biosyst. Eng. 2003, 85, 449–454. [Google Scholar] [CrossRef]
  23. Bauch, C.; Rath, T. Prototype of a vision based system for measurements of white fly infestation. In Proceedings of the International Conference on Sustainable Greenhouse Systems-Greensys, Leuven, Belgium, 12–16 September 2004. [Google Scholar]
  24. Foucher, P.; Revollon, P.; Vigouroux, B.; Chasseriaux, G. Morphological image analysis for the detection of water stress in potted forsythia. Biosyst. Eng. 2004, 89, 131–138. [Google Scholar] [CrossRef]
  25. Chung, S.; Breshears, L.E.; Yoon, J.Y. Smartphone near infrared monitoring of plant stress. Comput. Electron. Agric. 2018, 154, 93–98. [Google Scholar] [CrossRef]
  26. Ghosal, S.; Blystone, D.; Singh, A.K.; Ganapathysubramanian, B.; Singh, A.; Sarkar, S. An explainable deep machine vision framework for plant stress phenotyping. Proc. Natl. Acad. Sci. USA 2018, 115, 4613–4618. [Google Scholar] [CrossRef] [PubMed]
  27. Elvanidi, A.; Katsoulas, N.; Kittas, C. Automation for Water and Nitrogen Deficit Stress Detection in Soilless Tomato Crops Based on Spectral Indices. Horticulturae 2018, 4, 47. [Google Scholar] [CrossRef] [Green Version]
  28. Ramos-Giraldo, P.; Reberg-Horton, C.; Locke, A.M.; Mirsky, S.; Lobaton, E. Drought Stress Detection Using Low-Cost Computer Vision Systems and Machine Learning Techniques. IT Prof. 2020, 22, 27–29. [Google Scholar] [CrossRef]
  29. Story, D.; Kacira, M.; Kubota, C.; Akoglu, A.; An, L. Lettuce calcium deficiency detection with machine vision computed plant features in controlled environments. Comput. Electron. Agric. 2010, 74, 238–243. [Google Scholar] [CrossRef]
  30. Mao, H.; Gao, H.; Zhang, X.; Kumi, F. Nondestructive measurement of total nitrogen in lettuce by integrating spectroscopy and computer vision. Sci. Hortic. 2015, 184, 1–7. [Google Scholar] [CrossRef]
  31. Ahmad, I.S.; Reid, J.F. Evaluation of colour representations for maize images. J. Agric. Eng. Res. 1996, 63, 185–195. [Google Scholar] [CrossRef]
  32. An, J.; Li, W.; Li, M.; Cui, S.; Yue, H. Identification and Classification of Maize Drought Stress Using Deep Convolutional Neural Network. Symmetry 2019, 11, 256. [Google Scholar] [CrossRef] [Green Version]
  33. Chandel, N.S.; Chakraborty, S.K.; Rajwade, Y.A.; Dubey, K.; Tiwari, M.K.; Jat, D. Identifying crop water stress using deep learning models. Neural Comput. Appl. 2021, 33, 5353–5367. [Google Scholar] [CrossRef]
  34. Rubanga, D.P.; Loyani, L.K.; Richard, M.; Shimada, S. A Deep Learning Approach. for Determining Effects of Tuta Absoluta in Tomato Plants. arXiv 2020, arXiv:2004.04023. [Google Scholar]
  35. Han, K.A.M.; Watchareeruetai, U. Black Gram Plant Nutrient Deficiency Classification in Combined Images Using Convolutional Neural Network. In Proceedings of the 2020 8th International Electrical Engineering Congress (iEECON), Mai, Thailand, 4 March 2020. [Google Scholar]
  36. Wakamori, K.; Mizuno, R.; Nakanishi, G.; Mineno, H. Multimodal neural network with. clustering-based drop for estimating plant water stress. Comput. Electron. Agric. 2020, 168, 105118. [Google Scholar] [CrossRef]
  37. Shariff, A.R.M.; Aik, Y.Y.; Hong, W.T.; Mansor, S.; Mispan, R. Automated identification and counting of pests in the paddy fields using image analysis. In Computers in Agriculture and Natural Resources, Proceedings of the 4th World Congress Conference, Orlando Florida, FL, USA, 23–25 July 2006; American Society of Agricultural and Biological Engineers: St. Joseph, MI, USA, 2006; p. 759. [Google Scholar]
  38. Li, H.; Yin, J.; Zhang, M.; Sigrimis, N.; Gao, Y.; Zheng, W. Automatic diagnosis of strawberry water stress status based on machine vision. Int. J. Agric. Biol. Eng. 2019, 12, 159–164. [Google Scholar]
  39. Khanna, R.; Schmid, L.; Walter, A.; Nieto, J.; Siegwart, R.; Liebisch, F. A spatio temporal spectral framework for plant stress phenotyping. Plant Methods 2019, 15, 1–18. [Google Scholar] [CrossRef] [PubMed] [Green Version]
  40. Hendrawan, Y.; Murase, H. Bio-inspired feature selection to select informative image features for determining water content of cultured Sunagoke moss. Expert Syst. Appl. 2011, 38, 14321–14335. [Google Scholar] [CrossRef]
  41. Seginer, I.; Elster, R.T.; Goodrum, J.W.; Rieger, M.W. Plant wilt detection by computer-vision tracking of leaf tips. Trans. ASAE 1992, 35, 1563–1567. [Google Scholar] [CrossRef]
  42. Cevallos, C.; Ponce, H.; Moya-Albor, E.; Brieva, J. Vision-Based Analysis on. Leaves of Tomato Crops for Classifying Nutrient Deficiency using Convolutional Neural Net-works. In Proceedings of the 2020 International Joint Conference on Neural Networks (IJCNN), Glasgow, UK, 19 July 2020. [Google Scholar]
  43. Nhamo, L.; Magidi, J.; Nyamugama, A.; Clulow, A.D.; Sibanda, M.; Chimonyo, V.G.; Mabhaudhi, T. Prospects of Improving Agricultural and Water Productivity through Unmanned Aerial Vehicles. Agriculture 2020, 10, 256. [Google Scholar] [CrossRef]
  44. Koley, S. Machine learning for soil fertility and plant nutrient management using back propagation neural networks. Int. J. Recent Innov. Trends Comput. Commun. 2014, 2, 292–297. [Google Scholar]
  45. Hetzroni, A.; Miles, G.E.; Engel, B.A.; Hammer, P.A.; Latin, R.X. Machine vision monitoring of plant health. Adv. Space Res. 1994, 14, 203–212. [Google Scholar] [CrossRef]
  46. Mao, H.P.; Xu, G.; Li, P. Diagnosis of nutrient deficiency of tomato based on computer vision. Trans. Chin. Soc. Agric. Mach. 2003, 34, 73–75. [Google Scholar]
  47. Rangel, B.M.S.; Fernández, M.A.A.; Murillo, J.C.; Ortega, J.C.P.; Arreguín, J.M.R. KNN-based image segmentation for grapevine potassium deficiency diagnosis. In Proceedings of the 2016 International conference on Electronics Communications and Computers (CONIELECOMP), Cholula, Mexico, 24 February 2016. [Google Scholar]
  48. Li, D.; Zhang, P.; Chen, T.; Qin, W. Recent development and challenges in spectroscopy and machine vision technologies for crop nitrogen diagnosis: A review. Remote Sens. 2020, 12, 2578. [Google Scholar] [CrossRef]
  49. Boissard, P.; Martin, V.; Moisan, S. A cognitive vision approach to early pest detection in greenhouse crops. Comput. Electron. Agric. 2008, 62, 81–93. [Google Scholar] [CrossRef] [Green Version]
  50. Muppala, C.; Guruviah, V. Machine vision detection of pests, diseases and weeds: A review. J. Phytol. 2020, 12, 9–19. [Google Scholar] [CrossRef] [Green Version]
  51. Weizheng, S.; Yachun, W.; Zhanliang, C.; Hongda, W. Grading method of leaf spot disease based on image processing. In Proceedings of the 2008 International Conference on Computer Science and Software Engineering, Wuhan, China, 12 December 2008. [Google Scholar]
  52. Al-Hiary, H.; Bani-Ahmad, S.; Reyalat, M.; Braik, M.; Alrahamneh, Z. Fast and accurate detection and classification of plant diseases. Int. J. Comput. Appl. 2011, 17, 31–38. [Google Scholar] [CrossRef]
  53. Arivazhagan, S.; Shebiah, R.N.; Ananthi, S.; Varthini, S.V. Detection of unhealthy region of plant leaves and classification of plant leaf diseases using texture features. Agric. Eng. Int. CIGR J. 2013, 15, 211–217. [Google Scholar]
  54. Al Bashish, D.; Braik, M.; Bani-Ahmad, S. Detection and classification of leaf diseases using K-means-based segmentation and Neural-networks-based classification. Inf. Technol. J. 2011, 10, 267–275. [Google Scholar] [CrossRef] [Green Version]
  55. Chaudhary, P.; Chaudhari, A.K.; Cheeran, A.N.; Godara, S. Color transform based approach for disease spot detection on plant leaf. Int. J. Comput. Sci. Telecommun. 2012, 3, 65–70. [Google Scholar]
  56. Omrani, E.; Khoshnevisan, B.; Shamshirband, S.; Saboohi, H.; Anuar, N.B.; Nasir, M.H.N.M. Potential of radial basis function-based support vector regression for apple disease detection. Measurement 2014, 55, 512–519. [Google Scholar] [CrossRef]
  57. Camargo, A.; Smith, J.S. An image-processing based algorithm to automatically identify plant disease visual symptoms. Biosyst. Eng. 2009, 102, 9–21. [Google Scholar] [CrossRef]
  58. Choudhary, G.M.; Gulati, V. Advance in Image Processing for Detection of Plant Diseases. Int. J. Adv. Res. Comput. Sci. Softw. Eng. 2015, 5, 1090–1093. [Google Scholar]
  59. Kanjalkar, H.P.; Lokhande, S.S. Detection and classification of plant leaf diseases using ANN. Int. J. Sci. Eng. Res. 2013, 4, 1777–1780. [Google Scholar]
  60. Naikwadi, S.; Amoda, N. Advances in image processing for detection of plant diseases. Int. J. Appl. Or Innov. Eng. Manag. 2013, 2, 11. [Google Scholar]
  61. Muthukannan, K.; Latha, P.; Selvi, R.P.; Nisha, P. Classification of diseased plant leaves using neural Network algorithms. ARPN J. Eng. Appl. Sci. 2015, 10, 1913–1919. [Google Scholar]
  62. Wu, S.G.; Bao, F.S.; Xu, E.Y.; Wang, Y.X.; Chang, Y.F.; Xiang, Q.L. A leaf recognition algorithm for plant classification using probabilistic neural network. In Proceedings of the 2007 IEEE International Symposium on Signal Processing and Information Technology, Giza, Egypt, 15 December 2007. [Google Scholar]
  63. Singh, V.; Misra, A.K. Detection of plant leaf diseases using image segmentation and soft computing techniques. Inf. Process. Agric. 2017, 4, 41–49. [Google Scholar] [CrossRef] [Green Version]
  64. Kutty, S.B.; Abdullah, N.E.; Hashim, H.; Kusim, A.S.; Yaakub, T.N.T.; Yunus, P.N.A.M.; Abd Rahman, M.F. Classification of watermelon leaf diseases using neural network analysis. In Proceedings of the Business Engineering and Industrial Applications Colloquium (Beiac), Langkawi, Malaysia, 7 April 2013. [Google Scholar]
  65. Zhang, S.; Wu, X.; You, Z.; Zhang, L. Leaf image based cucumber disease recognition using sparse representation classification. Comput. Electron. Agric. 2017, 134, 135–141. [Google Scholar] [CrossRef]
  66. Sethy, P.K.; Barpanda, N.K.; Rath, A.K.; Behera, S.K. Deep feature based rice leaf disease identification using support vector machine. Comput. Electron. Agric. 2020, 175, 105527. [Google Scholar] [CrossRef]
  67. Karthik, R.; Hariharan, M.; Anand, S.; Mathikshara, P.; Johnson, A.; Menaka, R. Attention embedded residual CNN for disease detection in tomato leaves. Appl. Soft Comput. 2020, 86, 105933. [Google Scholar]
  68. Xie, X.; Ma, Y.; Liu, B.; He, J.; Li, S.; Wang, H. A deep-learning-based real-time. detector for grape leaf diseases using improved convolutional neural networks. Front. Plant Sci. 2020, 11, 751. [Google Scholar] [CrossRef]
  69. Jogekar, R.N.; Tiwari, N. A review of deep learning techniques for identification and diagnosis of plant leaf disease. Trends Comput. Commun. Proc. SmartCom 2020, 182, 435–441. [Google Scholar]
  70. López-García, F.; Andreu-García, G.; Blasco, J.; Aleixos, N.; Valiente, J.M. Automatic detection of skin defects in citrus fruits using a multivariate image analysis approach. Comput. Electron. Agric. 2010, 71, 189–197. [Google Scholar] [CrossRef]
  71. Kim, D.G.; Burks, T.F.; Qin, J.; Bulanon, D.M. Classification of grapefruit peel diseases using color texture feature analysis. Int. J. Agric. Biol. Eng. 2009, 2, 41–50. [Google Scholar]
  72. Qin, J.; Burks, T.F.; Ritenour, M.A.; Bonn, W.G. Detection of citrus canker using hyperspectral reflectance imaging with spectral information divergence. J. Food Eng. 2009, 93, 183–191. [Google Scholar] [CrossRef]
  73. Blasco, J.; Aleixos, N.; Moltó, E. Computer vision detection of peel defects in citrus by means of a region oriented segmentation algorithm. J. Food Eng. 2007, 81, 535–543. [Google Scholar] [CrossRef]
  74. Blasco, J.; Aleixos, N.; Gómez-Sanchís, J.; Moltó, E. Recognition and classification of external skin damage in citrus fruits using multispectral data and morphological features. Biosyst. Eng. 2009, 103, 137–145. [Google Scholar] [CrossRef]
  75. Li, J.; Rao, X.; Ying, Y. Detection of common defects on oranges using hyperspectral reflectance imaging. Comput. Electron. Agric. 2011, 78, 38–48. [Google Scholar] [CrossRef]
  76. Li, J.; Rao, X.; Wang, F.; Wu, W.; Ying, Y. Automatic detection of common surface defects on oranges using combined lighting transform and image ratio methods. Postharvest Biol. Technol. 2013, 82, 59–69. [Google Scholar] [CrossRef]
  77. Rong, D.; Rao, X.; Ying, Y. Computer vision detection of surface defect on oranges by means of a sliding comparison window local segmentation algorithm. Comput. Electron. Agric. 2017, 137, 59–68. [Google Scholar] [CrossRef]
  78. Li, Q.; Wang, M.; Gu, W. Computer vision based system for apple surface defect detection. Comput. Electron. Agric. 2002, 36, 215–223. [Google Scholar] [CrossRef]
  79. Shahin, M.A.; Tollner, E.W.; McClendon, R.W.; Arabnia, H.R. Apple classification based on surface bruises using image processing and neural networks. Trans. ASAE 2002, 45, 1619. [Google Scholar]
  80. Throop, J.A.; Aneshansley, D.J.; Anger, W.C.; Peterson, D.L. Quality evaluation of apples based on surface defects: Development of an automated inspection system. Postharvest Biol. Technol. 2005, 36, 281–290. [Google Scholar] [CrossRef]
  81. Dubey, S.R.; Jalal, A.S. Detection and classification of apple fruit diseases using complete local binary patterns. In Proceedings of the 2012 Third International Conference on Computer and Communication Technology, Allahabad, India, 23 November 2012. [Google Scholar]
  82. Kleynen, O.; Leemans, V.; Destain, M.F. Development of a multi-spectral vision system for the detection of defects on apples. J. Food Eng. 2005, 69, 41–49. [Google Scholar] [CrossRef] [Green Version]
  83. Barnes, M.; Duckett, T.; Cielniak, G.; Stroud, G.; Harper, G. Visual detection of blemishes in potatoes using minimalist boosted classifiers. J. Food Eng. 2010, 98, 339–346. [Google Scholar] [CrossRef] [Green Version]
  84. Laykin, S.; Alchanatis, V.; Fallik, E.; Edan, Y. Image–processing algorithms for tomato classification. Trans. ASAE 2002, 45, 851. [Google Scholar] [CrossRef]
  85. Diaz, R.; Gil, L.; Serrano, C.; Blasco, M.; Moltó, E.; Blasco, J. Comparison of three algorithms in the classification of table olives by means of computer vision. J. Food Eng. 2004, 61, 101–107. [Google Scholar] [CrossRef]
  86. Ariana, D.P.; Lu, R.; Guyer, D.E. Near-infrared hyperspectral reflectance imaging for detection of bruises on pickling cucumbers. Comput. Electron. Agric. 2006, 53, 60–70. [Google Scholar] [CrossRef]
  87. Wang, W.; Thai, C.; Li, C.; Gitaitis, R.; Tollner, E.W.; Yoon, S.C. Detection of sour skin diseases in vidalia sweet onions using near-Infrared hyperspectral imaging. In Proceedings of the 2009 American Society of Agricultural and Biological Engineers AIM, Reno, Nevada, 21–24 June 2009. [Google Scholar]
  88. Elsharif, A.A.; Dheir, I.M.; Mettleq, A.S.A.; Abu-Naser, S.S. Potato Classification Using Deep Learning. Int. J. Acad. Pedagog. Res. (IJAPR) 2020, 3, 1–8. [Google Scholar]
  89. Kukreja, V.; Dhiman, P. A Deep Neural Network based disease detection scheme for Citrus fruits. In Proceedings of the 2020 International Conference on Smart Electronics and Communication (ICOSEC), Trichy, India, 10 September 2020. [Google Scholar]
  90. El-Mashharawi, H.Q.; Abu-Naser, S.S.; Alshawwa, I.A.; Elkahlout, M. Grape type classification using deep learning. Int. J. Acad. Eng. Res. (IJAER) 2020, 3, 12. [Google Scholar]
  91. Rasti, P.; Ahmad, A.; Samiei, S.; Belin, E.; Rousseau, D. Supervised Image Classification by Scattering Transform with Application to Weed Detection in Culture Crops of High Density Sensing. Remote Sens. 2019, 11, 249. [Google Scholar] [CrossRef] [Green Version]
  92. Shin, J.; Chang, Y.K.; Heung, B.; Nguyen-Quang, T.; Price, G.W.; Al-Mallahi, A. A deep learning approach for RGB image-based powdery mildew disease detection on strawberry leaves. Comput. Electron. Agric. 2021, 183, 106042. [Google Scholar] [CrossRef]
  93. Orlov, S.P.; Susarev, S.V.; Morev, A.S. Machine Vision System for Autonomous Agricultural Vehicle. In Proceedings of the 2020 International Conference on Industrial Engineering Applications and Manufacturing (ICIEAM), Sochi, Russia, 18–22 May 2020; pp. 1–5. [Google Scholar]
  94. Tian, Z.; Ma, W.; Yang, Q.; Duan, F. Application status and challenges of machine vision in plant factory—A review. Inf. Process. Agric. 2022, 9, 195–211. [Google Scholar] [CrossRef]
  95. Qiu, Z.; Zhao, N.; Zhou, L.; Wang, M.; Yang, L.; Fang, H.; He, Y.; Liu, Y. Vision-based moving obstacle detection and tracking in paddy field using improved yolov3 and deep SORT. Sensors 2020, 20, 4082. [Google Scholar] [CrossRef]
  96. Sarker, I.H. Machine learning: Algorithms, real-world applications and research directions. SN Comput. Sci. 2021, 2, 1–21. [Google Scholar] [CrossRef]
  97. Bermeo-Almeida, O.; Cardenas-Rodriguez, M.; Samaniego-Cobo, T.; Ferruzola-Gómez, E.; Cabezas-Cabezas, R.; Bazán-Vera, W. Blockchain in agriculture: A systematic literature review. In International Conference on Technologies and Innovation; Springer: Cham, Switzerland, 2018; pp. 44–56. [Google Scholar]
  98. Lucena, P.; Binotto, A.P.; Momo, F.D.S.; Kim, H. A case study for grain quality assurance tracking based on a Blockchain business network. arXiv 2018, arXiv:1803.07877. [Google Scholar]
  99. Mohi-Alden, K.; Omid, M.; Firouz, M.S.; Nasiri, A. A Machine Vision-Intelligent Modelling Based Technique for In-Line Bell Pepper Sorting. Inf. Process. Agric. 2022; in press. [Google Scholar]
Figure 1. Common stress mechanism in plants. (A) water stress (Section 2.1.1), (B) nutrient deficiency (Section 2.1.2), and (C) pest stress (Section 2.1.3). Reprinted with permission from [15,16,17].
Agriengineering 05 00003 g001
Table 1. Application of machine vision for stress detection in crops.
Target TechniquesResultsReferences
AppleHyperspectral imaging with spectral signature measurement of leaf surfacesRed edge normalized difference vegetation index (NDVI) at 705–750 nm and NDVI at 680–800 nm showed the highest correlation with water stressKim et al., 2011 [20]
Corn and soybeansDrought stress using a pretrained DenseNet-12 modelPredicted drought/water responses with an accuracy of 88%Ramos-Giraldo et al., 2020 [28]
ForsythiaShape analysis with moment invariant, fractal dimension, and skeleton measuresMeasured water stress and other stresses, such as thermal, mechanical, and mineral deficiency stressFoucher et al., 2004 [24]
Lettucegrey-level co-occurrence matrix (GLCM) texture, hue-saturation-luminance color, and top-projected canopy area (TPCA) morphological features analysisTPCA and three textural parameters showed a good relationship with calcium deficiency (R2 = 0.97) Story et al., 2010 [29]
LettuceColor, texture, and morphological features analysisCombined computer vision (CV) and spectroscopy techniques showed a higher accuracy of 88.64% for nitrogenMao et al., 2015 [30]
MaizeFeatures extraction using red, green, and blue (RGB), hue-saturation-intensity (HSI), and chromaticity coordinate transformationsHSI detected color variations in both water and nitrogen levels ahead of RGB and chromaticity coordinatesAhmad & Reid, 1996 [31]
MaizeImage segmentation using E_G = 2G-R-BR+G+BThe algorithm had a 94.72% accuracy for the presence of fall armyworm on plantSena Jr. et al., 2003 [22]
MaizeDeep convolutional neural network for classifying drought stress Accuracies of the identification and classification of drought stress were 98.14% and 95.95%, respectivelyAn et al., 2019 [32]
Maize, okra, and soybeanAlexNet, GoogLeNet, and Inception V3 were used to identify water stressGoogLeNet was at 98.3%, 97.5%, and 94.1% accuracy for maize, okra, and soybean, respectivelyChandel et al., 2020 [33]
New Guinea impatiens Image segmentation and feature extraction using TPCA with grey imagesPlant water stress detection was feasible with a 100% success rate using plant movementKacira et al., 2002 [18]
PestVGG 16, VGG 19, ResNet, and Inception-V3 were used to detect Tuba absolutaThe Inception-V3 reported the highest accuracy of 87.2% in estimating the severity of the pest in tomatoRubanga et al., 2020 [34]
Plants leaves Near-infrared spectroscopy reflectance and the red reflectance using an inexpensive high pass filter at 800 nm to a smartphone cameraA strong linear correlation with R2 = 0.948, corroborating the smartphone’s ability in evaluating NDVI associated with water stressChung et al., 2018 [25]
Plant leavesResNet-50, logistic regression, support vector machine, and multilayer perceptronMultilayer perceptron showed the best performance with accuracy of 88.33% for nutrient deficiency Han & Watchareeruetai, 2020 [35]
Plant stresstop-K high-resolution feature maps that isolate the visual symptomsThe deep convolutional neural network model built performed well with visual symptoms of chemical injury and nutrient deficiencyGhosal et al., 2018 [26]
Plant stressC-Drop neural networks were used to predict water stress.C-Drop neural networks increased the accuracy of water stress prediction by 21%Wakamori et al., 2020 [36]
RiceColor, shape, and texture features analysisAccuracy of 100% was achieved for six pest extraction and classificationShariff et al., 2006 [37]
StrawberryRGB and infrared image information was fused and used for auto-detection of the crop area temperatureR2 between area Crop Water Stress Index and three strawberry groups were 0.8834, 0.8730 and 0.8851, respectivelyLi et al., 2019 [38]
Sugar beetCanopy cover, height, hyperspectral reflectance, and vegetation indices were used as the benchmarkMean cross-validation accuracies were 93%, 76%, and 83% for drought, nitrogen, and weed stress severity classification, respectively.Khanna et al., 2019 [39]
Sunagoke mossCCM and GLCM texture analysis for 90 textural features with 3 morphological featuresThe n-ACO algorithm performed better with the lowest mean squared error of 0.00175 for water content determination.Hendrawan & Murase, 2011 [40]
TomatoCV-based image analysis tracks the vertical movement of leaf tips of plantsTomato plants have linear vertical motions in response to both water stress levels and carbon dioxide Seginer et al., 1992 [41]
TomatoColor and shape analysis of images with a charged coupled device camera.83.1% of the white flies were correctly classified.Bauch & Rath, 2004 [23]
TomatoThe classification Tree model was used to group complex hyperspectral datasets to provide remote visual results The combination of modified soil adjusted vegetation index, mrNDVI, and photochemical reflectance index determine water and nitrogen deficit stress with 91.4% classification accuracy values for the testing samplesElvanidi et al., 2018 [27]
TomatoConvolutional neural networks were used to detect nutrient deficiencies based on nitrogen, phosphorus, and potassiumDeveloped automated nutrition monitoring system for tomato crops achieved an accuracy of 86.57%Cevallos et al., 2020 [42]
Disclaimer/Publisher’s Note: The statements, opinions and data contained in all publications are solely those of the individual author(s) and contributor(s) and not of MDPI and/or the editor(s). MDPI and/or the editor(s) disclaim responsibility for any injury to people or property resulting from any ideas, methods, instructions or products referred to in the content.

