Article

The Effect of Cropping Systems on Environmental Impact Associated with Winter Wheat Production—An LCA “Cradle to Farm Gate” Approach

by
Chisenga Emmanuel Mukosha
1,*,
Jan Moudrý
1,
Magdaléna Lacko-Bartošová
2,
Lucia Lacko-Bartošová
2,
Festus Onyebuchi Eze
1,
Reinhard W. Neugschwandtner
3,
Elnaz Amirahmadi
1,
Jiří Lehejček
4 and
Jaroslav Bernas
1
1
Department of Agroecosystems, Faculty of Agriculture and Technology, University of South Bohemia in Ceske Budejovice, Branišovská 1645/31A, 370 05 Ceske Budejovice, Czech Republic
2
Institute of Agronomic Sciences, Faculty of Agrobiology and Food Resources, Slovak University of Agriculture in Nitra, Tr. A. Hlinku 2, 94976 Nitra, Slovakia
3
Institute of Agronomy, Department of Crop Sciences, University of Natural Resources and Life Sciences Vienna, Konrad-Lorenz-Straße 24, 3430 Tulln, Austria
4
Department of Environmental Security, Faculty of Logistics and Crisis Management, Tomas Bata University in Zlin, Studentské nám. 1532, Mařatice, 686 01 Uherské Hradiště, Czech Republic
*
Author to whom correspondence should be addressed.
Agriculture 2023, 13(11), 2068; https://doi.org/10.3390/agriculture13112068
Submission received: 19 September 2023 / Revised: 19 October 2023 / Accepted: 24 October 2023 / Published: 27 October 2023
(This article belongs to the Special Issue Impact of Agricultural Practices on the Environment)

Abstract

:
The demand for wheat production is increasing and is associated with environmental effects. To sustain the increased demand, there is a need to find sustainable methods of wheat production. The choice of cropping system can significantly affect the environmental burden of agricultural production systems. This study presents the results of monitoring emission loads resulting from winter wheat cultivation under different cropping systems: organic unfertilized (ORG), organic fertilized (ORG-F), conventional unfertilized (CON), and conventional fertilized (CON-F). The system boundaries include all the processes from “cradle to farm gate” and the functional unit was 1 kg of wheat grain. The primary data were obtained from experimental field trials and secondary data from Ecoinvent v3.5, WFLDB, and Agri-footprint v5.0 databases. The results of this study are related to eight impact categories. The SimaPro 9.2.0.1 software and ReCiPe Midpoint (H) V1.13/Europe Recipe H were used for calculation. The results show that fertilized variants recorded higher environmental impacts compared to the unfertilized variants. The results indicate that ORG-F was more environmentally friendly compared to the CON-F variant at the expense of lower yields. Overall, ORG imposes the lowest environmental impact and is deemed to be more environmentally friendly.

1. Introduction

Wheat is the most widely grown crop in the world and is one of the most important sources of cereal grain, which fulfills the food needs of around 40% of the world population [1]. Global wheat production was around 1459 million tons in 2022 [2]. Wheat is the most widely grown cereal in Slovakia (more than 50%), with up to 96% of this being winter wheat [3], accounting for 350–660 thousand ha and representing 26% of arable land [4]. In agroecosystems, greenhouse gas (GHG) emissions can be influenced by anthropogenic activities such as preferred cropping systems and intensive land-use management [5]. Agriculture in general is a major source of GHG emissions, with animal-based foods producing twice as many emissions as plant-based foods [6]. The emissions of GHGs such as carbon dioxide (CO2), methane (CH4), and nitrous oxide (N2O) have a considerable influence on global warming, eutrophication, and human toxicity [7]. This can further impact climate, humans, soil, water bodies, air, forests, etc. [8,9]. In wheat production, GHG emissions may be reduced by the choice of cropping system, which can significantly affect the amount of emissions from agriculture [10]. Therefore, a change in the cropping system or a partial move to a more extensive farming technique may be included in reducing GHG emissions [11]. These initiatives could entail switching to conservation tillage, cutting back on the nitrogen fertilizer used on crops, and altering livestock and waste management [12].
There are different perspectives as to which system, regarding the environment and climate change, is more beneficial [6]. Organic agriculture is the most popular alternative farming system in the world [13] and is of increasing interest worldwide, especially in developed countries [14], with the demand for organically produced food in Europe constantly increasing [15]. The reason for this trend is that organically grown foods are believed by a high share of consumers to be healthier, taste better [16], and be more friendly to the environment than their conventional counterparts [17,18,19]. Synthetic pesticides and fertilizers used in conventional farming systems are not allowed to be used in organic systems [20]. Farmyard manure is a valuable organic fertilizer for increasing yield and maintaining soil fertility [21]. The substitution of mineral fertilizer with farmyard manure can decrease the energy input into the system [22]; conversely, however, the lower yields in organic farming imply that more land is required to produce the same amount of output in organic as in conventional farming [23]. The demand for additional land in organic agriculture to compensate for the lower yields faces challenges due to land use changes [24,25].
Conventional farming systems are commonly used systems [26] and the choice of the cropping system can increase the wheat yield, as reported by Moitzi et al. (2021) [22]. However, conventional farming systems require a wide range of external inputs to sustain the outputs and profit [27]. Pesticides are intensively used today in conventional agriculture to increase crop yield and quality, but the disadvantages include possible biomagnification and persistence in nature [28]. Organic and mineral fertilizers are key factors in the regulation of N2O and NO emissions from soil [29]. Mineral fertilizers can increase the energy efficiency of wheat production, but high fertilizer doses might impair the energy efficiency as the energy input can increase faster than the grain yields [30].
As a result, it is critical to be able to precisely calculate the environmental impacts of conventional and organic cropping systems for winter wheat production. To date, a life cycle assessment (LCA) study comparing wheat production performance in organic farming systems using organic sheep fertilizers and conventional farming in Slovakia has yet to be conducted. The LCA methodology is appropriate for a comparative study [31]. This method was originally developed for use in industrial operations but has later been adapted for a wider range of applications, including agriculture [32], to identify opportunities for improvement [31] and find mitigation strategies that focus on the primary sources of GHG [33]. Comparative studies are often used to compare the environmental sustainability of products from different agricultural production systems [34]. An agricultural LCA is one of the most holistically applicable methods, aiming for a comprehensive assessment of the environmental profile of the production system. The potential environmental impacts of agri-food chains and agricultural production systems can be assessed using an LCA to identify contributing hot spots and find mitigation strategies for the overall environmental burden [31]. An LCA can be undertaken to account for the GHG emitted in different cropping systems [33].

2. Materials and Methods

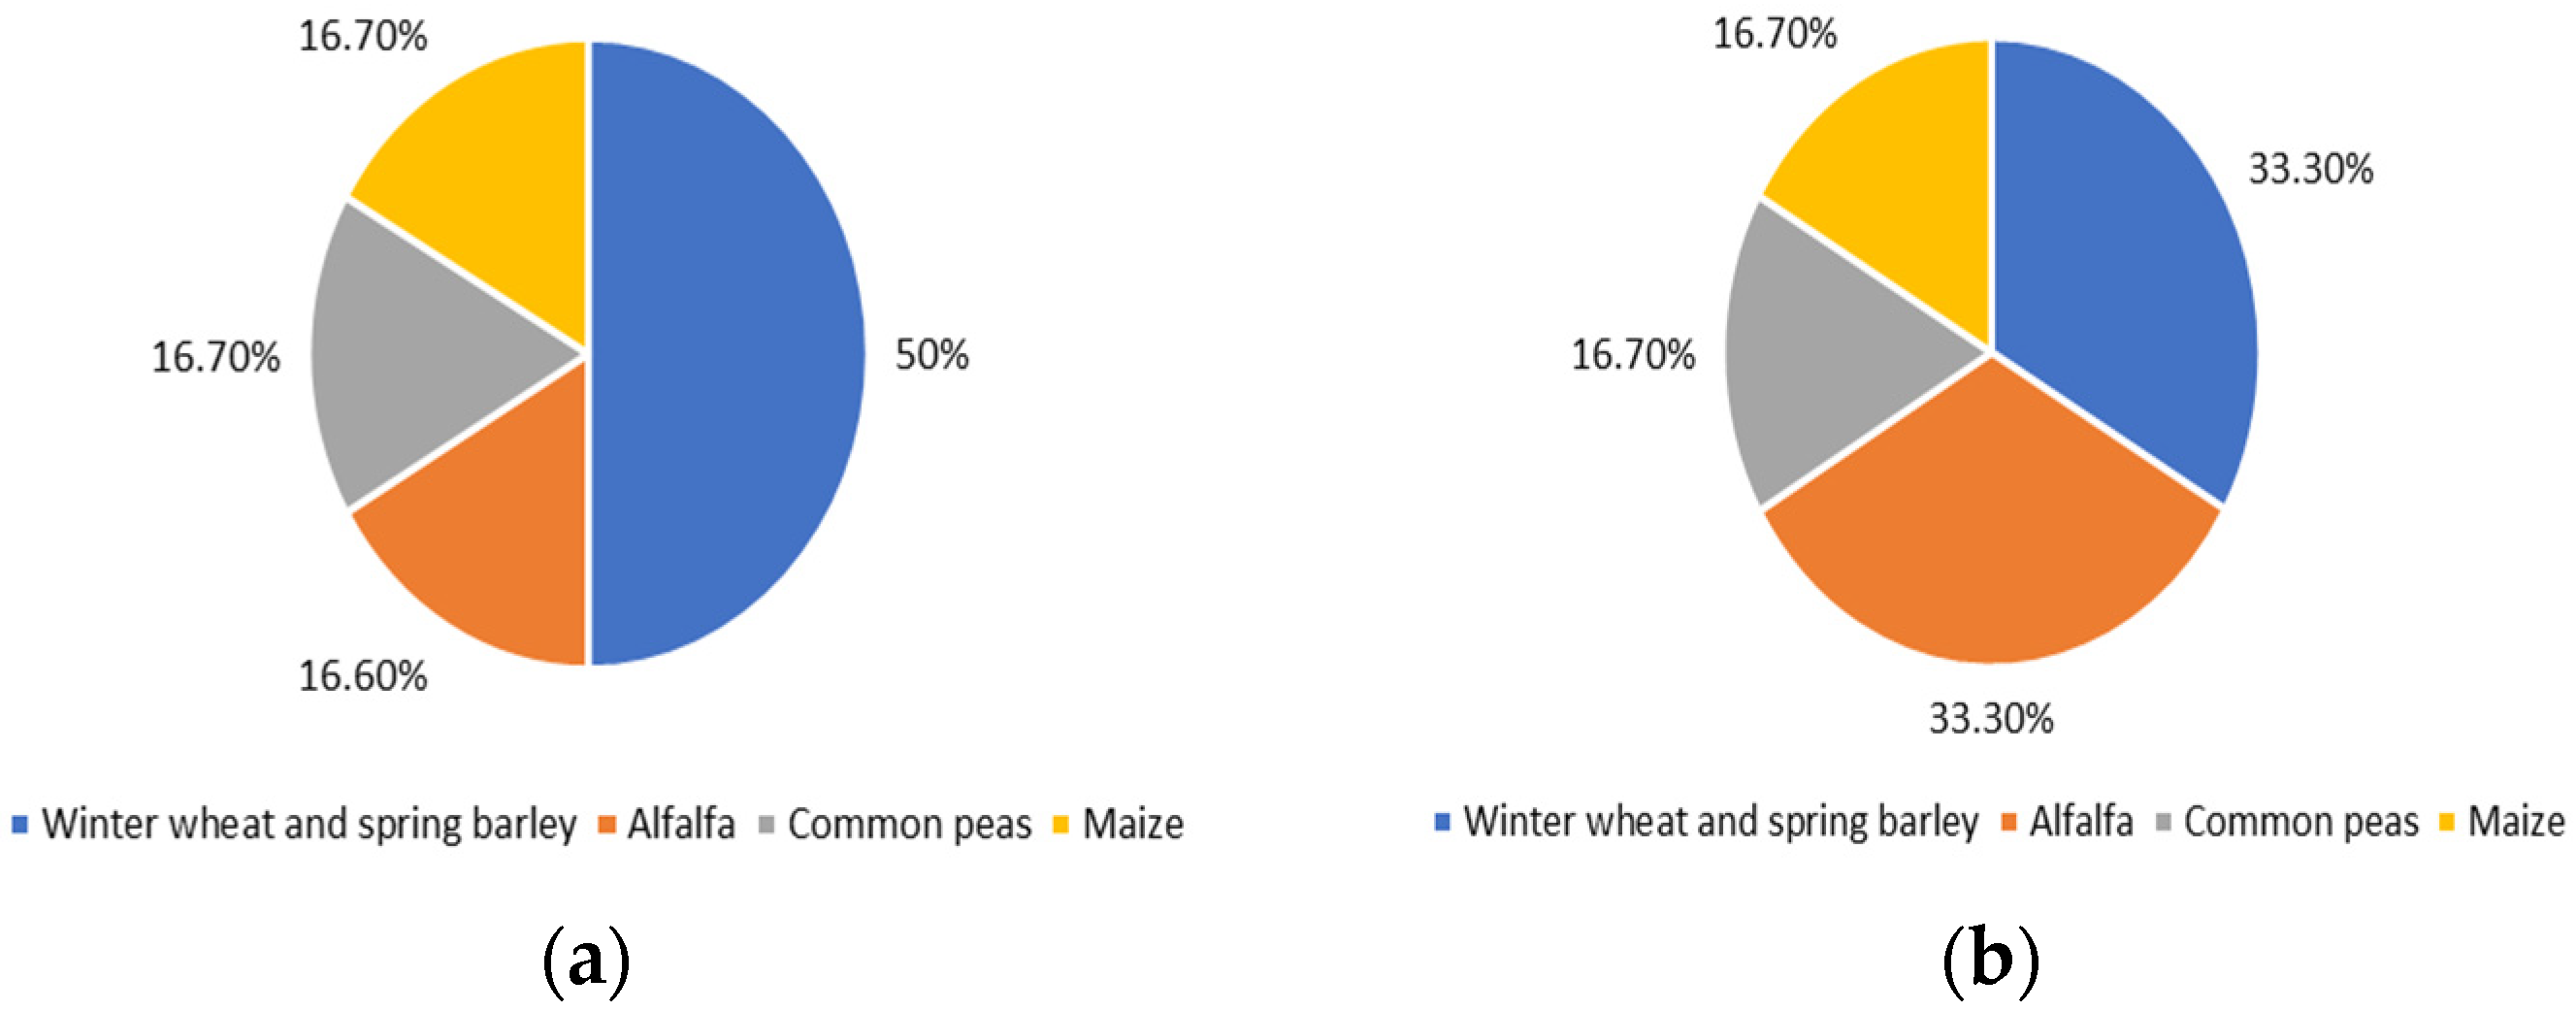
2.1. Field Site and Experimental Design

The field experiments were conducted at the field experimental base of the Faculty of Agrobiology and Food Resources, Slovak University of Agriculture in Nitra (48°19′ N, 18°07′ E). Long-term cropping system experiments have been conducted at the experimental base since 1999. The soil type is a haplic luvisol developed using proluvial sediments mixed with loess. The elevation of the experimental area is 178 m above sea level. The experimental site has a continental climate and belongs to a warm agro-climatic region, and is an arid subregion with predominantly mild winters.
The field trails were performed under organic (ORG) and conventional (CON) farming systems. The study was based on a three-year field study during the growing seasons of 2018/2019, 2019/2020, and 2020/2021. The sowing dates of winter wheat in CON and ORG systems were 10 October 2018, 8 October 2019, and 17 October 2020, and harvest dates were 14 July 2019, 20 July 2020, and 14 July 2021 of the growing seasons.
A split-plot design was used with cropping systems as the main factor, and subplots were fertilization treatments. The experimental factors were cropping systems, fertilization, and growing seasons. Complete crop rotations were performed every year in four replicates and the area of one plot was 100 m2. The fertilization treatments were fertilized (F) and unfertilized (UF, without manure or fertilizers) treatments. The fertilized treatments were based in both cropping systems on 40 t ha−1 of manure, which was applied to maize (4 years before winter wheat sowing) with medium-depth ploughing. Soil cultivation was undertaken by mechanically ploughing at a depth of 0.2 m in both systems.
The share of crops in the two cropping systems ORG and CON is summarized in Figure 1. The pre-crop for winter wheat was a leguminous crop.
For winter wheat, the application rate was calculated based on the macronutrient content in the soil and the plant needs to obtain a yield of 6 t ha-1. The application rates of mineral fertilizers in the CON system were for the first growing season (80 kg N ha−1, 40 kg P2O5 ha−1, 120 kg K2O ha−1), for the second growing season (85 kg N ha−1, 40 kg P2O5 ha−1, 90 kg K2O ha−1), and for the third growing season (75 kg N ha−1, 30 kg P2O5 ha−1, 20 kg K2O ha-1). The mineral fertilizers in the CON system were applied in three split applications according to the BBCH (Biologische Bundesanstalt, Bundessortenamt und Chemische Industrie) scale in all three monitored years. The BBCH scale is widely used to describe the phenological development stages of plants [35]. The first fertilizer dose applied in the CON system was full doses of P2O5 and K2O which were applied before sowing. The second application dose was the regeneration dose of N at BBCH 12 leaf development (60 kg, 45 kg, 30 kg N ha−1) for the growing seasons 2018/2019, 2019/2020, and 2020/2021, respectively. The third N fertilizer application was the productive dose (20 kg, 40 kg, 45 kg N ha−1) at the BBCH 28 tillering stage. In the ORG system, organic fertilizer approved for organic agriculture (Flovenal, Kosice, Slovakia) was used. The organic fertilizer was used in one application for the growing seasons 2018/2019 and 2019/2020, and two applications for growing season 2020/2021 at BBCH 12 leaf development (48 kg, 30 kg, 70 kg NPK ha−1) and during BBCH 28 tillering NPK (20 kg, 12 kg, 32 kg NPK ha−1). Weeds were managed in the ORG system mechanically, and in the CON system by herbicides (0.6 l/ha). Fungicides and insecticides were not used.

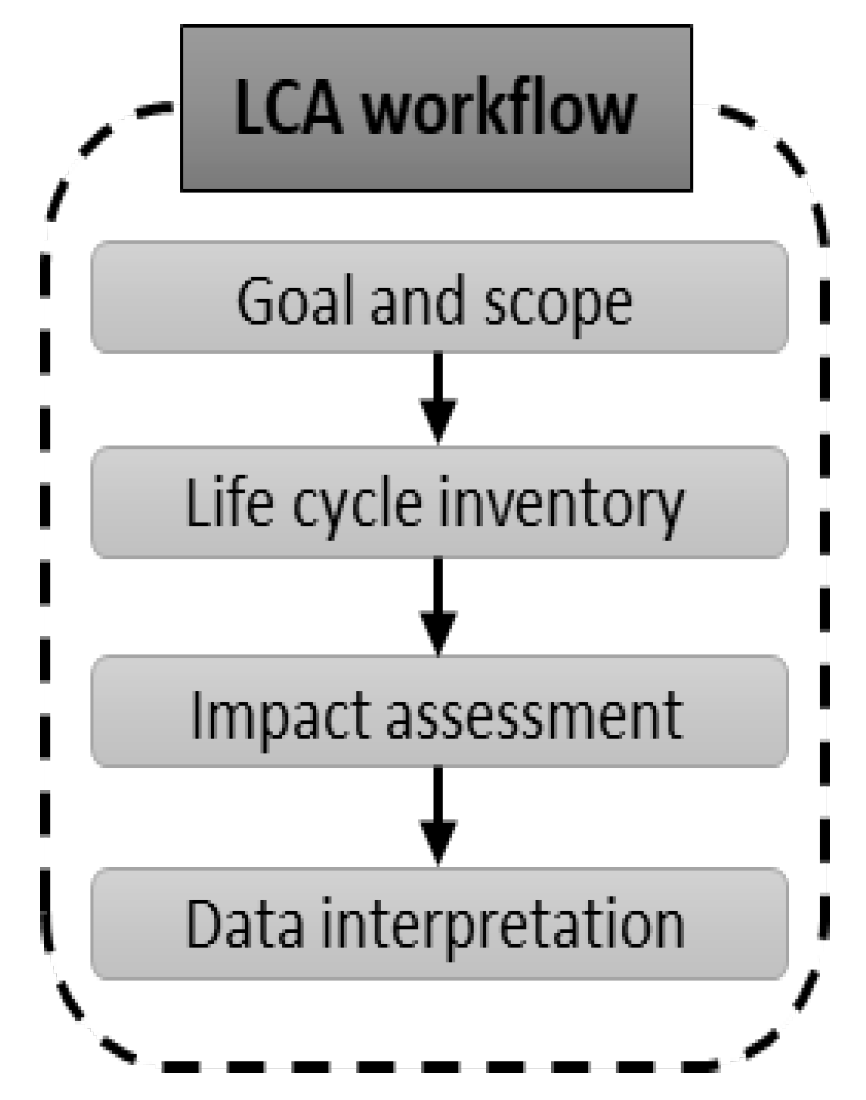
2.2. Life Cycle Assessment

The LCA method used in this study is in accordance with ISO14044 [36] and ISO 14040 [37]. This LCA includes four stages as shown in Figure 2. The SimaPro 9.2.0.1 software, ReCiPe Midpoint (H) V1.13/Europe Recipe H methodology, and data from Ecoinvent v3.5, WFLDB, and Agri-footprint v5.0, databases were used.

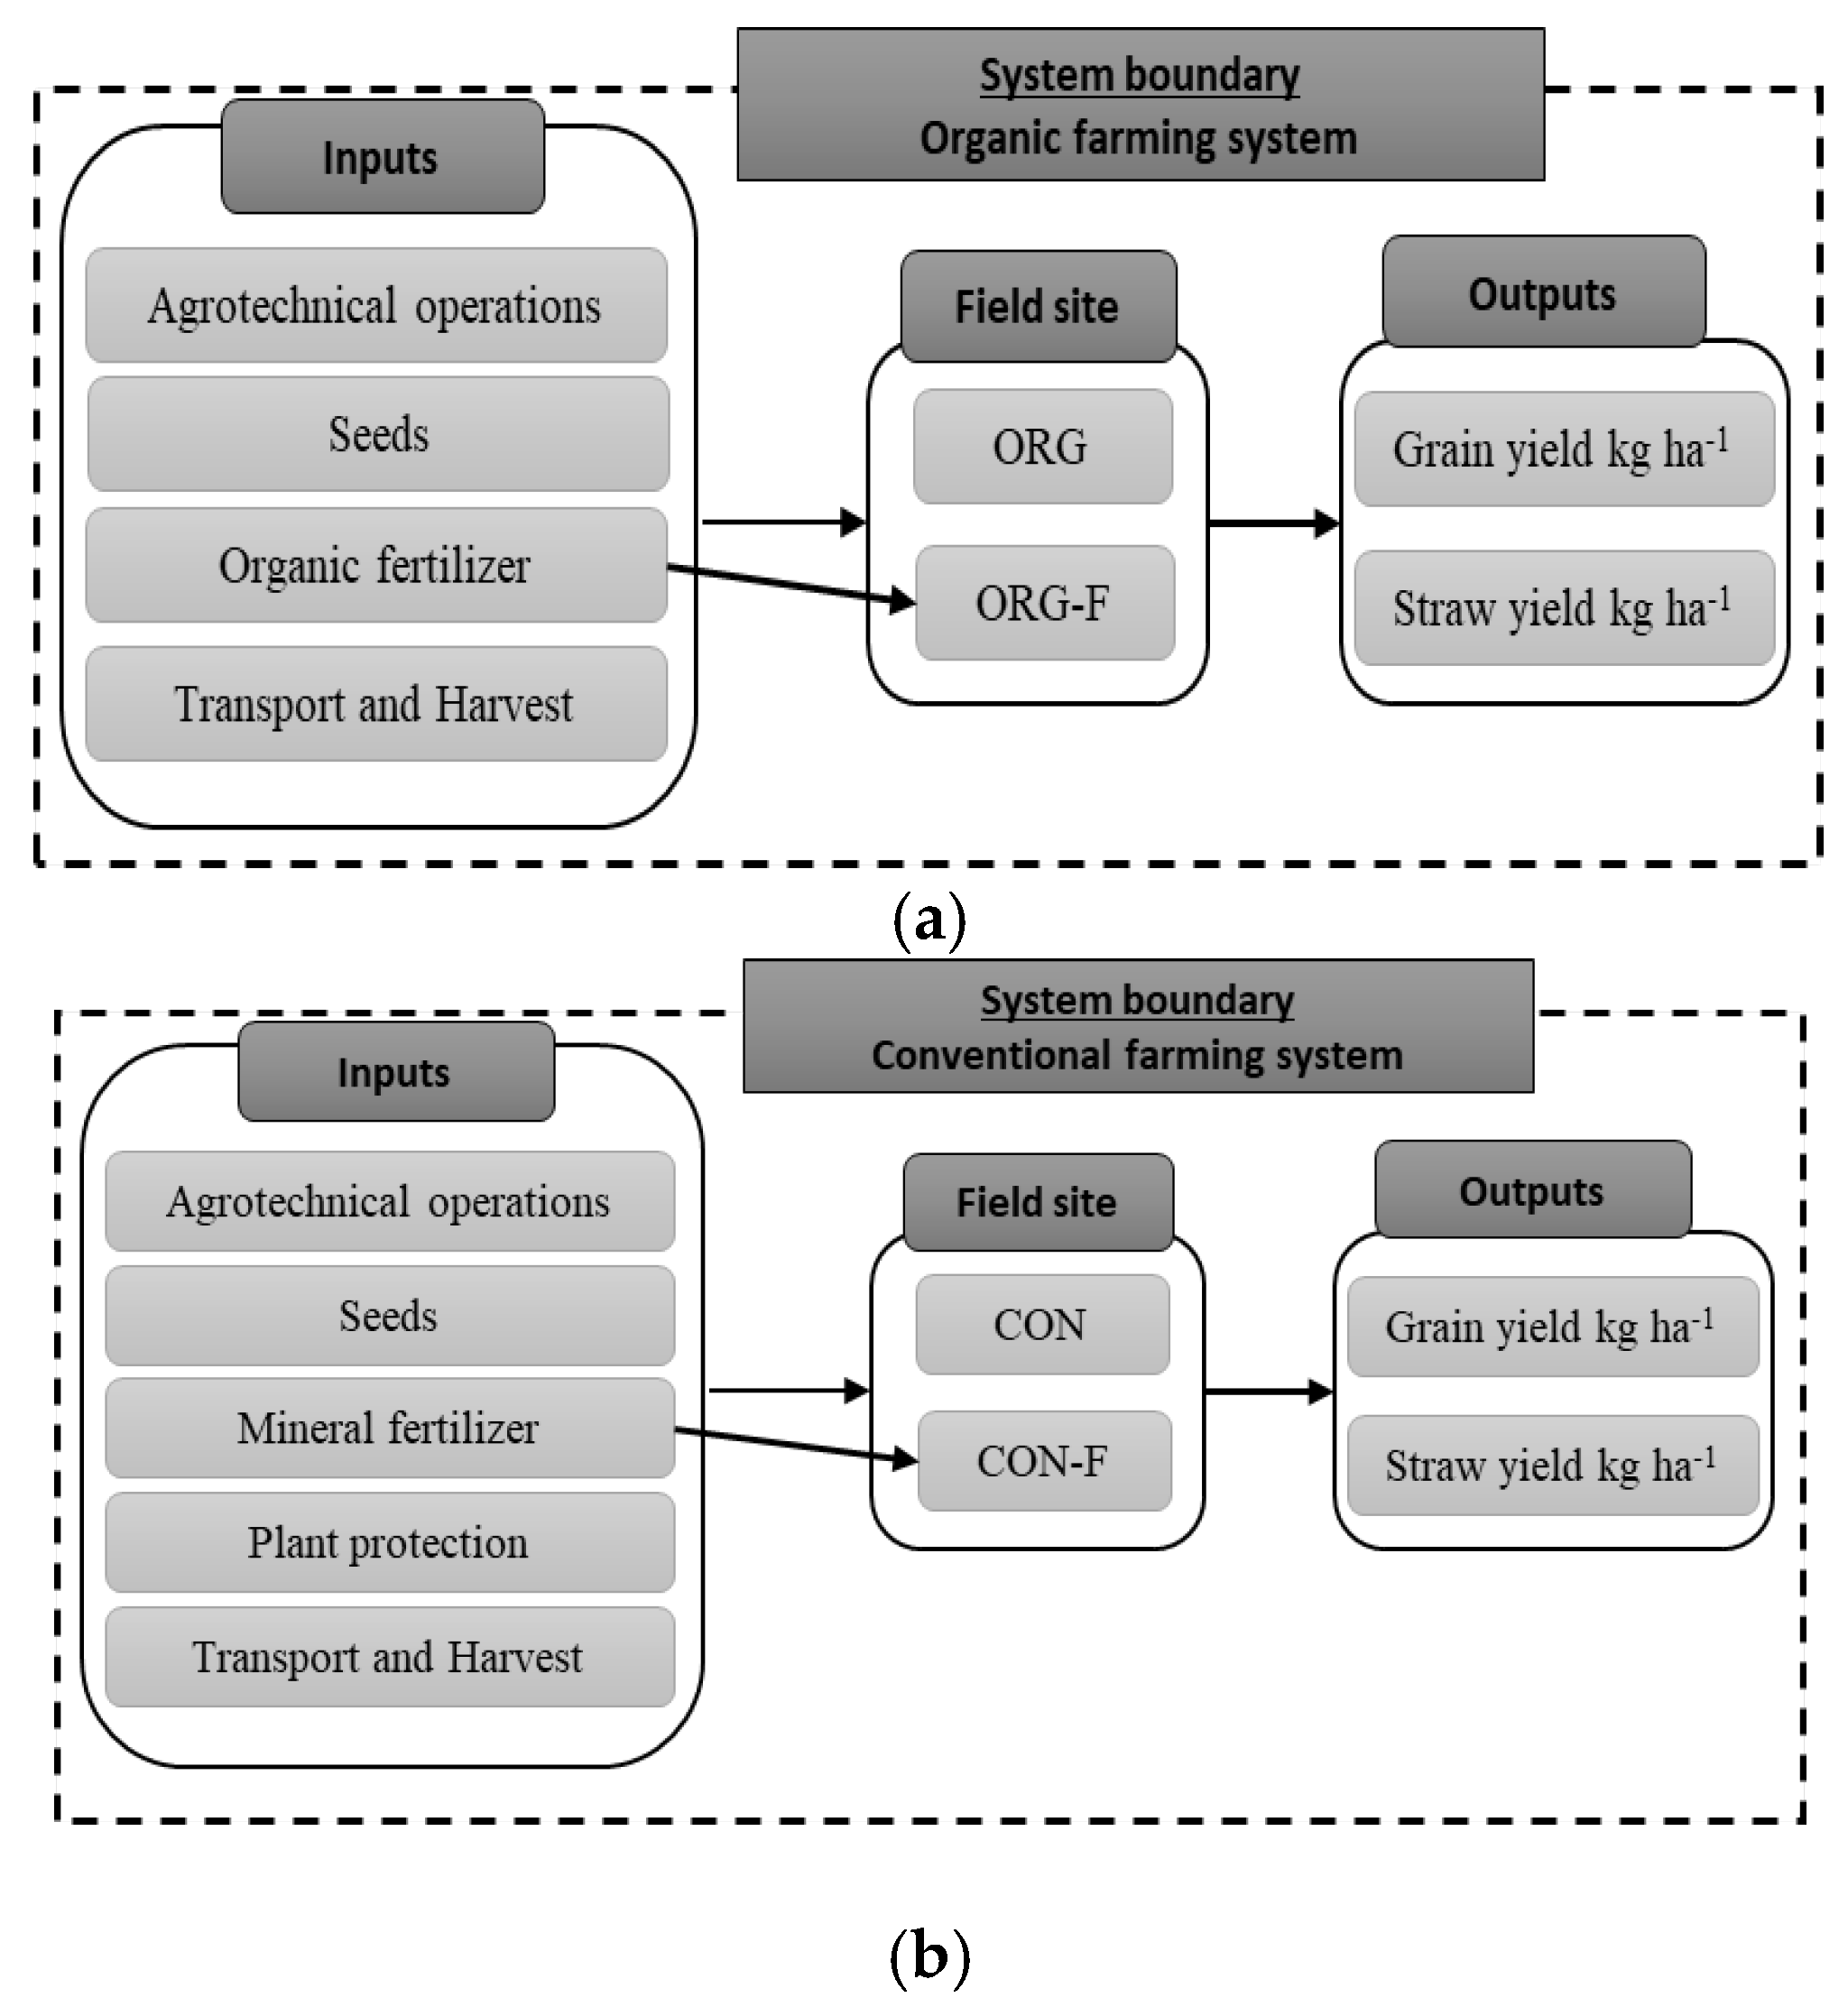
2.2.1. Goal and Scope

This study aimed to quantify the environmental impact of winter wheat production in organic winter wheat production using certified organic sheep fertilizer and conventional winter wheat production in Nitra, Slovakia. For this study, the functional unit (FU) chosen was 1 kg of final product and the mass allocation principle was employed. The system boundaries include all the processes from “cradle to farm gate”, i.e., crop production processes such as pre-seeding preparation, soil cultivation, sowing, fertilization, crop protection, transport of farming machinery, and harvesting. Emissions associated with manure management were included in system boundaries. Figure 3 shows the system boundaries and processes included in this study from cradle to farm gate.

2.2.2. Life Cycle Inventory (LCI) and Data Source

The primary data were obtained from the experimental field trials and secondary data were obtained from background processes from Ecoinvent v3.8, which includes data from central Europe [38], WFLDB [39], and Agri-footprint v5.0 [40] databases. Table 1 shows the inputs and outputs of the study from cradle to farm. The Intergovernmental Panel on Climate Change (IPCC) method was used to determine the emissions from fertilizers and agricultural residues [41]. Further, the outputs were calculated in accordance with the IPCC 2019 guidelines (nitrous oxide, N2O, nitrate, NOx, ammonia NH3, phosphate, PO43−, phosphorus, P) [39].

2.2.3. Life Cycle Impact Assessment (LCIA)

A life cycle assessment method was used for environmental impact quantification. The data were analyzed and evaluated based on LCA standards ISO 14040 [37] and ISO 14044 [36]. The results of this study are related to the following impact categories: global warming (kg CO2 eq), terrestrial acidification (kg SO2 eq), freshwater eutrophication (kg P eq), marine eutrophication (kg N eq), terrestrial ecotoxicity (kg 1,4-DCB eq), freshwater ecotoxicity (kg 1,4-DCB eq), marine ecotoxicity (kg 1,4-DCB eq), and water consumption (m3). Selected impact categories are suitable for agricultural LCAs [31]. The SimaPro 9.4.0.2 software was used to calculate the LCIA and impact category indicator. For this study, the ReCiPe Midpoint (H) V1.13/Europe Recipe H., an integrated method, was chosen [42]. The ReCiPe method addresses environmental impacts at the midpoint level, which are further aggregated into end-point categories. For evaluation, the characterization approach was used. Overall, the environmental impacts of winter wheat production were compared between conventional and organic farming systems.

3. Results and Data Interpretation

3.1. Interpretation Based on the Unit of Production

According to the characterization model, a contribution analysis was carried out for conventional and organic farming systems. The results are related to four winter wheat cropping systems and transferred to the environmental impact level in percentages. Figure 3 shows the results of the 3-year growing cycle of winter wheat in conventional and organic systems. From the data interpretation, it was also possible to determine different environmental impacts between individual cropping systems. The functional unit for this expression was 1 kg of the final product.
Table 2 shows the results of a 3-year cycle of growing winter wheat in conventional and organic farming systems and monitoring the environmental load according to production unit (1 kg of the final product). According to the results of this study for the impact category global warming, ORG (0.1312 kg CO2 eq) recorded the lowest environmental load, while OGR-F recorded the highest environmental demand for the impact categories climate change (0.2666 kg CO2 eq), terrestrial acidification (0.0066 kg SO2 eq), and marine eutrophication (0.000546 kg N eq), which is attributed mainly to the use and management of manure. CON-F recorded the highest environmental load for impact categories freshwater eutrophication (0.00012 kg P eq), terrestrial ecotoxicity (0.9794 kg 1,4-DCB), freshwater ecotoxicity (0.0170 kg 1,4-DCB), marine ecotoxicity (0.0114 kg 1,4-DCB), and water consumption (0.00179 m3).
Figure 4 shows the results of the 3-year growing cycle of winter wheat in conventional and organic systems. From the data interpretation, it was also possible to determine different environmental impacts between individual cropping systems and convert them into percentages. The functional unit for this expression was 1 kg of the final product. The results of this study show that the unfertilized variants ORG and CON impose lower environmental load per production unit in seven impact categories compared to the fertilized variants ORG-F and CON-F, respectively. This is attributed to the overall low quantity of inputs in the production process, as shown in Table 1, and these variants are deemed to be more environmentally friendly compared to the fertilized variants. For the impact category terrestrial acidification, there was no significant difference in environmental load between ORG (4.5%) and CON (4.7%) systems. This can be attributed to the lack of N-fertilizer input in the ORG and CON systems. For impact categories freshwater eutrophication, terrestrial ecotoxicity, freshwater ecotoxicity, marine ecotoxicity, and water consumption, CON-F recorded the highest environmental loads. For impact categories of global warming and terrestrial acidification, ORG-F recorded the highest environmental load, which is attributed to the use and application of manure.

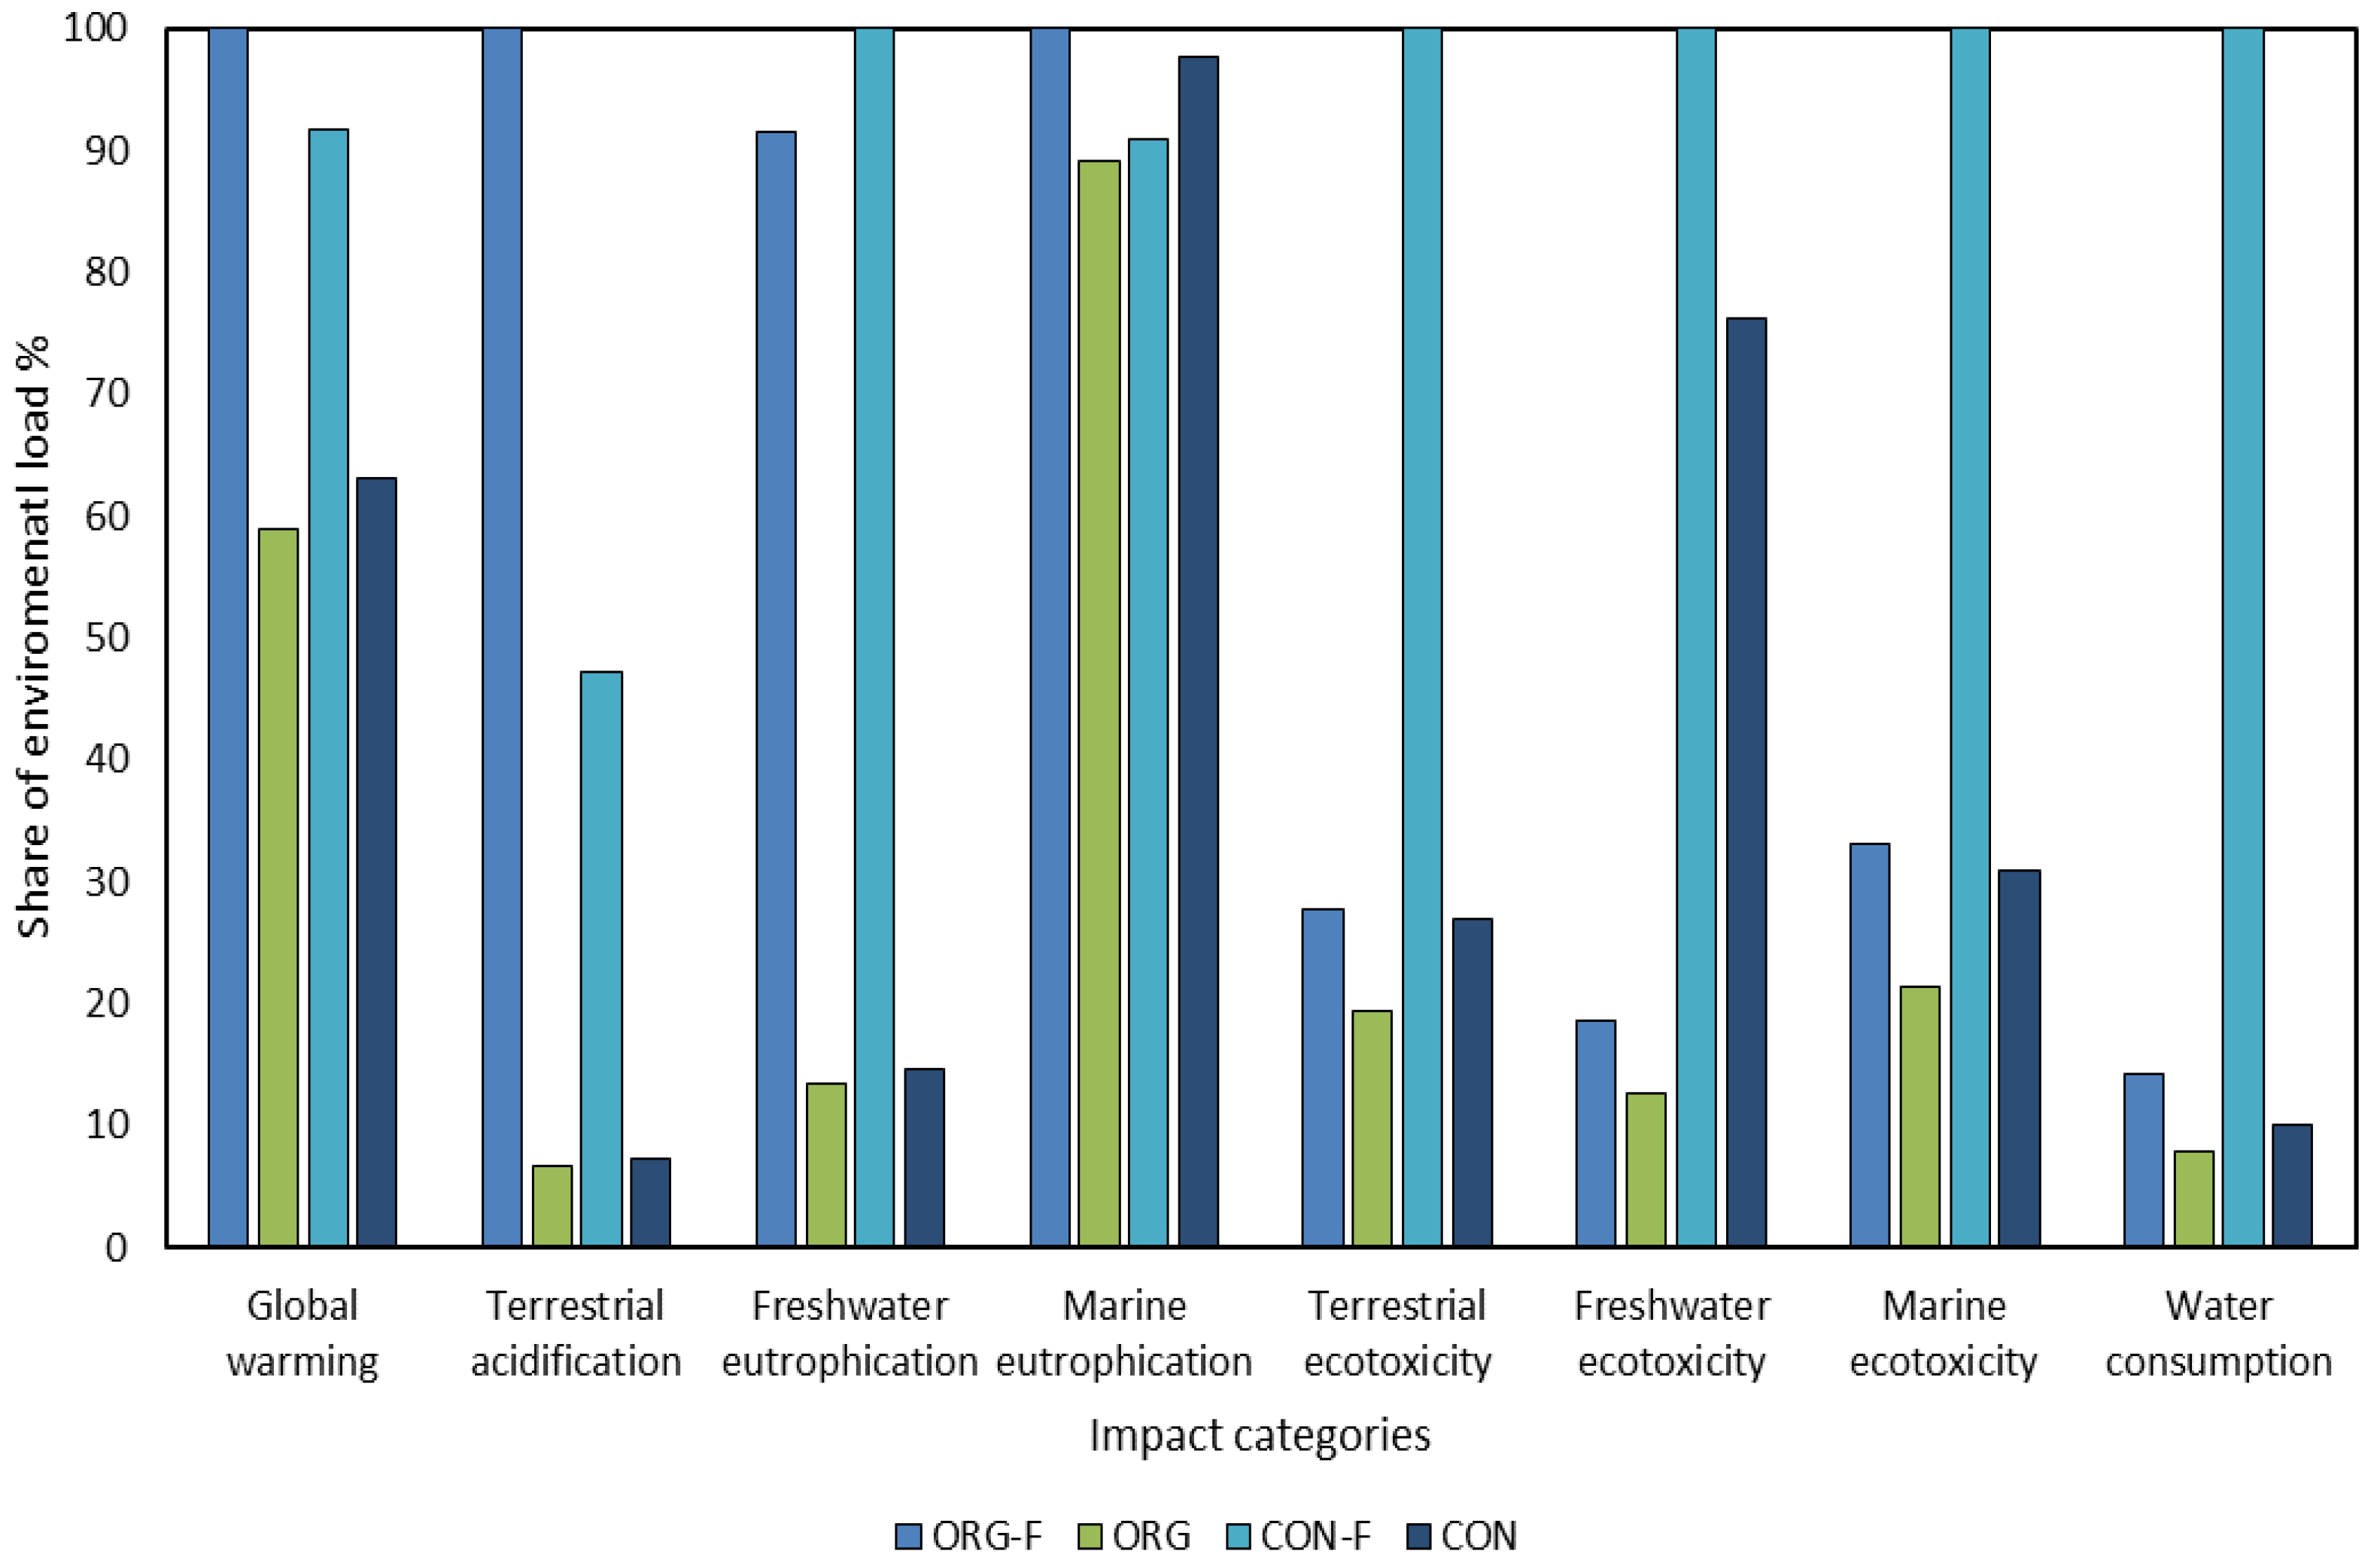
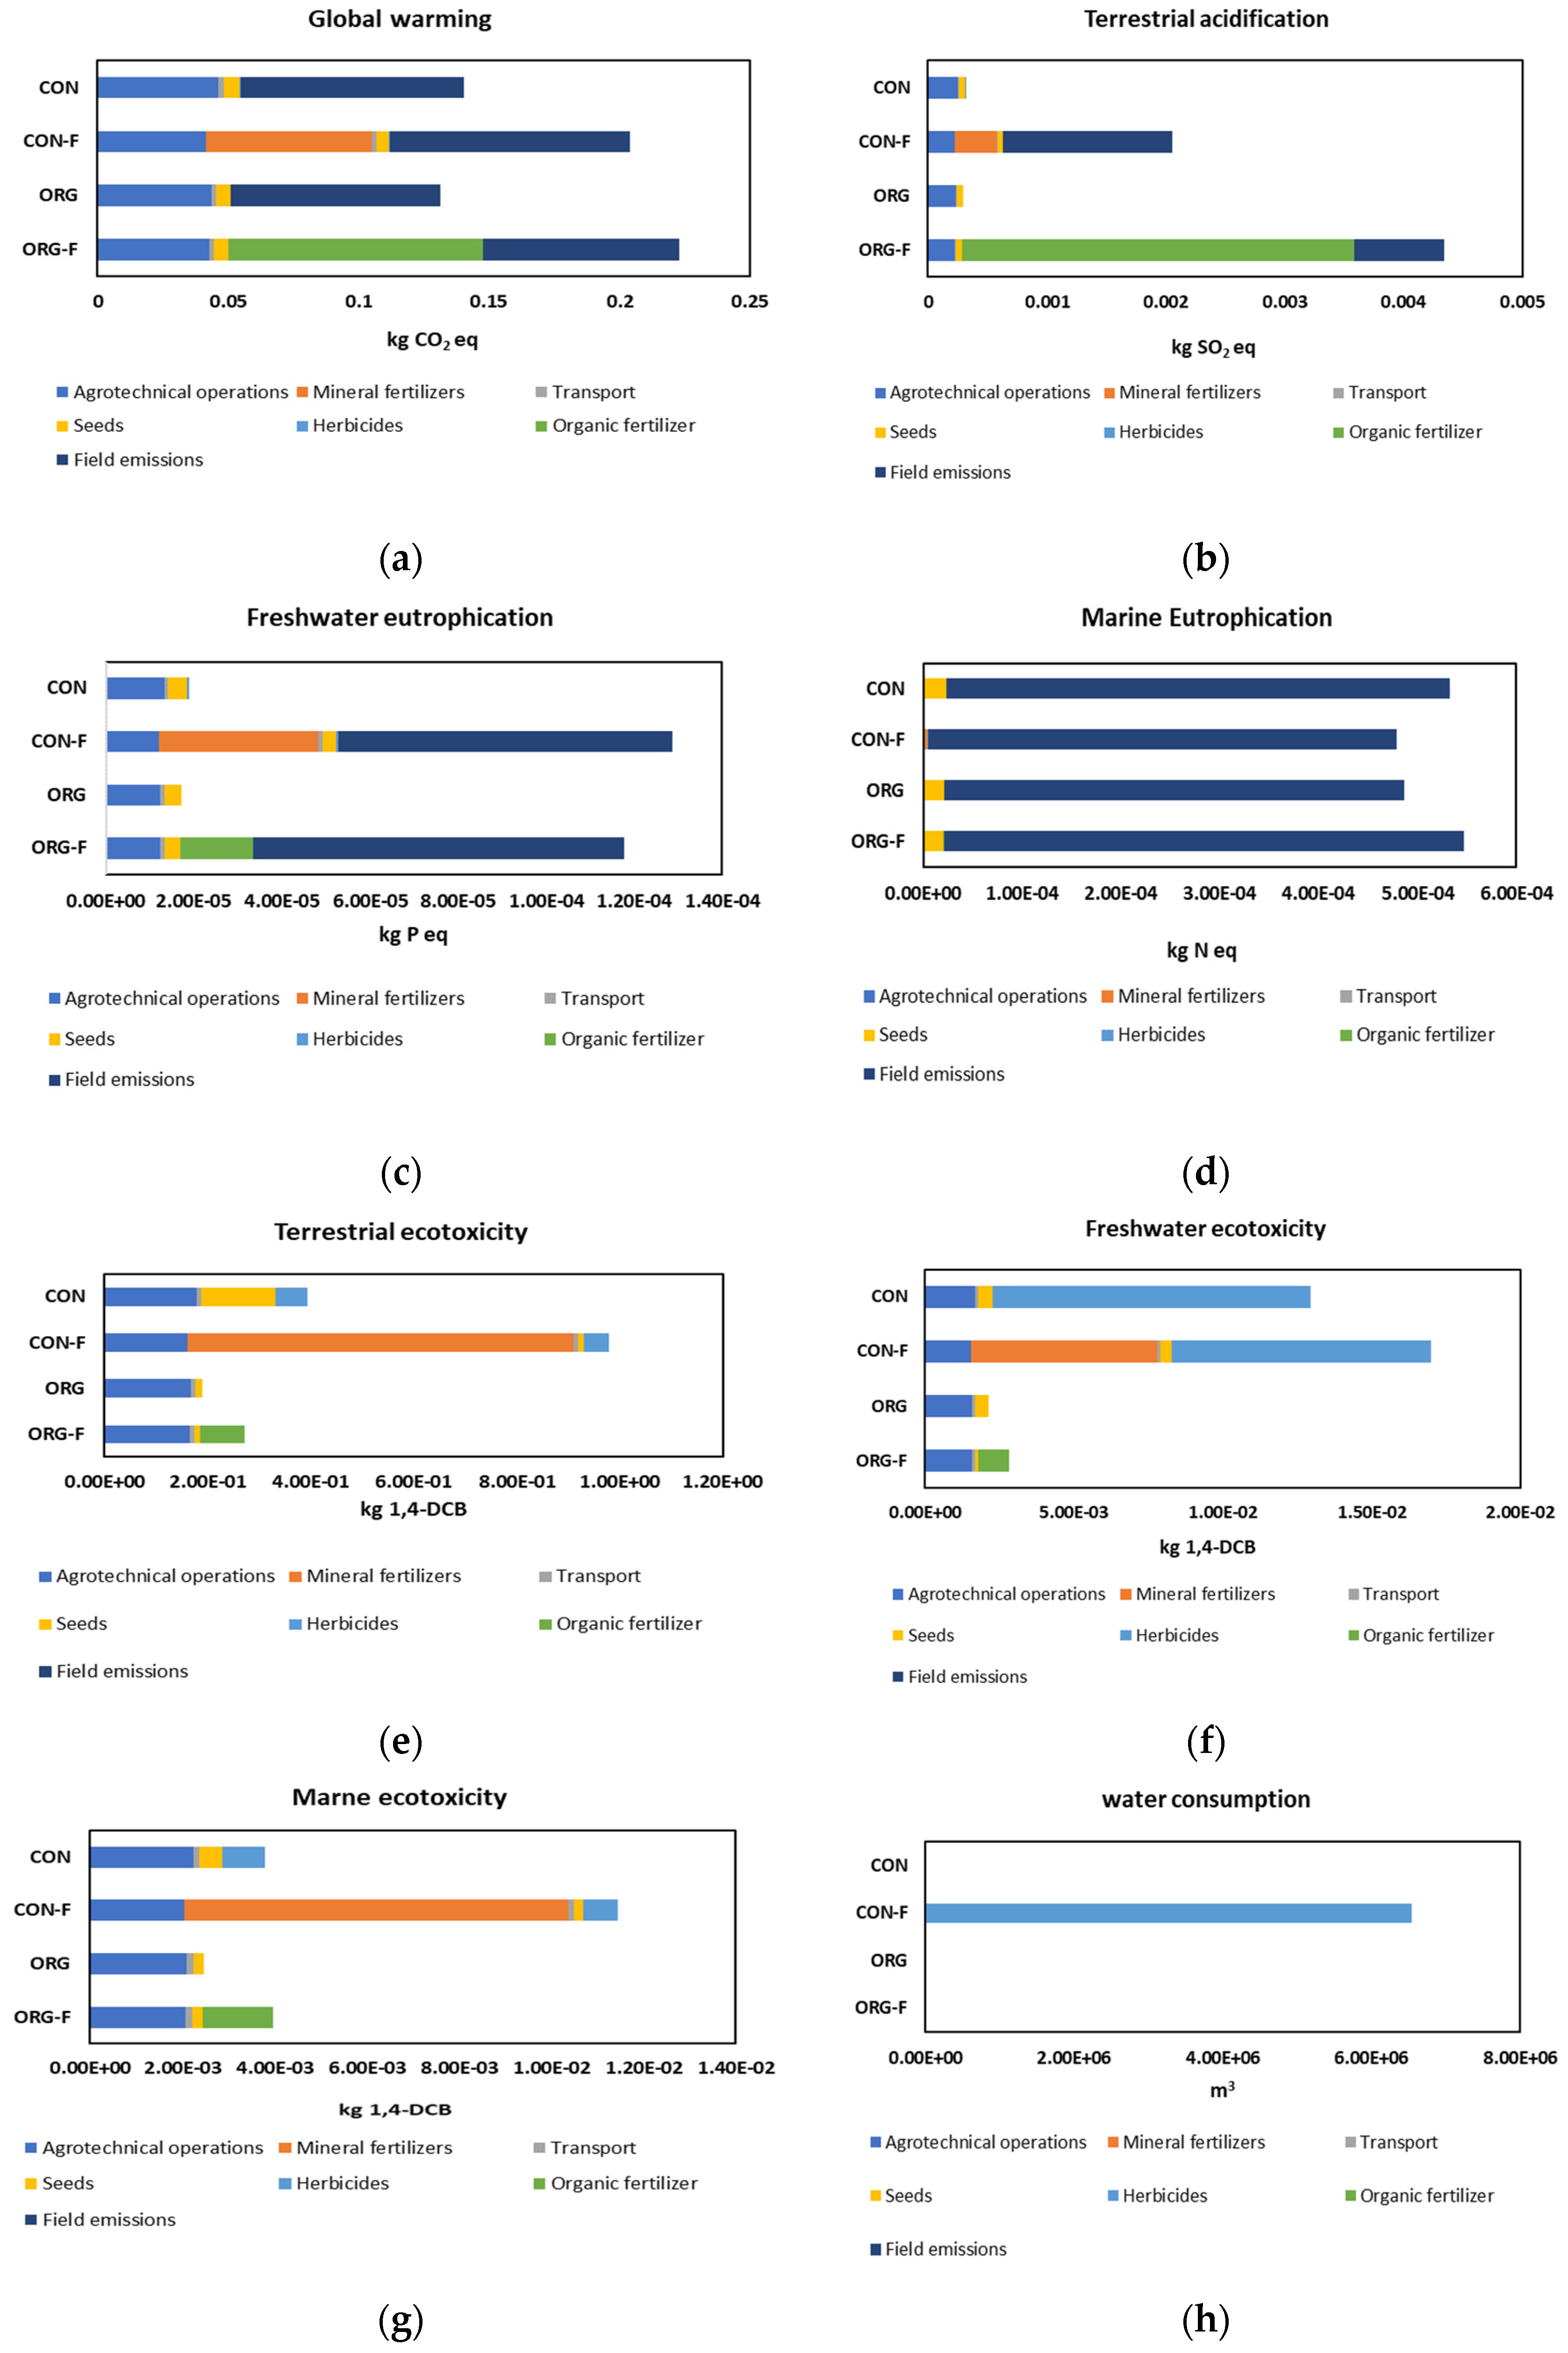
3.2. Contribution Analysis from Cradle to Farm Gate for Midpoint Environmental Impact

Figure 5 shows the shares of inputs on the environmental load within selected impact categories. From the results based on the contribution analysis, the midpoint environmental impacts were mainly due to the input of fertilizers in the case of CON-F, and manure for ORG-F, and predominantly agrotechnological operations for all variants and impact categories. In the impact category of climate change, the highest contribution for ORG-F (0.0975 kg CO2 eq) was associated with the use and management of organic fertilizer. For CON-F in the climate change impact category, the highest contribution was associated with the field emissions (0.0920 kg CO2 eq) arising from the application of fertilizers and (0.0634 kg CO2 eq) for the use of mineral fertilizers. CON recorded the highest contribution for agrotechnical operations (0.0465 kg CO2 eq) and the use and application of herbicides (0.00052 kg CO2 eq). Overall, for impact category climate change, ORG recorded the lowest environmental load.
For impact category terrestrial acidification, the highest contribution for CON-F (0.0014 kg SO2 eq) was associated with the field emissions, and for ORG-F (0.0033 kg SO2 eq) it was associated with the use and application of manure. There was no significant difference in all variants relating to agrotechnical operations, transport, and seeds in the impact category of terrestrial acidification. In the impact category freshwater eutrophication for the CON-F variant, the two highest contributions were field emissions (0.000076 kg P eq) and mineral fertilizers (0.000036 kg P eq). For impact category freshwater eutrophication, the highest contributions for the ORG-F variant were manure (0.000016 kg P eq) and field emissions (0.000084 kg P eq).
From the results of the impact category marine eutrophication, the overall highest contribution was associated with the field emissions in all four variants. For impact category terrestrial ecotoxicity, the highest contribution for CON-F was mineral fertilizers (0.7487 kg 1,4-DCB). There was no significant difference in the contributions of agrotechnological operations in all four variants in the terrestrial ecotoxicity impact category. The CON variant recorded the highest contribution for herbicides (0.0621 kg 1,4-DCB) in the terrestrial ecotoxicity impact category. In the impact category freshwater ecotoxicity, the overall highest contributions were associated with herbicides for CON-F (0.0087 kg 1,4-DCB) and CON (0.0106 kg 1,4-DCB). The other main contribution for impact category freshwater ecotoxicity was mineral fertilizers, namely CON-F (0.0063 kg 1,4-DCB).
From the results for the impact category marine ecotoxicity, the main contributions were from agrotechnical operations and mineral fertilizers. There was no significant difference in the contributions for agrotechnical operations for all four variants, namely ORG-F (0.00208 kg 1,4-DCB), ORG (0.00208 kg 1,4-DCB), CON-F (0.00204 kg 1,4-DCB), and CON (0.00223 kg 1,4-DCB). Overall, the ORG variant recorded the lowest impact in the marine ecotoxicity impact category. For impact category water consumption, the main contribution was from herbicides in the case of CON-F.

3.3. Interpretation Based on the Land Demand

Table 3 shows the results of a 3-year cycle of growing winter wheat in conventional and organic farming systems and monitoring the environmental load according to the land demand required to produce the same yield. There was an increase in the area unit, namely ORG-F (1.81 ha), ORG (1.31 ha), and CON (1.35 ha), to acquire the same yield as that of CON-F (1 ha), as shown in Table 1. This was a proportional increase in the environmental impact, reflecting the higher demand for land to produce the same yield [43]. The results for impact categories were as follows: freshwater eutrophication (1.98 kg P eq), terrestrial ecotoxicity (15092.11 kg 1,4 DCB) freshwater ecotoxicity (262.03 kg 1,4-DCB), marine ecotoxicity (176.39 kg 1,4 DCB), and water consumption (27.63 m3). The CON-F system recorded the highest environmental loads. For impact categories global warming (3596.2 kg CO2 eq) and terrestrial acidification (70.17 kg SO2 eq), ORG-F recorded the highest environmental impact.

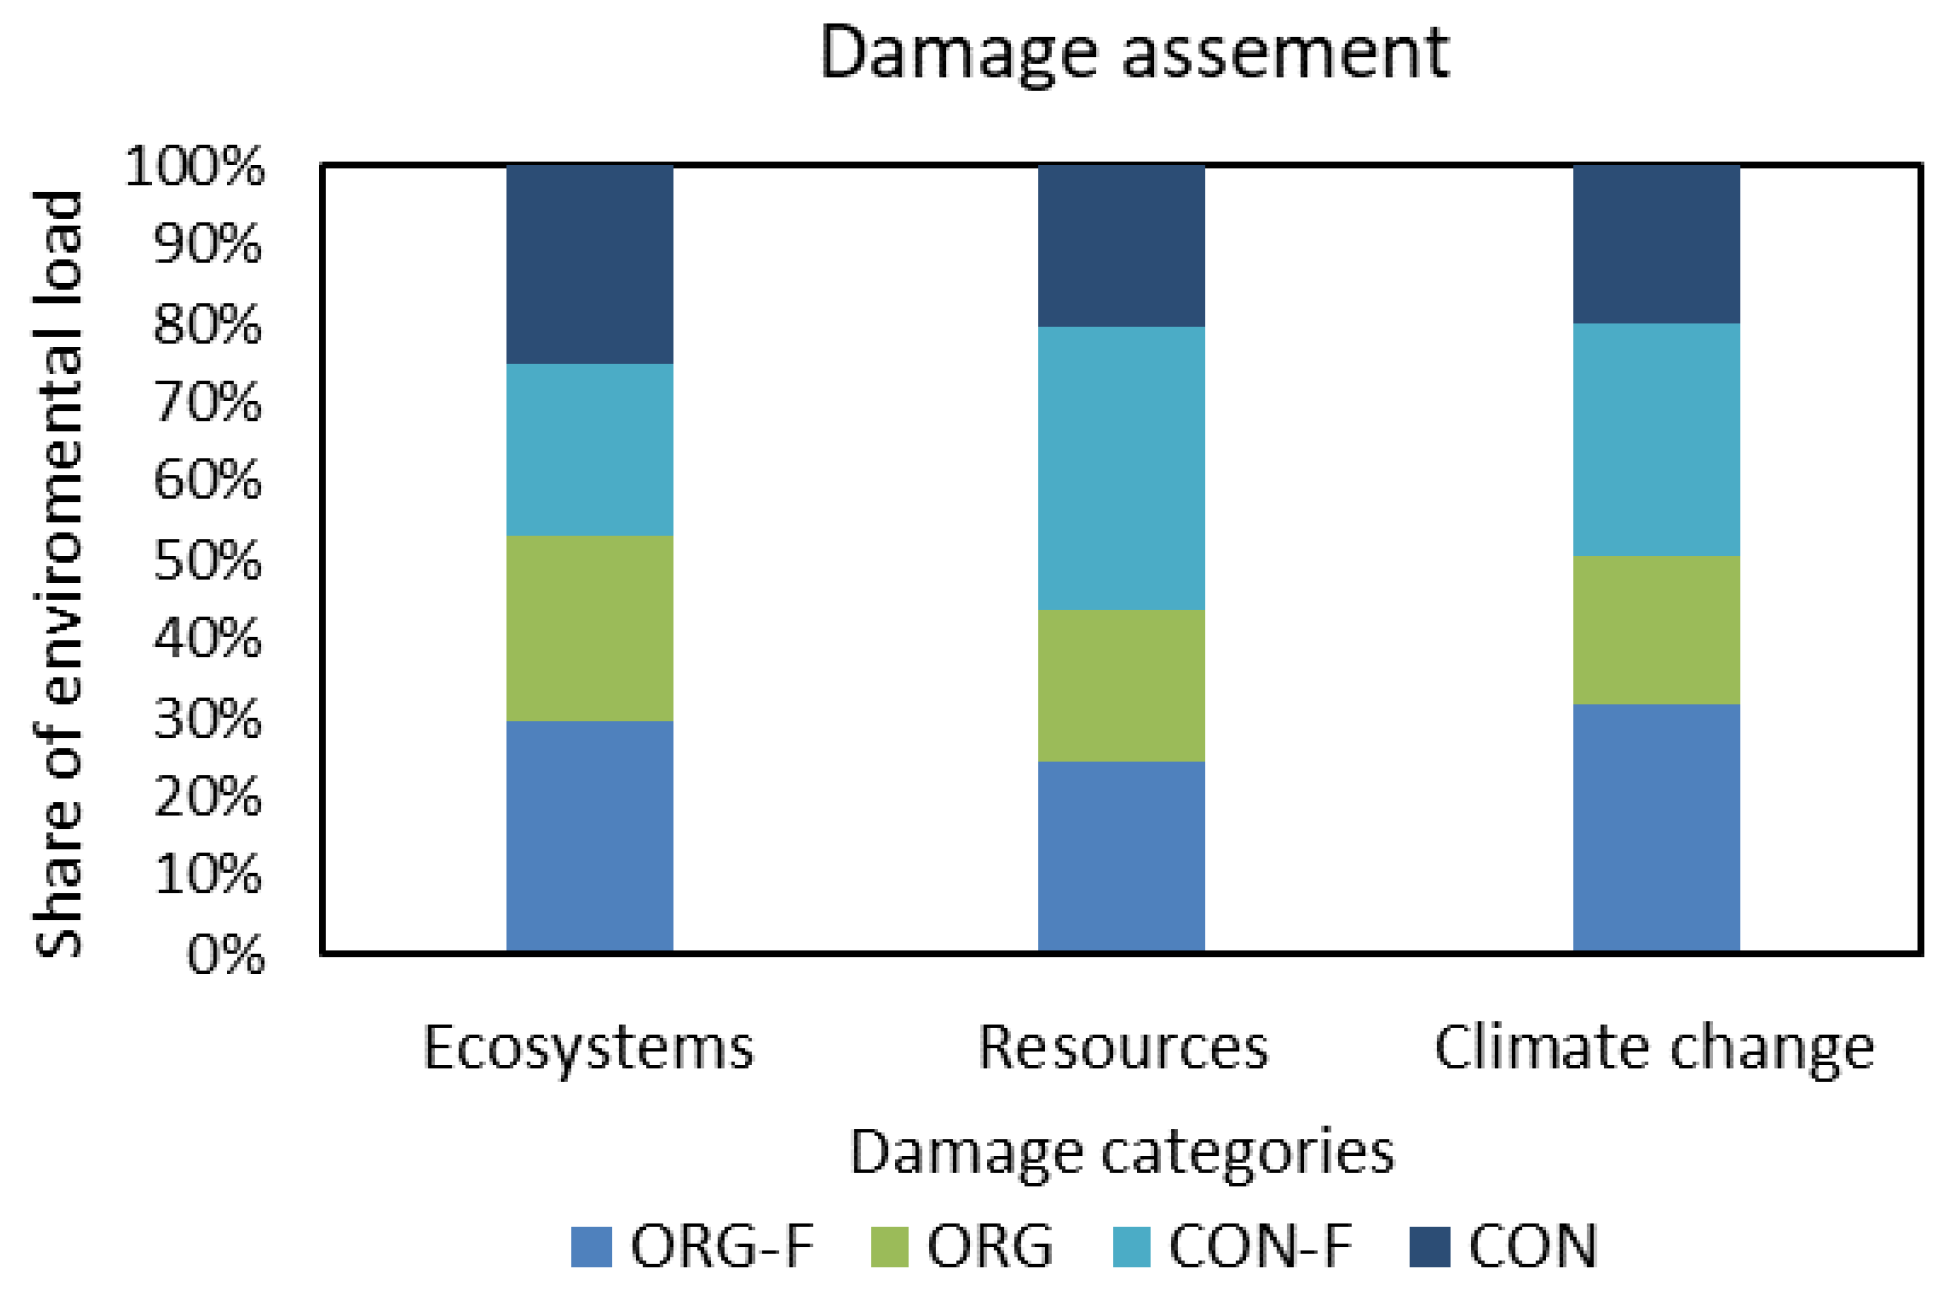
3.4. Damage Categories

Figure 6 shows the endpoint damage categories of (1) climate change, (2) ecosystem quality, and (3) those relating to results of the eight midpoint impact categories: global warming, terrestrial acidification, freshwater eutrophication, marine eutrophication, terrestrial ecotoxicity, freshwater ecotoxicity, marine ecotoxicity, and water consumption. From the data interpretation, it was also possible to determine different environmental impacts between individual cropping systems and convert them into percentages as shown in Figure 5. The functional unit for this expression was 1 kg of the final product.

4. Discussion

The global attention paid to the environmental impacts caused by human activities continues to be a hot topic. Agriculture both contributes to and is affected by the environmental impacts. Developments in intensive agriculture can lead to increased pollution of air, soil, and water bodies, as well as increase the consumption of resources. To address the potential mitigation of the environmental load within the framework of a standard farming process, we have to focus on all the sources of emissions arising from the production process [44]. The agricultural LCA has been seen as an effective way to assess resource consumption and environmental burdens in the whole process of agricultural production or agricultural activities [45]. The results of this study were related to impact categories corresponding to the agricultural LCA [31].
Global warming potential (GWP) is used to express the contribution that gaseous emissions from arable production systems make to the environmental problem of climate change [46] and is expressed based on the carbon dioxide equivalent (CO2 eq) [47]. According to the result based on the unit of production for the impact category global warming, the fertilized variants in both organic and conventional systems recorded higher environmental loads compared to the non-fertilized variants, namely ORG-F (0.223 kg CO2 eq) and CON-F (0.204 kg CO2 eq). There were similar trends from the results per land demand (land required to generate the same yield) for ORG-F (3596.17 kg CO2 eq) and CON-F (3146.83 kg CO2 eq). This can be mainly attributed to the use and application of mineral fertilizers for the CON-F system, and to the use and management of manure for the ORG-F system. This is supported by [48], who states that the greatest GHG emissions released into the atmosphere come mainly from N fertilizers. Significant greenhouse gas emissions in organic systems were linked to the usage of a large amount of organic manure [49]. Manure contains nitrogen, which when applied in excess or improperly handled, can lead to the deposition of nutrients in acidifying forms in the soil or release to air and water surfaces. Similar studies have linked the usage of organic manure to having an impact on the amount of GHG emitted [49,50].
As shown in Table 2 and Table 3, for the climate change impact category, the ORG system recorded the lowest environmental load per unit of production and per land demand required to produce the same yield. For the climate change impact category, the ORG system was deemed to be more environmentally friendly, which can be attributed to the non-application or use of chemical fertilizers and plant protection products; however, this was associated with lower yields, as shown in Table 2. According to the IPCC (2006), farmers use N fertilizers to increase yields. However, these are a significant source of anthropogenic GHG emissions. The choice of fertilizer, its amount, and the method of its application in relation to N could significantly contribute to the mitigation of environmental impacts [51]. Minimizing inputs and increasing productivity is key to improving agricultural farming systems. The savings in the life cycle should be calculated not only per production unit, which is how most LCA outputs are determined, but also per area unit and time unit [43]. Crop rotation management can be used to reduce fertilizer and pesticide demand, which will also reduce the environmental impacts of crop production [52]. Utilizing nitrogen-fixing plants in a crop rotation can be a good way to avoid the overuse of nitrogen in the production system [53]. The other contributing factor to the higher environmental load is the burning and use of fossil fuels. Emission of CO2 in the air at the farm level is generally caused by consumption of diesel fossil fuel in agricultural machinery [41,54]. This can have a direct or indirect effect on GHG emissions, e.g., during soil preparation, sowing, harvesting, plant protection, and chemical fertilizer application.
The interaction between natural processes and human impact must be carefully evaluated to understand ongoing soil processes concerning acidification [55]. Terrestrial acidification describes how terrestrial ecosystems are negatively affected by a lowering of the soil pH caused by atmospheric deposition of acidifying substances [56]. According to the results for the impact category terrestrial acidification per production unit expressed as kg SO2 equivalents, both fertilized variants, i.e., CON-F and ORG-F recorded higher environmental loads compared to the unfertilized variants, as shown in Table 2, which can be attributed to the loss of N during volatilization of ammonia NH3. Conventional farming has been shown to have a higher impact on terrestrial acidification and eutrophication potential [57]. Nitrogen fertilizer is an essential fertilizer in winter wheat production [58], but when applied in excess quantities, the unused nitrogen results in enhanced volatilization of ammonia and nitrous oxide [59] through the process of nitrification and/or denitrification [60]. The volatilized ammonia is emitted into the air and runs off to the surface and groundwater as nitrate and ammonium [59]. There are several climatic factors, such as humidity, temperature, pH, and the amount of organic matter, that may influence the loss of nitrogen by volatilization [61,62]. Ammonia in the atmosphere may easily combine SO2 and NOx to create particles [63]. The pollutants NH3, SO2, and NOx released from N fertilizer and diesel fuel lead to terrestrial acidification [64]. Extensive fuel combustion can increase SO2 concentrations in the atmosphere [65], which can impact plant and animal species [66]. To mitigate the amount of ammonia volatilized in winter wheat production, the reduction in N fertilizer doses and incorporation of green cultivation methods to improve soil fertility, which results in the reduced need for N fertilizers, or the adoption of organic farming, can serve as mitigating strategies.
The eutrophication of surface water bodies has always been one of the main threats to global water security [67]. Eutrophication of water bodies refers to the over-enrichment of water bodies. According to the results for impact category freshwater eutrophication, CON-F (0.00013 kg P eq) recorded the highest environmental load per production unit. This is attributed mainly to the use of phosphorous fertilizers. For the impact category marine eutrophication per production unit, ORG-F (0.00055 kg N eq) recorded the highest environmental load. Manure is usually collected for use as organic fertilizer, which, if applied in excess, will lead to diffuse water pollution [68]. Extreme nutrient inputs containing nitrogen and phosphorus lead to the eutrophication of surface waters and increase toxicity [59]. This can lead to reduced water quality and habitat degradation. Nitrogen (N) and phosphorus (P) fertilizers cause 78% of the global marine and freshwater eutrophication [69]. Both N and P are emitted via surface runoff and erosion, but only N is considered to leach, while P is easily absorbed by soils [70]. From the results, ORG recorded the lowest environmental load on eutrophication per production unit. To mitigate the increase in water bodies’ eutrophication it is necessary to reduce the excess amount of nutrients applied.
According to the results for impact categories freshwater and marine ecotoxicity per production unit and land demand, the ORG system recorded the lowest environmental load. Organic farming systems generate less damage to the environment, which is mainly attributed to the non-use of mineral fertilizers or chemical plant protection products. Nearly 70% of water resources worldwide are used for agriculture practices, which are responsible for an essential part of the pollution of water [59]. It is, therefore, necessary to protect the water resources from contamination, which can not only cause harm to the environment, but also to living organisms. From the results per production unit, the conventional variants recorded a higher environmental load, which is attributed to the use of herbicides. Similar to the impact category terrestrial ecotoxicity, CON-F had the highest environmental load. Ref. [71] stated that using chemical plant protection products is highly effective, but the dispersion of active substances in the environment causes the risk of contamination of waters and soils, as well as the bioaccumulation of these substances in living organisms. Agrochemical contamination has a long-term impact on humans, food chains, and the environment [47]. It is therefore important, as per Bessouet et al. (2013), that the chemical protection of crops and the fate of pesticides should be taken into account in agricultural LCAs [47]. The nutrient enrichment of waterbodies causes excessive growth of algae, deoxygenation, and biodiversity loss [72]. Our results showed that organic wheat farming reduces the environmental burden of ecotoxicity, which can be attributed to the non-use of plant protection products. To reduce the use of agrochemical protection in agriculture systems, crop rotation can be used to prevent the carryover of pathogens and the weed population [73], or organic farming can be adopted [74].
According to the results, CON-F recorded the highest environmental load both per unit production and land demand in the impact category of water consumption. This impact category refers only to the water used for the production processes relating to cultivation inputs [57]. For our results, this relates to the water required to dilute herbicide protection for the plants. Water is essential for every form of life, socio-economic development, and the maintenance of healthy ecosystems [68]. Water scarcity occurs when water supply is insufficient to meet water demand [75]. Therefore, it is important to protect water resources from scarcity. Overall, according to the results, ORG imposes the least amount of environmental load.

5. Conclusions

The life cycle assessment continues to be an essential tool for evaluating the environmental loads in the production system in agriculture. To find mitigation strategies to reduce the amount of GHG emitted, it is important to focus on the primary sources. The environmental loads differ in relation to different impact categories and functional units, but the trends are the same. It is, therefore, important when conducting an LCA for agriculture to not only examine the production unit but also land demand. The findings of this study indicated that the fertilized variants recorded higher environmental load per production unit compared to the unfertilized variants. The results of this case study demonstrate that the environmental performance of wheat production could be greatly improved by shifting from conventional chemical fertilizers to more environmentally friendly organic farming systems. The application of fertilizers had a significant impact on yield and environmental load. Reducing the environmental load produced within the cultivation of winter wheat can be achieved by reducing the dose of fertilizers at the cost of a lower yield. The excessive use of N fertilizer has an impact on increased environmental impact. Manure from livestock would also have the benefit of reducing the need for N as most manure N is stored in an organic form that is released as slowly as the crop requires N, which also results in reduced leaching. The reduction in the amount of GHG produced within the cultivation could also be reduced by making changes to the cultivation technology, e.g., by implementing reduced tillage systems in grain production, which may also reduce the use of fossil fuels.

Author Contributions

Conceptualization, C.E.M., J.M., J.B., F.O.E., M.L.-B. and L.L.-B.; methodology, C.E.M., J.M., J.B., M.L.-B. and L.L.-B.; software, C.E.M., J.B. and E.A.; validation C.E.M., J.M., M.L.-B. and L.L.-B.; formal analysis, C.E.M. and J.B.; investigation, C.E.M., J.M., J.B., M.L.-B. and L.L.-B.; resources, M.L.-B. and L.L.-B.; data curation, C.E.M., J.M., J.B., F.O.E., M.L.-B. and L.L.-B.; writing—original draft preparation, C.E.M., J.M., J.B., F.O.E.., M.L.-B., L.L.-B., R.W.N. and E.A.; writing—review and editing, C.E.M., J.M., J.B., F.O.E.., M.L.-B., L.L.-B., R.W.N. and J.L.; visualization, C.E.M. and F.O.E.; supervision, J.M., J.B., M.L.-B. and L.L.-B.; project administration J.M., M.L.-B. and L.L.-B.; funding acquisition, J.M., M.L.-B. and L.L.-B.; All authors have read and agreed to the published version of the manuscript.

Funding

This research was financially supported by the Operational Program Integrated Infrastructure Project SMARTFARM 15% and Project QK23020044-Evaluation of organic and conventional farming from the point of view of its impacts on ecosystem services for support of strategic decisions and processes.

Institutional Review Board Statement

Not applicable.

Data Availability Statement

The data that support the findings of this study are available on request from the corresponding author.

Conflicts of Interest

The authors declare no conflict of interest.

References

  1. Giraldo, P.; Benavente, E.; Manzano-Agugliaro, F.; Gimenez, E. Worldwide Research Trends on Wheat and Barley: A Bibliometric Comparative Analysis. Agronomy 2019, 9, 352. [Google Scholar] [CrossRef]
  2. FAO. Cereal Supply and Demand Brief 2023; FAO: Rome, Italy, 2023. [Google Scholar]
  3. Némethová, J.; Vilinová, K. Changes in the Structure of Crop Production in Slovakia after 2004 Using an Example of Selected Crops. Land 2022, 11, 249. [Google Scholar] [CrossRef]
  4. National Agricultural and Food Centre Slovakia. Report on Agriculture and Food Sector in the Slovak. Republic for 2020—Green Report; National Agricultural and Food Centre Slovakia—Research Institute of Agricultural and Food Economics: Bratislava, Slovakia, 2021; ISBN 978-80-8058-651-5. [Google Scholar]
  5. Aguilera, E.; Guzmán, G.; Alonso, A. Greenhouse Gas Emissions from Conventional and Organic Cropping Systems in Spain. I. Herbaceous Crops. Agron. Sustain. Dev. 2015, 35, 713–724. [Google Scholar] [CrossRef]
  6. Xu, X.; Sharma, P.; Shu, S.; Lin, T.-S.; Ciais, P.; Tubiello, F.N.; Smith, P.; Campbell, N.; Jain, A.K. Global Greenhouse Gas Emissions from Animal-Based Foods Are Twice Those of Plant-Based Foods. Nat. Food 2021, 2, 724–732. [Google Scholar] [CrossRef]
  7. Stocker, T. (Ed.) Climate Change 2013: The Physical Science Basis: Working Group I Contribution to the Fifth Assessment Report of the Intergovernmental Panel on Climate Change; Cambridge University Press: Cambridge, MA, USA, 2014; ISBN 978-1-107-05799-9. [Google Scholar]
  8. Yang, T.; Siddique, K.H.M.; Liu, K. Cropping Systems in Agriculture and Their Impact on Soil Health-A Review. Glob. Ecol. Conserv. 2020, 23, e01118. [Google Scholar] [CrossRef]
  9. Abatzoglou, J.T.; Williams, A.P. Impact of Anthropogenic Climate Change on Wildfire across Western US Forests. Proc. Natl. Acad. Sci. USA 2016, 113, 11770–11775. [Google Scholar] [CrossRef]
  10. O’Neill, M.; Lanigan, G.J.; Forristal, P.D.; Osborne, B.A. Greenhouse Gas Emissions and Crop Yields from Winter Oilseed Rape Cropping Systems Are Unaffected by Management Practices. Front. Environ. Sci. 2021, 9, 716636. [Google Scholar] [CrossRef]
  11. Moudry, J., Jr.; Bernas, J.; Kopecký, M.; Konvalina, P.; Bucur, D.; Jelínková, Z.; Šterba, Z.; Kolař, L.; Moudrý, J. Influence of Farming System on Greengouse Gas Emissions within Cereal Cultivation. Environ. Eng. Manag. J. 2018, 17, 905–914. [Google Scholar] [CrossRef]
  12. Horowitz, J.; Gottlieb, J. The Role of Agriculture in Reducing Greenhouse Gas Emisions 2010. Available online: https://www.ers.usda.gov/webdocs/publications/42842/8494_eb15_1_.pdf?v=211 (accessed on 15 February 2023).
  13. Lernoud, J.; Willer, H.; Kilcher, L. (Eds.) The World of Organic Agriculture: Statistics and Emerging Trends 2013, 14th ed.; FiBL: Frick, Switzerland; IFOAM: Bonn, Germany, 2013; ISBN 978-3-03736-233-4. [Google Scholar]
  14. International Federation of Organic Agriculture Movements, Forschungsinstitut für Biologischen Landbau. The World of Organic Agriculture: Statistics & Emerging Trends 2021; FiBL: Frick, Switzerland; IFOAM: Bonn, Germany, 2021; ISBN 978-3-03736-393-5. [Google Scholar]
  15. Van Stappen, F.; Loriers, A.; Mathot, M.; Planchon, V.; Stilmant, D.; Debode, F. Organic Versus Conventional Farming: The Case of Wheat Production in Wallonia (Belgium). Agric. Agric. Sci. Procedia 2015, 7, 272–279. [Google Scholar] [CrossRef]
  16. Funk, C.; Kennedy, B. The New Food Fights: U.S. Public Divides Over Food Science; Pew Research Center: Washington, DC, USA, 2016. [Google Scholar]
  17. Malissiova, E.; Tsokana, K.; Soultani, G.; Alexandraki, M.; Katsioulis, A.; Manouras, A. Organic Food: A Study of Consumer Perception and Preferences in Greece. Appl. Food Res. 2022, 2, 100129. [Google Scholar] [CrossRef]
  18. Hansmann, R.; Baur, I.; Binder, C.R. Increasing Organic Food Consumption: An Integrating Model of Drivers and Barriers. J. Clean. Prod. 2020, 275, 123058. [Google Scholar] [CrossRef]
  19. Probst, L.; Aigelsperger, L.; Hauser, M. Consumer Attitudes towards Vegetable Attributes: Potential Buyers of Pesticide-Free Vegetables in Accra and Kumasi, Ghana. Ecol. Food Nutr. 2010, 49, 228–245. [Google Scholar] [CrossRef] [PubMed]
  20. Council of the European Union. 2007 Council Regulation (EC) No 834/2007 of 28 June 2007 on Organic Production and Labelling of Organic Products and Repealing Regulation (EEC) No 2092/91. Off. J. Eur. Union 2007, 8, 1–23. [Google Scholar]
  21. Järvan, M.; Vettik, R.; Tamm, K. The Importance and Profitability of Farmyard Manure Application to an Organically Managed Crop Rotation. Zemdirb. Agric. 2017, 104, 321–328. [Google Scholar] [CrossRef]
  22. Moitzi, G.; Neugschwandtner, R.W.; Kaul, H.-P.; Wagentristl, H. Energy Efficiency of Continuous Rye, Rotational Rye and Barley in Different Fertilization Systems in a Long-Term Field Experiment. Agronomy 2021, 11, 229. [Google Scholar] [CrossRef]
  23. Meemken, E.-M.; Qaim, M. Organic Agriculture, Food Security, and the Environment. Annu. Rev. Resour. Econ. 2018, 10, 39–63. [Google Scholar] [CrossRef]
  24. Liu, Y.S.; Wang, J.Y.; Long, H.L. Analysis of Arable Land Loss and Its Impact on Rural Sustainability in Southern Jiangsu Province of China. J. Environ. Manag. 2010, 91, 646–653. [Google Scholar] [CrossRef]
  25. Wang, L.; Anna, H.; Zhang, L.; Xiao, Y.; Wang, Y.; Xiao, Y.; Liu, J.; Ouyang, Z. Spatial and Temporal Changes of Arable Land Driven by Urbanization and Ecological Restoration in China. Chin. Geogr. Sci. 2019, 29, 809–819. [Google Scholar] [CrossRef]
  26. Moudry, J., Jr.; Jelínková, Z.; Moudry, J.; Bernas, J.; Kopecký, M.; Konvalina, P. Influence of Farming Systems on Production of Greenhouse Gas Emissions Withincultivation of Selected Crops. J. Food Agric. Environ. 2013, 11, 1015–1018. [Google Scholar]
  27. Lyu, Y.; Raugei, M.; Zhang, X.; Mellino, S.; Ulgiati, S. Environmental Cost and Impacts of Chemicals Used in Agriculture: An Integration of Emergy and Life Cycle Assessment. Renew. Sustain. Energy Rev. 2021, 151, 111604. [Google Scholar] [CrossRef]
  28. Sharma, A.; Kumar, V.; Shahzad, B.; Tanveer, M.; Sidhu, G.P.S.; Handa, N.; Kohli, S.K.; Yadav, P.; Bali, A.S.; Parihar, R.D.; et al. Worldwide Pesticide Usage and Its Impacts on Ecosystem. SN Appl. Sci. 2019, 1, 1446. [Google Scholar] [CrossRef]
  29. Mosier, A.; Duxbury, J.M.; Heinemeyer, O.; Minami, K. Assessing and Mitigating N2O Emissions from Agricultural Soils. Clim. Change 1998, 40, 7–38. [Google Scholar] [CrossRef]
  30. Moitzi, G.; Neugschwandtner, R.W.; Kaul, H.-P.; Wagentristl, H. Efficiency of Mineral Nitrogen Fertilization in Winter Wheat under Pannonian Climate Conditions. Agriculture 2020, 10, 541. [Google Scholar] [CrossRef]
  31. Hauschild, M.Z.; Olsen, S.I.; Rosenbaum, R.K. (Eds.) Life Cycle Assessment: Theory and Practice, 1st ed.; Springer International Publishing: Cham, Switzerland, 2018; ISBN 978-3-319-56475-3. [Google Scholar]
  32. Caffrey, K.R.; Veal, M.W. Conducting an Agricultural Life Cycle Assessment: Challenges and Perspectives. Sci. World J. 2013, 2013, 1–13. [Google Scholar] [CrossRef] [PubMed]
  33. Biswas, W.K.; Barton, L.; Carter, D. Global Warming Potential of Wheat Production in Western Australia: A Life Cycle Assessment. Water Environ. J. 2008, 22, 206–216. [Google Scholar] [CrossRef]
  34. Meier, M.S.; Stoessel, F.; Jungbluth, N.; Juraske, R.; Schader, C.; Stolze, M. Environmental Impacts of Organic and Conventional Agricultural Products—Are the Differences Captured by Life Cycle Assessment? J. Environ. Manag. 2015, 149, 193–208. [Google Scholar] [CrossRef]
  35. ISO 14044; Environmental Management—Life Cycle Assessment—Requirements and Guidelines. ISO: Geneva, Switzerland, 2006.
  36. ISO 14040; Environmental Management—Life Cycle Assessment—Principles and Framework. ISO: Geneva, Switzerland, 2006.
  37. Wernet, G.; Bauer, C.; Steubing, B.; Reinhard, J.; Moreno-Ruiz, E.; Weidema, B. The Ecoinvent Database Version 3 (Part I): Overview and Methodology. Int. J. Life Cycle Assess. 2016, 21, 1218–1230. [Google Scholar] [CrossRef]
  38. Nemecek, T.; Bengoa, X.; Lansche, J.; Roesch, A.; Faist-Emmenegger, M.; Rossi, V.; Humbert, S. Methodological Guidelines for the Life Cycle Inventory of Agricultural Products; Quantis and Agroscope: Zurich, Switzerland, 2019. [Google Scholar]
  39. Van Paassen, M.; Braconi, N.; Kuling, L.; Durlinger, B.; Gual, P. Agri-Footprint 5.0; Blonk Consultants: Gouda, The Netherlands, 2009; p. 134. [Google Scholar]
  40. Eggleston, H.S. (Ed.) 2006 IPCC Guidelines for National Greenhouse Gas Inventories; Institute for Global Environmental Strategies: Hayama, Japan, 2006; ISBN 978-4-88788-032-0. [Google Scholar]
  41. Goedkoop, M.; Heijungs, R.; Huijbregts, M.; Schryver, A.D.; Struijs, J.; van Zelm, R. A Life Cycle Impact Assessment Method Which Comprises Harmonised Category Indicators at the Midpoint and the Endpoint Level; Ministry of VROM: The Hague, The Netherlands, 2009. [Google Scholar]
  42. Bernas, J.; Bernasová, T.; Nedbal, V.; Neugschwandtner, R.W. Agricultural LCA for Food Oil of Winter Rapeseed, Sunflower, and Hemp, Based on Czech Standard Cultivation Practices. Agronomy 2021, 11, 2301. [Google Scholar] [CrossRef]
  43. Bernas, J.; Bernasová, T.; Gerstberger, P.; Moudrý, J.; Konvalina, P.; Moudrý, J. Cup Plant, an Alternative to Conventional Silage from a LCA Perspective. Int. J. Life Cycle Assess. 2021, 26, 311–326. [Google Scholar] [CrossRef]
  44. Fan, J.; Liu, C.; Xie, J.; Han, L.; Zhang, C.; Guo, D.; Niu, J.; Jin, H.; McConkey, B.G. Life Cycle Assessment on Agricultural Production: A Mini Review on Methodology, Application, and Challenges. Int. J. Environ. Res. Public Health 2022, 19, 9817. [Google Scholar] [CrossRef]
  45. Brentrup, F.; Küsters, J.; Kuhlmann, H.; Lammel, J. Environmental Impact Assessment of Agricultural Production Systems Using the Life Cycle Assessment Methodology. Eur. J. Agron. 2004, 20, 247–264. [Google Scholar] [CrossRef]
  46. Amirahmadi, E.; Moudrý, J.; Konvalina, P.; Hörtenhuber, S.J.; Ghorbani, M.; Neugschwandtner, R.W.; Jiang, Z.; Krexner, T.; Kopecký, M. Environmental Life Cycle Assessment in Organic and Conventional Rice Farming Systems: Using a Cradle to Farm Gate Approach. Sustainability 2022, 14, 15870. [Google Scholar] [CrossRef]
  47. Barros, V. Globální Změna Klimatu; 1. vyd.; Mladá Fronta: Prague, Czech Republic, 2006; ISBN 978-80-204-1356-7. [Google Scholar]
  48. He, X.; Qiao, Y.; Liang, L.; Knudsen, M.T.; Martin, F. Environmental Life Cycle Assessment of Long-Term Organic Rice Production in Subtropical China. J. Clean. Prod. 2018, 176, 880–888. [Google Scholar] [CrossRef]
  49. Zhou, M.; Zhu, B.; Wang, S.; Zhu, X.; Vereecken, H.; Brüggemann, N. Stimulation of N2O Emission by Manure Application to Agricultural Soils May Largely Offset Carbon Benefits: A Global Meta-Analysis. Glob. Change Biol. 2017, 23, 4068–4083. [Google Scholar] [CrossRef] [PubMed]
  50. Webb, J.; Sørensen, P.; Velthof, G.; Amon, B.; Pinto, M.; Rodhe, L.; Salomon, E.; Hutchings, N.; Burczyk, P.; Reid, J. An Assessment of the Variation of Manure Nitrogen Efficiency throughout Europe and an Appraisal of Means to Increase Manure-N Efficiency. In Advances in Agronomy; Elsevier: Amsterdam, The Netherlands, 2013; Volume 119, pp. 371–442. ISBN 978-0-12-407247-3. [Google Scholar]
  51. Brankatschk, G.; Finkbeiner, M. Crop Rotations and Crop Residues Are Relevant Parameters for Agricultural Carbon Footprints. Agron. Sustain. Dev. 2017, 37, 58. [Google Scholar] [CrossRef]
  52. Jiang, Z.; Zheng, H.; Xing, B. Environmental Life Cycle Assessment of Wheat Production Using Chemical Fertilizer, Manure Compost, and Biochar-Amended Manure Compost Strategies. Sci. Total Environ. 2021, 760, 143342. [Google Scholar] [CrossRef]
  53. Mousavi-Avval, S.H.; Rafiee, S.; Sharifi, M.; Hosseinpour, S.; Notarnicola, B.; Tassielli, G.; Renzulli, P.A. Application of Multi-Objective Genetic Algorithms for Optimization of Energy, Economics and Environmental Life Cycle Assessment in Oilseed Production. J. Clean. Prod. 2017, 140, 804–815. [Google Scholar] [CrossRef]
  54. Fujii, K.; Funakawa, S.; Kosaki, T. Soil Acidification. Jpn. Soc. Pedol. 2012, 55, 415–425. [Google Scholar] [CrossRef]
  55. Verones, F.; Hellweg, S.; Azevedo, L.B.; Chaudhary, A.; Cosme, N.; Fantke, P.; Goedkoop, M.; Hauschild, M.; Laurent, A.; Mutel, C.L.; et al. LC-Impact Version 0.5: A Spatially Differentiated Life Cycle Impact Assessment Approach. Advance Access Published 2019. Available online: https://lc-impact.eu/doc/LC-Impact_report_SEPT2016_20160927.pdf (accessed on 10 July 2023).
  56. Verdi, L.; Marta, A.D.; Falconi, F.; Orlandini, S.; Mancini, M. Comparison between Organic and Conventional Farming Systems Using Life Cycle Assessment (LCA): A Case Study with an Ancient Wheat Variety. Eur. J. Agron. 2022, 141, 126638. [Google Scholar] [CrossRef]
  57. Zhao, J.; Yuan, L.; Chen, H.; Chen, X.; He, H.; Zhang, X.; Xie, H.; Lu, C. Reduction of NH3 Emissions from Urea by Long-Term No-Tillage and Stover Mulching with Inhibitors: An Isotopic Field Study in Northeast China. Agronomy 2023, 13, 2235. [Google Scholar] [CrossRef]
  58. Pericherla, S.; Karnena, M.K.; Vara, S. A Review on Impacts of Agricultural Runoff on Freshwater Resources. Int. J. Emerg. Technol. 2020, 11, 829–833. [Google Scholar]
  59. Li, T.; Wang, Z.; Wang, C.; Huang, J.; Feng, Y.; Shen, W.; Zhou, M.; Yang, L. Ammonia Volatilization Mitigation in Crop Farming: A Review of Fertilizer Amendment Technologies and Mechanisms. Chemosphere 2022, 303, 134944. [Google Scholar] [CrossRef] [PubMed]
  60. Rochette, P.; Angers, D.A.; Chantigny, M.H.; MacDonald, J.D.; Gasser, M.-O.; Bertrand, N. Reducing Ammonia Volatilization in a No-till Soil by Incorporating Urea and Pig Slurry in Shallow Bands. Nutr. Cycl. Agroecosyst. 2009, 84, 71–80. [Google Scholar] [CrossRef]
  61. Martines, A.M.; Nogueira, M.A.; Santos, C.A.; Nakatani, A.S.; Andrade, C.A.; Coscione, A.R.; Cantarella, H.; Sousa, J.P.; Cardoso, E.J.B.N. Ammonia Volatilization in Soil Treated with Tannery Sludge. Bioresour. Technol. 2010, 101, 4690–4696. [Google Scholar] [CrossRef] [PubMed]
  62. Asman, W.A.H.; Sutton, M.A.; Schjorring, J.K. Ammonia: Emission, Atmospheric Transport and Deposition. N. Phytol. 1998, 139, 27–48. [Google Scholar] [CrossRef]
  63. González-García, I.; Riaño, B.; Cuéllar-Franca, R.M.; Molinuevo-Salces, B.; García-González, M.C. Environmental Sustainability Performance of a Membrane-Based Technology for Livestock Wastewater Treatment with Nutrient Recovery. J. Environ. Chem. Eng. 2022, 10, 107246. [Google Scholar] [CrossRef]
  64. Lee, H.K.; Khaine, I.; Kwak, M.J.; Jang, J.H.; Lee, T.Y.; Lee, J.K.; Kim, I.R.; Kim, W.I.; Oh, K.S.; Woo, S.Y. The Relationship between SO2 Exposure and Plant Physiology: A Mini Review. Hortic. Environ. Biotechnol. 2017, 58, 523–529. [Google Scholar] [CrossRef]
  65. Ju, X.-T.; Xing, G.-X.; Chen, X.-P.; Zhang, S.-L.; Zhang, L.-J.; Liu, X.-J.; Cui, Z.-L.; Yin, B.; Christie, P.; Zhu, Z.-L.; et al. Reducing Environmental Risk by Improving N Management in Intensive Chinese Agricultural Systems. Proc. Natl. Acad. Sci. USA 2009, 106, 3041–3046. [Google Scholar] [CrossRef]
  66. Ye, M.; Pan, W.; Dai, W. Composite Iron-Carbon Constructed Wetland Combined with Photocatalytic Film to Restore Eutrophic Water Body and the Hydraulic Performance of Constructed Wetland. J. Water Process Eng. 2023, 53, 103590. [Google Scholar] [CrossRef]
  67. Food and Agriculture Organization of the United Nations. Water for Sustainable Food and Agriculture; FAO: Rome, Italy, 2017; ISBN 978-92-5-109977-3. [Google Scholar]
  68. Poore, J.; Nemecek, T. Reducing Food’s Environmental Impacts through Producers and Consumers. Science 2018, 360, 987–992. [Google Scholar] [CrossRef]
  69. Beusen, A.H.W.; Van Beek, L.P.H.; Bouwman, A.F.; Mogollón, J.M.; Middelburg, J.J. Coupling Global Models for Hydrology and Nutrient Loading to Simulate Nitrogen and Phosphorus Retention in Surface Water—Description of IMAGE–GNM and Analysis of Performance. Geosci. Model Dev. 2015, 8, 4045–4067. [Google Scholar] [CrossRef]
  70. Holka, M. Life cycle assessment (LCA) of winter wheat in an intensive crop production system in Wielkopolska region (Poland). Appl. Ecol. Environ. Res. 2016, 14, 535–545. [Google Scholar] [CrossRef]
  71. Jwaideh, M.A.A.; Sutanudjaja, E.H.; Dalin, C. Global Impacts of Nitrogen and Phosphorus Fertiliser Use for Major Crops on Aquatic Biodiversity. Int. J. Life Cycle Assess. 2022, 27, 1058–1080. [Google Scholar] [CrossRef]
  72. Eyhorn, F. Reducing Pesticide Use and Risks—What Action Is Needed? Helvetas: Zurich, Switzerland, 2015. [Google Scholar] [CrossRef]
  73. Iverson, A.N.; Halberg, A. Muller: Organic Agriculture for Sustainable Livelihoods. Landscape Ecol. 2014, 29, 1821–1823. [Google Scholar] [CrossRef]
  74. Alexandratos, N.; Bruinsma, J. World Agriculture towards 2030/2050. The 2012 Revision. 2012, 154. Available online: http://www.fao.org/docrep/016/ap106e/ap106e.pdf (accessed on 8 March 2023).
  75. Meier, U.; Bleiholder, H.; Buhr, L.; Feller, C.; Hack, H.; Heß, M.; Lancashire, P.D.; Schnock, U.; Stauß, R.; Van Den Boom, T.; et al. The BBCH System to Coding the Phenological Growth Stages of Plants—History and Publications. J. Cultiv. Plants 2009, 61, 41–52. [Google Scholar] [CrossRef]
Figure 1. Share of crops in (a) organic and (b) conventional farming systems.
Agriculture 13 02068 g001
Figure 2. Life cycle assessment workflow.
Agriculture 13 02068 g002
Figure 3. System boundaries from “cradle to farm gate” of organic (a) and conventional (b) winter wheat farming.
Agriculture 13 02068 g003
Figure 4. Midpoint environmental impact level for the unit of production (FU = kg ha−1) from the cradle to farm gate approach for environmental impacts; ReCiPe midpoint (H) method, characterization model; results are expressed kg ha−1.
Agriculture 13 02068 g004
Figure 5. (a–h) Midpoint environmental impact level for the unit of production (FU = kg ha−1). Contribution analysis from the cradle to farm gate approach for environmental impact categories; ReCiPe midpoint (H) method, characterization model.
Agriculture 13 02068 g005
Figure 6. Environmental impact level for the unit of production (FU = kg ha−1). Damage categories from the cradle to farm gate approach for environmental impacts; ReCiPe midpoint (H) method, characterization model; results are expressed kg ha−1.
Agriculture 13 02068 g006
Table 1. Inventory table: inputs and outputs of the life cycle.
UnitORG-FORGCON-FCON
Outputs
Grain yieldkg ha−16106553072305366
Straw yieldkg ha−17570734381806740
Unit of area- 1 ha of the selected cropha1111
Area needed for generating the same yieldha1.181.3111.35
Inputs from Technosphere
Tillage, ploughingha1111
Tillage, cultivating, chiselingha112 × 12 × 1
Tillage, harrowing, by offset disc harrowha1111
Tillage, harrowing, by offset leveling disc harrowha1111
Combine harvestingha1111
Sowingha1111
Seedskg200200200200
Nitrogen fertilizer, as Nkg ha−163-80-
Inorganic potassium fertilizers, as K2Okg ha−194-77-
Inorganic phosphorus fertilizers, as P2O5kg ha−139-37-
Fertilizing, by broadcasterha1-3 × 1-
Application of plant protection product by field sprayerha--11
Herbicide, mix for cereal crops, at plantkg--0.7330.733
Herbicide emissions, at farmkg--0.7330.733
Manure management at the farmkg2233-2233-
Manure treatmentkg2233-2233-
Transport, tractor, and trailer, agricultural (Graintkm30.627.736.626.8
Transport tractor, and trailer, agricultural (Straw)tkm37.936.740.933.7
Resources
Precipitationm37751.57751.57751.57751.5
Water (medium for plant protection products)l--300300
Emissions to air
Nitrogen oxideskg ha−1--3.082-
Dinitrogen monoxidekg ha−13.453.464.763.47
Ammoniakg ha−1--1.25
Emissions to water
Nitratekg ha−184.989.310992.1
Phosphoruskg ha−11.06-1.06-
Phosphatekg ha−10.303-0.332-
IPCC calculated following the IPCC (Intergovernmental Panel on Climate Change) methodology (determination of field emissions), Conventional fertilized (CON-F), conventional unfertilized (CON), organic fertilized (ORG-F), organic unfertilized (ORG).
Table 2. Midpoint environmental load per production unit (1 kg of the final product).
Impact CategoryDamage CategoryAbbreviationUnitORG-FORGCON-FCON
Global warmingClimate changeGWPkg CO2 eq2.23 × 10−11.31 × 10−12.04 × 10−11.40 × 10⁻¹
Terrestrial acidificationEcosystem qualityTAkg SO2 eq4.35 × 10−32.92 × 10−42.10 × 10−33.14 × 10⁻⁴
Freshwater eutrophicationEcosystem qualityFEkg P eq1.18 × 10−41.72 × 10−51.29 × 10−41.89 × 10⁻⁵
Marine eutrophicationEcosystem qualityMEkg N eq5.46 × 10−44.90 × 10−44.90 × 10−45.00 × 10⁻⁴
Terrestrial ecotoxicityEcosystem qualityTETkg 1,4-DCB2.71 × 10−11.89 × 10−19.79 × 10−12.64 × 10⁻¹
Freshwater ecotoxicityEcosystem qualityFETkg 1,4-DCB3.14 × 10−32.14 × 10−31.70 × 10−21.29 × 10⁻²
Marine ecotoxicityEcosystem qualityMETkg 1,4-DCB3.79 × 10−32.45 × 10−31.14 × 10−23.54 × 10⁻³
Water consumptionResourcesWCm32.55 × 10−41.40 × 10−41.79 × 10−31.82 × 10⁻⁴
Table 3. Midpoint environmental load per land demand.
Impact CategoryDamage CategoryAbbreviationUnitORG-FORGCON-FCON
Global warmingClimate changeGWPkg CO2 eq3.60 × 1032.21 × 1033.15 × 1032.29 × 103
Terrestrial acidificationEcosystem qualityTAkg SO2 eq7.02 × 1014.923.16 × 1015.14
Freshwater eutrophicationEcosystem qualityFEkg P eq1.902.90 × 10−11.983.09 × 10−2
Marine eutrophicationEcosystem qualityMEkg N eq8.828.21E+007.658.72
Terrestrial ecotoxicityEcosystem qualityTETkg 1,4-DCB4.38 × 1033.19 × 1031.51 × 1044.31 × 103
Freshwater ecotoxicityEcosystem qualityFETkg 1,4-DCB5.07 × 1013.62 × 1012.62 × 1022.12 × 102
Marine ecotoxicityEcosystem qualityMETkg 1,4-DCB6.13 × 1014.14 × 1011.76 × 1025.79 × 101
Water consumptionResourcesWCm34.122.362.76E+012.97
Disclaimer/Publisher’s Note: The statements, opinions and data contained in all publications are solely those of the individual author(s) and contributor(s) and not of MDPI and/or the editor(s). MDPI and/or the editor(s) disclaim responsibility for any injury to people or property resulting from any ideas, methods, instructions or products referred to in the content.

