Article

Nutritional and Antinutritional Potentials of Sorghum: A Comparative Study among Different Sorghum Landraces of Tigray, Northern Ethiopia

1
Department of Biotechnology, Mekelle University, Mekelle P.O. Box 231, Tigray, Ethiopia
2
Department of Plant Sciences (IPV), Norwegian University of Life Sciences (NMBU), P.O. Box 5003, 1432 Aas, Norway
3
Department of Dryland Crops and Horticultural Sciences, Mekelle University, Mekelle P.O. Box 231, Tigray, Ethiopia
4
Department of Food Science and Post-Harvest Technology, Mekelle University, Mekelle P.O. Box 231, Tigray, Ethiopia
5
Department of International Environment and Development Studies (Noragric), Norwegian University of Life Sciences (NMBU), P.O. Box 5003, 1433 Aas, Norway
*
Author to whom correspondence should be addressed.
Agriculture 2023, 13(9), 1753; https://doi.org/10.3390/agriculture13091753
Submission received: 10 August 2023 / Revised: 29 August 2023 / Accepted: 30 August 2023 / Published: 4 September 2023
(This article belongs to the Special Issue Breeding and Genetic Research of Cereal Grain Quality)

Abstract

:
Sorghum is one of the staple food crops in Tigray, northern Ethiopia. Despite this, limited research attention was given to the nutritional and antinutritional profiling of sorghum. Thus, this research was initiated to profile and evaluate the variabilities in protein, starch, minerals, flavonoid, tannin, and antioxidant activities among sorghum landraces of Tigray, northern Ethiopia. Protein and starch were analyzed using an infrared spectrophotometer, whereas mineral elements were estimated using an atomic absorption spectrophotometer. Antioxidant activity was analyzed using DPPH (2,2-diphenyl-1-picrylhydrazyl) free radical scavenging, ferric-reducing antioxidant power, and phosphomolybdenum assays. The result revealed significant variation among the landraces for all the evaluated parameters. Protein and starch contents ranged from 6.21 to 18% and 33.42 to 78.30%, respectively. Wider variations were observed for Fe (32–101), Zn (16.9–42.98), Cu (1.48–5.25), Mn (9.21–20.23), and Cr (0–1.5) as measured in mg/100 g. The variabilities were high for total flavonoid (0–665 mg CE/g) and tannin (0.18–7.5 mgCE/100 g). DPPH (EC50 = 29.09–818.37 µg/mL), ferric reducing antioxidant power (17.85–334.81 mgAAE/g), and total antioxidant activity (1.71–63.88 mgBHTE/g) were also highly variable among the samples. The relationship between seed color and phenolics, as well as antioxidant activities, are discussed. Multivariate analysis revealed that the landraces were clustered into four distinct groups. The rich genetic diversity in the nutritional and antinutritional attributes may be an opportunity for breeding for grain quality improvements of sorghum that, in turn, helps in addressing malnutrition.

1. Introduction

In developing countries, agricultural research on crops was emphasized to increase production to reduce hunger. However, limited research attention was given to nutritional quality improvement in crops, and for this reason, malnutrition problems are becoming the main public health challenge. In Ethiopia, for example, micronutrient deficiency, among which iron and zinc are common, remains a substantial public health problem. All forms of malnutrition are estimated to contribute to 45% of child deaths in developing countries [1]. It was estimated that about 2 billion people in the world lack key micronutrients like iron and vitamin A, and thus, they experience malnutrition because they mostly consume staples to avoid hunger [2].
Plant breeding can be one of the mitigating strategies to reduce malnutrition [3,4]. However, before the initiation of breeding strategies, it is necessary to explore the grain quality and composition of the diverse crop genetic resources intended to be improved. Thus, it is critical to harness the genetic diversity of crops, particularly landraces such as sorghum landraces, for improved nutritional quality traits, thereby reducing malnutrition. Landraces (also called “farmers’ varieties”) are dynamic populations of cultivated crops that have historical origins and distinct identities, lack formal crop improvement programs, and are associated with the traditional farming systems that are maintained and owned by local farmers to meet their socio-economic and cultural needs [5,6]. They can also be defined as plant populations maintained via the conscious selection of farmers for their stable, functional attributes and morphological characteristics within a defined biophysical and social environment [7]. They own locally adapted and untapped reservoirs of useful genes that have unique and potential sources of traits for improved nutrition and biotic and abiotic tolerances [8].
Sorghum (Sorghum bicolor Moench (L.)), the third most important cereal crop after teff and maize in terms of production in Ethiopia [9], is one of the stable foods in many parts of Ethiopia, including Tigray that is mainly consumed in the form of enjera (Ethiopian pancake-like flat bread) and Swa (local beverage) [10,11]. Sorghum is one of the healthiest and most nutritious food crops in view of its richness in minerals, energy, protein, vitamins, fiber, phenolic compounds, and gluten-free properties for the people of the semi-arid tropics [12,13,14]. It is one of the important sources of mineral elements such as iron and zinc in low-income communities. Although sorghum is a nutritious crop, its nutritional profile is highly genotype and environment-dependent [15,16,17,18]. Genetic variation in nutritional composition was reported among Ethiopian [15] and Malawian, Tanzanian, and Zambian [19] sorghum landraces. The variability among South African [17] and Ethiopian [20] sorghum genotypes for protein content was reported. The starch content and composition of sorghum were also influenced by its genetic properties and environment [15,20,21,22]. In addition, the mineral content of sorghum was affected by the site of cultivation and countries of origin [18].
Phenolic compounds found in whole grains of some cereals, including sorghum, are among the health-promoting phytochemicals as they have unique bioactive properties. These phenolics act as antioxidants due to their ability to scavenge free radicals before they cause oxidative damage to the cellular structure [23]. The availability of phenolic compounds such as flavonoids and tannin in sorghum, which are found in its pericarp layer, has been reported [24,25,26]. It is well known that the presence of pigments in the pericarp layer is due to the presence of B1 and B2 genes, and for the expression of these genes, the existence of tannins is essential. The unique beneficial aspect of sorghum as human food is due to the composition of polyphenol compounds [27]. Sorghum has a diverse range of phenolic compounds that are not commonly found in other cereal grains [28]. The content of phenolics varies widely among sorghums, and their antioxidant activity level varies accordingly and is influenced by the genetics of the crop and environment [14,28].
Despite the fact that sorghum is a diverse and stable food crop used for different end-uses in Tigray, northern Ethiopia, comprehensive information on nutritional and antinutritional profiling and variability among the sorghum landraces of Tigray is not documented yet. This makes it critical to profile the level of genetic diversity for proximate, mineral, phenolic compounds, and antioxidant activities. Therefore, the main objective of this study was to determine the extent of genetic variation in sorghum landraces with respect to protein, starch, minerals, total flavonoid, total tannin, and antioxidant activities. It was also intended to select nutritionally superior landraces to be utilized in the future for complementary food development as well as to be used as breeding materials for improved grain quality traits of sorghum.

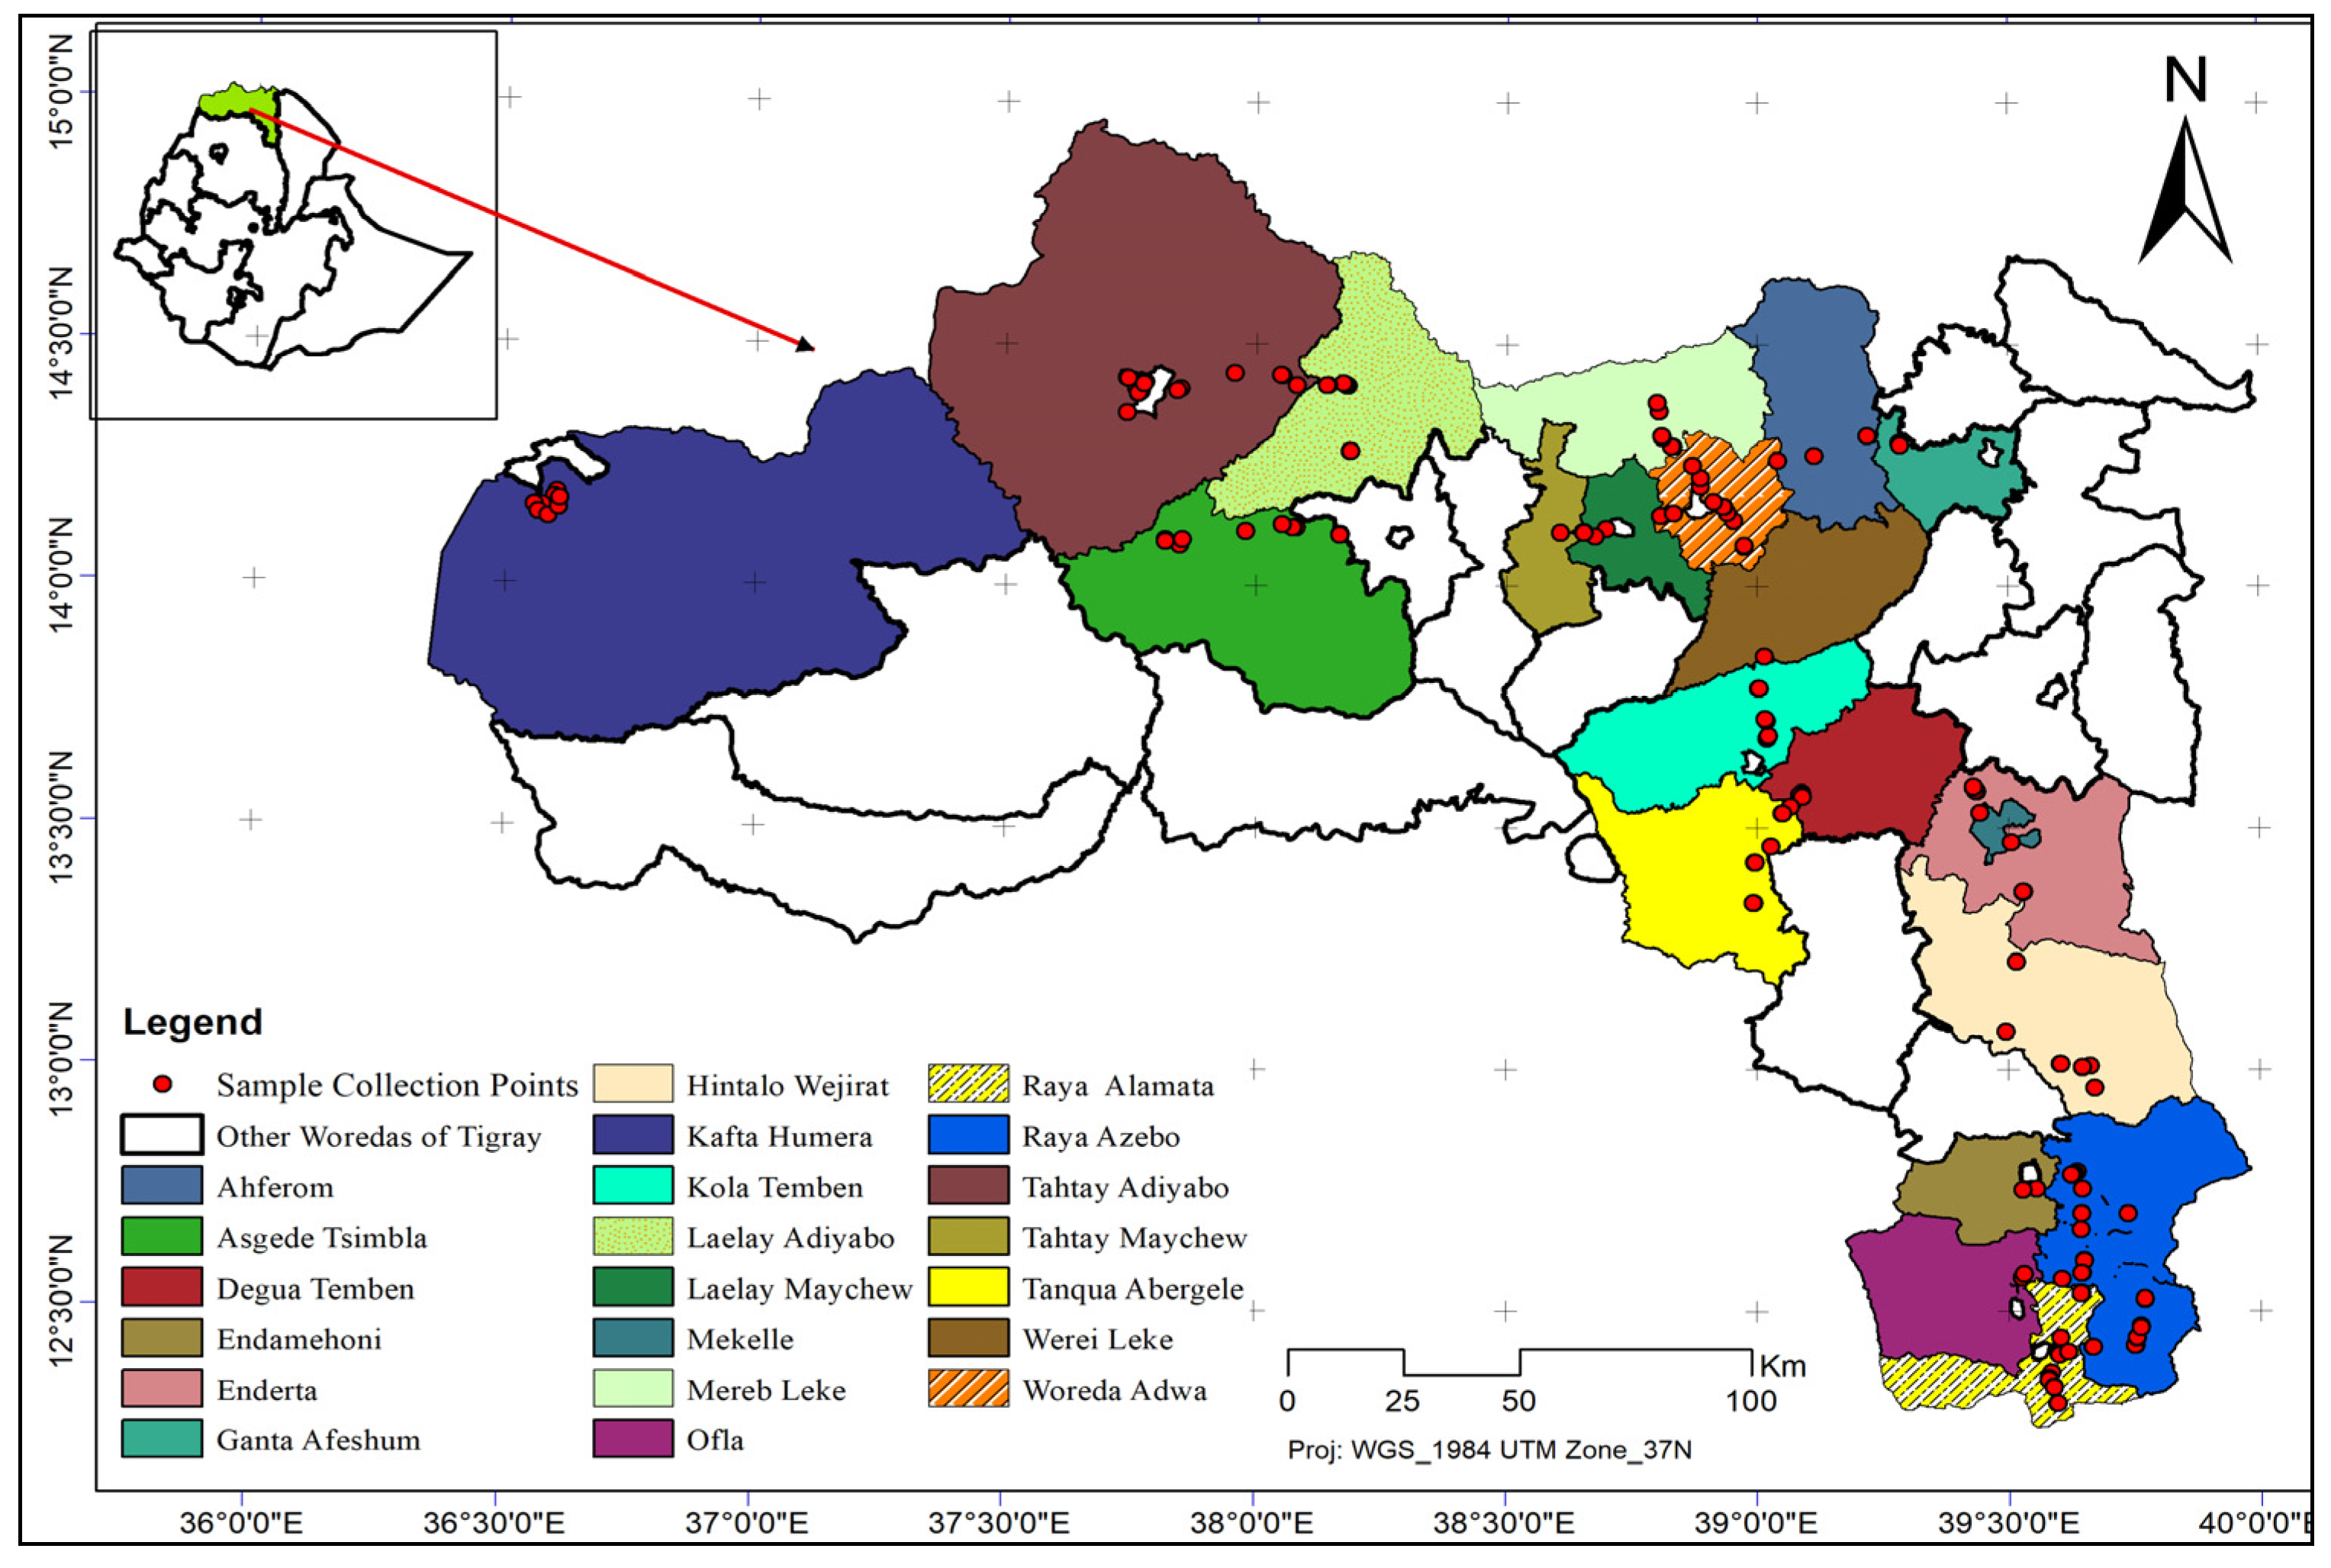
2. Materials and Methods

2.1. Plant Materials

All the sorghum samples used in the current study are landraces collected in situ (on-farm). Panicles of these landraces were collected from 20 sorghum-growing localities (‘weredas’) of the Tigray region, northern Ethiopia (Figure 1). The unit of collection was vernacular names (local names) based on traces by farmers, and farmers were also involved in describing their end-use qualities. Three major races (bicolor, durra, and caudate) and one intermediate race (durra-bicolor) were included in the collection. As part of this collection mission, sweet sorghum landraces (locally named ‘Tinkish’) and the wild relative of sorghum were included. A total of 358 landraces were used for the analysis of protein and starch. The list of the landraces with all other collection information (local name, zone of collection, GPS, altitude, temperature, and precipitation) is illustrated in Supplementary Table S1. However, for the determination of minerals, total flavonoid content (TFC), total tannin content (TTC), and antioxidant activity, 21 selected sorghum landraces were used. These 21 landraces were selected based on their merit of a wide spectrum of utilization in the traditional food culture (different end-use attributes) in the study area, Tigray (Table 1). Further, only 21 landraces were selected due to the limitation of resources that limited us from analyzing all the 358 landraces. Multivariate analysis was conducted based on these 21 landraces for all the nutritional and antinutritional traits.

2.2. Sample Preparation and Extraction

Panicles of each sample were dried, and their moisture content was measured (Supplementary Table S2) to make sure that the samples were in a desiccated state. Seeds were then thrashed separately and subjected to cleaning, and only pure seeds were kept for further analysis. The samples were grounded to a fine powder using an electric grinder (FM100 model, Pancheng, China). The extract was prepared by dissolving 10 g of fine powder in 100 mL of methanol, and the contents were kept in an orbital shaker for 8 h at room temperature. Thereafter, each extract was filtered using Whatman no.1 filter paper and evaporated to dryness under vacuum at 40 °C using a rotary evaporator (Buchi, 3000 series, Flawil, Switzerland). The resulting extracts were kept in a sealed glass bottle and stored at −20 °C until the analysis of total flavonoid content, total tannin content, and antioxidant activities. The sources for all the chemicals and reagents used in this study are Sigma-Aldrich (Merck KGaA, Darmstadt, Germany).

2.3. Determination of Protein and Starch

Protein and starch contents of the sorghum samples were analyzed using near-infrared spectrophotometers (DA 7250 Perkin) as described in http://www.perkinelmer.com [29]. NIR (Near InfraRed) spectrophotometer is the most effective and non-destructive technique for the analysis of grain quality traits, including protein and starch [30]. A 100 g of pure sorghum seeds of each sample were placed in a sample cup for scanning of the whole seeds. The samples were scanned twice, and average values of protein and starch were recorded.

2.4. Estimation of Mineral Concentration

The concentrations of mineral elements, including iron (Fe), zinc (Zn), manganese (Mn), copper (Cu), and chromium (Cr), were estimated using an atomic absorption spectrophotometer (Varian AA240FS) at EZANA Mining Development Plc, Mekelle, Ethiopia as described by Melash and Mengistu [31]. A dried seed sample of each landrace was ground to a fine powder, and 2 g powder was taken into an ashing vessel that was ashed at 550 °C. To complete the ashing process, the ash was dissolved in a volume of HCl-H2O (1:1). The samples were then subjected to mineral analysis with an atomic absorption spectrophotometer using an air-acetylene flame. The estimated concentrations of minerals were expressed in mg/100 g of the sample.

2.5. Determination of Phenolic Compounds

2.5.1. Determination of Total Flavonoid Content

The total flavonoid content of the samples was estimated according to the method of Quettier et al. [32]. The methanol (CH3OH) extract (1 mg/mL) was diluted with 1.25 mL of distilled water, and then 75 μL NaNO2 was added to the mixture. AlCl3 (150 μL; 10%) and NaOH (1 mL; 1 M) were added to the mixture separately, each after 5 min intervals. The absorbance of the mixture having a pink color was then read at 415 nm against the blank (methanol extract without AlCl3). The measurement was performed in duplicate, and the average absorbance was taken. Total flavonoid content was determined using a standard curve of catechin (1–40 μg/mL), and values were calculated as milligrams of catechin (C15H14O6) equivalent per gram of dried extract (mg CE/g).

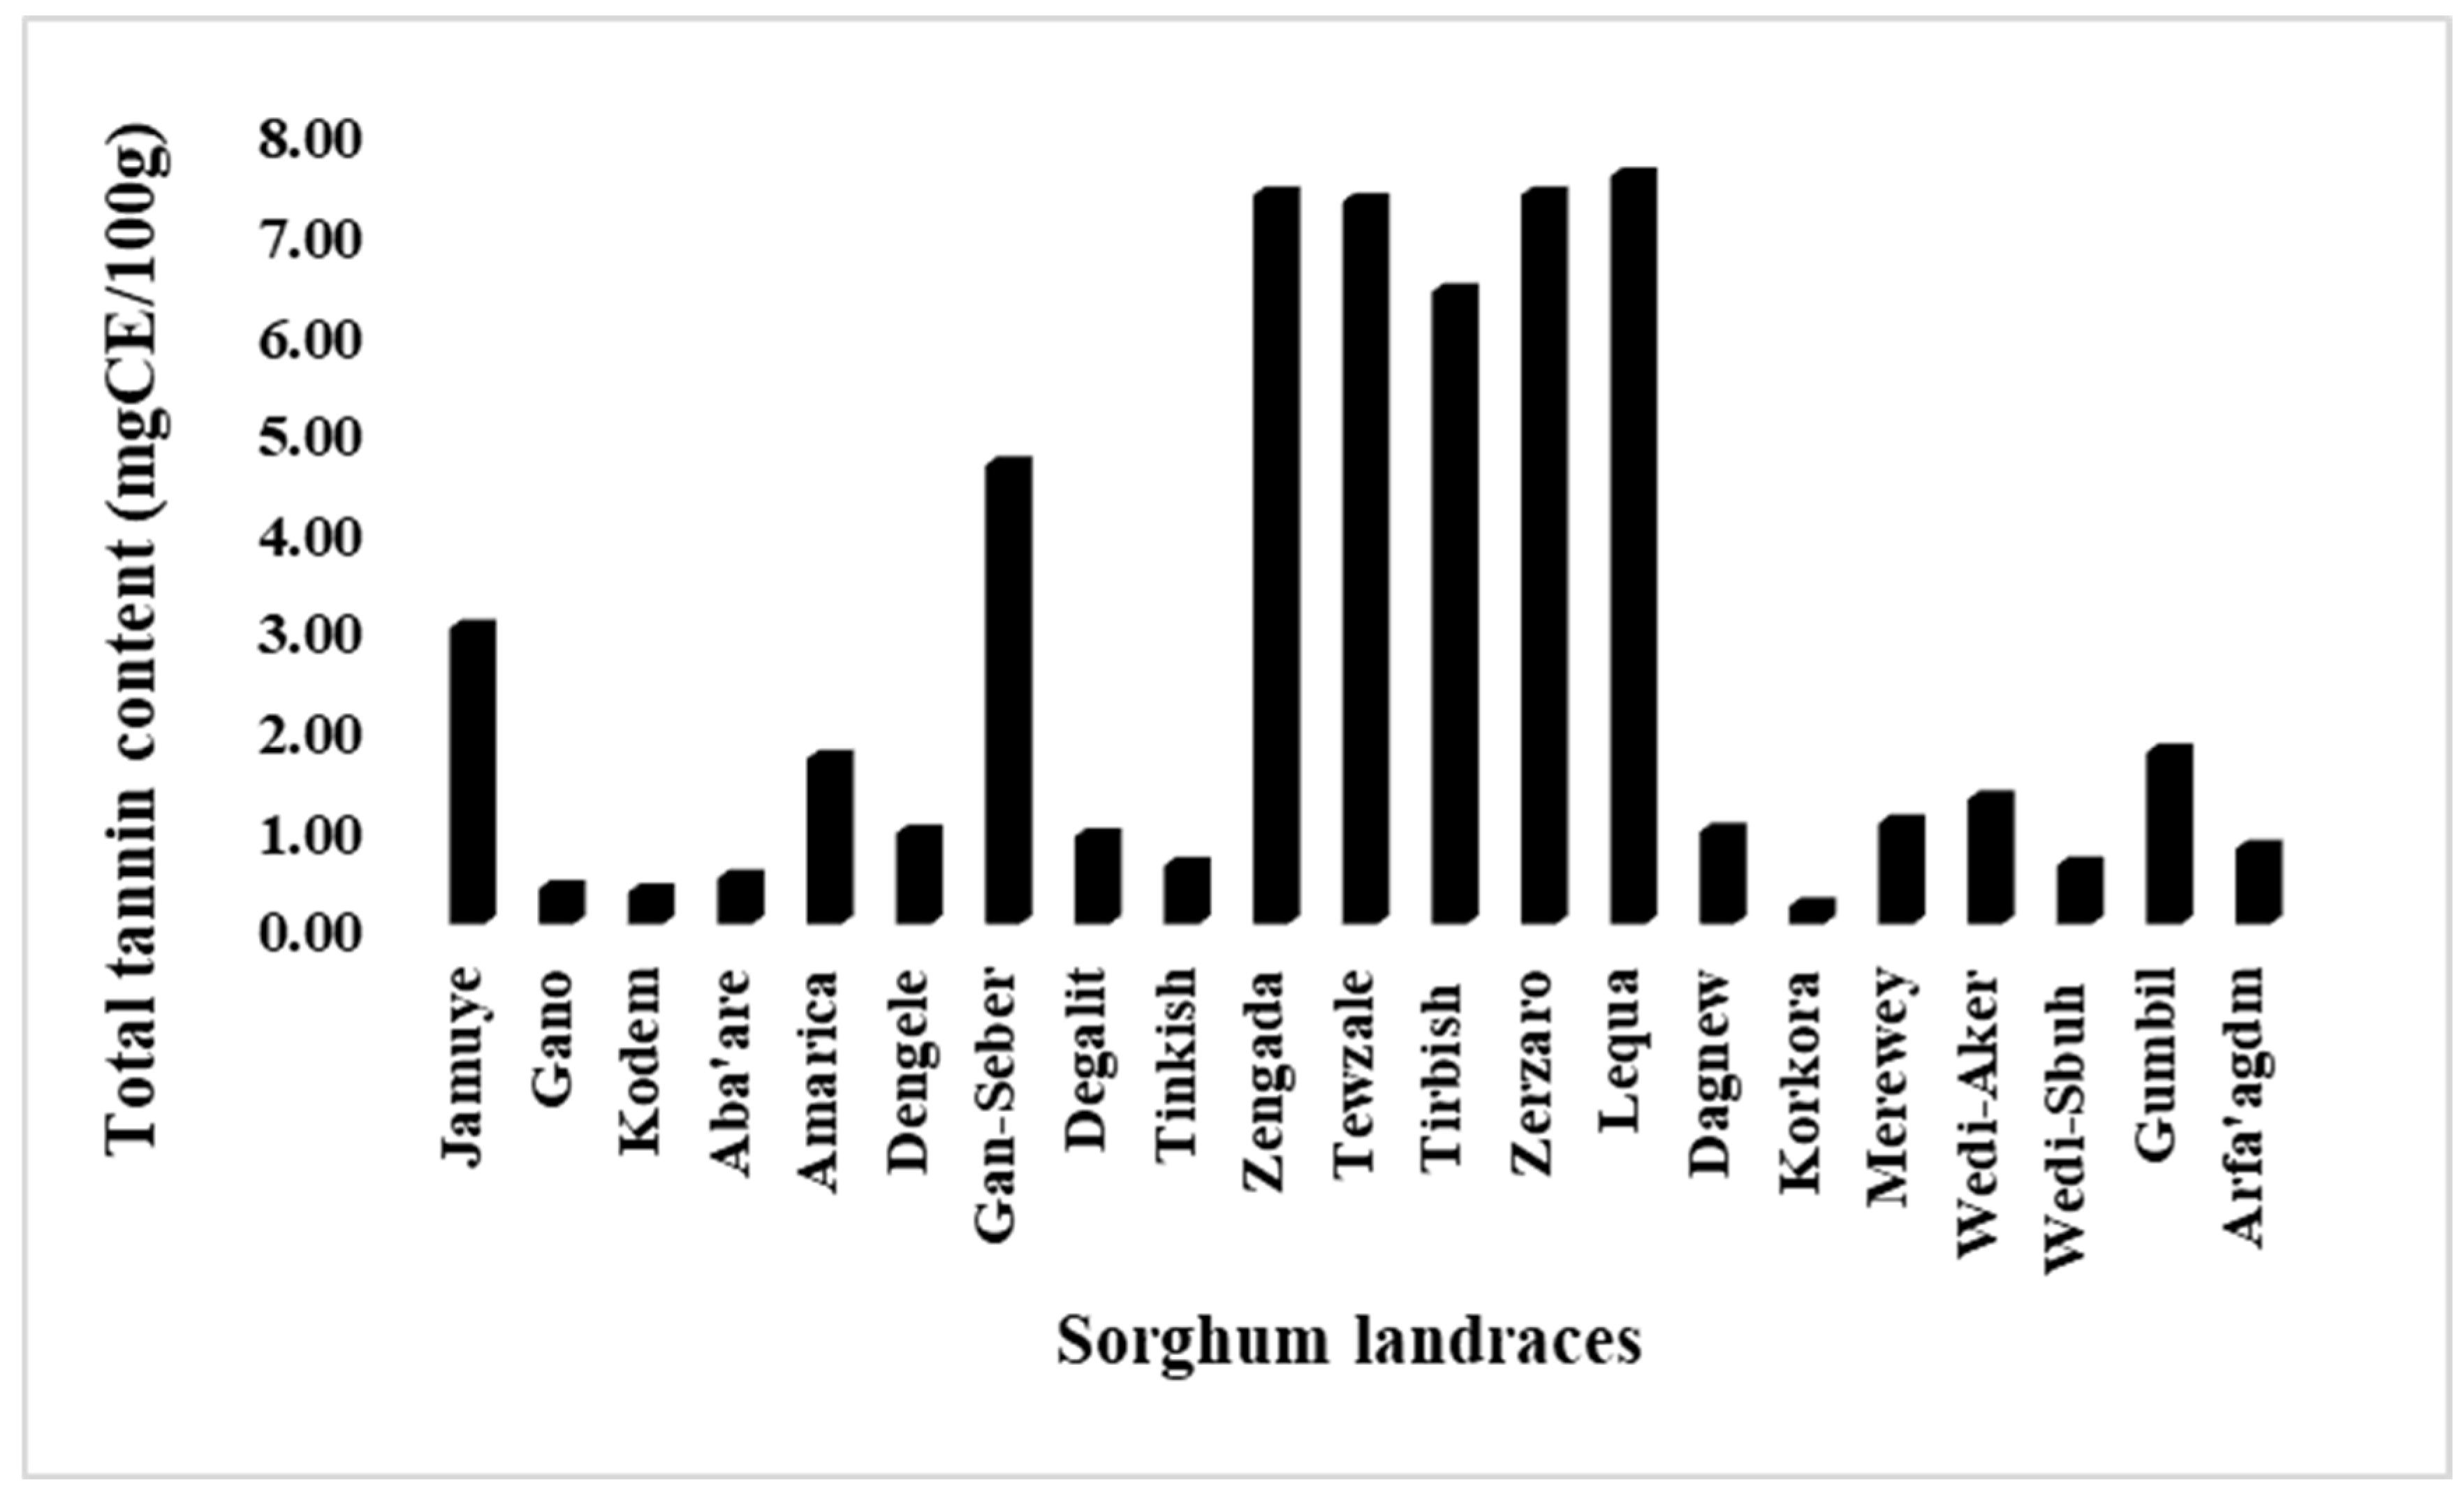
2.5.2. Determination of Total Tannin Content

Total tannin content was determined based on the method described by Chew et al. [33]. A 0.5 mL of undiluted crude extract (1 mg/mL) was mixed with 3 mL of vanillin (C8H8O3) reagent (4% w/v, in absolute methanol (CH3OH)), followed by an addition of 1.5 mL of concentrated HCl. The mixture was then stored for 15 min at room temperature in a dark environment. Blank was prepared by replacing the 0.5 mL of undiluted crude extract with 0.5 mL of deionized water. The absorbance of the mixture was measured at 500 nm against a blank using a spectrophotometer. The measurement was performed in duplicate, and the average absorbance was taken. Catechin (1–40 μg/mL) was used for the calibration of the standard curve, and the results were expressed as milligrams of catechin (C15H14O6) equivalent per 100 g of dry weight sample (mg CE/100 g).

2.6. Determination of Antioxidant Capacity

2.6.1. DPPH Radical Scavenging Assay

The DPPH (2,2-diphenyl-1-picrylhydrazyl) radical scavenging activities of the sorghum extracts were determined according to the method of Katerere and Eloff [34]. Different concentrations (50–1000 µg/mL) of each extract were taken in different test tubes, and a solution of DPPH in methanol (CH3OH) (2 mL, 0.006% w/v) was added to each test tube. The reaction mixture was shaken vigorously and left in the dark for 30 min, and then absorbance was measured at 520 nm using a spectrophotometer. Methanol was used as a blank. The measurement was performed in duplicate, and the average absorbance was taken. The antioxidant activity was expressed as the percent of DPPH radical scavenging, which is calculated using the equation:
D P P H   s c a v e n g i n g % = A c A s × 100 A c
where Ac is the absorbance of the control and As is the absorbance of the sample, the effective concentration (EC50) at which 50% of DPPH radicals are scavenged was calculated from the graph percentage of DPPH scavenging activity against extract concentration. The EC50 was expressed in μg/mL.

2.6.2. Ferric Reducing Antioxidant Power

The ferric-reducing antioxidant power (FRAP) assay was performed as described by Engida [35]. Sample extract solution (1 mg/mL) was mixed with sodium phosphate (NaH2PO4) buffer (2.5 mL, 0.2 M, pH 6.6) and potassium ferricyanide (K3Fe(CN)6) (2.5 mL, 1% w/v). After the mixture was incubated at 50 °C for 20 min, trichloroacetic acid (C2HCl3O2) (2.5 mL, 10% w/v) was added, followed by centrifugation at 3000 rpm (Centurion, 1000 series, Scotland, UK) for 5 min. Finally, 2.5 mL of the supernatant solution was mixed with 2.5 mL of distilled water and 0.5 mL of FeCl3 (0.1% w/v). After incubation at room temperature in the dark for 30 min, absorbance was measured at 700 nm using a spectrophotometer. The measurement was performed in duplicate, and the average absorbance was taken. Antioxidant activity was expressed as milligrams of ascorbic acid equivalents per gram of dried extract (mg AAE/g).

2.6.3. Total Antioxidant Capacity with Phosphomolybdenum Assay

The total antioxidant activities (TAC) of the samples were determined using a phosphomolybdenum assay as described by Prieto et al. [36]. A sample extract of 0.3 mL was mixed with 2.5 mL of phosphomolybdenum reagent (0.6 M sulfuric acid, 28 mM sodium sulfate (NaH2PO4), and 4 mM ammonium molybdate ([NH4]2MoO4) mixed in 250 mL distilled water). The absorbance of the reaction mixture was measured at 695 nm on a spectrophotometer. Total antioxidant capacity was expressed as milligram equivalent of butylated hydroxytoluene per gram of dried extract (mg BHTE/g).

2.7. Statistical Data Analysis

The results obtained from the two replicas were reported as mean values ± standard error. Significant tests were performed using a t-test in IBM-SPSS (Armonk, NY, USA). Cluster analysis was conducted on the standardized data using the Ward Linkage method and Squared Euclidean Distance measure in MINITAB v19. Discriminant analysis (DA) was conducted to validate the groups created using the cluster analysis. Principal component analysis (PCA) was performed using a correlation matrix to define the existing pattern of variation among populations using Past4.0 software.

3. Results

3.1. Variabilities for Protein and Starch

Statistically significant (p < 0.001) variations for protein and starch contents were found among the 358 sorghum landraces (Table 2). Data on protein and starch for all 358 landraces is illustrated in Supplementary Table S2. The protein content ranged from 6.21 to 18%, with a mean value of 11.40%. The sorghum landrace Arfa’agdm was superior in protein content, followed by the landraces Tsaeda Jargte and Keyih Afincho, with an equal protein content of 17%. The lowest protein content (6.21%) was observed in the landrace Lequa. Protein content variability among the sorghum landraces that have similar local names was observed. For example, the protein content of sorghum landraces named Arfa’agdm (15.36–18%), Lequa (6.21–13.96%), Kodem (8.88–15.17%), and Shilkuit (7.31–13.31%) were variable. In this study, five sweet sorghum types that the farmers locally called these types as “Tinkish” were part of the analysis. These all were collected from the southern zone of Tigray, particularly from the districts of Raya-Alamata. Higher protein was found in Lewaso Tinkish with a value of 15.77%, followed by Tinkish varieties Gorid and Gegebsa with protein contents of 14.67% and 14.52%, respectively, whereas lower protein content was found in Tinkish Afincho (11.54%) and Tinkish Hawaye (12.87%).
The starch content of the sorghum landraces was in the range of 33.42 to 78.30%. Next to Kodem, with 78.30% protein, the highest starch content was recorded from landrace Tsaeda Kubi (77.48%). The lowest starch was found from Zeri-Sheytan [the Devil’s sorghum], which is a wild type of sorghum, followed by Lequa, with a value of 43%. As is shown in protein, variabilities for starch within the same locally named landraces were also observed; for example, the starch content of Kodem varied from 51.65 to 78.3% and that of Lequa from 45.84 to 76.92%. The wild types of sorghum showed wide variability for protein (10.4–14.78%), and starch (33.42–63.9%) contents, and some of the wild types had higher protein and starch contents than many of the cultivated sorghum landraces.

3.2. Variabilities for Mineral Elements

The result revealed the presence of statistically significant (p < 0.001) variability for mineral concentrations among the landraces (Table 2). Data for all minerals of all the 21 landraces is shown in Supplementary Table S3. Fe concentration ranged between 32 and 101 mg/100 g. The highest concentration of Fe was obtained from landrace Jamuye, followed by Dagnew, with a concentration of 79 mg/100 g. Next to Dengele with a value of 32 mg/100 g, Aba’are, and Tirbish scored the lowest Fe, with a value of 36.54 and 38.31 mg/100 g, respectively. For zinc, maximum (42.98 mg/100 g) and minimum (16.90 mg/100 g) concentrations were found from the landraces of Dagnew and Zengada, respectively. Mn concentration in ten samples ranged from 9.21 to 20.23 mg/100 g. The highest Mn concentration was recorded from Aba’are, followed by Wedi-Sbuh (18 mg/100 g), while the lowest was obtained from Tirbish, followed by Gumbil (10.46 mg/100 g). Among the landraces, the highest copper and chromium concentrations were recorded from Jamuye (5.25 mg/100 g) and Dagnew (1.5 mg/100 g), respectively. The lowest copper content (1.48 mg/100 g) was obtained from Gumbil. Chromium was below the detection limit in the sorghum landrace Kodem.

3.3. Variabilities for Total Flavonoid and Tannin Contents

Extensive variability with significant difference (p < 0.001) for total flavonoid content was observed among the evaluated sorghum landraces (Table 2). The data of total flavonoid and total tannin contents for all 21 landraces is illustrated in Supplementary Table S3. Total flavonoid content ranged from 0 to 665 with a median value of 142.5 mg CE/g. The highest Total flavonoid content was found in Lequa, followed by Tirbish (578.50 mg CE/g), Zerzaro (526.25 mg CE/g), and Zengada (467.50 mg CE/g). Landraces Jamuye and Kodem scored the lowest Total flavonoid content with a value of 5.25 and 9.5 mg CE/g, respectively (Figure 2). Out of the 21 evaluated sorghum landraces, flavonoid was below the detection limit in four landraces, including Amarica, Tinkish, Gumbil, and Arfa’agdm.
Significant variation (p < 0.001) for total tannin content was observed among the landraces (Table 2). The maximum (7.5 mg CE/100 g) and minimum (0.18 mg CE/100 g) total tannin content were found from landraces Lequa and Korkora, respectively, with a median value of 1.01 mg CE/100 g. Next to Lequa, the landraces Zerzaro, Zengada, and Tewzale had the highest total tannin content (with approximately 7.3 mg CE/100 g) (Figure 3). All the landraces with the highest total tannin and flavonoid contents are from the central zone of Tigray. Respectively, landraces Kodem, Gano, and Aba’are scored the lowest total tannin content next to Korkora, with a value of 0.32, 0.36, and 0.46 mg CE/100 g.

3.4. Variabilities for Antioxidant Activities

The antioxidant activities among the landraces showed a significant difference (p < 0.001) (Table 2). The data for antioxidants of all the 21 landraces is shown in Supplementary Table S3. DPPH radical scavenging for the sorghum sample extracts was evaluated at different concentrations ranging from 50 to 1000 µg/mL. At higher concentrations (1000 µg/mL), the DPPH radical scavenging ranged from 54.63% to 99.29%, whereas at lower concentrations (50 µg/mL), it was in the range of 25.59 to 93.45%. Widespread ranges of variability in EC50 (i.e., the sample extract concentration in µg/mL required to scavenge DPPH free radical by 50%) among the evaluated sorghum landraces were observed (Figure 4). The EC50 values were ranged between 29.09 and 818.37 µg/mL. The sorghum landrace Tirbish had a lower EC50 value (29.09 µg/mL) than the control (Ascorbic acid), with an EC50 value of 31.51 µg/mL. Among other sorghum landraces, Zerzaro (33.38 µg/mL), Lequa (33.52 µg/mL), and Dagnew (33.6 µg/mL) scored lower EC50 values, whereas higher EC50 values were obtained from the landraces Tinkish (818.37 µg/mL), Amarica (687.6 µg/mL), and Jamuye (484.38 µg/mL). The landraces with higher phenolics (flavonoid and tannin) were also found to have higher DPPH scavenging activities.
There was a high variation in the ferric-reducing antioxidant power (FRAP) of the sorghum samples that ranged between 17.85 and 334.81 mg AAE/g. The strongest ferric-reducing antioxidant power was obtained from sorghum landrace Lequa (334.81 mg AAE/g), followed by Tirbish (333.75 mg AAE/g), Zerzaro (318.39 mg AAE/g), and Zengada (225.5 mg AAE/g). Respectively, sorghum landraces that had the weakest ferric reducing antioxidant power were Tinkish (17.85 mg AAE/g), Amarica (18 mg AAE/g), Kodem (23 mg AAE/g), and Arfa’agdm (27.59 mg AAE/g).
The strongest and weakest total antioxidant capacity, as assayed using phosphomolybdenum, were also found in sorghum landraces Zengada (63.89 mg BHTE/g) and Tinkish (1.71 mg BHTE/g), respectively. Next to Zengada, the top three sorghum landraces with the highest total antioxidant activity were Tirbish (62.18 mg BHTE/g), Zerzaro (61.28 mg BHTE/g), and Lequa (60.43 mg BHTE/g), whereas the sorghum landraces Amarica (6.01 mg BHTE/g), Wedi-Aker (6.55 mg BHTE/g), and Korkora (7.61 mg BHTE/g) were among the landraces that had weakest total antioxidant activity.

3.5. Relationships of Seed Color with Phenolics and Antioxidant Activities

The diversity of seed colors of the sorghum landraces used in this study (Figure 5) resulted in excessive variability in the contents of the studied nutritional traits, particularly phenolics and antioxidants. Those with red and brown seed colors had the highest flavonoid, tannin, and antioxidant capacity as compared to yellow and white seeded sorghum landraces. Those sorghum landraces with the highest phenolic compounds (flavonoid and tannin contents) recorded the highest antioxidant capacity.

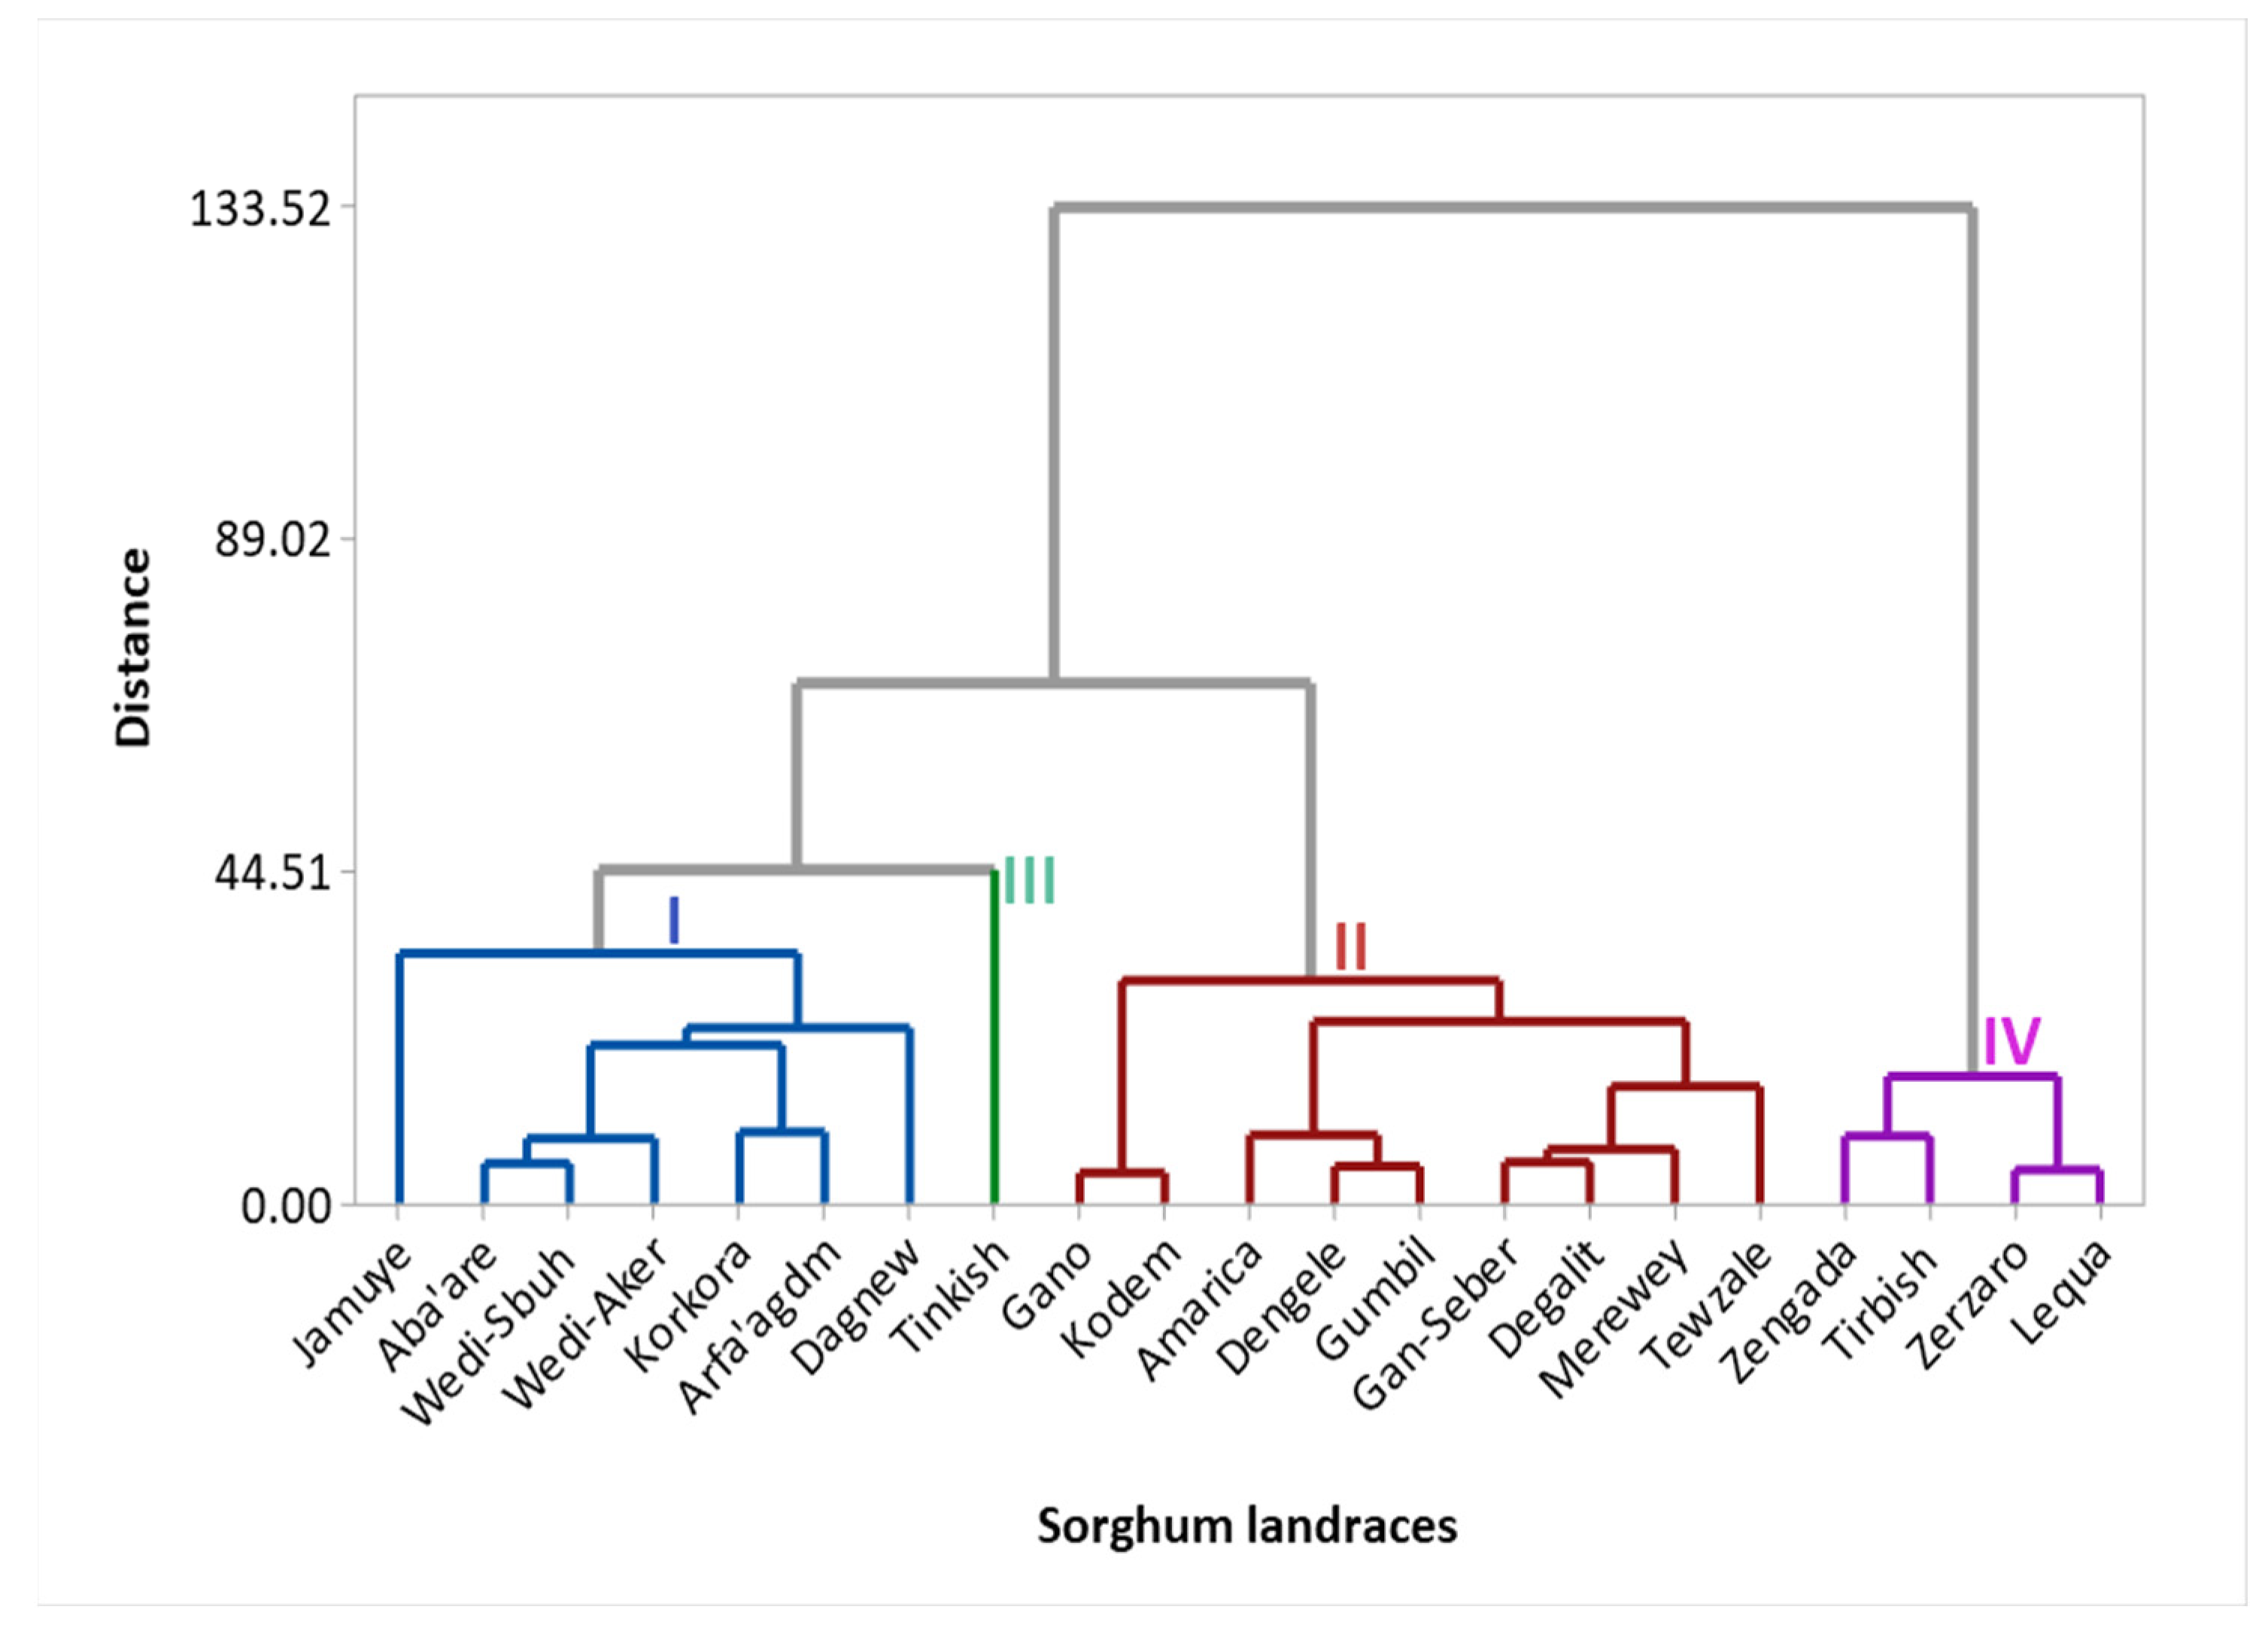
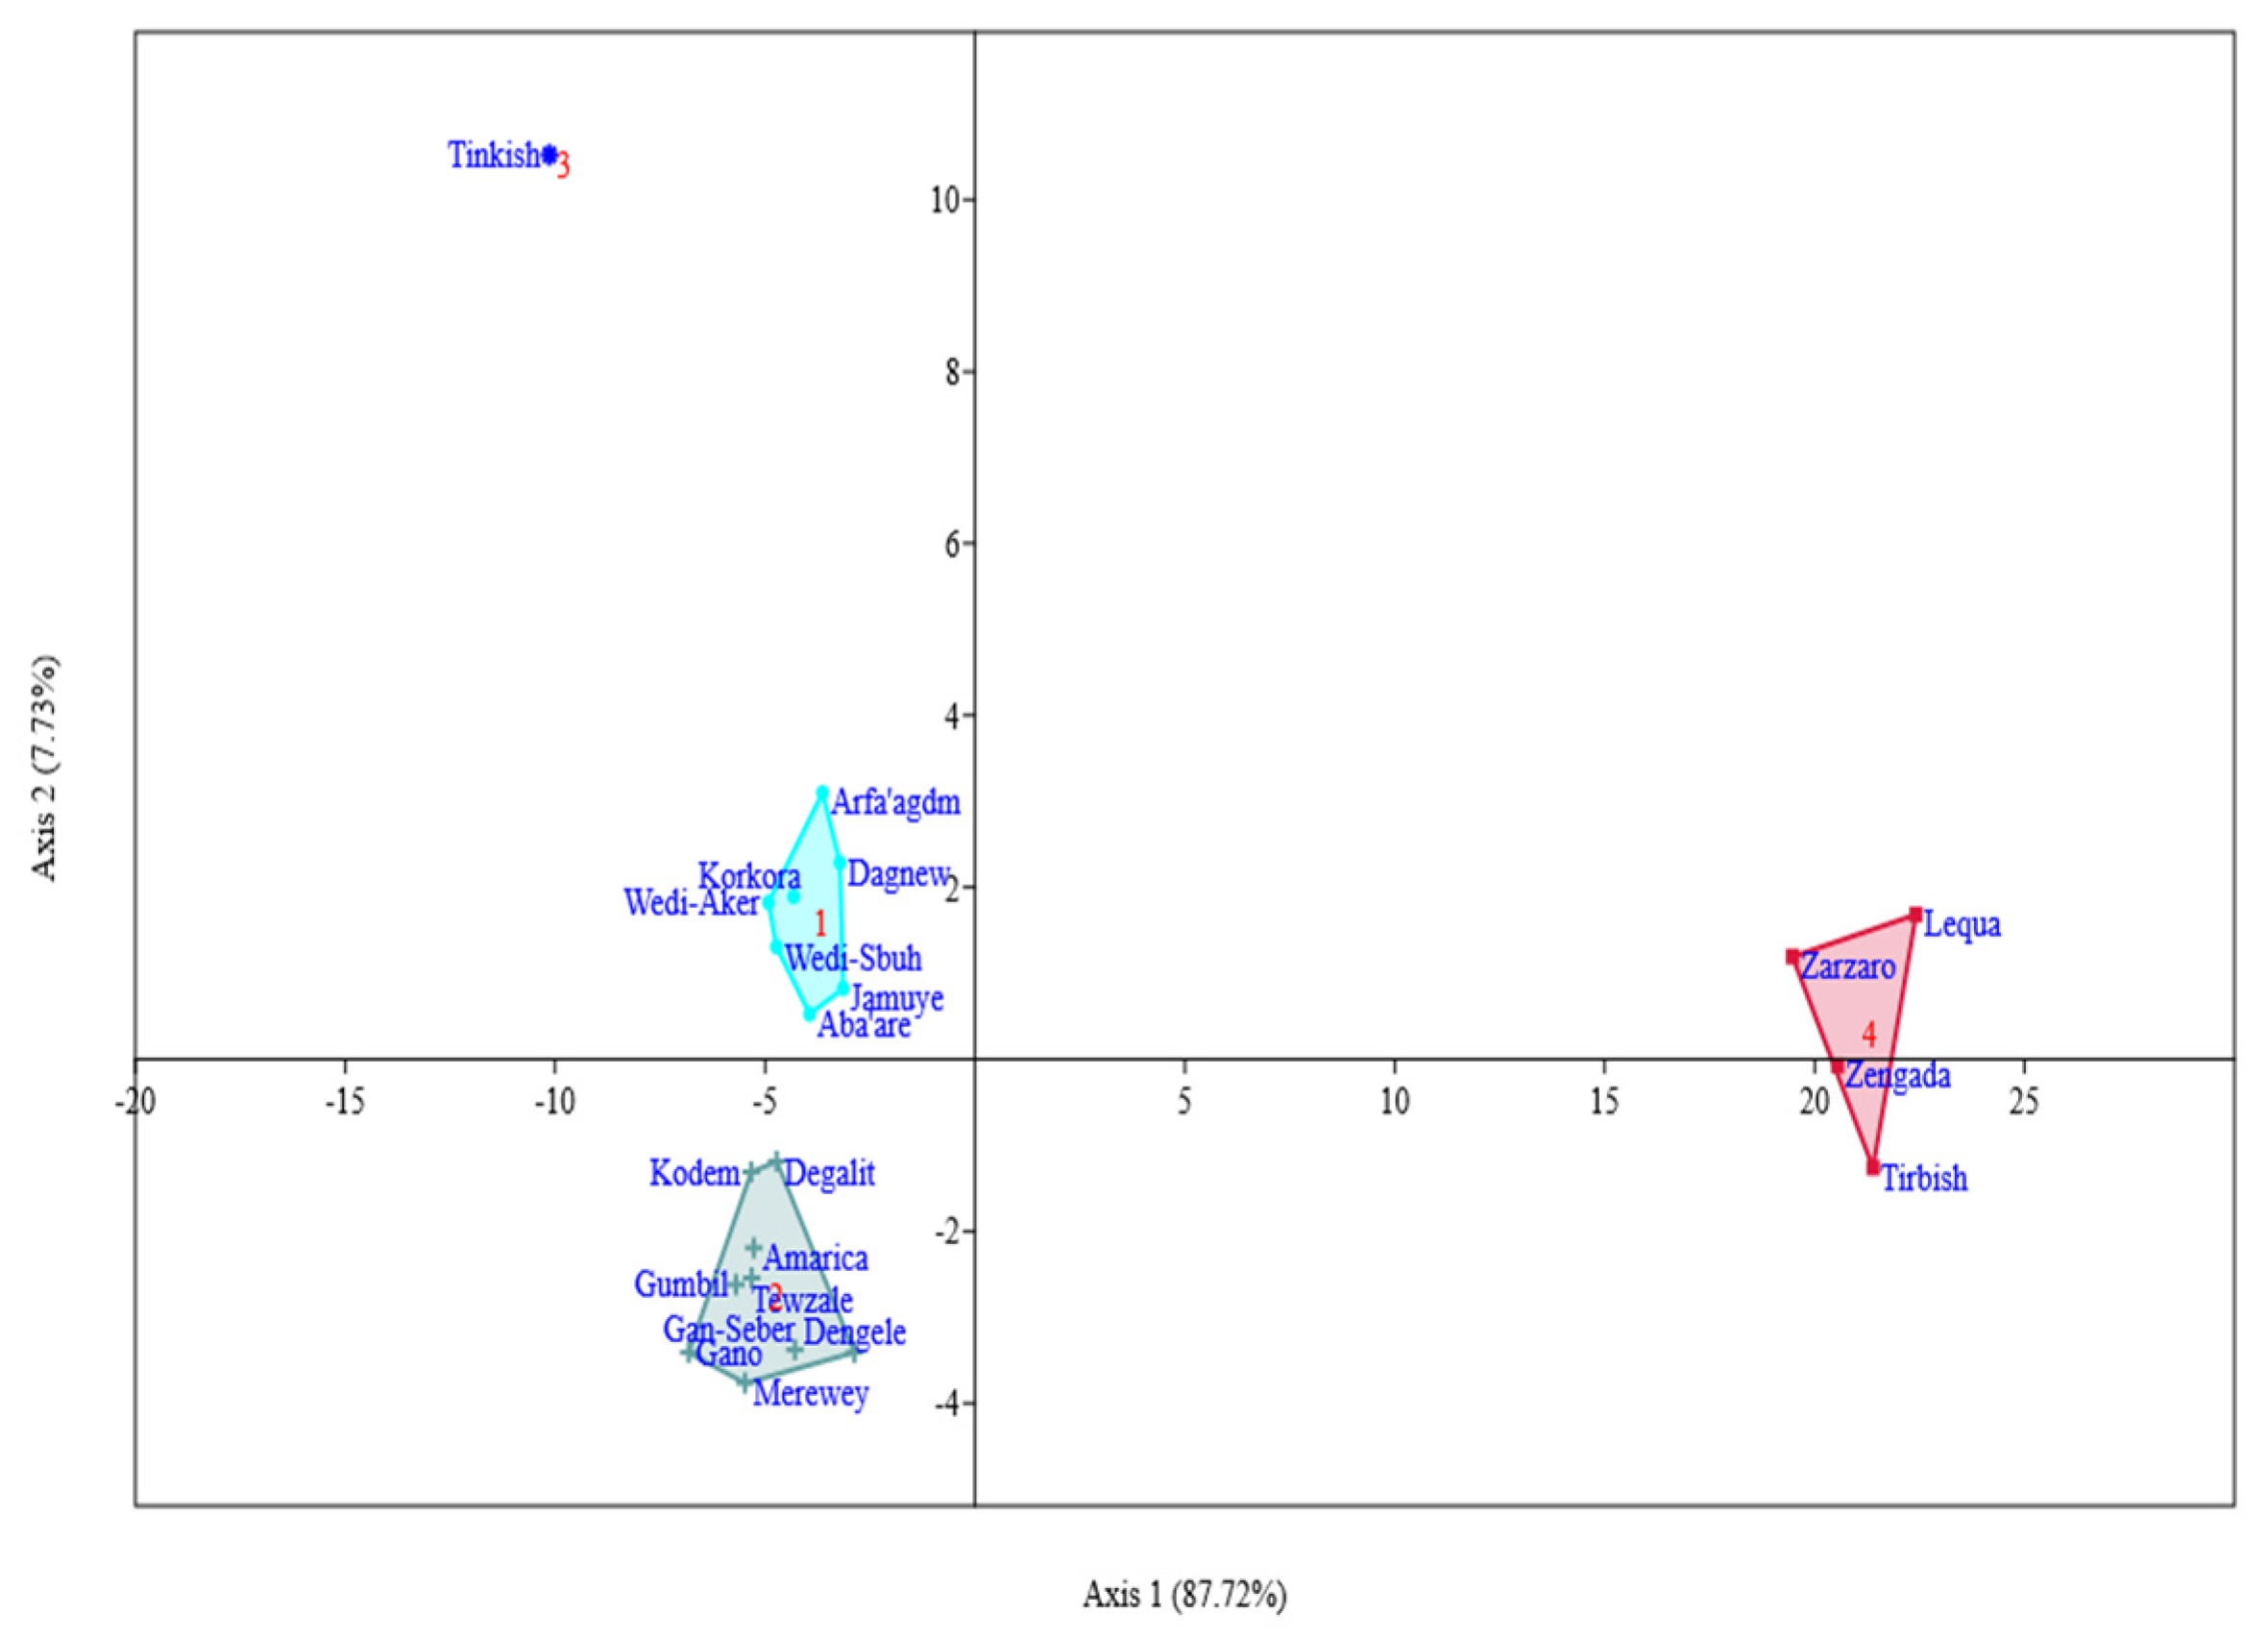
3.6. Grouping and Ordination of Genotypes

3.6.1. Cluster Analysis

The result showed that the twenty-one sorghum landraces were clustered into four groups (Figure 6). Respectively, clusters I, II, III, and IV consist of 7, 9, 1, and 4 landraces. Genotypes gathered under cluster I are characterized by their higher mineral elements, high starch, and lower flavonoid, tannin, and antioxidant activities. Those in cluster II have the highest starch, lower proteins, lower mineral concentrations, high tannin, and high antioxidant potential. Interestingly, the landrace Tinkish (a sweet sorghum type) was uniquely grouped alone in cluster III. The highest protein and lowest starch, the presence of very low phenolic compounds, and the weakest antioxidant capacity may be the reasons that made Tinkish stand alone from the rest of the group. Further, it is the only sweet sorghum included in the determination of mineral concentrations, flavonoids, and tannins, as well as antioxidant activities. Members in cluster IV are characterized by the highest phenolic compounds (flavonoid and tannin) and antioxidant potentials. Further, all the landraces gathered under cluster IV have red/brown seed color. High variability for the cluster means of all traits was observed (Table 3). Discriminant analysis was performed to further confirm the genotype grouping analyzed using cluster analysis (Figure 7). The first axis accounts for 87.72% of the total variability, while the second axis accounts for 7.73%. According to the squared distance between clusters (Mahalanobis distance, D2), cluster IV was the most divergent than others (Table 4). Clusters IV and III had the highest distance, followed by clusters IV and II and clusters IV and I.

3.6.2. Principal Component Analysis

Among the total of 12 principal components (PCs), the first four principal components (PCs) contributed much of the variability with eigenvalues greater than unity and cumulatively accounted for 78.48% of the total variation among the landraces. Thus, these four PCs were considered important for this study, but the first two component scores were plotted to aid visualization of the overall variability among the populations (Figure 8). Respectively, the four PCs explained 35.54, 20.16, 13.08, and 9.71% of the total variability (Table 5). The result of PCA revealed that the nutritional traits showed different patterns of contribution to the variability among the landraces. In PC 1, the variables ferric reducing antioxidant power, total antioxidant capacity, flavonoid, and tannin, respectively, had significant contributions with positive loading, whereas protein and DPPH had high contributions in the negative direction. The mineral elements Cu, Fe, Zn, and Mn greatly contributed to the variability in PC 2. The nutritional traits starch and Zn had a significant influence on PC3 in the positive direction, while DPPH is in the negative direction. The traits Cr (positive loading) and Mn (negative loading) contributed more to the fourth component.

4. Discussion

4.1. Proximate Analysis

The high variability in protein content among the landraces of the current study may be due to the genetics of the landraces and environmental effects. The highest protein content found in the current study (18%) is higher than previous studies conducted on Ethiopian sorghum, in which they found a maximum of 15.26% [15] and 16.48% [37]. Variability in grain protein in Ethiopian sorghum that varied from 77 to 114 g/kg was also reported [19]. According to [38], the protein content in whole sorghum grain is in the range of 7 to 15%, a relatively narrower range than the current work. Grain protein content analysis of South African sorghum was also reported from 7.69 to 16.30% [17,19].
Farmers in the study area purposely sow Tinkish (sweet sorghum) in the middle of other sorghum types to hide them from herdsmen. This is because their stem is very sweet, and the herdsmen, mainly children, like to chew them before they reach the maturity stage. In Ethiopia, unique sweet sorghums that, in terms of nutrition and tastiness, extremely exceed other sorghum types are available. The local farmers called these landraces in Amharic ‘Wetet Begunche’ (to mean “milk in my mouth”) and Marchuke (meaning “honey squirts out of it”). It was reported that of the 9000 varieties tested, these two were unique and contained 30% more protein, but more importantly, their protein is about twice the normal level of lysine, an amino acid critical to nutritional quality [39]. A high lysine mutant with the hl gene has been identified from the Ethiopian line [40], where lysine content was enhanced by about 40–60%. Thus, the higher protein content of Tinkish landraces in this study may be due to the high lysine content of the sweet sorghum.
The great variability in starch also reflects the presence of genetic differences among the sorghum landraces and environmental effects. Such a wide variability is in line with previous studies [20,21,22]. The current result in starch content is much higher than the sorghum samples of western Ethiopia [15], indicating that the sorghum genetic resources of Tigray are important to consider in the sorghum starch improvement program. The discrepancy in protein and starch content within the locally similar named landraces shows the impact of the environment on the nutritional status of the landraces. It is reported that the accumulation of quantitatively inherited traits, such as starch, in grains is affected by the environment [41]. The higher protein and starch content of some wild relatives than the cultivated landraces indicate the significance of including the wild gene pool in sorghum nutritional enrichment and improvement program as they might have valuable alleles for the nutritional trait. High variability for protein content (10.2–14.6%) among ten Sudanese wild genotypes of sorghum was also reported [42].
In Tigray and other parts of the country, sorghum is widely used for human consumption as enjera (mainly in the rural areas where about 85% of the population lives), and it is considered one of the cheap sources of protein [37]. The sorghum landraces identified to have the highest protein content could be targeted for complementary food product development to enrich the nutritional profile of food products. In addition, these landraces could be considered by plant breeders as potential starting parent materials for grain quality improvements of sorghum.
The wide variability in mineral elements among the currently studied sorghum landraces could be due to the genetic differences among the landraces, the environment, the variability in the concentration of minerals in the soil, and the differences in the ability of the landraces to absorb the nutrients from the soil. This agreed with [15], who reported the concentrations of iron, zinc, and manganese ranging from 41.17 to 127.50, 13.5 to 34.67, and 9.5 to 23.83 mg kg−1, respectively. Significant variations in Fe (12.10–83.40 mg kg−1) and Zn (6.30–51.40 mg kg−1) were also detected among cultivars, breeding lines, and selected sorghum accessions [43]. Respectively, iron, zinc, and copper content for sorghum flour was reported to be 2.24 mg/100 g, 0.75 mg/100 g, and 0.61 mg/100 g [44].
Sorghum exceeds other major cereals such as wheat, rice, and maize and compares well with pulses in terms of grain Fe and Zn [45]. Biofortification, improving the density and availability of micronutrients, is considered one of the most suitable solutions for severe malnutrition problems, mainly in developing countries [46]. Thus, the high concentration of the mineral elements in the studied sorghum landraces might offer a probable source for biofortification. Landraces such as Jamuye and Dagnew, with extremely high Fe and Zn, shall be taken into consideration for those people suffering from these micronutrient deficiencies. Generally, those landraces with enhanced mineral elements may be directly consumed as whole grains to satisfy the daily micronutrient intake or used indirectly as candidate materials for breeding to generate new and nutritionally rich varieties.

4.2. Phenolic Compounds and Antioxidant Activities

The absence of flavonoids in some of the landraces suggests that these samples have insignificant antioxidant potential because the higher flavonoid corresponds to the higher antioxidant activity [24]. Previous studies showed that Total flavonoid content was in the range of 0–8138.22 μg CE g−1 dm−1 in sorghum landraces and breeding lines [47], 0–22,606 μg CE g−1 dm−1 in sorghum panels [48] and 15.33–42.84 mg RE/100 g in five genotypes of sorghum [49]. Genetic variability among the landraces for Total flavonoid content was very clear (Figure 2). In addition to the genotypic difference, the variation in flavonoids among the landraces may also be due to the differences in the sites of collection of the samples (i.e., environmental differences). Like the present result, a significant variation of flavonoid concentration in sorghum grains was observed due to the variation in genotype and environment [50].
In agreement with the total tannin content of this current study, Ref. [37] found lower tannin content for the landrace Abuare, which is the same as the landrace Aba’are of our sample despite their spelling. Sorghum tannins have the ability to bind to minerals, mainly iron and zinc, and reduce their bioavailability, thereby negatively impacting the nutritional profile of sorghum [51]. In line with this, we found that most of the landraces with high total tannin content had shown low mineral content. In addition, tannins can bind to proteins and significantly restrict their digestibility [52,53]. However, it was also stated that the reduction in protein digestibility in sorghum may not be entirely due to tannins [24,27]. In support of this, sorghums with equal levels of tannins had different digestibility, signifying that tannins are only partially responsible for low protein digestibility [54]. On the other hand, tannins help in increasing plant resistance to predators such as birds; for example, black sorghum cannot be easily attacked by birds due to the existence of tannins in this type of sorghum [26].
Since high tannins have the properties of undesirable texture, flavor, and taste, the sensory of food products made from food crops having high tannin may not be easily accepted by end users [37]. Thus, the sorghum landraces with low tannin, such as the landraces of Korkora, Kodem, Gano, and Aba’are, are preferable for food product making for acceptable sensory attributes and nutritional value, whereas the sorghum landraces with high tannin such as of Lequa are not preferable for enjera rather for local beverage (Swa), which is widely used in the study area.
The increase in the concentration of extracts led to an increase in the percentage of DPPH radical scavenging activity. Similarly, this was supported in related studies [35,55,56]. The lower EC50 value indicates the higher DPPH radical scavenging potential and vice versa [57,58]. It was reported that sorghum had shown higher DPPH scavenging capacity as compared to rye [58]. This shows that sorghum contains DPPH free radical scavenging capacity that could have a beneficial action against abnormalities caused by the generation of free radicals. The presence of antioxidants in plant extracts causes a reduction in the ferric ion (Fe3+) to ferrous (Fe2+) and molybdenum (VI) to molybdenum (V). Thus, higher reducing values, as shown in sorghum landraces of Lequa, Tirbish, Zengada, and Zerzaro, imply that they have higher antioxidant capacity because the value is based on the reduction in ions in the presence of antioxidants [59]. The widespread variability in total antioxidant capacity in the present result was also supported in previous studies in sorghum genotypes [14,27,48,60]. According to [25], sorghum had revealed the highest total antioxidant capacity as compared to wheat, oat, barley, and maize. Hence, sorghum is one of the richest cereals in antioxidant capacity, and it could be used as a natural antioxidant against free radicals or other physiological or pathological abnormalities.

4.3. Relationship of Seed Color with Phenolic Compounds and Antioxidant Activities

Seed color is one of the important morphologic characteristics used by local farmers to identify their varieties. Sorghum landraces with diverse color traits are appropriate depending on the test and preferences of the farming community for different end uses such as for enjera, Swa, and popping (Figure 9). In line with our result, a higher level of antioxidants in red-seeded than white-seeded sorghum was reported [49,61]. Further, Ref. [47] identified a low level of antioxidant compounds in yellow or white-seeded sorghum genotypes. The highest antioxidant for the landraces with the highest phenolic compounds confirms that the phenolic compounds, which are found in the pericarp layer of black and red-seeded varieties of sorghum grain, contributed to the antioxidant activities [24]. The strong association between pericarp color and antioxidant activity was reported in previous studies [48,61]. Hence, sorghum grains with red and brown seed color may possess an extensive range of prevention against cellular damage due to free radicals.
In the study region (Tigray), sorghum is mainly utilized for human consumption as enjera, in which yellow and white seeded sorghum are ideal, whereas sorghum with red seed color is used for making ‘Swa’ [62]. Farmers in the same study area also cultivate finger millets of different seed colors for different end-use purposes in that black-seeded are used to prepare local drinks, while white-seeded are utilized for making enjera [63]. According to [28], red-seeded sorghum is preferred for brewing traditional beer. In most African countries, white or light white sorghums are more generally preferred for porridge making [64]. Furthermore, in some parts of Africa where the bird quelea problem is severe, the high tannin brown seeded sorghum varieties, which are least preferred by birds, are grown for food and drinks [65]. The presence of a connection between kernel color and human consumption in Ethiopian barley was also stated [66]. Such end-use attributes associated with different colored sorghum variants could have conservation and utilization as well as market implications.

4.4. Genotypes Grouping

Cluster analysis helps to facilitate future identification and selection of the best parents for nutritional improvement in the sorghum landraces. The high range for the cluster means in this study suggests the extensive genetic diversity among the planting materials for the studied nutritional traits. The lower the inter-cluster distance (Mahalanobis distance), the lower the chance to produce important recombinants [63], which shows the similarity in the nutritional make-up of the landraces. On the other hand, the higher distance between the clusters tells that there is a wide variability between the landraces in the different clusters, which is important to conduct crossing to get better nutritional traits of interest. In other words, extremely divergent genotypes would yield a broad range of variability in the following generation [67]. Thus, desirable recombinants could be found by crossing parents selected from clusters IV and III and clusters IV and II.
Principal component analysis (PCA) was performed to reduce the number of variables into a few correlated components that can explain much of the variability and to estimate the relative importance and contribution of each nutritional trait to the total variance. The sign of the loading indicates the direction of the relationship between the components and the variable [68]. The biplot of PCA clearly shows the associations and differences among the landraces and targeted traits. The distinctiveness of characters that appear less than 90° angle are positively correlated, while those that formed more than 90° angles are associated with negative correlation, and those that have a 90° angle do not show correlation [69]. The landraces remained scattered across the four quadrants, showing large genetic variability in their nutritional make-up that could be used in the sorghum improvement program. The landraces relatively close to each other have similar nutritional properties, whereas those that are positioned far from each other are different. The landraces, which are far from the origin, are separated from the rest of the group due to some specific distinctiveness in their nutritional characteristics. Thus, the selection of these landraces as potential parent materials would result in successful crossing to develop specific sorghum varieties with enhanced nutritional attributes. Landraces on the opposite side of the trait vector arrows indicate a small value for that trait, while those landraces in the direction of vector arrows display high values for the trait. The length of the vector is proportional to the magnitude of the trait in grouping the landraces. For example, the longer vector, as shown in the traits of flavonoid, tannin, and antioxidant capacities, highly contributed to grouping the landraces Lequa, Zerzaro, Zengada, and Tirbish.

5. Conclusions

Extensive variability in the studied nutritional and antinutritional traits exists, and thus, there is the prospect for enrichment of the nutritional attributes in sorghum to combat malnutrition. The landraces Arfa’agdm, Tsaeda Jargte, Keyih Afincho, Kodem, and Taeda Kubi were superior in protein and starch contents that should be considered as sources of energy, whereas the landraces Jamuye, Dagnew, Aba’are, and Wedi-Sbuh had higher mineral concentrations. The sorghum landraces, mainly Lequa, Zerzaro, Zengada, Tewzale, and Tirbish, were superior in phenolics and antioxidants that could be used as potential natural antioxidants.
The landraces with superior nutritional profiles can serve as potential resources for future grain quality improvements of sorghum and for new food product development like biscuits, snacks, and syrup. However, for the delivery of high grain minerals, protein, starch, and phenolic compounds, it is also critical to consider those landraces that satisfy farmers’ preferred traits, including maturity and grain yield. The rich genetic diversity in the nutritional and antinutritional attributes may provide some novel genes for enhanced grain quality of sorghum, and such a great diversity has implications for the conservation and utilization of sorghum genetic resources. Finally, the present result will help as a benchmark in designing bio-fortification and/or breeding for quality traits of sorghum, thereby sensitizing nutrition in sorghum production and consumption in the region.

Supplementary Materials

The following supporting information can be downloaded at: https://www.mdpi.com/article/10.3390/agriculture13091753/s1, Table S1: List of the landraces with all other collection information (local name, zone of collection, GPS, altitude, temperature, and precipitation); Table S2: Data on protein, starch and moisture for all 358 landraces; Table S3: Data for all minerals, flavonoid, tannin, and antioxidants of all 21 landraces.

Author Contributions

T.S., Y.T., L.T., O.T.W. and S.F.: Conceptualization, methodology, validation, resources, visualization, project administration, funding acquisition, writing—review and editing; T.S., Y.T. and L.T.: investigation; T.S.: data curation, writing—original draft preparation; T.S. and Y.T: software, formal analysis; Y.T., O.T.W. and S.F.: supervision. All authors have read and agreed to the published version of the manuscript.

Funding

This research was financially supported by the Norwegian Embassy in Addis Ababa through the institutional collaboration between Mekelle University and the Norwegian University of Life Sciences (NMBU) (grant number MU-MB/MU/CoDANR/0992/2016). APC was funded by an internal NMBU seed funding (Grant number 1850092006).

Institutional Review Board Statement

Not applicable.

Data Availability Statement

All data generated or analyzed in this study are included in this published article and its Supplementary Materials.

Acknowledgments

The authors would like to acknowledge the Norwegian Embassy in Addis Ababa, Mekelle university, and Norwegian University of Life Sciences (NMBU). We also thank Engida Desalegn, Metsae Bibici, and Teklehaymanot Fisseha for their technical support.

Conflicts of Interest

The authors declare no conflict of interest.

References

  1. Singh, R.; Govindan, V. Zinc-Biofortified Wheat: Harnessing Genetic Diversity for improved Nutritional Quality. In Science Brief: Biofortification; No. 1. CIMMYT; HarvestPlus, and the Global Crop Trust: Bonn, Germany, 2017. [Google Scholar]
  2. Development Initiatives. Global Nutrition Report 2017: Nourishing the SDGs; Development Initiatives: Bristol, UK, 2017. [Google Scholar]
  3. Maberly, G.F.; Trowbridge, F.L.; Yip, R.; Sullivan, K.M.; West, C.E. Programs against micronutrient malnutrition: Ending hidden hunger. Annu. Rev. Public Health 1994, 15, 277–301. [Google Scholar] [CrossRef] [PubMed]
  4. Mayer, J.E.; Pfeiffer, W.H.; Beyer, P. Biofortified crops to alleviate micronutrient malnutrition. Curr. Opin. Plant Biol. 2008, 11, 166–170. [Google Scholar] [CrossRef]
  5. Teshome, A.; Baum, B.R.; Fahrig, L.; Torrance, J.K.; Arnason, T.J.; Lambert, J.D. Sorghum (Sorghum bicolor (L.) Moench) landrace variation and classification in North Shewa and South Welo, Ethiopia. Euphytica 1997, 97, 255–263. [Google Scholar] [CrossRef]
  6. Villa, T.C.C.; Maxted, N.; Scholten, M.; Ford-Lloyd, B. Defining and identifying crop landraces. Plant Genet. Resour. 2005, 3, 373–384. [Google Scholar] [CrossRef]
  7. Seboka, B.; van Hintum, T. The dynamics of on-farm management of sorghum in Ethiopia: Implication for the conservation and improvement of plant genetic resources. Genet. Resour. Crop Evol. 2006, 53, 1385–1403. [Google Scholar] [CrossRef]
  8. Newton, A.C.; Akar, T.; Baresel, J.P.; Bebeli, P.J.; Bettencourt, E.; Bladenopoulos, K.V.; Czembor, J.H.; Fasoula, D.A.; Katsiotis, A.; Koutis, K.; et al. Cereal landraces for sustainable agriculture. Sustain. Agric. 2011, 2, 147–186. [Google Scholar]
  9. Central Statistical Agency (CSA). Agricultural Sample Survey 2015/2016 Volume 1, a Report on Area and Production of Major Crops; Statistical Bulletin: Addis Ababa, Ethiopia, 2016. [Google Scholar]
  10. Teshome, A.; Patterson, D.; Asfew, Z.; Torrance, J.K.; Arnason, J.T. Changes of Sorghum bicolor landrace diversity and farmers’ selection criteria over space and time, Ethiopia. Genet. Resour. Crop Evol. 2007, 54, 1219–1233. [Google Scholar] [CrossRef]
  11. Tsehaye, Y.; Abera, Z.; Kebede, A.; Ghebremichael, B. A dynamic sorghum (Sorghum bicolor (L.) Moench) diversity management in situ and livelihood resilience in South and Central Tigray Region, Ethiopia. Momona Ethiop. J. Sci. 2009, 1. [Google Scholar] [CrossRef]
  12. Duodu, K.G.; Taylor, J.R.N.; Belton, P.S.; Hamaker, B.R. Factors affecting sorghum protein digestibility. J. Cereal Sci. 2003, 38, 117–131. [Google Scholar] [CrossRef]
  13. Saleh, S.M.; Zhang, Q.; Chen, J.; Shen, Q. Millet grains: Nutritional quality, processing, and potential health benefits. Compr. Rev. Food Sci. Food Saf. 2013, 12, 281–295. [Google Scholar] [CrossRef]
  14. Rao, S.; Santhakumar, A.B.; Chinkwo, K.A.; Wu, G.; Johnson, S.K.; Blanchard, C.L. Characterization of phenolic compounds and antioxidant activity in sorghum grains. J. Cereal Sci. 2018, 84, 103–111. [Google Scholar] [CrossRef]
  15. Shegro, A.; Shargie, N.G.; van Biljon, A.; Labuschagne, M.T. Diversity in starch, protein and mineral composition of sorghum landrace accessions from Ethiopia. J. Crop Sci. Biotechnol. 2012, 15, 275–280. [Google Scholar] [CrossRef]
  16. Shegro, A.; Labuschagne, M.T.; Shargie, N.G.; van Biljon, A. Multivariate analysis of nutriotonal diversity in sorghum accesions from wetsern Ethiopia. J. Biol. Sci. 2013, 13, 67–74. [Google Scholar] [CrossRef]
  17. Mofokeng, M.A. Diversity Analysis of South African Sorghum Genotypes Using Agronomic Traits, SSR Markers and Protein Content and Amino Acid Composition. Ph.D. Thesis, University of KwaZulu-Natal, Pietermaritzburg, South Africa, 2015. [Google Scholar]
  18. de Morais Cardoso, L.; Pinheiro, S.S.; Martino, H.S.D.; Pinheiro-Sant’Ana, H.M. Sorghum (Sorghum bicolor L.): Nutrients, bioactive compounds, and potential impact on human health. Crit. Rev. Food Sci. Nutr. 2017, 57, 372–390. [Google Scholar] [CrossRef]
  19. Nguni, D.; Geleta, M.; Hofvander, P.; Fatih, M.; Bryngelsson, T. Comparative genetic diversity and nutritional quality variation among some important southern African sorghum accessions [Sorghum bicolor (L.) Moench]. Aust. J. Crop Sci. 2012, 6, 56–64. [Google Scholar]
  20. Shewayrga, H.; Sopade, P.A.; Jordan, D.R.; Godwin, I.D. Characterisation of grain quality in diverse sorghum germplasm using a Rapid Visco-Analyzer and near infrared reflectance spectroscopy. J. Sci. Food Agric. 2012, 92, 1402–1410. [Google Scholar] [CrossRef]
  21. Jambunathan, R.; Subramanian, V. Grain quality and utilization of sorghum and pearl millet. Biotechnol. Trop. Crop Improv. 1988, 133–139. [Google Scholar]
  22. Njuguna, V.W.; Cheruiyot, E.K.; Mwonga, S.; Rono, J.K. Effect of genotype and environment on grain quality of sorghum (Sorghum bicolor L. Moench) lines evaluated in Kenya. Afr. J. Biotechnol. 2018, 12, 324–330. [Google Scholar]
  23. Pietta, P.G. Flavonoids as antioxidants. J. Nat. Prod. 2000, 63, 1035–1042. [Google Scholar] [CrossRef]
  24. Dykes, L.; Rooney, L.W. Sorghum and millet phenols and antioxidants. J. Cereal Sci. 2006, 44, 236–251. [Google Scholar] [CrossRef]
  25. Dykes, L.; Rooney, L. Phenolic compounds in cereal grains and their health benefits. Cereal Foods World 2007, 52, 105–111. [Google Scholar] [CrossRef]
  26. Dykes, L.; Rooney, W.L.; Rooney, L.W. Evaluation of phenolics and antioxidant activity of black sorghum hybrids. J. Cereal Sci. 2013, 58, 278–283. [Google Scholar] [CrossRef]
  27. Dykes, L.; Rooney, L.W.; Waniska, R.D.; Rooney, W.L. Phenolic compounds and antioxidant activity of sorghum grains of varying genotypes. J. Agric. Food Chem. 2005, 53, 6813–6818. [Google Scholar] [CrossRef]
  28. Awika, J.M.; Rooney, L.W. Sorghum phytochemicals and their potential impact on human health. Phytochemistry 2004, 65, 1199–1221. [Google Scholar] [CrossRef] [PubMed]
  29. Available online: https://www.perkinelmer.com/product/da-7250-at-line-nir-instrument-perdab (accessed on 12 February 2022).
  30. Brauteseth, E.M. The Mutagenesis of Sorghum bicolour (L.) Moench towards Improved Nutrition and Agronomic Performance. Doctoral Dissertation, University of KwaZulu-Natal, Pietermaritzburg, South Africa, 2009. [Google Scholar]
  31. Melash, A.A.; Mengistu, D.K. Improving grain micronutrient content of durum wheat (Triticum turgidum var. durum) through agronomic biofortification to alleviate the hidden hunger. Adv. Agric. 2020, 2020, 1–6. [Google Scholar] [CrossRef]
  32. Quettier-Deleu, C.; Gressier, B.; Vasseur, J.; Dine, T.; Brunet, C.; Luyckx, M.; Cazin, M.; Cazin, J.C.; Bailleul, F.; Trotin, F. Phenolic compounds and antioxidant activities of buckwheat (Fagopyrum esculentum Moench) hulls and flour. J. Ethnopharmacol. 2000, 72, 35–42. [Google Scholar] [CrossRef]
  33. Chew, K.K.; Khoo, M.Z.; Ng, S.Y.; Thoo, Y.Y.; Aida, W.W.; Ho, C.W. Effect of ethanol concentration, extraction time and extraction temperature on the recovery of phenolic compounds and antioxidant capacity of Orthosiphon stamineus extracts. Int. Food Res. J. 2011, 18, 1427. [Google Scholar]
  34. Katerere, D.R.; Eloff, J. Antibacterial and antioxidant activity of Sutherlandia frutescens (Fabaceae), a reputed anti-HIV/AIDS. Phytomedicine Phytother. Res. 2005, 19, 779–781. [Google Scholar] [CrossRef]
  35. Engida, D. In Vitro Antioxidant and α-Amylase Inhibition Activities of Spiced Red Chili Paste (Datta) from South Ethiopia. Ethiop. Pharm. J. 2015, 31, 93–106. [Google Scholar] [CrossRef]
  36. Prieto, P.; Pineda, M.; Aguilar, M. Spectrophotometric quantitation of antioxidant capacity through the formation of a phosphomolybdenum complex: Specific application to the determination of vitamin E. Anal. Biochem. 1999, 269, 337–341. [Google Scholar] [CrossRef]
  37. Tasie, M.M.; Gebreyes, B.G. Characterization of nutritional, antinutritional, and mineral contents of thirty-five sorghum varieties grown in Ethiopia. Int. J. Food Sci. 2020, 8243617. [Google Scholar] [CrossRef]
  38. FAO. Sorghum and Pearl Millets in Human Nutrition; Food and Agriculture Organization of the United Nations (FAO) Press: Rome, Italy, 1995. [Google Scholar]
  39. BSTID-NRC (Board on Science and Technology for International Development-National Research Council). Lost Crops of Africa; Academic Press: Washington, DC, USA, 1996; pp. 127–213. [Google Scholar]
  40. Singh, R.; Axtell, J.D. High lysine mutant gene (hl) that improves protein quality and biochemical value of grain sorghum. Crop Sci. 1973, 13, 535–539. [Google Scholar] [CrossRef]
  41. Bing, Y.I.; Zhou, Y.F.; Gao, M.Y.; Zhang, Z.; Yi, H.; Yang, G.D.; Wenjuan, X.; Huang, R.D. Effect of drought stress during flowering stage on starch accumulation and starch synthesis enzymes in sorghum grains. J. Integr. Agric. 2014, 13, 2399–2406. [Google Scholar]
  42. Abdelhalim, T.S.; Kamal, N.M.; Hassan, A.B. Nutritional potential of wild sorghum: Grain quality of Sudanese wild sorghum genotypes (Sorghum bicolor L. Moench). Food Sci. Nutr. 2019, 7, 1529–1539. [Google Scholar] [CrossRef]
  43. Hariprasanna, K.; Agte, V.; Elangovan, M.; Patil, J.V. Genetic variability for grain iron and zinc content in cultivars, breeding lines and selected germplasm accessions of sorghum [Sorghum bicolor (L.) Moench]. Indian J. Genet. 2014, 74, 42–49. [Google Scholar] [CrossRef]
  44. Mohammed, N.; Ahmed, I.; Babiker, E. Nutritional evaluation of sorghum flour (Sorghum bicolor L. Moench) during processing of injera. Int. J. BioLife Sci. 2010, 6, 35–39. [Google Scholar]
  45. Chan, S.S.; Ferguson, E.L.; Bailey, K.; Fahmida, U.; Harper, T.B.; Gibson, R.S. The concentration of iron, calcium, zinc and phytate in cereals and legumes habitually consumed by infants living in East Lombok, Indones. J. Food Compos. Anal. 2007, 20, 609–617. [Google Scholar] [CrossRef]
  46. Clemens, S. Zn and Fe biofortification: The right chemical environment for human bioavailability. Plant Sci. 2014, 225, 52–57. [Google Scholar] [CrossRef] [PubMed]
  47. Alfieri, M.; Balconi, C.; Cabassi, G.; Habyarimana, E.; Redaelli, R. Antioxidant activity in a set of sorghum landraces and breeding lines. Maydica 2017, 62, 1–7. [Google Scholar]
  48. Habriyanman Habyarimana, E.; Dall’Agata, M.; De Franceschi, P.; Baloch, F.S. Genome-wide association mapping of total antioxidant capacity, phenols, tannins, and flavonoids in a panel of Sorghum bicolor and S. bicolor × S. halepense populations using multi-locus models. PLoS ONE 2019, 14, e0225979. [Google Scholar] [CrossRef]
  49. Punia, H.; Tokas, J.; Malik, A.; Sangwan, S. Characterization of phenolic compounds and antioxidant activity in sorghum [Sorghum bicolor (L.) Moench] grains. Cereal Res. Commun. 2021, 2021, 343–353. [Google Scholar] [CrossRef]
  50. Taleon, V.; Dykes, L.; Rooney, W.; Rooney, L. Effect of genotype and environment on flavonoid concentration and profile of black sorghum grains. J. Cereal Sci. 2012, 56, 470–475. [Google Scholar] [CrossRef]
  51. Awika, J.M. Sorghum: Its Unique Nutritional and Health-Promoting Attributes. In Gluten-Free Ancient Grains: Cereals, Pseudocereals, and Legumes: Sustainable, Nutritious, and Health-Promoting Foods for the 21st Century; 2017. [Google Scholar]
  52. Kruger, J.; Taylor, J.R.; Du, X.; De Moura, F.F.; Lönnerdal, B.; Oelofse, A. Effect of phytate reduction of sorghum, through genetic modification, on iron and zinc availability as assessed by an in vitro dialysability bioaccessibility assay, Caco-2 cell uptake assay, and suckling rat pup absorption model. Food Chem. 2013, 141, 1019–1025. [Google Scholar] [CrossRef] [PubMed]
  53. Rathore, S.; Karunakar, S.; Vivek, K. Millet Grain Processing, Utilization and its Role in Helath promotion: A review. Int. J. Nutr. Food Sci. 2016, 5, 318–329. [Google Scholar] [CrossRef]
  54. Elkin, R.G.; Freed, M.B.; Hamaker, B.R.; Zhang, Y.; Parsons, C.M. Condensed tannins are only partially responsible for variations in nutrient digestibilities of sorghum grain cultivars. J. Agric. Food Chem. 1996, 44, 848–853. [Google Scholar] [CrossRef]
  55. Sharma, I.; Mathur, M.; Singh, G.P.; Rishi, A. Quantitative estimation of phenolic and flavonoid content ns antioxidant activity of various extracts of different parts of Plumbago zeylanica Linn. Int. J. Drug Dev. Res. 2014, 6, 136–140. [Google Scholar]
  56. Negash, A.; Derbew, B.; Amanuel, Z.; Mitiku, H.; Girmay, G.; Atkilt, G. Tree aga And Harvesting Season Affected Physico-chemical and Bioactive Compounds of Elite Type of Gunda Gundo Orange (Citrus spp.) in the Nortehrn Ethiopia. Int. J. Fruit Sci. 2021, 21, 26–39. [Google Scholar] [CrossRef]
  57. Ljiljana, S.; Mihajlo, S.; Vensa, N.; Ljubisa, N.; Dusica, R.; Jasna, C.B.; Vensa, T. Antioxidant Activity and Total Phenolic and Flavonoid Contents of Hieracium pilosella L. Extracts. Sensors 2009, 9, 5702–5714. [Google Scholar] [CrossRef]
  58. Soualem, Z.M.; ALsayadi, M.; Gaouar, N.; Benammar, C.h.; Beghdada, C.h.; Belarbi, M. Antioxidant activity and nutrient composition of Sorghum bicolor L. and Secale cereale L. in Algeria. Acad. J. Food Res. 2013, 1, 59–65. [Google Scholar]
  59. Rohman, A.; Riyanto, S.; Yuniarti, N.; Saputra, W.R.; Utami, R.; Mulatsih, W. Antioxidant activity, total phenolic, and total flavaonoid of extracts and fractions of red fruit (Pandanus conoideus Lam). Int. Food Res. J. 2010, 17, 97–106. [Google Scholar]
  60. Shen, S.; Huang, R.; Li, C.; Wu, W.; Chen, H.; Shi, J.; Chen, S.; Ye, X. Phenolic Compositions and Antioxidant Activities Differ Significantly among Sorghum Grains with Different Applications. Molecules 2018, 23, 1203. [Google Scholar] [CrossRef] [PubMed]
  61. Awika, J.M. Sorghum Phenols as Antioxidants. Master’s Thesis, Texas A&M University, College Station, TX, USA, 2000. [Google Scholar]
  62. Semere, T.; Fjellheim, S.; Tsehaye, Y.; Westengen, O.T. Inventory of sorghum landraces diversity on-farm and adaptability responses to changing climate: Implications for sorghum breeding and conservation. Genet. Resour. Crop Evol. 2023, 1–18. [Google Scholar] [CrossRef]
  63. Tsehaye, Y.; Berg, T.; Tsegaye, B.; Tanto, T. Farmers’ management of finger millet (Eleusine coracana L.) diversity in Tigray, Ethiopia and implications for on-farm conservation. Biodivers. Conserv. 2006, 15, 4289–4308. [Google Scholar] [CrossRef]
  64. Hikeezi, D.M. The Importance of Sorghum Grain Colour and Hardness, and Their Causes and Measurement. International Sorghum and Millet Collaborative Research Support Program (INTSORMIL CRSP) Presentations. 2010. Available online: https://digitalcommons.unl.edu/intsormilpresent/18 (accessed on 3 May 2022).
  65. Harris, H.B.; Burns, R.E. Influence of tannin content on preharvest seed germination in sorghum seed molding. Agron. J. 1970, 65, 957–959. [Google Scholar] [CrossRef]
  66. Asfaw, Z. Variation in the morphology of the spike within Ethiopian barley, Hordeum vulgare L. (Poaceae). Acta Agric. Scand. 1988, 38, 277–288. [Google Scholar] [CrossRef]
  67. Deepika, K.; Krishna, L.; Santosha, R.; Chandra, M.Y.; Aravind, K.J.; Narender, R.; Subba, R.L.V.; Jyothi, B. Multivariate analysis of geographically diverse rice germplasm for genetic improvement of yield, dormancy and shattering-related traits. Plant Genet. Resour. Charact. Util. 2021, 19, 144–152. [Google Scholar] [CrossRef]
  68. Seiler, G.J.; Stafford, R.E. Factor analysis of components of yield in Guar. Crop Sci. 1985, 25, 905–908. [Google Scholar] [CrossRef]
  69. Yan, W.; Fregeau-Reid, J.A. Breeding line selection based on multiple traits. Crop Sci. 2008, 48, 417–423. [Google Scholar] [CrossRef]
Figure 1. Map of the Tigray region (study site) and Ethiopia (upper left). The color-highlighted maps are Woredas/districts from where sorghum landraces were collected.
Agriculture 13 01753 g001
Figure 2. Variability for total flavonoid contents among 21 sorghum landraces.
Agriculture 13 01753 g002
Figure 3. Variability for total tannin contents among 21 sorghum landraces.
Agriculture 13 01753 g003
Figure 4. Comparisons of effective concentration (EC50) of sorghum landraces.
Agriculture 13 01753 g004
Figure 5. Sorghum landraces of the study area, Tigray, with different seed colors.
Agriculture 13 01753 g005
Figure 6. Dendrogram showing sorghum landraces clustered into different distinct groups.
Agriculture 13 01753 g006
Figure 7. Discriminant analysis for 21 sorghum landrace collections. The axes represent the first two Linear Discriminants (LD). Each convex hull represents a cluster, and each dot represents an individual landrace.
Agriculture 13 01753 g007
Figure 8. Biplot of the 21 sorghum landraces and nutritional traits for the first and second principal components.
Agriculture 13 01753 g008
Figure 9. Some end uses of sorghum include Enjera (pancake-like Ethiopian flat bread), popping, and Swa’ (local beverage), respectively, from left to right.
Agriculture 13 01753 g009
Table 1. The 21 selected sorghum landraces were used for the analysis of minerals, flavonoids, tannin, and antioxidant activities with some of their descriptions.
No.Landrace NameZone of OriginRaceSeed ColorPreferred End-Use
1JamuyeSouthern TigrayDurraYellowSwa/Enjera
2GanoSouthern TigrayDurraYellowEnjera
3KodemSouthern TigrayDurraYellowEnjera/Swa
4Aba’areSouthern TigrayDurraYellowEnjera
5AmaricaSouthern TigrayDurraWhiteEnjera
6DengeleSouthern TigrayDurraYellowEnjera/Swa
7Gan-SeberSouthern TigrayDurraWhiteSwa/Enjera
8DegalitSouthern TigrayDurraYellowSwa/Enjera
9TinkishSouthern TigrayDurraYellowEnjera/popping
10ZengadaSouthern TigrayBicolorRedEnjera/Swa
11TewzaleCentral TigrayCaudatumRedEnjera/Swa
12TirbishCentral TigrayDurraYellowSwa/Enjera
13ZerzaroCentral TigrayDurraBrownSwa/Enjera
14LequaCentral TigrayBicolorBrownSwa
15DagnewWestern TigrayBicolorYellowSwa/Enjera
16KorkoraWestern TigrayCaudatumWhiteEnjera
17MereweyWestern TigrayDurraYellowEnjera
18Wedi-AkerWestern TigrayCaudatumWhiteSwa
19Wedi-SbuhWestern TigrayDurraWhiteEnjera
20GumbilCentral TigrayDurraYellowEnjera
21Arfa’agdmWestern TigrayCaudatumWhiteEnjera
Table 2. Descriptive statistics for protein, starch, Fe, Zn, Cu, Mn, Cr, TFC, TTC, EC50, FRAP, and TAC of the sorghum landraces.
VariableProteinStarchFeZnCuMnCrTFCTTCEC50FRAPTAC
Max1878.3101435.320.21.56657.5818.4334.863.9
Min6.2133.43216.91.59.21000.1829.117.91.71
Mean11.469.351.6272.914.71.01198.42.6120811523.5
SE0.120.323.291.420.20.550.146.70.6148.623.14.45
SD2.26.1215.16.50.92.510.35214.22.78222.6105.920.4
CV19.348.8329.224.13217.134.3108106.5106.992.3586.8
t-test0.0000.0000.0000.0000.0000.0000.0000.0000.0000.0000.0000.000
Table 3. The mean of sorghum nutritional traits of the four clusters.
Mean of Nutritional Traits
ClusterProteinStarchFeZnCuMnCrTFCTTCEC50FRAPTAC
I13.1772.3859.9932.483.716.241.12119.61.02231.66212.39
II10.2772.845.0123.132.3214.020.85121.32.08199.68217.47
III14.675355.4925.192.9114.241.3900.59818.37181.71
IV10.3467.8850.7426.282.8313.71.07559.37.1234.830361.94
Table 4. Squared distances between clusters (Mahalanobis Distance, D2).
ClustersIIIIIIIV
I-
II40.18 **-
III212.12 **238.15 **-
IV673.98 **729.15 **1173.79 **-
The symbol “**” denotes significant at 1 %.
Table 5. Principal component matrix showing eigenvalues, total variance, cumulative variance, and eigenvector (loadings) for the 12 nutritional traits of sorghum landraces.
TraitPC 1PC 2PC 3PC 4
Protein−0.430.38−0.270.32
Starch−0.07−0.250.89−0.02
Fe−0.170.75−0.06−0.07
Zn−0.130.650.530.27
Cu−0.220.910.01−0.21
Mn−0.220.450.16−0.59
Cr0.190.28−0.050.72
TFC0.890.240.050.15
TTC0.880.15−0.24−0.21
EC50−0.69−0.01−0.56−0.02
FRAP0.970.17−0.030.01
TAC0.960.10−0.14−0.11
Eigenvalue4.262.421.571.17
% Total variance35.5420.1613.089.71
% Cumulative variance35.5455.7068.7878.48
Disclaimer/Publisher’s Note: The statements, opinions and data contained in all publications are solely those of the individual author(s) and contributor(s) and not of MDPI and/or the editor(s). MDPI and/or the editor(s) disclaim responsibility for any injury to people or property resulting from any ideas, methods, instructions or products referred to in the content.

