
Food Trade Network and Food Security: From the Perspective of Belt and Road Initiative

1
School of Economics and Management, Harbin Institute of Technology (Shenzhen), Shenzhen 518055, China
2
School of Finance and Economics, Jiangsu University, Zhenjiang 212013, China
3
School of Statistics, Dongbei University of Finance and Economics, Dalian 116025, China
*
Author to whom correspondence should be addressed.
Agriculture 2023, 13(8), 1571; https://doi.org/10.3390/agriculture13081571
Submission received: 20 June 2023
/
Revised: 31 July 2023
/
Accepted: 3 August 2023
/
Published: 7 August 2023
(This article belongs to the Special Issue The Sustainable Agri-Food Systems in the Era of COVID-19: Opportunities and Challenges)
Abstract
:In recent times, there has been a growing interest in the role of food trade in achieving food security. This study presents a comprehensive analysis of the relationship between food trade and food security within the context of the Belt and Road Initiative (BRI). This study employs complex networks alongside the quadratic assignment procedure (QAP) regression method on trade data of 46 countries under BRI for the period 2008 to 2018. The resulting complex network showed an enhancement in the food trade relationships and food security levels after BRI, indicating a mutually positive effect. In addition, the closeness centrality measure showed a strong correlation with food security, indicating that food trade has positive spillovers on food security in the proximate countries. Using geographical distance as an instrumental variable, the QAP regression model proved the positive effects of food trade on food security. More investment in trade infrastructure is recommended to reduce the negative effect of geographical distance on food security.
1. Introduction
In a world marked by interconnected economies and an ever-growing global population, ensuring food security has emerged as a pressing concern. Although the UN plans to achieve food security in the first third of the 21st century, many countries still suffer from hunger, poverty, and the lack of life necessities. Globally 1 in 9 people is undernourished. Recent data indicates that approximately 20.5 million children were born with low-birth weight in 2015. Three years later, 149 million children were stunted, 49.5 million children were wasted, and 40.1 million children were overweight [1]. These statistics refer to the urgency of cooperation among countries to end world hunger by enhancing food security through trade cooperation and import liberalization measures, as well as the enhancement of export access to international markets [2]. As nations strive to meet the nutritional needs of their populations, strengthening the global food trade network is still not a priority for policymakers.
The literature refers to the positive impact of agricultural merchandise trade on global food security by enhancing food availability and access [3]. This relationship has been proved using dynamic network modeling techniques [4], econometric analysis [5], GMM econometric technique [6], and simulation technique [7]. However, developing countries face two main challenges in this context. The first challenge related to food safety and market access limitations [8]. The second challenge pertains to import liberalization, which can lead to shifts in dietary patterns and the availability of cheap calories and fats [9]. In addition, all international trade theories, including traditional and modern theories, are less applicable in less developed countries than in industrialized countries due to market access limitations for raw products and low productivity [8], which leads to a negative relationship between food trade and food security [9]. This study investigates the impact of food trade cooperation initiatives on food security and explores how developing countries can overcome the challenges they face in food trade.
Ever since its launch in September 2013, the Belt and Road Initiative (BRI) has garnered substantial attention from scholars and researchers, owing to its promotion of trade cooperation between nations aimed at fostering economic development and prosperity. An area of particular significance within the BRI framework is food security, as the initiative plays a pivotal role in strengthening global food security by (1) enhancing agricultural production capacities in developing countries and stabilizing international food markets; and (2) increasing imports and pursuing strategic integration of agribusiness conglomerates across all levels of global food supply chains instead of promoting self-reliance [10]. This study investigates the relationship between food trade and food security among 46 countries of the BRI using a dataset that covers the period before and after the announcement of BRI in 2013. This study aims to address the following key questions: (1) Have the bilateral food trade relationships been strengthened since the inception of the BRI? (2) To what extent have food trade relationships contributed to the improvement of food security in countries participating in the BRI? (3) What are the underlying factors influencing food trade and its implications for food security within BRI countries?
This study makes significant and distinctive contributions to the existing literature, providing unique empirical evidence on the relationship between food trade and food security, drawing from data gathered from countries participating in the Belt and Road Initiative (BRI). Firstly, it presents the evolution of bilateral food trade relationships and food security situations among BRI countries before and after the launch of the BRI. Secondly, it conducts an analysis of the relationship between food trade and food security, taking into account the issue of non-independence of observations. Thirdly, this study addresses concerns regarding the potential issue of reverse causality in the relationship between food trade and food security by employing the instrumental variables (IV) method. Lastly, this study enhances the robustness of its findings by employing various food security indicators.
The findings showed a positive relationship between food trade cooperation and food security levels in BRI countries. Moreover, the results indicate that geographical distance continues to act as a hindrance in food trade, emphasizing the importance of investing in food trade infrastructure. The results obtained are robust and consistent when using different food security indicators.
2. Literature Review
This section reviews previous theoretical and empirical literature relative to food security and its relationship with the food trade.
2.1. Food Security
The World Food Summit in 1996 defined food security as a situation in which all people can consistently access healthy and sufficient food. The term ‘access’ encompasses physical, social, and economic means of obtaining food [11]. Subsequently, the Food and Agricultural Organization (FAO) identified four essential dimensions of food security: (1) Food availability: Ensuring food supply is in the right quantity and quality provided by local production and/or imports. (2) Food access: Ensuring that the individuals possess sufficient resources to obtain appropriate nutritious food. (3) Food utilization: ensuring that people have a proper diet, clean water, sanitation facilities, and medical care to achieve nutritional welfare that meets all physiological needs. (4) Food stability: ensuring access to food under all conditions, including periods of economic or climate crises [12].
Food security theory addresses the issue of hunger, drawing from the Malthusian analysis that links hunger with poverty and food scarcity [13]. During the 1980s, significant investments were made in agriculture and seed technology, particularly in developed countries, leading to a global increase in food production. This transformative period came to be known as the Green Revolution, which successfully boosted productivity through technology transfer, research, and social reforms related to agricultural land distribution [14]. The Green Revolution asserts that while knowledge plays a vital role in resolving world hunger, it is crucial to consider the political and economic environments. Many scientists assert that global food production can meet the needs of the world population; however, hunger persists due to the uneven distribution of food supplies. As such, the solution lies in ensuring food access for all individuals worldwide [15]. From an economic perspective, in addition to the importance of cooperation in agricultural investment [16] and cooperation in education [17], mutually beneficial food trade emerges as a recommended measure to achieve food security.
Discussion of food security issues requires a spotlight on food sovereignty theory. Food sovereignty embodies the right of individuals to determine their agriculture and food choices, aiming to safeguard and manage local agricultural production and trade in the pursuit of sustainable development. Food sovereignty does not reject the food trade; instead, it encourages the setting up of policies and practices in the food trade to protect the local people’s rights in healthy and sustainable food production [18]. On the other hand, some scholars point to the importance of trade in achieving food sovereignty goals. Burnett and Murphy [19] suggest that the food sovereignty movement should further develop its position on trade, as trading remains pivotal to achieving food security and supporting the livelihoods of small producers and peasants affiliated with the movement. According to Jansen [20], Nations need to achieve food sovereignty by (1) realizing the importance of complex chains for feeding the world population; (2) helping farmers to be incorporated into larger commodity networks; and (3) supporting state and science. This brief theoretical review supports the importance of international trade in achieving food security among countries.
2.2. Food Security and Food Trade
There is a broad consensus regarding the positive impact of agricultural merchandise trade on global food security. This impact is achieved by improving both food availability and access to food [3]. In addition to the direct effects of food trade on food security, it also stimulates increased investments in the food sector [4], and boosts food production [5], thus further benefiting food security.
Nevertheless, developing countries continue to face two main challenges in this context. The first challenge pertains to food safety and access to regional and international markets. Developing countries encounter limitations in market access for raw products [8]. An example of such limitations is the imposition of food safety restrictions. To overcome these barriers, exporters may implement risk reduction measures and quality certification programs to enhance their position in emerging overseas markets [21]. However, it is essential to strike a balance between the objectives of food trade and food safety, which often requires public intervention and additional costs. Developing countries must evolve their food safety standards to align with international norms [22]. On the other hand, promoting diversity in food products can facilitate access to markets. Studies by Nin-Pratt and Diao [23] highlight that low diversity in agricultural exports and low productivity present significant constraints to promoting regional trade and its positive effects on welfare and food security. Similarly, Pasara and Diko [7] demonstrate that incorporating a wider range of food categories into the model can enhance the overall gains of the African Continental Free Trade Area (ACFTA).
The second challenge pertains to import liberalization. Although increased food availability is generally associated with positive health outcomes, trade openness can lead to shifts in dietary patterns, greater dietary diversity, and the availability of cheap calories and fats [9]. Implementing nutrition-sensitive interventions during trade negotiations and agreements can mitigate the negative effects of trade liberalization, improve dietary quality, and reduce undernutrition [24]. For example, the application of differential tariffs on palm oil may serve as an intervention to promote healthier and more sustainable oil consumption, aligning with sustainable nutrition agendas and policy goals related to self-sufficiency and food security [25]. Recent research by Gleeson and Labonté [26] has shown that liberalizing trade in unhealthy commodities has led to increased availability, reduced prices, and heightened consumption of such products in certain countries. It is crucial to address the potential implications of trade and investment agreements on governments’ ability to safeguard public health. Careful negotiation of legal texts, including well-drafted exceptions for health measures, can serve as a viable solution in this regard.
Despite wide agreement about the positive relationship, some studies suggest that the challenges mentioned above could lead to a negative relationship between food trade and food security [9], raising questions about the direction of this relationship. This study tries to comprehensively examine the direction of this relationship by using different statistical methods and different food security indicators. Moreover, this study aims to investigate the impact of food trade cooperation initiatives (such as BRI) on food security and explores how developing countries can overcome the challenges they face in food trade to strengthen the effectiveness of food trade in addressing the problem of food insecurity. Although the announced goals of BRI are to end poverty and hunger and enhance prosperity, the member countries still have about 7 percent of children under 5 years overweight, 11 percent with underweight, 22 percent with stunting, 10 percent are suffering from undernourishment, and 5 percent with wasting [27]. All these indicators indicate that food security is still a critical matter for the countries along BRI. This study argues that food trade cooperation among BRI countries is an opportunity to overcome the abovementioned challenges and enhance food security. So, this study tests the following hypothesis:
Hypothesis 1.
The food trade has a significant impact on food security in BRI countries.
Although the main aim of this study is to investigate the effect of food trade on food security, the impact of food security on food trade should be considered. Dithmer and Abdulai [28] referred to the potential reverse causality problem between food trade and food security, where they treated trade openness as an endogenous variable. Later, Ref. [29] supported this opinion with evidence. She found that developing countries’ response to increased hunger by reducing food trade openness is a type of protectionist policy that could support food security in the short term. To know whether food security deficiency issues influence choosing the food trade partners, this study tests the following hypothesis:
Hypothesis 2.
Food security has a significant impact on the pattern formation of the food trade network in BRI countries.
This study uses the complex network method to present and analyze the relationship between food trade and food security and the QAP Regression approach to test hypotheses. Moreover, it uses the 2SLS method to dispel concerns about the reverse causality problem.
3. Data and Methodology
This section provides an overview of the data and variables utilized in this study. Subsequently, it presents the food trade network and its various components and measurements. Finally, the section explains the QAP regression models employed in the research.
3.1. Data
This study is based on panel data from 46 countries covered by BRI over an 11-year period (2008–2018). The study sample comprises a varied mix of countries, encompassing less developed, developing, and a few developed nations. This diversity in the sample allows for a comprehensive reflection of global economic and social characteristics. Furthermore, the chosen sample enables an in-depth analysis of the role of food trade cooperation initiatives in enhancing food security. The selection of sampled countries and the covered duration in this study is contingent upon data availability. On the one hand, numerous food security indicators lack data beyond the year 2018, rendering them ineligible for inclusion. On the other hand, some countries do not possess sufficient data to be incorporated into this study. Furthermore, the recent inclusion of many countries in the BRI that were not part of the initiative before 2018 has led to their exclusion from this analysis. The list of countries included in this study is shown in Table A2. The annual food trade data was collected from the International Trade Centre (ITC). To represent the food trade data, this study uses “Processed Food and Agro-Based Products” import data, where it collected the annual import data for each country from all 45 countries. The basic food security indicators were obtained from the FAO website. These food security indicators used in this study represent the four aspects of food security identified by the FAO. First, food availability is represented by the average dietary energy supply adequacy. Second, access to food is denoted by gross domestic product per capita (in purchasing power equivalent). Third, the political stability indicator (the absence of violence/terrorism) is used to represent the stability of the food supply. Finally, food utilization is proxied by the percentage of the population using at least basic drinking water services.
3.2. Model Specification
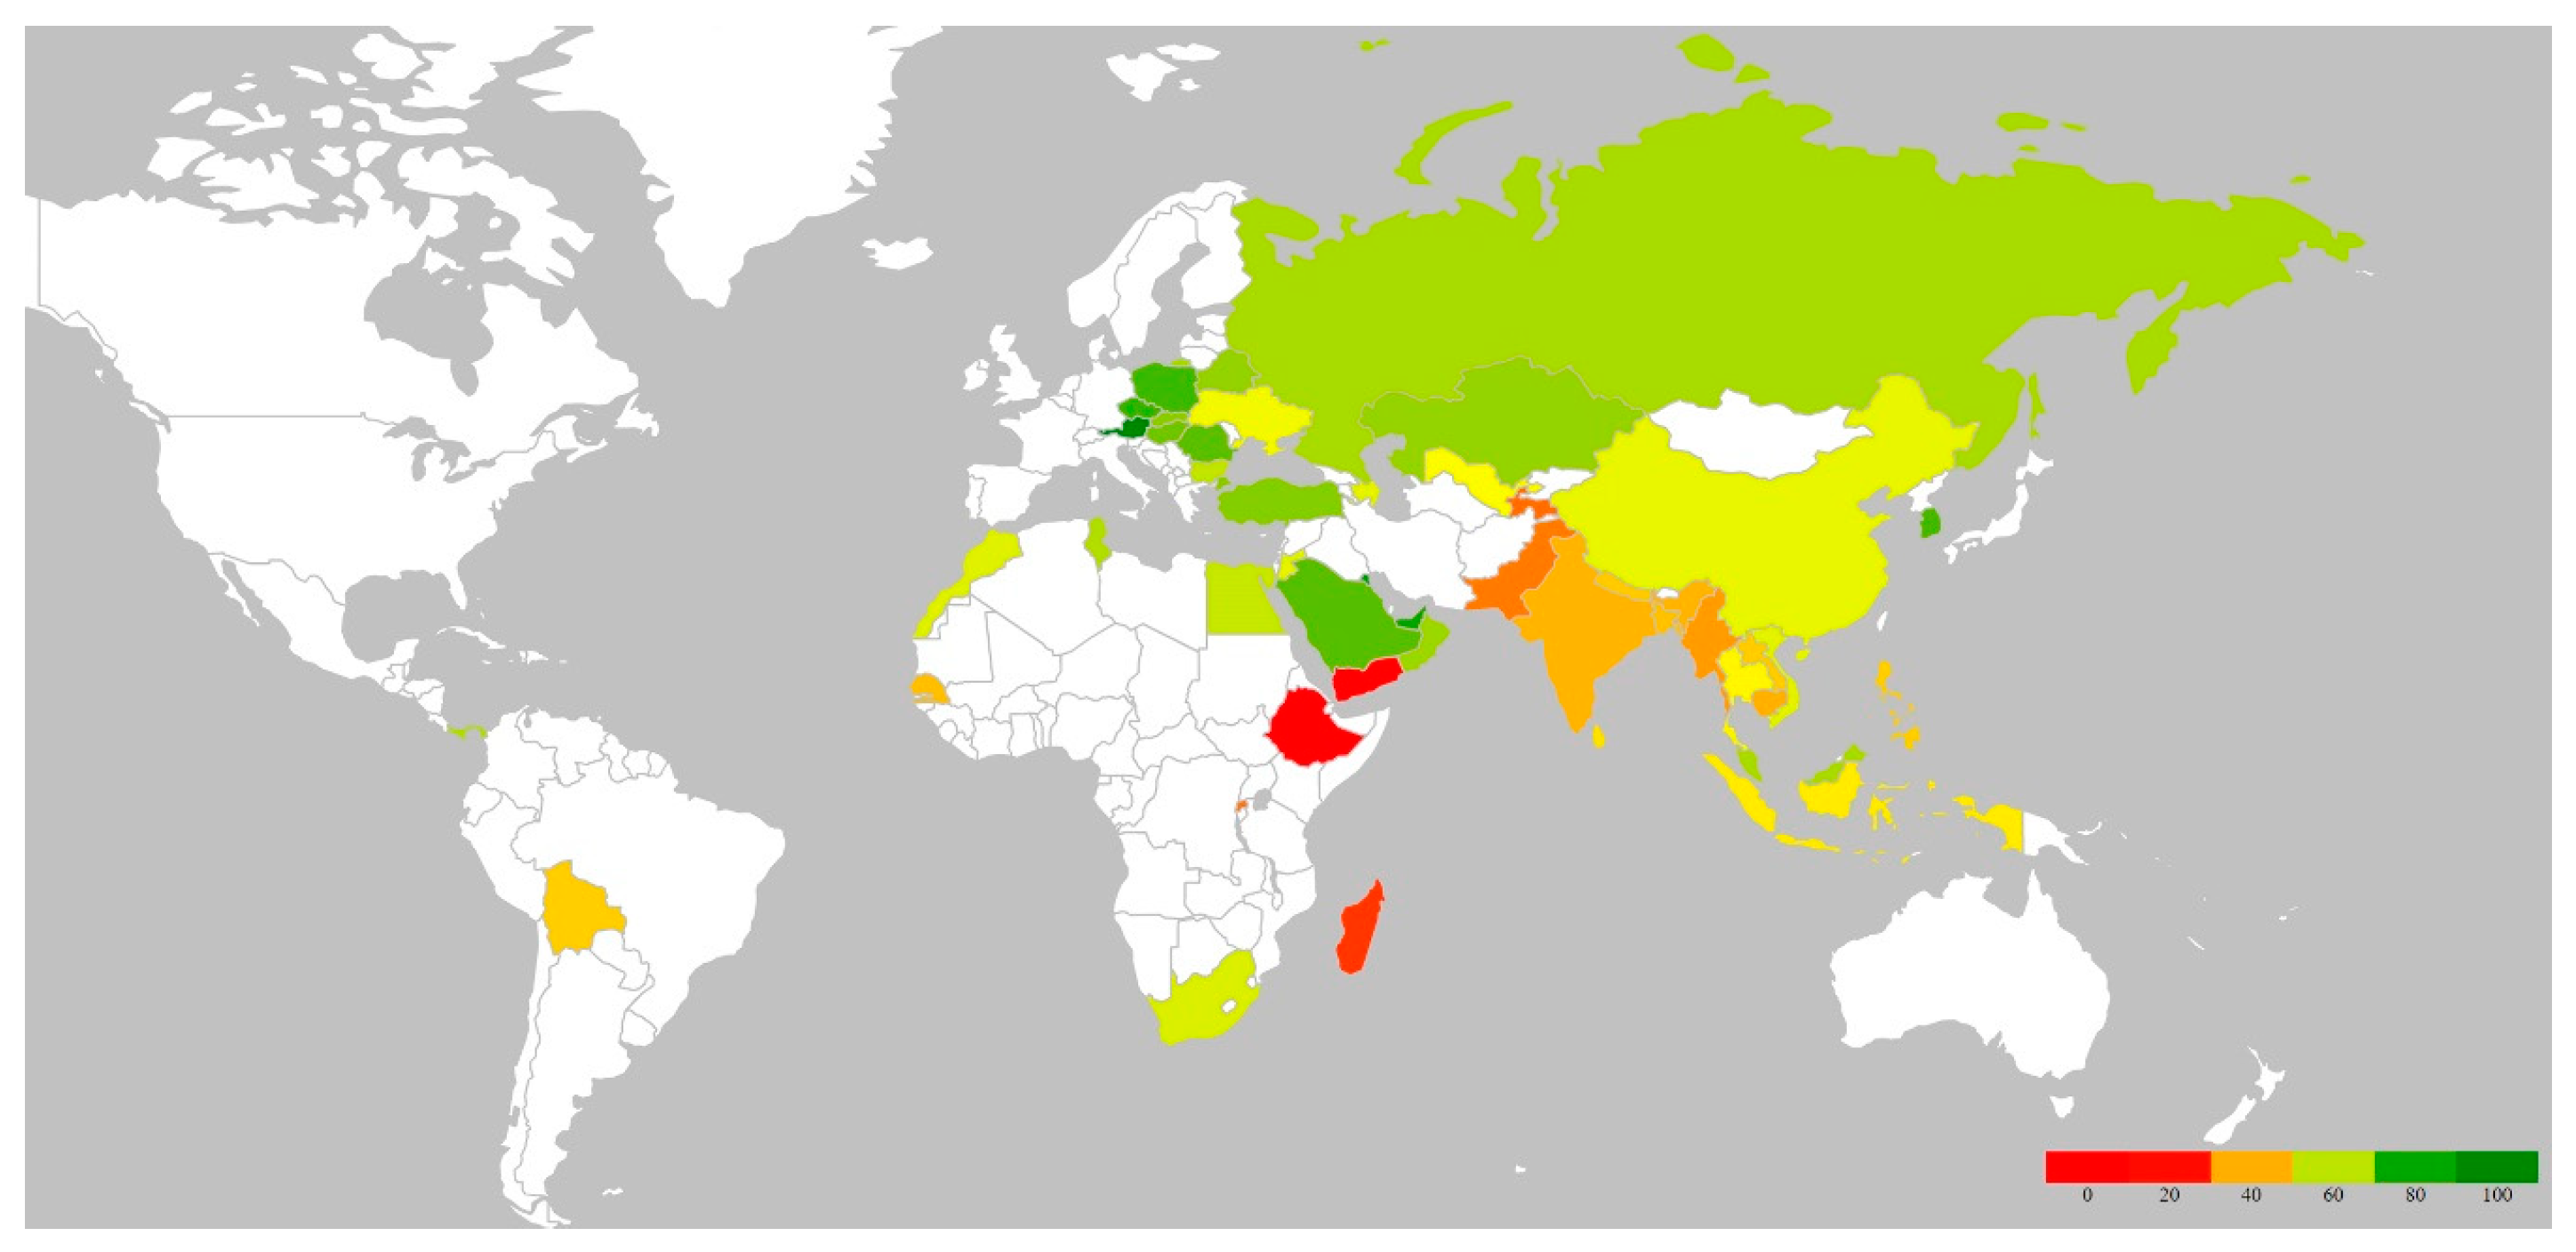
Given the different variables measured by different metrics included, this study undertakes a standardization of the data as shown in Equation (1). This study standardized the four food security indicators and then calculated their average to obtain one indicator that can represent the level of food security well. Figure 1 shows the average food security levels in study sample countries over 11 years.
To perform QAP regression analysis, this study added more variables to the analysis, such as the agricultural production per capita, gross domestic product per capita (GDPPC), and the distance between countries. Since the QAP regression method can only be run for cross-sectional data and cannot be run for panel data, this study calculated the average for all variables over 11 years. The statistical summary of variables is shown in Table 1.
These averaged data were used as input in the analysis. The data was prepared for the analysis in the following two steps:
- Since the different variables are measured by different metrics, data should be standardized by applying Equation (1) for each variable separately.
- 2.
- Since the trade matrix is a square matrix (N*N), this study transforms the data of some variables (FSI, GDPPC, AgrPC) by taking the differences between each couple of countries. Differences matrix X is formed according to equation X (i, j) = vector (i) – vector (j). where i and j refer to row and column numbers, respectively. To make sure that values of the difference’s matrix X represent for all variables, this study set the exporters as columns and importers as rows in the trade matrix.
Finally, the correlation coefficients were calculated based on prepared data according to the two steps mentioned above; Table 2 shows that there is no autocorrelation between variables.
3.3. Complex Network
The network method is commonly used in trade relationship analysis. Most relationship analysis methods, such as regression models, consider that the effect of other factors could be reduced to the average effects. However, the case is different when we deal with trade networks characterized by a high degree of heterogeneity that can be quantified in the world network using centrality measures. In this case, the network analysis can be a fruitful complement to the econometrics methods [30].
Trade network is a graph where V is a set of vertices or nodes, L is links or edges, W is edges weights, and P represents values relevant to nodes (e.g., label, income, geographical coordinates).
3.4. Weight Measure
Many weight measures of edges in trade networks have been assumed [31,32,33]. This paper follows Bhattacharya, Mukherjee [34]. The annual trade between two countries, i and j, is described by four different quantities: , , , and , In general values of and should be the same, but they have been quoted differently since exports from i to j and imports to j from i are reported as different flows in the International Monetary Fund (IMF) trade data. Although magnitudes of these quantities are approximately the same in most cases, they differ in many instances due to different reporting procedures and different rates of duties applicable in different countries. Therefore, for two countries i and j, the number of imports from j to i () is defined as:
3.5. Network Centrality Measures
3.5.1. Node Degree
The degree of node i in the network denotes the number of nodes that have a connection with node i. If the network is directed, then the degree of a node will be divided into outdegree and in-degree. The outdegree of node i is the number of all edges from node i to other nodes. The in-degree of node i is the number of edges from all other nodes to node i [35]. Since international trade includes imports and export flows, this paper has a directed network. The network can be divided into a food import network where the in-degree of nodes is considered and a food export network where the outdegree of nodes is considered. The in-degree of a node (country) measures the number of other countries that export food products to the country. The outdegree measures the number of other countries that import food products from the country [36].
3.5.2. Closeness Centrality
Closeness centrality is a measure of how close (in terms of topological distance) a node is with respect to all other nodes. The closeness centrality of a node z in a graph G, denoted by Cc(z), is inversely proportional to the total distance between z and all other nodes in G [30]:
where: is the number of the distance between node z and node i. N is the number of nodes in the network. Closeness centralities measure the accessibility between nodes, where adding an arc between two nodes increases the closeness centrality in many other nodes.
3.5.3. Betweenness Centrality
Betweenness centrality assumes the most important node is part of all (or the most) shortest paths between the other nodes. Let us have a group of nodes where S is a subset from V, the set of all vertices, then the betweenness centrality of group , denoted by , is the extent to which the nodes from over the shortest paths between two nodes that are not in [37]:
where is the total number of shortest paths between and , and is the total number of shortest paths between and containing at least one node from .
3.6. QAP Regression Method
Since the trade data is expressed as imports (or exports) between each couple of countries, the trade matrix is a square matrix where the rows and columns are the countries (partners), and each cell contains import volume from one country to its trade partner. In this case, the observations will not be independent of each other, which means using the methods that suppose that observations are independent leads to biased results. As an alternative method, usually, the quadratic assignment procedure (QAP) is used to effectively fix the autocorrelation problem of network data [38,39]. This research applies the QAP approach using Ucinet v.6 software to analyze the mutual relationship between food security and food trade.
3.6.1. Direct Relationship Analysis
Firstly, this study tests the direct mutual relationship between food trade and food security, and the models are shown as follows:
where refer to the volume of food imports from country j to country i (i = 1, 2, 3 … n, j = 1, 2, 3 … n, n countries count). represents the differences matrix of the average food security between country i and country j. represents the differences matrix of the average agriculture value added per capita between country i and country j. represents the differences matrix of the average GDP per capita between country i and country j. represents the geographic distance matrix between country i and country j, the coefficients values, and denotes error term.
3.6.2. Instrumental Variables Analysis
As mentioned in Section 2, some scholars have raised concerns about the existence of a heterogeneity problem or reverse causality in the relationship between food trade and food security [29]. To dispel these concerns, this study goes a step further and applies the instrumental variables technique. Given that the geographical distance between food exporters and food importers plays an essential role in food trade and does not affect food security directly (as the results will tell in Section 4.3.1), the distance can be used as an instrumental variable. This study checks whether instrumental variables analysis can provide different information about the relationship between food trade and food security by testing hypothesis 1, again, where the models are shown as follows:
where refers to the volume of food imports from country j to country i (i = 1, 2, 3 … n, j = 1, 2, 3 … n, n countries count). represents the difference matrix of the GDP per capita between country i and country j. represents the geographic distance matrix between country i and country j. represents the difference matrix of the average food security between country i and country j. is the predicted value, of food imports, from Equation (7). represents the difference matrix of the agriculture value added per capita between country i and country j, the coefficients values, and denotes error term.
4. Results and Discussion
4.1. Food Trade Network and Food Security
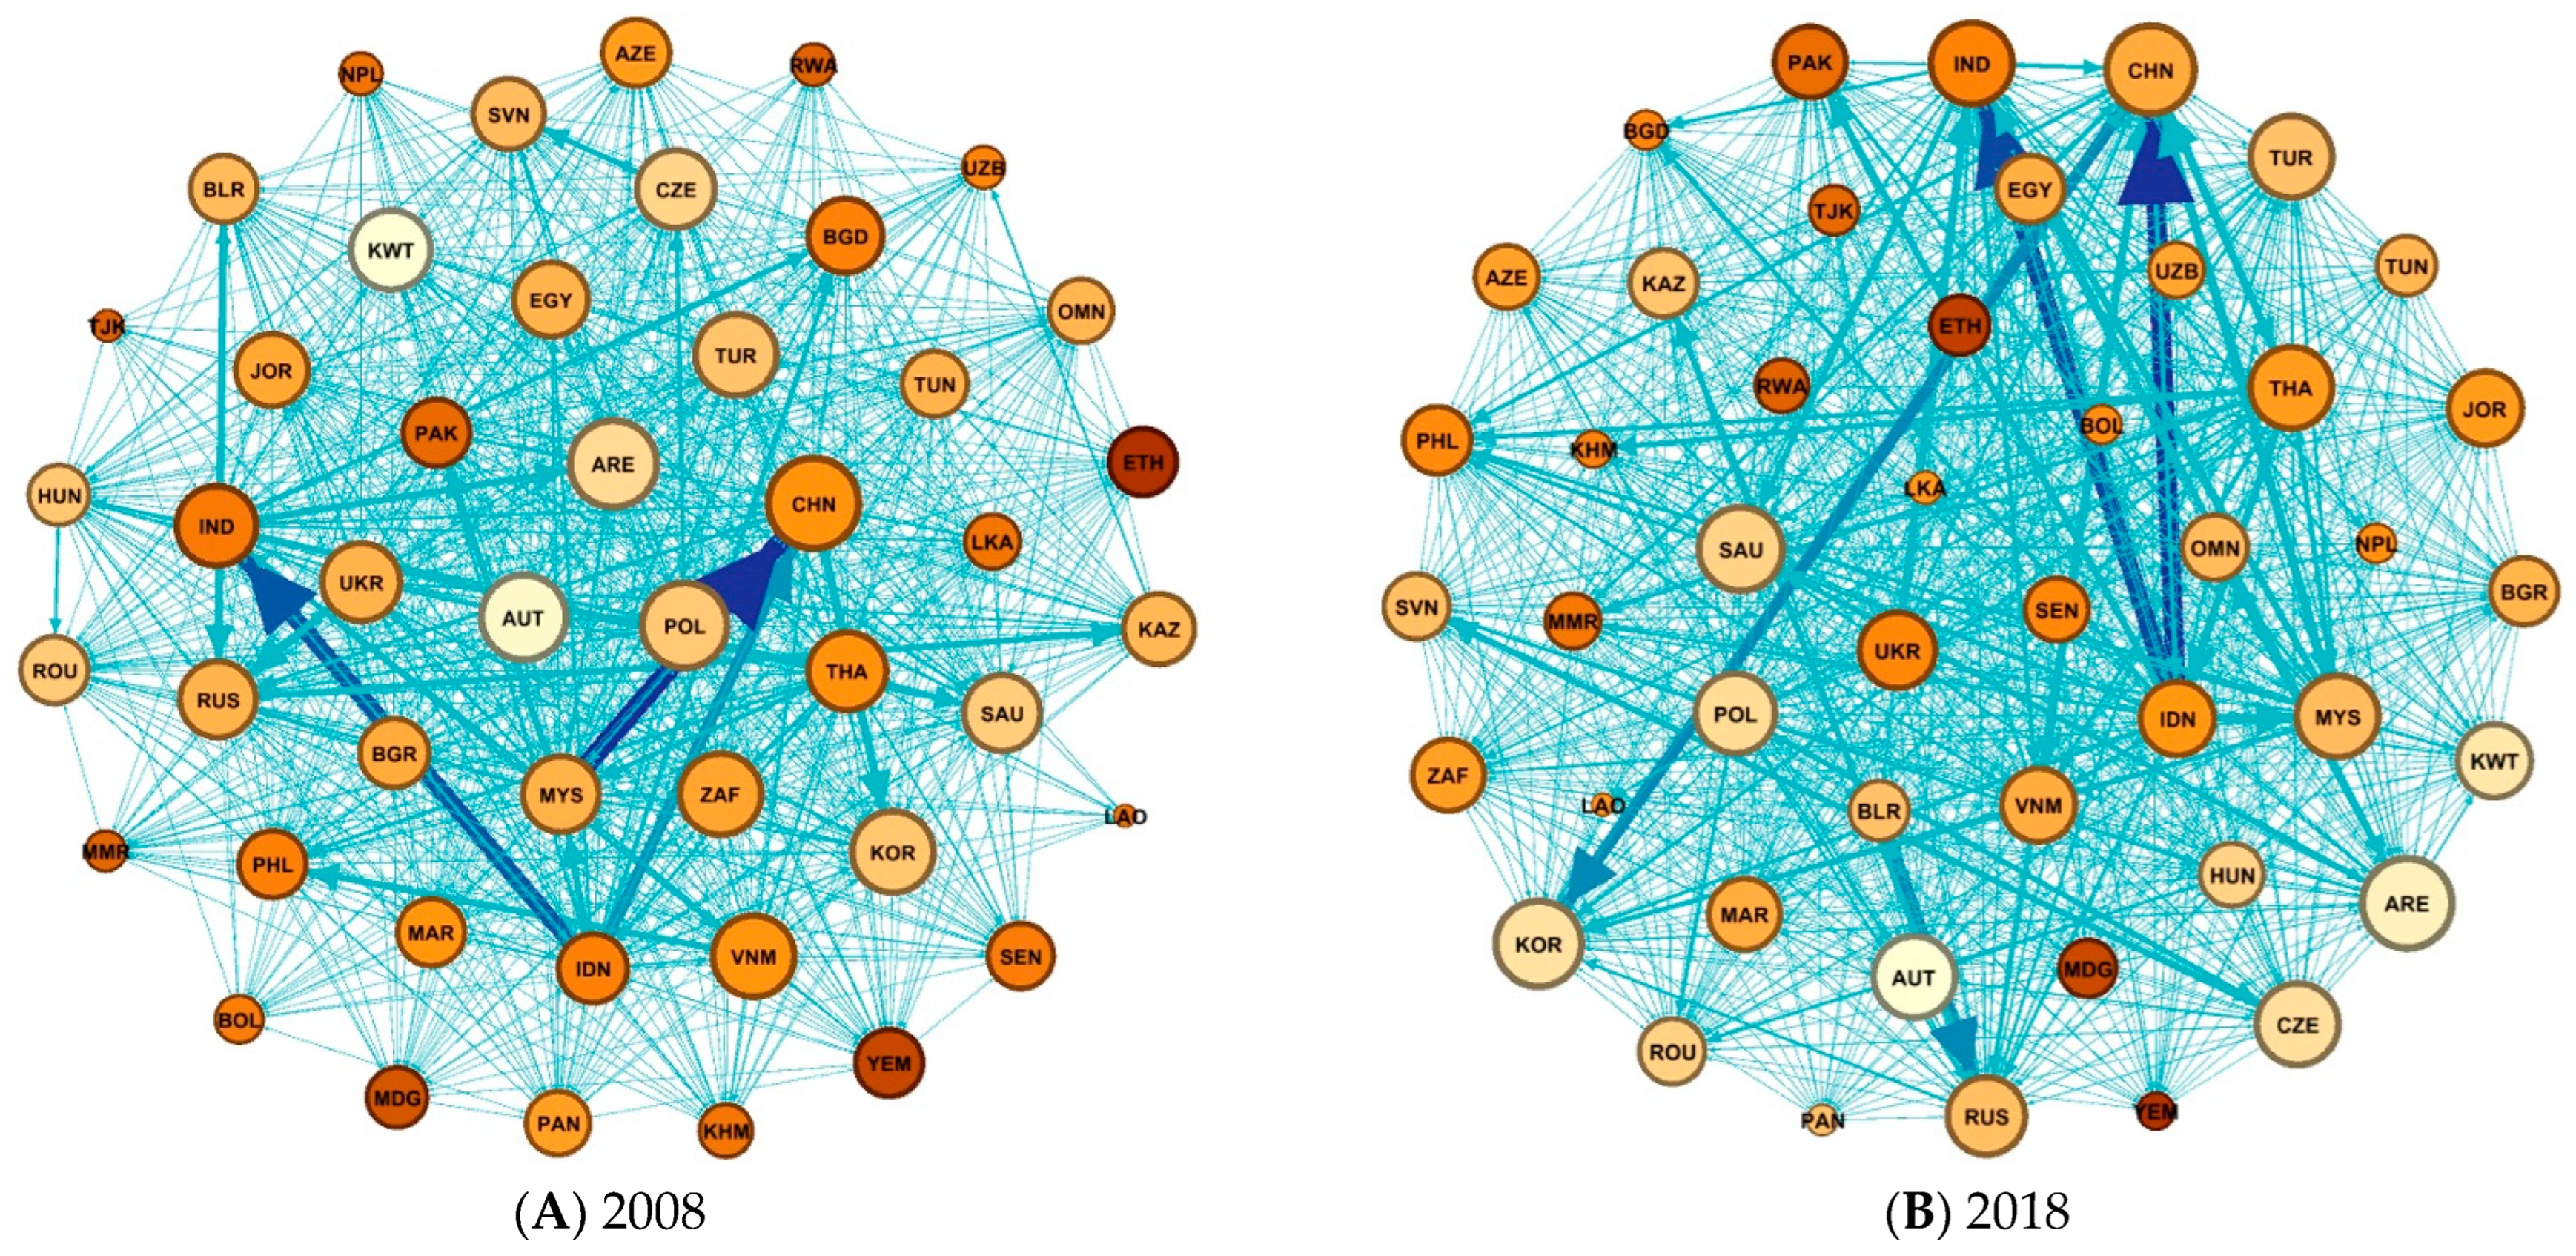
The collected food trade data shows that the top ten food importers imported 57.2% of total food imports. China, India, and Russia were the first, second, and third food importers, respectively. On the other hand, the top ten food exporters exported 75.8% of total food exports, which means that these ten countries contribute the most to food availability. Indonesia, India, and Russia were the first, second, and third food exporters, respectively. To present the strength of food trade relationships between each couple of countries, and their effects on food security and to make a comparison between the two periods, before and after BRI, this study used the data of food security and food trade for the years 2008 and 2018 and obtained two networks as shown in Figure 2.
Generally, Figure 2B has denser arcs than Figure 2A, indicating that food trade relationships become stronger after BRI. The networks show that the node size in many countries became larger in 2018 compared to 2008, such as TJK (Tajikistan), MMR (Myanmar), UZB (Uzbekistan), IDN (Indonesia), TUR (Turkey), BGR (Bulgaria), PAK (Pakistan), ARE (United Arab Emirates). Moreover, the node color in many countries became brighter in 2018 compared to 2008, such as LAO (Lao PDR), KOR (South Korea), UZB (Uzbekistan), NPL (Nepal), CZE (Czech Republic), MAR (Morocco), RUS (Russian Federation), CHN (China), BGR (Bulgaria), ARE (United Arab Emirates), POL (Poland). An increase in node size signifies a higher rank for the respective country based on the number of food suppliers, while brighter node colors indicate a better rank for the country concerning food security. Figure 2 and Figure 3D indicate that enhancing food trade relationships between some countries after BRI affected food security levels positively in these countries and other countries.
On the other hand, there has been a decrease in food supplier numbers, after BRI, in a few countries, where there are two cases: (1) the food security levels increased or did not change as the case in KHM (Cambodia), BGD (Bangladesh), PAN (Panama) and LKA (Sri Lanka), which indicate that the local food production enhanced food security levels. (2) Decreasing in the food security levels in the countries that face instability situations, such as YEM (Yemen), where the war led to a high decreasing in food imports and increasing in the extreme hunger problem in 2018 compared to 2008. Finally, results show that food trade cooperation among BRI countries comes along with enhancing food security, and the differences in food security levels have become less after BRI. In other words, increasing the number of food trade canals plays a clear role in reducing the differences in food security levels among BRI countries. In contrast, wars in some countries led to extreme hunger and instability that threatened other neighboring countries and the whole world.
Except for the improvement in the food trade among BRI’s countries, many other factors can enhance food security, such as increasing agricultural production, which is affected by rain rate and other factors, improving the food industry, and increasing economic growth. In addition, Torreggiani and Mangioni [40] concluded that the probability of country pairs belonging to the same food trade community depends more on geopolitical and economic factors such as geographical proximity and trade agreement co-membership. Section 4.3 tests the relationship between food security and food trade, considering more factors that could affect food trade and food security, such as agricultural production, GDP per capita, and the geographical distance between countries.
4.2. Food Trade Network Centrality Measures and Food Security
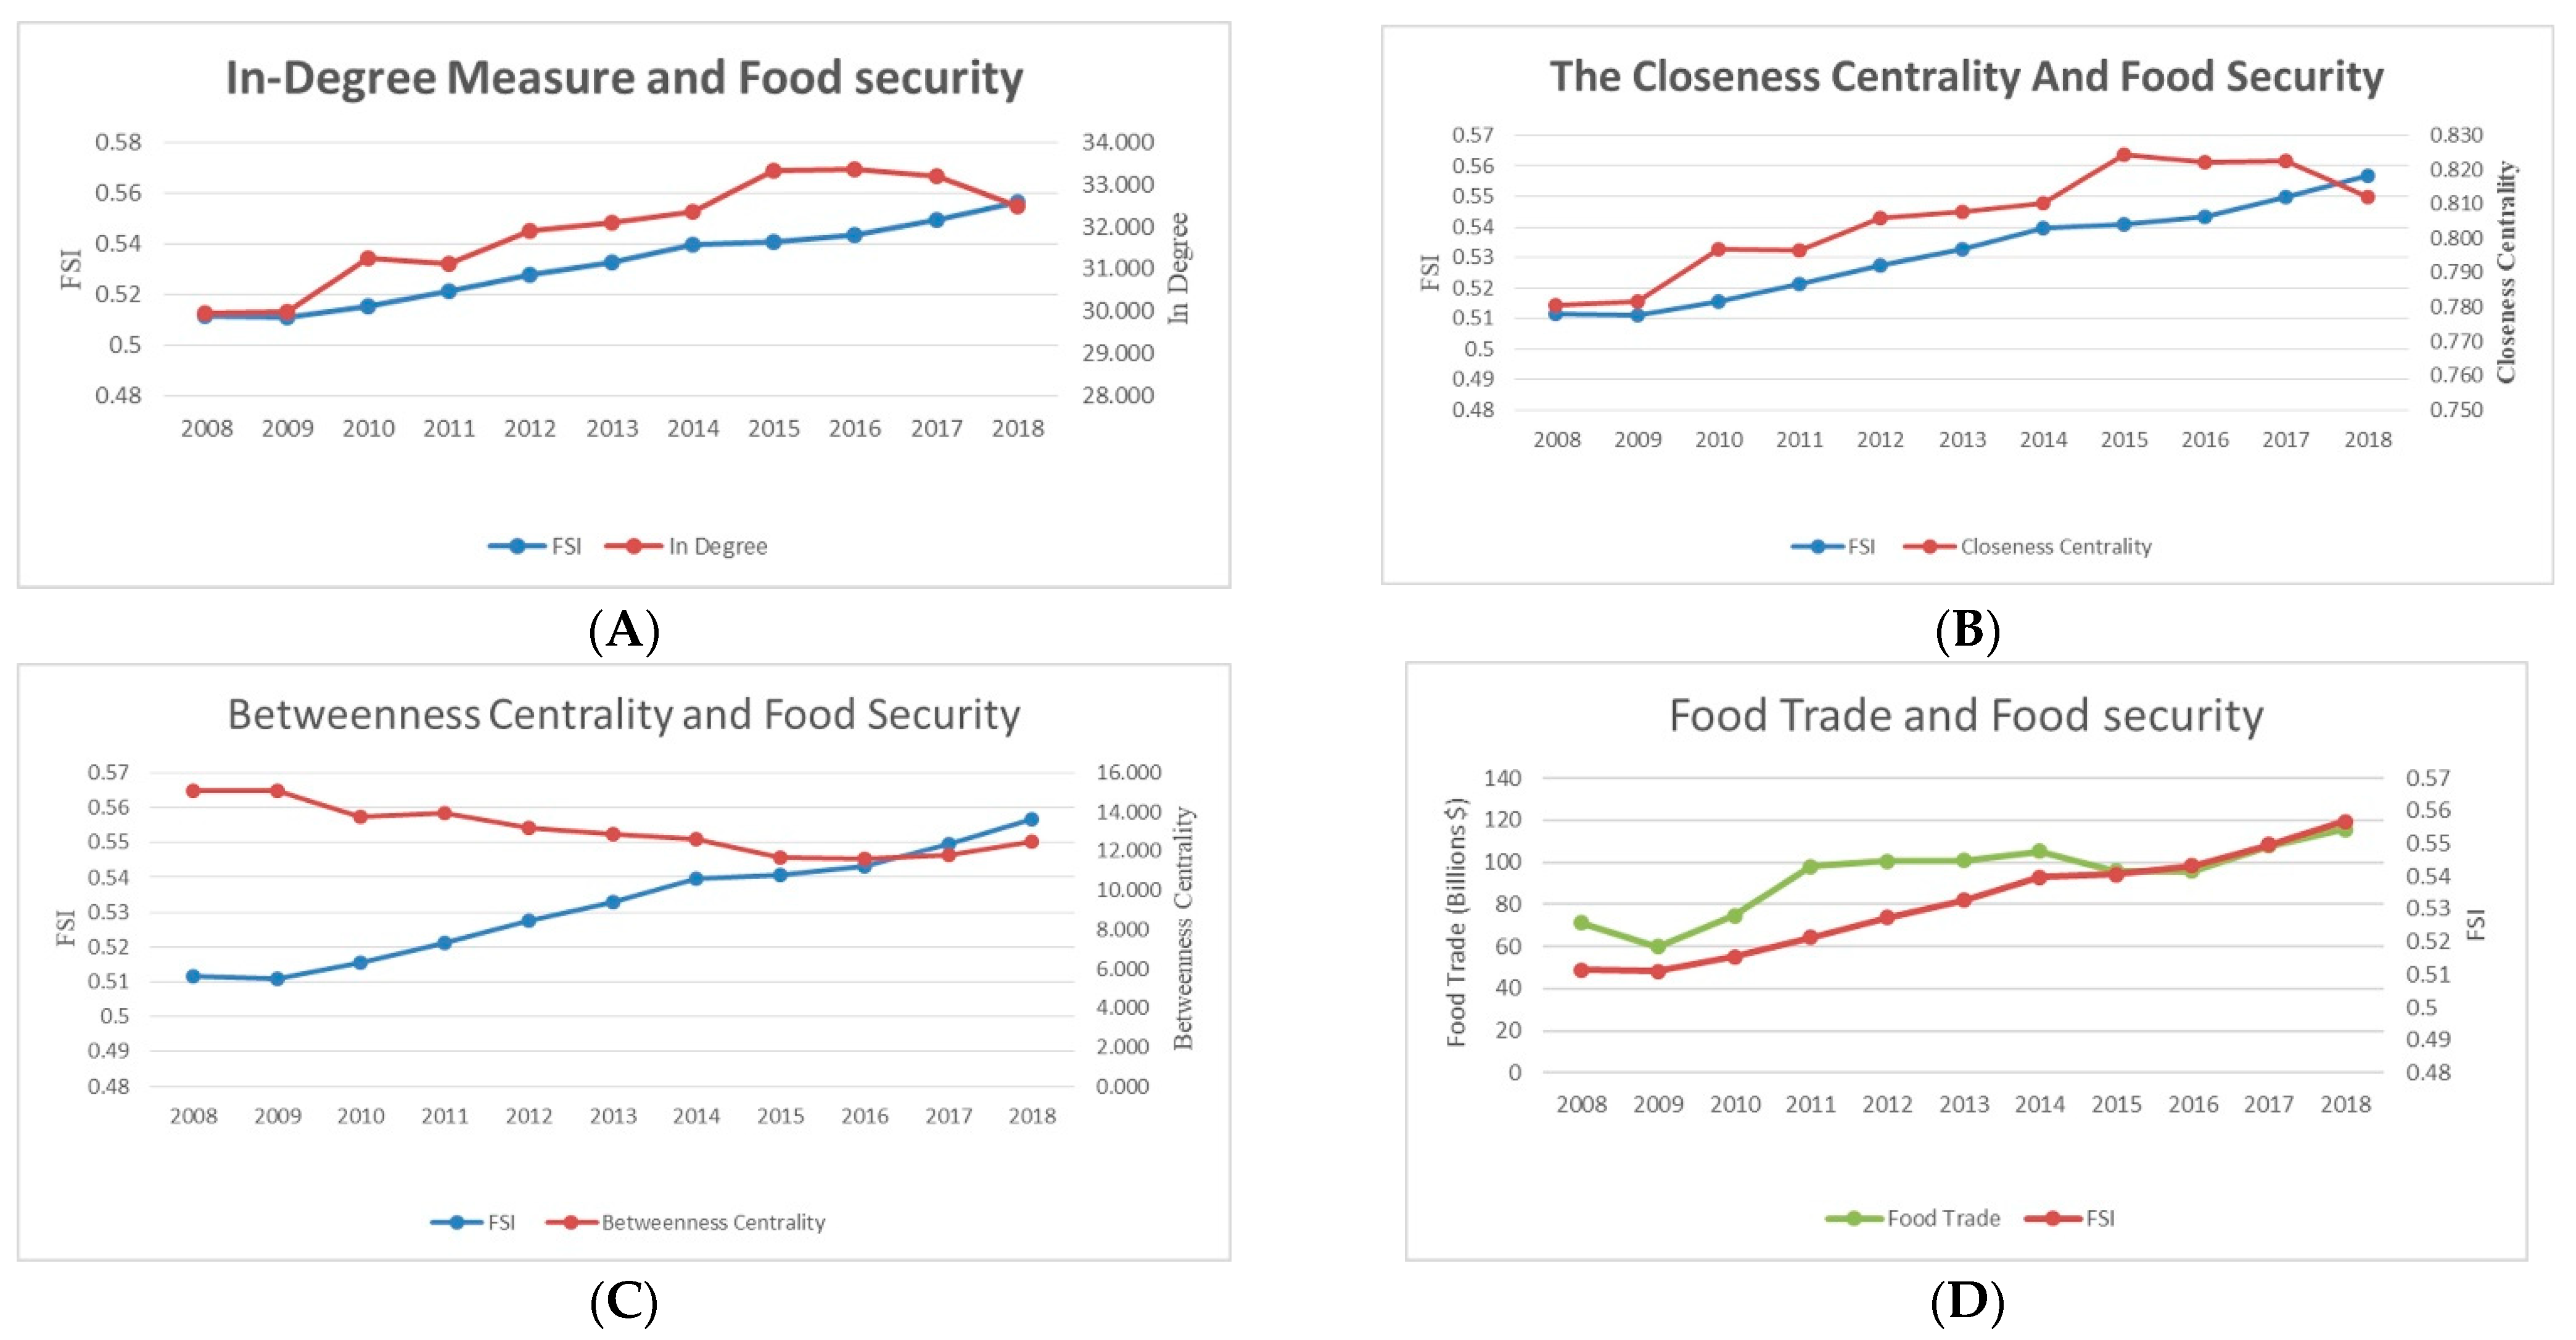
For a deep understanding of the food trade network, Figure 3 shows the network’s centrality measures and their relationship with food security levels.
Figure 3A shows a clear positive relationship between the number of food suppliers and the level of food security in the country. On the other hand, the decrease in food trade relations in 2018 did not affect the growth of food security because the total food trade volumes increased in 2018, as shown in Figure 3D. To explain Figure 3B, we should take into consideration that the increase in the in-degree measure in one country would increase the closeness centrality in that country and some other countries. In the same context, the positive relationship between the closeness centrality measure and food security can be explained that when two countries enhance (or diminish) their food trade relationship, then that could affect positively (or negatively) food security in these countries and some other countries. In other words, the positive (or negative) effects of enhancing (or diminishing) food trade cooperation on food security levels extend to many other countries. In contrast to the closeness centrality, the decreases in the in-degree in one country could increase the betweenness centrality values in other countries, as shown in Figure 3C. The betweenness centrality measure shows a negative relationship with food security, which can be explained by the fact that importing food products from many countries could enhance food security more than depending on a few food exporters. Using the same data of Figure 3, the values of the correlation coefficients of food security with food trade volumes, in-degree measure, closeness centrality measure, and betweenness centrality measure were 0.869, 0.882, 0.876, and −0.884, respectively. Both the in-degree measure and closeness centrality measure have a stronger correlation with food security than food trade volumes. These results indicate that the increase in the in-degree measure could come along with investing in trade facilities and trade infrastructure affecting food trade between many countries positively, which means an increase in the closeness centrality measure. The increase in the value of the closeness centrality measure reflects a better cooperation atmosphere, where the countries become closer to each other in the food trade relationships, which enhances food security.
4.3. QAP Regression Analysis Method
This study used the QAP regression method to investigate the factors that affect the structure of the food trade network. QAP regression method helped in answering the following questions:
- Do food trade volumes affect the gaps in food security between countries?
- Do differences in food security levels affect the structure of the food trade network?
This section answers these questions; then, by focusing on the first question, it uses the instrumental variable technique to avoid the reverse causality problem.
4.3.1. Direct Relationship Analysis
The results of applying QAP Regression on the data, according to the models in Equations (5) and (6), are shown in Table 3.
Testing the direct relationship using the QAP regression method shows an insignificant mutual positive effect between food import volumes and the differences in food security, which means that hypotheses 1 and 2 cannot be accepted, as shown in Table 3. The insignificant mutual effects between food trade and food security could refer to the reverse causality problem, as observed in previous studies [29]. The reverse causality could lead to incorrect inferences, so this study will address this issue in the forthcoming section. The result shows that distance has a significant relationship with food trade and an insignificant relationship with food security; thus, we can estimate the impact of food trade on food security using distance as an instrumental variable. Moreover, In the context of hypothesis 2, the absence of a significant effect of food gaps on the formation of food trade relationships could indicate missed opportunities to address food deficiency problems through food trade cooperation.
In addition, the results show that if the distance between countries is farther by 1 percent, the volumes of food trade will decrease by 0.0394 percent. This result makes sense because countries usually import their needs from the nearest partner to reduce shipping costs. Moreover, countries achieving more agriculture value-added per capita by 1 percent have more food security by 0.2413 percent and fewer food imports by 0.0129 percent.
4.3.2. Instrumental Variables Analysis
Table 4 shows the results obtained from the application of the instrumental variables technique.
Table 4 shows the results of instrumental variable analysis, where the first model shows a significant negative effect of geographical distance on food trade. Using the predicted food trade values, a significant positive effect on the differences in food security is observed, which leads us to accept hypothesis 1. These results can be interpreted that the geographical distance between food exporters and food importers has a significant effect on food trade volumes, which significantly affects food security levels in importer countries. Table 4 also shows that a decrease in the distance between two countries by 1 percent leads to an increase in food trade by 0.039 percent, and a 1 percent increase in food trade leads to a decrease in the value of food deficit of the importer country with the exporter country, by 3.45 percent.
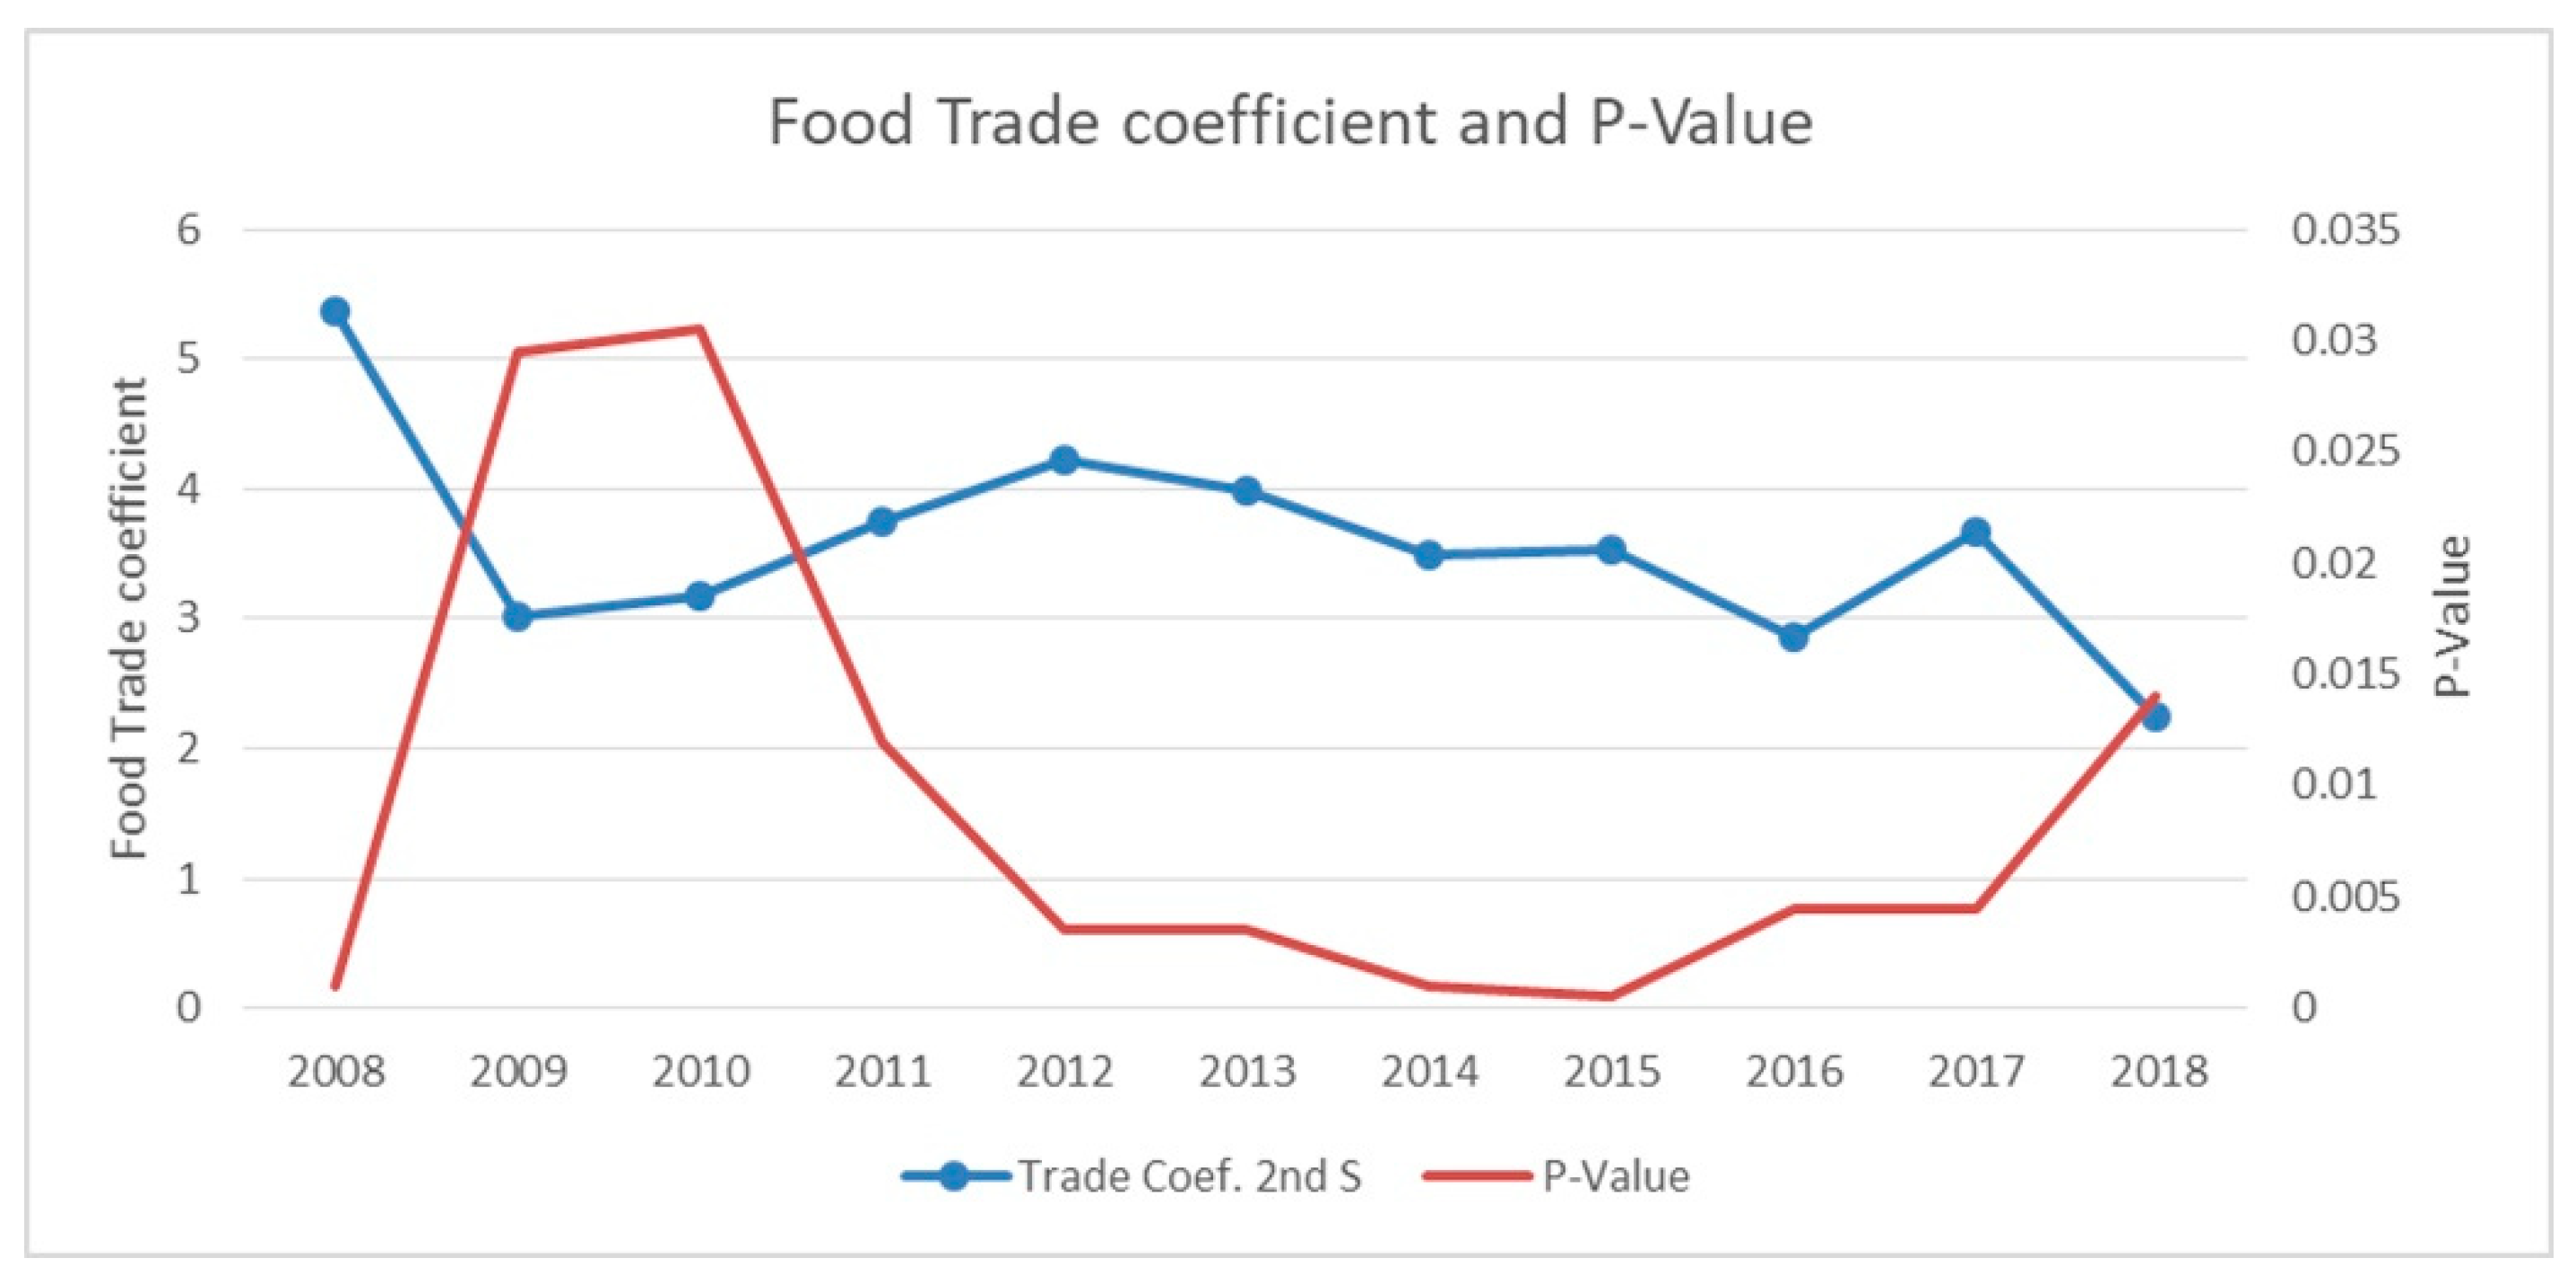
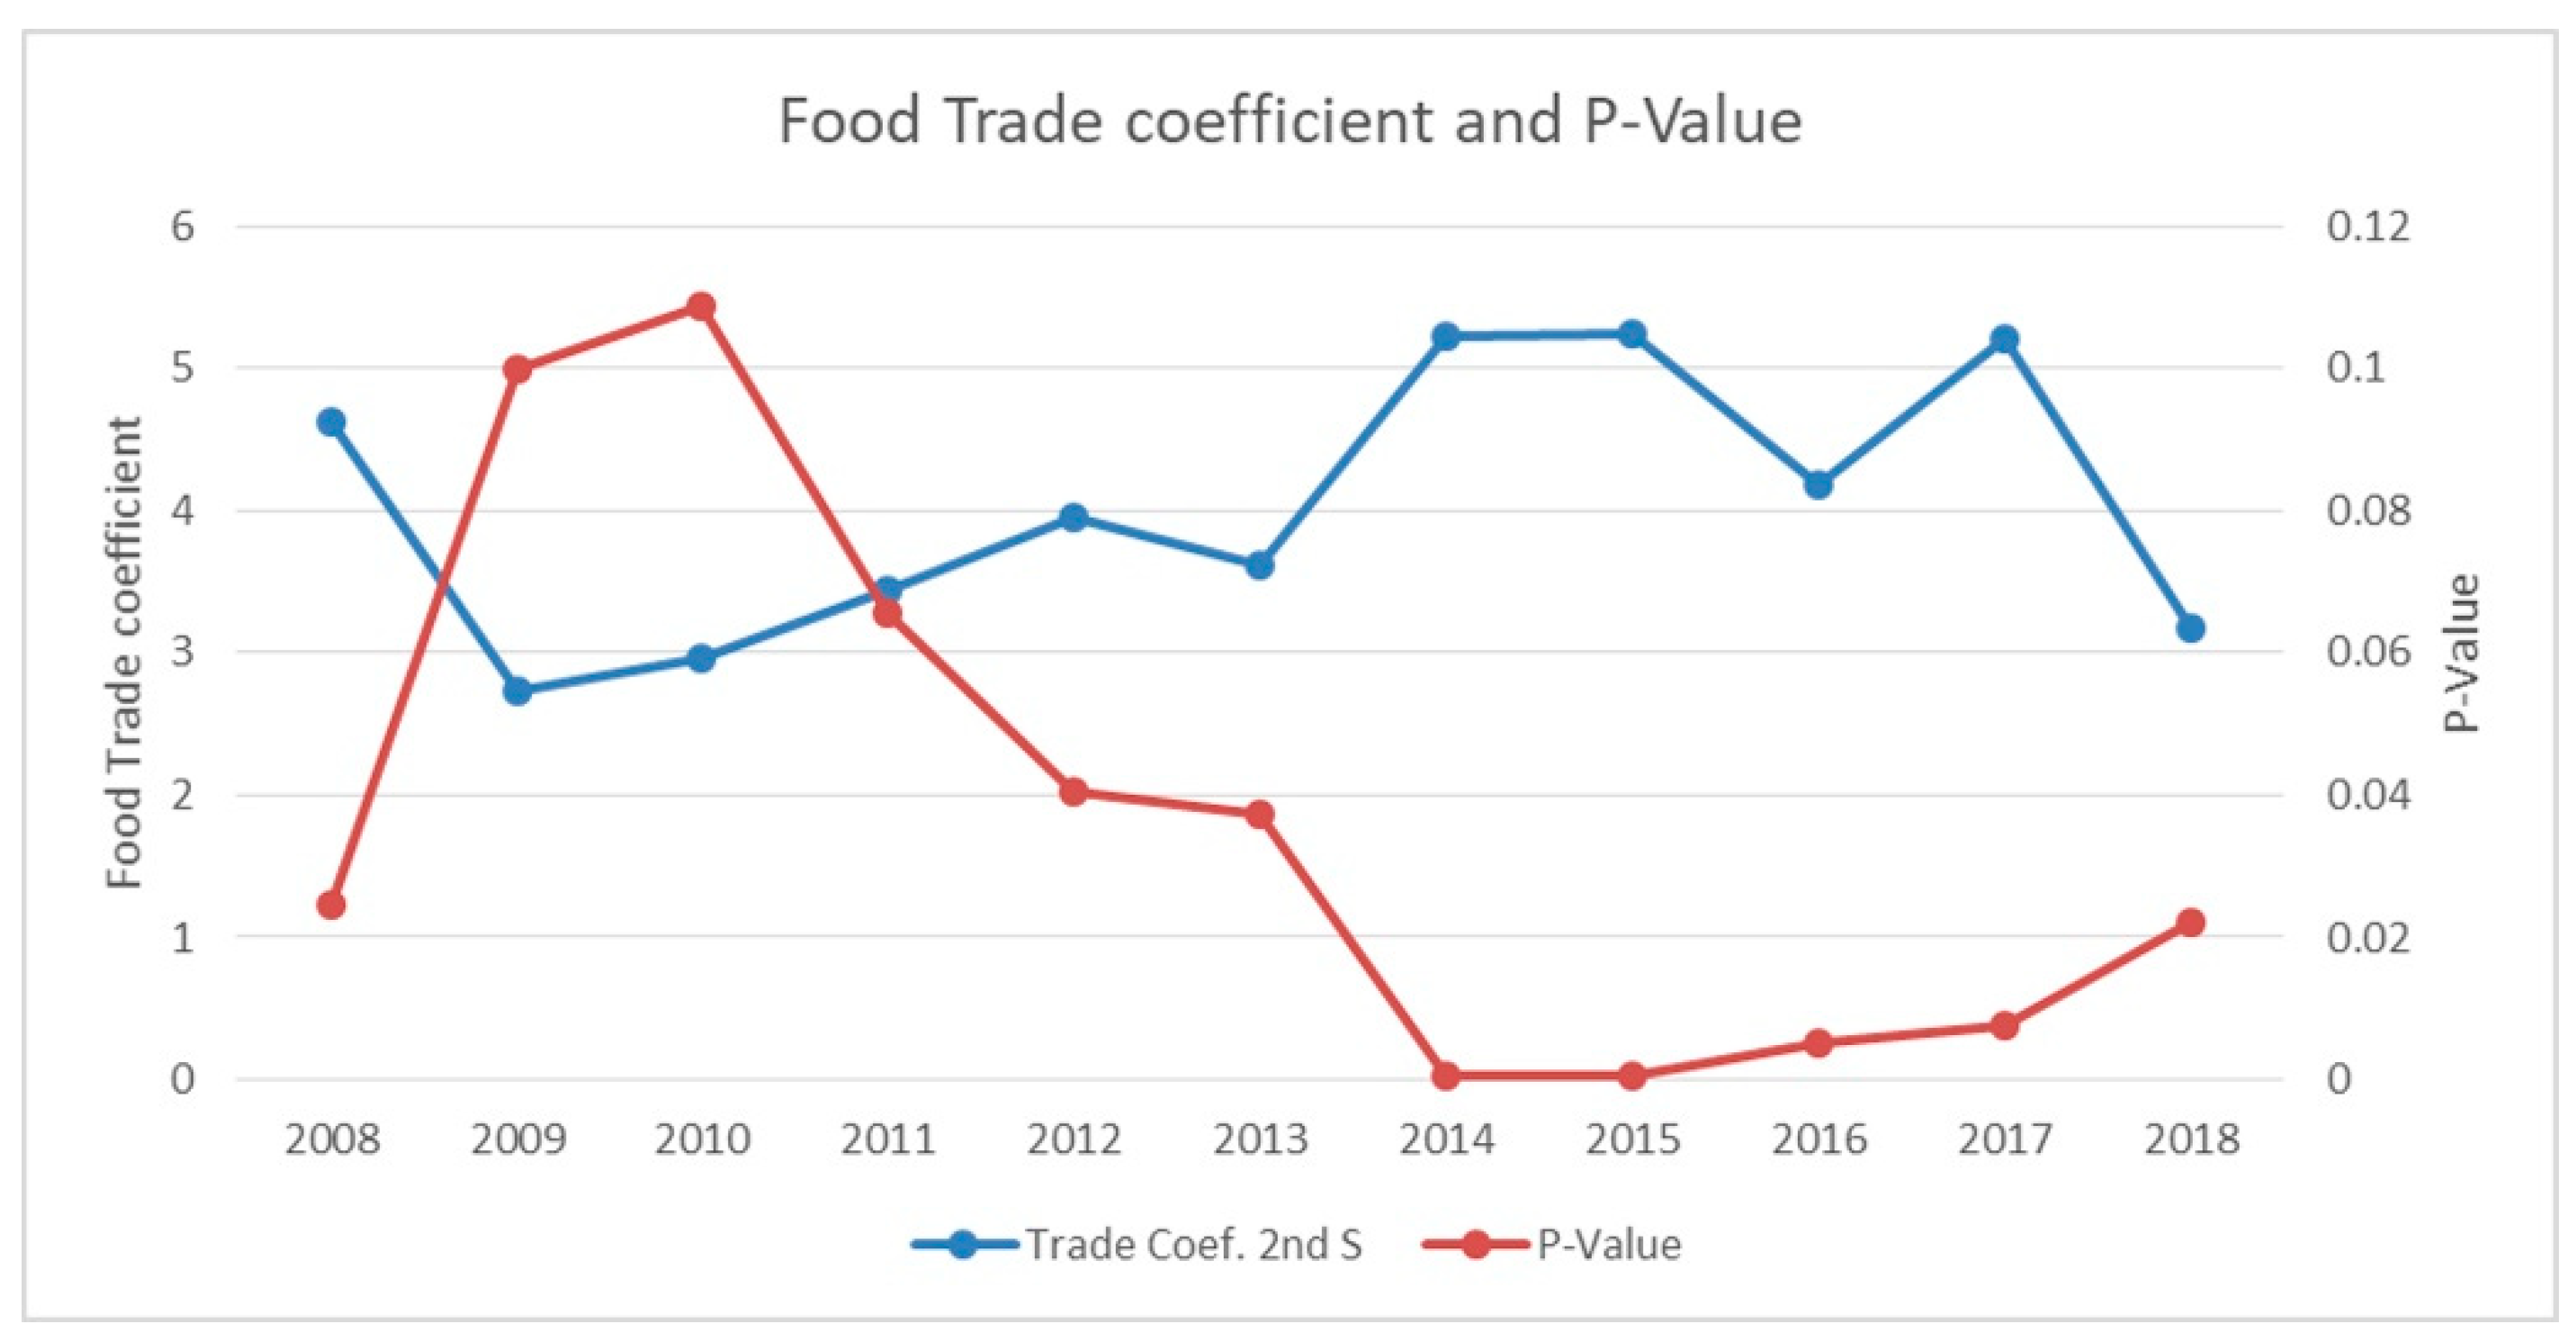
The results of applying models 7 and 8, using the data of 11 years separately, showed that the distance had a significant effect on food trade, and food trade had a significant effect on food security with the p-values less than 0.01, on average after BRI, as shown in Figure 4.
Figure 4 shows that, in general, enhancing trade relationships supported food security levels in the countries involved in the BRI. In 2008 when the world experienced a financial crisis and economic downturn, the role of food trade was very critical to overcoming global food deficiency. The results demonstrate the importance of investment in food trade infrastructure to reduce the negative effect of geographical distance on food trade and food security, especially since most food products are natural agricultural products, like fruits and vegetables, which cannot be stored for a long time. Therefore, if the surplus of food products is not optimally managed, it will be spoiled, leading to the waste of food that people need in different parts of the world. Moreover, Figure 4 shows that the p-values decrease for the greater coefficient values. In 2009, 2016, and 2018 there were remarkable declines in the effects of food trade on food security, which came along with a decrease in the number of trade partners or in the volumes of food imports in these years, as shown in Figure 3. The results indicate that the volume of food trade and the number of partners affect the relationship between food trade and food security. Consequently, when a country increases food imports and the number of food trade partners, the imports would have a much more significant role in enhancing food security.
4.3.3. Robustness Check
Given the multitude of indicators available for food security, there might be concerns about the robustness of the previous analysis. To check the robustness of our analysis, this study re-ran models 7 and 8 over 11 years using different food security indicators. The problem in choosing food security indicators is that most indicators have no data for the period between 2008 and 2018. Since this study ran the analysis for each year separately, and it standardized the data by applying Equation (1) on food security data for each year individually, then it can use different food security indicators. In robustness analysis, the research used two different indicators.
First, for the period between 2008 and 2013, this study uses food security indicators as presented in [41], where food security indicators represent the four aspects of food security according to the FAO definition. They include dietary energy supply adequacy, food production per capita variability, access to improved water sources, and access to improved sanitation facilities. To obtain one indicator of food security, this research adopts a composite indicator that can represent these four indicators together using principal component analysis (PCA). Secondly, for the period between 2014 and 2018, this study uses the Global Food Security Index (GFSI), which was created by the Economic Intelligence Unit (EIU) and sponsored by DuPont. The same as the first indicator, this index was also created according to the definition of food security established at the World Food Summit in 1996. GFSI analyses food security across three dimensions: affordability, availability, and quality and safety. Later, natural resources and resilience were incorporated into GFSI in 2017 [42].
Similar to the last analysis, Figure 5 shows that the food trade has a clear and significant positive effect on food security (except in 2010). Moreover, the food security indicator of the period between 2008 and 2013 showed close coefficient values and significance levels to those in Figure 4. From 2014 to 2018, the GFSI showed higher coefficient values with lower p-values, an indication that food trade could have a bit stronger effects on food security after launching BRI.
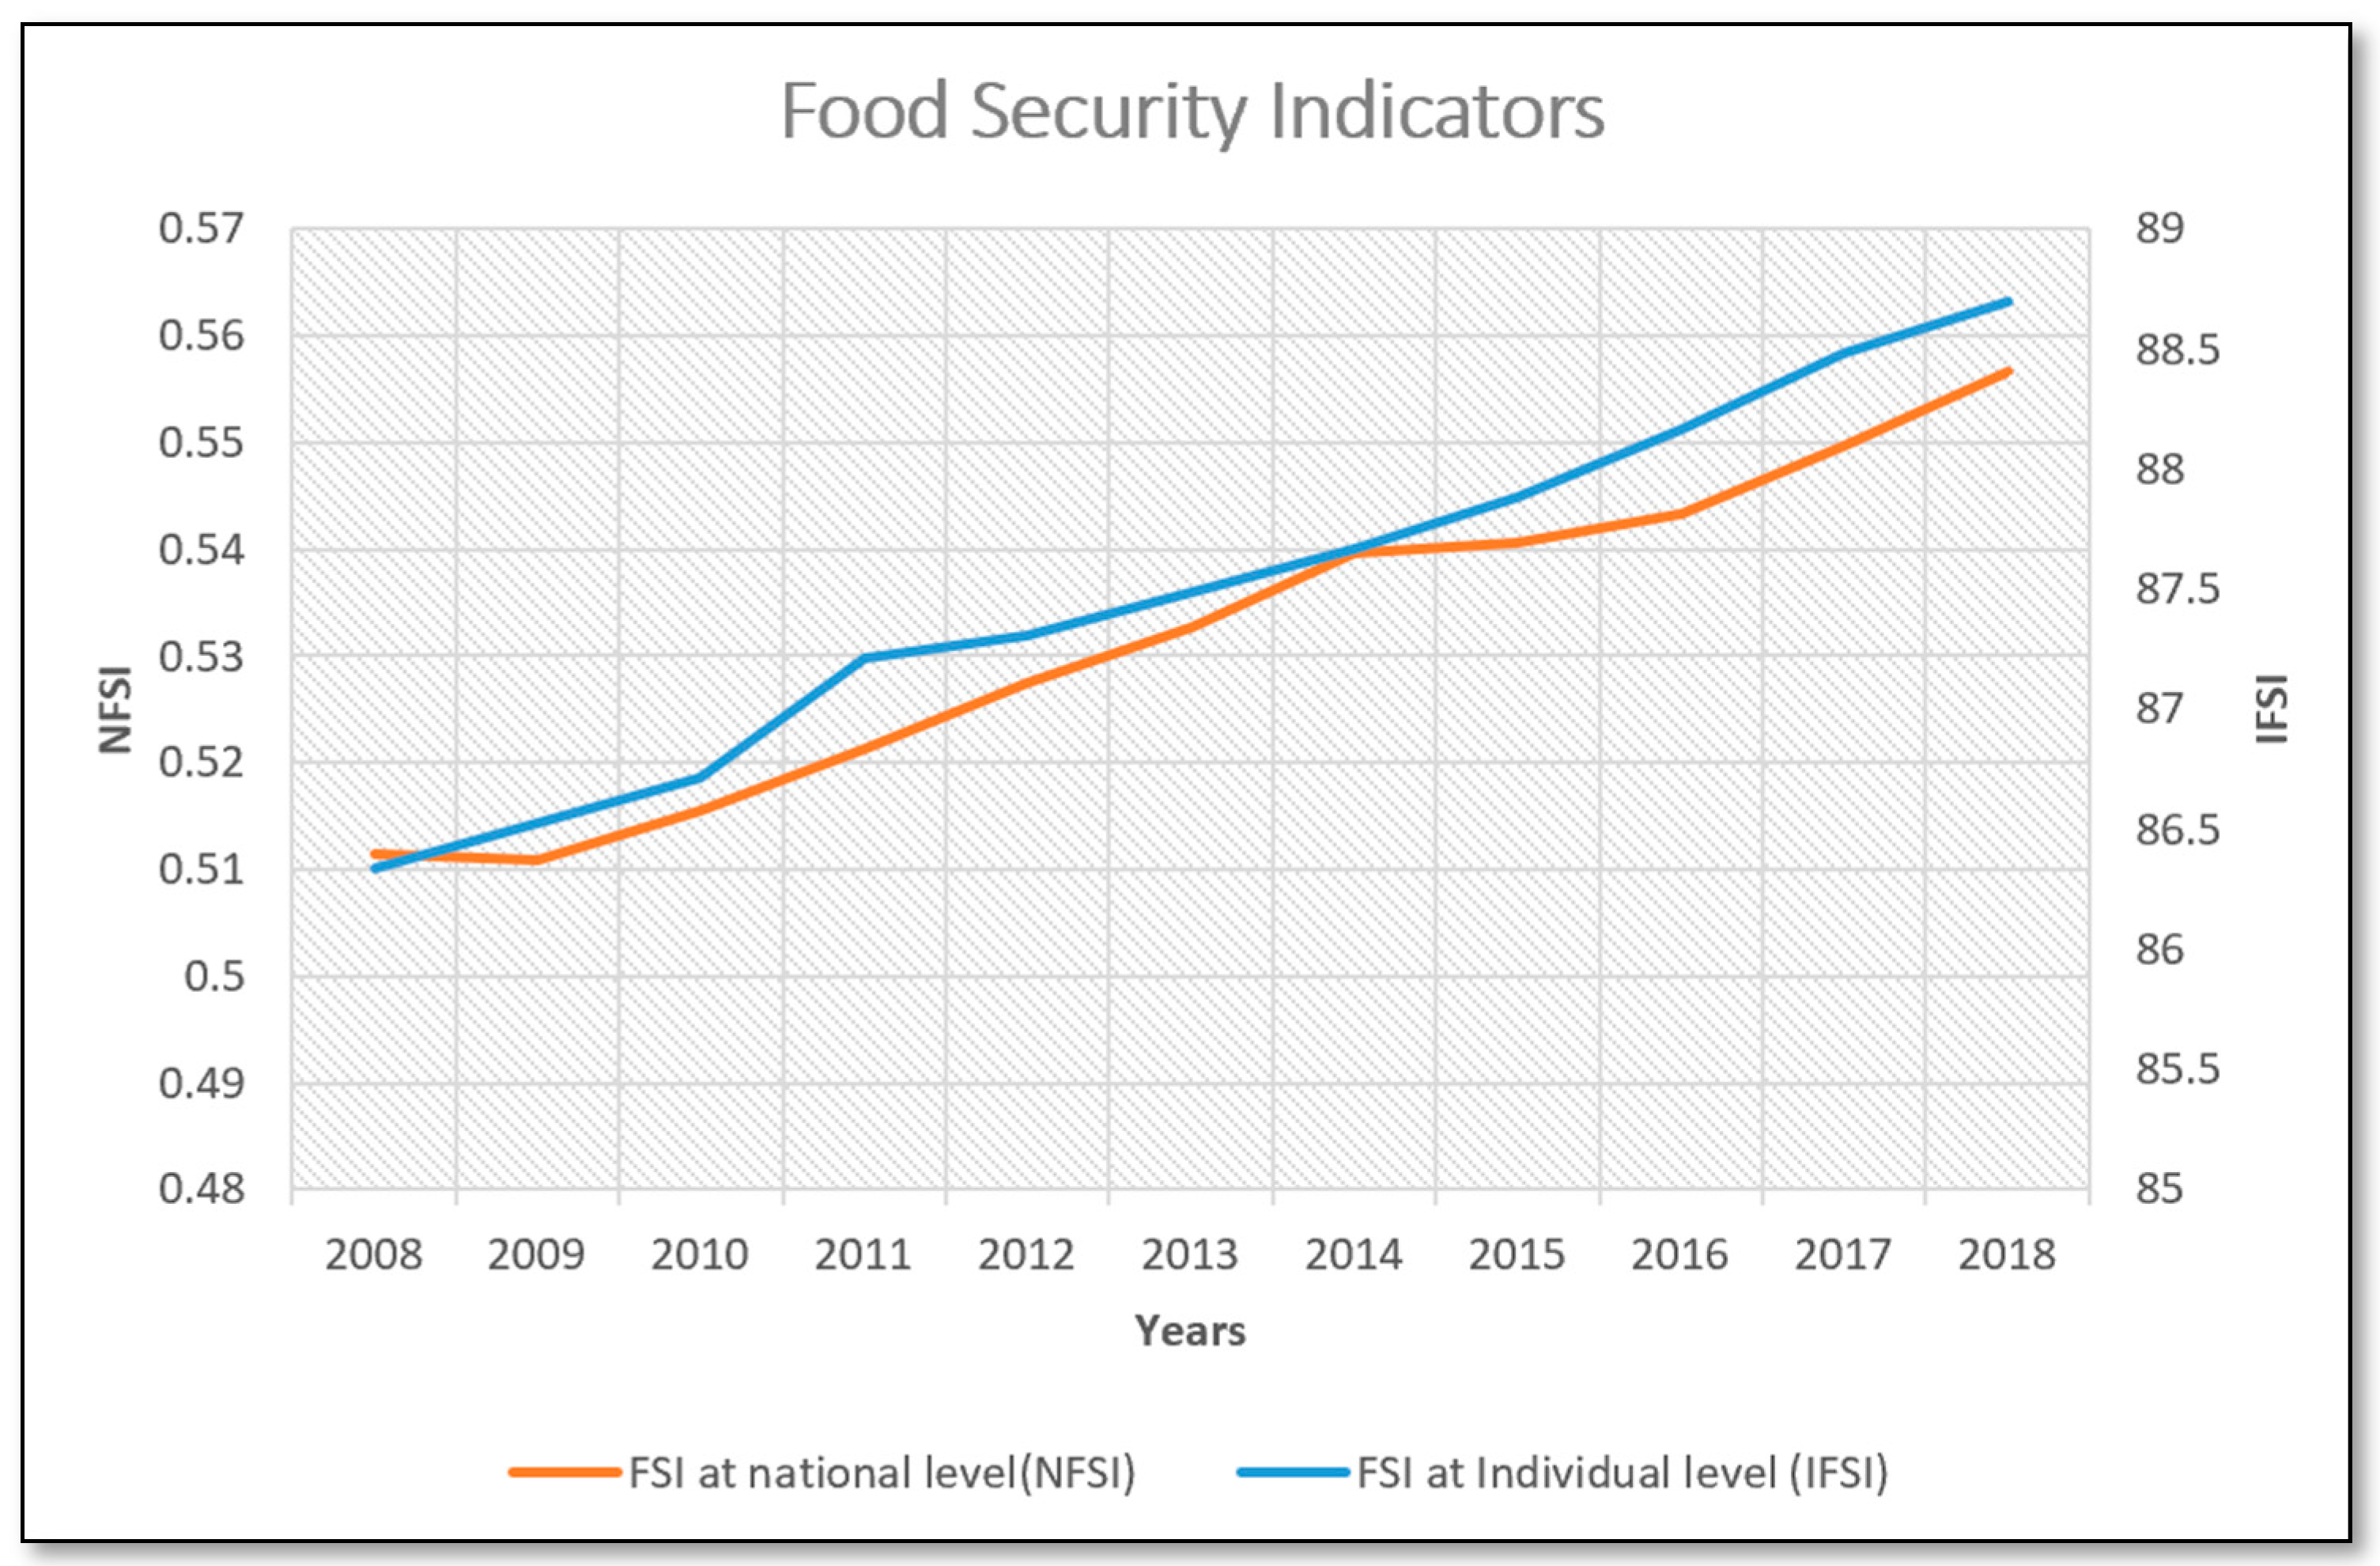
There are measures for food security at three levels: (1) national levels (e.g., food availability); (2) household level (e.g., daily meal numbers); and (3) individual level (e.g., malnutrition) [43]. For further checking of the robustness of the results, this study checked the situation of the food security indicators within BRI countries at the individual level. Food security indicators, at the individual level, include [12] (1) undernourishment (hunger) is not provided by habitual food consumption; (2) stunting, which means low in height for each age; (3) wasting, which means low in weight for each height; (4) underweight which means low in weight for each age; and (5) overweight: or obesity, and diet-related diseases. All these indicators are calculated as proportions. This study calculated the average of these five food insecurity indicators and then calculated the complement values to 100.
The results showed a perfect correlation between the food security indicator at the national level values and the food security indicator at the individual level, with a correlation coefficient value of 99%, as shown in Figure 6. These results indicate that food security at the individual level would have a positive relationship with the food trade, similar to the positive association observed between food security at the national level and the food trade.
5. Conclusions and Policy Implications
This study presented an analysis of the relationship between food trade and food security using panel data from 46 countries of BRI. This study applied the model of the complex network alongside the QAP regression model. Complex networks showed a positive relationship between food trade and food security. Moreover, the closeness centrality and the in-degree measures showed a positive relationship with food security. Thus, starting a new food trade relationship between two countries could be a result of investment in trade infrastructure, which positively affects food trade and food security in these two countries, and in many other geographically close countries, especially since the trade infrastructures have a primary role in reconfiguring foodscapes and food trade, which increases food availability and enhances food security [44]. In contrast, the instability conditions in a country negatively affect food supply chains and food security levels in that country as well as neighboring countries. QAP regression model provided more details, where it showed that the geographical distance between food exporters and food importers has a significant negative impact on food trade volumes, which significantly affects food security levels. This result supports hypothesis 1, and it is consistent with the conclusions of previous studies. On the other hand, the QAP regression model showed that the role of food security in reconfiguring the food trade network is insignificant, which does not allow us to accept hypothesis 2. The findings of this study demonstrate that cooperation through the BRI facilitates countries in overcoming challenges related to market access [8] and import liberalization [9]. These results are in line with prior research, which has shown a positive impact of agricultural merchandise trade on global food security [3,4,5,6,7]. Additionally, our study presents further analysis of the role of distance in the food trade and its implications for food security.
Regarding policy implications, this study outlines the following recommendations:
(1) The study encourages regional and international food trade cooperation initiatives to boost food security.
(2) The significant decline in food trade and food security in war-torn countries, such as Yemen, underscores the urgent need to halt conflicts. Ceasing hostilities would provide these countries with the opportunity to reestablish food trade relationships and ensure adequate nourishment for their populations. It should be noted that food aid alone has not proven to be a sustainable solution to the issue of hunger.
(3) The far-reaching impact of food trade relations on food security places a responsibility on developed countries to assist less-developed nations in eliminating food trade barriers. By doing so, significant benefits can be achieved in terms of global food security.
(4) The influence of geographical distance on food trade and food security underscores the importance of investing in the facilities and infrastructure of the food trade system.
(5) The insignificant effect of food gaps on the formation of food trade relationships indicates missed opportunities to address food deficiency problems through food trade cooperation.
While this study endeavors to comprehensively cover the relationship between food trade and food security, it does have some limitations. Firstly, the data used is relatively old, yet it remains the most recent available data for the included variables and the sampled countries. Secondly, the sample of countries included in this study represents less than half of the current number of Belt and Road Initiative (BRI) countries. Where many countries within the BRI lack the required data to be included in this study. Moreover, the BRI has recently attracted other countries that were not part of the initiative in 2018 or prior. Finally, due to the absence of a standard indicator to represent food security, this study employed what it deemed to be the most appropriate proxies for food security. However, it should be acknowledged that these limitations do not compromise the validity of this study’s conclusions. Future research should explore different food security indicators, incorporate datasets from diverse groups of countries, and employ alternative analytical techniques.
Author Contributions
Conceptualization, M.I.A. and O.A.R.; methodology, M.I.A. and O.A.R.; software, M.I.A.; validation, M.I.A., O.A.R., J.R. and H.Y.; formal analysis, M.I.A.; investigation, M.I.A.; resources, M.I.A.; data curation, M.I.A.; writing—original draft preparation, M.I.A.; writing—review and editing, M.I.A. and O.A.R.; visualization, M.I.A.; supervision, J.R. and H.Y.; project administration, J.R. and H.Y.; funding acquisition, J.R. and H.Y. All authors have read and agreed to the published version of the manuscript.
Funding
This work was supported by the Natural Science Foundation of China (grant number 71831005) and Shenzhen Humanities and Social Sciences Key Research Bases (grant number KP191001).
Institutional Review Board Statement
Not applicable.
Data Availability Statement
The data of this study is available online. All data sources are mentioned in this study.
Acknowledgments
We would like to thank the National Natural Science Foundation of China and Shenzhen Humanities and Social Sciences Key Research Bases. This work would not have been possible without their support.
Conflicts of Interest
The authors declare no conflict of interest.
Appendix A

Table A1.
Variables definitions.
| Variables | Definition | Source |
|---|---|---|
| Dietary Energy Supply | The dietary energy supply is a percentage of the average dietary energy requirement in each country (3-year average). | FAOSTAT http://www.fao.org/economic/ess/ess-fs/ess-fadata/en/#.YDTUhugza00. accessed on 1 June 2023. |
| GDP PC PPP | Gross domestic product per capita (in purchasing power equivalent) | |
| Political Stability | Political stability indicator (the absence of violence/terrorism) | |
| Using Basic Drinking Water | The Percentage of the population using at least basic drinking water services | |
| Access to Water | The percentage of the population with access to an improved water source. | |
| Food Production Variability | The total value of annual food production variability, in International Dollars divided by the total population (kcal/capita/day) (I$ per person constant 2004-06) (3-year average) | |
| Access to Facilities | The percentage of the population with access to improved sanitation facilities. | |
| Wasting | Percentage of children under 5 years affected by wasting (percent) | |
| Overweight | Percentage of children under 5 years of age who are overweight (modeled estimates) (percent) | |
| Stunting | Percentage of children under 5 years of age who are stunted (modeled estimates) (percent) | |
| Undernourishment | Prevalence of undernourishment (percent) (3-year average) | |
| GFSI | Global Food Security Index | https://foodsecurityindex.eiu.com. Accessed on 1 January 2023. |
| F_Trade | The imports volume of Processed food and agro-based products in US Dollars | International Trade Centre (ITC) https://www.trademap.org. Accessed on 1 January 2021. |
| Distance | The distances in kilometers between sampled countries | CEPII http://www.cepii.fr/CEPII/en/welcome.asp. accessed on 1 January 2023. |
| GDPPC | GDP per capita (current USD) | World Bank |
| AgrPC | Agriculture value added per capita, computed by authors based on World Bank data (current USD) |
Appendix B
Table A2.
List of countries.
| Id | ISO3 | Country Name | Id | ISO3 | Country Name | Id | ISO3 | Country Name |
|---|---|---|---|---|---|---|---|---|
| 1 | AUT | Austria | 17 | KOR | South Korea | 33 | SAU | Saudi Arabia |
| 2 | AZE | Azerbaijan | 18 | KWT | Kuwait | 34 | SEN | Senegal |
| 3 | BGD | Bangladesh | 19 | LAO | Lao PDR | 35 | SVN | Slovakia |
| 4 | BLR | Belarus | 20 | MDG | Madagascar | 36 | ZAF | South Africa |
| 5 | BOL | Bolivia | 21 | MYS | Malaysia | 37 | LKA | Sri Lanka |
| 6 | BGR | Bulgaria | 22 | MAR | Morocco | 38 | TJK | Tajikistan |
| 7 | KHM | Cambodia | 23 | MMR | Myanmar | 39 | THA | Thailand |
| 8 | CHN | China | 24 | NPL | Nepal | 40 | TUN | Tunisia |
| 9 | CZE | Czech Republic | 25 | OMN | Oman | 41 | TUR | Turkey |
| 10 | EGY | Egypt | 26 | PAK | Pakistan | 42 | UKR | Ukraine |
| 11 | ETH | Ethiopia | 27 | PAN | Panama | 43 | ARE | United Arab Emirates |
| 12 | HUN | Hungary | 28 | PHL | Philippines | 44 | UZB | Uzbekistan |
| 13 | IND | India | 29 | POL | Poland | 45 | VNM | Viet Nam |
| 14 | IDN | Indonesia | 30 | ROU | Romania | 46 | YEM | Yemen |
| 15 | JOR | Jordan | 31 | RUS | Russian Federation | |||
| 16 | KAZ | Kazakhstan | 32 | RWA | Rwanda |
References
- Micha, R.; Mannar, V.; Afshin, A.; Allemandi, L.; Baker, P.; Battersby, J.; Bhutta, Z.; Chen, K.; Corvalan, C.; Di Cesare, M. 2020 Global Nutrition Report: Action on Equity to End Malnutrition; Development Initiatives Poverty Research: Bristol, UK, 2020. [Google Scholar]
- Oyejide, T.A. Trade policy and sustainable human development in Africa. In The African Regional Policy Dialogue Held in Windhoek, Namibia; UNCTAD: Geneva, Switzerland, 2001. [Google Scholar]
- Maasdorp, G. Regional trade and food security in SADC. Food Policy 1998, 23, 505–518. [Google Scholar] [CrossRef]
- Tsui, T.S.; Wall, R.; Stavropoulos, S. A Beer Index for International Food Security? In International Institute of Urban Management; Erasmus University Rotterdam: Rotterdam, The Netherlands, 2014. [Google Scholar]
- Zakaria, M.; Xi, J. Food security in south Asian countries: 1972 to 2013. Afr. Asian Stud. 2014, 13, 479–503. [Google Scholar] [CrossRef]
- Baye, S. Assessing Trade Liberalisation on Food Security in Sub-Saharan Africa (SSA); University Of Ghana: Accra, Ghana, 2016. [Google Scholar]
- Pasara, M.T.; Diko, N. The Effects of AfCFTA on Food Security Sustainability: An Analysis of the Cereals Trade in the SADC Region. Sustainability 2020, 12, 1419. [Google Scholar] [CrossRef] [Green Version]
- Verter, N. The application of international trade theories to agriculture. Mediterr. J. Soc. Sci. 2015, 6, 209–219. [Google Scholar] [CrossRef] [Green Version]
- Walls, H.; Richard, S.; Cuevas, S.; Hanefeld, J. International trade and investment: Still the foundation for tackling nutrition related non-communicable diseases in the era of Trump? BMJ J. 2019, 365, l2217. [Google Scholar] [CrossRef] [Green Version]
- Arcesati, R. Is the belt and road a food security plan. Belt Road Advis. 2018, 2018. Available online: https://beltandroad.ventures/beltandroadblog/agriculturesilkroad (accessed on 15 June 2023).
- FAO. Rome Declaration on World Food Security and World Food Summit Plan of Action: World Food Summit 13–17 November 1996, Rome, Italy; FAO: Rome, Italy, 1996. [Google Scholar] [CrossRef]
- FAO. Food Security. In Policy Brief; FAO: Rome, Italy, 2006. [Google Scholar]
- Yaro, J.A. Theorizing food insecurity: Building a livelihood vulnerability framework for researching food insecurity. Nor. Geogr. Tidsskr.-Nor. J. Geogr. 2006, 58, 23–37. [Google Scholar] [CrossRef]
- Carolan, M.S. Reclaiming Food Security; Routledge: London, UK, 2013. [Google Scholar] [CrossRef]
- Vivero Pol, J.L. Food as a commons: Reframing the narrative of the food system. In Social Science Research Network; Centre for Philosophy of Law, Université Catholique de Louvain: Louvain, Belgium, 2013. [Google Scholar]
- Yao, H.; Alhussam, M.I.; Abu Risha, O.; Memon, B.A. Analyzing the Relationship between Agricultural FDI and Food Security: Evidence from Belt and Road Countries. Sustainability 2020, 12, 2906. [Google Scholar] [CrossRef] [Green Version]
- Alhussam, M.I.; Yao, H.; Abu Risha, O. The impact of scholarship inflows on achieving food security: What can Bayesian networks tell us? Appl. Econ. 2020, 53, 2486–2499. [Google Scholar] [CrossRef]
- Rosset, P. Food sovereignty: Global rallying cry of farmer movements. Food First Backgrounder 2003, 9, 4. [Google Scholar]
- Burnett, K.; Murphy, S. What place for international trade in food sovereignty? J. Peasant Stud. 2014, 41, 1065–1084. [Google Scholar] [CrossRef]
- Jansen, K. The debate on food sovereignty theory: Agrarian capitalism, dispossession and agroecology. J. Peasant Stud. 2014, 42, 213–232. [Google Scholar] [CrossRef]
- Buzby, J.C. International Trade and Food Safety: Economic Theory and Case Studies; Citeseer: University Park, PA, USA, 2003. [Google Scholar]
- Henson, S.; Jaffee, S. Food safety standards and trade: Enhancing competitiveness and avoiding exclusion of developing countries. Eur. J. Dev. Res. 2006, 18, 593–621. [Google Scholar] [CrossRef]
- Nin-Pratt, A.; Diao, X.; Bahta, Y. Assessing potential welfare impacts on agriculture of a regional free trade agreement in Southern Africa. In Proceedings of the Southern Africa Regional Conference on Agriculture, Gaborone, Botswana, 8–9 December 2008; pp. 8–9. [Google Scholar]
- García-Dorado, S.C.; Cornselsen, L.; Smith, R.; Walls, H. Economic globalization, nutrition and health: A review of quantitative evidence. Glob. Health 2019, 15, 15. [Google Scholar] [CrossRef] [PubMed] [Green Version]
- Cuevas García-Dorado, S. The Nutritional and Economic Effects of Palm Oil Trade Liberalisation in India: A Policy Analysis. Ph.D. Thesis, London School of Hygiene & Tropical Medicine, London, UK, 2019. [Google Scholar]
- Gleeson, D.; Labonté, R. Commodities Harmful to Health. In Trade Agreements and Public Health; Springer: Singapore, 2020. [Google Scholar] [CrossRef]
- FAO. [Dataset]FAOSTAT. Food Security Data; FAO: Rome, Italy, 2018. [Google Scholar]
- Dithmer, J.; Abdulai, A. Does trade openness contribute to food security? A dynamic panel analysis. Food Policy 2017, 69, 218–230. [Google Scholar] [CrossRef]
- Mary, S. Hungry for free trade? Food trade and extreme hunger in developing countries. Food Secur. 2019, 11, 461–477. [Google Scholar] [CrossRef]
- De Benedictis, L.; Nenci, S.; Santoni, G.; Tajoli, L.; Vicarelli, C. Network Analysis of World Trade using the BACI-CEPII dataset. Glob. Econ. J. 2014, 14, 287–343. [Google Scholar] [CrossRef]
- Fagiolo, G.; Reyes, J.; Schiavo, S. On the topological properties of the world trade web: A weighted network analysis. Phys. A Stat. Mech. Its Appl. 2008, 387, 3868–3873. [Google Scholar] [CrossRef] [Green Version]
- Bhattacharya, K.; Mukherjee, G.; Saramäki, J.; Kaski, K.; Manna, S.S. The international trade network: Weighted network analysis and modelling. J. Stat. Mech. Theory Exp. 2008, 2008, P02002. [Google Scholar] [CrossRef]
- Chatterjee, A.; Chakrabarti, B.K. Econophysics of Markets and Business Networks; Springer: Berlin/Heidelberg, Germany, 2007; Volume 27. [Google Scholar]
- Bhattacharya, K.; Mukherjee, G.; Manna, S. The international trade network. In Econophysics of Markets and Business Networks; Springer: Berlin/Heidelberg, Germany, 2007. [Google Scholar] [CrossRef] [Green Version]
- Freeman, L.C. Centrality in social networks conceptual clarification. Soc. Netw. 1978, 1, 215–239. [Google Scholar] [CrossRef] [Green Version]
- Du, R.; Wang, Y.; Dong, G.; Tian, L.; Liu, Y.; Wang, M.; Fang, G. A complex network perspective on interrelations and evolution features of international oil trade, 2002–2013. Appl. Energy 2017, 196, 142–151. [Google Scholar] [CrossRef]
- Savić, M.; Ivanović, M.; Jain, L.C. Complex Networks in Software, Knowledge, and Social Systems; Springer: Berlin/Heidelberg, Germany, 2019. [Google Scholar] [CrossRef]
- He, Q.; Cao, X. Pattern and Influencing Factors of Foreign Direct Investment Networks between Countries along the “Belt and Road” Regions. Sustainability 2019, 11, 4724. [Google Scholar] [CrossRef] [Green Version]
- Simpson, W. The quadratic assignment procedure (QAP). In Proceedings of the North American Stata Users’ Group Meetings 2001, Boston, MA, USA, 12–13 March 2001. [Google Scholar]
- Torreggiani, S.; Mangioni, G.; Puma, M.J.; Fagiolo, G. Identifying the community structure of the food-trade international multi-network. Environ. Res. Lett. 2018, 13, 054026. [Google Scholar] [CrossRef]
- Ben Slimane, M.; Huchet-Bourdon, M.; Zitouna, H. The role of sectoral FDI in promoting agricultural production and improving food security. Int. Econ. 2016, 145, 50–65. [Google Scholar] [CrossRef]
- EIU. 2018 Global Food Security Index Model; The Economist Group: London, UK, 2018. [Google Scholar]
- INDDEXProject. Data4Diets: Building blocks for diet-related food security analysis. In USAID Advancing Nutrition; Tufts University: Boston, MA, USA, 2018. [Google Scholar]
- Moragues-Faus, A.; Marsden, T.; Adlerová, B.; Hausmanová, T. Building Diverse, Distributive, and Territorialized Agrifood Economies to Deliver Sustainability and Food Security. Econ. Geogr. 2020, 96, 219–243. [Google Scholar] [CrossRef]
Figure 1.
Food security levels in study sample countries (average from 2008 to 2018). This graph was prepared by the authors using the research data.
Figure 1.
Food security levels in study sample countries (average from 2008 to 2018). This graph was prepared by the authors using the research data.

Figure 2.
The Processed Food and Agro-Based Products Trade Network in 2008 and 2018 (before and after BRI). In this panel, the size of the vertices is proportional to the number of inflows, and the color of the vertices is proportional to the food security level, where the brighter color represents a higher level of food security. The width of edges that connect between vertices is proportional to the volume of food imports between countries.

Figure 3.
Food security and its relationship with food trade network centrality measures. Food security relationship with in-degree measure (A). Food security relationship with closeness centrality measure (B). Food security relationship with betweenness centrality measure (C). Food security relationship with food trade (D).

Figure 4.
Coefficient and p-values of food trade.

Figure 5.
Coefficients and p-values of food trade using different food security indicators.

Figure 6.
The relationship between food security indicators at national and individual levels.

Table 1.
Summary Statistics.
| Variable | Obs. | Mean | Std. Dev. | Min | Max |
|---|---|---|---|---|---|
| AgrPC | 46 | 404.959 | 197.072 | 117.4082 | 964.0265 |
| FSI | 46 | 0.531774 | 0.166539 | 0.087746 | 0.920022 |
| GDPPC | 46 | 9304.964 | 11,530.58 | 440.0452 | 48,819.04 |
| Distance | 2116 | 5800.685 | 3667.091 | 215.6626 | 19,276.41 |
| Trade | 1913 | 48,724.3 | 222,739.4 | 0 | 5,433,066 |
Table 2.
Pearson Correlation Test.
| Variable | 1 | 2 | 3 | 4 | 5 |
|---|---|---|---|---|---|
| (1) AgrPC | 1 *** | ||||
| (2) FSI | 0.521 *** | 1 *** | |||
| (3) GDPPC | 0.286 ** | 0.791 *** | 1 *** | ||
| (4) Distance | 0 | 0 | 0 | 1 *** | |
| (5) Trade | −0.059 * | 0.004 | 0.026 | −0.154 *** | 1 *** |
Standard errors in parentheses *** p < 0.01, ** p < 0.05, * p < 0.1.
Table 3.
QAP regression.
| Variable | Food Security | Food trade |
|---|---|---|
| FSI | 0.0027 | |
| 0.0131 | ||
| (0.0116) | ||
| Trade | 0.0180 | |
| 0.0037 | ||
| (0.07595) | ||
| AgrPC | 0.2413 *** | −0.0126 *** |
| 0.3049 *** | −0.0771 *** | |
| (0.0339) | (0.0055) | |
| Gdppc | 0.4971 *** | 0.0054 |
| 0.7109 *** | 0.0371 | |
| (0.0419) | (0.0071) | |
| Distance | −0.0048 | −0.0394 *** |
| −0.0038 | −0.1541 *** | |
| (0.0315) | (0.0064) | |
| Intercept | 0.0006 *** | 0.0109 *** |
| 0.0000 *** | 0.0000 *** | |
| (0.00000) | (0.0000) | |
| Obs. | 1913 | 1913 |
| Adj. R2 | 0.7239 | 0.0273 |
Each variable has two coefficient values, which are unstandardized coefficient values and standardized coefficient values, respectively. Standard errors in parentheses *** p < 0.01.
Table 4.
Instrumental Variable Analysis with QAP Regression.
| Variable | First Stage (Food Trade) | Second Stage (Food Security) |
|---|---|---|
| Gdppc | 0.0036 | |
| 0.0251 | ||
| (0.0040) | ||
| Distance | −0.0394 *** | |
| −0.1541 *** | ||
| (0.0065) | ||
| AgrPC | 0.4003 *** | |
| 0.5059 *** | ||
| (0.051) | ||
| Trade_hat | 3.4470 *** | |
| 0.1112 *** | ||
| (1.3525) | ||
| Intercept | 0.0109 *** | 0.0008 *** |
| 0.0000 *** | 0.0000 *** | |
| (0.0000) | (0.0000) | |
| Obs. | 1913 | 1913 |
| Adj. R2 | 0.0234 | 0.2730 |
Each variable has two coefficient values, which are the unstandardized coefficient value and the standardized coefficient value, respectively. Standard errors in parentheses *** p < 0.01.
Disclaimer/Publisher’s Note: The statements, opinions and data contained in all publications are solely those of the individual author(s) and contributor(s) and not of MDPI and/or the editor(s). MDPI and/or the editor(s) disclaim responsibility for any injury to people or property resulting from any ideas, methods, instructions or products referred to in the content. |
© 2023 by the authors. Licensee MDPI, Basel, Switzerland. This article is an open access article distributed under the terms and conditions of the Creative Commons Attribution (CC BY) license (https://creativecommons.org/licenses/by/4.0/).
Share and Cite
MDPI and ACS Style
Alhussam, M.I.; Ren, J.; Yao, H.; Abu Risha, O. Food Trade Network and Food Security: From the Perspective of Belt and Road Initiative. Agriculture 2023, 13, 1571. https://doi.org/10.3390/agriculture13081571
AMA Style
Alhussam MI, Ren J, Yao H, Abu Risha O. Food Trade Network and Food Security: From the Perspective of Belt and Road Initiative. Agriculture. 2023; 13(8):1571. https://doi.org/10.3390/agriculture13081571
Chicago/Turabian StyleAlhussam, Mohammed Ismail, Jifan Ren, Hongxing Yao, and Omar Abu Risha. 2023. "Food Trade Network and Food Security: From the Perspective of Belt and Road Initiative" Agriculture 13, no. 8: 1571. https://doi.org/10.3390/agriculture13081571
Note that from the first issue of 2016, this journal uses article numbers instead of page numbers. See further details here.