
Characterization of Particle Size Distributions and Water-Soluble Ions in Particulate Matter Measured at a Broiler Farm
 , , ,
, , ,
Abstract
:1. Introduction
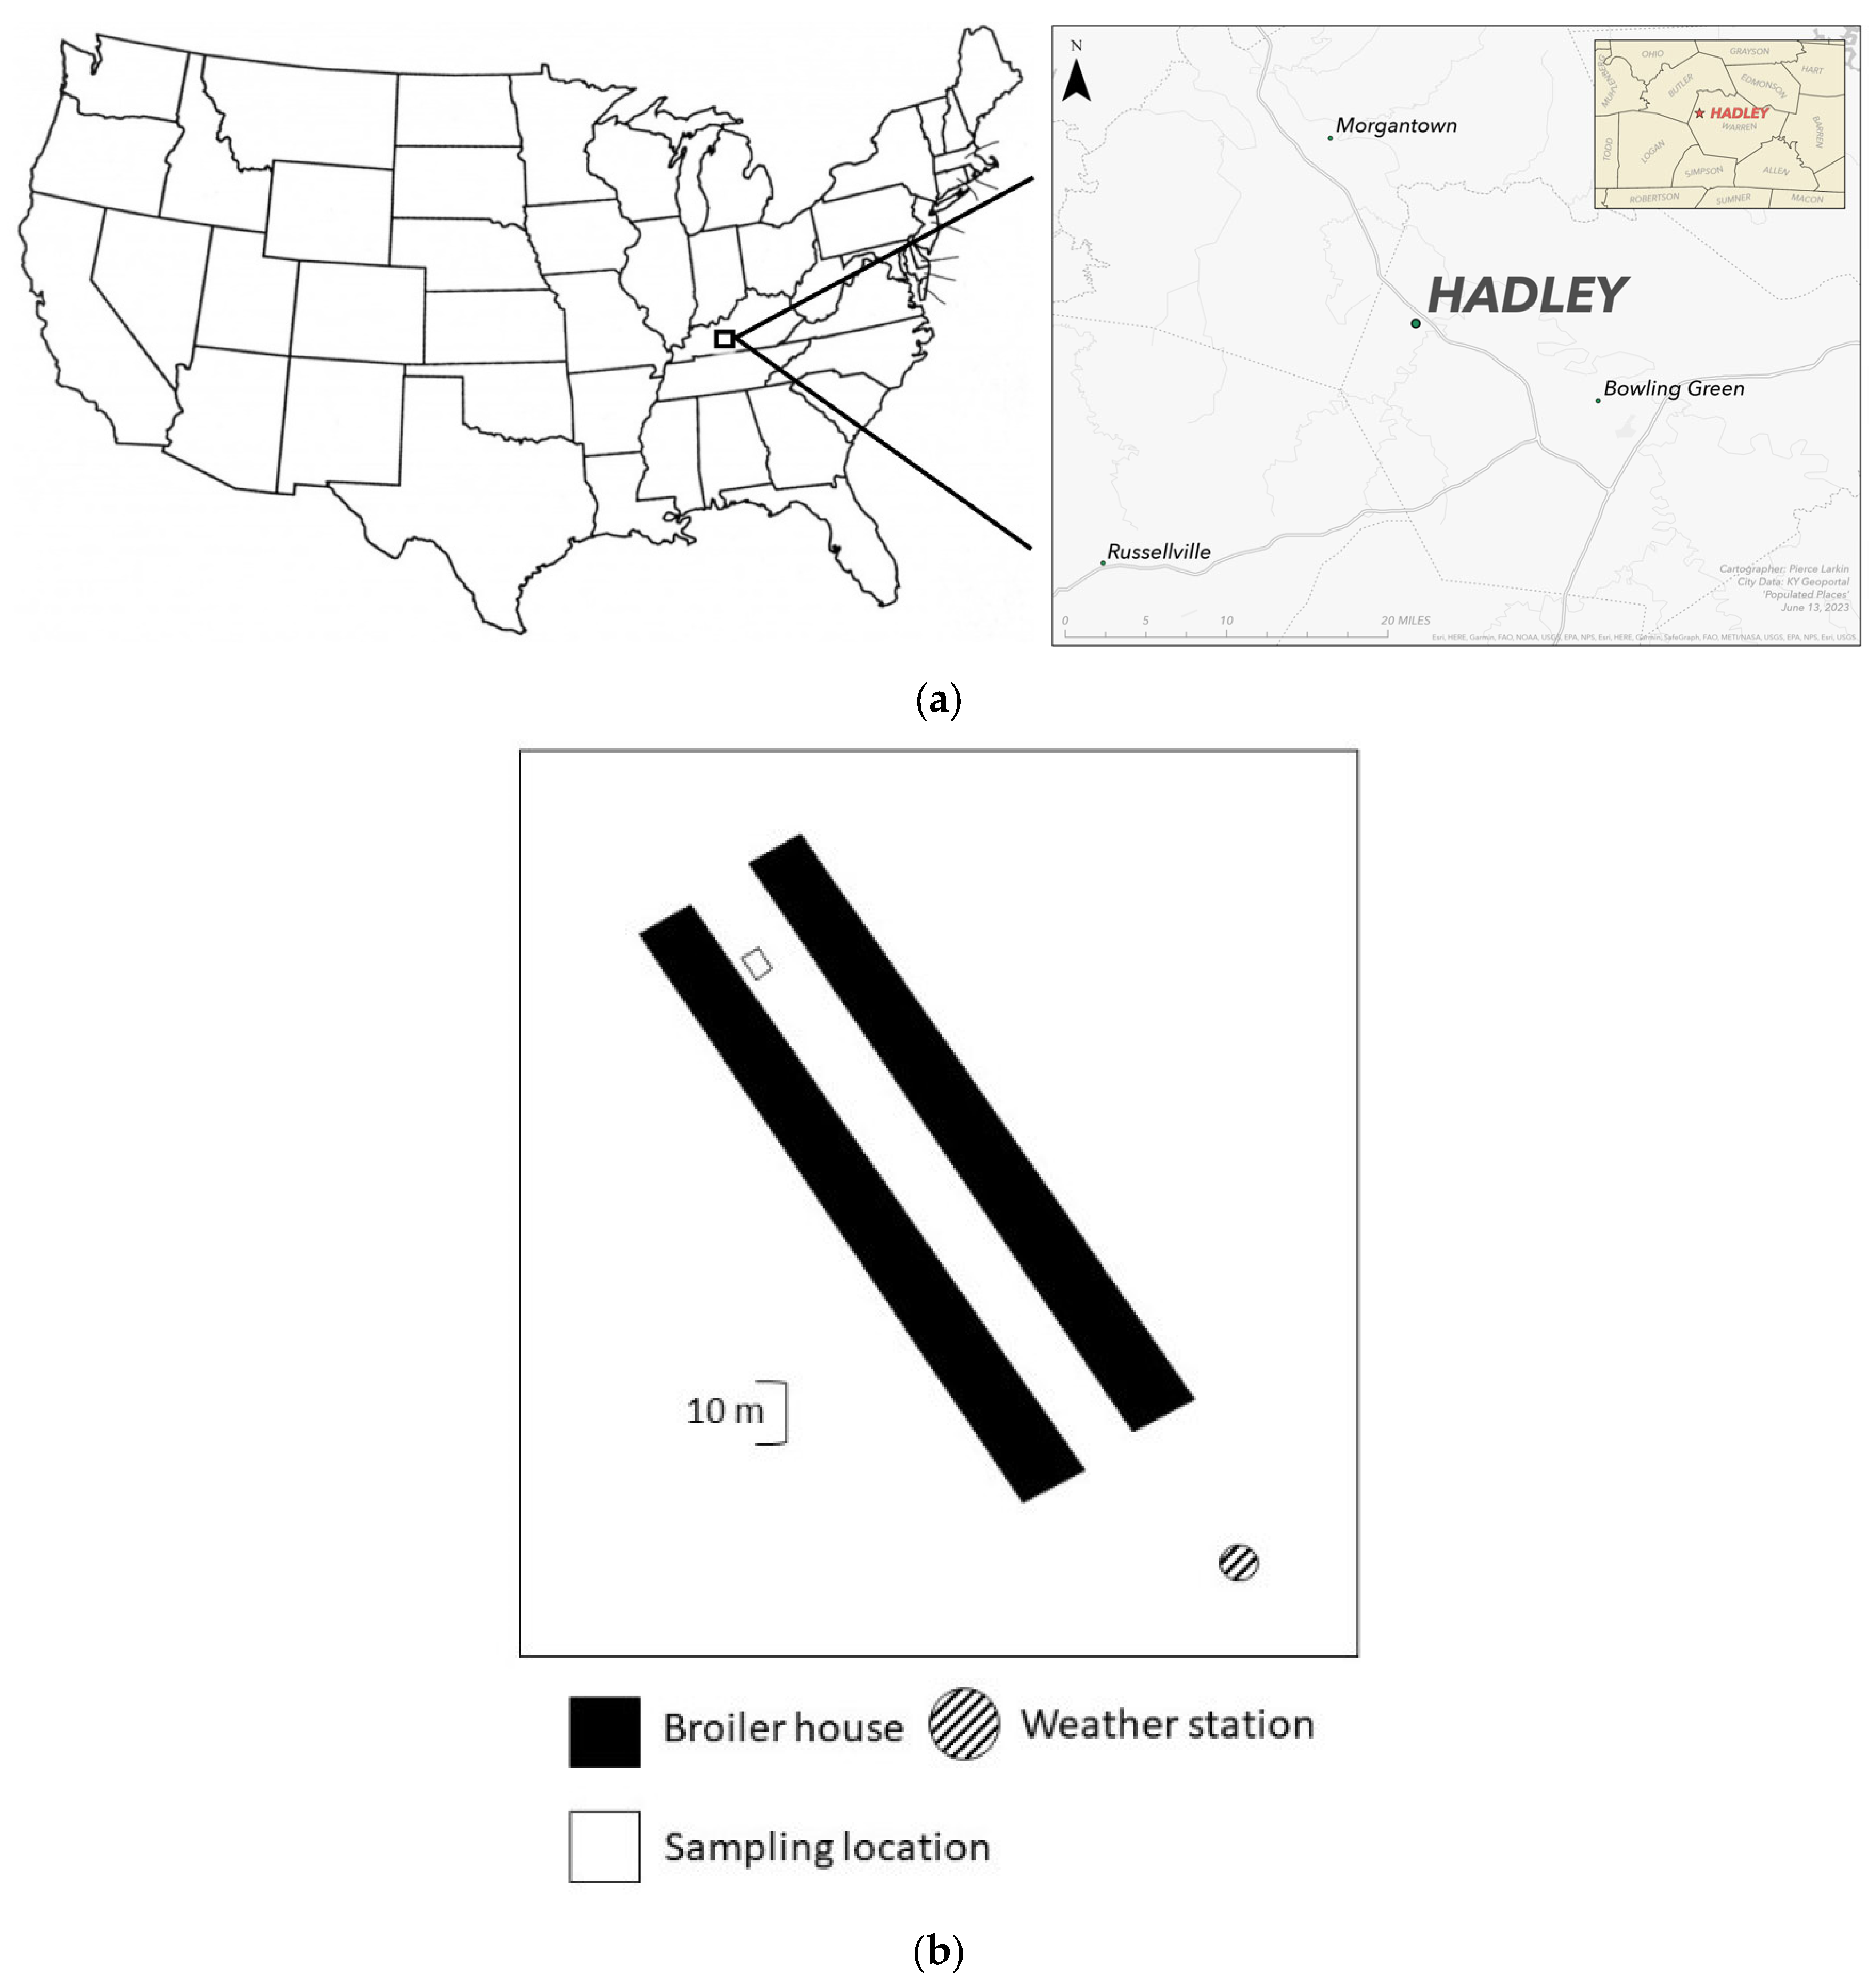
2. Materials and Methods
3. Results
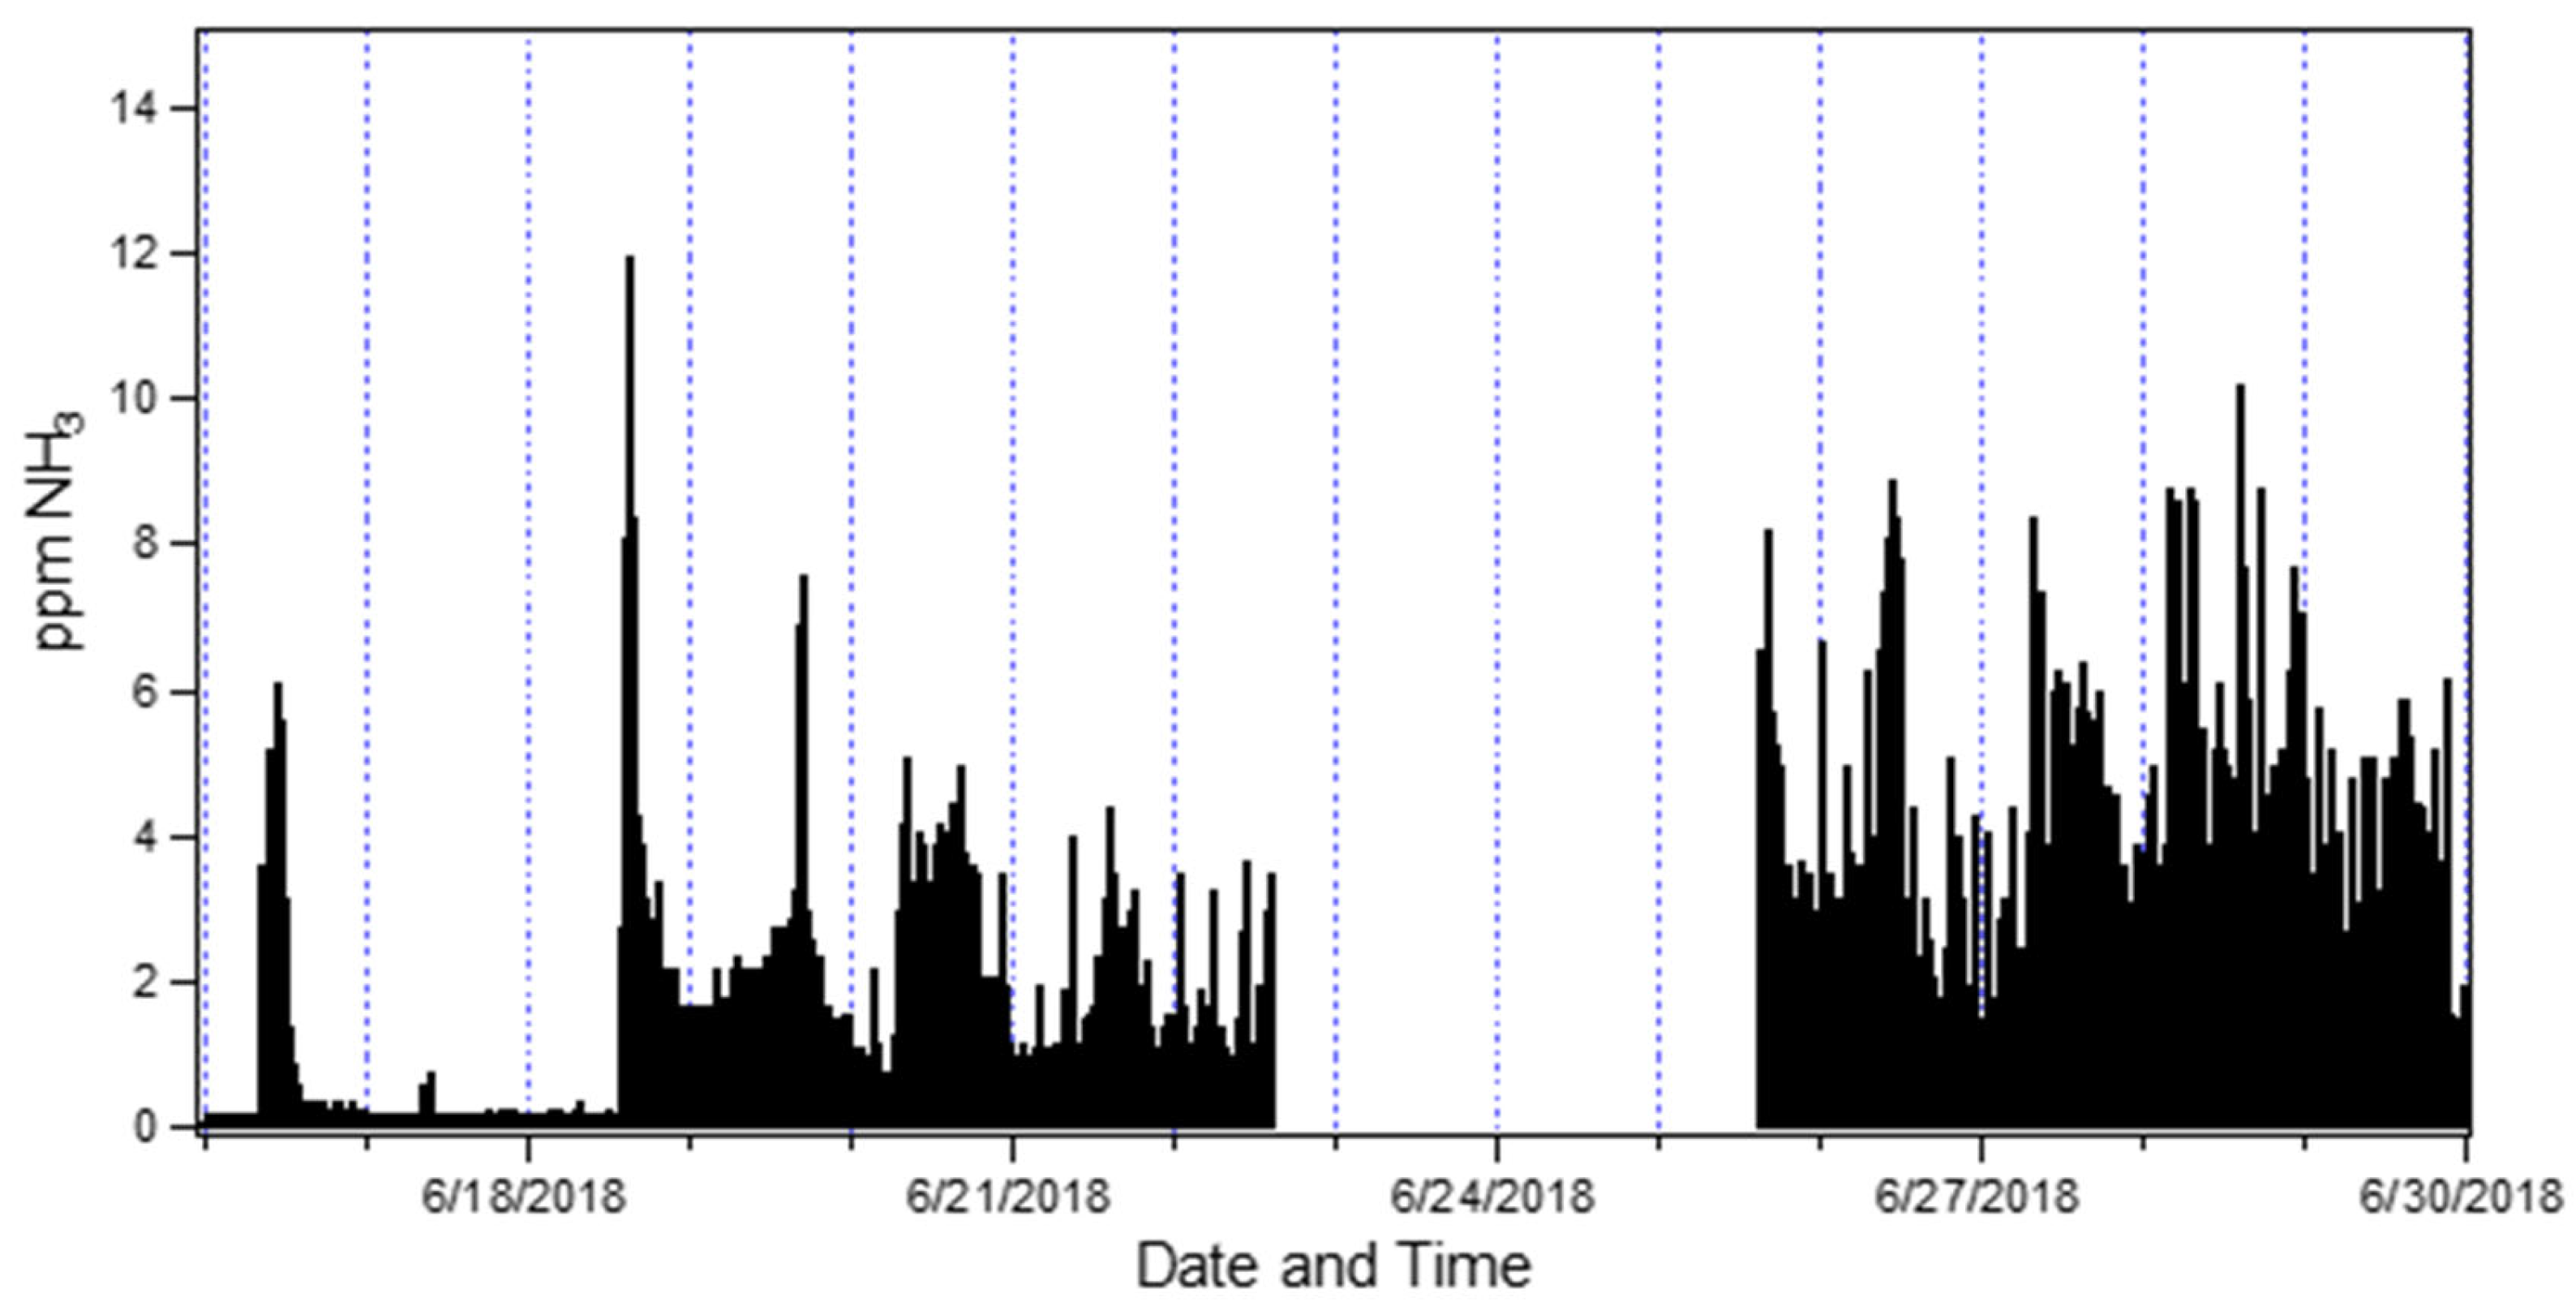
3.1. Ammonia
3.2. Particle Sizing
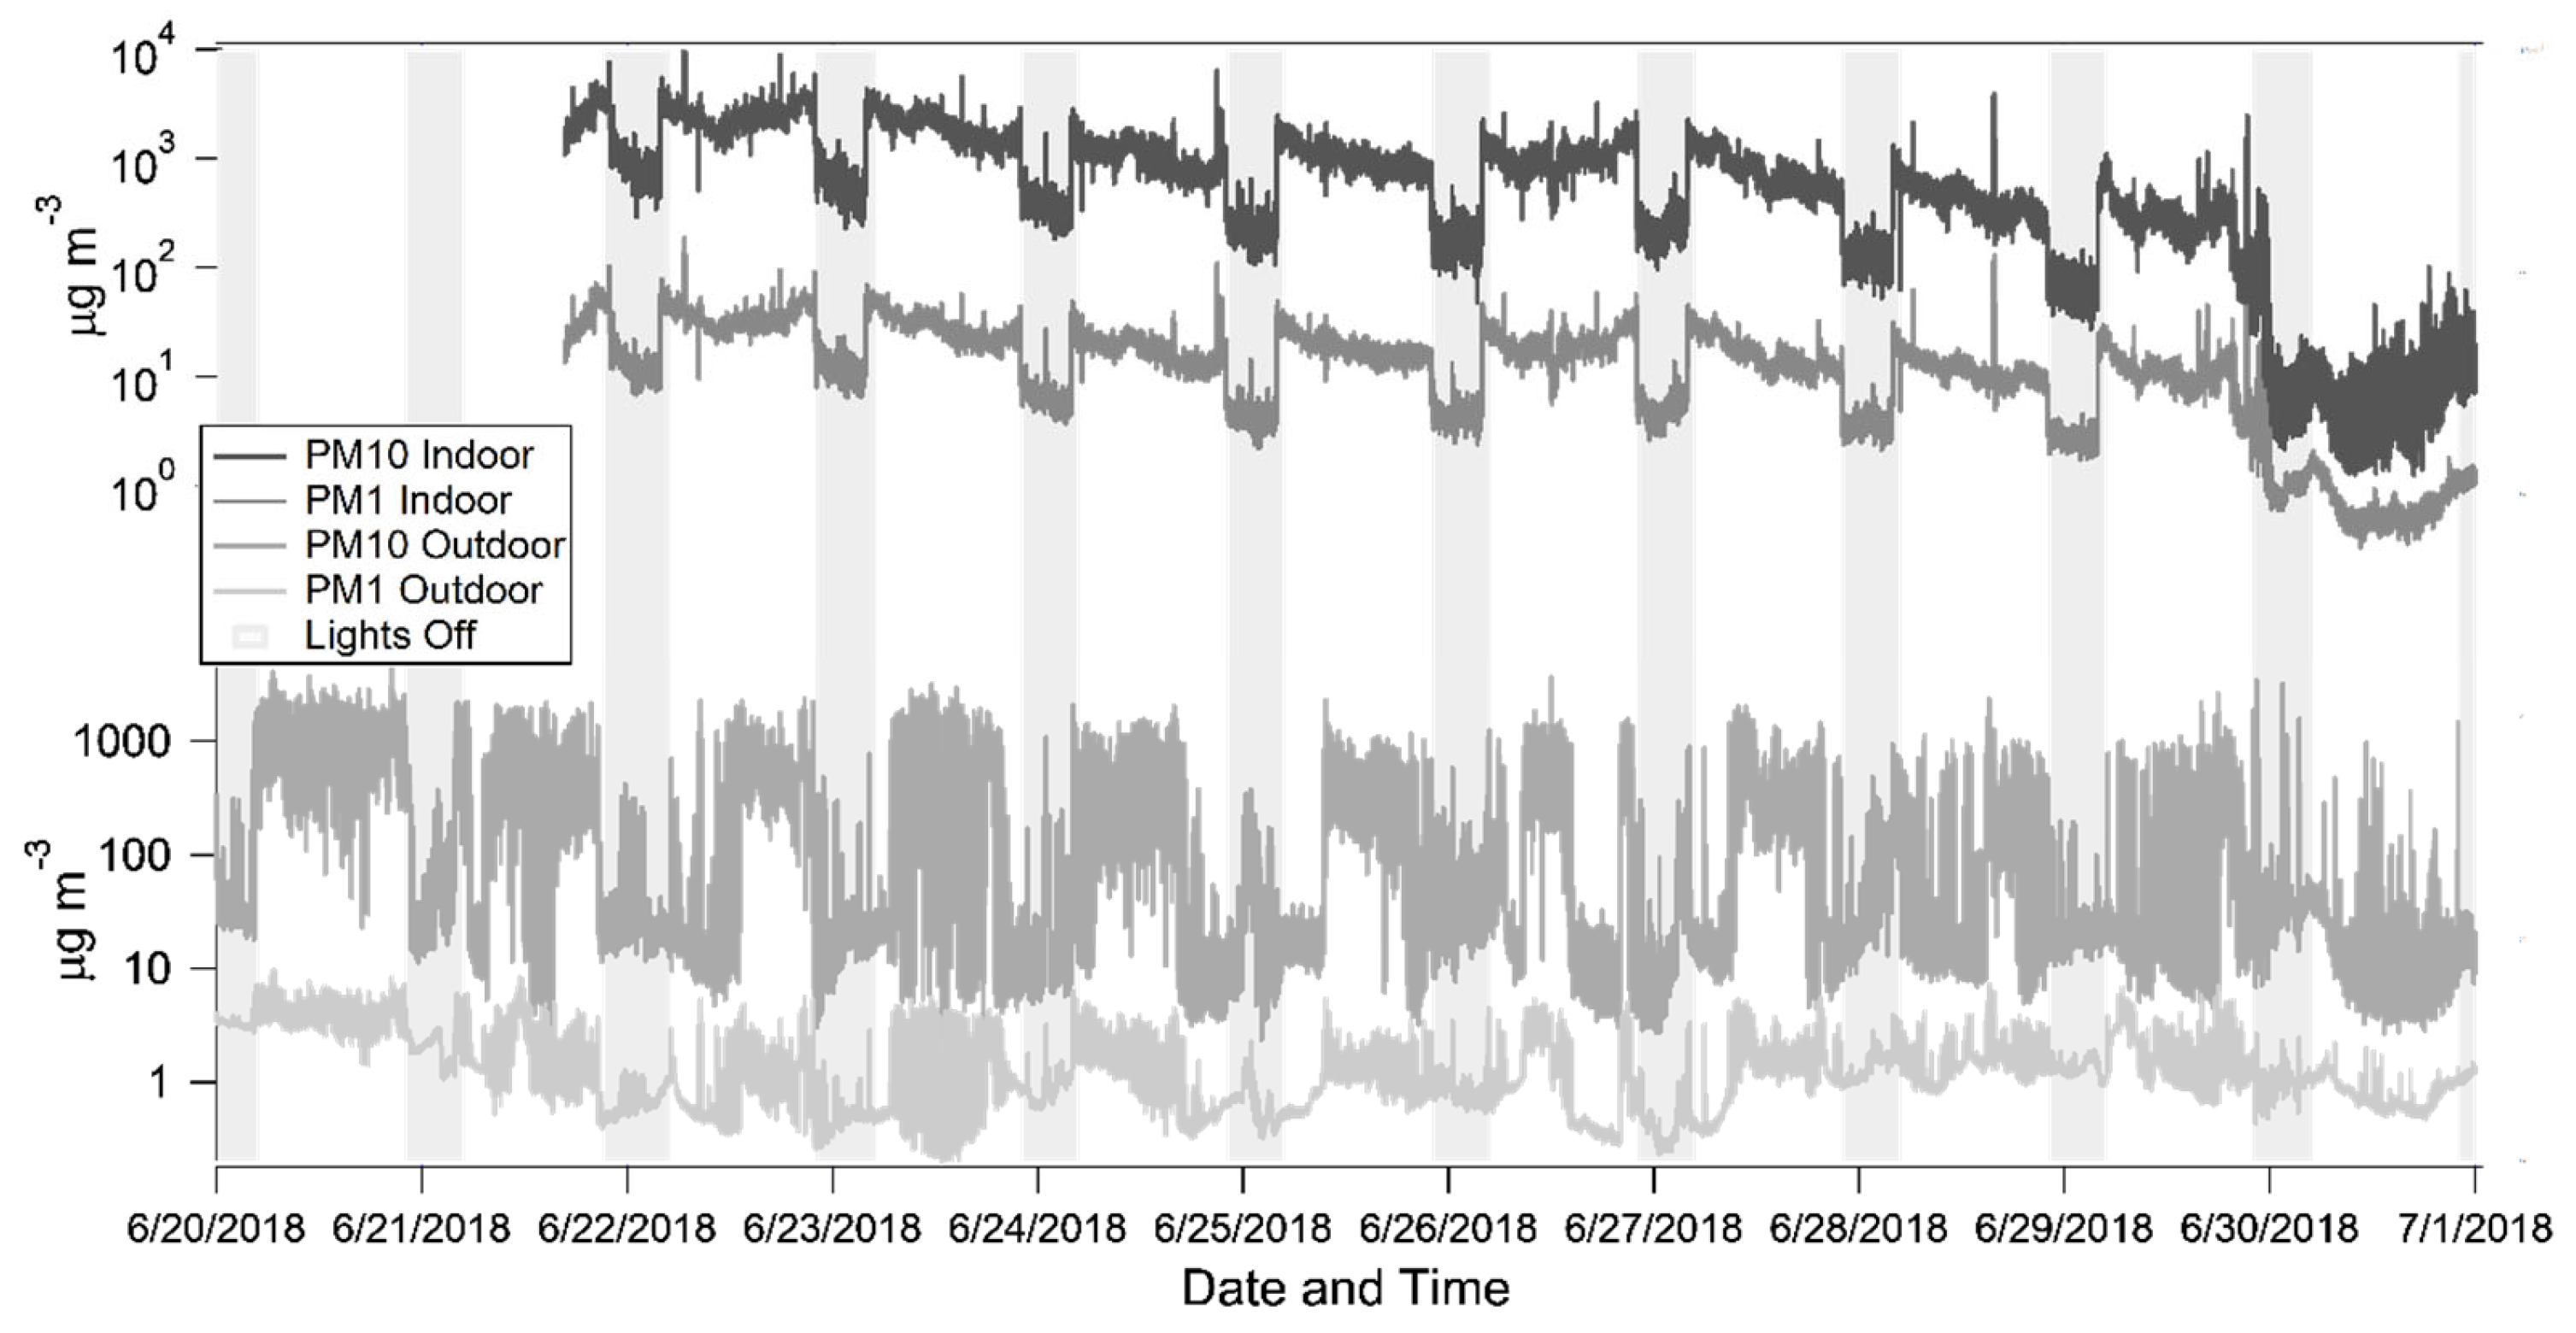
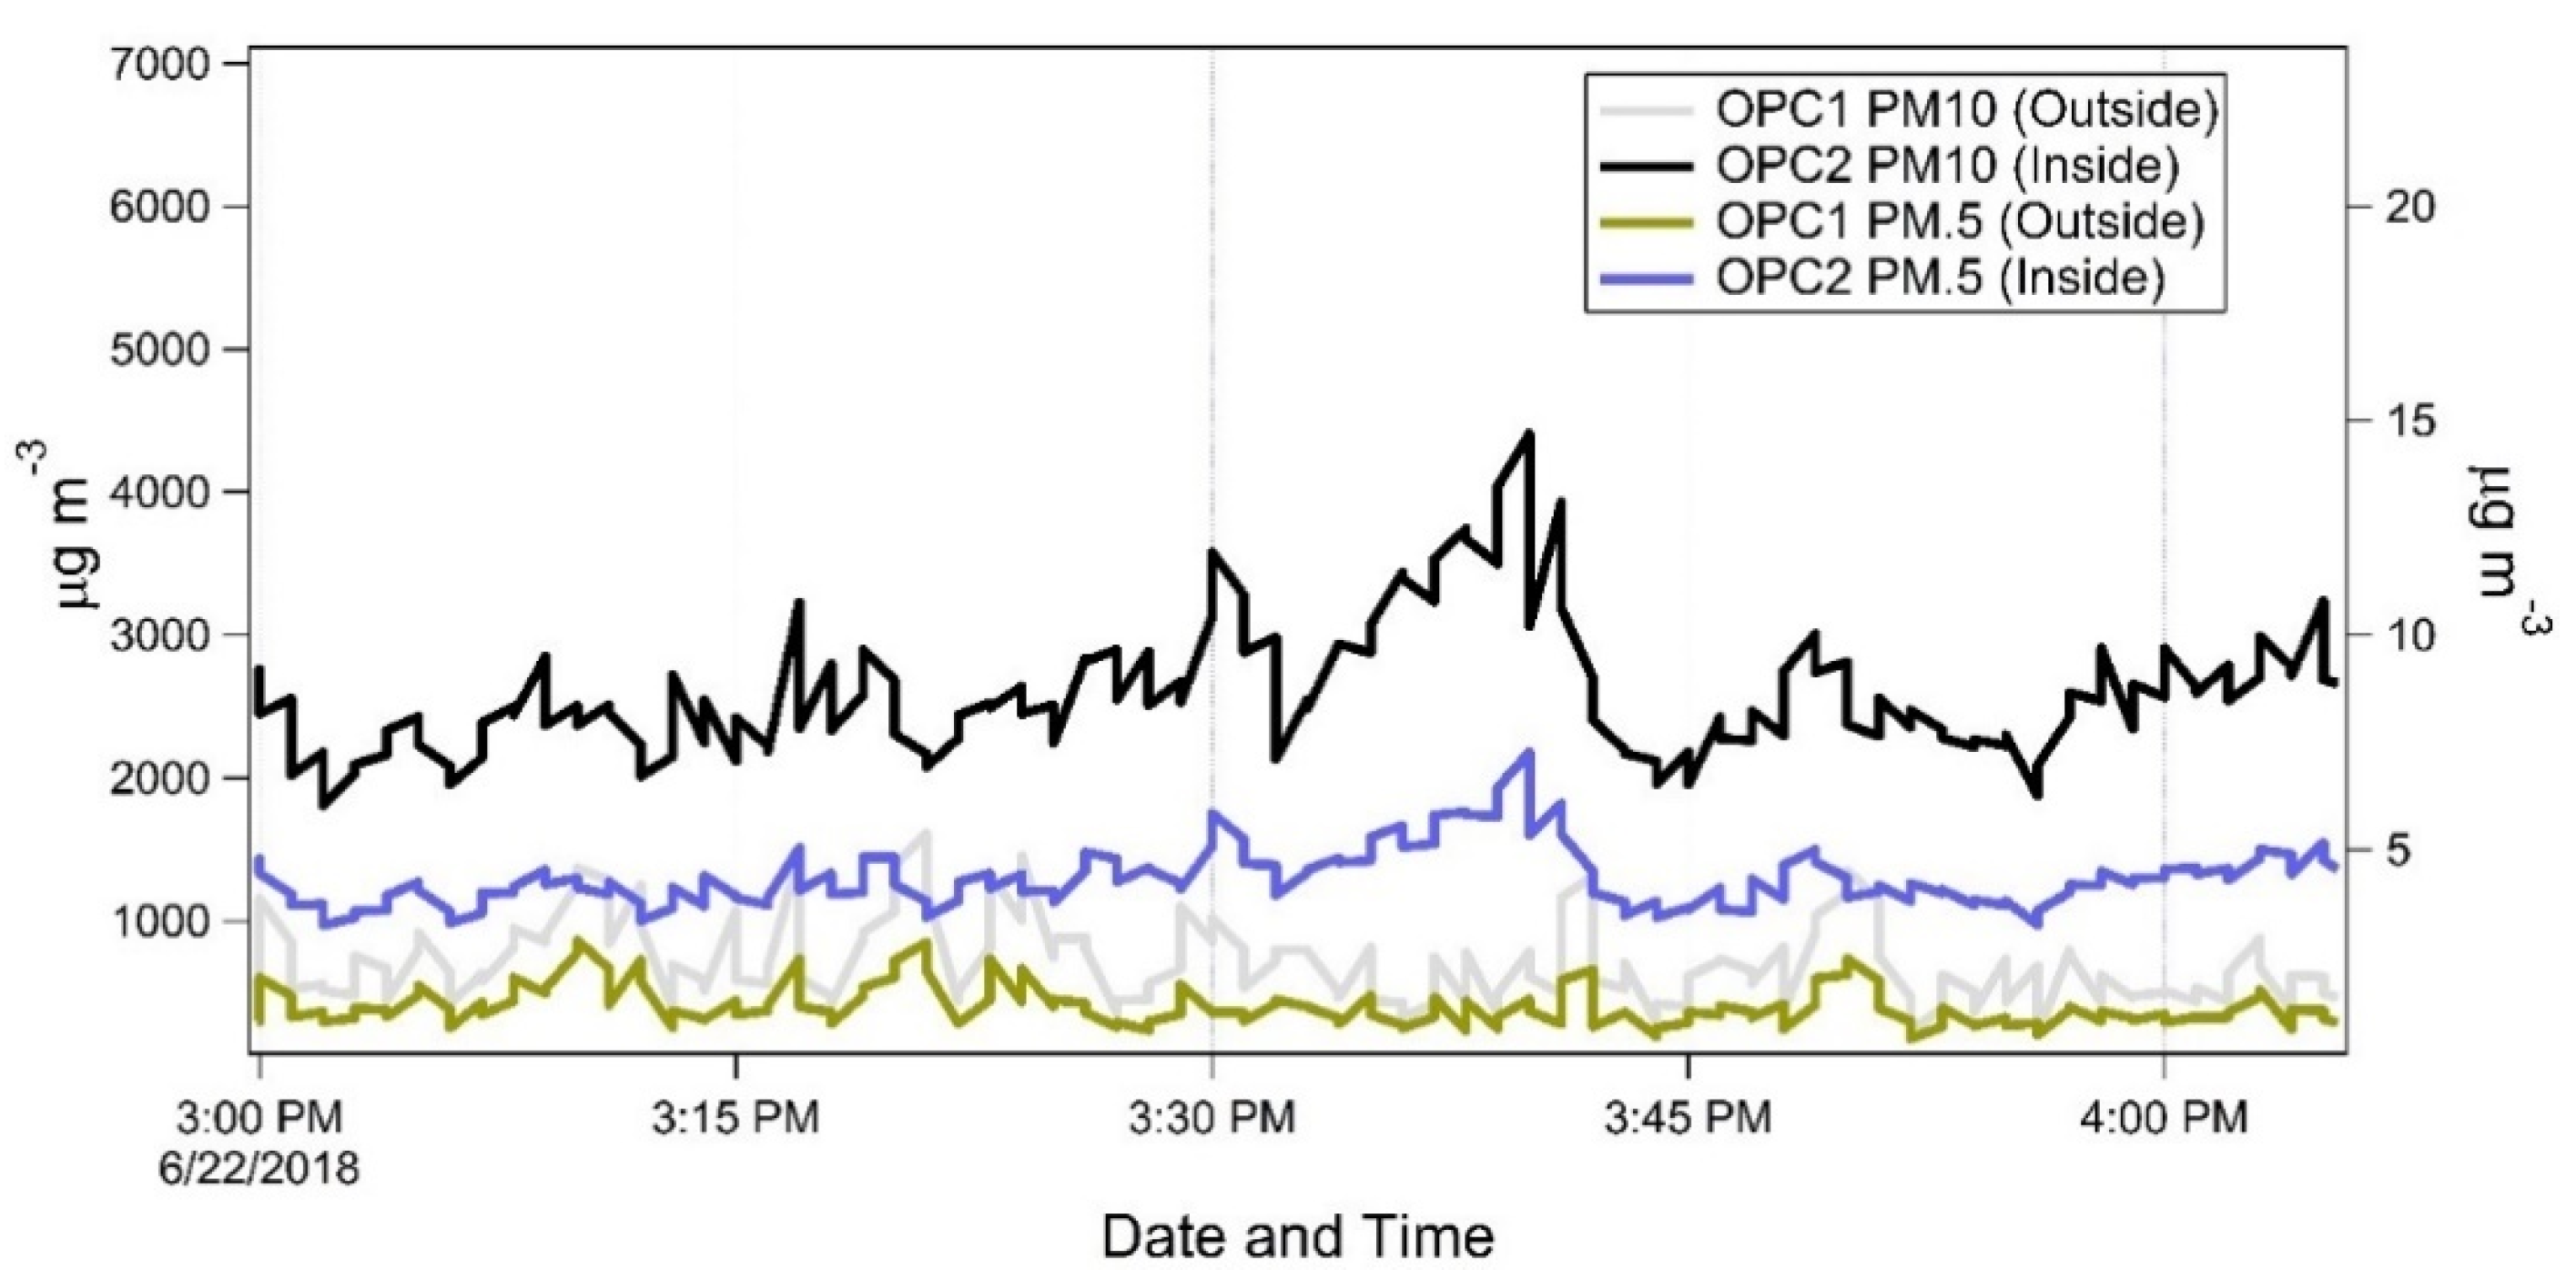
3.2.1. Optical Particle Counter
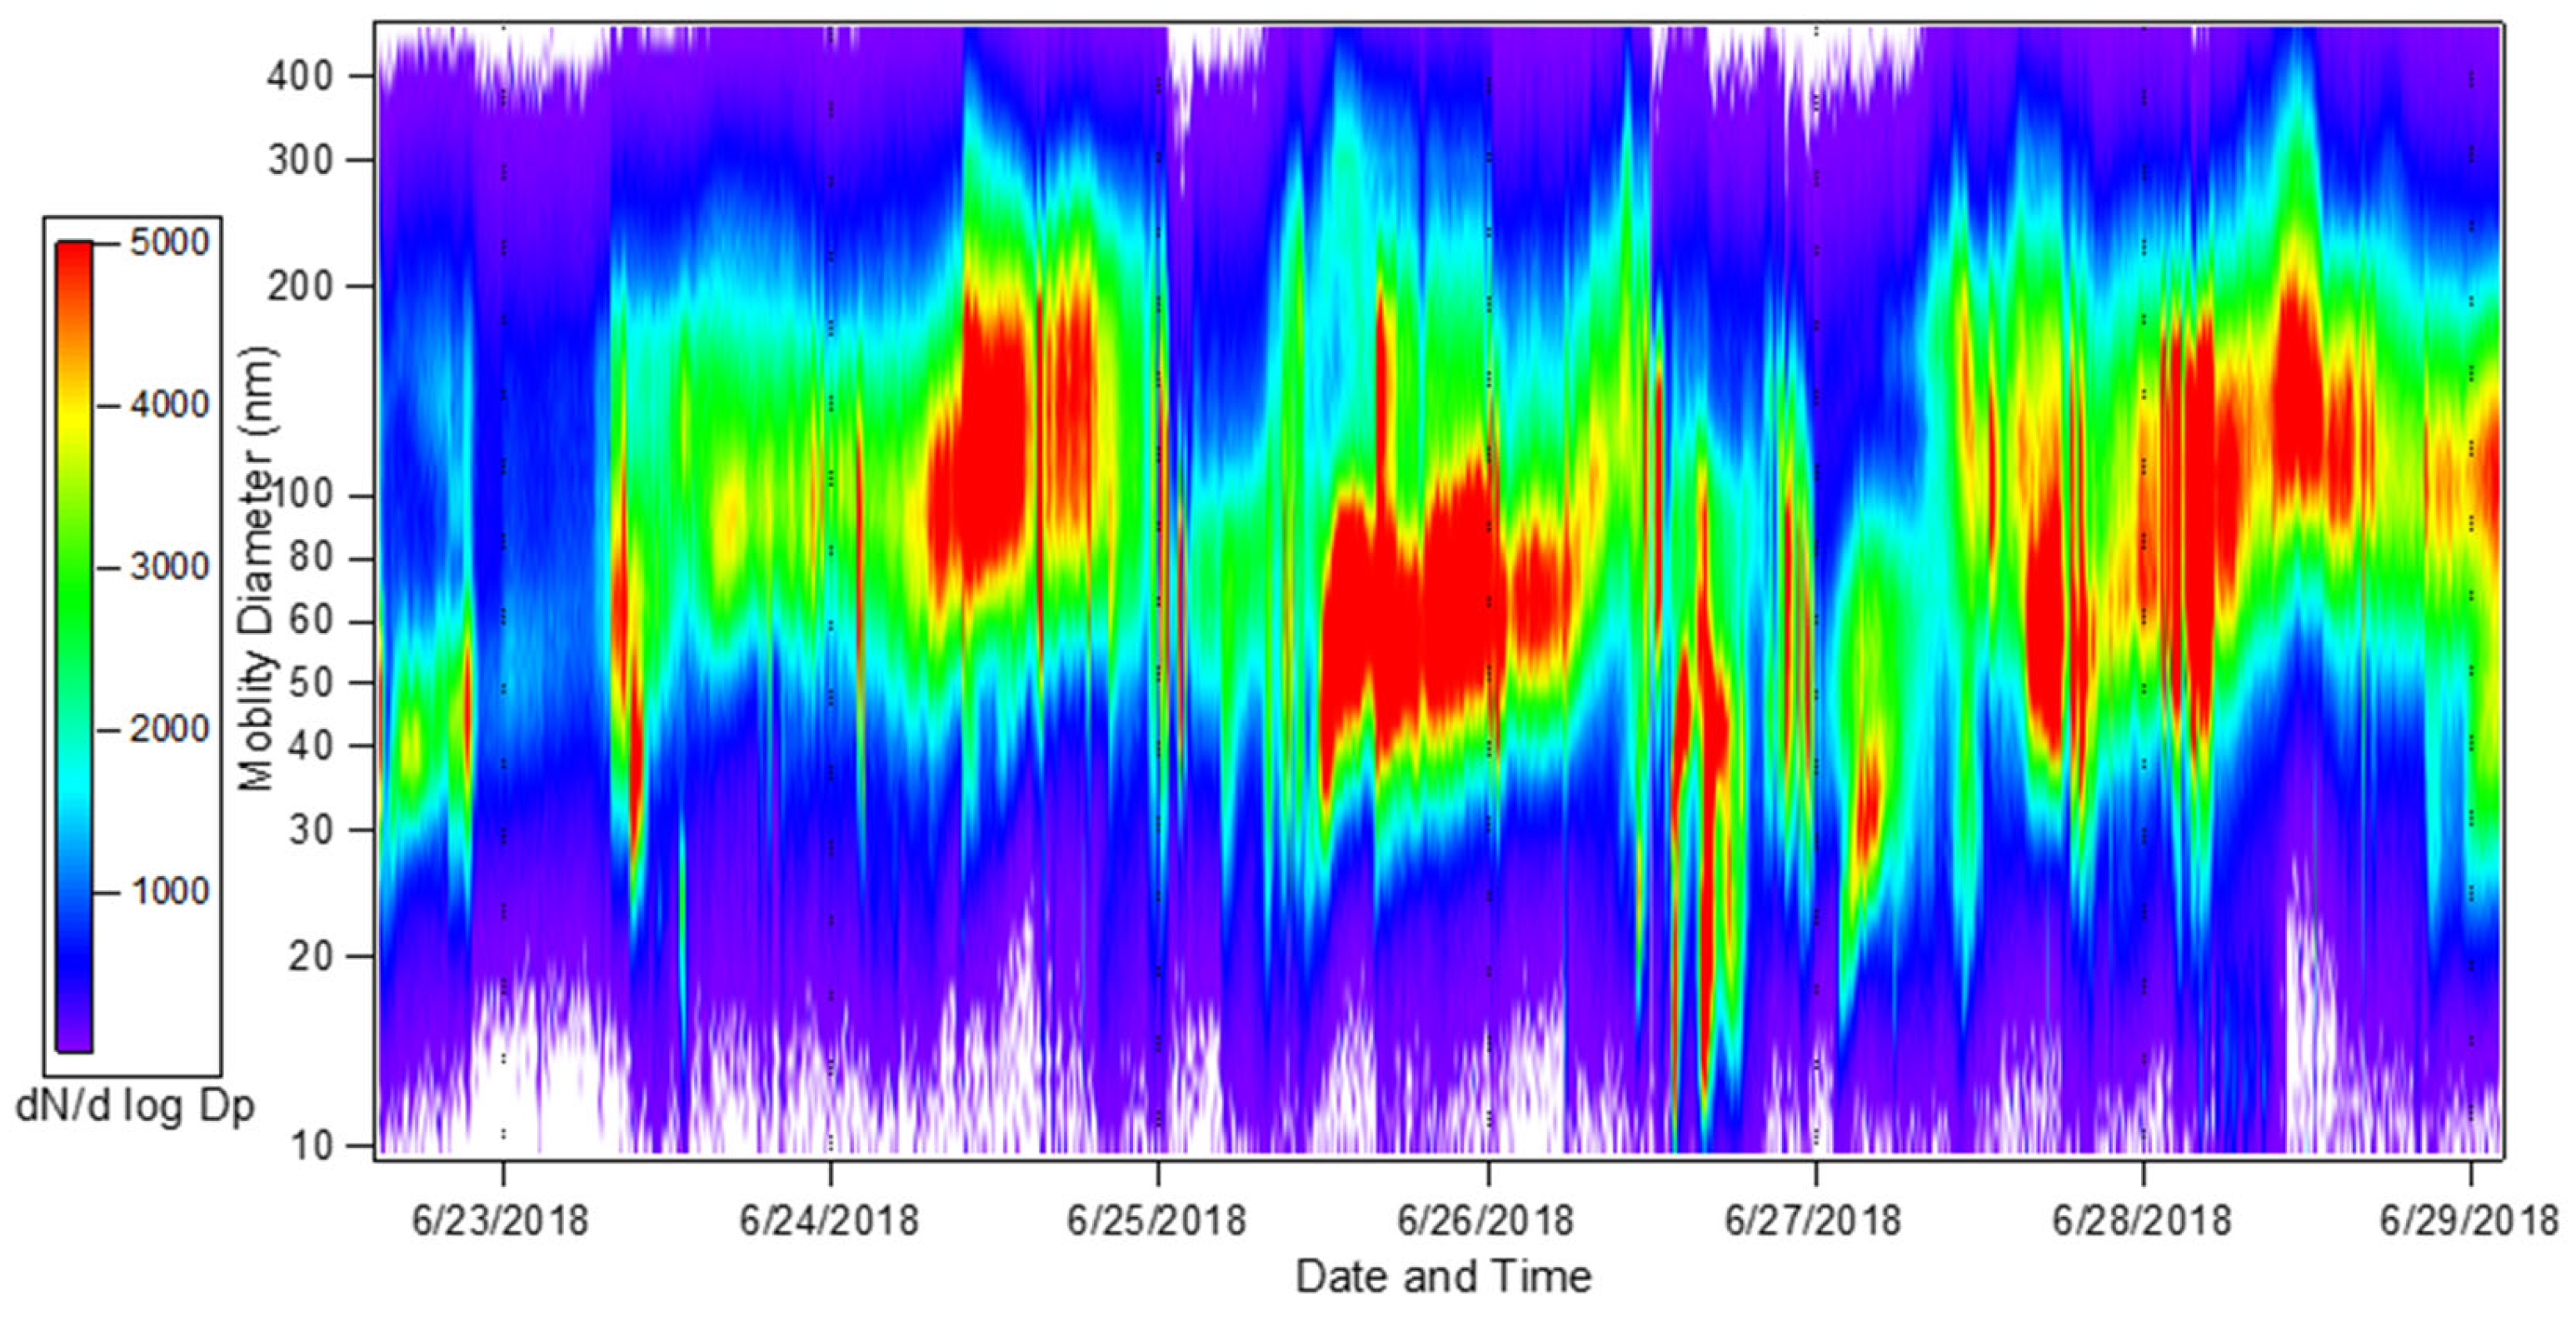
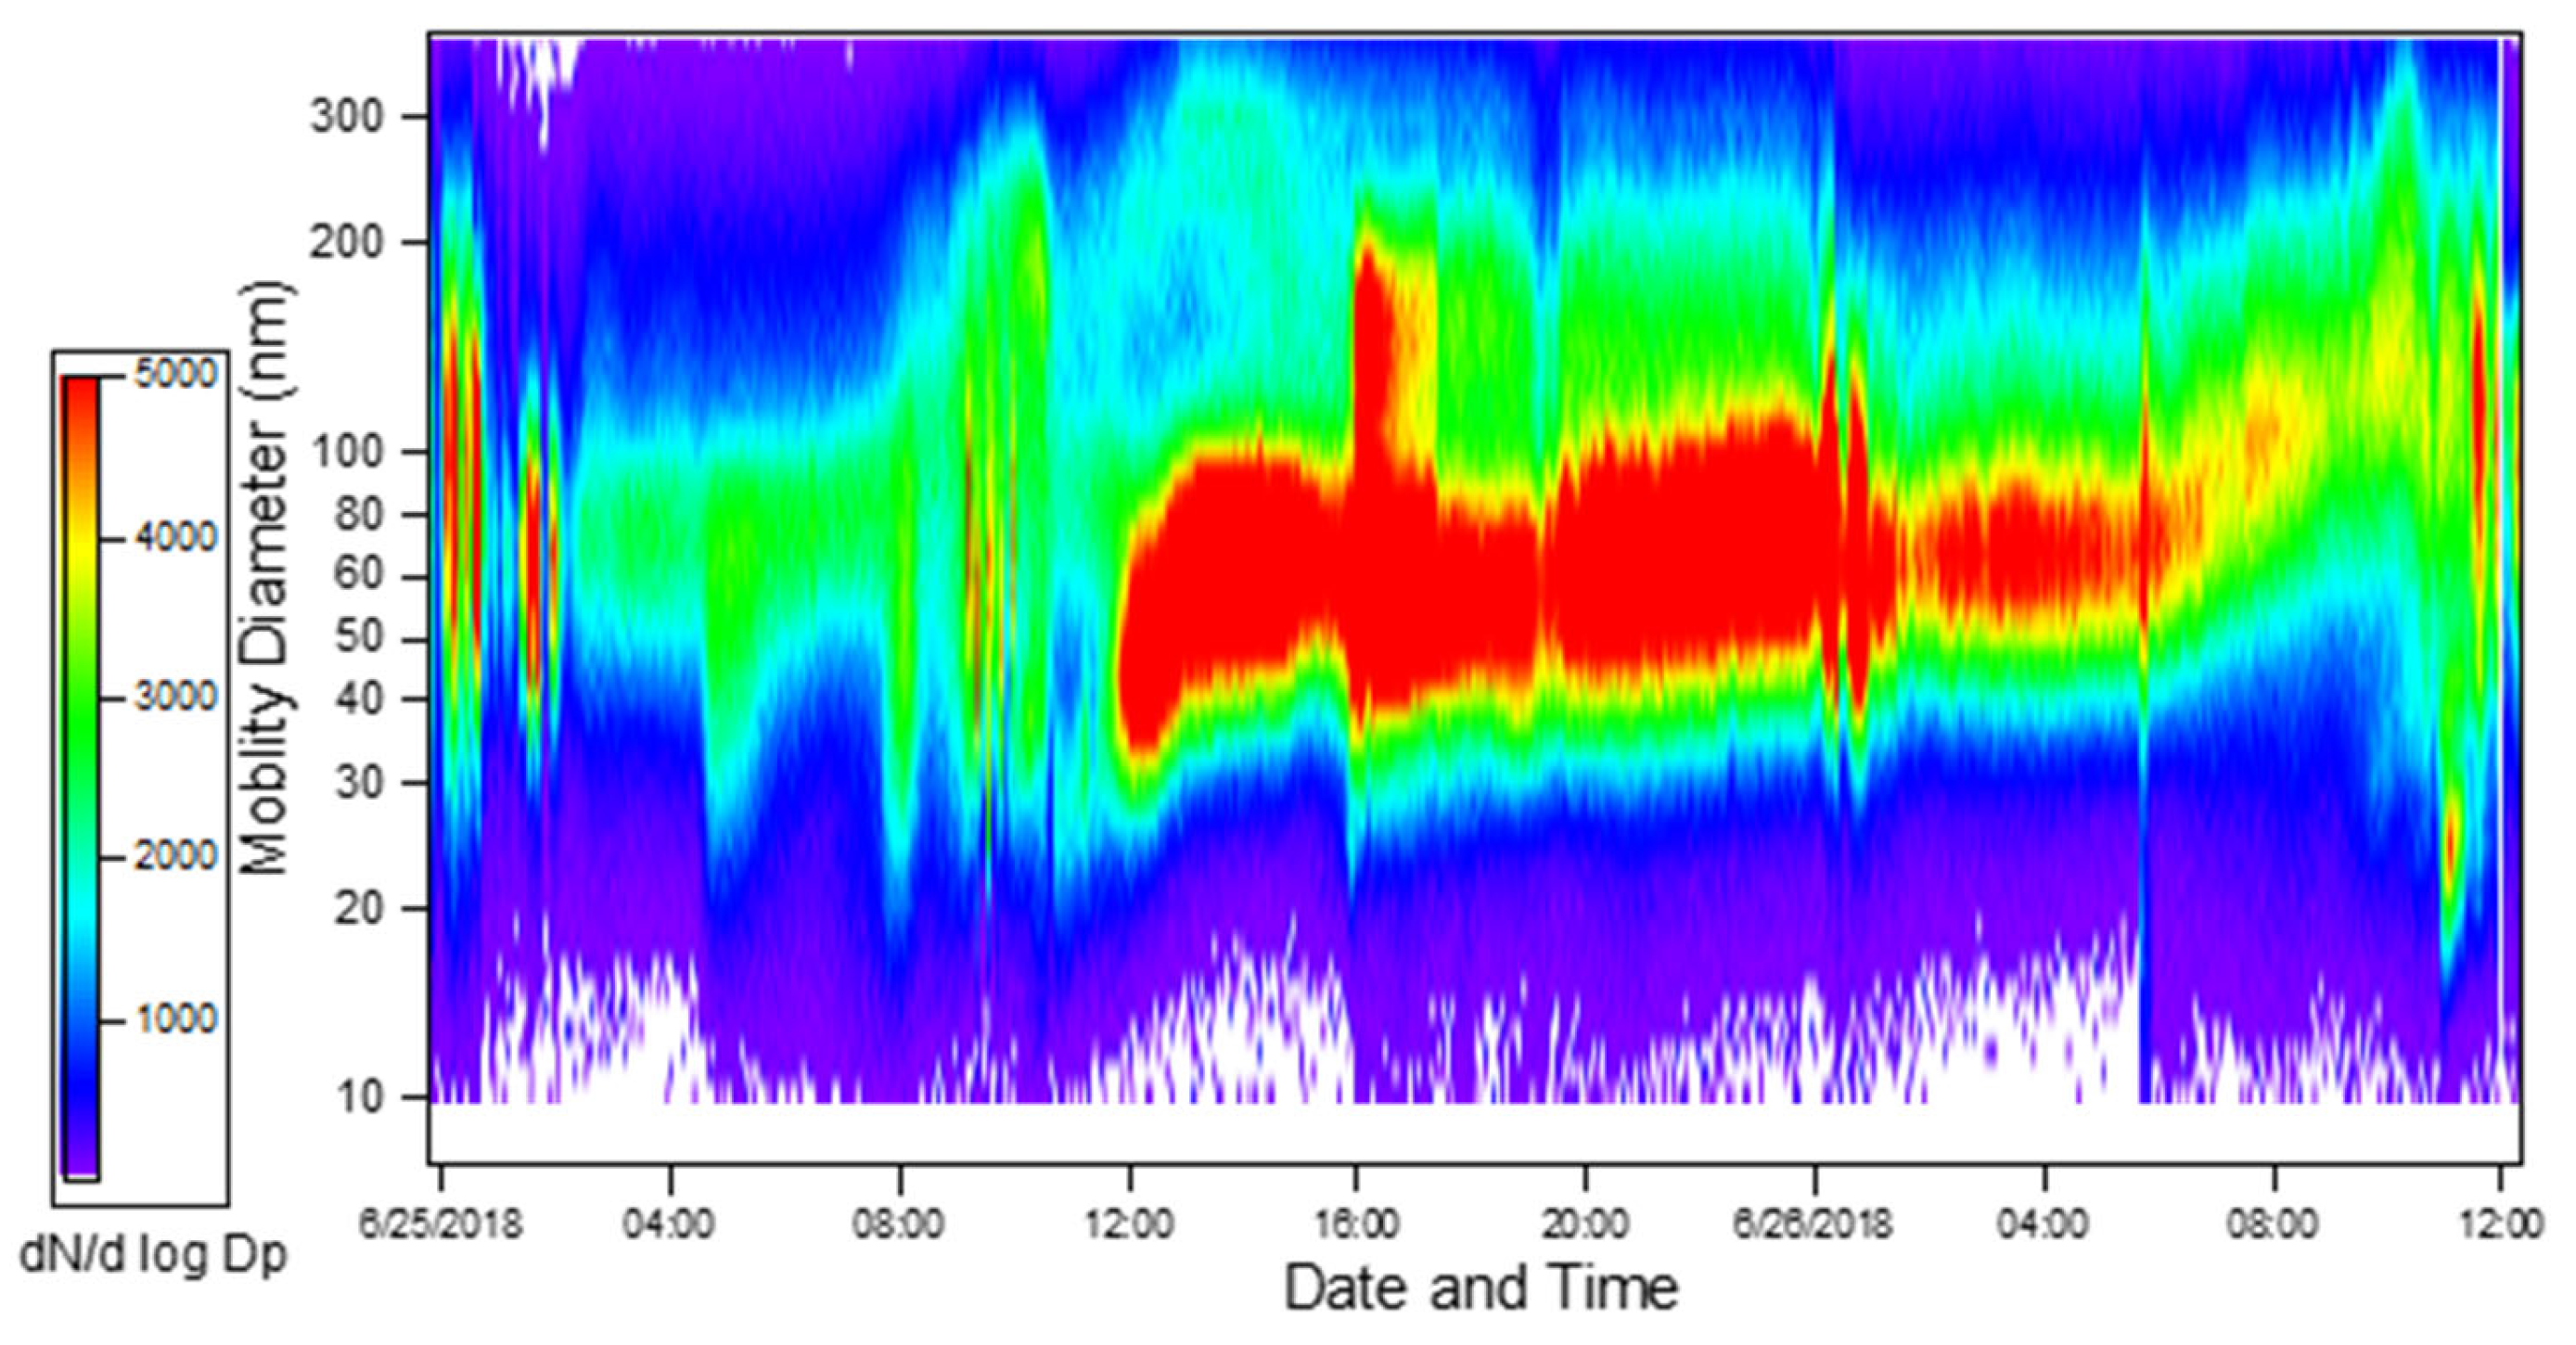
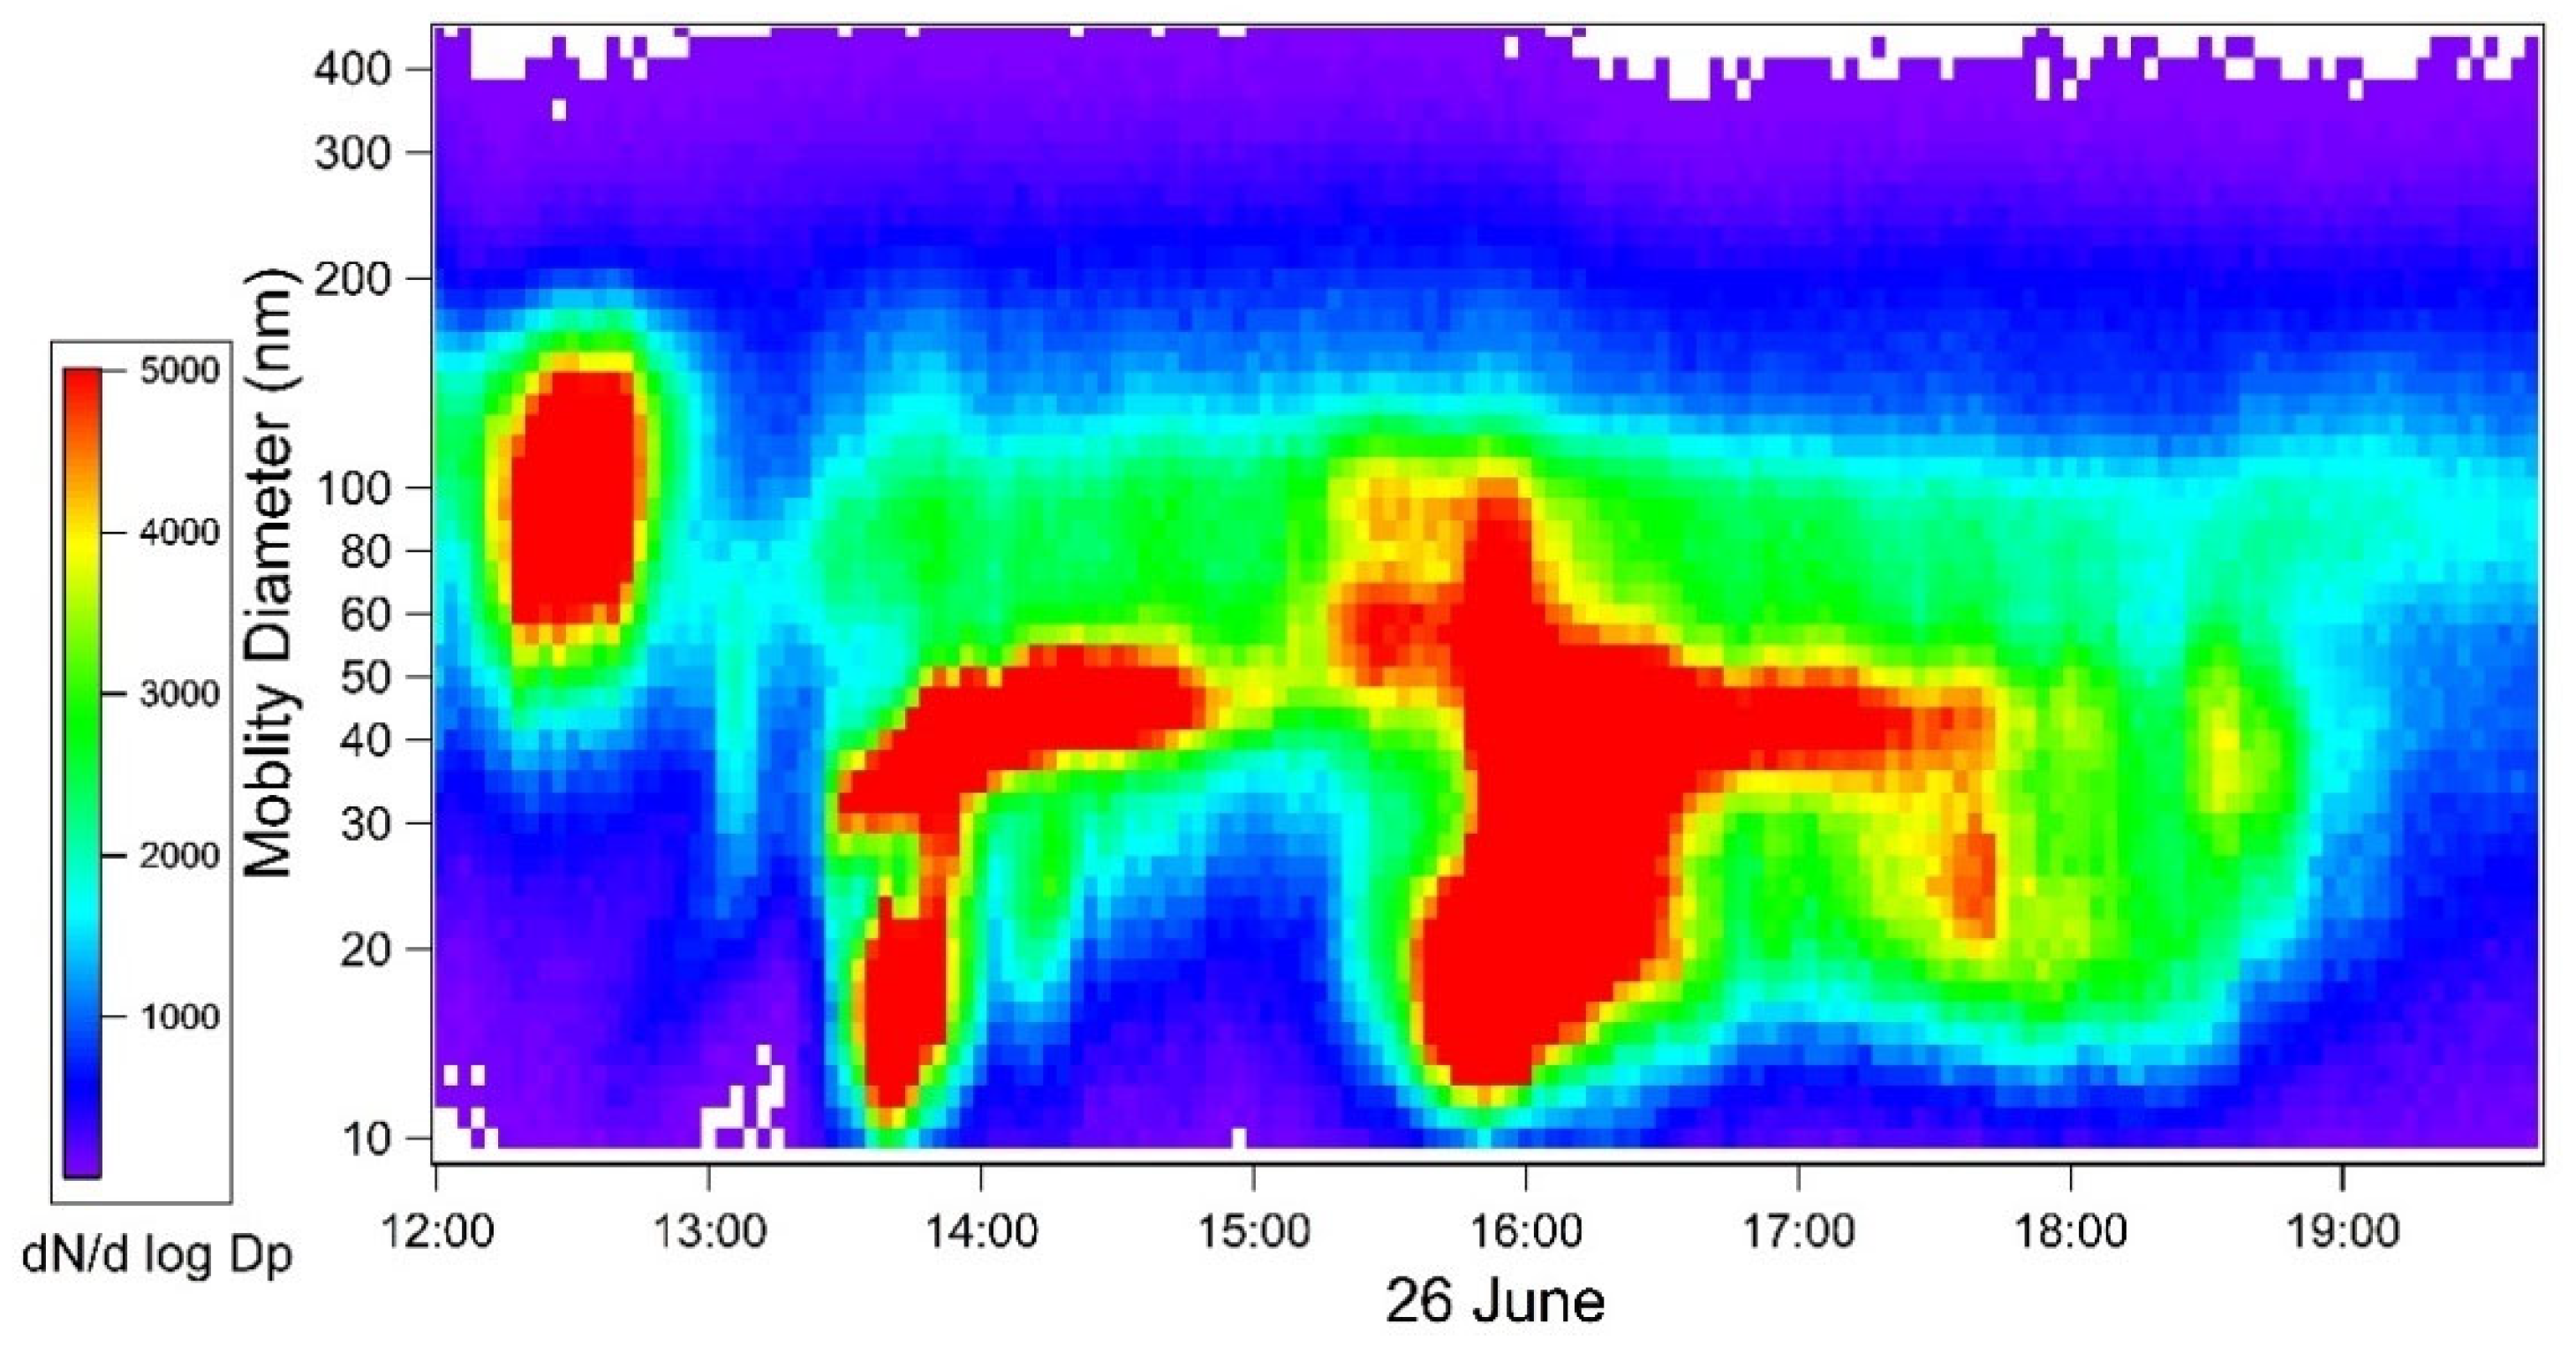
3.2.2. Scanning Mobility Particle Sizer
3.3. Particle Chemical Composition
4. Discussion and Conclusions
Author Contributions
Funding
Data Availability Statement
Acknowledgments
Conflicts of Interest
Appendix A


References
- Cambra-Lopez, M.; Aarnink, A.J.A.; Zhao, Y.; Calvet, S.; Torres, A.G. Airborne particulate matter from livestock production systems: A review of an air pollution problem. Environ. Pollut. 2010, 158, 1–17. [Google Scholar] [CrossRef] [PubMed]
- Franzi, L.M.; Linderholm, A.L.; Rabowsky, M.; Last, J.A. Lung toxicity in mice of airborne particulate matter from a modern layer hen facility containing Proposition 2-compliant animal caging. Toxicol. Ind. Health 2017, 33, 211–221. [Google Scholar] [CrossRef] [PubMed] [Green Version]
- Viegas, S.; Faisca, V.M.; Dias, H.; Clerigo, A.; Carolino, E.; Viegas, C. Occupational Exposure to Poultry Dust and Effects on the Respiratory System in Workers. J. Toxicol. Environ. Health Part A 2013, 76, 230–239. [Google Scholar] [CrossRef] [PubMed]
- Winkel, A.; Mosquera, J.; Koerkamp, P.; Ogink, N.W.M.; Aarnink, A.J.A. Emissions of particulate matter from animal houses in the Netherlands. Atmos. Environ. 2015, 111, 202–212. [Google Scholar] [CrossRef]
- Domingo, N.G.G.; Balasubramanian, S.; Thakrar, S.K.; Clark, M.A.; Adams, P.J.; Marshall, J.D.; Muller, N.Z.; Pandis, S.N.; Polasky, S.; Robinson, A.L.; et al. Air quality-related health damages of food. Proc. Natl. Acad. Sci. USA 2021, 118, 6. [Google Scholar] [CrossRef]
- Loftus, C.; Afsharinejad, Z.; Sampson, P.; Vedal, S.; Torres, E.; Arias, G.; Tchong-French, M.; Karr, C. Estimated time-varying exposures to air emissions from animal feeding operations and childhood asthma. Int. J. Hyg. Environ. Health. 2020, 223, 187–198. [Google Scholar] [CrossRef]
- Guo, L.; Zhao, B.; Jia, Y.Y.; He, F.Y.; Chen, W.W. Mitigation Strategies of Air Pollutants for Mechanical Ventilated Livestock and Poultry Housing-A Review. Atmosphere 2022, 13, 452. [Google Scholar] [CrossRef]
- Faulkner, W.B.; Shaw, B.W. Review of ammonia emission factors for United States animal agriculture. Atmos. Environ. 2008, 42, 6567–6574. [Google Scholar] [CrossRef]
- Jiang, J.Z.; Stevenson, D.S.; Uwizeye, A.; Tempio, G.; Sutton, M.A. A climate-dependent global model of ammonia emissions from chicken farming. Biogeosciences 2021, 18, 135–158. [Google Scholar] [CrossRef]
- Cox, J. Judge Rules Maryland Must Regulate Chicken Farm Air Pollution. Bay Journal. 12 March 2021. Available online: https://www.bayjournal.com/news/policy/judge-rules-maryland-must-regulate-chicken-farm-air-pollution/article_a576af78-8328-11eb-8bd9-8b13df23c6d3.html (accessed on 12 February 2023).
- Roumeliotis, T.S.; Dixon, B.J.; Van Heyst, B.J. Characterization of gaseous pollutant and particulate matter emission rates from a commercial broiler operation part I: Observed trends in emissions. Atmos. Environ. 2010, 44, 3770–3777. [Google Scholar] [CrossRef]
- Yang, X.F.; Wang, X.L.; Zhang, Y.H.; Lee, J.M.; Su, J.W.; Gates, R.S. Characterization of trace elements and ions in PM10 and PM2.5 emitted from animal confinement buildings. Atmos. Environ. 2011, 45, 7096–7104. [Google Scholar] [CrossRef]
- Wang, Y.; Niu, B.L.; Ni, J.Q.; Xue, W.T.; Zhu, Z.P.; Li, X.R.; Zou, G.Y. New insights into concentrations, sources and transformations of NH3, NOx, SO2 and PM at a commercial manure-belt layer house. Environ. Pollut. 2020, 262, 9. [Google Scholar] [CrossRef]
- Ni, J.Q.; Chai, L.L.; Chen, L.D.; Bogan, B.W.; Wang, K.Y.; Cortus, E.L.; Heber, A.J.; Lim, T.T.; Diehl, C.A. Characteristics of ammonia, hydrogen sulfide, carbon dioxide, and particulate matter concentrations in high-rise and manure-belt layer hen houses. Atmos. Environ. 2012, 57, 165–174. [Google Scholar] [CrossRef]
- Lin, X.J.; Cortus, E.L.; Zhang, R.; Jiang, S.; Heber, A.J. Ammonia, hydrogen sulfide, carbon dioxide and particulate matter emissions from California high-rise layer houses. Atmos. Environ. 2012, 46, 81–91. [Google Scholar] [CrossRef]
- Lin, X.J.; Zhang, R.H.; Jiang, S.M.; El-Mashad, H.; Xin, H.W. Emissions of ammonia, carbon dioxide and particulate matter from cage-free layer houses in California. Atmos. Environ. 2017, 152, 246–255. [Google Scholar] [CrossRef] [Green Version]
- Li, Q.F.; Wang-Li, L.J.; Liu, Z.F.; Jayanty, R.K.M.; Shah, S.B.; Bloomfield, P. Major ionic compositions of fine particulate matter in an animal feeding operation facility and its vicinity. J. Air Waste Manag. Assoc. 2014, 64, 1279–1287. [Google Scholar] [CrossRef] [Green Version]
- Li, Q.; Wang, L.; Liu, Z.; Beasley, D.B.; Jayanty, R.K.M. Chemical Characterization of Particulate Matter Emitted from Animal Feeding Operations. In Proceedings of the ASABE, Reno, NV, USA, 21–24 June 2009; ASABE: St. Joseph, MI, USA, 2009. [Google Scholar]
- Dai, P.Y.; Shen, D.; Tang, Q.; Huang, K.; Li, C.M. PM 2.5 from a broiler breeding production system: The characteristics and microbial community analysis. Environ. Pollut. 2020, 256, 11. [Google Scholar] [CrossRef]
- Shen, D.; Wu, S.; Dai, P.Y.; Li, Y.S.; Li, C.M. Distribution of particulate matter and ammonia and physicochemical properties of fine particulate matter in a layer house. Poult. Sci. 2018, 97, 4137–4149. [Google Scholar] [CrossRef]
- Cambra-Lopez, M.; Hermosilla, T.; Lai, H.T.L.; Aarnink, A.J.A.; Ogink, N.W.M. Particulate Matter Emitted from Poultry and Pig Houses: Source Identification and Quantification. Trans. ASABE 2011, 54, 629–642. [Google Scholar] [CrossRef] [Green Version]
- Dunlop, M.W.; Blackall, P.J.; Stuetz, R.M. Odour emissions from poultry litter—A review litter properties, odour formation and odorant emissions from porous materials. J. Environ. Manag. 2016, 177, 306–319. [Google Scholar] [CrossRef] [Green Version]
- Wadud, S.; Michaelsen, A.; Gallagher, E.; Parcsi, G.; Zemb, O.; Stuetz, R.; Manefield, M. Bacterial and fungal community composition over time in chicken litter with high or low moisture content. Br. Poult. Sci. 2012, 53, 561–569. [Google Scholar] [CrossRef] [PubMed]
- Murphy, K.R.; Parcsi, G.; Stuetz, R.M. Non-methane volatile organic compounds predict odor emitted from five tunnel ventilated broiler sheds. Chemosphere 2014, 95, 423–432. [Google Scholar] [CrossRef] [PubMed]
- Mackie, R.I.; Stroot, P.G.; Varel, V.H. Biochemical identification and biological origin of key odor components in livestock waste. J. Anim. Sci. 1998, 76, 1331–1342. [Google Scholar] [CrossRef] [PubMed]
- Zhang, Y.M.; Zhang, X.Y.; Sun, J.Y.; Hu, G.Y.; Shen, X.J.; Wang, Y.Q.; Wang, T.T.; Wang, D.Z.; Zhao, Y. Chemical composition and mass size distribution of PM1 at an elevated site in central east China. Atmos. Chem. Phys. 2014, 14, 12237–12249. [Google Scholar] [CrossRef] [Green Version]
- Ciuraru, R.; Kammer, J.; Decuq, C.; Vojkovic, M.; Haider, K.; Carpentier, Y.; Lafouge, F.; Berger, C.; Bourdat-Deschamps, M.; Ortega, I.K.; et al. New particle formation from agricultural recycling of organic waste products. npj Clim. Atmos. Sci. 2021, 4, 10. [Google Scholar] [CrossRef]
- Cusack, M.; Perez, N.; Pey, J.; Alastuey, A.; Querol, X. Source apportionment of fine PM and sub-micron particle number concentrations at a regional background site in the western Mediterranean: A 2.5 year study. Atmos. Chem. Phys. 2013, 13, 5173–5187. [Google Scholar] [CrossRef] [Green Version]
- Trabue, S.; Scoggin, K.; Li, H.; Burns, R.; Xin, H.W.; Hatfield, J. Speciation of volatile organic compounds from poultry production. Atmos. Environ. 2010, 44, 3538–3546. [Google Scholar] [CrossRef] [Green Version]
- Hasson, A.S.; Ogunjemiyo, S.O.; Trabue, S.; Ashkan, S.; Scoggin, K.; Steele, J.; Olea, C.; Middala, S.; Vu, K.; Scruggs, A.; et al. NOx emissions from a Central California dairy. Atmos. Environ. 2013, 70, 328–336. [Google Scholar] [CrossRef]
- Mao, J.B.; Yu, F.Q.; Zhang, Y.; An, J.Y.; Wang, L.; Zheng, J.; Yao, L.; Luo, G.; Ma, W.C.; Yu, Q.; et al. High-resolution modeling of gaseous methylamines over a polluted region in China: Source-dependent emissions and implications of spatial variations. Atmos. Chem. Phys. 2018, 18, 7933–7950. [Google Scholar] [CrossRef] [Green Version]
- Erupe, M.E.; Liberman-Martin, A.; Silva, P.J.; Malloy, Q.G.J.; Yonis, N.; Cocker, D.R., III; Purvis-Roberts, K.L. Determination of methylamines and trimethylamine-N-oxide in particulate matter by non-suppressed ion chromatography. J. Chromatogr. A 2010, 1217, 2070–2073. [Google Scholar] [CrossRef]
- Orsini, D.A.; Ma, Y.L.; Sullivan, A.; Sierau, B.; Baumann, K.; Weber, R.J. Refinements to the particle-into-liquid sampler (PILS) for ground and airborne measurements of water soluble aerosol composition. Atmos. Environ. 2003, 37, 1243–1259. [Google Scholar] [CrossRef]
- VandenBoer, T.C.; Markovic, M.Z.; Petroff, A.; Czar, M.F.; Borduas, N.; Murphy, J.G. Ion chromatographic separation and quantitation of alkyl methylamines and ethylamines in atmospheric gas and particulate matter using preconcentration and suppressed conductivity detection. J. Chromatogr. A 2012, 1252, 74–83. [Google Scholar] [CrossRef]
- Place, B.K.; Quilty, A.T.; Di Lorenzo, R.A.; Ziegler, S.E.; VandenBoer, T.C. Quantitation of 11 alkylamines in atmospheric samples: Separating structural isomers by ion chromatography. Atmos. Meas. Tech. 2017, 10, 1061–1078. [Google Scholar] [CrossRef] [Green Version]
- Weber, R.J.; Orsini, D.; Daun, Y.; Lee, Y.N.; Klotz, P.J.; Brechtel, F. A particle-into-liquid collector for rapid measurement of aerosol bulk chemical composition. Aerosol Sci. Technol. 2001, 35, 718–727. [Google Scholar] [CrossRef] [Green Version]
- National Academies Press. Air Emissions from Animal Feeding Operations; National Academies Press: Washington, DC, USA, 2003; pp. 96–115. [Google Scholar]
- National Air Emissions Monitoring Study. Available online: https://www.epa.gov/afos-air/national-air-emissions-monitoring-study (accessed on 14 November 2022).
- Hong, E.-C.; Kang, H.-K.; Jeon, J.-J.; You, A.-S.; Kim, H.-S.; Son, J.-S.; Kim, H.-J.; Yun, Y.-S.; Kang, B.-S.; Kim, J.-H. Studies on the concentrations of particulate matter and ammonia gas from three laying hen rearing systems during the summer season. J. Environ. Sci. Health Part B 2021, 56, 753–760. [Google Scholar] [CrossRef]
- Calvet, S.; Van den Weghe, H.; Kosch, R.; Estelles, F. The influence of the lighting program on broiler activity and dust production. Poult. Sci. 2009, 88, 2504–2511. [Google Scholar] [CrossRef]
- Lovanh, N.; Loughrin, J.; Silva, P. The effect of aged litter materials on polyatomic ion concentrations in fractionated suspended particulate matter from a broiler house. J. Air Waste Manag. Assoc. 2016, 66, 707–714. [Google Scholar] [CrossRef] [Green Version]
- Ni, J.-Q.; Erasmus, M.; Jones, D.R.; Campbell, D.L. Effectiveness and characteristics of a new technology to reduce ammonia, carbon dioxide, and particulate matter pollution in poultry production with artificial turf floor. Environ. Technol. Innov. 2023, 29, 102976. [Google Scholar] [CrossRef]
- Ranadheera, C.S.; Mcconchie, R.; Phan-Thien, K.; Bell, T. Strategies for eliminating chicken manure odour in horticultural applications. World’s Poult. Sci. J. 2017, 73, 365–378. [Google Scholar] [CrossRef]
- Liu, Y.; Zhang, G.; Rong, L.; Wang, C.; Teng, G. Odor components and the effects of different managements on odor characteristics in layer houses. Trans. Chin. Soc. Agric. Eng. Trans. CSAE 2021, 37, 194–199. [Google Scholar] [CrossRef]
- Lu, M.; Lamichhane, P.; Liang, F. Eric Imerman & Ming Chai, Identification of Odor Causing Compounds in a Commercial Dairy Farm. Water Air Soil Pollut. Focus 2008, 8, 359–367. [Google Scholar]


| Indoor Fraction | Outdoor Fraction | |
|---|---|---|
| PM10 | 1 | 1 |
| PM5 | 0.57 | 0.82 |
| PM3 | 0.27 | 0.57 |
| PM1 | 0.03 | 0.16 |
| PM0.5 | 0.003 | 0.03 |
| Water-Soluble Ion | Mean Concentration (µg m−3) | Standard Deviation (µg m−3) | Median (µg m−3) | Lowest Measured Concentration (µg m−3) | Highest Measured Concentration (µg m−3) |
|---|---|---|---|---|---|
| PILS-IC | |||||
| Acetate | 13.95 | 21.35 | 3.76 | 0.24 | 112.25 |
| Chloride | 0.26 | 0.12 | 0.27 | 0.10 | 0.69 |
| Formate | 1.87 | 1.55 | 1.35 | 0.65 | 7.84 |
| Nitrate | 1.01 | 0.25 | 0.97 | 0.67 | 3.72 |
| Nitrite | 4.07 | 3.86 | 2.40 | 0.84 | 17.10 |
| Sulfate | 1.13 | 2.64 | 0.74 | 0.18 | 36.24 |
| Magnesium | 0.44 | 0.50 | 0.26 | 0.00 | 1.97 |
| Methylaminium | 0.94 | 1.05 | 0.79 | 0.03 | 12.54 |
| Potassium | 1.14 | 1.12 | 0.83 | 0.07 | 4.39 |
| AIM | |||||
| Acetate | 0.40 | 1.05 | 0.00 | 0.00 | 8.68 |
| Bromide | 0.01 | 0.02 | 0.00 | 0.01 | 0.11 |
| Butyrate | 0.70 | 0.78 | 0.44 | 0.23 | 3.34 |
| Chloride | 0.82 | 2.19 | 0.29 | 0.14 | 15.41 |
| Fluoride | 0.07 | 0.11 | 0.00 | 0.04 | 0.64 |
| Formate | 9.30 | 8.20 | 7.36 | 0.90 | 56.20 |
| Nitrate | 0.90 | 2.47 | 0.31 | 0.12 | 18.77 |
| Nitrite | 0.58 | 0.58 | 0.35 | 0.12 | 2.25 |
| Phosphate | 1.19 | 3.83 | 0.53 | 0.38 | 37.65 |
| Propionate | 9.37 | 10.52 | 5.81 | 1.29 | 57.69 |
| Sulfate | 19.39 | 45.24 | 4.22 | 0.41 | 353.39 |
| Ethylamininium | 1.87 | 5.86 | 0.03 | 0.01 | 36.74 |
| Sodium | 0.31 | 0.46 | 0.02 | 0.00 | 2.24 |
Disclaimer/Publisher’s Note: The statements, opinions and data contained in all publications are solely those of the individual author(s) and contributor(s) and not of MDPI and/or the editor(s). MDPI and/or the editor(s) disclaim responsibility for any injury to people or property resulting from any ideas, methods, instructions or products referred to in the content. |
© 2023 by the authors. Licensee MDPI, Basel, Switzerland. This article is an open access article distributed under the terms and conditions of the Creative Commons Attribution (CC BY) license (https://creativecommons.org/licenses/by/4.0/).
Share and Cite
Silva, P.J.; Cress, T.; Drover, R.; Michael, C.; Docekal, G.; Larkin, P.; Godoy, A.; Cavero, D.A.; Sin, C.; Waites, J.; et al. Characterization of Particle Size Distributions and Water-Soluble Ions in Particulate Matter Measured at a Broiler Farm. Agriculture 2023, 13, 1284. https://doi.org/10.3390/agriculture13071284
Silva PJ, Cress T, Drover R, Michael C, Docekal G, Larkin P, Godoy A, Cavero DA, Sin C, Waites J, et al. Characterization of Particle Size Distributions and Water-Soluble Ions in Particulate Matter Measured at a Broiler Farm. Agriculture. 2023; 13(7):1284. https://doi.org/10.3390/agriculture13071284
Chicago/Turabian StyleSilva, Philip J., Tanner Cress, Ryan Drover, Cara Michael, Gregory Docekal, Pierce Larkin, Antonio Godoy, Devin A. Cavero, Crystal Sin, Janise Waites, and et al. 2023. "Characterization of Particle Size Distributions and Water-Soluble Ions in Particulate Matter Measured at a Broiler Farm" Agriculture 13, no. 7: 1284. https://doi.org/10.3390/agriculture13071284