Article

Water Accounting for Food Security: Virtual Water and Water Productivity in the Case of Tunisian Olive Oil Value Chain

1
Olive Institute, Route de l’Aéroport Km 1,5, Sfax 3000, Tunisia
2
Higher Agronomic Institute Mograne, University of Cartago, Mograne-Zaghouan 1121, Tunisia
3
Department of Agricultural Engineering, Polytechnique University of Cartagena, Plaza Cronista Isidro Valverde, 30202 Cartagena, Spain
*
Author to whom correspondence should be addressed.
Agriculture 2023, 13(6), 1205; https://doi.org/10.3390/agriculture13061205
Submission received: 16 April 2023 / Revised: 19 May 2023 / Accepted: 26 May 2023 / Published: 7 June 2023
(This article belongs to the Section Agricultural Economics, Policies and Rural Management)

Abstract

:
To achieve food security goals, water accounting seems to be one of the most powerful tools to deal with water scarcity management. Thus, indicators, such as virtual water and water productivity, can be considered complementary rather than competing indicators to assess water demand efficiency use. Water computation is, therefore, a crucial tool to understand the overall tendency of water consumption and to assist the decision makers in their decisional process about water efficiency use in different phases of production. In this perspective, this paper aims to evaluate water use throughout the value chain of the olive oil sector, which is the first strategic agro-industrial sector in Tunisia. This evaluation will be undertaken while taking into account various crucial issues concerning the main two production phases in terms of the importance of water consumption (agriculture and processing phase). In the agriculture phase, the rainfed and irrigated modes will be compared, and in the processing phase, three different processing systems will be evaluated. Thirty surveys with farmers and nine surveys with olive oil mill owners were undertaken in the arid region of Sfax: one of the most important olive oil producers in Tunisia. The results show the importance of the theoretical framework adopted in clarifying the state of water consumption in a strategic sector, such as the Tunisian olive oil sector. In addition, the different calculated indicators highlight the importance of the application of a whole technical package and a controlled and efficient use of water to improve the economic profitability and the necessity to revise the irrigated olive growing extensions’ policies under arid conditions. In addition, in the processing phase, the continuous-two phase system is emphasized as the most relevant system in terms of water efficiency use. This system is proposed to be encouraged by policy makers in future olive mill installations.

1. Introduction

With climate change and a population increase, the acute scarcity of water has increasingly become a food security concern. Thus, climate change, risks on water resource shortages, and the accelerated water demand require a common and rational management to preserve this valuable resource. It is, therefore, important to analyse water management from several perspectives (agronomic, economic, environmental, and political points of view). In fact, in the last decades, supply management policies were the most implemented in managing water. This is based on a strong mobilization of water resources within the construction of dams, hill lakes, wells, irrigated perimeters, etc. This supply management policy has proven to be insufficient to solve the problems of water scarcity in many regions. In addition, other innovative solutions, such as the use of non-conventional resources (desalination of sea-water and wastewater recycling), have remained limited and costly [1,2]. Therefore, it was an inevitable shift to a new policy based on water demand management. Indeed, it was essentially to save water, rationalize its use, and maximize its productivity [3,4]. In this context, water computation seems to be a crucial tool to understand water demand tendencies at both regional and national scales and to deal consequently with food security goals and climatic change challenges. Therefore, “Virtual water” and “Water productivity” are two indicators that can be considered the most powerful indicators in water accounting, and they are able to assist decision-making policies. These two indicators, which will be explained below, are complementary rather than competing concepts [1,4,5].
In this perspective, virtual water is considered to be water used in the production process of an agricultural or industrial product [6]. It is “virtual” since it is often not physically present in the final product, which is why it has not always been counted in trade. This indicator is implemented to describe the potential of a water-scarce country to achieve food security by purchasing part of its food needs from international markets rather than using limited water resources to produce all of its food needs [6]. The “virtual water” perspective is compatible with the concept of integrated water management, in which many aspects of water supply and demand are considered to determine the optimal use of limited water resources. Virtual water therefore has an intrinsic strategic acceptance, affecting agricultural policies and water resource management policies, particularly in arid and semi-arid countries, particularly in the evaluation of some strategic orientations [1,2]. In a convergent way, water productivity aims at measuring the efficiency of water use (i.e., how much a cubic meter of water is able to produce in terms of the product or in terms of the economic benefit). Water productivity is therefore defined as the ratio between production and the amount of water consumed in the production process. In its overall acceptance, the notion of water productivity in the agricultural sector focuses on the idea of “more crop per drop” [7,8]. In fact, these concepts and indicators have only reinforced the studies on water accounting representing a value-added information to better understand and address the issue of water scarcity and its food, livelihood, and environmental implications.
Water indicators have been successfully assessed in several studies by taking into account its international implications on agri-food product transactions (import and export) [1,9,10]. Virtual water was used also in several studies as an indicator to analyze water management and allocation issues, especially in countries facing water scarcity [1,2,11,12]. It is considered an adjustment variable to structural deficits and an instrument to reshape the sectorial allocation of water [13]. In the same context, studies of [14,15,16,17] demonstrate the importance of virtual water in decision making about exporting food products and the accounting of water in trade transactions. Other researchers have studied the assessment of virtual water in some productive systems, such as the cereal sector [1,18] and olive growing sector [19]. Other studies were focusing in several methodological issues and in various case studies on water productivity [20,21,22,23,24,25,26].
In Tunisia, water is considered a limited resource and unevenly distributed in space and time, especially in arid areas. Indeed, the average annual rainfall varies from less than 100 mm in the extreme south and more than 1500 mm in the extreme north of the country. Tunisia is currently experiencing a critical situation with regard to the availability of renewable water resources. With a share of 355 cubic meters per capita/year, the country is classified below the threshold of absolute water scarcity, fixed at 500 cubic meters per capita per year [11]. In these specific conditions, the olive tree was always considered a hardy species that has been able for a long time to withstand high levels of water stress in the arid and semi-arid climates characterizing the areas of Tunisia where the olive tree has experienced the most significant extensions (central and southern Tunisia). However, the prolonged hydric deficit, or the drought, can impact the plant to various degrees, having negative repercussions on the productivity of the olive tree and on the regularity of productions. Various cultural interventions can be implemented to mitigate the impact of these difficult climatic conditions. These interventions are generally related to the adequacy between the development of the olive tree and the capacity of the environment to feed it, in particular to the provision of irrigation water and other safeguarding interventions [27,28,29]. This explains the diversification in recent years of olive production systems. In fact, in Tunisia, in addition to the conventional production system in rainfed systems, we can observe the existence of other production systems that are conducted in irrigated systems, namely the intensive system, the dynamic system, and the super high-density system, in addition to other systems conducted in organic or biodynamic modes [30,31,32].
Olive cultivation plays a very important social role in Tunisia, with more than 310,000 growers accounting for 20% of the active population in the primary sector [33]. Olive oil is a strategic product both for Tunisian agriculture and for its economy as a whole. Indeed, it is the first agri-food product to be exported. In the period of 2015–2019, the production of olive oil was estimated at 196,000 tons, of which 165,000 tons were exported, representing 84% of the total produced. The volume of oil exported by Tunisia represents 20% of olive oil world exports (without taking into account intra-community exports). The export of olive oil occupies first place in the Tunisian agrifood trade balance, both in quantity and in the value of the exports, and represents more than 50% of the total value of the agrifood exports of the country [34]. Furthermore, this sector significantly strengthens the industrial and commercial infrastructure of the country. In fact, it contributes to the constitution of a very important processing industry, ensuring the processing of olives to obtain olive oil, the extraction of oil pomace, refining, and packaging. There are 1672 olive oil mills representing the most important activity of the olive industry in Tunisia with a milling capacity of about 71,203 tons per day [33,34,35]. Three main extraction systems currently coexist: the traditional system, the continuous system with two phases, and the continuous system with three phases. The continuous system is the most dominant with around 70% of the total number of olive oil mills and 92% of the total milling capacity; the three-phases extraction system is the system that requires the most water quantity for olive milling and produces the most important amount of waste-water [33,34,35]. It is very important to highlight that the olive processing industry consumes significant volumes of water, especially in the solid–liquid separation phase (horizontal decanter) in the three-phase system. Significant quantities of water are also used in the olive washing, in vertical centrifuge operations, and, in a reduced degree, in the olive oil mill-cleaning [33,34,35].
As the most agri-food products, olive oil production requires large quantities of water throughout its value chain, from the agriculture phase to the obtention of the final product [2,11,31,35]. A good understanding of the functioning of the olive oil value chain and its decomposition as well as the estimation of the quantities of water consumed along the olive oil chain can probably provide the necessary elements to understand the distribution of this consumption in order to better manage this scarce resource and to determine the critical phases where interventions can have a positive impact in order to reduce the water needs [36]. The management of water resources should help to strengthen the objectives of food security, especially in a country like Tunisia, which suffers from a water shortage increasingly accentuated by climate change and an overexploitation of water resources.
Following the above, the introduction of water computation brings with it a different vision of water accounting, which requires the use of different analytical tools. Thus, in the production and processing phase, water accounting is a central component to reveal the efficiency of water demand use throughout the value chain. In this context, this paper aims to evaluate water efficiency use throughout the Tunisian olive oil value chain. To deal with this purpose, (i) an estimation of virtual water and water productivity in the agricultural phase in rainfed and irrigated olive growing system will be undertaken, and (ii) an estimation of the same indicators will be undertaken in the transformation phase in the case of the three most important trituration systems. The evaluation will consider both water consumption and economic profitability to highlight opportunity costs linked with different alternatives.
In accordance with the study objectives, this paper is structured as follows: after this, introduction, the materials, and methods are described, setting out the conceptual and technical characteristics of the study; following this, the results and the discussion are reported; and to finish, the corresponding conclusions are drawn.

2. Materials and Methods

To deal with the study’s purposes, a methodology based on an agroeconomic approach was adopted. Thus, the methodology was based on an integrated approach through the main water accounting indicators: virtual water and water productivity. The integration of these two concepts was interesting taking into account their perfect harmony in a scientific acceptance. Three key issues were examined: (i) the virtual water used or consumed by the olive plantation and the water biophysical productivity in rainfed and irrigated olive growing systems; (ii) the virtual water consumed and biophysical water productivity in the phase of olive oil transformation in the case of traditional olive mill system, three phase system, and two phase system; and (iii) economic impact based on the study of economic water productivity indicators. The associated indicators were calculated in the case of irrigated and rainfed olive growing systems in the region of Sfax and in the case of olive oil mills of the same region. To obtain more concise information, the evaluation targeted farms of different surfaces’ strata and olive oil mills of different processing systems.

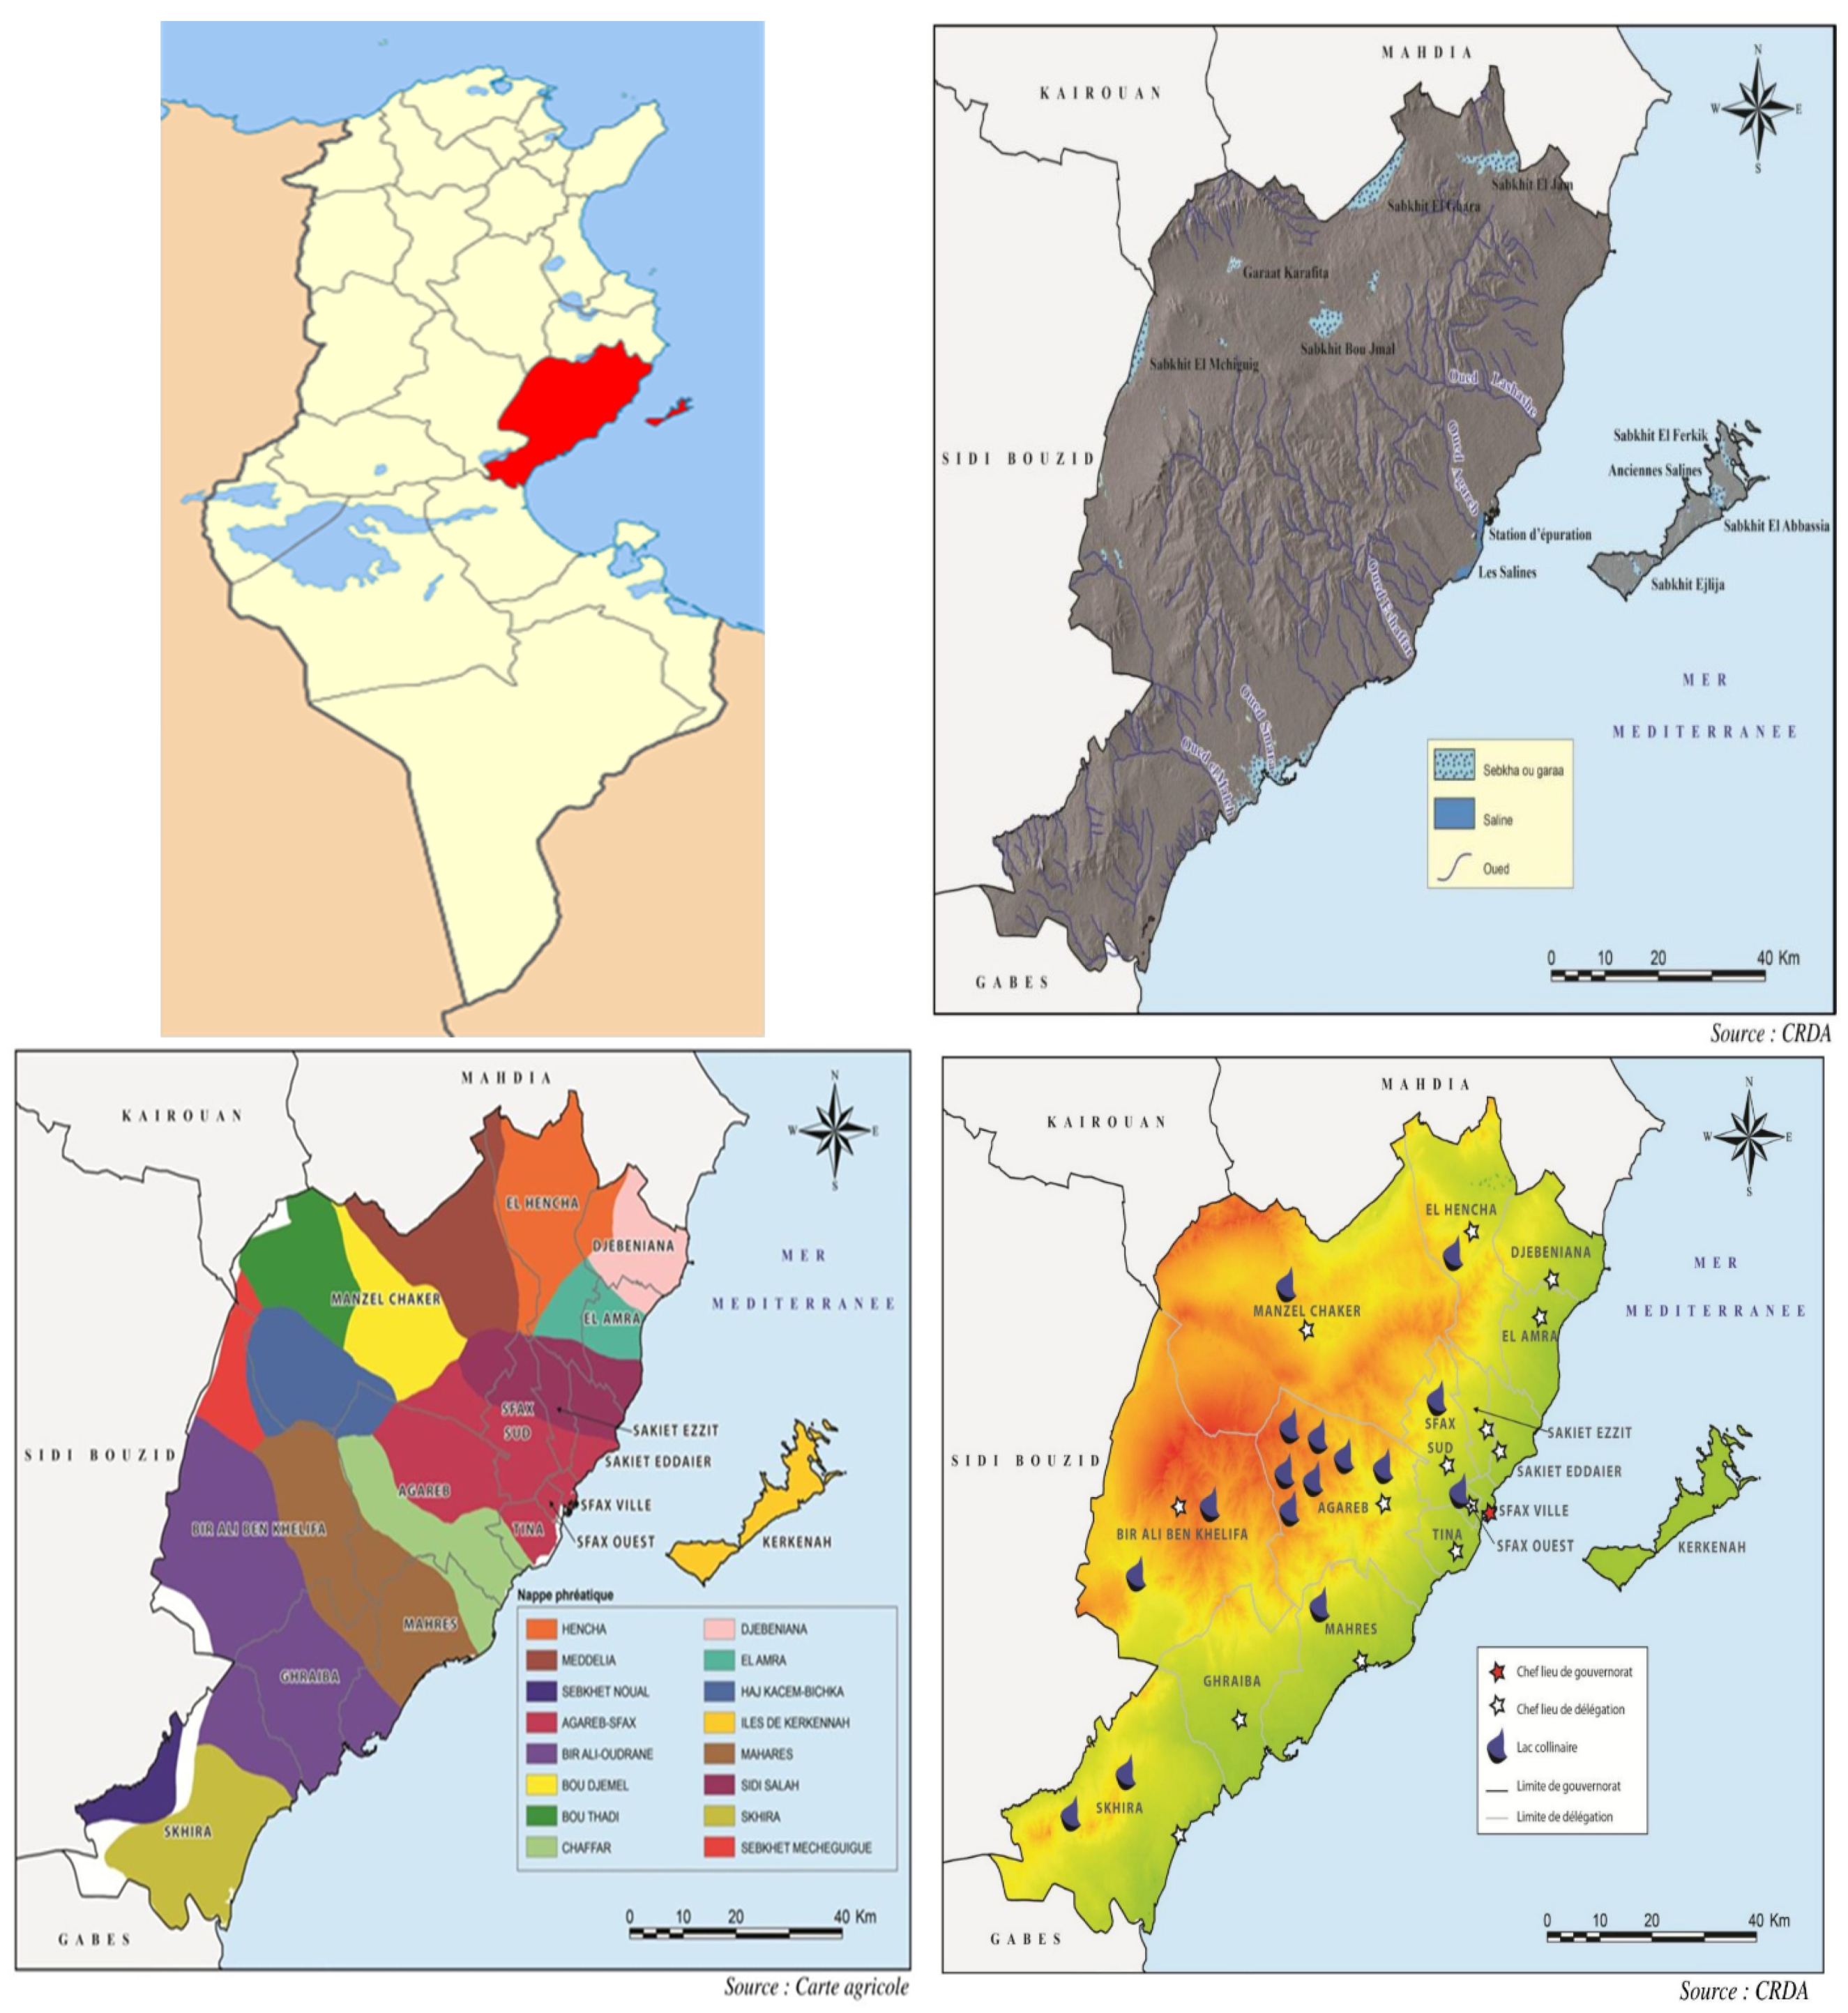
2.1. Sample and Study Area

This study focused on the region of Sfax, a region that belongs to arid bioclimatic stage where the average annual rainfall is about 200 mm (the location map of the study area and additional hydrological information’s are available in Appendix A). Olive growing represents a principal component of the agriculture of the study area where olive tree is generally extended over a sandy–silty to sandy–limono–clay soil. In Sfax, olive growing surfaces represent 83% of the total arboriculture, and the average planting density of traditional rainfed olive is about (17–34 trees/Ha) with very low yields, which increasingly affects the economic viability and sustainability of the olive sector [37]. In addition, the irrigated olive growing area is limited in this zone due to the accentuated problem of water availability.
Concerning olive oil processing industry, it was very important to outline the relevance of the Sfax region by gathering the largest number of olive oil mills (23% of the total national numbers of mills) with a trituration capacity of (10,750 tons of olives per day).
The sample was of 30 olive growing farms: 16 representing the rainfed system and 14 representing the irrigated system. These farms were from four different surfaces’ strata (these strata were represented proportionally to the overall distribution of farms in the study area): M1: 0–5 Ha, M2: 5–10 Ha, M3: 10–50 Ha, M4: more than 50 Ha (the sample was represented in the following proportions: M1: 33%, M2:24%, M3: 25%, and M4: 18%).
The sample of mills was about 9 mills. Of different processing systems, there were 7 of three phases, 1 of two phases, and 1 traditional system (these proportions were in concordance with the overall distribution of olive oil mills in the region). The sample considered in both phases was limited to a reduced number given the complexity and the high level of detail required by the data to be collected.
Face-to-face surveys were directed with farmers and olive mill owners in the period April and May 2018. Indicators were calculated based on data from surveys and primary data collected from the CRDA (abbreviation of its name in French: “Commissariat Régional de Développement Agricole”) of Sfax (Appendix B).
Agricultural surveys contained items about olive growing systems and olive yields, water consumption, farms revenue derived from olive or olive oil sales, productions costs (tillage, harvesting, inputs costs, irrigation, etc.), whereas mill surveys contained several headings, including processing system, quantity of olives processed per year, quantity of water consumed per year, sources of income (services, sale of olive oil, and sale of olive by-product), and costs associated with olives processing (purchase of olives, labor, electricity, price of water consumed, and cost of evacuating olive oil waste water).
Climatic data, such as crop coefficient value per crop (Kc) and any agronomic data, such as rooting of the olive tree and water storage capacity of the soil, were taken from FAO data basis and study results of the Olive Institute of Tunisia [38,39,40]. The potential crop evapotranspiration value (ETp) and rainwater data were from the Tunisian National Institute of Metrology data basis and regional data of the CRDA of Sfax.

2.2. Estimation of Virtual Water for Olive Value Chain

2.2.1. Estimation of Virtual Water in Agricultural Phase

For olive cultivation, virtual water corresponded to the total quantity of water used by this crop during one year to produce olives. This virtual water was drawn from the soil, which received rainfall and possibly irrigation water. The calculation was based on FAO56 method [38,39]. Virtual water calculation details are given in Appendix C.
In this study, the virtual water estimation was undertaken in three steps:
-
the estimation of the monthly water stocks Si in the soil available for the crop;
-
the estimation of the monthly Actual Evapotranspiration AETi of the crop;
-
the estimation of virtual water used per unit of product obtained from the crop.

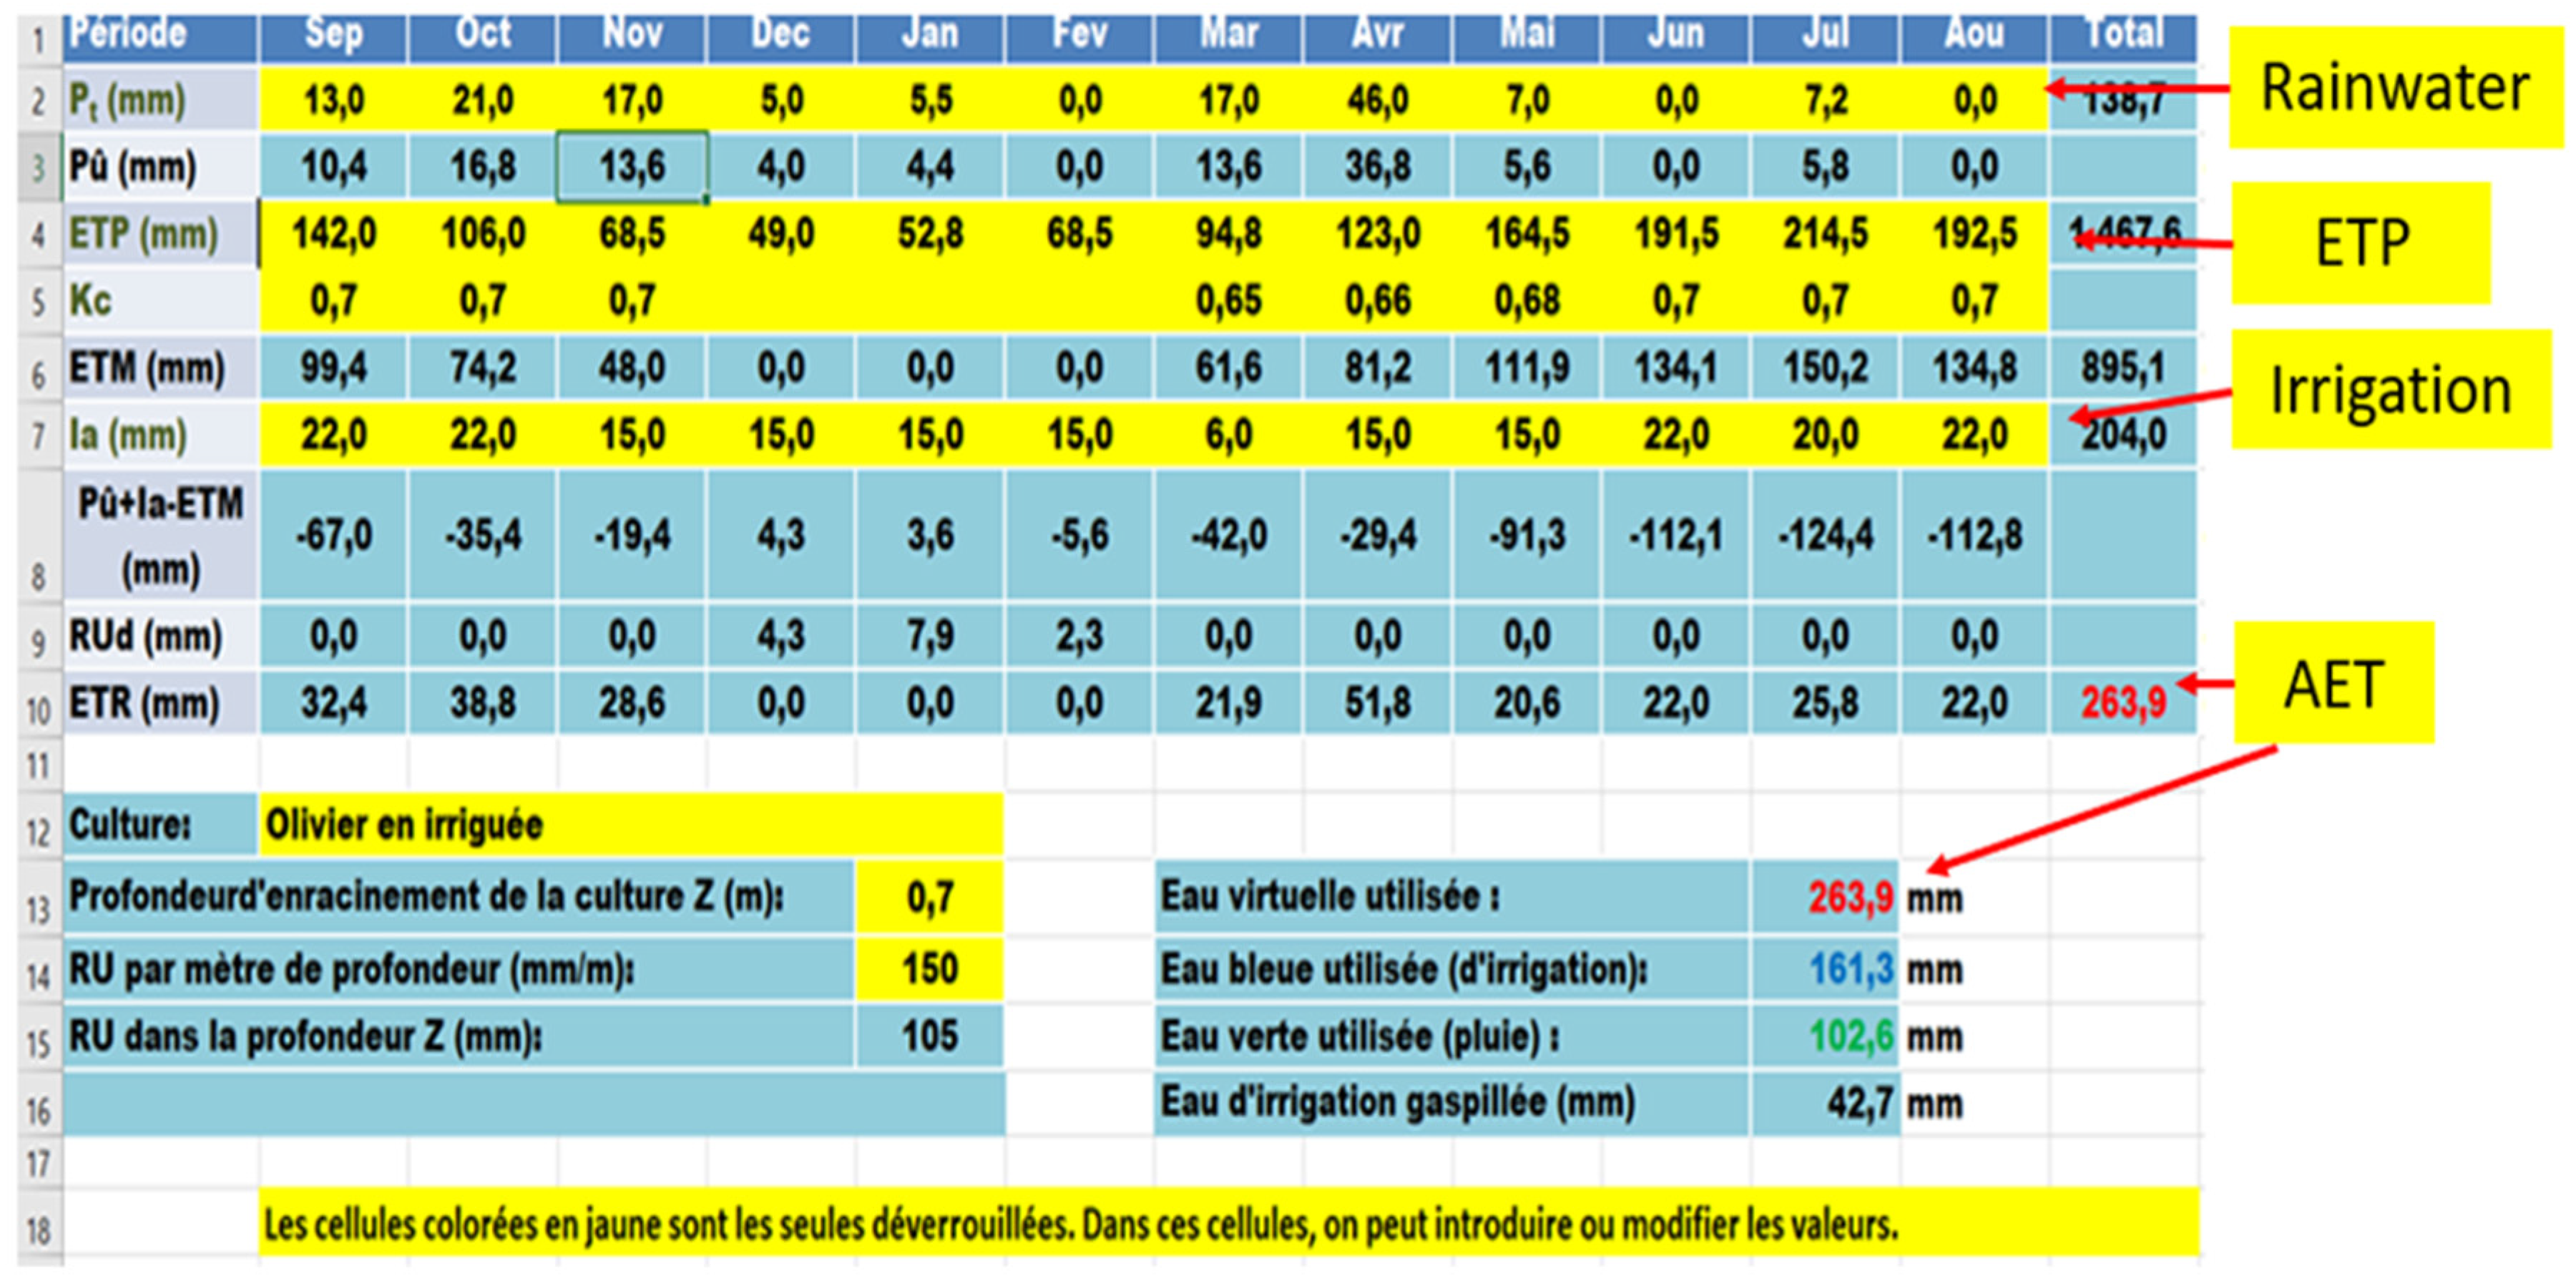
Estimation of Monthly Water Stocks (Si) in Soil Available for Cultivation

The water stock in soil (Si) available at the end of each month i for cultivation was estimated using the following equation system:
S i = 0                                                                               ;       s i   S i 1 + EP i +   I i ETM i   0 S i 1 + EP i + I i ETM i         ;       i f         0 < S i 1 + EP i + I i ETM i < U R chaque   ile azinement   du   solulturepar   plusieurs   é tapes : but   de   la   p é riode   i UR                                                                         ;         i f                 S i 1 + EP i + I i ETM i
where:
  • EPi was the effective precipitation for the month i. EPi = c Pi; with c = 0.8 and Pi: the total precipitation recorded during the month i;
  • ETMi was the maximum monthly crop evapotranspiration, which represented the monthly water requirement of the crop during the month i. ETMi = Kci ETPi; with Kci: the crop coefficient during the month i and ETPi: the potential evapotranspiration (or reference evapotranspiration ET0) during month i;
  • Ii was the amount of irrigation water brought to the crop during month i. In the case of a rainfed crop, Ii = 0 since irrigation was not applied.
  • UR was the water storage capacity of the soil (useful reserve), which depends on the nature of the soil and the depth of rooting of the crop.

Estimation of the Monthly Actual Evapotranspiration AETi of the Crop

The actual monthly evapotranspiration AETi of the crop in month i was estimated using the equation system:
AET i = EP i +   I i + S i 1                     i f     EP i +   I i + S i 1 < ETM i ETM i                                                               i f     EP i +   I i + S i 1   3   ETM i
Thus, the actual annual evapotranspiration AET, which represented the total amount of water consumed by the crop (olive growing) during a year, was given by the equation:
AET = i = 1 12 AET i
If the crop was not irrigated, the Ii in Equation (2) was zero, and the actual annual evapotranspiration produced was denoted here by AETp.

Estimation of the Virtual Water Used per Unit of Product Obtained from the Crop

Virtual water VW1 (in m3/Kg) in agricultural was water consumed per Kg of agricultural product (olive) was estimated using the following equation:
VW 1 = 10   AET R
where AET was in mm (multiplied by 10 we obtained the water consumption in m3/Ha) and R, which represented the yield of the crop, was in Kg/Ha.

2.2.2. Estimation of Virtual Water in Processing Phase

The estimation of virtual water used to produce one Tn of olive oil can be summarised in the following equation:
VW 2 = VWpr Tr
where:
VW2 corresponded to the virtual water in m3 used per Tn of olive oil.
VWpr was the quantity used in the trituration of one Tn of olive in the mill. This quantity corresponded to the washing water of the olives + the cleaning water of the oil mill + the water added during the trituration in the case of three phases olive oil mills (in the case of traditional olive oil mills and two phases’ mills, no water was added in this phase).
Tr was the trituration rate, which corresponded to the rate of oil contained in one kg of olive. In our case, the rate considered was about 21%, which was the average reported by surveyed olive oil mills corresponding to “chemlali”, which was the most transformed variety by the mills of the region.

2.3. Economic Evaluation of Water Productivity

The economic evaluation of water used in the main phases of olive oil value chain in Sfax was estimated through two indicators: biophysical water productivity expressed in Kg/m3 in agricultural phase and in Tn/m3 in the processing phase and the economic water productivity in TND/m3 (TND: Tunisian Dinars), which was the Gross Margin per m3 of water consumed. Water consumed considered in this step was water consumption estimated in the previous section. These indicators allowed for an economic evaluation of the biophysical and economic profitability of the water consumed by the plant and in the processing phase leading to interesting conclusions while making comparisons: (i) in agricultural phase between irrigated and rainfed olive growing systems and between the different groups of farms and (ii) in the processing phase between different processing systems.
The gross margin was mainly chosen as the most suitable economic indicator to allow the most reliable comparison between different production systems using practically the same cost composition directly related to the production process. In this sense, it was important to underline the importance of the share of variable costs in total costs. Thus, according to the International Olive Oil Council’s study on olive production costs [41], variable costs accounted for 75% of total olive growing costs in the case of Tunisia. Nevertheless, perhaps in other studies, it will be interesting to include the fixed charges specially to visualize their weight in relation to the other headings forming the total cost.
The calculated indicators are explained in the following equations:

2.3.1. Water Productivity Indicators in the Agricultural Phase

Biophysical Water Productivity in agriculture phase estimated in Kg/m3 (BWPag) was obtained with the following equation:
BWP ag = R 10   AET
where:
AET was in mm (multiplied by 10 we obtain the water consumption in m3/Ha) and R, which represented the yield of the crop, was in Kg/Ha; i.e., R: olive yield in Kg/Ha.
Economic Water Productivity in agricultural phase estimated in TND/m3 (EWPag) was obtained with the following equation:
EWP ag = GM P
where:
GM: Gross Margin in TND/Ha = Revenue (TND/Ha)—Variable Costs (TND/Ha);
Revenue: was the multiplication of the Quantity Produced (Kg) of olive by the Unit Price of 1 Kg of olive (TND).
NB: For each of the calculated parameters, the weighted averages were estimated. We refer here to the results calculated in each stratum, which represent the average of farm results in proportion to the olive production of each farm. The same will be applicable in the following section to the results from the indicator calculation in relation with the processing system (case of mills of three phase system).

2.3.2. Water Productivity Indicators in Processing Phase

Biophysical Water Productivity in processing phase estimated in Tn of olive/m3 (BWPag) was obtained with the following equation:
BWP pr = QT VWpr
where:
QT: was the total quantity of olive processed in the mill in Tn.
VWpr: water used in the processing phase in m3 estimated in the Equation (5).
Economic Water Productivity in processing phase estimated in TND/m3 (EWPpr) was obtained by the following equation:
EWP pr = MBF VWpr
where:
MBF: Mill benefit in TND = Revenue (TND)—Olive Mill Costs (TND);
Revenue: was the multiplication of the Quantity Produced of olive oil (Tn) by the Unit Price of one Tn of olive oil (TND) + sale of olive pomace.
Concerning Olive Mill costs, costs considered were purchase of the olives, labor cost, cost of water, cost of electricity, and cost of waste–water evacuation.

3. Results

The results will be presented in three sections: (i) the estimation of virtual water in both agricultural and processing phases and their implications to explain hydric performances of the olive trees conducted in irrigated and rainfed modes, and virtual water contained in one Tn of olive oil from different processing olive mills’ systems. This can shed light on the relevance of strategic choices of the country with regard to the extensions of the surfaces of olive trees in irrigated mode in Tunisia and at the same time on the adopted processing systems; (ii) the estimation of economic water productivity to focus on water use efficiency and cost opportunities in different olive growing modes and in different processing systems; and (iii) aggregated results obtained to see the distribution of the quantities of water consumed throughout the different phases of production in order to indicate the systems and phases of greater consumption where water economies should be deployed.

3.1. Virtual Water and Water Productivity in Agricultural Phase

In irrigated farms, the weighted average volume of virtual water used is estimated at 0.87 m3/Kg of olive. The farms that use less virtual water are those in the M3 stratum that consume 0.35 m3 to produce 1 Kg of olive compared to 0.6 m3/Kg in the M1 stratum, 0.69 m3/Kg for the M2 stratum, and 1.45 m3/Kg for the M4 stratum farms. These results clearly show that the irrigated farms in the M3 stratum are the most efficient from the point of view of water management and the control of the crop package. Indeed, the farms in the M3 stratum are the farms that consume less water and produce the highest amounts of olive (Table 1). In the rainfed mode, the weighted average volume of virtual water used is 0.93 m3/Kg of olive. The farms that use less virtual water are those in the M2 stratum that consume 0.66 m3 to produce 1 Kg of olive compared to 1.27 m3/Kg in the M1 stratum: 1.25 m3/Kg for the M3 stratum and 0.73 m3/Kg for the M4 stratum farms. M2 (5–10 ha) and M3 (10–50 ha) are registered as the most efficient strata. These strata correspond to the farms, of which the size is between 5 Ha and 50 Ha and is the most represented stratum at the level of the study area (about 50% of the total farms’ area). These farms represent a very important structural asset at the regional level and represent the more specialized farms in the region.
To estimate virtual water consumed in the agriculture phase in one kg of olive oil which is the final product, we considered the extraction rate of 21%. The observed results in the Table 1 show that in term of average in rainfed system the water consumption is about 4.24 m3 of water to produce one Kg of olive oil whereas in irrigated system this amount is about 4.14 m3 to produce one Kg of olive oil. This interesting result show clearly the importance of controlled irrigation in improving production performances and can be explained by the highest registered yields in irrigated mode. These values are different in the different strata, this demonstrates the possibilities to decrease water consumption through the same production system with only the application of more adapted technical package.
As is explained above, economic water productivity is assessed based on two indicators: biophysical water productivity and economic water productivity.
In irrigated farms and concerning biophysical water productivity, 1 m3 of water consumed produces an average of 1.15 Kg of olives with an economic water productivity of 1.33 TND/m3. The farms of the M3 stratum have the best values of water productivity with an average of 2.88 Kg/m3 but have less economic water productivity 0.82 TD/m3, whereas farmers of the M4 stratum present less biophysical water productivity (0.69 Kg of olive/m3 of the water) but the highest economic water productivity was 1.81 TND/m3 (Table 1). In a rainfed olive growing system, 1 m3 of water consumed produces an average of 1.08 Kg of olives, which corresponds to an economic water productivity of an average of 0.78 TND/m3. The farms with the highest water productivity are those of the M2 stratum with 1.52 Kg/m3 and an economic water productivity of 1.26 TND/m3. These farms of 5 ha to 10 ha are in fact the typical rainfed olive farms with an important degree of specialization and control of the technical package (Table 1).

3.2. Virtual Water and Water Productivity in Processing Phase

Concerning that the virtual water in the processing phase is evident, the wastes registered in the case of three phase system, consuming 4.84 m3 in one tone of olive oil produced, whereas the gap is very big comparing with the tow system with 2.14 m3/Tn of olive oil and the traditional system with 1.91 m3/Tn of olive oil. However, there is great variability between the different three phase oil mills: the virtual water varies from 3.52 to 7.90 m3/Tn of olive oil. This shows the difference between the oil mills in terms of technicity, equipment, and know-how in water use. The traditional system shows better results in terms of virtual water but is important to indicate the reduced processing capacity of this system and the lowest quality of olive oil produced (Table 2). No irrefutable conclusions can be drawn before studying both biophysical and economic productivity of water in the processing phase.
The registered biophysical water productivity from the system is of 0.97 Tn of olive/m3 in the three phase system, 2.22 Tn of olive/m3 in the two phases, and 2.5 Tn of olive/m3 in the traditional system. The average of the biophysical productivity of water weighted according to the quantity of olives crushed shows that the two phase continuous chain system allows an improvement of 1.23 Tn of olives per m3 comparing with the three phase system.
Economic water productivity registered values in the processing phase are about: 173 TND/m3 in the three system, 310 TND/m3 in the two system, and 275 TND/m3 in the traditional system. The three phase system presents the lowest economic productivity value compared to the other two processing systems. However, there is a great variability between the different three phase oil mills, with economic productivity varying between 90 TND/m3 and 265 TND/m3 (Table 3). Finally, it is important to indicate that the average economic water productivity in the two phase system provides an improvement of 137 TND/m3.

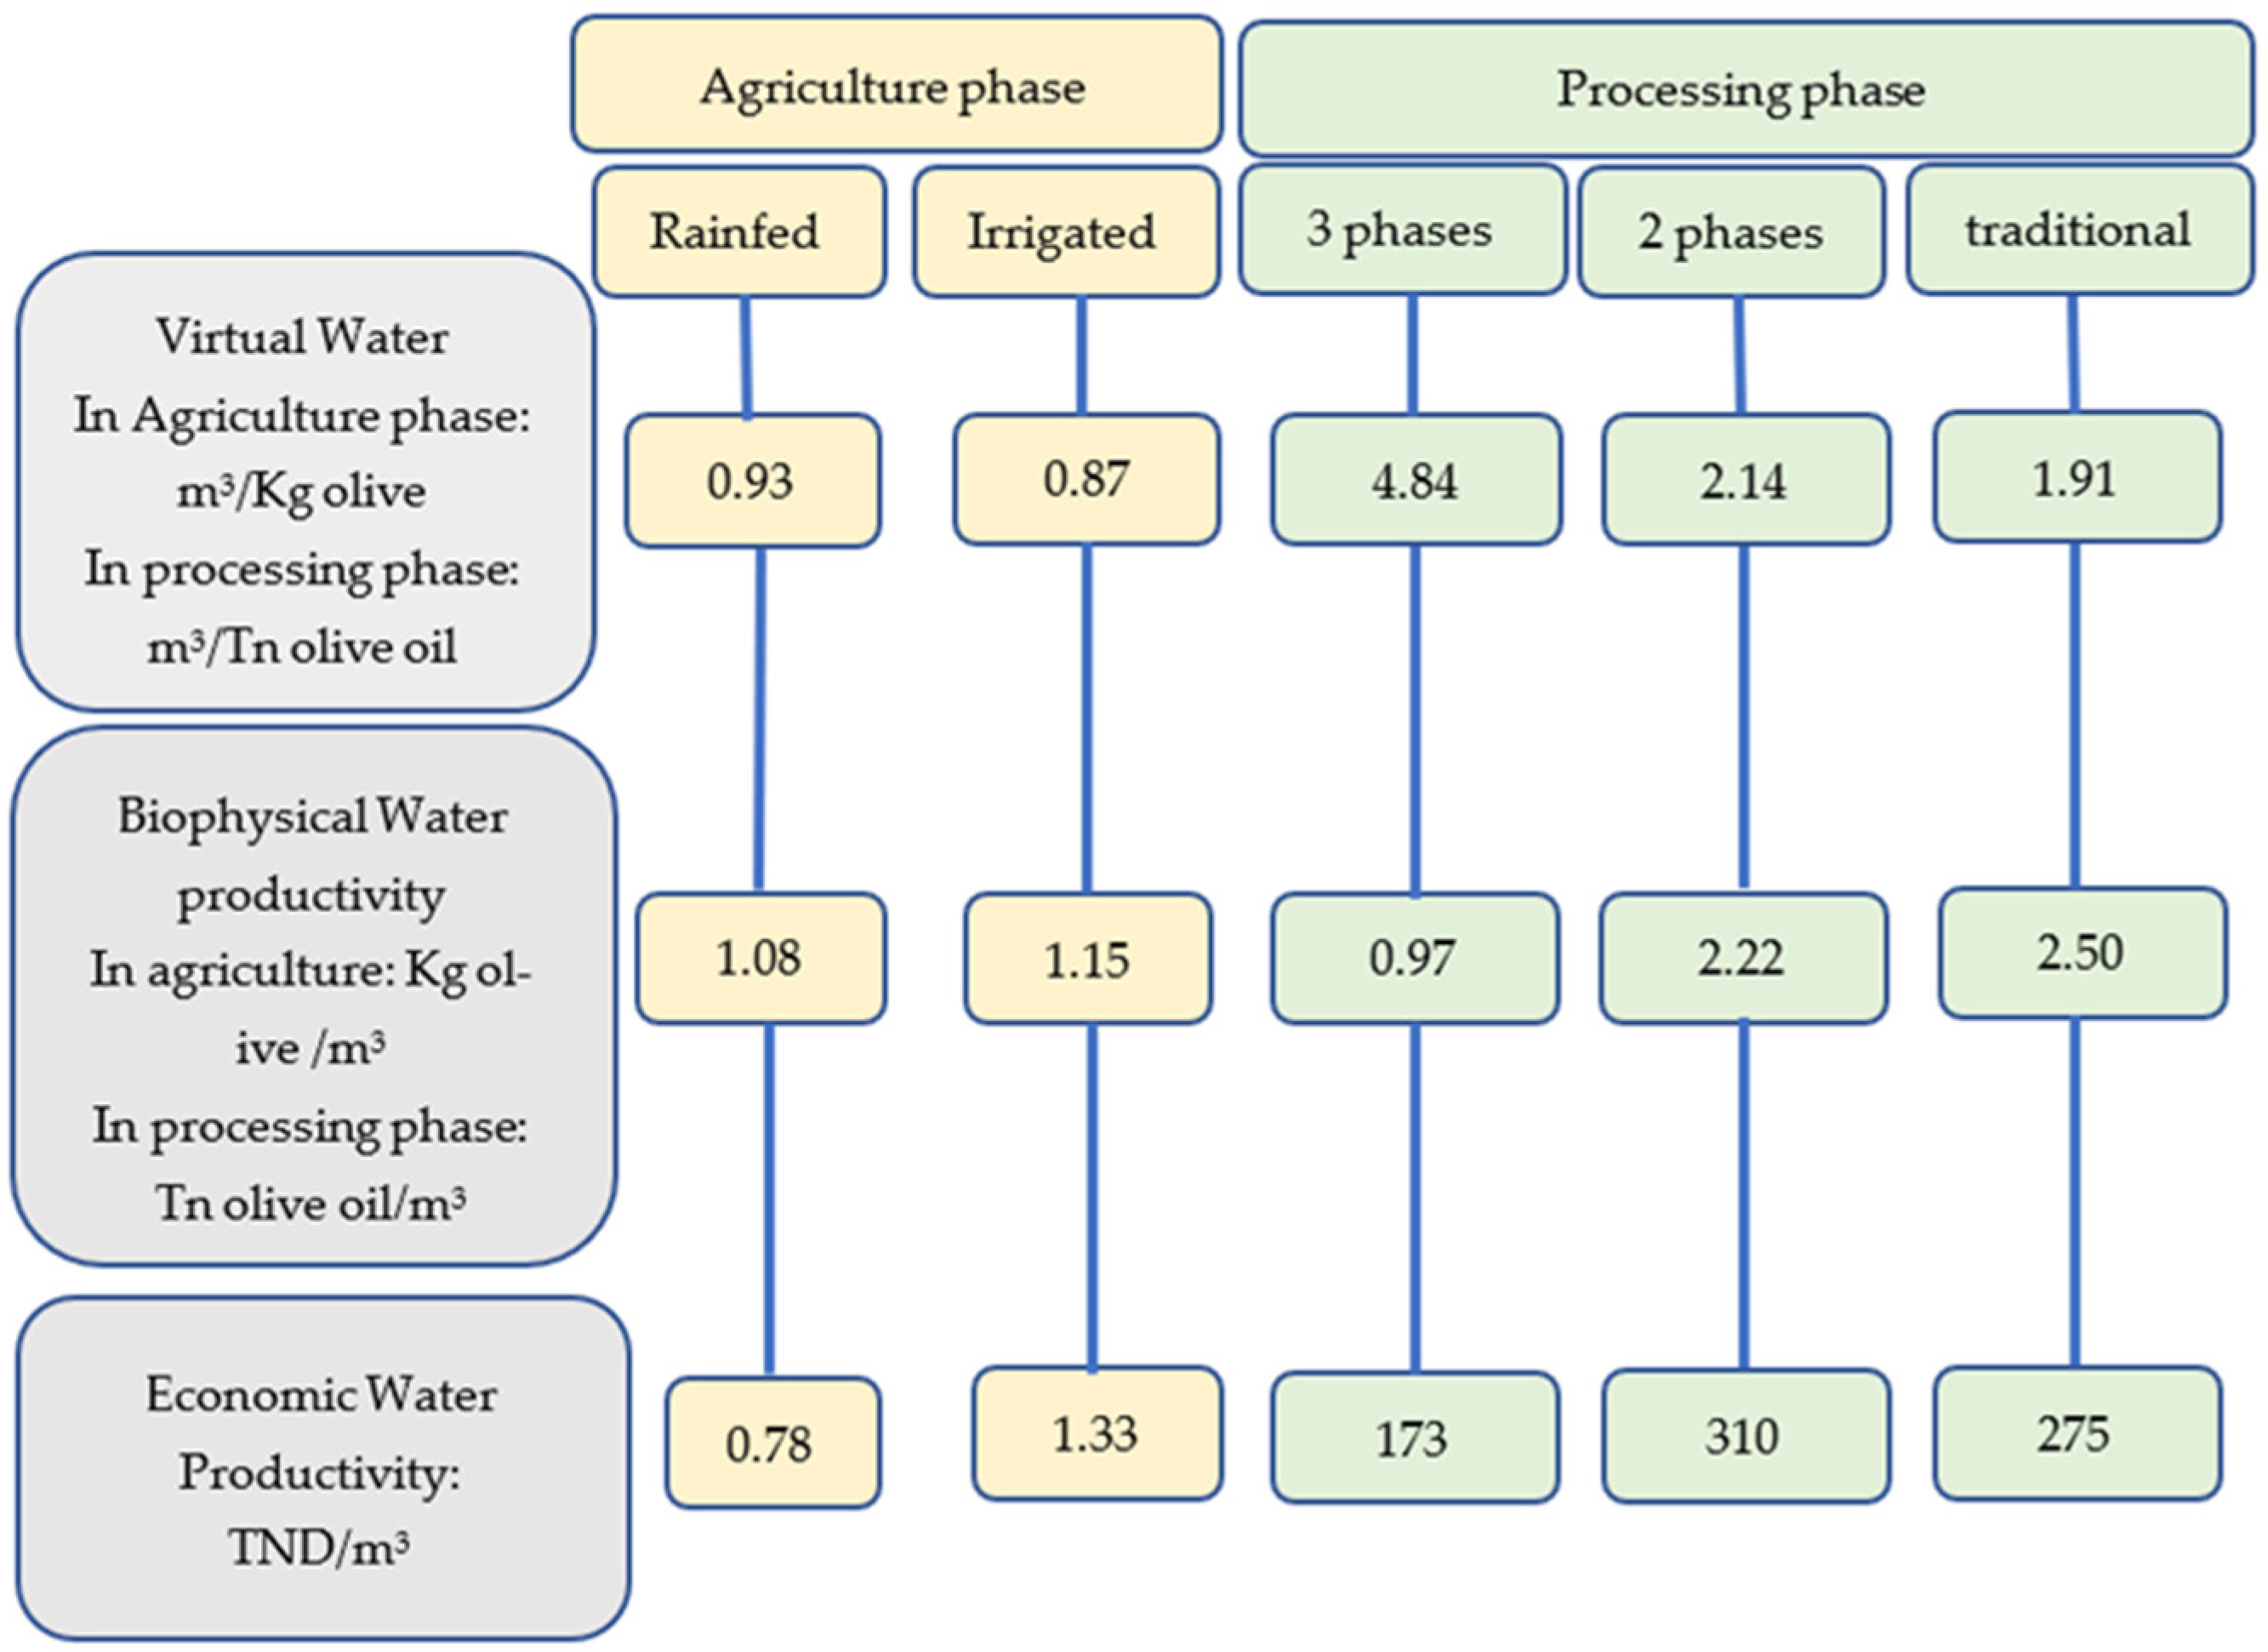
3.3. Recapitulation of Water Accounting through Olive Oil Value CHAIN

Figure 1 presents a summary of the results along the value chain of virtual water, biophysical water productivity and economic water productivity in agriculture phase, and processing phases. It shows the importance of the quantity of water used in the agricultural phase compared to that consumed in the processing phase. Thus, to produce one Kg of olive oil, we need, in the agriculture phase, 4.24 m3 in a rainfed and 4.12 m3 in an irrigated system. In the processing system, this quantity varies between 4.84 m3/Tn of olive oil in the three phase system and 1.91 m3/Tn of olive oil in the traditional system. In m3/Kg of olive oil, these quantities are, respectively: 0.0048 and 0.0019, which are insignificant quantities compared to those consumed in the agricultural phase. However, if we take into account the costs related to water consumption, we can deduce that the total costs are almost equal. This is due to the difference between the price of water in agriculture and in the processing industry. In our case, the price of irrigation water varies between 0.12 TND/m3 and 0.25 TND/m3 while the price of water in the agro-industrial sector varies between 0.816 TND/m3 and 1.6 TND/m3.

4. Discussion

This work has the originality to combine several sound indicators of water accounting (virtual water and water productivity) and, at the same time, examine water efficiency consumption throughout the value chain of olive oil. These concepts were generally used separately and in only one phase of production, in most cases in the scientific literature [1,2,19], in spite of the complementarity of their conceptions and the relevance of the conclusions that can be drawn from their integrated use throughout the whole value chain. Water accounting and the study of its economic productivity is a fundamental step in understanding the success factors that can lead to good decisions about food security, especially in a context of water scarcity.
In the region of Sfax, the different calculated indicators (virtual water, biophysical water productivity, and economic water productivity) highlight:
In the agriculture phase, the importance of the application of a whole technical package and a controlled and efficient use of water in order to improve the profitability of olive cultivation [30,31]. Certainly, the excessive supply of water can in no way lead to higher profitability on olive farms conducted on an irrigated system because of the high cost of production of this system and because of the possible loss of water outside the period of high needs of the plant [30,31,32]. However, a suitable combination of inputs with the full crop technical operations (pruning and tillage) is necessary to improve productivity. Indeed, generally the farms that provide controlled water doses accompanied with an adequate technical package are the most productive and the most economically profitable contributing, therefore, to a better management of the water resource. Indeed, when comparing irrigated and rainfed systems is clearly shown in the high quantities of virtual water per kg of olive in a rainfed system. This is due to the low yields of the olive tree per hectare in a rainfed olive growing system comparing with irrigated system. This makes the virtual water per Kg of olive a significant amount compared to the irrigated mode. Therefore, it seems obvious that controlled irrigation water inputs and an adequate technical package can contribute to the improvement of the values of water consumed per Kg of olive produced [1,2,30,42]. Therefore, the comparison of the two olive growing systems (irrigated and rainfed) demonstrates a higher economic water productivity in irrigated farms (in terms of production and in terms of benefit). It is very interesting to highlight the variability of these parameters in each same system. This makes it interesting to consider the possibility of improving results in the studied area (for example, through complementary irrigation in the rainfed mode in the critical phase of the plant instead of a complete intensification of the system or through the best control of the production factors). This will allow an improvement in production without compromising many production factors and additional production costs [32]. In reality, good production is not only conditioned with the high supply of water, but also with the full control of the technical package and with the control of water doses proportionally with plant’s needs [29,30,31]. In addition, the observed deficit in biophysical water productivity (kg/m3) in the farms of the Sfax governorate can be perfectly compensated with a better economic efficiency in terms of profit by the control of the balance between costs and benefits. This can be done either through good input management or through more efficient marketing policies (or both together).
Then, the overall weighted average of virtual water in olive growing farms (rainfed and irrigated) in the study area (southern Tunisia) is about 0.9 m3/Kg while this value is about 2.32 m3/Kg of olives in the northern zone, especially in the Zaghouan region [39]. In this same northern area, producing 1 Kg of soft wheat requires a virtual amount of water of about 1.14 m3 [1,2,39]. These results highlight and reinforce the importance of strategic choices on crop allocation based on cost opportunity in order to achieve food security goals at the national level. Indeed, it seems more profitable in terms of water security and in terms of cost opportunity to adapt strategic choices to the climatic stage [1,2,42,43].
In the processing phase, three phase oil mills in the Sfax region recorded lower biophysical productivity values than the two phase oil mill, which shows the importance of the two phase system as the system of the future for improving the water productivity of oil mills. However, despite the water optimization that it theoretically allows, this system seems to be still unexploited in Tunisia [44]. However, it is important to point out that this study includes only a limited number of oil mills and that the study should be extended to draw more relevant conclusions. In relation to the economic productivity, there is a great variability between the different three phase oil mills. This shows the great possibilities that three oil mills have to improve within the improvement of technical performances. The improvement of economic productivity can be achieved either by improving water management or by improving the economic performance [44]. In addition, the average economic water productivity shows that the two phase system provides significant improvement compared with the three phase system. This is explained by the better water optimization obtained in this system in addition to the contribution of the two phase system to the improvement of the economic benefits through: (i) the improvement of the quality of the olive oil, which will undoubtedly have a positive impact on the income from oil sales, and (ii) through the minimization of the costs saved within the elimination of water waste mainly generated by three phase system. Therefore, the two phase system is very important, not only for the more efficient use of water, but also for the highest quality of its olive oil [44,45,46,47,48]. These results, in addition to those of virtual water, encourage once again the recommendation to adopt the two phase system for new oil mill implantations.
The traditional or pressure system shows a higher average of biophysical water productivity than the two continuous chain systems (three phase and two phase), which is to be expected, as the pressure is less water intensive, as water is usually only used for cleaning or centrifugation. However, this water saving is obtained in detriment of the final quality of the product because if it allows for water saving, this system presents great disadvantages from the point of view of quality and reduced processing capacity and requires more labor. This is why, being no longer competitive, it tends to disappear in Tunisia as in the other olive oil producing countries [44,45,49].
In a global vision, the agricultural and processing phases are the two most water-intensive phases to produce olive oil, which is why this study focuses on them. The values of virtual water, biophysical water productivity, and economic water productivity in both phases vary according to farm conducting systems and on mill processing systems. These differences thus show the alternatives and the scope for improvement. In fact, it is relevant to highlight the important quantities of water used in the agricultural phase compared to those consumed in the processing phase [50]. However, the costs associated with these quantities are almost the same given the different pricing systems in agriculture and the agroindustry [44,45,51].

5. Conclusions

The undertaken study emphasizes the importance of the conducting modes and the control of the production techniques for saving water in the production of olive oil, both in the agricultural phase and in the processing phase. The agricultural phase is always the most critical phase in terms of water consumption, so an intervention at this phase seems indispensable to reduce the pressure on the water resource.
This study opens up a wealth of opportunities for further research. These include more in-depth studies (i) of water accounting throughout the Tunisian olive oil value chain in different regions of the country, (ii) of the same issues in most diversified production systems, and finally, (iii) of the understanding of the technical and economic efficiency of the studied farms and olive oil mills in relation to water use.

Author Contributions

Conceptualization, S.E., O.H. and S.B.A.; methodology, S.E., S.B.A. and O.H.; formal analysis, S.E., O.H., S.B.A. and O.B.; investigation, S.E., O.H., S.B.A. and O.B.; resources, S.E., O.B., S.B.A. and O.H.; data curation S.E., O.H. and S.B.A.; writing—original draft preparation, S.E., O.H. and S.B.A.; writing—review and editing, S.E., O.H., S.B.A. and O.B.; visualization, S.E., O.H., S.B.A. and O.B.; supervision, S.E. and O.B.; project administration, S.E. and O.B. All authors have read and agreed to the published version of the manuscript.

Funding

This research was funded by the EU program for Research and Innovation solutions in the Mediterranean region PRIMA under the project FREECLIMB “Fruit Crop Resilience to Climate Change” and the Tunisian Ministry of Higher Education and Scientific Research.

Data Availability Statement

Not applicable.

Conflicts of Interest

The authors declare no conflict of interest.

Appendix A

Figure A1. Study area localization and hydrological information [52].
Agriculture 13 01205 g0a1

Appendix B

Table A1. Agricultural phase additional information.
Olive Growing SystemsWater VariablesEconomic Variables in Agricultural Phase
AET (mm)Annual Irrigation (m3/Ha)Olive Yields Tn/HaRevenue
(TND/Ha)
Gross Margin (TND/Ha)Costs
(TND/Ha)
IrrigatedM130220945.0335212597924
M21854862.6835542760794
M32009305.7342016401780
M41607651.133852896489
Average2059912.437092726983
RainfedM122801.81340627713
M210001.518501260590
M331202.520391528511
M413501.8519731593380
Average18501.9819901443547
Source: Calculated by the authors based on surveys and CRDA Sfax data basis 2018.
Table A2. Processing phase additional information.
Processing SystemOlive MillQuantity of Olive
Triturated (Tn)
Total Water Consumption (m3) Total Annual Economic Benefit (TND)
Three phase systemH117011361258,600
H253387967972,000
H314,36713,0612,729,750
H461014519406,720
H518343057642,000
H614461364146,000
H718622069548,200
Two phase systemH8728133101,026,000
Traditional systemH933613537,000
Source: Calculated by the authors based on surveys directed by olive oil mills.

Appendix C

Figure A2. Excel spreadsheet original page.
Agriculture 13 01205 g0a2

References

  1. Souissi, A.; Chebil, A.; Mtimet, N. Virtual water flows and water value in Tunisia: The case of wheat and olive. Arab. J. Geosci. 2019, 12, 421. [Google Scholar] [CrossRef]
  2. Souissi, A.; Mtimet, N.; McCann, L.; Chebil, A.; Thabet, C. Determinants of Food Consumption Water Footprint in the MENA Region: The Case of Tunisia. Sustainability 2022, 14, 1539. [Google Scholar] [CrossRef]
  3. Elfkih, S.; Feijoo, M.L.; Romero, C. Agricultural sustainable management: A normative approach based on goal programming. J. Oper. Res. Soc. 2009, 60, 534–543. [Google Scholar] [CrossRef]
  4. Letseku, V.; Grové, B. Crop Water Productivity, Applied Water Productivity and Economic Decision Making. Water 2022, 14, 1598. [Google Scholar] [CrossRef]
  5. Sraïri, M.T.; Assis, L.; Kuper, M. Assessing physical and economic water productivity in crop-livestock systems. Afr. Mediterr. Agric. J.-Al Awamia 2021, 133, 63–82. [Google Scholar]
  6. Allan, J.A. Fortunately, there are substitutes for water otherwise our hydro-political futures would be impossible. Priorities Water Resour. Alloc. Manag. 1993, 13, 26. [Google Scholar]
  7. FAO. Crops and Drops: Making the Best Use of Water for Agriculture; FAO: Rome, Italy, 2002; 22p. [Google Scholar]
  8. Giordano, M.; Rijsberman, F.; Maria Saleth, R. More Crop Per Drop: Revisiting a Research Paradigm; IWA Publishing House: London, UK, 2006. [Google Scholar]
  9. Dominguez, F. Can virtual water operators help. Util. Policy 2010, 18, 129–134. [Google Scholar] [CrossRef]
  10. Zho, N.; Samson, E.L. Estimation of virtual water contained in international trade products using nighttime imagery. J. Appl. Earth Obs. Geoinf. 2012, 18, 243–250. [Google Scholar] [CrossRef]
  11. Treyer, S. La planification stratégique à long terme de l’eau en Tunisie. Rev. Tiers Monde 2001, 166, 455–474. [Google Scholar] [CrossRef]
  12. D’Ambrosio, E.; De Girolamo, A.M.; Rulli, M.C. Assessing sustainability of agriculture through water footprint analysis and in-stream monitoring activities. J. Clean. Prod. 2018, 200, 454–470. [Google Scholar] [CrossRef]
  13. Rousset, N. The Impact of Climate Change, Water Security and the Implications for Agriculture. Clim. Chang. China Chall. 2007, 2007, 1213. [Google Scholar] [CrossRef] [Green Version]
  14. Wichelns, D. The role of virtual water in efforts to achieve food security and other national goals, with an example from Egypt. Agric. Water Manag. 2001, 49, 131–151. [Google Scholar] [CrossRef]
  15. Hoekstra, A.Y.; Hung, P.Q. Globalisation of water resources: International virtual water flows in relation to crop trade. Glob. Environ. Chang. 2005, 15, 45–56. [Google Scholar] [CrossRef]
  16. Zhan-Ming, C.; Chen, G.Q. Virtual water accounting for the globalized world economy: National water footprint and international virtual water trade. Ecol. Indic. 2013, 28, 142–149. [Google Scholar]
  17. Zhang, C.; Anadon, L.D. A multi-regional input–output analysis of domestic virtual water trade and provincial water footprint in China. Ecol. Econ. 2014, 100, 159–172. [Google Scholar] [CrossRef]
  18. Novo, P.; Garrido, A.; Varela-Ortega, C. Are virtual water “flows” in Spanish grain trade consistent with relative water scarcity? Ecol. Econ. 2009, 68, 1454–1464. [Google Scholar] [CrossRef] [Green Version]
  19. Ben Abdallah, S.; Elfkih, S.; Ghzel, L.; Souissi, A.; Chbil, A.; Frija, A.; Istambouli, T.; Mtimet, N.; Abdelkafi, B.H.; Ben Alaya, A. Evaluation de l’Eau Virtuelle en Aridoculture: Perspectives pour un Développement Durable dans les zones de Sfax, Mahdia et Médenine. Rev. Régions Arid. 2014, 35, 2011–2015. [Google Scholar]
  20. Zhang, Y.; Huang, K.; Yu, Y.; Yang, B. Mapping of water footprint research: A bibliometric analysis during 2006–2015. J. Clean. Prod. 2017, 149, 70–79. [Google Scholar] [CrossRef]
  21. Van Halsema, G.E.; Vincent, L. Efficiency and productivity terms for water management: A matter of contextual relativism versus general absolutism. Agric. Water Manag. 2012, 108, 9–15. [Google Scholar] [CrossRef]
  22. Scheierling, S.; Treguer, D.O.; Booker, J.B. Water Productivity in Agriculture: Looking for Water in the Agricultural Productivity and Efficiency Literature. Water Econ. Policy 2016, 2, 1650007. [Google Scholar] [CrossRef]
  23. Shirmohammadi-Aliakbarkhani, Z.; Afshin, A. Investigation of economic analysis of water productivity in the most important crops of Torbat-e-Jam plain. Singap. J. Sci. Res. 2021, 11, 23–30. [Google Scholar]
  24. Lovarelli, D.; Bacenetti, J.; Fiala, M. Water Footprint of crop productions. Sci. Total Environ. 2016, 548–549, 236–251. [Google Scholar] [CrossRef] [PubMed]
  25. Xiao, J.; Wei, J.; Wu, M.; Cao, X. Bibliometric and Visual Analysis of Crop Water Footprint: A Widely Used Agricultural Water Resources Evaluation Method. Water 2022, 14, 2866. [Google Scholar] [CrossRef]
  26. Yerli, C.; Sahin, U. An assessment of the urban water footprint and blue water scarcity: A case study for Van (Turkey). Braz. J. Biol. 2022, 82, e249745. [Google Scholar] [CrossRef] [PubMed]
  27. Gargouri, K.; Bentaher, H.; Rhouma, A. Novel method to assess drought stress of olive tree. Agron. Sustain. Dev. 2012, 32, 735–745. [Google Scholar] [CrossRef] [Green Version]
  28. Ghrab, M.; Gargouri, K.; Bentaher, H.; Chartzoulakis, K.; Ayadi, M.; Ben Mimoun, M.; Masmoudi, M.M.; Ben Mechlia, N.; Psarras, G. Water relations and yield of olive tree (cv. Chemlali) in response to partial root-zone drying (PRD) irrigation technique and salinity under arid climate. Agric. Water Manag. 2013, 123, 1–11. [Google Scholar] [CrossRef]
  29. Trabelsi, L.; Gargouri, K.; Ben Hassena, A.; Ghrab, M. Impact of drought and salinity on olive water status and physiological performance in an arid climate. Agric. Water Manag. 2019, 213, 749–759. [Google Scholar] [CrossRef]
  30. Ben Abdallah, S.; Elfkih, S.; Parras Lopez, C.; Suárez-Rey, E.M.; Romero-Gámez, M. Evaluation of the environmental sustainability in the olive growing systems in Tunisia. J. Clean. Prod. 2021, 282, 124526. [Google Scholar] [CrossRef]
  31. Ben Abdallah, S.; Parras Lopez, C.; Elfkih, S.; Suárez-Rey, E.M.; Romero-Gámez, M. Sustainability assessment of traditional, intensive and highly-intensive olive growing systems in Tunisia by integrating Life Cycle and Multicriteria Decision analyses. Sustain. Prod. Consum. 2022, 33, 73–87. [Google Scholar] [CrossRef]
  32. Elfkih, S.; Sahnoun, H.; Ameur, W.; Ben Abdallah, S.; Albouchi, L. Organic olive growing farms’ sustainability assessment: The Tunisian case. EMJE 2022, 7, 565–581. [Google Scholar] [CrossRef]
  33. DGPA. Données Statistiques de la Direction Générale de Production Agricole; Ministère de l’Agriculture, des Ressources Hydrauliques et de la Pêche: Tunis, Tunisia, 2021. [Google Scholar]
  34. Elfkih, S.; Fernández-Uclés, D.; Mozas-Moral, A.; Bernal-Jurado, E.; Medina-Viruel, M.J. ICT as a development factor in the Tunisian olive oil sector. New Medit 2021, 20, 1–14. [Google Scholar] [CrossRef]
  35. Elkadri, A.; Elfkih, S.; Sahnoun, H.; Abichou, M. Storage tanks’ olive mill wastewater management in Tunisia. Sustain. Water Resour. Manag. 2021, 8, 1–14. [Google Scholar] [CrossRef]
  36. Kinha, C.; Dossouhoui, F.; Megbleto, I. Formation des responsables des PEA et de leurs prestataires sur l’analyse filière et le développement de la chaîne de valeur au Bénin. In Proceedings of the Atelier International «Capitalisation et Echange des Expériences sur le Renforcement de Compétences en Recherche Agricole pour le Développement (RAD)», Cotonou, Bénin, 11–15 May 2009; Available online: http://www.icra-edu.org/obects/ard_fr_sharing/Benin6.pdf (accessed on 1 April 2020).
  37. AgriDATA. Statistiques du Ministère de l’Agriculture Tunisien. 2019. Available online: http://agridata.tn/ (accessed on 1 April 2020).
  38. Allen, R.G.; Pereira, L.S.; Raes, D.; Smith, M. Crop Evapotranspiration: Guidelines for Computing Crop Water Requirements; FAO Irrigation and Drainage Paper 56; United Nations Food and Agriculture Organization: Rome, Italy, 1998. [Google Scholar]
  39. Souissi, A.; Ben Alaya, A.; Abdelkefi, B.H.; Stambouli, T.; Ghzel, L.; Belaid, R.; Naceur, Y.; Ousleti, M.; Elfkih, S.; Ben Abdallah, S. Contribution of virtual water to improving water security in Tunisia: Soft wheat and olive trees in the Zaghouan region. In Proceedings of the International Seminar, Sustainable Management of Water and Soil Resources: Situation, Challenges and Prospects, Hammamet, Tunisia, 19–20 November 2013. [Google Scholar]
  40. Masmoudi, C.; Hbabeib, H. Utilisation des Fonctions de Répartition de la Pluie Pour la Détermination des Besoins en Eau d’Irrigation de l’Olivier (Olea europaea L.). 2017. Available online: http://www.iosfax.agrinet.tn/annonce/Fonctions%20de%20r%C3%A9partitions.pdf (accessed on 1 May 2018).
  41. International Olive Oil Council (IOC), International Olive Oil Production Costs Study. 2015. Available online: https://www.internationaloliveoil.org/wp-content/uploads/2019/11/INTERNATIONAL-OLIVE-OIL-PRODUCTION-COSTS-STUDY-.pdf (accessed on 15 June 2018).
  42. Ben Abdallah, S.; Elfkih, S.; Ghzel, L.; Souissi, A.; Chebil, A.; Frija, A.; Stambouli, T.; Mtimet, N.; Abdelkafi, B.; Benalaya, A. Evaluation de l’eau virtuelle consommée par l’Oléiculture dans le Centre Est et le Sud-Ouest de la Tunisie: Cas des régions de Sfax et Médenine. Revue Régions Arides 2014, 35, 2011–2016. [Google Scholar]
  43. Chebil, A.; Soula, R.; Souissi, A.; Bennouna, B. Efficiency, valuation, and pricing of irrigation water in northeastern Tunisia. Agric. Water Manag. 2022, 266, 107577. [Google Scholar] [CrossRef]
  44. Ayadi, M.; Fourati, H.; Triki, M.A. Olive Oil: A Process under Control, du Guide de l’huile d’olive en Tunisie: l’huile d’olive Éclaire la Tunisie Depuis Carthage; Du Ministère de l’industrie et l’Institut de l’Olivier: Tunis, Tunisia, 2013; pp. 61–69. [Google Scholar]
  45. Civantos, L. Obtencion del Aciete de Oliva Virgin, 2nd ed.; Agricola Espagnola: Madrid, Spain, 1999. [Google Scholar]
  46. Salomone, R.; Loppolo, G. Environmental impacts of olive oil production: A Life Cycle Assessment case study in the province of Messina (Sicily). J. Clean. Prod. 2012, 28, 88–100. [Google Scholar] [CrossRef]
  47. Tsarouhas, P.; Achillas, C.; Aidonis, D.; Folinas, D.; Maslis, V. Life Cycle Assessment of olive oil production in Greece. J. Clean. Prod. 2015, 93, 75–83. [Google Scholar] [CrossRef]
  48. Di Giovacchino, L.; Sestili, S.; Di Vincenzo, D. Influence of olive processing on virgin olive oil quality. Eur. J. Lipid Sci. Technol. 2002, 104, 587–601. [Google Scholar] [CrossRef]
  49. Titouh, K.; Mazari, A.; Aït Meziane, M.Z. Contribution to improvement of the traditional extraction of olive oil by pressure from whole and stoned olives by addition of a co-adjuvant (talc). OCL 2020, 27, 23. [Google Scholar] [CrossRef]
  50. Ben Boubaker, H.; Benzarti, Z.; Hénia, L. Les ressources en eau de la tunisie: Contraintes du climat et pression anthropique. In Eau et Environnement: Tunisie et Milieux Méditerranéens; ENS Edition: Lyon, France, 2003; pp. 37–52. [Google Scholar]
  51. Grattan, S.R.; Berenguer, M.J.; Connell, J.H.; Polito, V.S.; Vossen, P.M. Olive oil production as influenced by different quantities of applied water. Agric. Water Manag. 2006, 85, 133–140. [Google Scholar] [CrossRef]
  52. Direction Générale de l’Aménagement du Territoire de la République Tunisienne. Atlas Du Gouvernorat de Sfax; Direction Générale de l’Aménagement du Territoire de la République Tunisienne: Tunis, Tunisia, 2013; Available online: http://www.mehat.gov.tn/fileadmin/user_upload/Amenagement_Territoire/AtlasSfaxFr.pdf (accessed on 15 May 2023).
Figure 1. Accounting water decomposition in the olive oil value chain. Source: Elaborated by authors from results.
Agriculture 13 01205 g001
Table 1. Water accounting parameters in agricultural phase (irrigated and rainfed olive growing in the study area).
Estimated ParametersOlive Growing SystemFarms’ StrataWeighted Average
M1M2M3M4
Virtual WaterVirtual Water (m3/Kg olive)Rainfed1.270.661.250.730.93
Irrigated0.60.690.351.450.87
Virtual Water (m3/Kg of olive oil)Rainfed6.043.145.953.474.24
Irrigated2.853.281.666.94.14
Water productivityBiophysical Water Productivity (Kg/m3)Rainfed0.791.520.801.371.08
Irrigated1.671.452.860.691.15
Economic Water Productivity (TND/m3)Rainfed0.2751.260.491.180.78
Irrigated0.861.380.821.811.33
Source: Elaborated by authors from surveys.
Table 2. Virtual Water in the processing phase (different systems).
Processing SystemOlive MillVirtual Water in Processing Phase
Virtual Water (m3/Tn Olive)Weighted Average
Virtual Water (m3/Tn Olive)
Virtual Water (m3/Tn Olive Oil)Weighted Average Virtual Water (m3/Tn Olive Oil)
Three phase systemH10.81.023.814.84
H21.487.04
H30.94.29
H40.743.52
H51.667.90
H61.065.04
H70.94.28
Two phase systemH80.450.452.142.14
Traditional systemH90.400.401.911.91
Source: Elaborated by authors from surveys.
Table 3. Water productivity in processing phase.
Processing SystemOlive MillBiophysical Water Productivity
(Tn Olive/m3)
Average
Biophysical Water Productivity per System
Economic Water Productivity TND/m3Average Economic Water Productivity per Processing System TND/m3
Three phase systemH11.250.97190173
H20.67122
H31.10209
H41.3590
H50.60210
H61.06107
H70.9265
Two phase systemH82.222.22310310
Traditional systemH92.502.50275275
Source: Elaborated by authors from surveys.
Disclaimer/Publisher’s Note: The statements, opinions and data contained in all publications are solely those of the individual author(s) and contributor(s) and not of MDPI and/or the editor(s). MDPI and/or the editor(s) disclaim responsibility for any injury to people or property resulting from any ideas, methods, instructions or products referred to in the content.

