Article

Analysis of Phylogeny and Genetic Diversity of Endangered Romanian Grey Steppe Cattle Breed, a Reservoir of Valuable Genes to Preserve Biodiversity

by
Madalina-Alexandra Davidescu
1,
Daniel Simeanu
1,*,
Dragos-Lucian Gorgan
2,*,
Mitica Ciorpac
3 and
Steofil Creanga
1
1
Department of Control, Expertise and Services, Faculty of Food and Animal Sciences, “Ion Ionescu de la Brad” University of Life Sciences, 700489 Iasi, Romania
2
Department of Biology, Faculty of Biology, Alexandru Ioan Cuza University of Iasi, 700506 Iasi, Romania
3
Advanced Research and Development Center for Experimental Medicine (CEMEX), Grigore T. Popa University of Medicine and Pharmacy of Iasi, 700115 Iasi, Romania
*
Authors to whom correspondence should be addressed.
Agriculture 2022, 12(12), 2059; https://doi.org/10.3390/agriculture12122059
Submission received: 26 October 2022 / Revised: 24 November 2022 / Accepted: 28 November 2022 / Published: 30 November 2022
(This article belongs to the Special Issue Animal Nutrition and Productions)

Abstract

:
Since 2000, the Food and Agriculture Organization of the United Nations (FAO) has been drawing attention to the increasing numerical decline of Podolian cattle, which include the Romanian Grey Steppe. Currently, this breed is endangered, numbering under 100 heads across the territory of the entire country. Due to its qualities of rusticity, adaptability, and increased resistance to diseases and severe climate conditions, the Grey Steppe is considered a valuable genetic reserve for improving livestock production. This study aimed to quantify the genetic diversity of a population of 32 cattle from the area of N-E Moldova through the analysis of two mitochondrial markers, cytochrome b and the d-loop, which have been proven to be relevant to studies of genetic diversity and phylogeny. The results obtained based on the statistical analysis of the data using nucleotide sequence analysis software (DnaSP, SeaView, MegaX, PopArt, etc.) demonstrated that the breed belonged to the ancestral P′QT haplogroup, with direct descent from Bos taurus primigenius. Within this haplogroup, five cattle were identified, which could be used in the selection of crosses, with the aim of preserving valuable genetic resources for the improvement of other cattle breeds and the protection of biodiversity.

1. Introduction

Podolian cattle breeds are considered a form of socio-cultural heritage and a valuable genetic resource due to their high tolerance to extremely harsh environmental climatic conditions, resistance to disease and external parasites, and quick recovery after illnesses, which are important aspects of reproduction and conservation programs for improving livestock production [1,2,3]. Many historical sources attribute the term Podolian to a shared ancestral origin in Podolia (the modern western Ukraine). Alternative hypotheses have been proposed: Podolian cattle may have spread from the eastern steppe southward into Anatolia and westward into the Balkans and Italy in historical times (3rd–5th century AD) with Eastern European Barbarian people; other authors have suggested a more ancient migration (3 kya BP) from the Near East to Central Italy via the Mediterranean Sea, with a contribution from local wild aurochs via secondary local domestication [3]. Romanian Grey Steppe cattle belong to the category of Podolian breeds, which have been threatened with extinction since 2000, according to the Food and Agriculture Organization (FAO) [4,5]. The common origin of this cattle and other Podolian breeds (Iskar Grey, Bulgarian Grey, Istrian, Slavonian Podolian, Katerini, Hungarian Grey, Maremmana, Podolica, Turkish Grey, etc.) is the wild ancestor Bos taurus primigenius, which was declared be extinct around the 16th century [2,6]. This cattle breed was formed over many centuries, under the exclusive influence of natural environmental conditions that imprinted special qualities of hardiness, resistance, and adaptability to severe climatic factors [7,8,9,10]. The external peculiarities of the Grey Steppe breed led to the distinction of this breed from the others based on the craniological type and, more precisely, the characteristic shape of the bicolor horns, which are white at the base with a characteristic black dot. At birth, calves are yellow-reddish in color, and after a period of about 2–3 months, they change to shades of grey [11,12]. In 2018, the number of specimens of the Grey Steppe breed decreased below 150 heads [13]. Isolated specimens of this breed can also be found in households in north-eastern Moldova, in the counties of Iasi, Neamt, and Pardina (Danube Delta), currently totaling about 100 heads [14,15]. Presently, within the Research and Development Station for Cattle Breeding Dancu, Iasi, Romania, there is a population of cattle of this breed that is part of a national genetic conservation program, representing the biological material used in this research. The genetic diversity of Podolian breeds is an important asset for countries where agriculture is still an important economic sector [16].
Numerous studies [17,18,19,20,21] focusing on the origin of cattle based on mitochondrial genome analysis have determined that all taurine breeds share a common ancestor in the Near East, around 10 ka ago, during the Neolithic transition. The discovery of uncommon mitochondrial DNA (mtDNA) haplogroups such as P, Q, and R has sparked debate about the potential occurrence of independent or secondary domestication episodes. Recent research on the mitochondrial genome of Bos taurus has revealed that macro-haplogroup T is composed of two sister clades, T1′2′3 and T5, with the former including the originally identified haplogroups T1, T2, and T3, and T4, a grouping within T3. The Fertile Crescent is where all T haplogroups most likely originated and underwent domestication. From there, they spread with the movement of domestic Bos taurus herds. However, the mtDNA of contemporary taurine breeds is not entirely represented by haplogroups T1–T5. Complete mtDNA sequence analyses have revealed that a small subset of these individuals belongs to three other uncommon haplogroups (P, Q, and R). The mtDNA of haplogroups P and R most likely come from populations of wild aurochsen in Europe, whereas haplogroup Q is most likely of Near Eastern origin.
This research aimed to quantify the genetic diversity of the Grey Steppe cattle population using mitochondrial markers (cytochrome b and the d-loop) that are relevant to studies of genetic diversity, phylogeny, and molecular phylogeography. The main objective was to preserve valuable genetic resources for the improvement of other cattle breeds and the protection of biodiversity. The results of this study demonstrated that the Romanian Grey is a direct descendant of the Bos taurus primigenius, which is valuable information for the efforts to conserve the genetic resources of this endangered cattle breed.

2. Materials and Methods

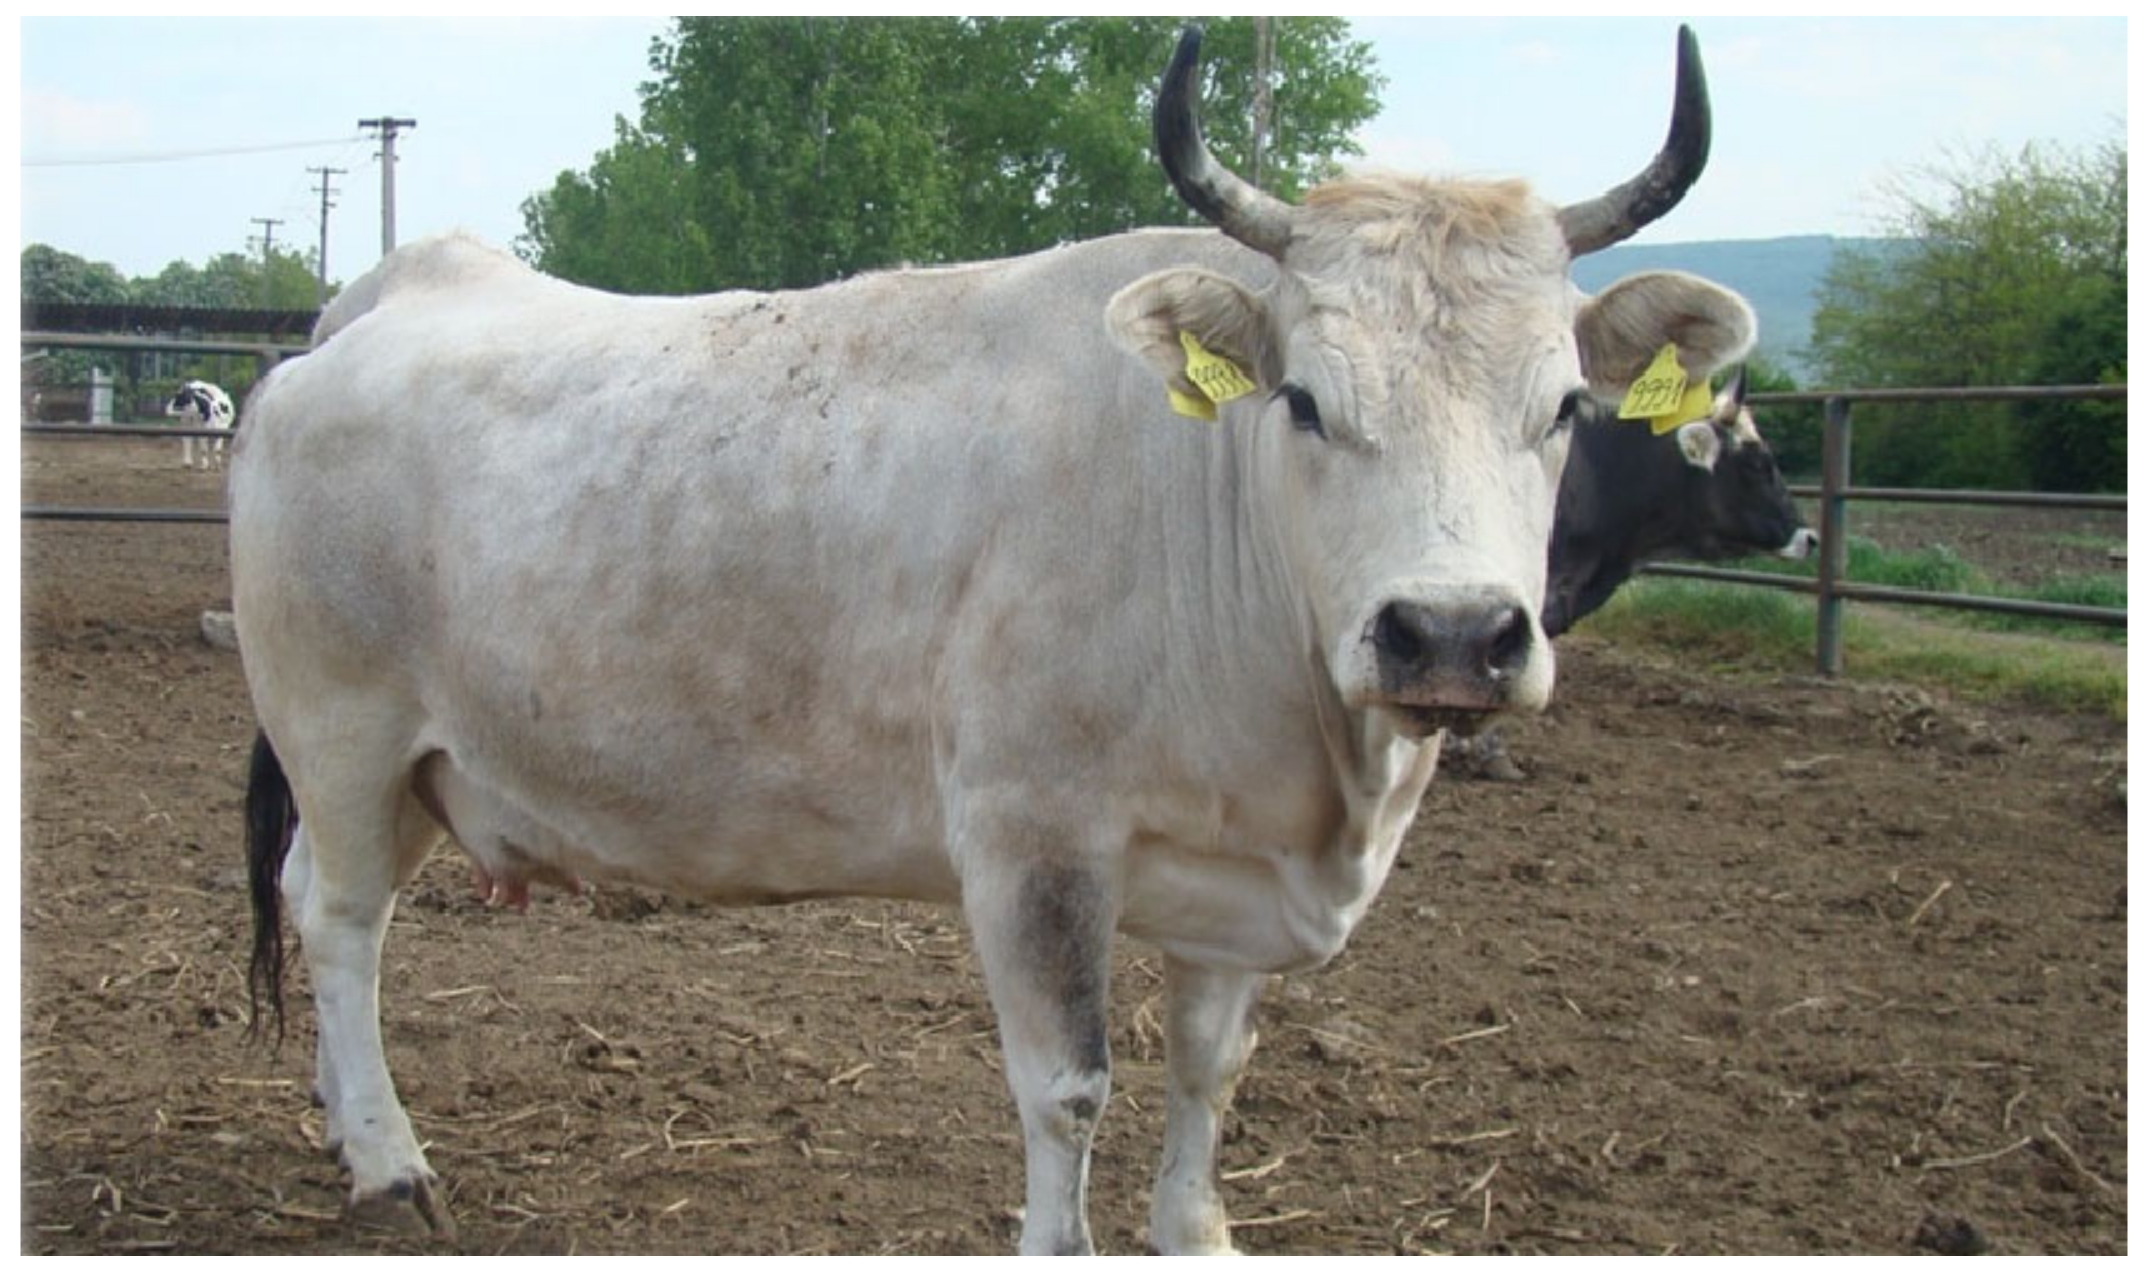
2.1. The Biological Material Studied

In Romania, the Grey Steppe represents one of the oldest autochthonous breeds, adapted to the pedoclimatic conditions of the country. Along with other breeds (Podolica Italiana, Hungarian Grey, Bulgarian Grey, Istrian cattle, Katerini, Turkish Grey, Ukrainian Grey, etc.), it is included in the Podolian group [21]. This breed developed in a natural environment, both in summer and in winter, which granted it exceptional qualities that aew necessary for the improvement of other cattle. In the past, the breed was used intensively for traction, due to its special resistance characteristics, which also ensured an average milk production, noted for its high-fat content (approximately 4.71% in the fifth lactation). With the disappearance of this breed, a series of special qualities such as adaptability, resistance to disease, and high fat content in milk would disappear. The maintenance of various conformation features of the breed, such as the large lyre-shaped horns, gray color, and small waist that are characteristic of the primitive type, is an equally important goal (Figure 1) [22].

2.2. Blood Samples

The first step in achieving the objectives of this research was the collection of blood samples from 32 females of the Grey Steppe cattle breed (Table 1), a population located within the Research and Development Station for Cattle Breeding in Romania, located in northern Moldova. The blood samples were collected by jugular vein puncture using Vacutainer tubes with EDTA (ethylene-diamine-tetra-acetic acid) to prevent clotting, with a capacity of 2 mL.
The blood samples were stored in the freezer under optimal conditions, at a temperature of −20 °C until the DNA extraction step.

2.3. Extraction and Quantification of Total DNA from Blood Samples

DNA extraction from blood samples was performed via the automated method with Maxwell™ 16 and 16 MDx instruments, using a special kit provided by the Promega distributor: Maxwell 16 LEV Blood DNA Kit (code-AS1290) [23], containing 50 LEV purification pistons, 50 elution tubes, 20 mL lysis buffer, two 1 mL proteinase K solutions, and 20 mL elution buffer. The DNA samples were quantified using the Nanodrop ASP-3700 spectrophotometer (ACTGene Inc., New Jersey, USA), and the optical density was measured at the absorption rates of A260 nm and A280 nm to calculate the DNA yield.

2.4. Primer, Amplification, Sequencing

The amplification of mtDNA, cytochrome b, and d-loop (mitochondrial DNA control-region sequences) was carried out through PCR analysis (polymerase chain reaction), which is a genomic technique applied for rapidly amplifying millions to billions of copies of a specific segment of DNA using amplification primers. In this research, the PCR amplification of the cytochrome b and d-loop was performed using two pairs of primers, forward and reverse (Table 2), specifically designed on the Bovine Reference Sequence (BRS; GenBank V00654) [24]. The total size of the complete mitochondrial genome of Bos taurus is 16,341 bp (Figure 2a). The cytochrome b gene, which has a size of 1140 bp, and the mitochondrial d-loop control region, which has a length of 910 bp (Figure 2b) [25,26,27,28], were amplified by the PCR technique.
The isolated and purified DNA samples were amplified by the PCR technique. The final volume of the PCR was 25.5 μL, including 2 μL DNA samples; 12.5 μL GoTaq® Green Master Mix (Promega, Madison, WI, USA); 1.5 μL of each primer (forward and reverse); and 7.5 μL nuclease-free water. The reaction mixture was supplemented with 0.5 µL MgCl2. In the case of the amplification of cytochrome b fragments, the temperature of primer alignment was 62 °C, and in the case of the amplification of d-loop fragments, the temperature of primer alignment was 60 °C. The PCR program for the amplification reaction of cytochrome b and d-loop fragments included 35 amplification cycles under the conditions represented in Table 3.
The cytochrome b and d-loop region were successfully amplified; then, the PCR fragments were sent to Macrogen Europe Sequencing Laboratory, Amsterdam, The Netherlands for sequencing. To determine the nucleotide sequence of cytochrome b and d-loop, Sanger sequencing was applied using the primers detailed in Table 2.

2.5. Data Analysis

Data analysis was carried out using a series of programs (Table 4). The primary processing of the sequences in the form of fluorograms and their correction was carried out using the DNABaser program (sequence assembly software). To identify the phyloge-netic relationships of the Grey Steppe cattle breed with other Podolian cattle breeds, we aligned both sequences of the complete mitochondrial genome of Bos taurus and the individual cytochrome b genes and mitochondrial control regions (d-loop) specific to the Podolian cattle breeds (Grey Steppe, access no. HM596474.1; Bulgarian Grey, access no. KF373019.1; Istrian, access no. MZ901619.1; Slavonian Podolian, access no. MZ901634.1; Katerini, access no. DQ518336.1; Hungarian Grey, access no. GQ129207.1; Podolica, access no. EU177843.1; and Turkish Grey, access no. EF126309.1) from the NCBI-GenBank [23]. For each individual, forward and reverse sequences were concatenated with the resulting sequences from the two primers, and the two strands were cut, resulting in a unique sequence. The alignment of all cytochrome b and d-loop gene sequences from the analyzed individuals was carried out using ClustalW [30] with the MegaAlignment module. Sequence comparison and phylogenetic tree tracing was carried out using the MEGA X program (Molecular Evolutionary Genetics Analysis, Center for Evolutionary Medicine and Informatics, Tempe, AZ, USA).
The analyzed sequence diversity was estimated using LaunchDnaSP version 4.50.3 software [31]. PopART software was used for the median-joining network analysis. The neighbor-joining tree was built using the Kimura 2-parameter model with the following parameters: 1000 bootstrapping replicates, a gamma distribution (+G) with five rate categories, and evolutionary invariability (+I).

3. Results

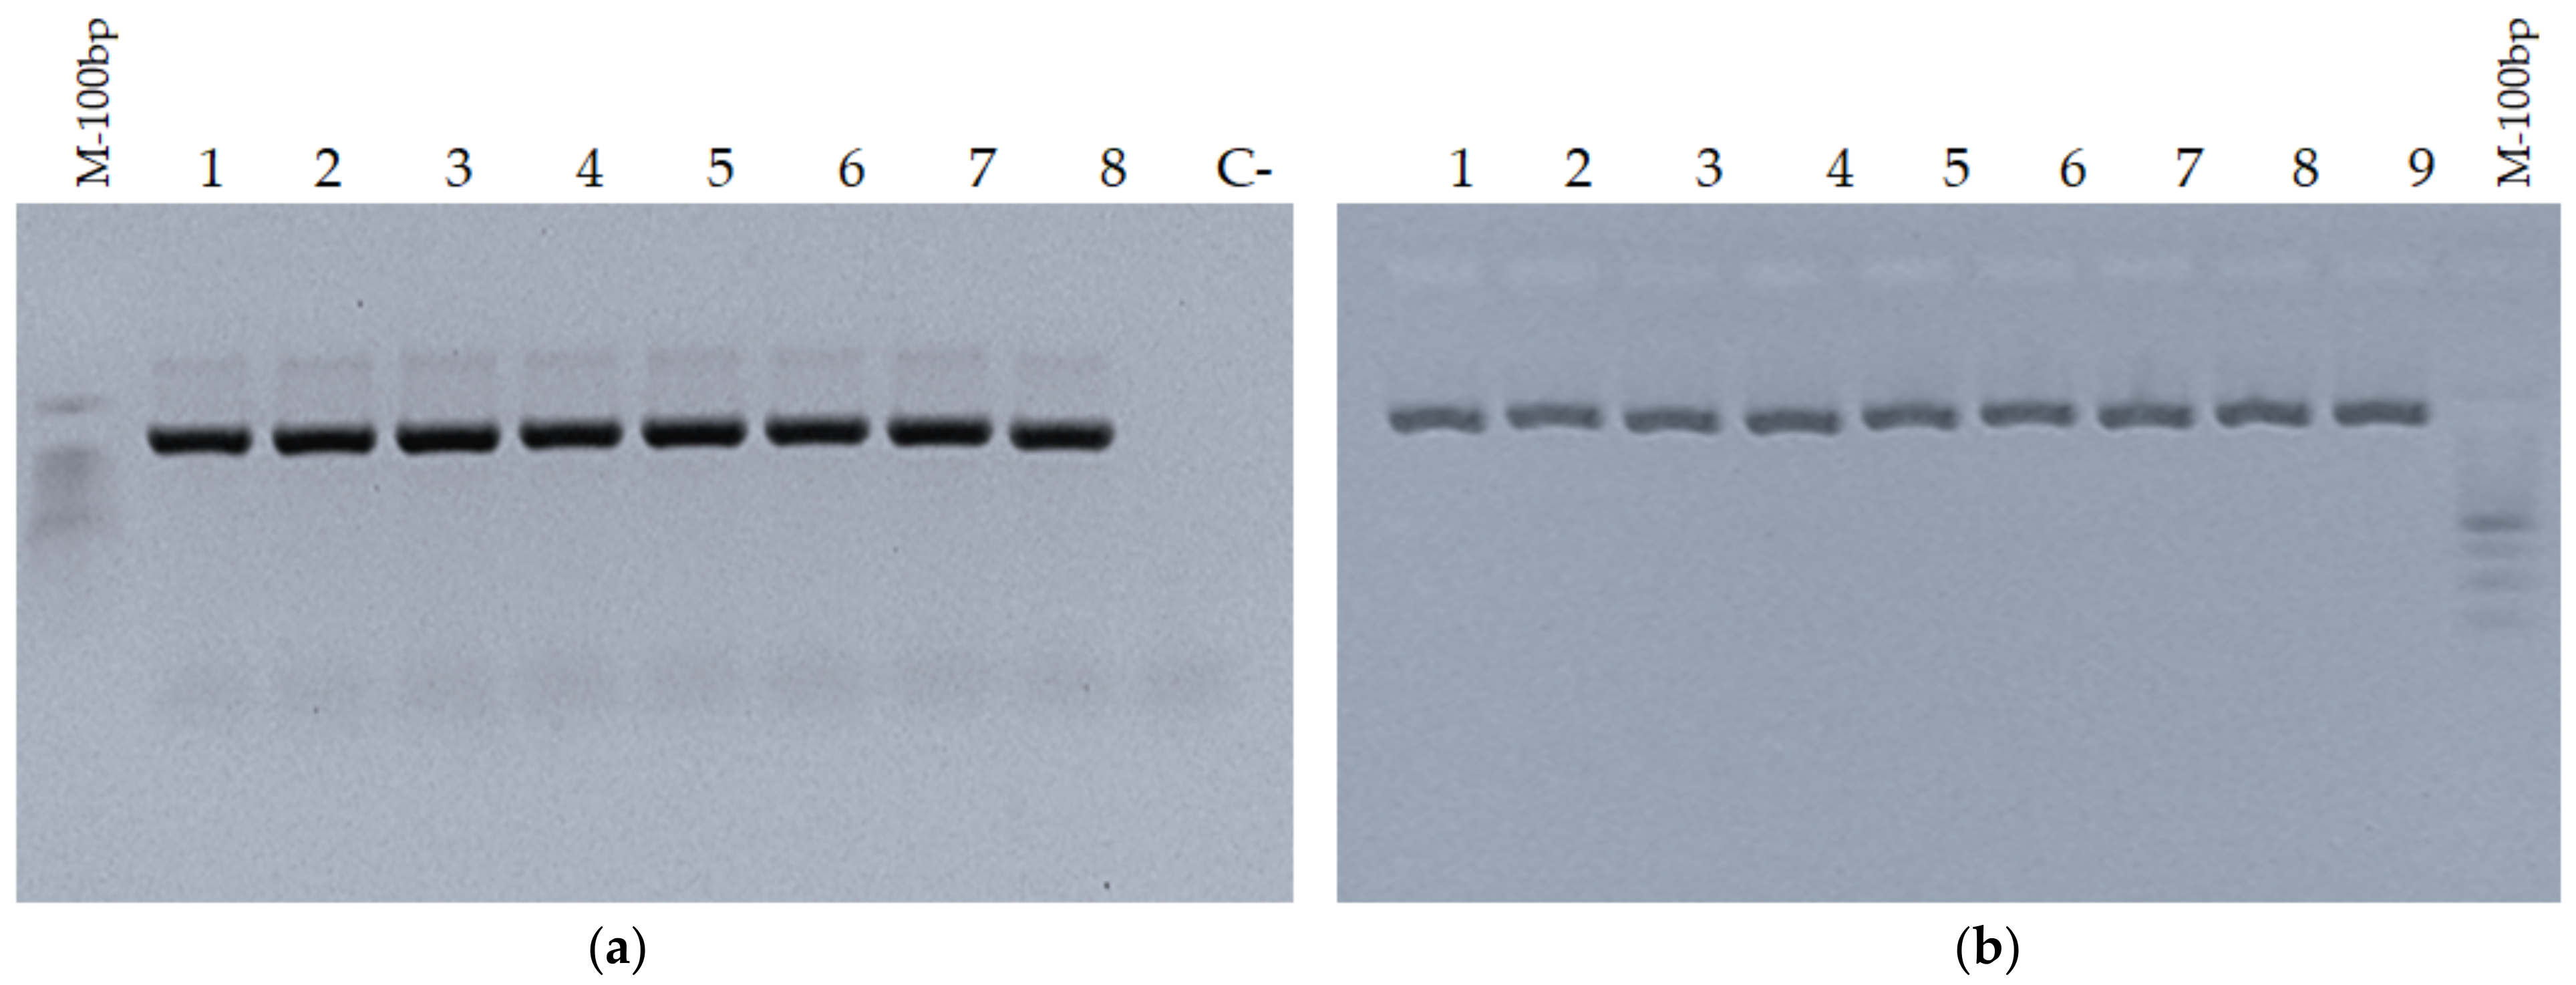
3.1. Validation of Amplification of PCR Products in Agarose Gel Electrophoresis

The PCR amplicons were validated in 1% agarose gel with 0.5xTBE buffer, after which migration was performed at a voltage of 100 volts for 30 min (Figure 3). A molecular weight marker of 100 base pairs was used to estimate the size of the amplified fragments. The amplification of the gene sequences of interest was successfully achieved, with the primers having high specificity for these mitochondrial markers. The length of the PCR products was approximately 1140 bp for the cytochrome b sequences and approximately 910 bp for the d-loop sequences, in agreement with the values found for the complete sequence of the Bos taurus mitochondrial genome (GeneBank accession number: V00654).

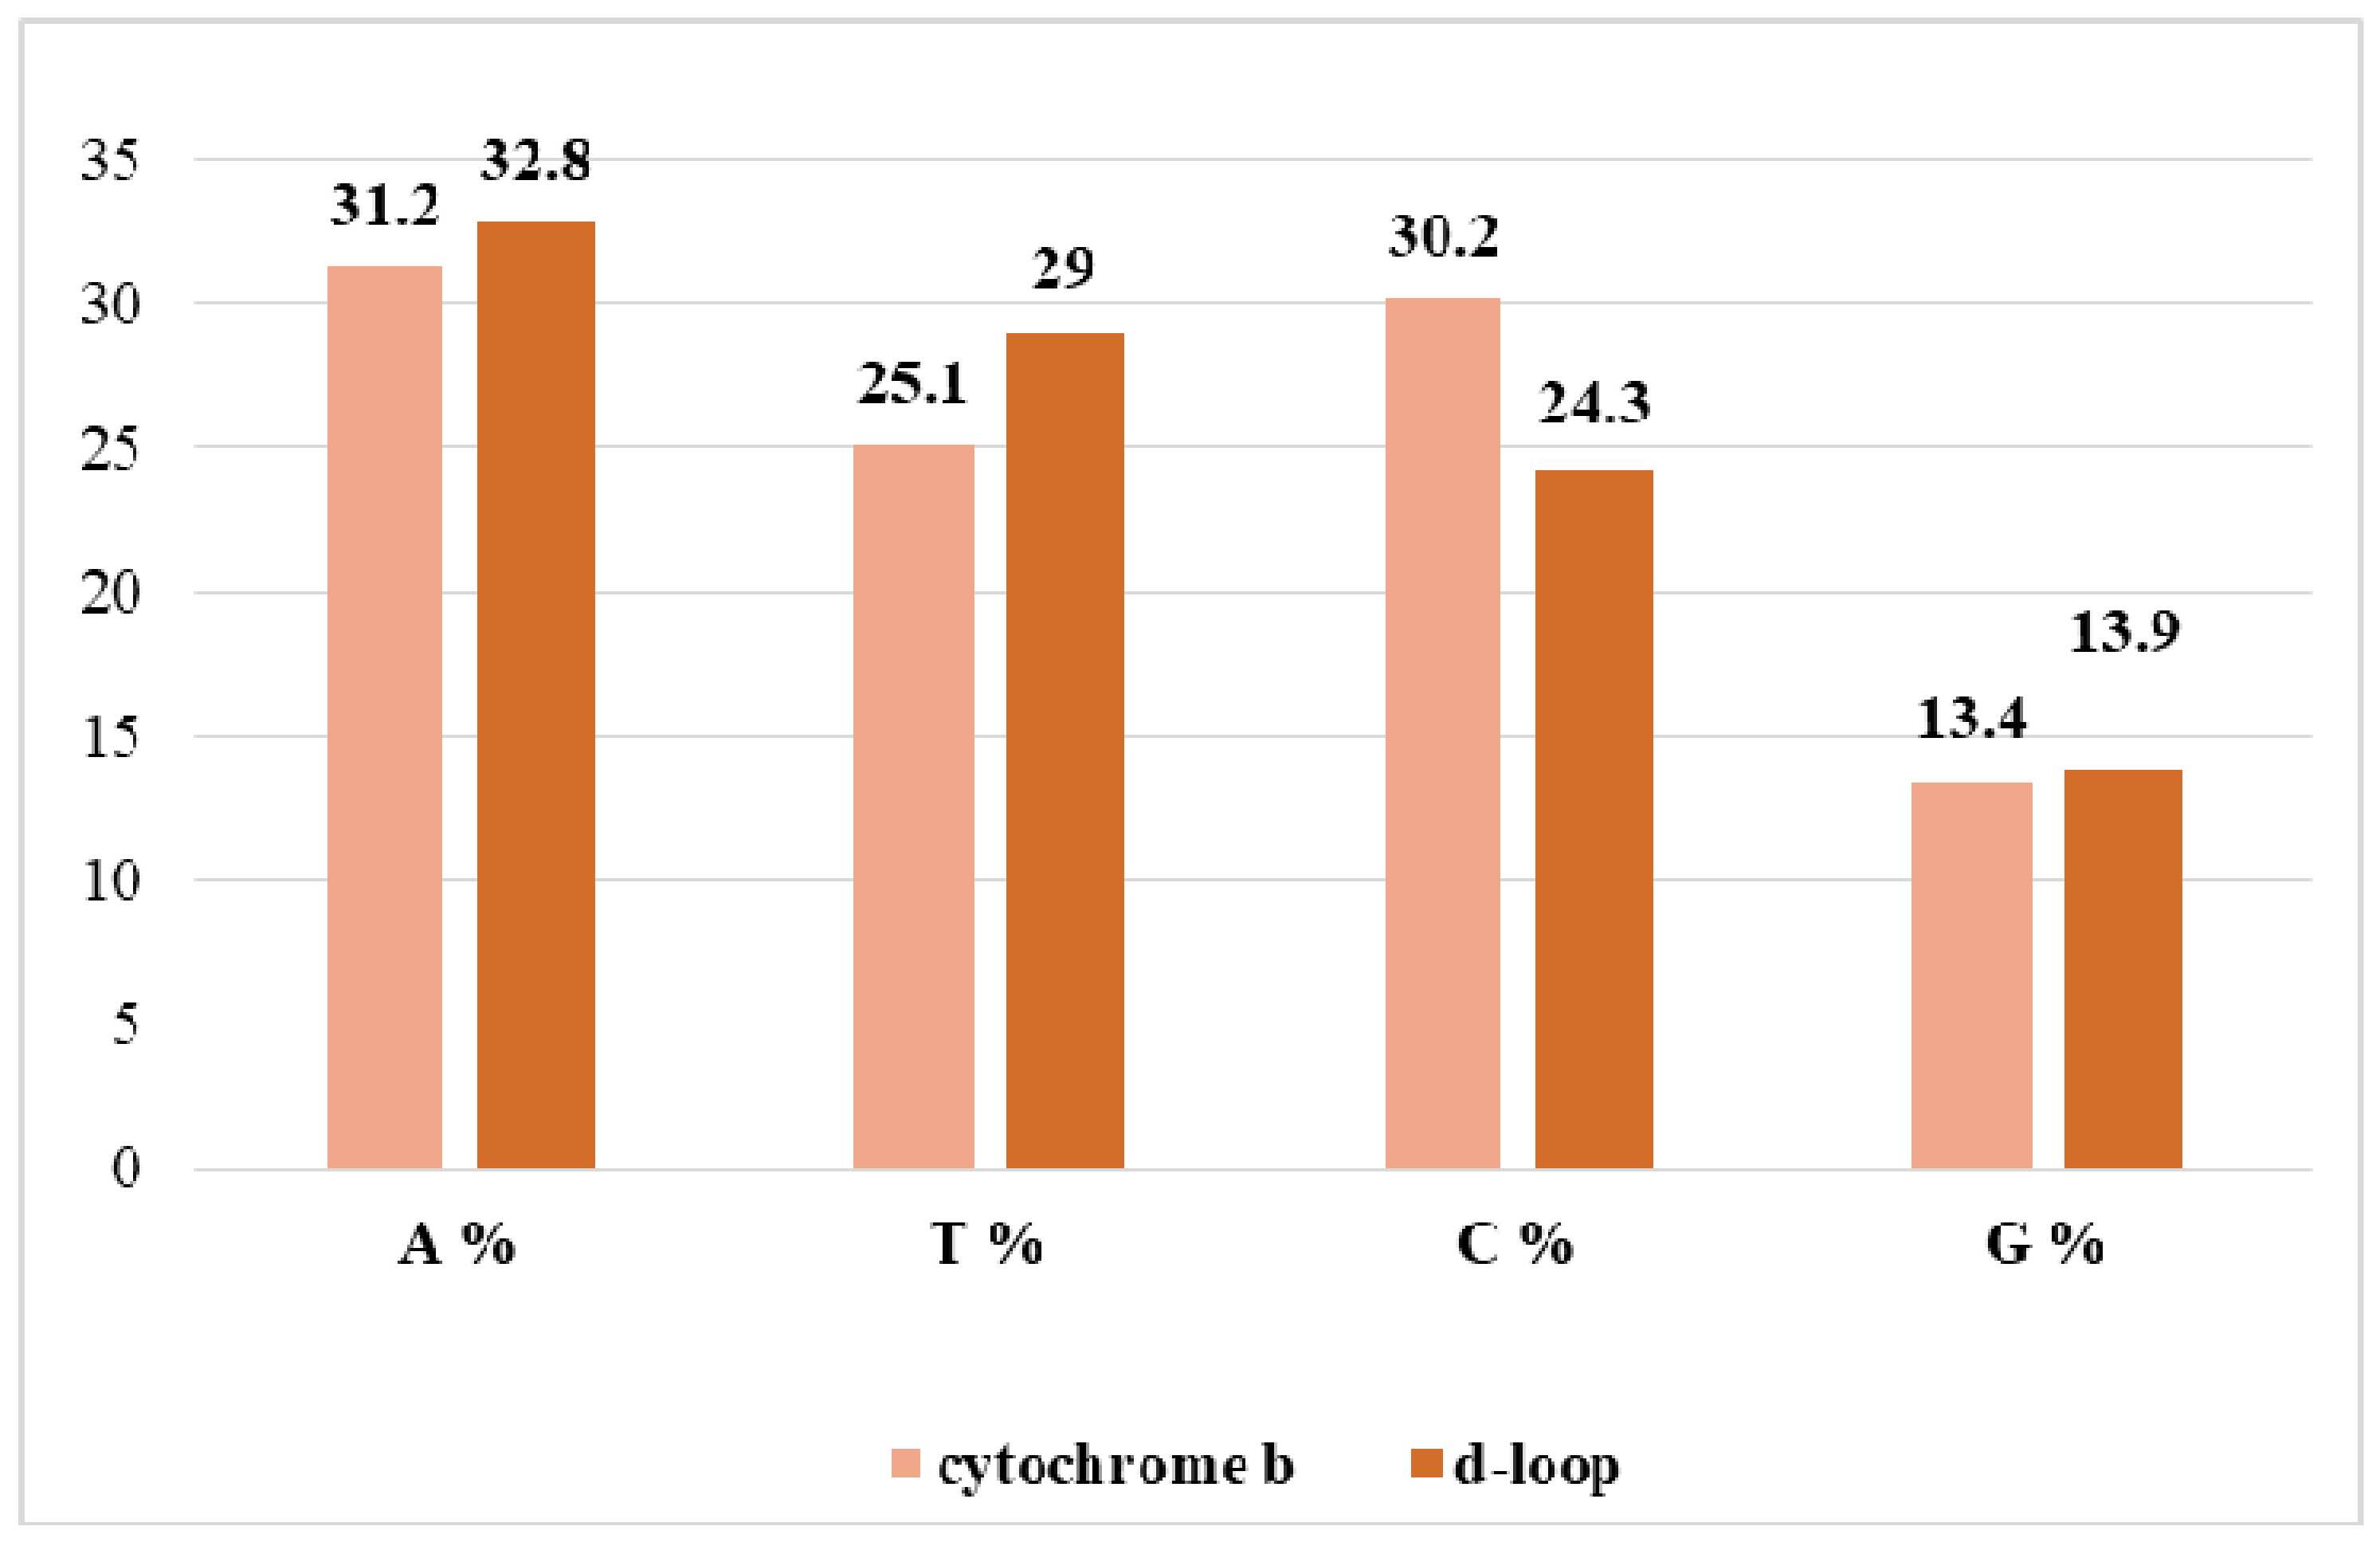
3.2. The Proportion of Nitrogenous Bases in the Nucleotide Sequences of Grey Steppe for Cytochrome b and d-Loop Mitochondrial Markers

The complete sequence of the mtDNA cytochrome b (1140 bp) [32] was obtained for all 32 samples. The base composition was as follows: 31.2% adenine, 25.1% thymine, 30.2% cytosine, and 13.4% guanine. The base composition for the mtDNA d-loop (910 bp) [33] was as follows: 32.8% adenine, 29.0% thymine, 24.3% cytosine, and 13.9% guanine (Figure 4).

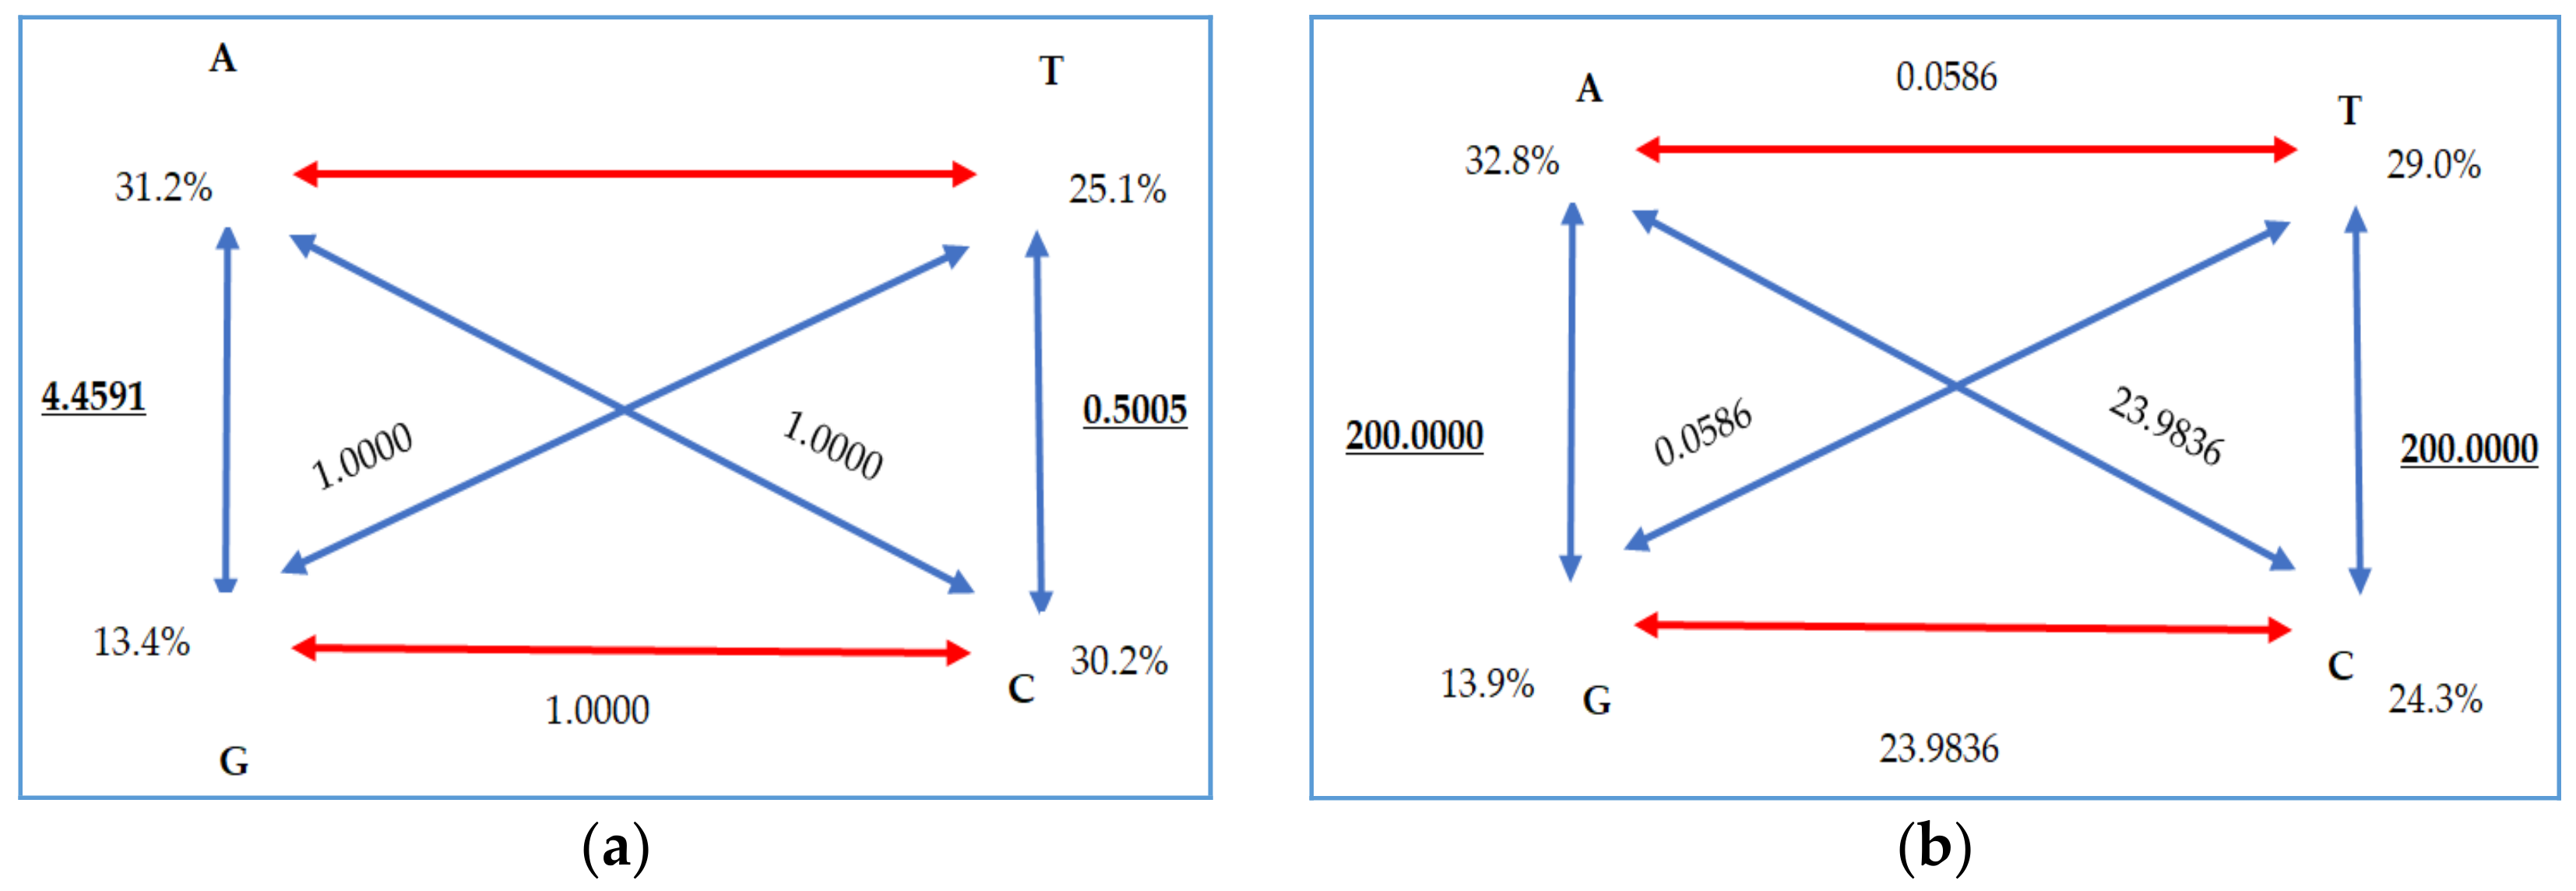
3.3. The Specificity Coefficient

Based on the frequencies of the four nitrogenous bases, the specificity coefficient was calculated, the value of which is given by the A+T/C+G ratio and shows the differences between the individuals of a species. This coefficient is calculated in molecular phylogeny studies to observe differences in nucleotide composition. Normally, it has values in the range of 1.2–1.5, characteristic of most animal species. If we refer to the nitrogenous bases with the highest frequency, two types of DNA can be distinguished, namely, AT-type DNA (when A+T > C+G) and GC-type DNA (when A+T < C+G). In the case of the cytochrome b nucleotide sequences, the nitrogenous bases A and T predominated; therefore, all the individuals analyzed had characteristic AT-type DNA (A+T > C+G). The same conclusion was also reached in the case of the nucleotide sequences of the mitochondrial d-loop control region. The specificity coefficient for the two concatenated nucleotide sequences had an average value of 1.45, which fell within the range of values specific to animal organisms.

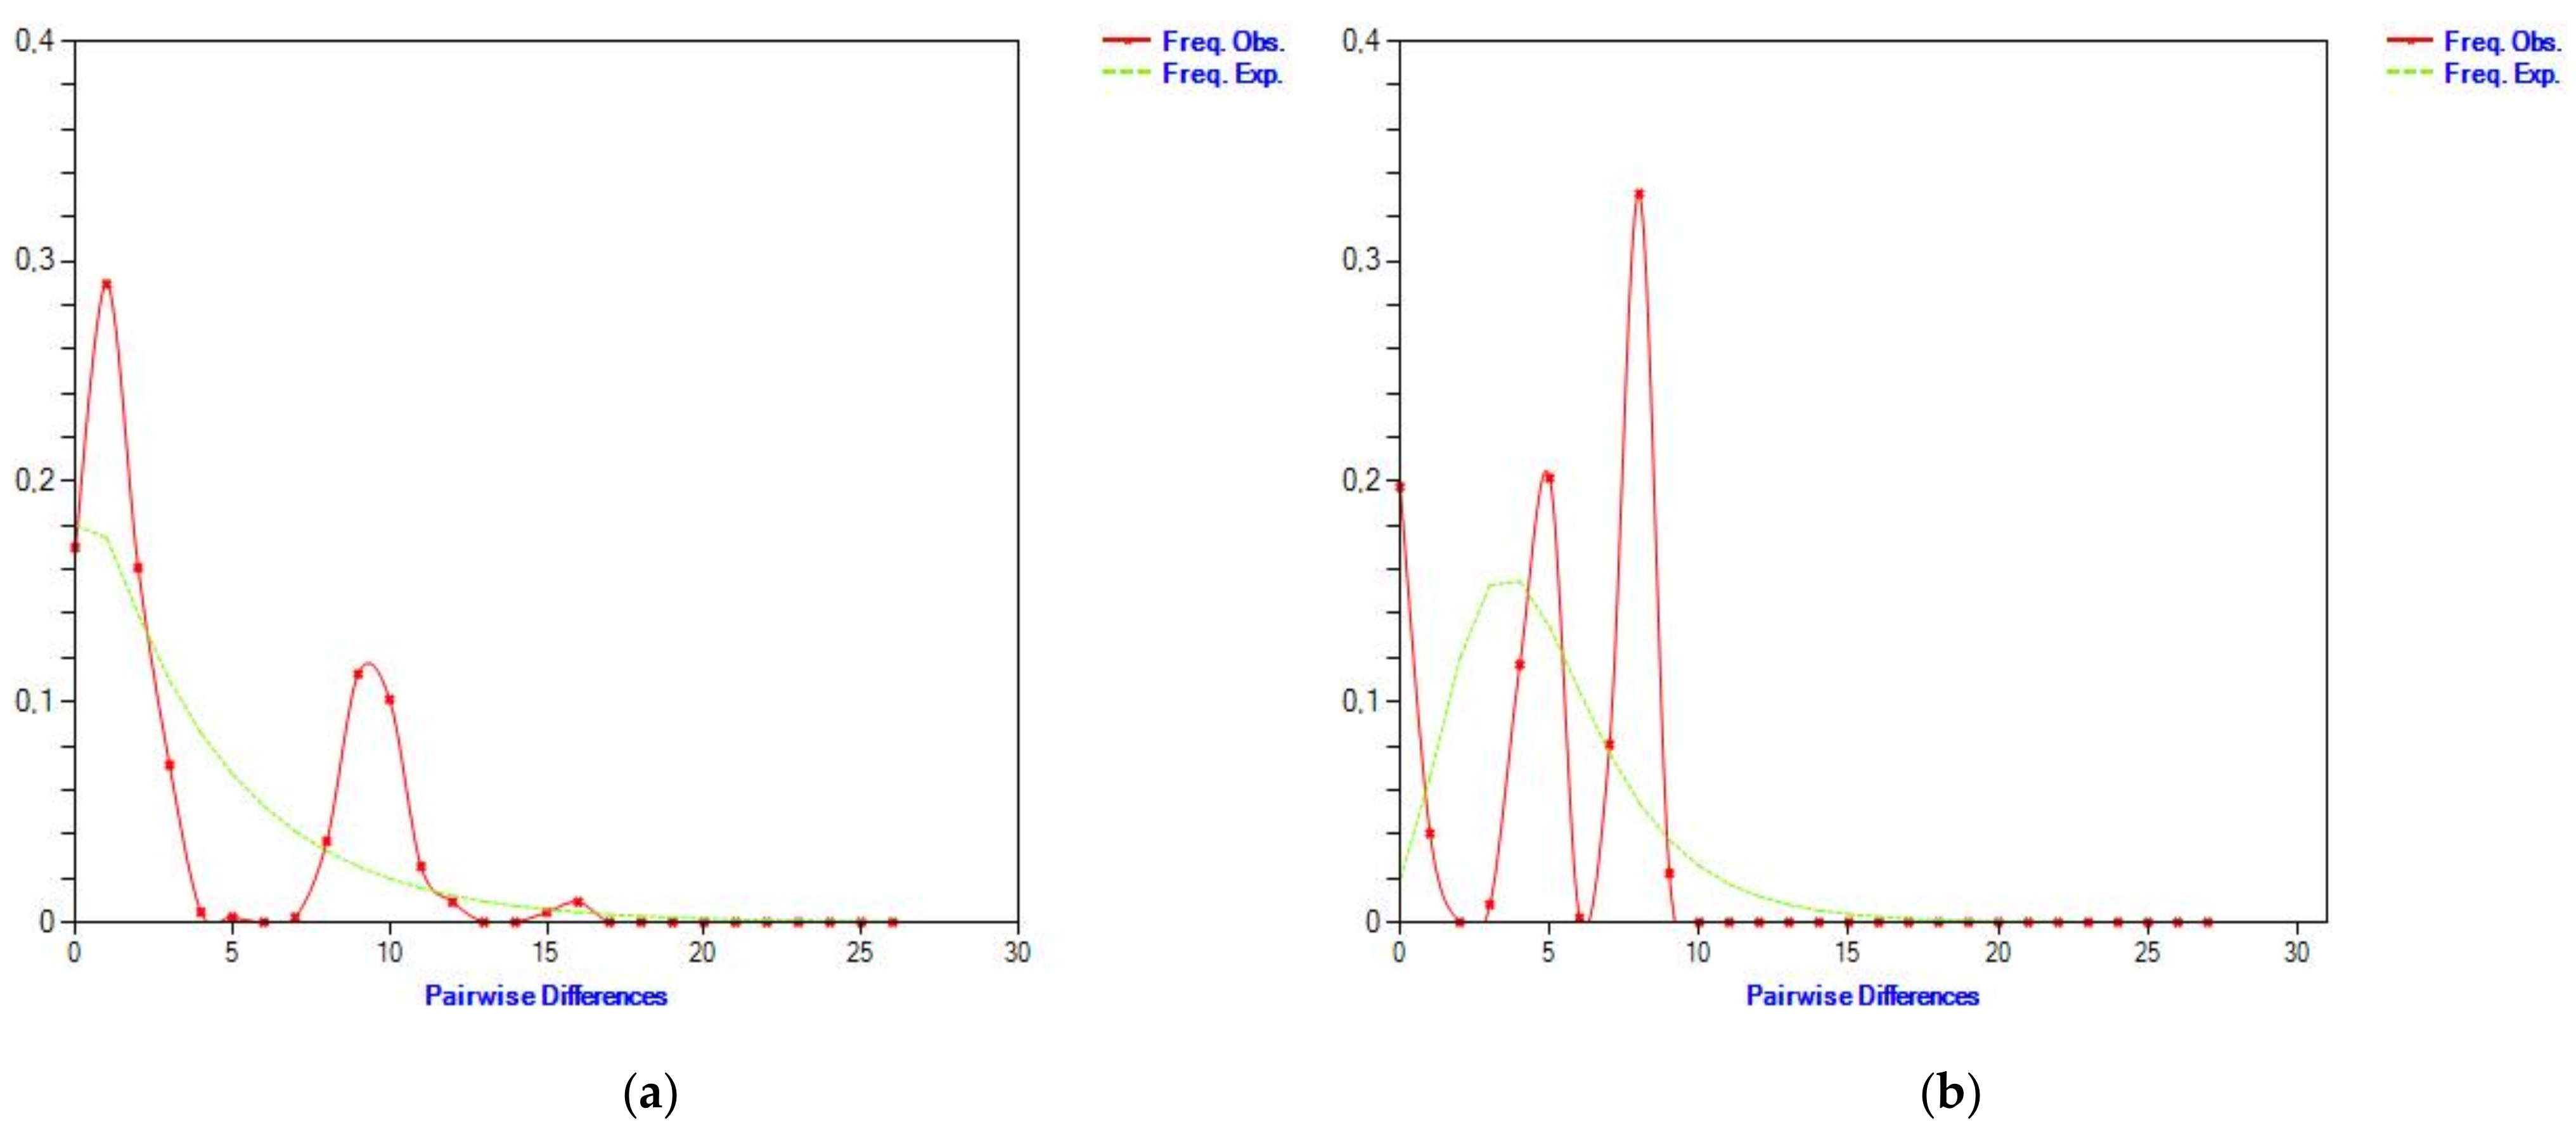
3.4. Dynamics of the Rate Evolution of Cytochrome b and d-Loop Mitochondrial Markers

Regarding the genetic variability at the d-loop region, after aligning and trimming the 32 sequences, the haplotypes and variable nucleotide positions were assessed in relation to the reference sequence V00654 from GenBank. The T3/T4 subclade haplogroup had the highest frequency, as predicted for European cattle breeds. The diversity of haplotypes was 0.908 ± 0.005. The haplotypes observed in Romanian Grey Steppe were the same as those seen in Hungarian Grey and Podolian cattle (Hungarian Grey, Bulgarian Grey, Ukrainian Grey, Istrian, and Slavonian Syrmian).
Based on the gene sequences of the cytochrome b and d-loop mitochondrial markers, the demographic and spatial expansion of the Grey Steppe population was analyzed, using the Mismatch distribution calculation model, which shows the distribution of the number of differences identified between pairs of haplotypes. As a rule, this distribution can be unimodal (specific to populations that have undergone either a recent demographic expansion or a spatial expansion characterized by a high degree of migration) or multimodal (in the case of populations in demographic equilibrium). In the case of the Grey Steppe, a multimodal distribution resulted from the analysis of both the cytochrome b nucleotide sequences and the d-loop mitochondrial control region (Figure 5a,b).
The alignment of all cytochrome b and d-loop gene sequences was performed by the ClustalW method using the MegAlign module, which is based on joining the forward and reverse sequences for each individual by aligning them with the primer sequences, cutting the two chains, and joining them into a single chain. After alignment, for each dataset (cytochrome b sequences and d-loop sequences, respectively), the optimal substitution model was checked, using the jModelTest program [34] based on the Akaike Information Algorithm Criterion [35] (AIC). The best-fit models of nucleotide substitution were chosen using jModelTest. This program employs five distinct model selection procedures, including hierarchical and dynamical likelihood ratio tests (hLRT and dLRT), Akaike and Bayesian information criteria (AIC and BIC), and a decision theory method (DT). It also provides model-selection uncertainty estimates; parameter importance estimates; and model-averaged parameter estimates, including model-averaged tree topologies. Additionally, jModelTest provides novel tree optimization algorithms and model-averaged phylogenetic trees (determining both topology and branch length). The optimal substitution model for each analysis is shown in Table 5. Following the analysis, 22 variable sites (1.9%) were observed, of which 18 were informative sites (1.6%). In the case of d-loop sequences, the number of variable sites was 18 (2.0%), and the number of informative sites was 13 (1.4%).
The optimal substitution model was chosen from a confidence interval of 100%, with eight candidate models for both cytochrome b TrN+I6 (with an estimated mean log-likelihood value of 1708.1951) and d-loop TPM3uf (with an estimated mean log-likelihood value of 1354.6687). The values for the nitrogenous base frequencies were 31.2% for A, 25.1% for T, 13.4% for G, and 30.2% for C (cytochrome b sequence). A<->G and T<->C type transversions had values of 4.4591 and 0.5005, respectively (Figure 6a), their ratio being 0.755 (Table 6).
In the case of d-loop gene sequences, the frequencies of the nitrogenous bases were as follows: 32.8% A, 29.0% T, 24.3% C, and 13.9% G. The Ti/Tv ratio showed a value of 5.107 (Table 6 and Figure 6b).

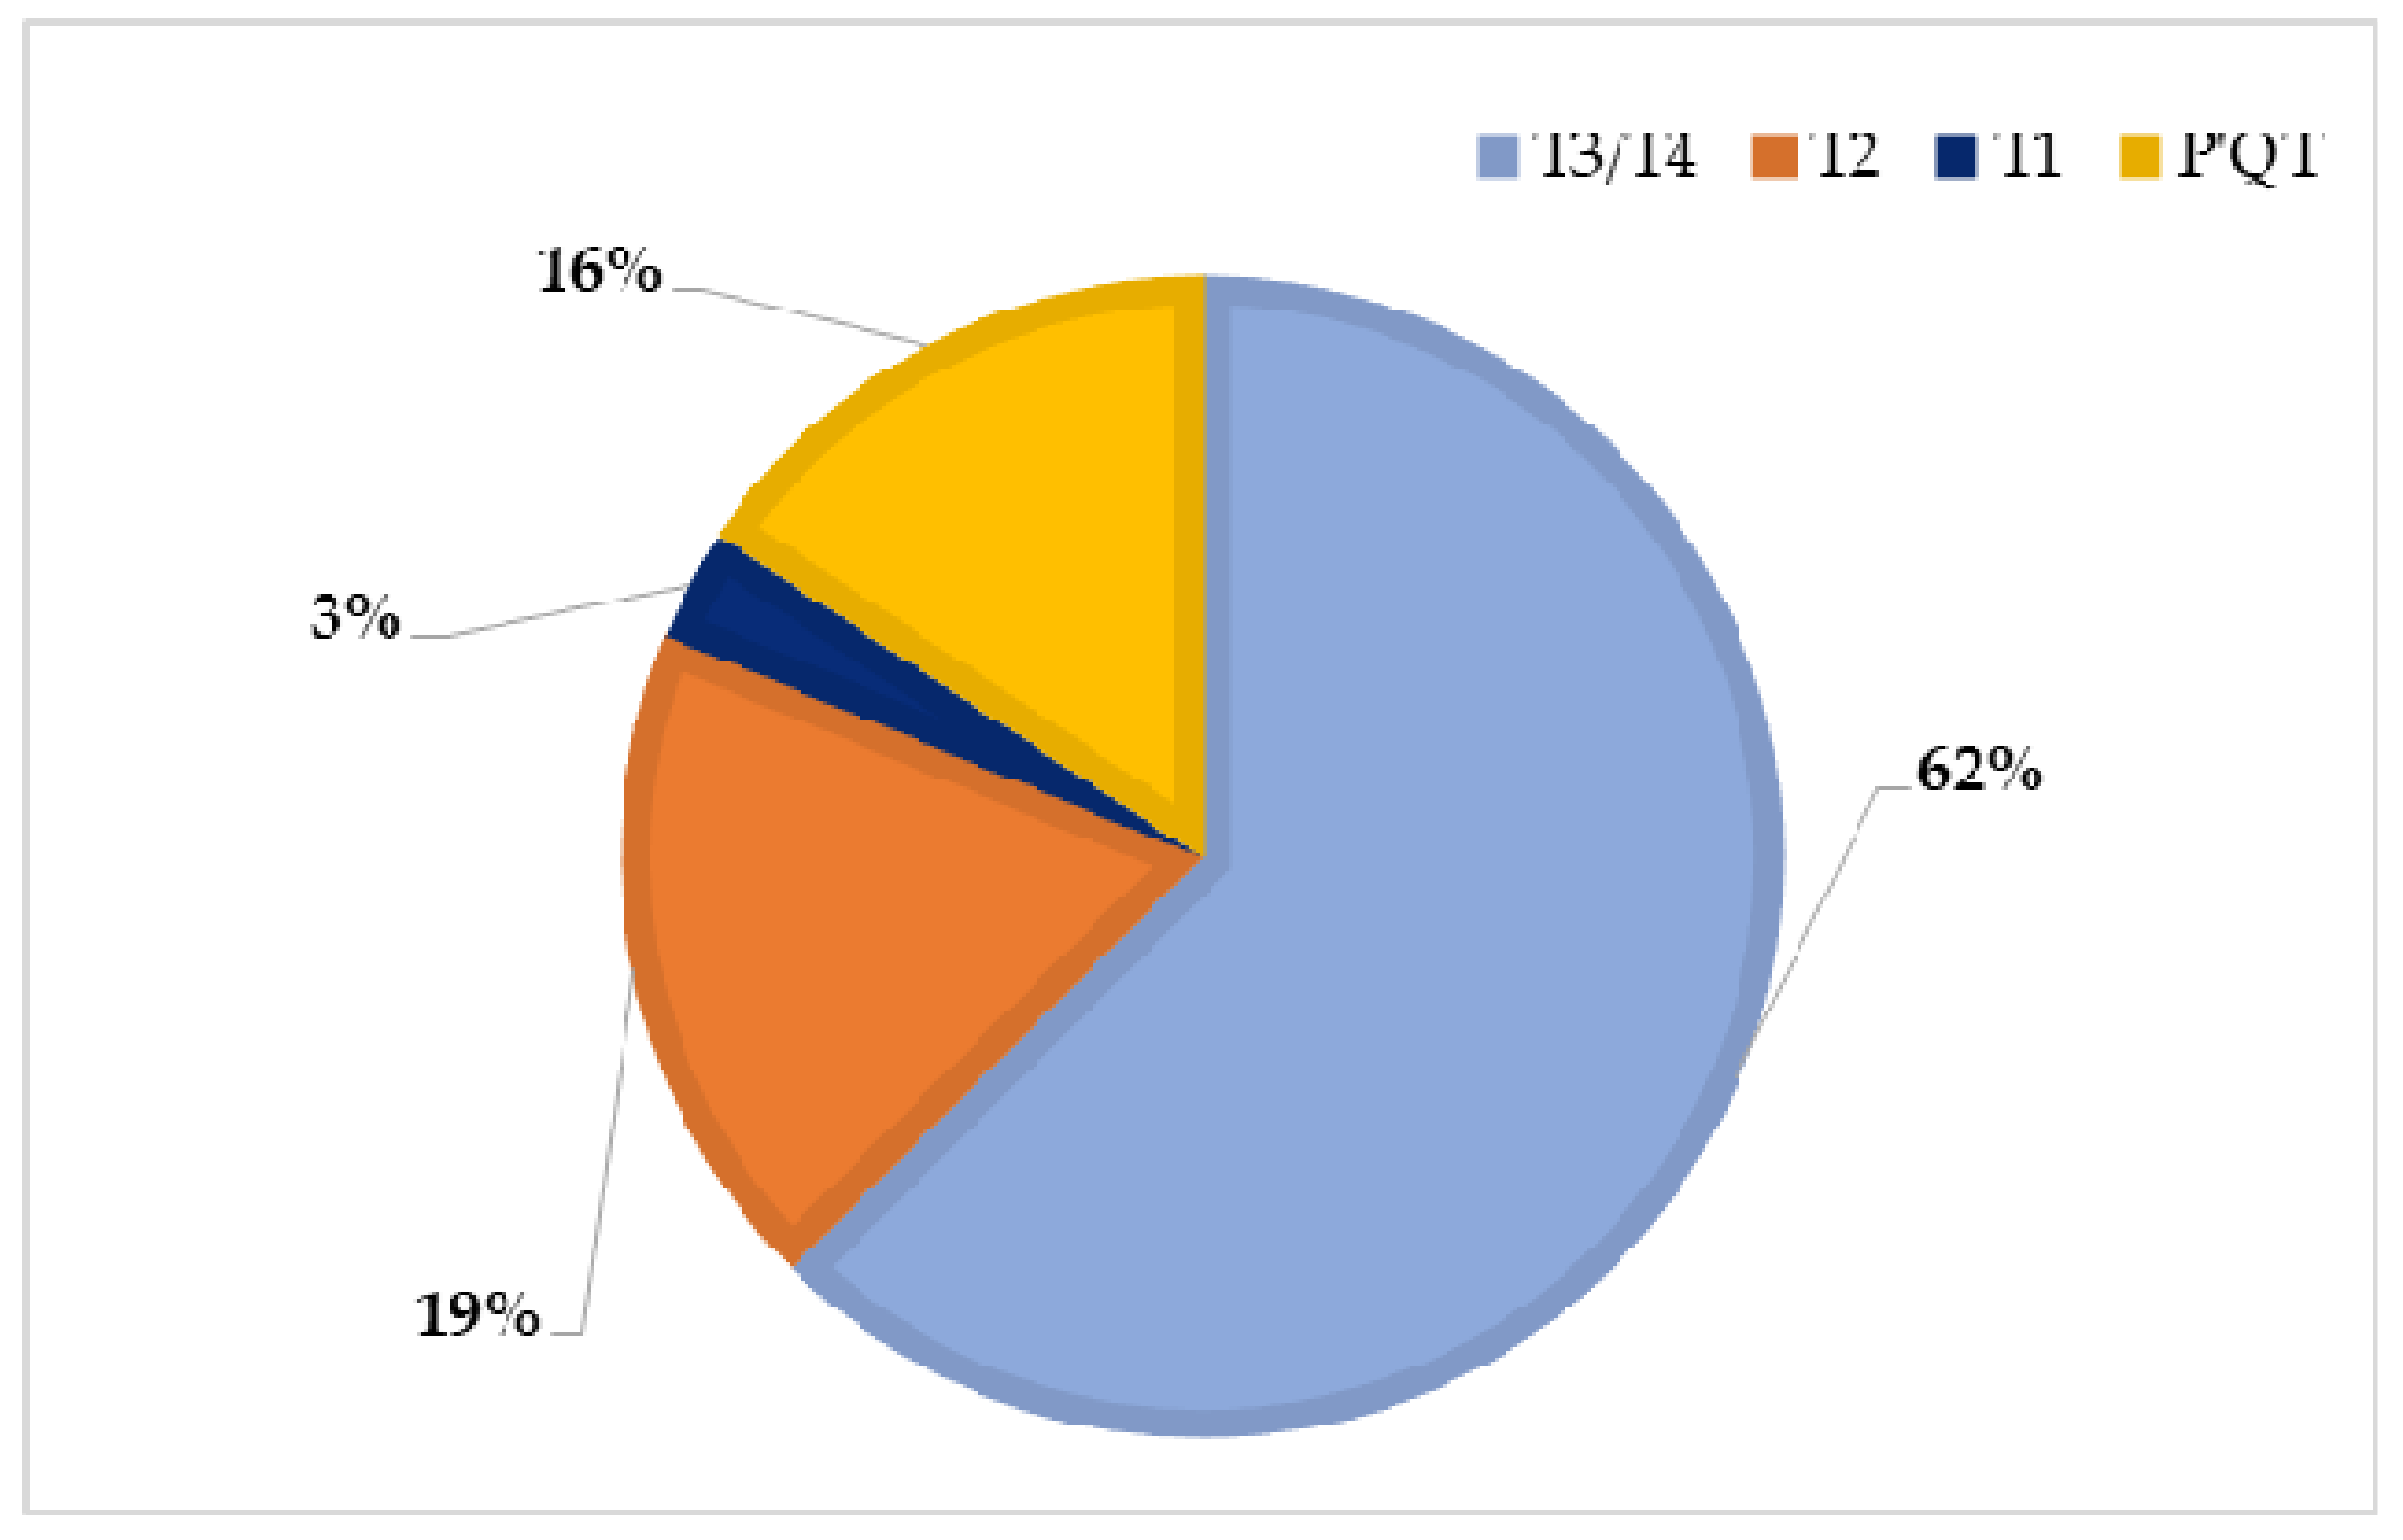
3.5. Haplotype Frequency Assessment by Analysis of Cytochrome b Gene Sequences and Mitochondrial d-Loop Control Region

By analyzing and interpreting the gene sequences of the two mitochondrial markers, four haplotypes with different frequencies were identified (T1, T2, T3/T4, and P′QT), into which the 32 individuals under study were classified (Figure 7).
The highest haplotype frequency was represented by the T3/T4 haplotype, which was identified in 20 analyzed individuals (62%): SS_02; SS_03; SS_04; SS_06; SS_07; SS_08; SS_09; SS_10; SS_12; SS_13; SS_14; SS_15; SS_16; SS_17; SS_20; SS_21; SS_23; SS_24; SS_29; and SS_31. Six individuals fell into the T2 haplotype, representing 19%: SS_01; SS_05; SS_18; SS_19; SS_28; and SS_33. The haplotype P′QT was identified in five individuals, with a frequency of 16%: SS_22; SS_25; SS_26; SS_30; and SS_34. (This haplotype was also identified in the analysis of the nucleotide sequences from taurine specimens with direct descent from Bos taurus primigenius.) A single individual, SS_11, was included in the T1 haplotype, which had the lowest frequency at only 3% (Table 7).

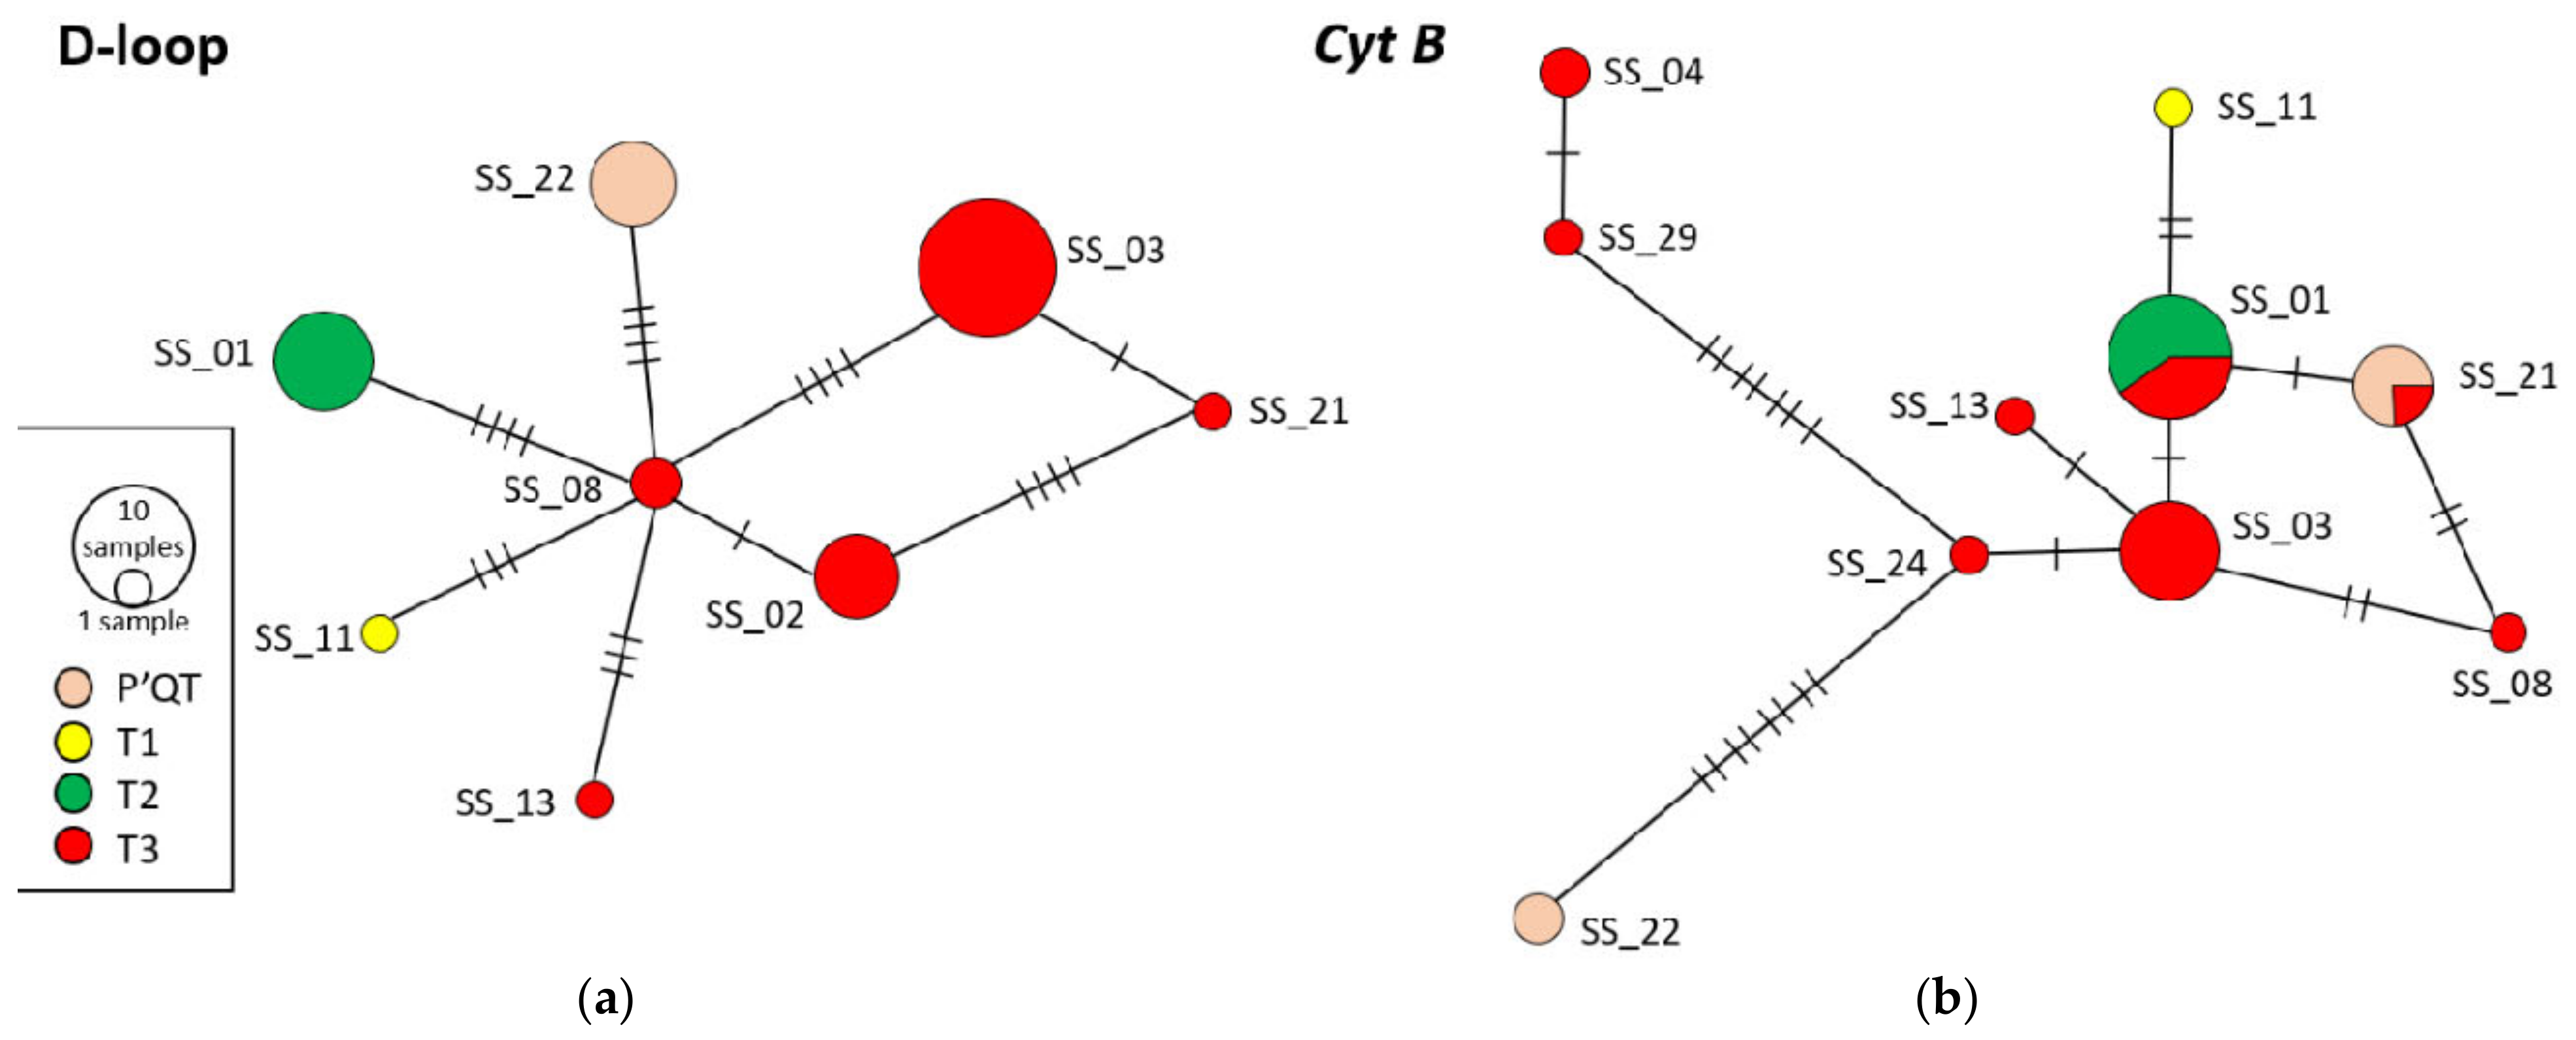
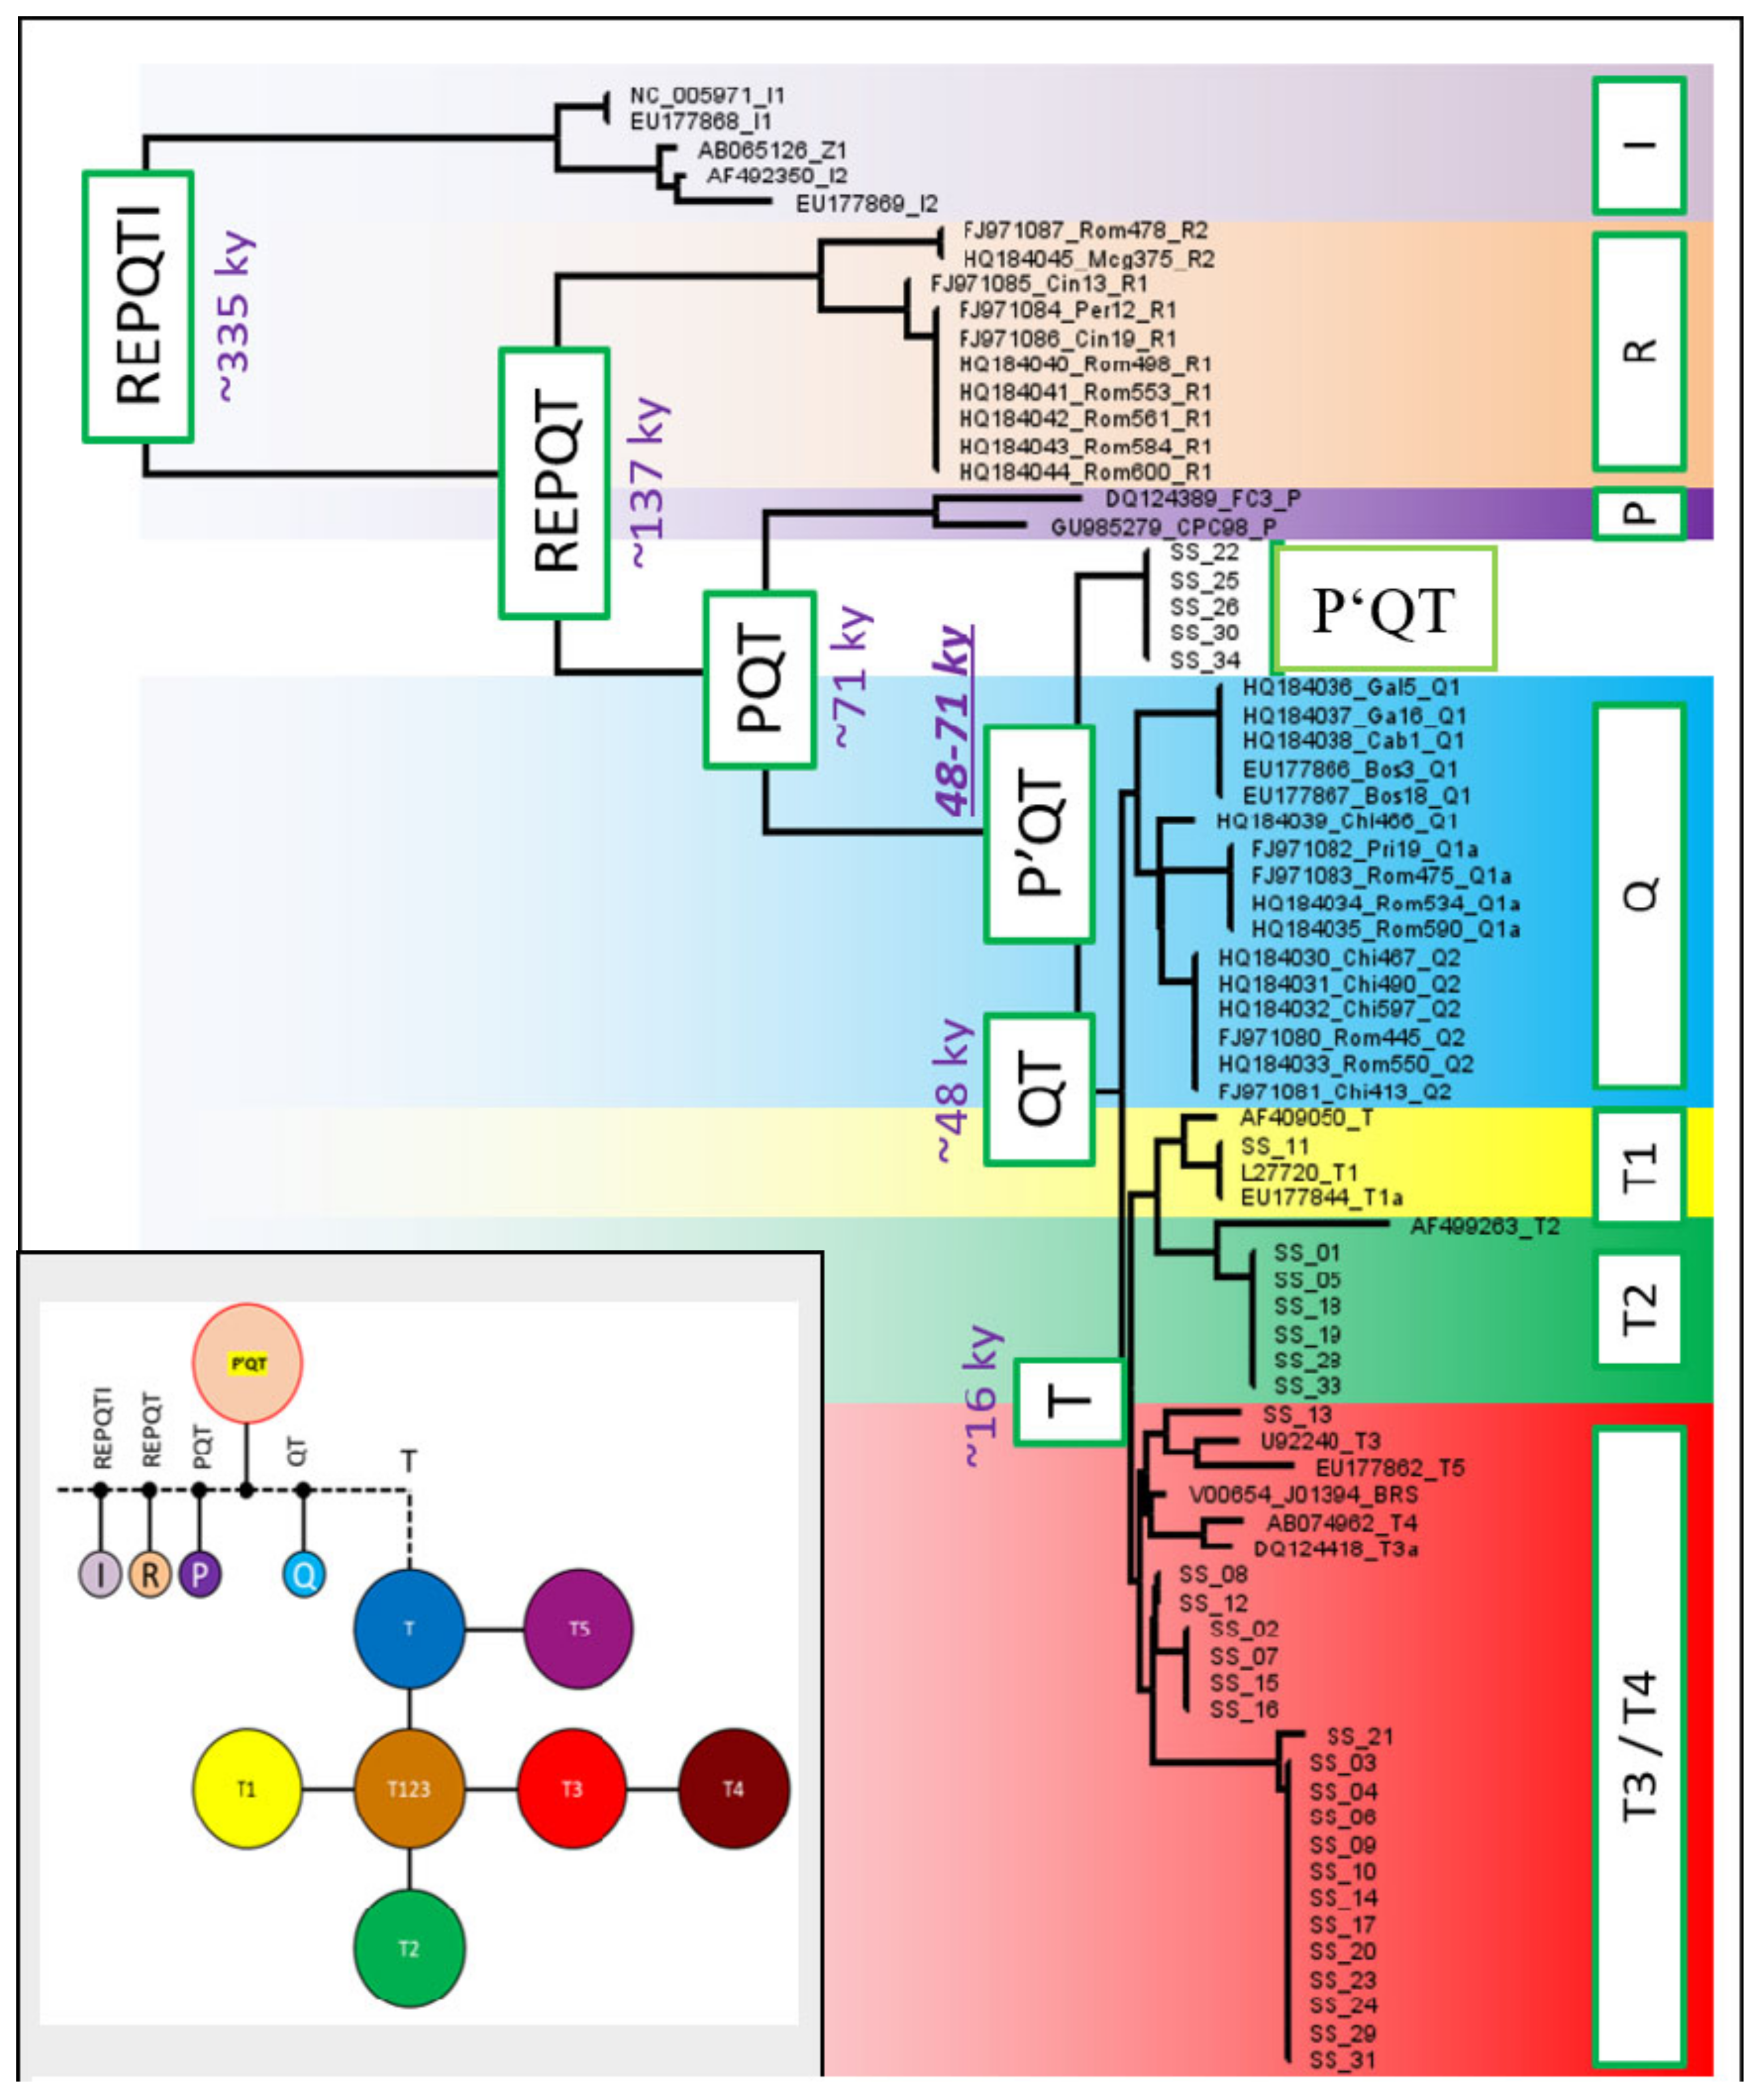
3.6. Haplotype Network Analysis and Phylogenetic Tree Construction

The analysis of the nucleotide sequences using the Network program resulted in the haplotype network graphically represented in Figure 8a,b. Four major haplotypes (T1, T2, T3, and P′QT) were identified, with specific connection networks. Each haplotype corresponded to a certain number of individuals (Table 7).
Through the analysis of the distribution of the four haplotypes, it was found that the T3 haplotype had the highest weight, being identified in 20 individuals out of the 32 that were analyzed.
The identification of the P′QT haplogroup following the analysis of the nucleotide sequences of the Grey Steppe cattle breed indicated that this haplotype is of the ancestral type, being specific to Bos taurus primigenius, from which this breed evolved. Within this haplogroup, five individuals were identified (SS_22; SS_25; SS_26; SS_30; and SS_34), representing 16% of the specimens analyzed. The genetic distance between haplotypes T1, T2, and T3 varied between one and four sites. The presence of T-derived haplotypes suggested the demographic expansion of this population (Figure 9).

4. Discussion

To date, only a few studies have been conducted on the genetic composition of Podolian cattle breeds. Most were confined to a few breeds and focused on the nuclear genome. This study reported, for the first time, the genetic diversity and phylogenetic characteristics of indigenous Romanian Grey cattle based on the sequencing of mtDNA markers. The analysis of genetic diversity and phylogeny plays an essential role in the genetic improvement and selection of cattle breeds for sustainable breeding and management programs in many countries. The type and number of haplotypes constitutes a key indicator in the maternal line of a cattle breed’s genetic diversity. The numerous studies of mtDNA in the Bovinae species [2,19,36,37,38] have demonstrated the existence of five major haplotypes specific to the genus Bos taurus, the wild ancestor of domesticated cattle (T1, T2, T3, and T4), as well as two haplotypes for Bos indicus (I1 and I2). Recent research [39,40,41,42,43] has shown that almost all taurines belong to macro-haplogroup T, and the estimated divergence time is ~16,000 years, indicating a narrow bottleneck in the evolutionary history of taurines in the Bos taurus genus. Macro-haplogroup T is divided into two sister subclades (T5 and T1/T2/T3), the predominant subclade being T1/T2/T3. Over time, T4 was integrated into T3 [44]. Haplogroup P was another prominent haplogroup in European aurochs, but it has not been found in current European cattle. However, from a dataset of over 3000 haplotypes, haplogroup P has only been detected in three modern breeds: Asian cattle, Korean cattle, and Chinese cattle [45]. This haplogroup is thought to be a relic of wild auroch introgression into the early domesticated bovine gene pool [45,46].
Other studies [47,48], aimed at analyzing the nucleotide sequences of the d-loop specific to an endangered Italian taurine breed, led to the identification of another haplogroup belonging to this breed, namely, haplogroup Q. Haplogroup Q was also identified following the phylogenetic analysis of ancestral European cattle, with descent from Bos taurus primigenius. A study by Achilli et al. [19], regarding the origin of taurines based on mitochondrial genome analysis, demonstrated that not all taurines in Europe belong to haplogroup T. In this study, we analyzed the gene sequences of the mtDNA from 26 European cattle breeds (22 from Italy and 4 from other regions of Europe). Most breeds fell into macro-haplogroup T and its subclades. Of the analyzed breeds, 1.4% were representative of haplogroups P and Q, which are specific to ancestral cattle from northern and central Europe with Bos taurus primigenius as their common ancestor. Haplogroup Q is phylogenetically close to macro-haplogroup T. Studies in the literature show that haplogroup Q and haplogroup T subclades are implicated in the same domestication event in the Fertile Crescent [49,50,51].
It has been suggested that haplogroup P belongs to breeds domesticated in the Near East, which then moved following the migration of humans. Another recent article by Senczuk et al. [21] contributed several findings regarding the origin and evolutionary history of the Podolian cattle breeds. Haplogroup P is characteristic of ancestral taurines of central and northern Europe and a few modern taurine breeds. In the haplogroup Q line, Italian, Egyptian, and Neolithic European cattle breeds can be distinguished, and in the R line, Italian cattle breeds can be distinguished from the Podolian Grey group. Compared to modern European cattle breeds, cattle from the “Podolian Grey” group, which also includes the Grey Steppe breed that was the subject of this research, present many ancestral characteristics (long horns, longevity, and adaptability to climatic and environmental conditions). The evolutionary history of European cattle is dominated by introgression events with both ancestral cattle and other breeds. According to the latest findings, the introgression between Indic and European taurines dates back ~4200 years [21,52,53].
Other studies on Podolian breeds found 13 haplotypes in 5 Istrian cattle and 5 haplotypes in 47 Slavonian Syrmian Podolian cattle [54], as well as 7 haplotypes in 39 Bulgarian Grey cattle [55]. Significantly lower levels of genetic diversity were observed in Serbian Podolian (0.709; n = 11) and Ukrainian Grey cattle (0.000; n = 8) [56], which could be explained by the lower sample size or the influence of human breeding activities (inbreeding, population bottlenecks). Moreover, modern cattle populations and wild cattle have high haplotype diversity, with the predominance of haplogroups T1, T2, and T3 [19,24].
Through molecular investigations, we found that the cytochrome b gene was the mitochondrial marker capable of evaluating the phylogenetic relationships most accurately, showing particular relevance for highlighting genetic differences, while the d-loop molecular marker presented the best topological support.

5. Conclusions

The identification of the P′QT haplogroup following the analysis of the mitochondrial marker nucleotide sequences of the Grey Steppe cattle breed indicated that this haplogroup is of an ancestral type, being specific to the wild Bos taurus primigenius, from which this breed evolved. The present research might help to save the endangered Romanian Grey Steppe. The findings from a small population of endangered Romanian Grey cattle demonstrate the presence of significant genetic variety and underline the importance of the breed in the formation of overall genetic biodiversity in cattle. Saving the Romanian Grey breed from extinction will assist both Romanian agriculture and global genetic heritage. The results of this study demonstrated that the Romanian Grey is a direct descendant of Bos taurus primigenius, representing a valuable tool for efforts to conserve the genetic resources of this endangered cattle breed.

Author Contributions

Conceptualization, M.-A.D.; methodology, M.-A.D., M.C. and D.-L.G.; software, M.-A.D. and M.C.; validation, M.-A.D. and D.S.; formal analysis, M.-A.D., S.C., D.-L.G. and M.C.; investigation, M.-A.D., S.C. and D.-L.G.; data curation, D.S.; writing—original draft preparation, M.-A.D.; writing—review and editing, M.-A.D., M.C. and D.S.; supervision, M.-A.D. All authors have read and agreed to the published version of the manuscript.

Funding

This research received no external funding.

Institutional Review Board Statement

In this study, blood samples were collected from 32 cows, in accordance with the EU directive UE 2016/679 on “general data protection regulation”. Samples were collected through the puncture of the jugular vein, and sampling procedures were in accordance with the EU Directive 2010/63/EU “on the protection of animals used for scientific purposes”. Animals were not subjected to experimental factors.

Data Availability Statement

The data present in this study are available on request from the first author and corresponding authors.

Conflicts of Interest

The authors declare no conflict of interest.

References

  1. Groeneveld, L.F.; Lenstra, J.A.; Eding, H.; Toro, M.A.; Scherf, B.; Pilling, D. Genetic diversity in farm animals—A review. Anim. Genet. 2010, 11, 6–31. [Google Scholar] [CrossRef] [Green Version]
  2. Pariset, L.; Mariotti, M.; Nardone, A.; Soysal, M.I.; Ozkan, E.; Williams, J.L.; Dunner, S.; Leveziel, H.; Maroti-Agots, A.; Bodo, I.; et al. Relationships between Podolic cattle breeds assessed by single nucleotide polymorphisms (SNPs) genotyping. J. Anim. Breed. Genet. 2010, 127, 481–488. [Google Scholar] [CrossRef]
  3. Ilie, D.E.; Cean, A.; Cziszter, L.T.; Gavojdian, D.; Ivan, A.; Kusza, S. Microsatellite and Mitochondrial DNA study of native Eastern European cattle populations: The case of the Romanian Grey. PLoS ONE 2015, 10, e0138736. [Google Scholar] [CrossRef] [Green Version]
  4. Scherf, B.D. World Watch List for Domestic Animal Diversity, 3rd ed.; FAO: Rome, Italy, 2000; Available online: http://www.fao.org/docrep/009/x8750e/x8750e00.htm (accessed on 23 May 2022).
  5. Creangă, Ș.; Dascălu, D.L.; Ariton, A.M. Conservation of Grey Steppe Cattle Breed from Romania in Order to Ensure the Biodiversity of the Genetic Resources of the Animal Populations; Pim: Iași, Romania, 2018; pp. 15–23. ISBN 20978-606-13-4638-7. [Google Scholar]
  6. Teneva, A.; Todorovska, E.; Tyufekchiev, N.; Kozelov, L.; Atanassov, A.; Foteva, S.; Ralcheva, S.; Zlatarev, S. Molecular characterization of Bulgarian livestock genetic resources: Genetic diversity in Bulgarian grey cattle as revealed by microsatellite markers. Biotechnol. Anim. Husb. 2005, 21, 35–42. [Google Scholar] [CrossRef]
  7. Creangă, Ş.; Maciuc, V.; Leonte, C. Genetical conservation for Romanian Grey Steppe cattle breed from SCDCB Dancu, Iasi county. Sci. Pap. Vet. Med. Ser. 2008, 51, 702–706. [Google Scholar]
  8. Georgescu, S.E.; Manea, M.A.; Zaulet, M.; Costache, M. Genetic diversity among Romanian cattle breeds with a special focus on the Romanian Grey Steppe Breed. Rom. Biotechnol. Lett. 2008, 14, 4194–4200. [Google Scholar]
  9. Creangă, Ș.; Chelmu, S.S.; Maciuc, V.; Bâlteanu, V.A. Molecular characterization of Grey Steppe cattle breed for its genetic biopreservation. Rom. Biotechnol. Lett. 2013, 18, 8893–8900. [Google Scholar]
  10. Maciuc, V.; Radu-Rusu, R.M. Assessment of Grey Steppe cattle genetic and phenotypic traits as valuable resources in preserving biodiversity. Environ. Eng. Manag. J. 2018, 17, 2741–2748. [Google Scholar]
  11. Maciuc, V. Cattle Breeding Management; Alfa: Iași, Romania, 2006; pp. 76–78. ISBN 973-8953-18-9. [Google Scholar]
  12. Creangă, Ș.; Maciuc, V. Grey Steppe Cattle Breed from Romania; Alfa: Iași, Romania, 2010; pp. 47–58. ISBN 978-606-540-034-4. [Google Scholar]
  13. Dascălu, D.L.; Creangă, Ș.; Borș, S.I.; Doliș, M.G.; Simeanu, D.; Donosă, R. The Romanian Grey Steppe characterisation—The breed evolution in the last century from the numerical and morphological point of view. Danub. Anim. Genet. Resour. 2017, 2, 70–75. [Google Scholar]
  14. Davidescu, M.A.; Ciorpac, M.; Madescu, B.M.; Porosnicu, I.; Creangă, Ș. Analysis of the Genetic diversity of endangered cattle breeds based on studies of genetic markers. Sci. Pap. Anim. Sci. Biotechnol. 2021, 54, 60–63. [Google Scholar]
  15. Davidescu, M.A.; Grădinaru, A.C.; Creangă, Ș. Endangered romanian cattle breeds–between traditional breeding and genetic conservation. Sci. Pap.-Anim. Sci. Ser. Sci. Pap.-Anim. Husb. Ser. 2021, 75, 66–75. [Google Scholar]
  16. Grădinaru, A.C.; Petrescu-Mag, I.V.; Oroian, F.C.; Balint, C.; Oltean, I. Milk Protein Polymorphism Characterization: A Modern Tool for Sustainable Conservation of Endangered Romanian Cattle Breeds in the Context of Traditional Breeding. Sustainability 2018, 10, 534. [Google Scholar] [CrossRef] [Green Version]
  17. Bollongino, R.; Edwards, C.J.; Alt, K.W.; Burger, J.; Bradley, D.G. Early history of European domestic cattle as revealed by ancient DNA. Biol. Lett. 2006, 2, 155–159. [Google Scholar] [CrossRef] [PubMed]
  18. Bollongino, R.; Elsner, J.; Vigne, J.D.; Burger, J. Y-SNPs do not indicate hybridisation between European aurochs and domestic cattle. PLoS ONE 2008, 3, e3418. [Google Scholar] [CrossRef]
  19. Achilli, A.; Bonfiglio, S.; Olivieri, A.; Malusà, A.; Pala, M. The multifaceted origin of taurine cattle reflected by the mitochondrial genome. PLoS ONE 2009, 4, e5753. [Google Scholar] [CrossRef] [PubMed] [Green Version]
  20. Sinding, M.H.S.; Gilbert, M.T.P. The draft genome of extinct European Aurochs and its implications for de-extinction. Open Quat. 2016, 2, 7. [Google Scholar] [CrossRef] [Green Version]
  21. Senczuk, G.; Mastrangelo, S.; Ajmone-Marsan, P.; Becskei, Z.; Colangelo, P.; Colli, L.; Ferretti, L.; Karsli, T.; Lancioni, H.; Lasagna, E.; et al. On the origin and diversification of Podolian cattle breeds: Testing scenarios of European colonization using genome-wide SNP data. Genet. Sel. 2021, 53, 48. [Google Scholar] [CrossRef]
  22. Dascălu, D.L. Conservation of the Romanian Grey Steppe Breed. Ph.D. Thesis, Iasi University of Life Sciences, Iași, Romania, 2014. [Google Scholar]
  23. PCR Master Mix—Promega Corporation. PCR Master Mix. Available online: https://www.promega.ro/products/pcr/taq-polymerase/master-mix-pcr/?catNum=M7502 (accessed on 12 May 2021).
  24. GenBank Overview-NCBI. Bos taurus Complete Mitochondrial Genome. Available online: https://www.ncbi.nlm.nih.gov/nuccore/V00654.1 (accessed on 15 September 2021).
  25. Seroussi, E.; Yakobson, E. Bovine mtDNA D-loop haplotypes exceed mutations in number despite reduced recombination: An effective alternative for identity control. Animal 2010, 4, 1818–1822. [Google Scholar] [CrossRef]
  26. Wang, X.; Zhang, Y.Q.; He, D.C.; Yang, X.M.; Li, B.; Wang, D.C.; Guang, J.; Xu, F.; Li, J.Y.; Gao, X.; et al. The complete mitochondrial genome of Bos taurus coreanae (Korean native cattle). Mitochondrial DNA A DNA Mapp. Seq. Anal. 2016, 27, 120–121. [Google Scholar] [CrossRef]
  27. Liu, S.J.; Lv, J.Z.; Tan, Z.Y.; Ge, X.Y. The complete mitochondrial genome of Uruguayan native cattle (Bos taurus). Mitochondrial DNA B Resour. 2020, 5, 443–444. [Google Scholar] [CrossRef] [Green Version]
  28. Arbizu, C.I.; Ferro-Mauricio, R.D.; Chávez-Galarza, J.C.; Vásquez, H.V.; Maicelo, J.L.; Poemape, C.; Gonzales, J.; Quilcate, C.; Corredor, F.-A. The Complete Mitochondrial Genome of a Neglected Breed, the Peruvian Creole Cattle (Bos taurus), and Its Phylogenetic Analysis. Data 2022, 7, 76. [Google Scholar] [CrossRef]
  29. Guo, X.; Pei, J.; Xiong, L.; Bao, P.; Zhu, Y.; Wangdui, B.; Wu, X.; Chu, M.; Yan, P.; Ding, X. The complete mitochondrial genome of Shigaste humped cattle (Bos taurus). Conserv. Genet. Resour. 2017, 10, 789–790. [Google Scholar] [CrossRef]
  30. Thompson, J.D.; Higgins, D.G.; Gibson, T.J. CLUSTAL W: Improving the sensitivity of progressive multiple sequence alignment through sequence weighting, position-specific gap penalties and weight matrix choice. Nucleic Acids Res. 1994, 22, 4673–4680. [Google Scholar] [CrossRef] [PubMed] [Green Version]
  31. Rozas, J.; Sánchez-DelBarrio, J.C.; Messeguer, X.; Rozas, R. DnaSP, DNA polymorphism analyses by the coalescent and other methods. Bioinformatics 2003, 19, 2496–2497. [Google Scholar] [CrossRef] [PubMed] [Green Version]
  32. Tarekegn, G.M.; Ji, X.Y.; Bai, X.; Liu, B.; Zhang, W.; Birungi, J.; Djikeng, A.; Tesfaye, K. Variations in mitochondrial cytochrome b region among Ethiopian indigenous cattle populations assert Bos taurus maternal origin and historical dynamics. Asian-Australas. J. Anim. Sci. 2018, 31, 1393–1400. [Google Scholar] [CrossRef] [Green Version]
  33. Yang, S.L.; Lin, R.Y.; Xu, L.X.; Cheng, L. Analysis of polymorphisms of mitochondrial DNA D-loop and Mc1R gene in Chinese Wuchuan Black cattle. J. Appl. Anim. Res. 2014, 42, 487–491. [Google Scholar] [CrossRef]
  34. Darriba, D.; Taboada, G.L.; Doallo, R.; Posada, D. jModelTest 2: More models, new heuristics and parallel computing. Nature Methods 2012, 9, 772. [Google Scholar] [CrossRef]
  35. Akaike, H. Anew look at the statistical model identification. IEEE Trans. Autom. Control 1974, 19, 716–723. [Google Scholar] [CrossRef]
  36. Achilli, A.; Olivieri, A.; Pellecchia, M.; Uboldi, C.; Colli, L. Mitochondrial genomes of extinct aurochs survive in domestic cattle. Curr. Biol. 2008, 18, 157–158. [Google Scholar] [CrossRef] [Green Version]
  37. Bonfiglio, S.; Ginja, C.; De Gaetano, A.; Achilli, A.; Olivieri, A.; Colli, L.; Tesfaye, K.; Agha, S.H.; Gama, L.T.; Cattonaro, F.; et al. Origin and spread of Bos taurus: New clues from mitochondrial genomes belonging to haplogroup T1. PLoS ONE 2012, 7, e38601. [Google Scholar] [CrossRef] [Green Version]
  38. Di Lorenzo, P.; Lancioni, H.; Ceccobelli, S.; Colli, L.; Cardinali, I.; Karsli, T.; Capodiferro, M.R.; Sahin, E.; Ferretti, L.; Marsan, P.A.; et al. Mitochondrial DNA variants of Podolian cattle breeds testify for a dual maternal origin. PLoS ONE 2018, 13, e0192567. [Google Scholar] [CrossRef] [Green Version]
  39. Olivieri, A.; Gandini, F.; Achilli, A.; Fichera, A.; Rizzi, E.; Bonfiglio, S.; Battaglia, V.; Brandini, S.; De-Gaetano, A.; El-Beltagi, A.; et al. Mitogenomes fromEgyptian Cattle Breeds: New Clues on the Origin of Haplogroup Q and the Early Spread of Bos taurus from the Near East. PLoS ONE 2015, 10, e0141170. [Google Scholar] [CrossRef] [PubMed]
  40. Park, S.D.E.; Magee, D.A.; McGettigan, P.A.; Teasdale, M.D.; Edwards, C.J.; Lohan, A.J.; Murphy, A.; Braud, M.; Donoghue, M.T.; Liu, Y.; et al. Genome sequencing of the extinct Eurasian wild aurochs, Bos primigenius, illuminates the phylogeography and evolution of cattle. Genome Biol. 2015, 16, 234. [Google Scholar] [CrossRef] [Green Version]
  41. Cubric-Curik, V.; Novosel, D.; Brajkovic, V.; Rota Stabelli, O.; Krebs, S.; Sölkner, J.; Šalamon, D.; Ristov, S.; Berger, B.; Trivizaki, S.; et al. Large-scale mitogenome sequencing reveals consecutive expansions of domestic taurine cattle and supports sporadic aurochs introgression. Evol. Appl. 2022, 15, 663–678. [Google Scholar] [CrossRef] [PubMed]
  42. Dorji, J.; Vander-Jagt, C.; Chamberlain, A.; Cocks, B.; MacLeod, I.; Daetwyler, H. Cattle Maternal Diversity Inferred from 1,883 Taurine and Indicine Mitogenomes. Res. Sq. 2021. [Google Scholar] [CrossRef]
  43. Dorji, J.; Vander Jagt, C.J.; Chamberlain, A.J.; Cocks, B.G.; MacLeod, I.M.; Daetwyler, H.D. Recovery of mitogenomes from whole genome sequences to infer maternal diversity in 1883 modern taurine and indicine cattle. Sci. Rep. 2022, 12, 5582. [Google Scholar] [CrossRef]
  44. Liu, H.; Zhai, J.; Wu, H.; Wang, J.; Zhang, S.; Li, J.; Niu, Z.; Shen, C.; Zhang, K.; Liu, Z.; et al. Diversity of Mitochondrial DNA Haplogroups and Their Association with Bovine Antral Follicle Count. Animals 2022, 12, 2350. [Google Scholar] [CrossRef]
  45. Edwards, J.; Bollongino, R.; Scheu, A.; Chamberlain, A.; Tresset, A.; Vigne, J.D.; Baird, J.F.; Larson, G.; Ho, S.Y.; Heupink, T.H. Mitochondrial DNA analysis shows a Near Eastern Neolithic origin for domestic cattle and no indication of domestication of European aurochs. Proc. Biol. Sci. 2007, 274, 1377–1385. [Google Scholar] [CrossRef]
  46. Stock, F.; Edwards, C.J.; Bollongino, R.; Finlay, E.K.; Burger, J.; Bradley, D.G. Cytochrome b sequences of ancient cattle and wild ox support phylogenetic complexity in the ancient and modern bovine populations. Anim. Genet. 2009, 40, 694–700. [Google Scholar] [CrossRef]
  47. Magee, D.A.; Hugh, D.E.; Ceiridwen, J.E. Interrogation of modern and ancient genomes reveals the complex domestic history of cattle. Anim. Front. 2014, 4, 7–22. [Google Scholar] [CrossRef] [Green Version]
  48. Maretto, F.; Ramljak, J.; Sbarra, F.; Penasa, M.; Mantovani, R.; Ivankovic, A.; Bittantea, G. Genetic relationship among Italian and Croatian Podolian cattle breeds assessed by microsatellite markers. Livest. Sci. 2012, 150, 256–264. [Google Scholar] [CrossRef]
  49. Felius, M.; Beerling, M.-L.; Buchanan, D.S.; Theunissen, B.; Koolmees, P.A.; Lenstra, J.A. On the History of Cattle Genetic Resources. Diversity 2014, 6, 705–750. [Google Scholar] [CrossRef] [Green Version]
  50. Pitt, D.; Sevane, N.; Nicolazzi, E.L.; Hugh, D.E.; Park, S.D.E.; Colli, L.; Martinez, R.; Bruford, M.W.; Orozco-terWenge, P. Domestication of cattle: Two or three events? Evol. Appl. 2019, 12, 123–136. [Google Scholar] [CrossRef] [PubMed]
  51. Verdugo, M.P.; Mullin, V.E.; Scheu, A.; Mattiangeli, V.; Daly, K.G.; Maisano Delser, P.; Hare, A.J.; Burger, J.; Collins, M.J.; Kehati, R.; et al. Ancient cattle genomics, origins, and rapid turnover in the Fertile Crescent. Science 2019, 365, 173–176. [Google Scholar] [CrossRef]
  52. Loftus, R.T.; MacHugh, D.E.; Bradley, D.G.; Sharp, P.M.; Cunningham, E.P. Evidence for two independent domestications of cattle. Proc. Natl. Acad. Sci. USA 1994, 91, 2757–2761. [Google Scholar] [CrossRef] [Green Version]
  53. Upadhyay, M.R.; Chen, W.; Lenstra, J.A.; Goderie, C.R.; MacHugh, D.E.; Park, S.D.; Magee, D.A.; Matassino, D.; Ciani, F.; Megens, H.J.; et al. European Cattle Genetic Diversity Consortium & RPMA Crooijmans Genetic origin, admixture and population history of aurochs (Bos primigenius) and primitive European cattle. Heredity 2017, 118, 169–176. [Google Scholar] [CrossRef] [Green Version]
  54. Ivankovic, A.; Paprika, S.; Ramljak, J.; Dovc, P.; Konjacic, M. Mitochondrial DNA-based genetic evaluation of autochthonous cattle breeds in Croatia. Czech J. Anim. Sci. 2014, 59, 519–528. [Google Scholar] [CrossRef]
  55. Hristov, P.; Teofanova, D.; Neov, B.; Radoslavov, G. Haplotype diversity in autochthonous Balkan cattle breeds. Anim. Genet. 2014, 46, 92–94. [Google Scholar] [CrossRef]
  56. Kantanen, J.; Edwards, C.J.; Bradley, D.G.; Viinalass, H.; Thessler, S.; Ivanova, Z.; Kiselyova, T.; Ćinkulov, M.; Popov, R.; Stojanović, S.; et al. Maternal and paternal genealogy of Eurasian taurine cattle (Bos taurus). Heredity 2009, 103, 404–415. [Google Scholar] [CrossRef]
Figure 1. The Grey Steppe cattle within the Research and Development Station for Cattle Breeding, Iasi, Romania (original photograph).
Agriculture 12 02059 g001
Figure 2. The complete mitochondrial genome of Bos taurus: (a) complete mitochondrial genome of Bos taurus (16,340 bp); (b) mitochondrial markers analyzed—cytochrome b (1140 bp) and d-loop-(910 bp) [29].
Agriculture 12 02059 g002
Figure 3. Amplification of mitochondrial markers: (a) Amplification of cytochrome b sequence (M, 100 bp marker; C-, negative control; 1–8: sample numbers). (b) Amplification of d-loop sequence (M, 100 bp marker; C-, negative control; 1–9: sample numbers).
Agriculture 12 02059 g003
Figure 4. The frequency of nitrogenous bases (A: adenine; T: thymine; C: cytosine; and G: guanine) for the sequences of cytochrome b and d-loop.
Agriculture 12 02059 g004
Figure 5. Demographic expansion of Grey Steppe population: (a) cytochrome b; (b) d-loop.
Agriculture 12 02059 g005
Figure 6. Substitution rates for each nucleotide, calculated in jModelTest: (a) cytochrome b gene sequences; (b) d-loop gene sequences.
Agriculture 12 02059 g006
Figure 7. The frequency of haplotypes in Grey Steppe cattle population analyzed.
Agriculture 12 02059 g007
Figure 8. The network haplotypes of Grey Steppe cattle population: (a) d-loop; (b) cytochrome b.
Agriculture 12 02059 g008
Figure 9. Phylogenetic tree obtained from the data analysis of the cytochrome b gene and the estimation of divergence time.
Agriculture 12 02059 g009
Table 1. Information on Grey Steppe population analyzed.
Current No. Cattle
Identification No.
Age of Cattle
(Months)
SexBlood Sample
Identification Code 1
1.RO242000109988288femaleblood-ss01
2.RO242000110002242femaleblood-ss02
3.RO245000109998228femaleblood-ss03
4.RO241000109812202femaleblood-ss04
5.RO247000109811193femaleblood-ss05
6.RO243000109786187femaleblood-ss06
7.RO243000109800186femaleblood-ss07
8.RO242000110205185femaleblood-ss08
9.RO243000109723185femaleblood-ss09
10.RO241000110120184femaleblood-ss10
11.RO241000110274178femaleblood-ss11
12.RO242000120579175femaleblood-ss12
13.RO243000120587175femaleblood-ss13
14.RO242000120656171femaleblood-ss14
15.RO243000120678171femaleblood-ss15
16.RO243000174164152femaleblood-ss16
17.RO242000218328144femaleblood-ss17
18.RO243000218587136femaleblood-ss18
19.RO143000108432128femaleblood-ss19
20.RO248001058693111femaleblood-ss20
21.RO507000112314109femaleblood-ss21
22.RO50600116628997femaleblood-ss22
23.RO50400116630896femaleblood-ss23
24.RO50800383142269femaleblood-ss24
25.RO50200383148268femaleblood-ss25
26.RO50400550078461femaleblood-ss26
27.RO50100730079039femaleblood-ss27
28.RO50800730085837femaleblood-ss28
29.RO50700740535829femaleblood-ss29
30.RO50400740538828femaleblood-ss30
31.RO50700744826727femaleblood-ss31
32.RO50000744840622femaleblood-ss32
1—“ss” is the abbreviation of the name of the cattle breed in the Romanian language (Sura Stepa).
Table 2. Characteristics of the primer pairs used to amplify the gene sequences by PCR.
Primer SetPrimer SpecificitySequenced (5′-3′)Content
G 1 + C 2
(%)
GenBank Accession no./Position in Genome [23]Length of PCR
Product (bp)
BCYTcytochrome b Forward:
TTCTTACATGGAATCTAACCATGA
33.3V00654.1
14,443–14,466
1140
cytochrome b
cytochrome bReverse:
GGGAGGTTAGTTGTTCTCCTTCTC
50.0V00654.1
473–497
BRSd-loopForward:
CCTAAGACTCAAGGAAGAAACTGC
45.8V00654.1
15,718–15,741
910
d-loop
d-loopReverse:
CAGTGAGAATGCCCTCTAGGTT
50.0V00654.1
496–517
1 “G”—guanine nitrogen base. 2 “C”—cytosine nitrogen base.
Table 3. PCR program: cytochrome b and d-loop sequence amplification.
Stages *Cytochrome b Amplification Conditionsd-Loop Amplification Conditions
TemperatureTimeTemperatureTime
1. Denaturing94 °C2 min94 °C2 min
2. Annealing62 °C30 s60 °C30 s
3. Extending72 °C5 min72 °C5 min
* ×35 amplification cycles.
Table 4. List of programs used for data analysis.
Data AnalysisProgram Used
Amplicon sequencing
Sanger sequencing
Agriculture 12 02059 i001
Alignment of chromatograms and correction of raw sequences
DNA Baser
Agriculture 12 02059 i002
Sequence alignment
Mega X
Agriculture 12 02059 i003
Calculation of the optimal substitution model
jModelTest
Agriculture 12 02059 i004
Haplotype network construction
PopArt
Agriculture 12 02059 i005
Construction of phylogenetic trees
SeaView/PhyML
Agriculture 12 02059 i006
Nucleotide sequence diversity analysis
DnaSP
Agriculture 12 02059 i007
Table 5. The optimal substitution model calculated in the jModelTest program (cytochrome b and d-loop).
Cytochrome bd-Loop
Model TrN+I 6TPM3uf
Partition 010020012012
-lnL 11708.19511354.6687
K 26467
freqA 30.3125R(a)1.00000.3278R(a)23.9836
freqC 30.3021R(b)4.45910.2440R(b)200.0000
freqG 30.1352R(c)1.00000.1379R(c)0.0586
cytochrome bd-loop
freqT 30.2501R(d)1.00000.2902R(d)23.9836
ti/tv 4-R(e)0.5005-R(e)200.0000
-R(f)1.0000-R(f)0.0586
p-inv 50.8680gamma- gamma-
1 -lnL: negative log likelihood. 2 K: number of estimated parameters. 3 freqA, freqC, freqG, freqT: frequency of nitrogen base A, C, G, and T, respectively. 4 ti/tv: transition/trasversion ratio. 5 p-inv: proportion of invariable sites. 6 I: invariable sites
Table 6. Number of sites and Ti/Tv ratio for cytochrome b and d-loop mitochondrial markers specific to the Grey Steppe population.
SequenceNo. of Informative Sites%No. of Variable Sites %Ti/Tv 1
cytochrome b181.6221.90.755
d-loop131.4182.05.107
1 ti/tv: transition/trasversion ratio.
Table 7. Identified haplotypes and representative individuals for each haplotype in Grey Steppe population.
Haplotypes IdentifiedRepresentative IndividualsTotal Individuals/Haplotype
T3/T4SS_02; SS_03; SS_04; SS_06; SS_07; SS_08; SS_09; SS_10; SS_12; SS_13; SS_14; SS_15; SS_16; SS_17; SS_20; SS_21; SS_23; SS_24; SS_29; SS_3120
T2SS_01; SS_05; SS_18; SS_19; SS_28; SS_336
T1SS_111
P′QTSS_22; SS_25; SS_26; SS_30; SS_345
Publisher’s Note: MDPI stays neutral with regard to jurisdictional claims in published maps and institutional affiliations.

