Article

The Impact of Government Agricultural Development Support on Agricultural Income, Production and Food Security of Beneficiary Small-Scale Farmers in South Africa

by
Mahlako Nthabeleng Mokgomo
1,*,
Clarietta Chagwiza
2 and
Phathutshedzo Fancy Tshilowa
1
1
Department of Agriculture and Animal Health, College of Agriculture and Environmental Sciences, Florida Campus, University of South Africa, Johannesburg 1710, South Africa
2
Department of Agricultural Economics, University of Pretoria, Pretoria 0028, South Africa
*
Author to whom correspondence should be addressed.
Agriculture 2022, 12(11), 1760; https://doi.org/10.3390/agriculture12111760
Submission received: 12 September 2022 / Revised: 19 October 2022 / Accepted: 20 October 2022 / Published: 25 October 2022

Abstract

:
Enormous Literature indicates that agriculture remains a source of livelihood for about 86% of rural people and generates job opportunities for approximately 1.3 billion small-scale farmers and landless workers. Over the past couple of years, the South African government has been offering varied support to households that are engaged in small-scale farming to improve their livelihoods, income and food security. Although the various rounds of the General Households Survey (GHS) gathered information on the type of agricultural support received by the farmers about their food production, agricultural income and food security status, there is still limited pragmatic evidence on the extent to which programme is yielding the intended results. The main aim of the study was to use GHS data spanning the period 2013 to 2016 to assess how government agricultural development support influences the livelihoods of small-scale farmers in South Africa. Using both descriptive analyses with Propensity Score Matching (PSM) and Logistics estimations, the result of the study indicates that the proportion of households who have access to the agricultural development support have decreased marginally by two percent from 16% in 2013 to 14% in 2016. The study also reveals that agriculture development assistance given by the South African government is effective in reducing food insecurity, improving agricultural production and income of the beneficiary small-scale farmers. Following the observed marked gender, racial and geographical differences in households’ access to the agricultural development support, the Ministry of Agriculture and its allied ministries and departments responsible for the implementation of the agricultural development support programmes must streamline policies to account for the lack of support to farmers in general. Addressing such differences is necessary to ensure that the programme achieves its intended overall objectives.

1. Introduction

Agricultural development support has continued to be one of the key strategies of governments in developing countries for enhancing the livelihood of farmers, primarily small-scale farmers [1,2,3]. Enhanced food production, food security and higher rural income have been the primary targets of governments in developing countries [4,5,6].
The green revolution is a testimony to the effectiveness of agricultural development support, which contributed to a significant reduction in poverty, improved food security, agricultural income and transformation of the economy of many Asian and Latin American countries during the 1960s and 1970s [7,8,9]. Although this strategy was successful in these countries, it was the opposite in Africa due to environmental, political and economic differences [10,11,12,13].
At the regional level, the Southern African Development Community (SADC) members acknowledged that the agricultural sector remains central to poverty reduction, growth and sustainable food security in the region [14]. This sector provided livelihoods such as food, income and employment for nearly 70% of the SADC population [14].South Africa is one of the SADC participating countries. The support for small-scale farmers in South Africa began in the 1980s by the Development Bank of Southern Africa (DBSA) with the critical purpose of addressing constraints of farmers in the homeland areas [15]. This effort, named Farmers Support Programme (FSP), was a tool that the government developed to assist small-scale farmers in the homeland areas to improve their agricultural production, food security and income through comprehensive agricultural support [16,17].
The FSP provided small-scale farmers with comprehensive agricultural support, including production inputs through credit, mechanisation services, agricultural infrastructure, extension and research services, training and marketing. According to [16,18,19] the FSP was successful because farmers who participated in this programme gained improved access to inputs, extension services and mechanisation along with increased production. However, little attention was given to market development and institutional capacity-building.
After 1994 (post apartheid era), agriculture was identified as one of the sectors to be developed through land reform programmes of which the main focus of support has been on small-scale farmers. Although the agricultural development support is implemented on the number of initiatives, the biggest expenditure is on land reform and the Comprehensive Agricultural Support Programme (CASP) of which the impact has been small, with few farmers benefiting [20].
Programmes implemented under land reform can be classified into three types, namely land tenure, redistribution and restitution. Land tenure involves “addressing the challenges associated with the administration of land in the communal areas of the former homelands”, which has the highest concentrations of poverty in the country [21,22] Land restitution was meant to “redress historical injustices perpetrated through dispossession”. land redistribution is aimed at “providing previously disadvantaged Black South Africans with land for settlement and small-scale farming purposes” [21,22].
Redistribution of land is generally considered to have the potential to improve the livelihoods of the rural poor significantly and to propel economic development [23]. The government established the farmers support programmes mainly meant for the land reform beneficiaries, but also none land reform beneficiaries, taking cognisance of the fact that not all small-scale farmers are beneficiaries. The support includes on- and off-farm infrastructure, training and capacity building, technical advice and assistance, marketing and business development, information and knowledge management, financing mechanisms, free inputs and vaccination and agricultural production loans.
The 2016 GHS showed that small-scale farmers received agricultural development support from the government, private sector, Community Based Organisations (CBOs) and Non-Governmental Organisations (NGOs) [24,25,26,27]. Assistance included training, extension services, grants loans in the form of money, loans in the form of input, free inputs, vaccination, and other unspecified forms of support. The link between these assistances and the livelihood of small-scale farmers is shown through improved income, productivity and food security.
Many of these small-scale farmers have received agricultural development supports but remain unproductive [28,29]. This situation raises a concern about the interventionist and one-dimensional approach used by the government over the years, which could engender continuous dependence of farmers on such supports. Although there seems to be a consensus that lack of monitoring and institutional coordination have engendered the ineffectiveness of the numerous agricultural development support policies and programmes, one possible challenge is the limited number of empirical studies that have assessed the effectiveness of these policies from a nationally representative perspective.
Lack of policy cohesion and coordination has led to duplication, uncoordinated efforts and inadequate progress towards national and international development targets of food security [29]. Although agricultural production is heterogeneous between small-scale farmers, several studies have shown that farmer’s characteristics such as age, level of education, farming experience, marital status, household’s size and gender affect their farm productivity [30,31,32]. Contrary heterogeneity also exists on the different types of support because farmers receive additional support, which leads to different outcomes on productivity, income and food security.
Even so, earlier studies have shown that the agricultural output of small-scale farmers in the country is generally low due to several limitations that they face [33,34,35,36]. Amongst these limitations is reduced access to finance, lack of access to market, poor infrastructure, low level of education, lack of production inputs such as seeds and fertiliser, climate change, droughts, soil erosion, water pollution and other factors [37,38,39,40,41,42,43]. These constraints have impacted the effectiveness of various agricultural development support policies and programmes in achieving the intended objectives of reducing chronic hunger, unemployment, absolute poverty and inequality [39,40]. Therefore, sufficient and adequate agricultural development support must address these challenges and improve the livelihood of small-scale farmers through enhanced agricultural production, income and food security.
The study provided an alternative to the approach used by the Food and Agricultural Organisation (FAO). The FAO approach uses country’s food balance sheet to estimate calories intake per person calorie distribution in the population and establish a calorie cut-off point that is used to estimate the number of undernourished people [44]. Another aspect of this study which makes it unique, is that it uses an innovative approach to link farmers who were assisted with those who were not supported, using the type of assistance that they received as an identifier. Although the study is not a pure RCT, this approach helps to make it possible to obtain reliable and valid estimates that may not differ significantly from those of pure RCT. Finally, the contribution of this study is that, unlike the previous studies that cover only some provinces or communities within provinces, this study uses a nationally representative household survey, and pooled data across four survey periods.

2. Materials and Methods

2.1. Data

The GHS is a nationally representative household survey conducted annually by Stats SA since 2002. It is a household-level survey instrument used to determine the progress of development in South Africa. It is used regularly to gauge the performance of programmes and the quality-of-service delivery in several key service sectors in the country [24,25,26,27].
This study relies on the secondary data from the last four rounds of the GHS, which were conducted in 2013, 2014, 2015 and 2016 by Statistics South Africa (StatsSA). The survey contains detailed information on agricultural development supports given by the government to small-scale farmers, food security status of households including those of the small-scale farmers, income from sales of farming products and services and production of livestock. The information makes GHS an ideal source of data for the analyses of this study and over the years. The GHS data has been used in several studies covering agricultural support, food security, poverty and health [33,45,46,47].
Drawing on the research design of the GHS, the research design of this study is both cross-sectional and quantitative in nature. It is quantitative in the sense that it follows an approach that involves the testing of objective theories by examining the relationship among variables. The variables are consequently measured, typically on instruments, so that numbered data can be analysed using statistical procedure [48,49]. The design is also cross-sectional because it involves the collection of data from the study population at a single point in time to examine the relationship among variables [48,49].
The GHS involves a multi-stage sampling design. The “first stage is based on a stratified design with probability proportional to size selection of Primary Sampling Units (PSUs) which is the Census Enumeration Area (EAs)”.The “second stage involves the sampling of Dwelling Units (DUs) with systematic sampling”. “After allocating the sample to the nine provinces, the sample was further stratified by geography (primary stratification) and by population attributes using census 2011 data (secondary stratification)” The “data collection process also involved a visit by the enumerators to the sampled dwelling units in each of the nine sampled provinces” [24,25,26,27].
“The visit was meant to inform the sampled dwelling units about actual data collection, which took place four weeks later”. As presented in Table 1, a pooled data of 19,620 sample size is expected to be used for the analyses. The study pooled the last four rounds of the GHS data for the analyses because over the years, the survey has gathered the same information but not from the same households and individuals. The observations of variables on agricultural development support for some of the surveys are to allow for parametric analysis. As a result, pooling the four rounds as a composite data improved the sample size.

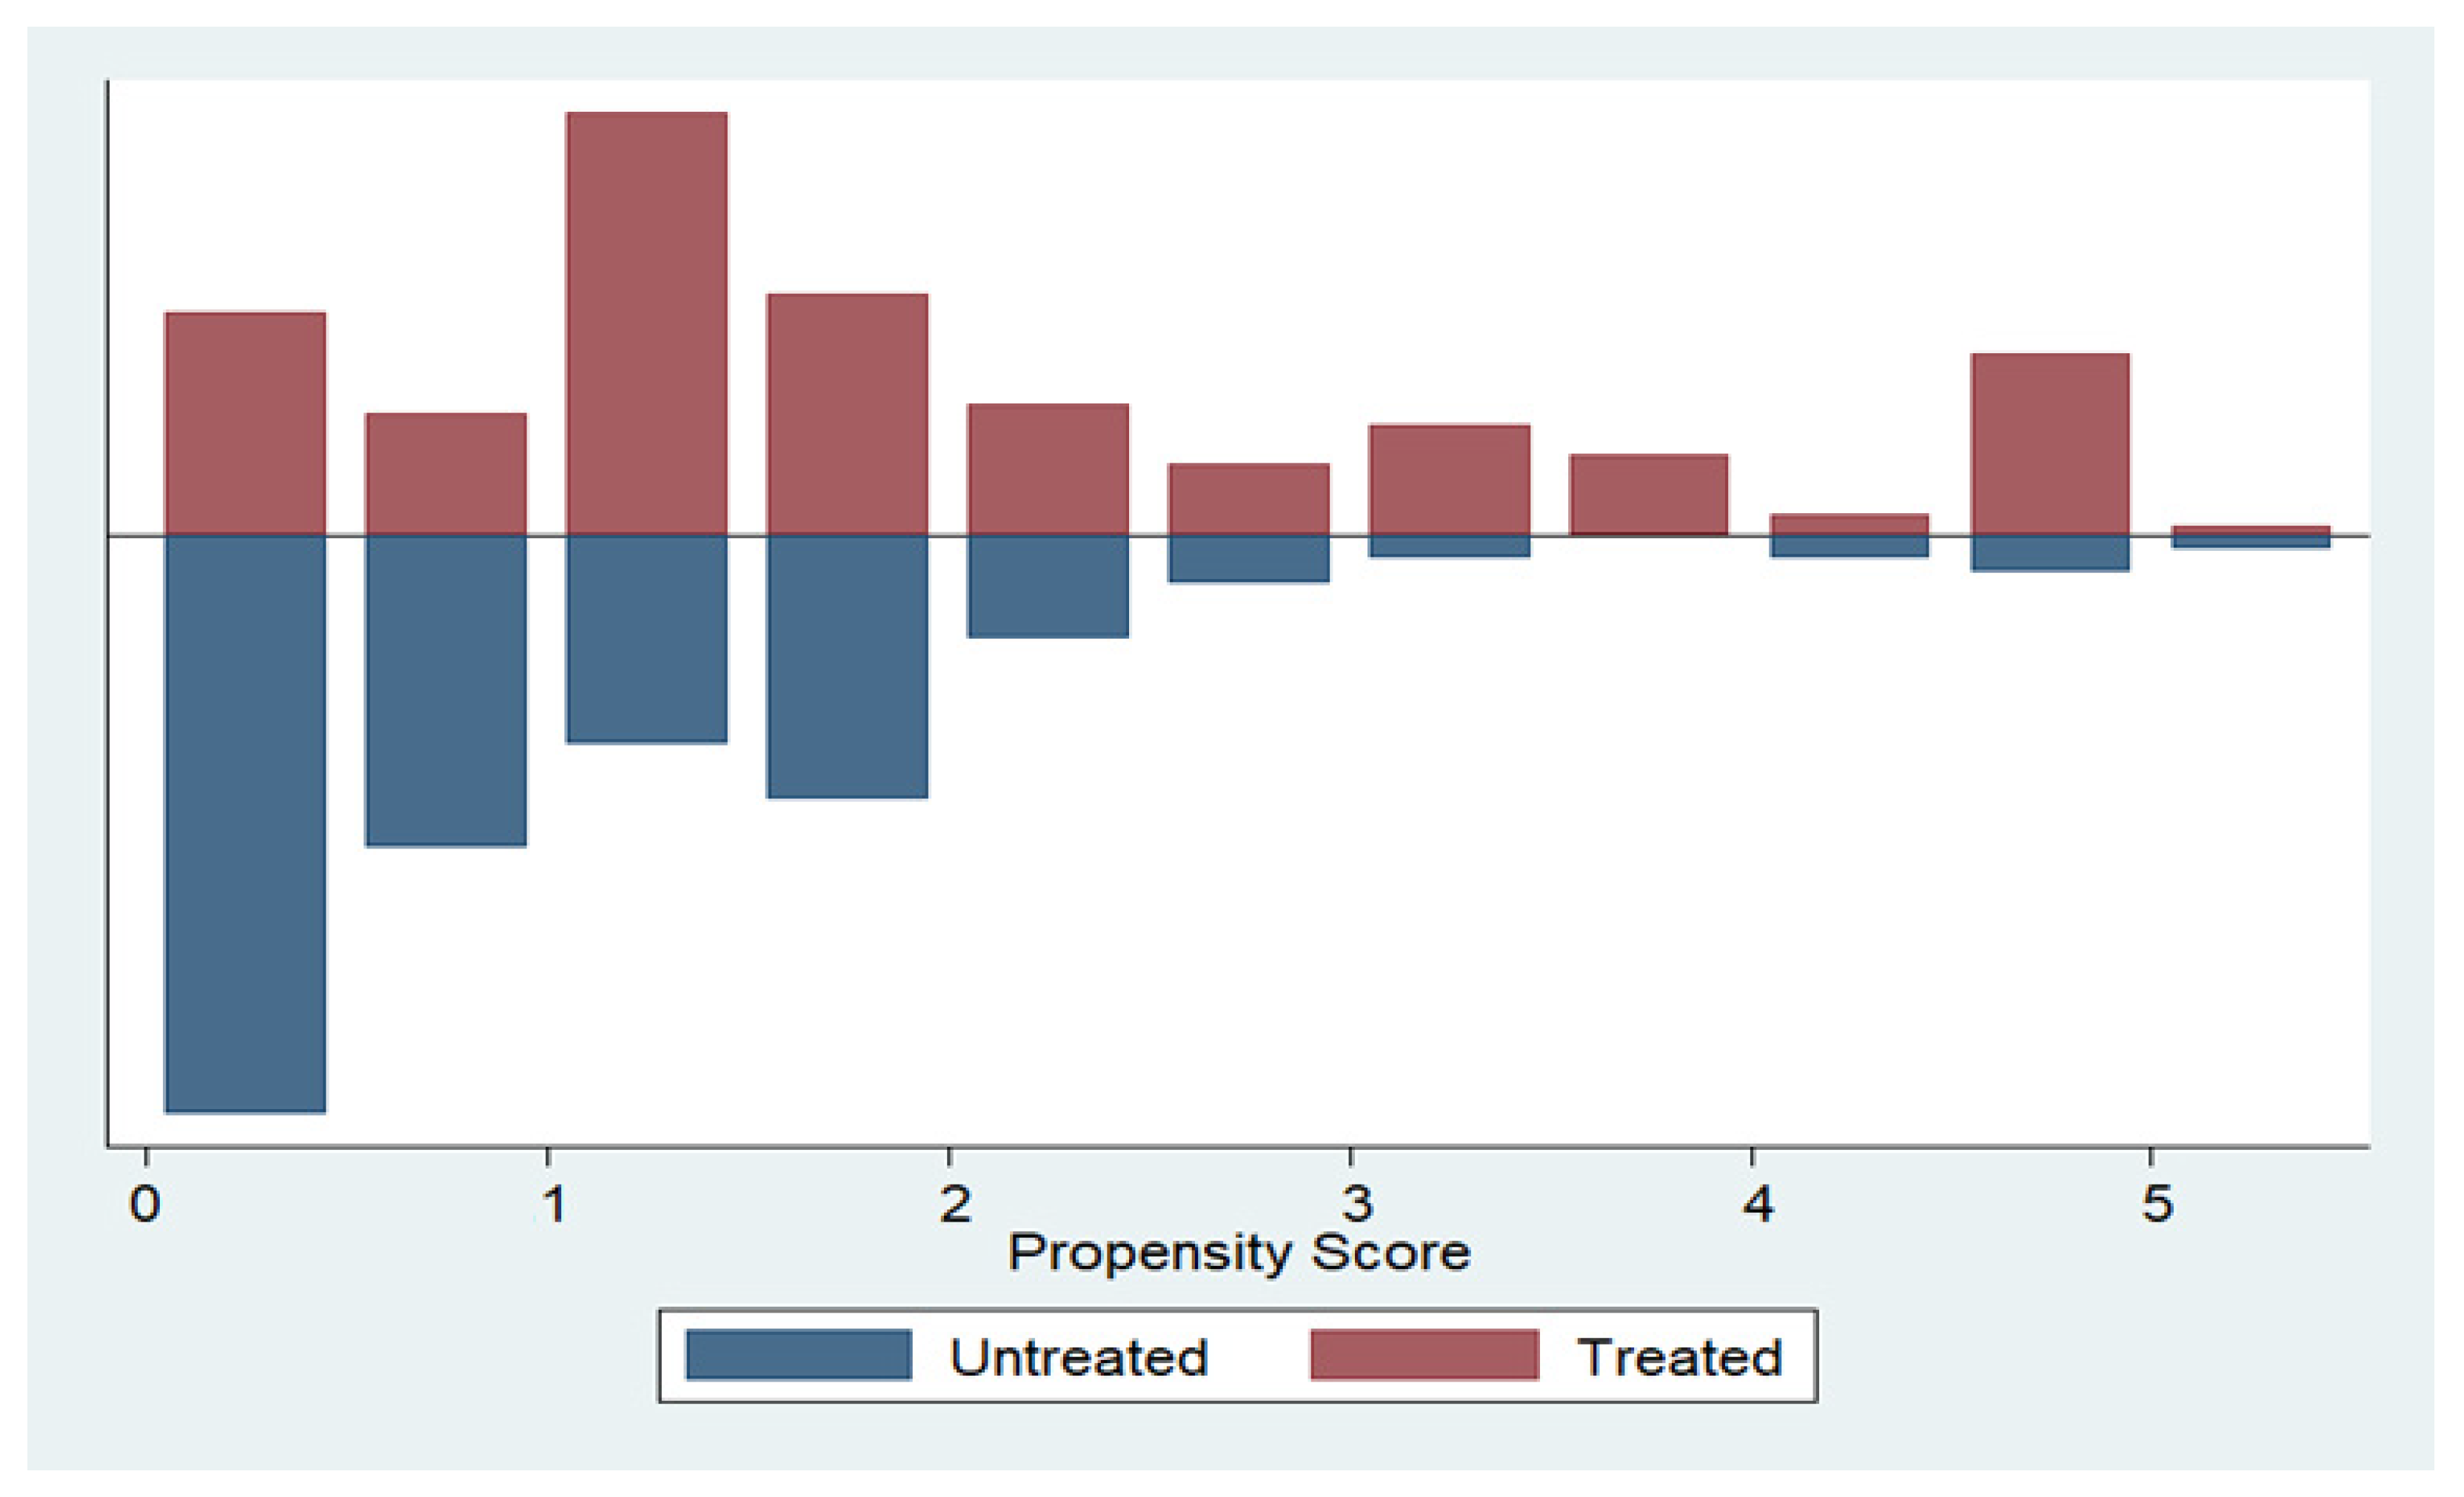
2.2. Estimation Techniques

Secondary data was used to address the objectives of the study. The initial stages of the analyses entailed an exploration of the data and the socio-economic variables that were included in the models. All the necessary data of the existing variables and generation of the indicators of food security, income and production were done at this stage of the analyses using the STATA version 14 software package. An assessment of this nature requires pure Randomised Control Trial (RCT). RCT is designed to test a hypothesis under optimal setting in the absence of confounding factors [50].
One of the approaches predominantly used in the literature in the modelling of quasi-experimental studies of this nature is the Propensity Score Matching (PSM) estimation method which also was applied in this analysis to quantify the impact of the government’s agricultural development support on the livelihood of the small-scale farmers. The PSM identifies respondents who were assisted similar to those who were not assisted based on observable characteristics. The first step in computing the PSM involves the estimation of the predicted probability that small-scale farmer will be selected for assistance. From Equation (1) of the theoretical model, the equation for the logistic regression can be specified as: p( x i ) = Probability ( A i = 1 | x i ).
The logistic regression is used to estimate the propensity score [p( x i )], by regressing the agricultural development assistance (1 = assisted and 0 = not assisted) on the observed observable covariates. The next step of the estimations process involves in the choice of a matching estimator, which can be done using several matching algorithms. However, this study applies three algorithms (i.e., nearest neighbour matching, kernel matching, and the radius matching technique) to ensure that the estimates are robust, the statistical significance of the average treatment effects on the quantities treated was tested using bootstrapped standard errors, which takes into account the variation that is caused by the matching process. The mathematical framework for the different algorithm for the PSM estimations and other relevant equations have been discussed extensively in [51,52,53,54].
The choice of the covariates was informed by two main conditions, as discussed in the literature. First, only variables that influence the treatment status (a receipt of agricultural development support) and the outcome variables (production, food security and income from agricultural activities) simultaneously. Second, the variable should be included, given that confoundedness requires the outcome variable(s) to be independent of treatment conditional on the propensity score [55,56]. Only variables that are unaffected by treatment should be included in the model. On the other hand, a variable should only be excluded from analysis if there is a consensus that the variable is either unrelated to the outcome or not a proper covariate. Complications can be minimised by using relevant variables were included in the propensity score estimations as recommended by [57].
Despite its qualities of producing robust estimates, one of the downsides of the PSM that needs to be highlighted is the likelihood of hidden bias. Hidden bias may occur when there are unobserved variables that affect both the variable of interest (receiving assistance) and the outcome variables see [54]. For instance, the PSM estimates can be over-estimated in conditions where households that were assisted were also likely to improve their productivity, income and food security. The hidden bias was addressed by including important observable individual and household level characteristics in the estimation of the propensity score specification to minimise any tendencies for omitted variable bias. Also, the matching process was implemented around the region of standard support see [53]. Thirdly, different matching algorithms were estimated to ensure the consistency of the results.
Food insecurity as another dependent variable was computed as a score from ten questions on food security in the GHS. More questions on this variable are clearly defined on Section 3.2 (Measurement of variables and a priori expectation).

2.3. Theoritical Model

The theoretical model that supports the empirical analysis of this study is adapted from the theory of net farm exits as espoused by [58,59,60]. The model proposes that when deciding on either quitting or continuing to engage in farming, farmers weigh the utility derived from continuing to farm with the utility that they would derive from quitting and becoming unemployed in the farming industry. This decision can be presented by matching the present value of expected future utility that a farmer would derive from farming at time t as Vtf, with that of quitting as Vtq. The farmer will quit if Vtf < Vtq but he/she continues to farm if Vtf > Vtq.
The farmer’s utility depends on his/her consumption levels, which in turn are dependent on his/her income or returns to labour (and capital) invested per unit of time invested in agriculture or off-farm work. Maximisation of utility is subject to three constraints: (1) budget constraint considering farm income (including direct payments), off-farm wage and non-labour income; (2) time allocation constraint that allows the farmer to spend all available labour on-farm, off-farm and leisure time; (3) existing farm production technology.
The farmer maximises a utility function (U), which is a function of goods consumed (C), leisure time (L), non-pecuniary benefits of being self-employed (S), and exogenous shifters (α). This can be functionally specified as:
U = u C ,   L ,   S ;   α
This maximisation of this utility is subject to income constraint (Equation (1)) and time constraint (Equation (2)).
P γ K ,   R ;   β + G K + φ V f T + A = C   P γ D = L + R + V
From Equations (1) and (2) P denotes farm output price; γ is the farm production function; K is the quantity of variable non-labour inputs; R is the number of days worked on-farm; β is a vector representing other fixed characteristics of the farmer.
Similarly, G denotes total farm government programme payments, such as direct payments; is the vector of prices of the variable representing non-labour inputs; φ represents the daily wages from off-farm market work, and V is the number of days invested in off-farm employment. Finally, f(T) is total transaction costs of working off the farm; and A denotes unearned (non-labour) household income; while D is the total time (hours, days, or weeks) available.
Assuming the objective of the rational small-scale farmer is to maximise his/her household income (Equation (1)), optimal labour allocation requires that the Marginal Value Product (MVP) of the labour used on-farm must be equal to the expected level of (off-farm) market wage. If the farmer decides to shift all available time from on-farm activities to off-farm activities, R will be equal to zero (R = 0). The value of on-farm labour MVP (i.e., the increase of revenues coming from an additional day worked on-farm) can be specified as Equation (3).
M V P = p = M P P
From Equation (3), MPP = ∂Q/∂df represents the marginal physical productivity of farm labour. Agricultural development policies can affect labour allocation decisions in two main ways: the first is by decreasing the level of risk associated with farming; the second is by directly supporting farm income. However, this study focuses on the second effect of agricultural development because direct payments affect labour allocation decisions in a more indirect way than price policies. The effect of direct payment changes according to the nature of payments as direct payments can be coupled to the production level, to the amount of land or heads of livestock, or can be separated from production.
Assuming the total amount of direct payment that a farmer receives (G) may be affected, directly or indirectly, by the number of days worked on-farm (df) and by other farm-specific characteristics (γ), such as current and past production patterns and farm location, this yields a generic and very simplified Equation (4):
G = g d f ; γ
Suppose direct payments are coupled to production (Coupled Direct Payment (CDP)), farmers are motivated to produce and to use more resources, including labour. A surge in the use of labour on-farm may contribute to an increase in the total amount of direct payments received by the farmer.
G d f > 0
Equation (5) depicts that agricultural development support (CDPs) received by farmers has the potential to induce an upward shift of their marginal value product and, consequently, their income and food security.

2.4. Theoritical Framework

Market Failure underpins the empirical analysis of this study because the objectives of the study fit well into the central tenet of this theory. The theory postulates that, under certain conditions commodity production and distribution in a competitive market characterised by pursuing of own self-interest of relevant agents, will result in the allocation of a socially inefficient commodity [61]. [62] describes market failure as a signal of the inability of a market economy to reach specific desirable outcomes in resource allocation. These expositions suggest that whenever a market failure occurs, the government’s intervention in regulating the market to achieve a more optimal distribution of resources is necessary.
Ref. [63] explained that the term “market failure” does not necessarily mean that a market is not working at all, but that it is not working because it is not producing goods that are wanted. Market failure may occur due to either supply or demand-side factors. It is a pervasive phenomenon in agriculture, especially in developing countries [64]. Ref. [65] discoursed that market failure is the product of the cost of the transaction through a market exchange which creates a disutility that is greater than the utility gain that it produces and mostly results in the market not being used for the transaction.
As a significant feature of the agriculture industry market failure manifests itself in many forms including but not limited to, unpredictable prices, unstable supply, low and volatile income for farmers, environmental costs of intensive farming (negative externalities), agriculture as an essential component of the life of rural residents (positive externalities), and monopsony power of food purchasers [66]. Price volatility of agricultural commodities is driven by a combination of factors, such as: (1) supply is price inelastic in the short term because production is time demanding; (2) demand is price inelastic because food is a necessity, and higher prices do not usually deter people; (3) climatic conditions can alter the supply of agricultural products.
Any of these factors resulting in market failure can affect the prices of agricultural products and the revenue of farmers in one way or the other [67]. A sharp reduction in price due to any of the mentioned factors may cause a fall in farmers’ revenue. A glut in supply equally may throw farmers out of business because prices can fall significantly below cost. Similarly, the cobweb theory predicts that prices can become stuck in a cycle of continually increasing volatility. The cyclical volatility of prices could occur if prices in a particular year fall below certain levels, forcing many farmers out of business [67].
Drawing on welfare economics theories, agricultural economists have proposed several theories to explain how the government can intervene to address the market imperfections often associated with the agricultural economic system. Such interventions include direct income support, implementation of regional labour market policies, and the abolition of price support policies [68]. The government can build buffer stocks to support price stabilisation, and institute price floors and price ceilings to regulate supply and stabilise farmers’ income.
The government can also set minimum prices (price floors) to guarantee farmers’ basic income by subsidising food prices. However, minimum prices may encourage oversupply and lead to excess production that may go waste. Another tool at the disposal of government to cushion the income and enhance the production of farmers is subsidies for farmers who adhere to more environmentally friendly methods of production. Import tariffs have also proved to be a useful policy tool to protect domestic farmers, although they cause the domestic price of agricultural produce to increase, leading to lower trade.
In the context of developed countries, one school of thought, led by [69], posited that two main factors largely influence agricultural support policies. The first factor is the country’s position as either a net exporter or net importer of agricultural products. Net importing countries of agricultural products usually provide higher support to farmers than their counterparts net exporting countries. The second factor is the farmer and non-farmer income differences. This school of thought assumes that the maximisation of a social welfare function based on egalitarian value preferences, which are relatively stable, reflects the behaviour of the political system. Like economic models, the model of this school of thought has been criticised because in general, as well as specific contexts, the model is unable to address several questions related to the characteristics of agriculture [68].
To propose a model to support the Common Agricultural Policy (CAP) introduced by the European Union, Nedergaard combined the traditional welfare economic theory of agriculture with the rational choice theory [68]. The model considers individual decision-makers in the market (producers and consumers) as the unit of analysis at the microeconomic level. Within the political-economic system, the microeconomic model of supply and demand considers the political decision-makers such as politicians and bureaucrats, political partners who constitute producers and consumers as the decision-units.
The principal assumption of the model is that politicians and bureaucrats are the ones who supply political decisions, while producers and consumers demand political decisions. Like the neo-classical microeconomics theory, maximisation of the utility function, regardless of the unit of analysis, remains the principal objective of all parties. At the micro-level, market failure takes place when economic actors resort to potential rent-seeking behaviour in the political system, a situation which translates into government failures, and consequently affects the microeconomic level [68,70]. The model depicts a structural causality between factors within the economic and political systems. It is assumed that several economic interests in the political system that try to build coalitions due to differences in political decisions translate into different cost and benefits for the various groups in society [68].
The model postulates that market failure in the agricultural markets, due to the intense political voice of farmers, could attract political intervention, a situation which will be eventually decided by the equilibrium between the supply of political decisions by politicians and bureaucrats on the one hand, and the demands of the farmer-producers, consumers and taxpayers on the other hand [68]. The importance of the redistribution of resources through government intervention is a common theme that runs through both the welfare economic theory and its later applied version in the agricultural industry. Therefore, government intervention to address any possible market failures that could contribute to sub-optimal and inefficient production.
Ref. [71] argued that government intervention is necessary to address public concerns regarding the inequality in the distribution of income, which is a sign of market failure. Government intervention in agriculture is aimed at the development of the sector. For instance, many countries developed their agricultural sector using various forms of direct or indirect government subsidies [72,73].
According to [73], most governments in developed nations subsidise farmers, while developing nations tax farmers with the ultimate rationale of stabilising prices, supporting the use of fertiliser, building irrigation systems, offering extension services, and providing credit rates that are often below the market rates. These supports often have counterproductive impacts by imposing enormous financial burdens on the government and generating allocative inefficiencies in low-income countries. The definition of market failure has been based on the two theories, which included the public goods and externalities explained below.
Based on the principles of market failure, it can be deduced that the economic agents who are mostly affected by this phenomenon are the small-scale farmers who often have face high cost of the transaction to be able to access markets [64]. Transaction costs have a significant influence on small-scale farmers’ resource allocation decisions. [74] argued that high transaction costs deter small-scale farmers from entering the market, and this deprives them of the benefits associated with commercialisation in agriculture. As mentioned in the previous paragraphs, other factors from the small-scale farmers’ perspective that could lead to market failures include changes in climatic conditions and price volatility.
These require the government’s interventions to reduce such transaction costs to encourage more farmers to participate in competitive markets. Therefore, a subsequent increase in productivity and thus help in meeting the South African government’s broader objectives of ensuring poverty alleviation in the country. While government intervention is considered necessary to correct the market failure in agricultural production, it comes with its problems. Studies suggest that the cost of subsidising agriculture, especially in developed countries, is high.
It is estimated that the cost of supporting agricultural producers in advanced countries in the year 2000 was about $245 billion, which was five times the total development assistance received by developing countries [67]. It has also been found that farmers who own large amounts of land and have virtually no incentive to follow more environmentally friendly procedures are the ones who often receive subsidies. Minimum prices have been found to contribute to over-supply, while tariffs on agriculture often lead to lower income for food exporters in the developing countries and these have been barriers to trade [75,76].

3. Results and Discussions

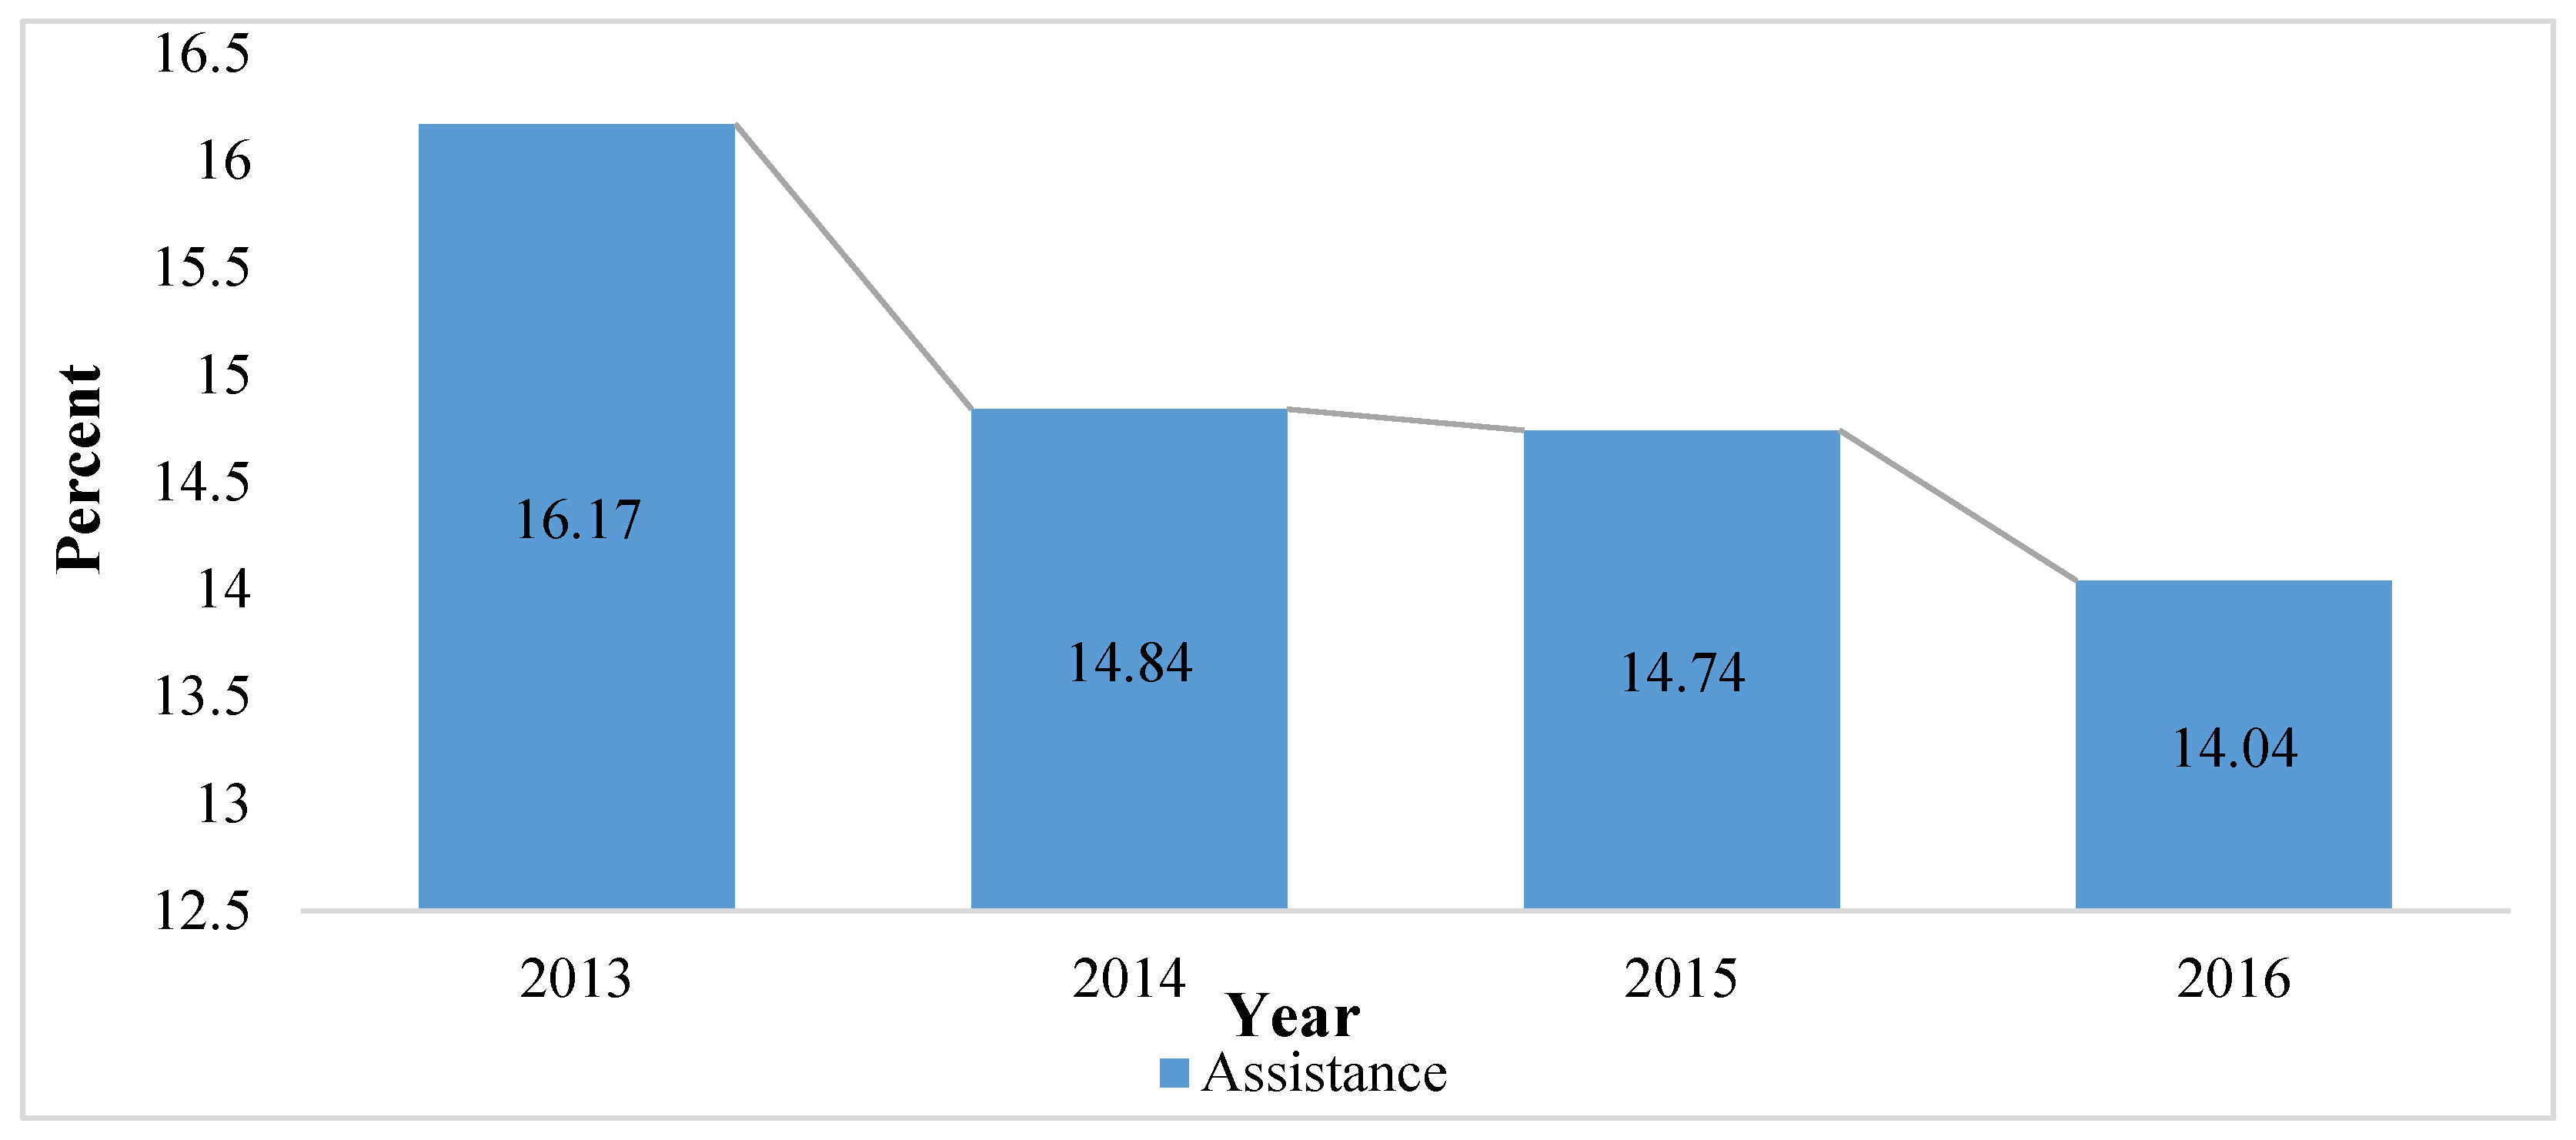
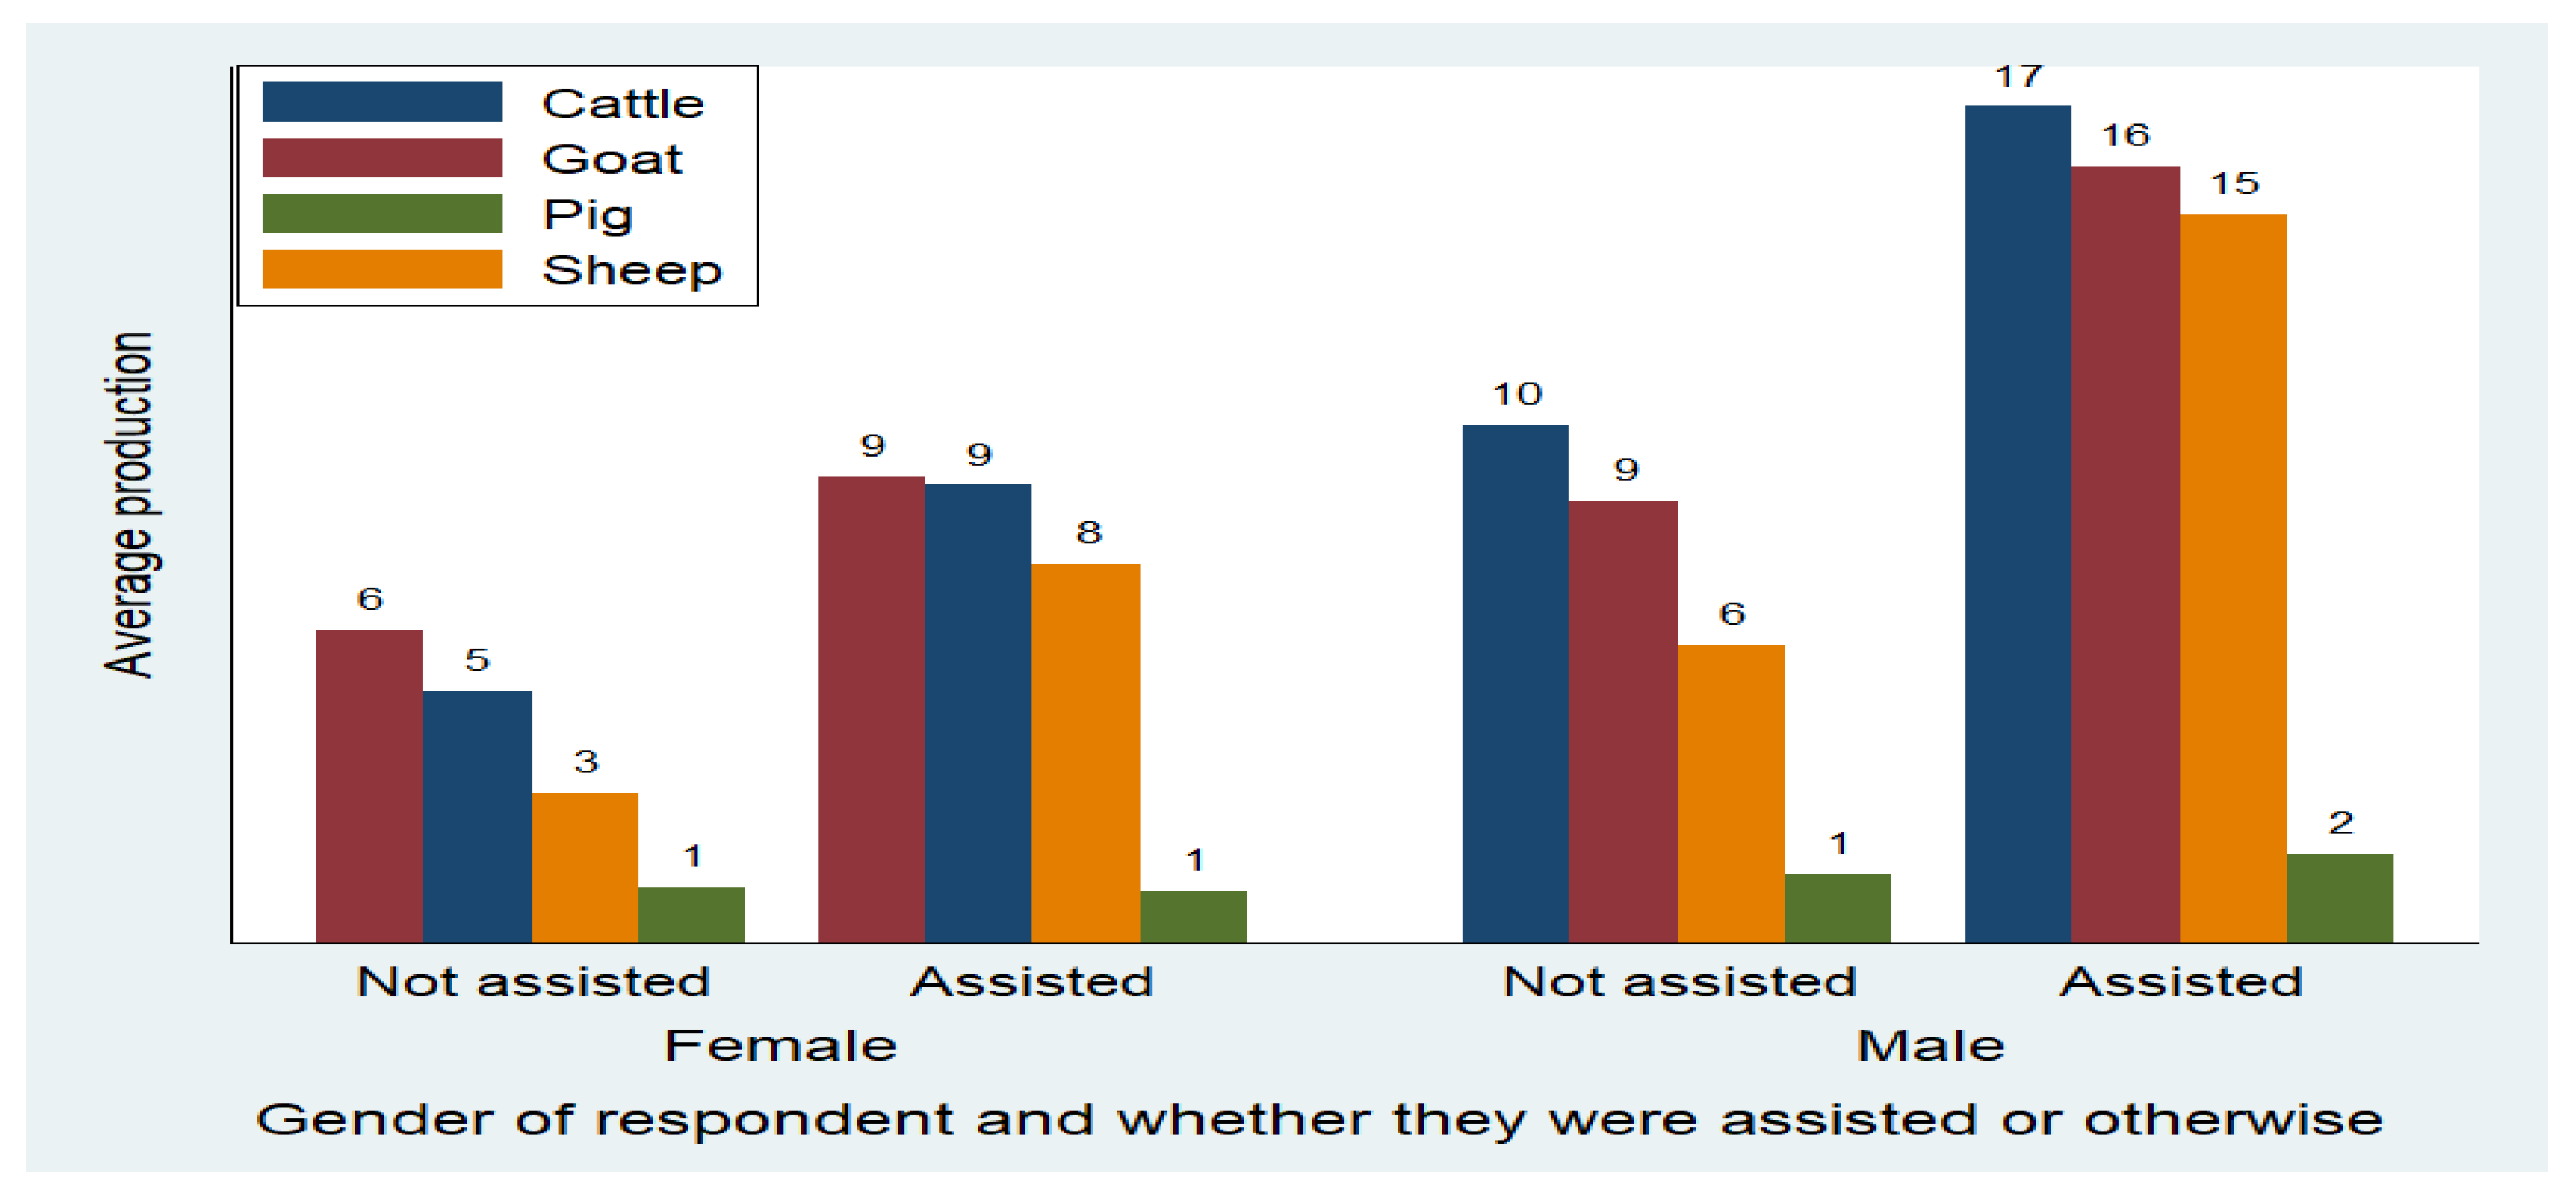
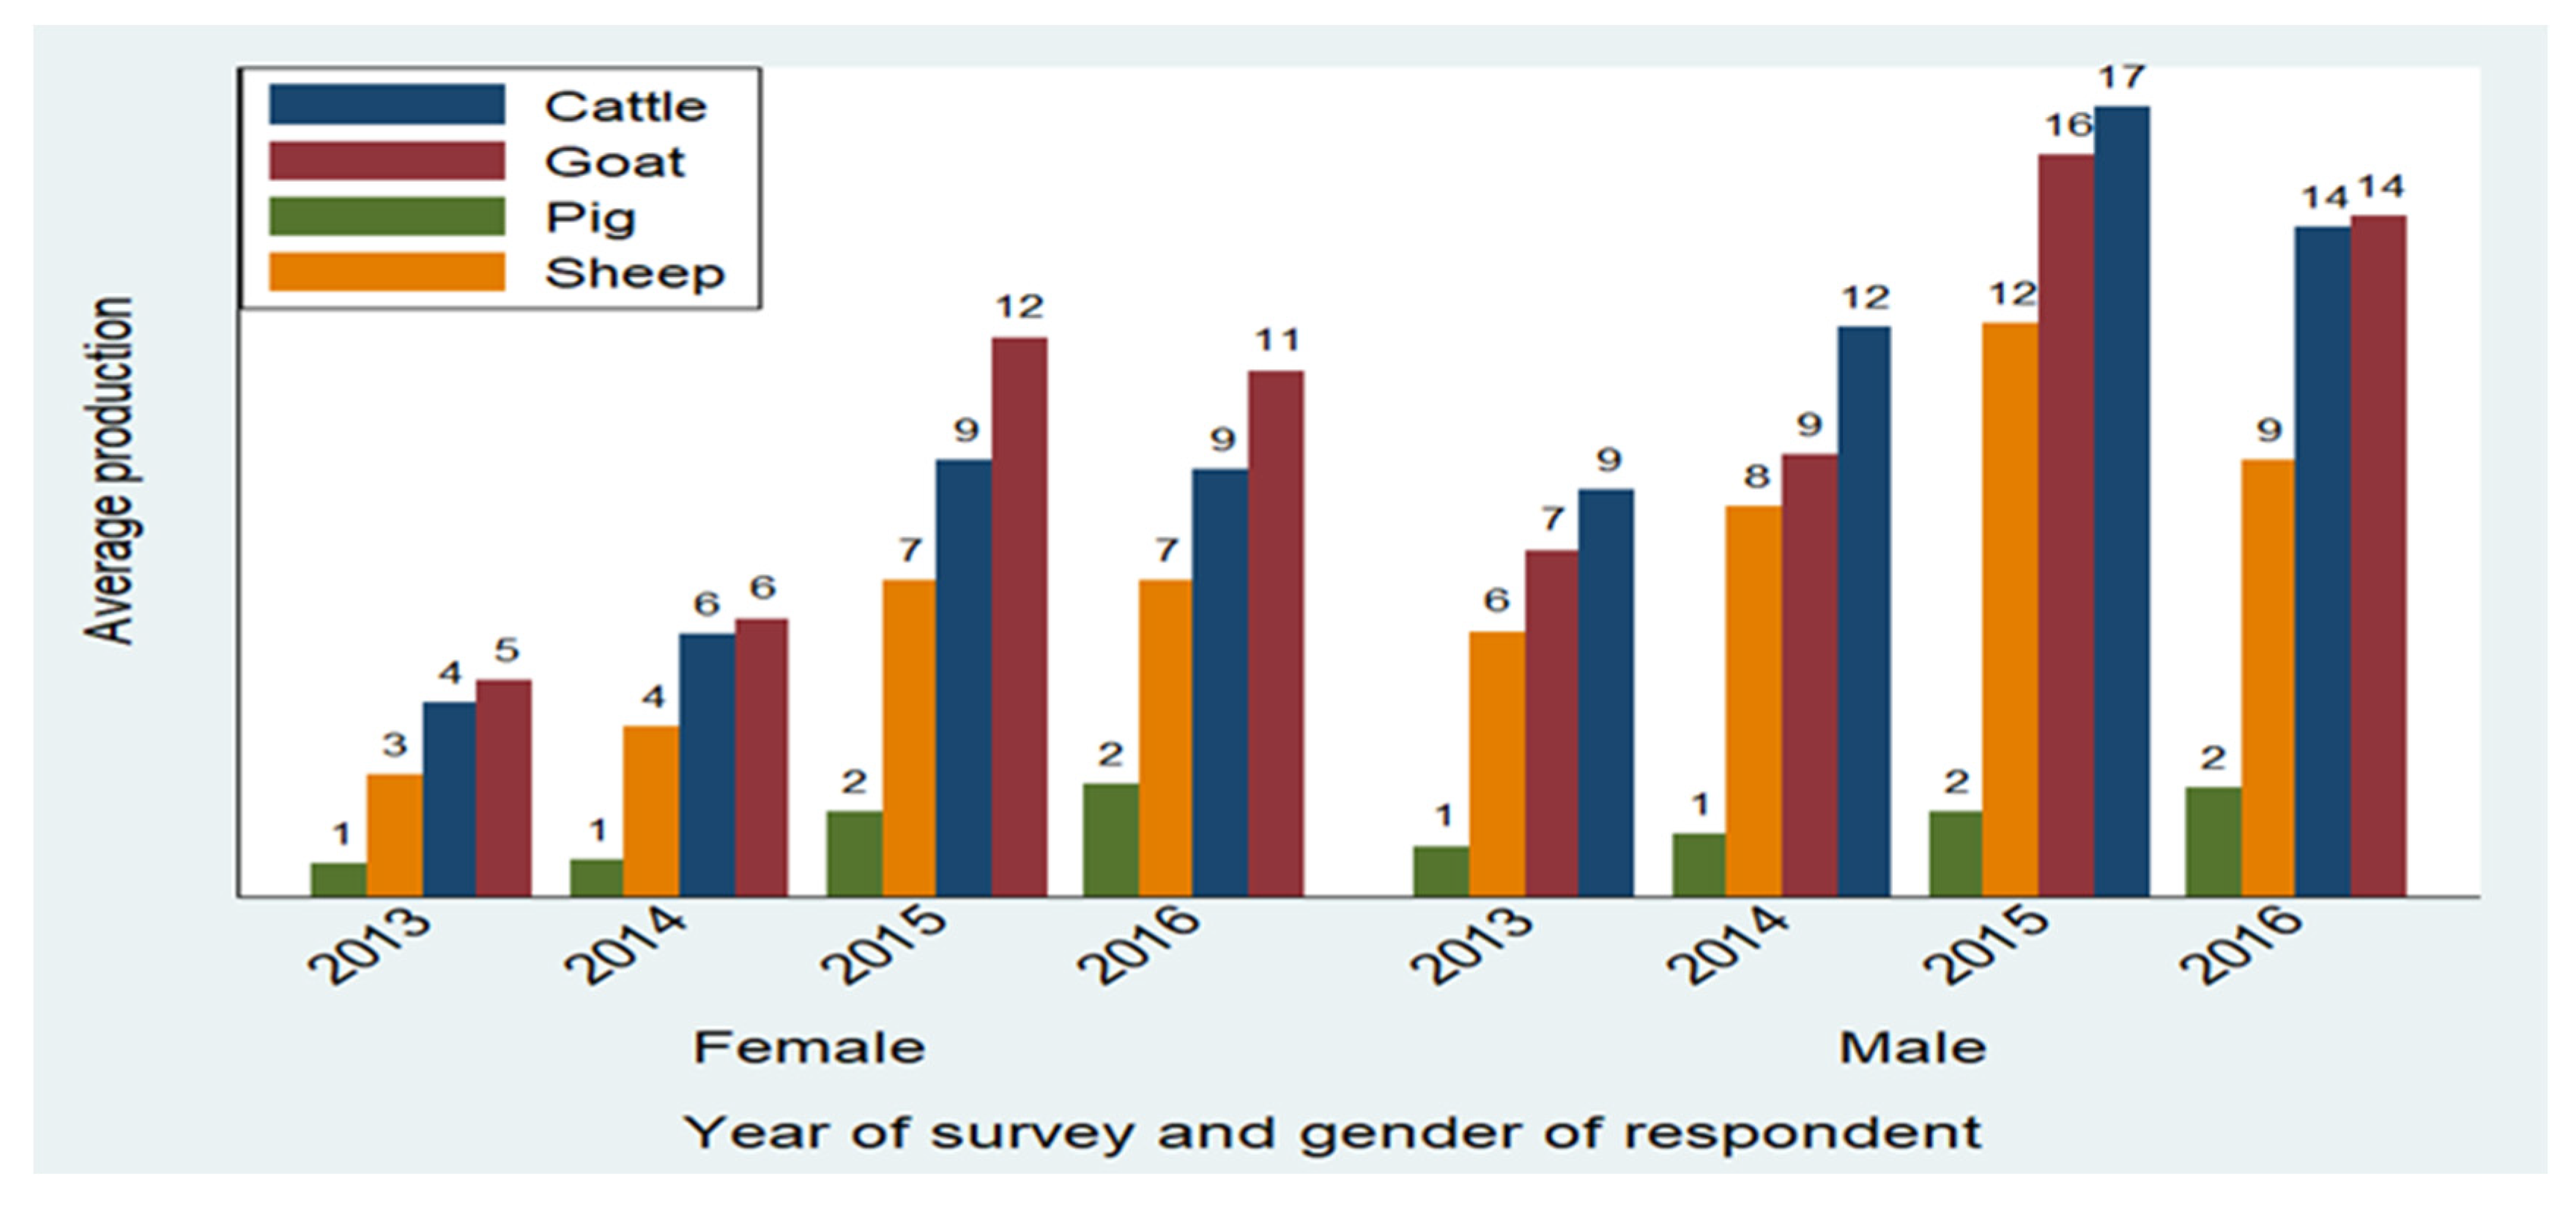
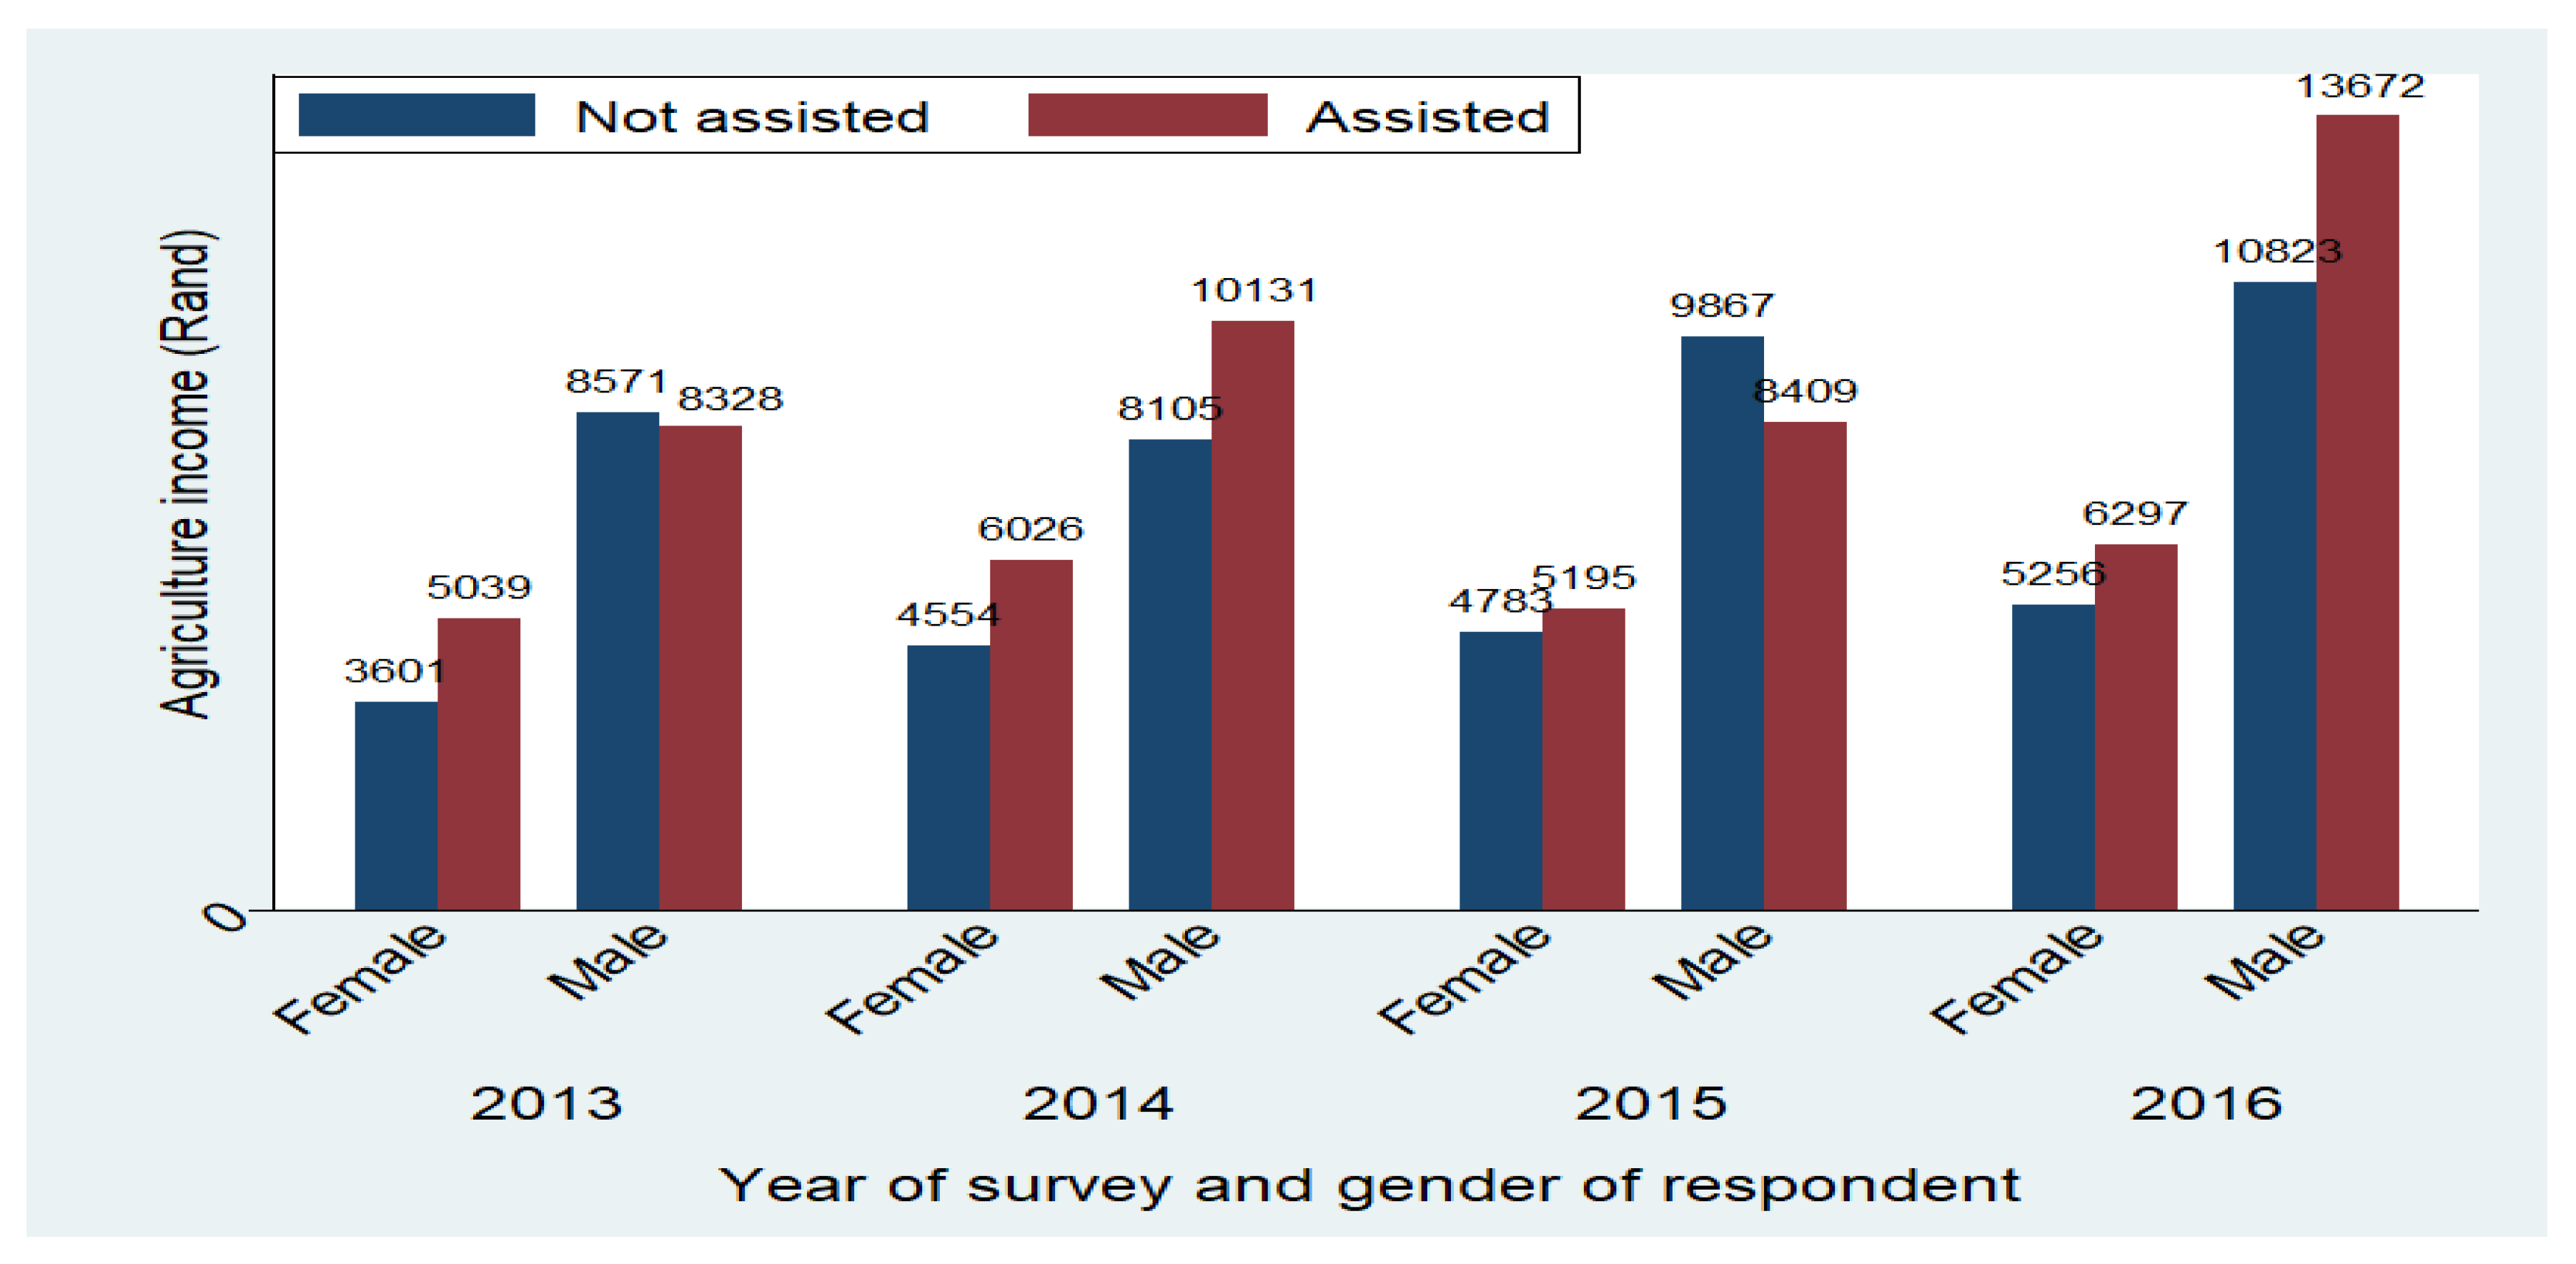
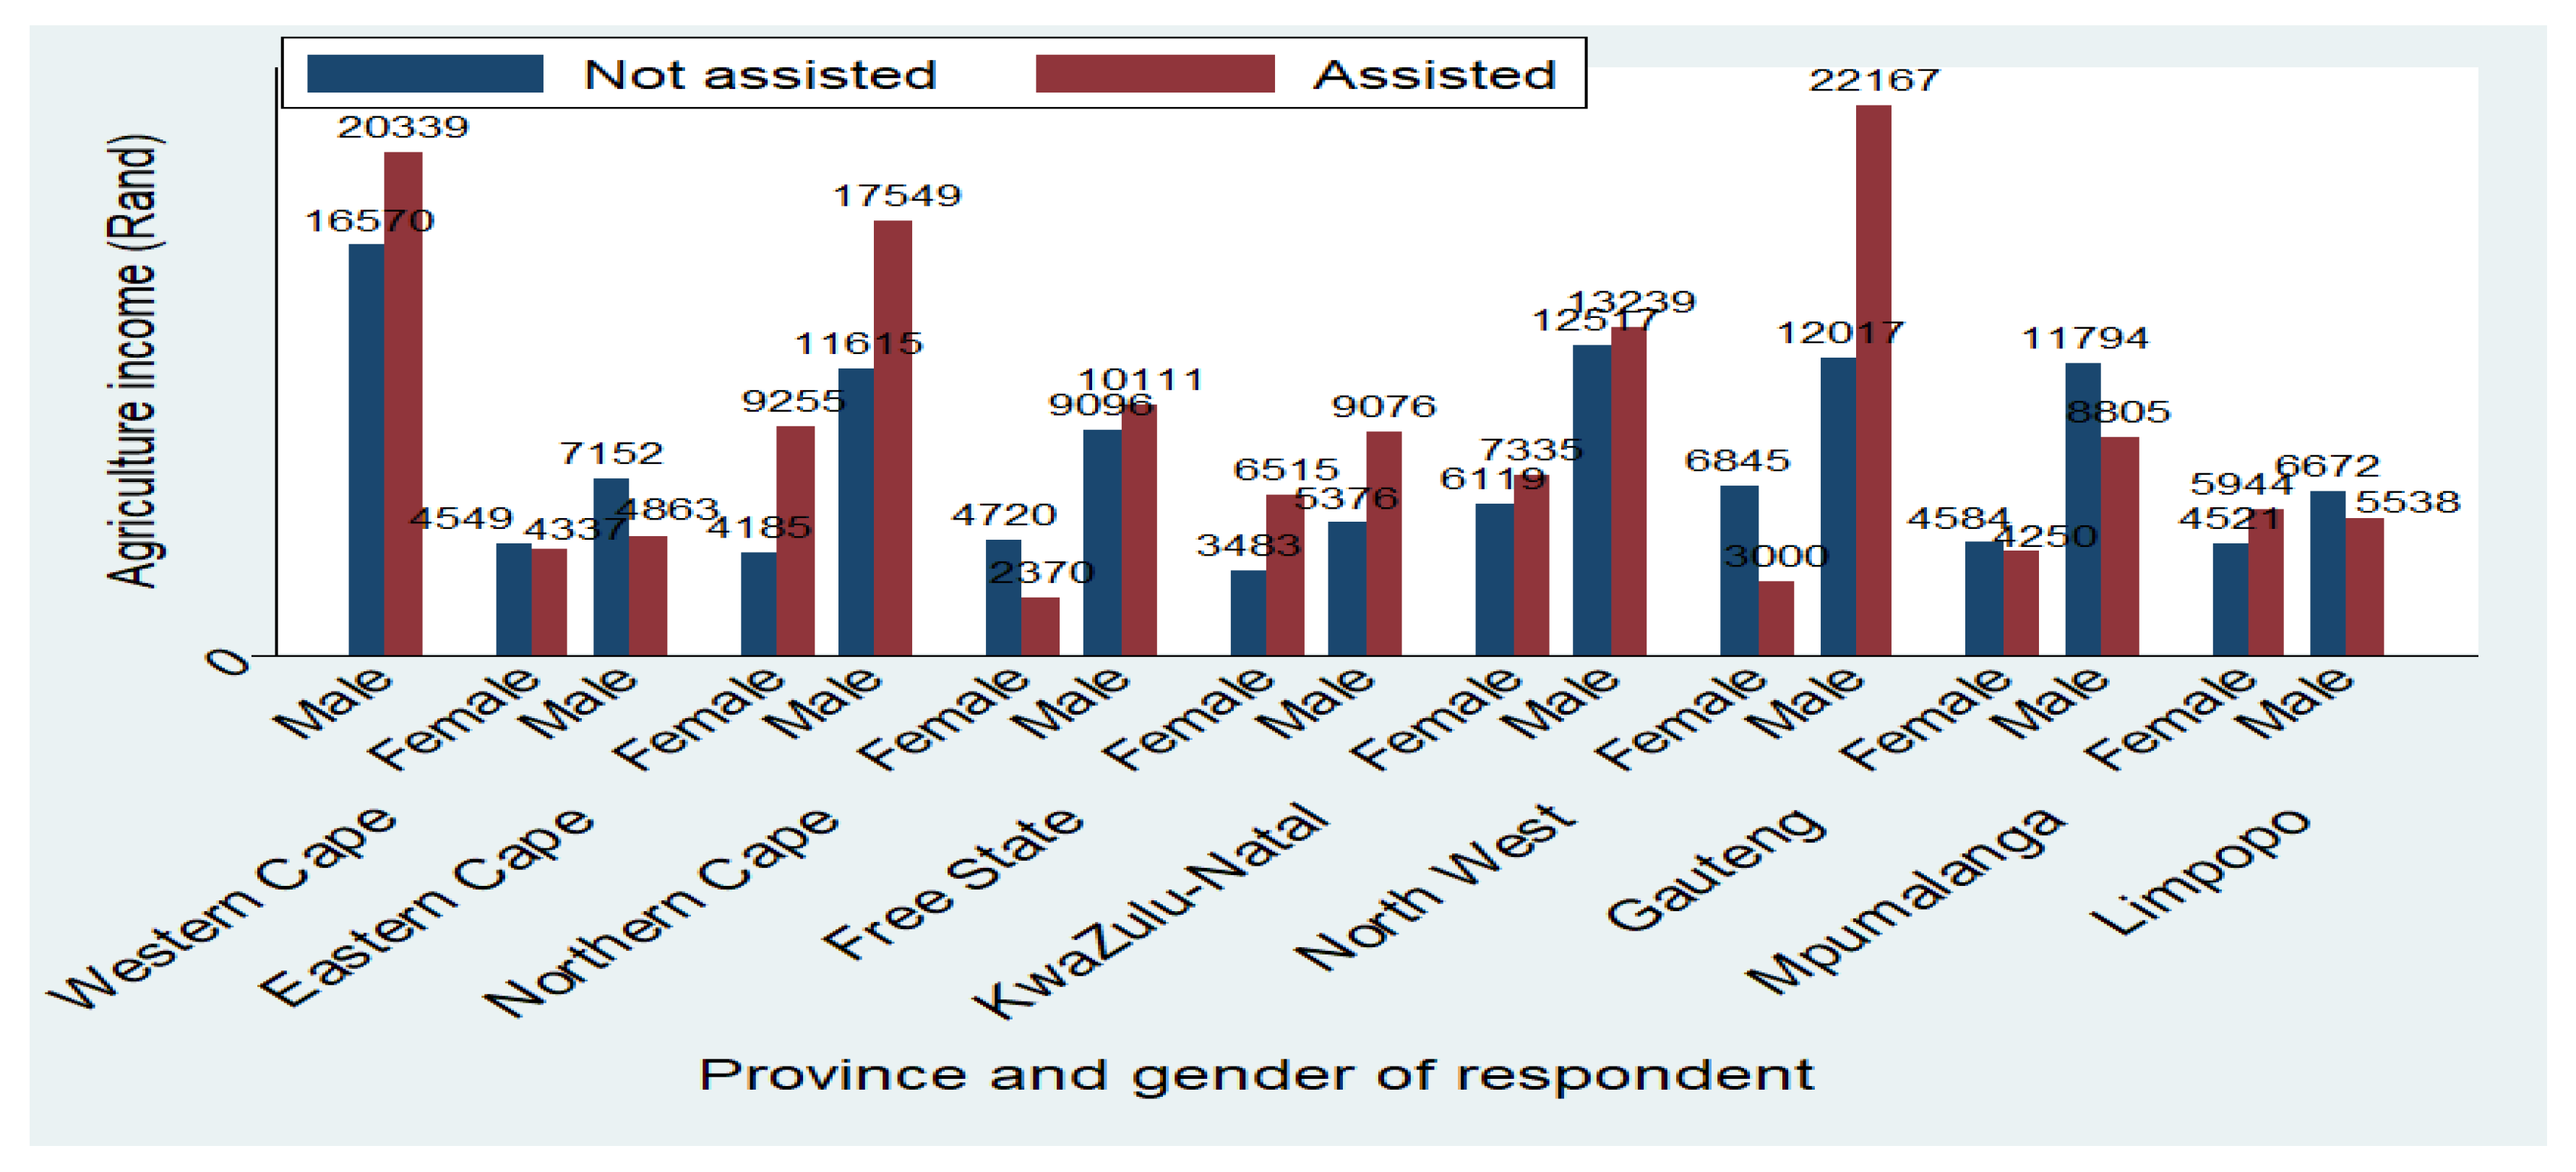
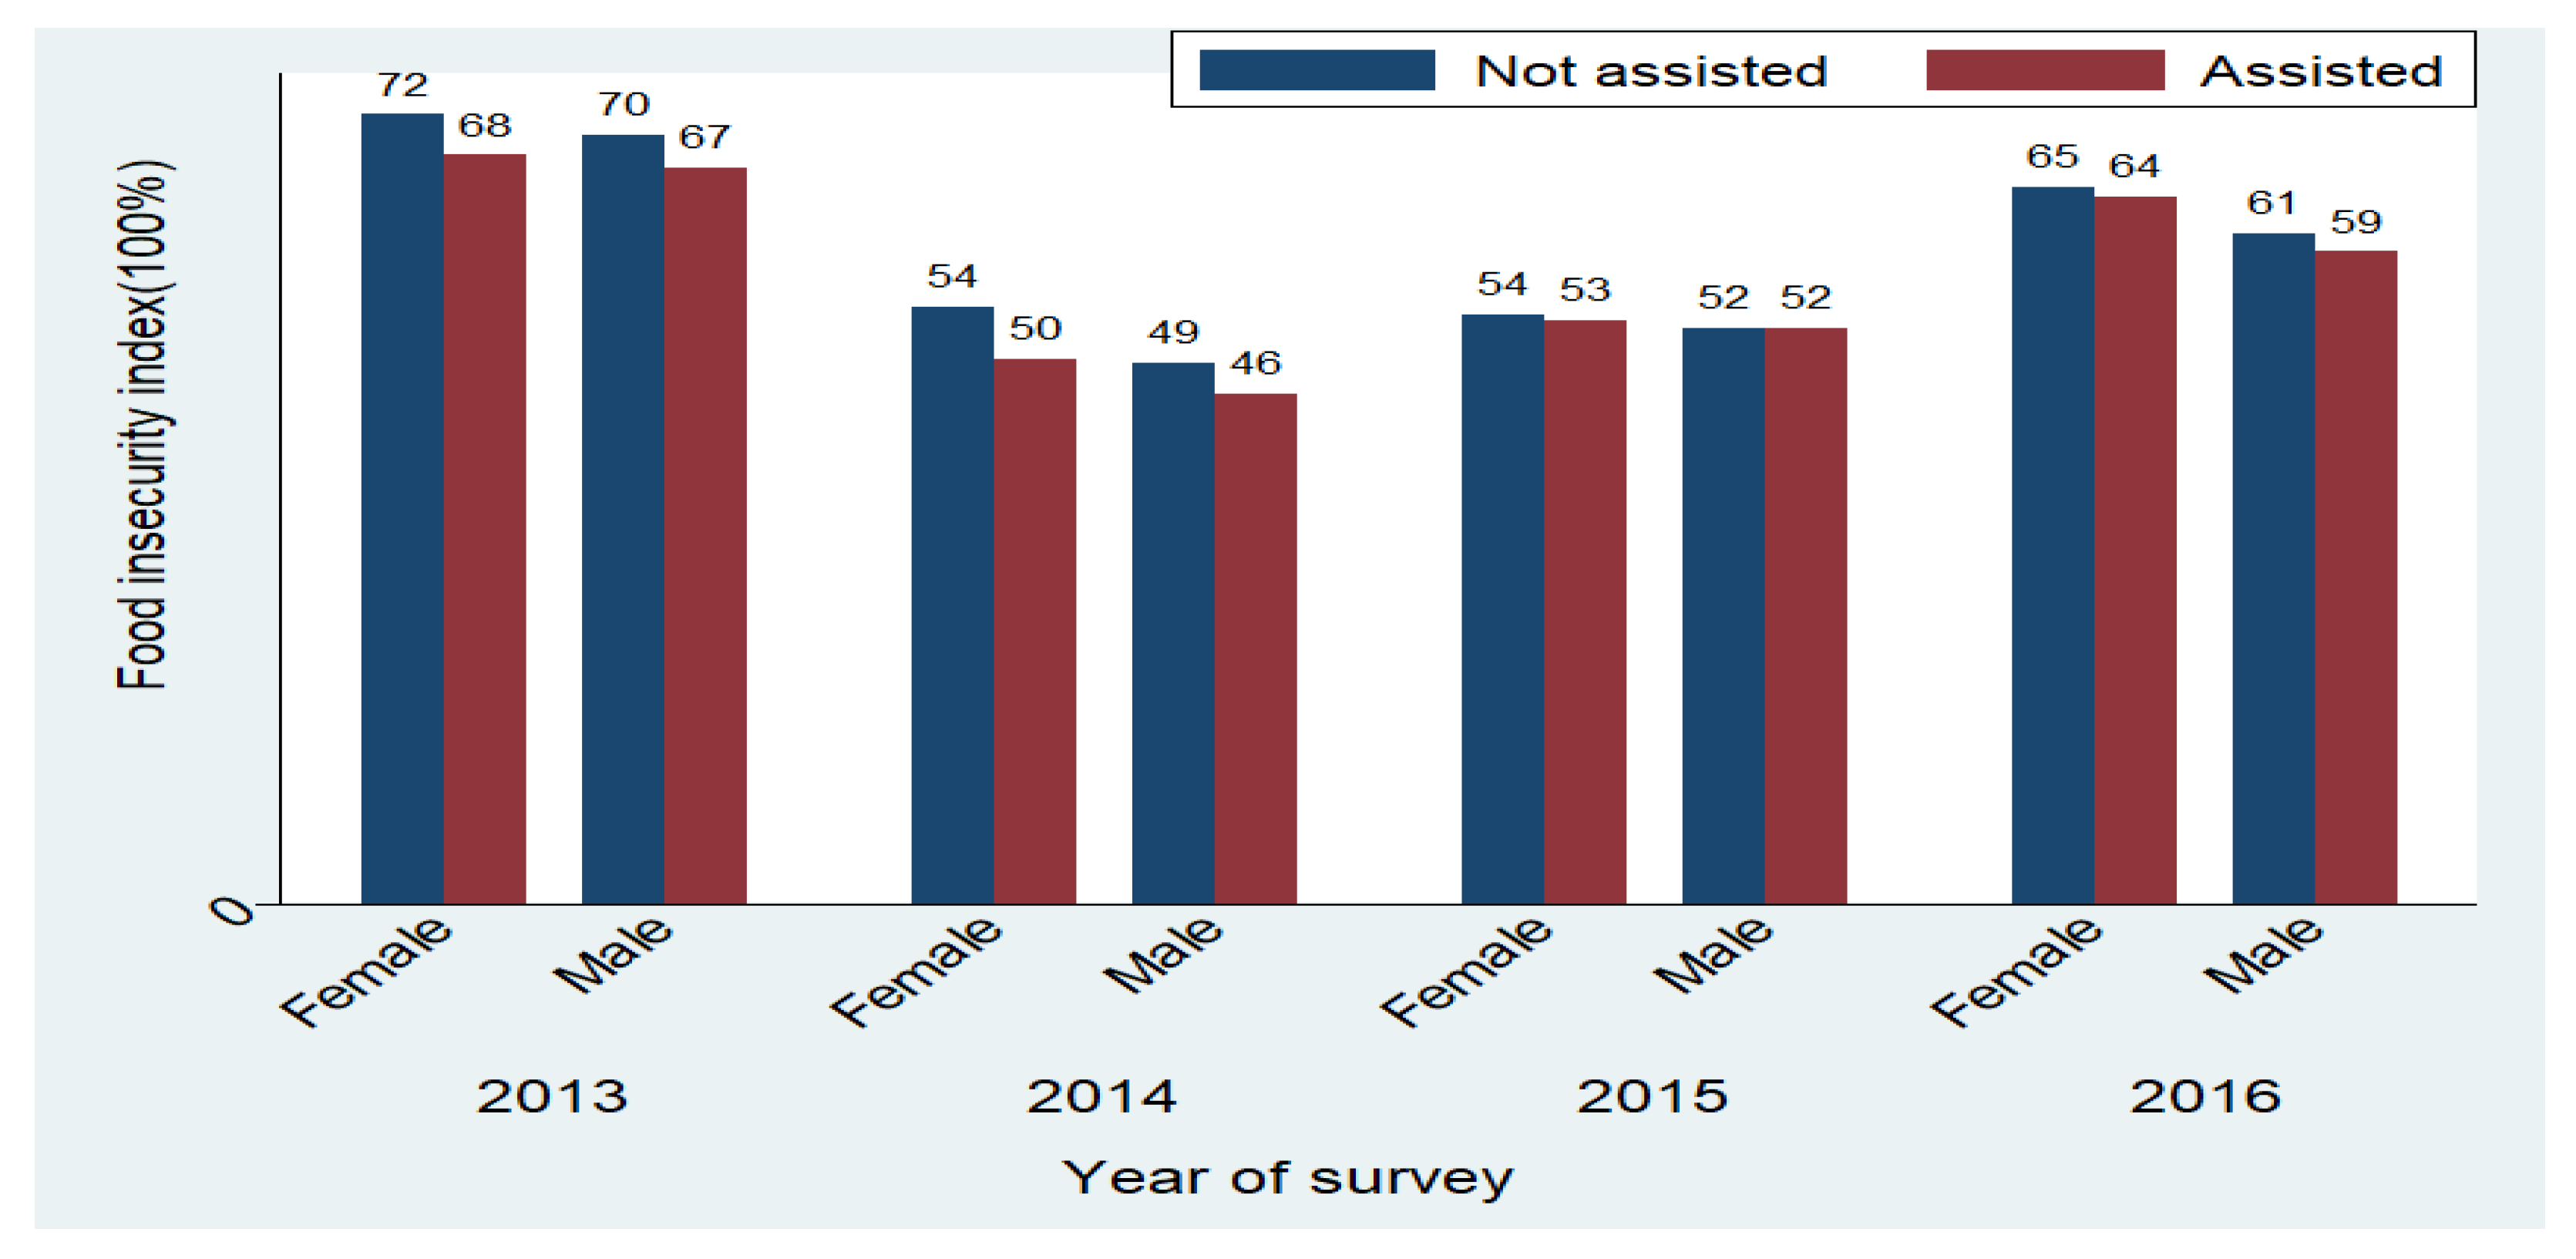
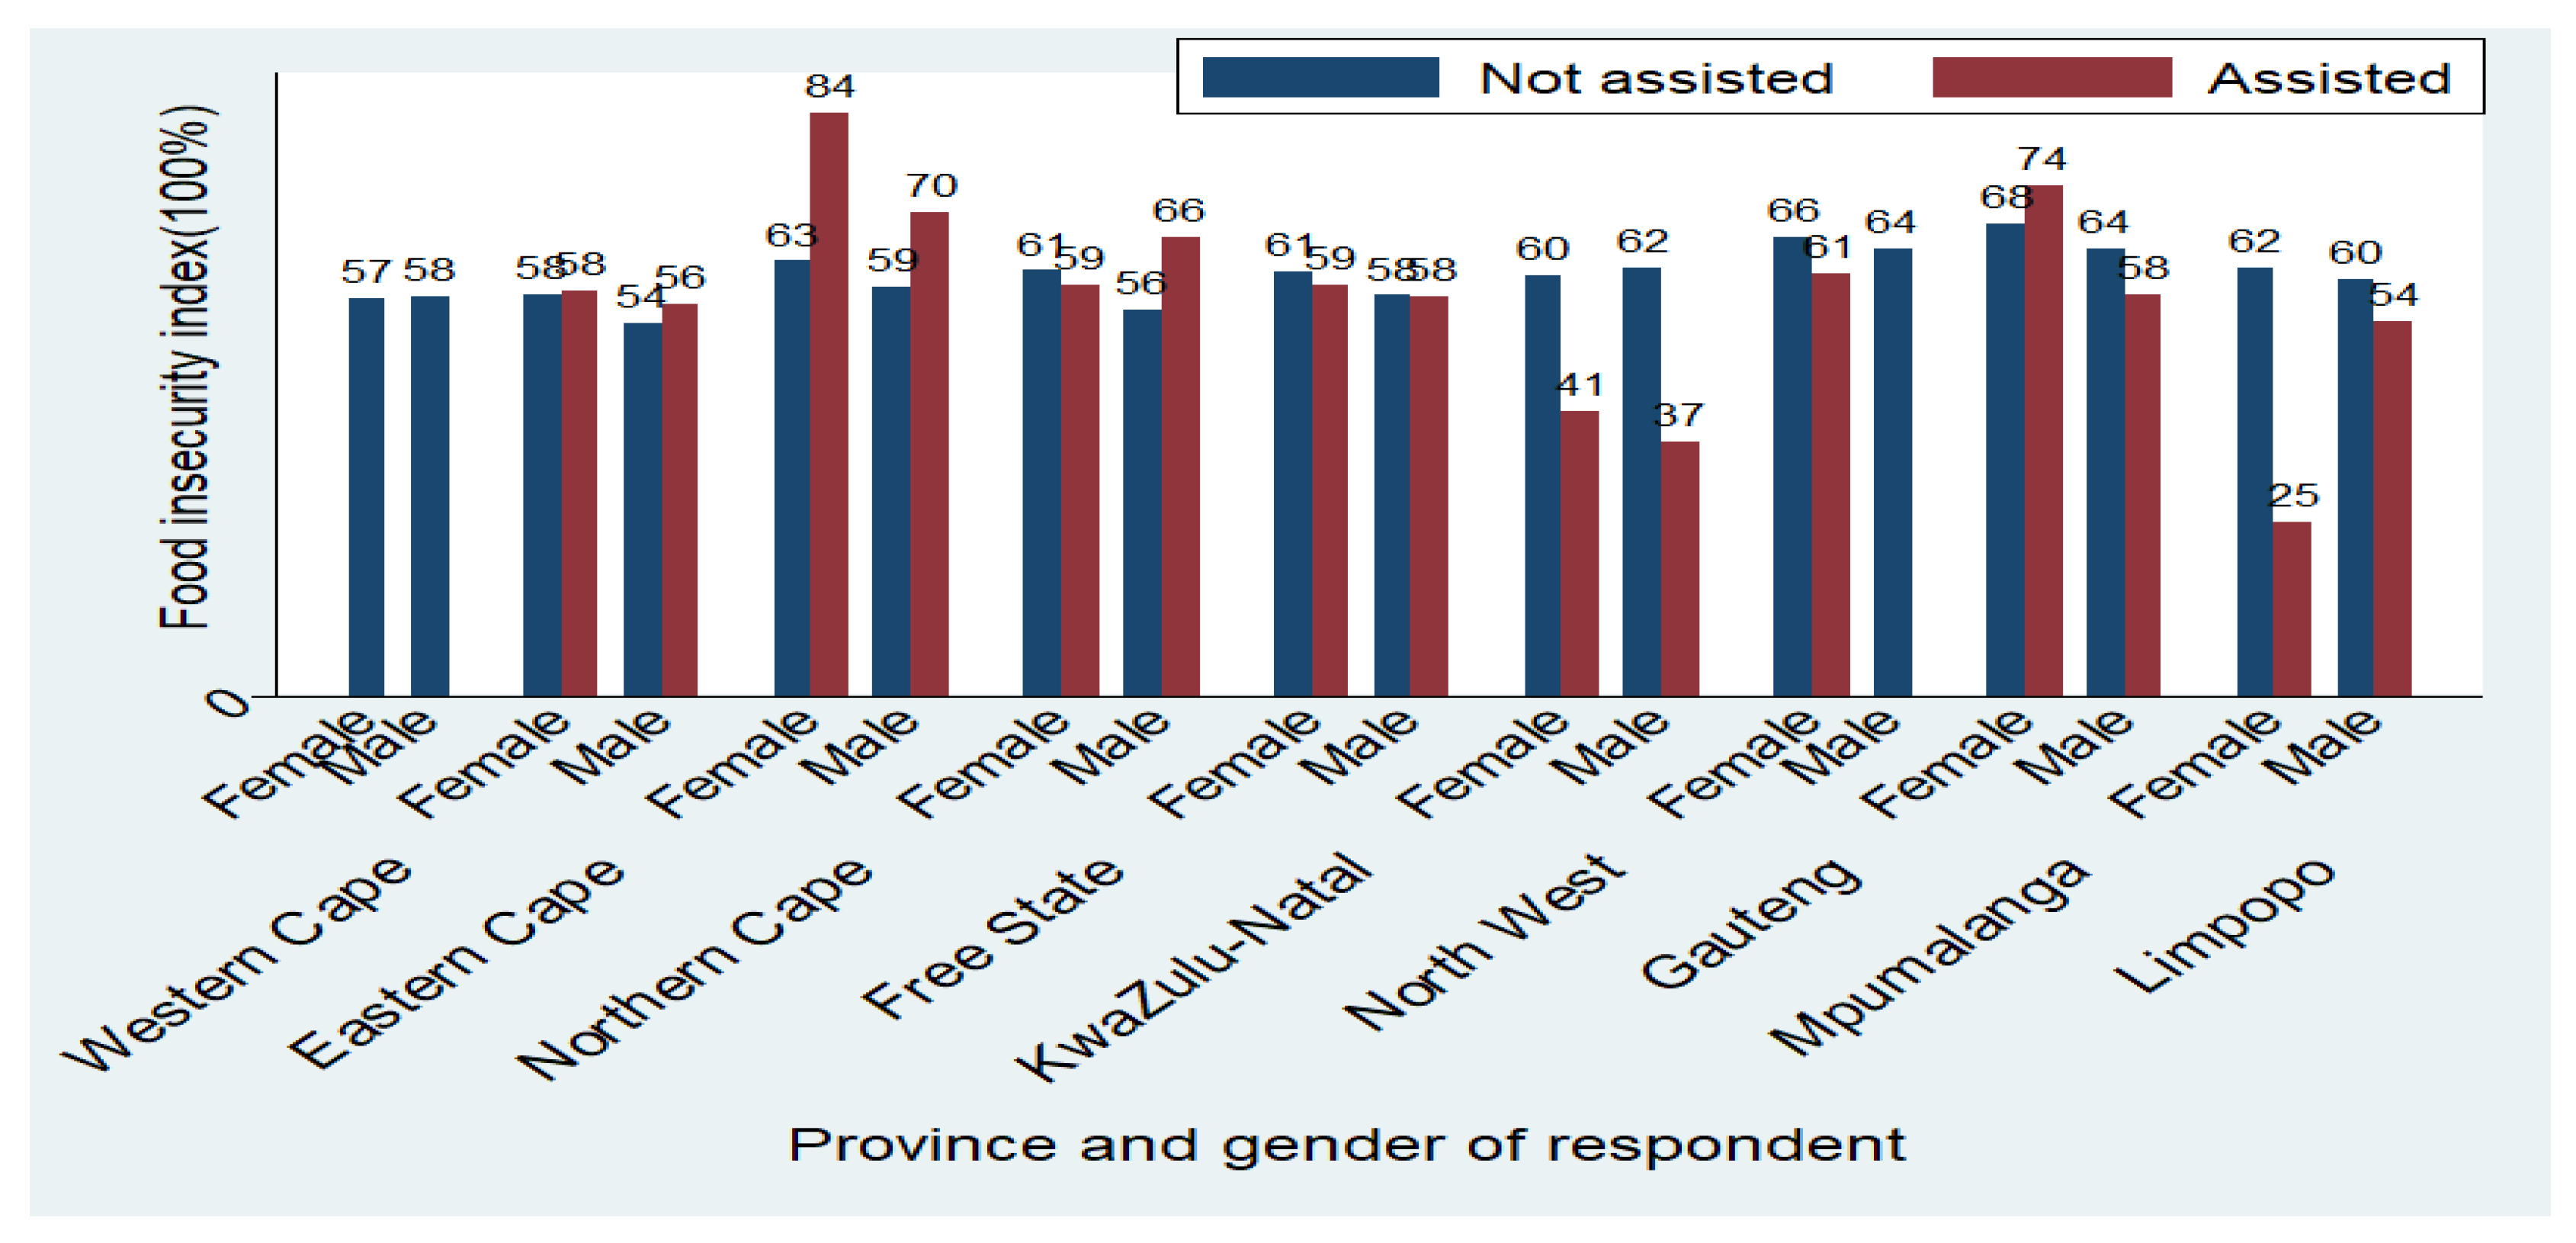
3.1. Descriptive Analysis

The rationale behind the South African government’s agricultural support policies and programmes is to make the sector more robust by increasing equity amongst the farmers with regards to gender, race, modern technology and other agricultural support [77]. Figure 1 depicts a considerable reduction in the percentage of farmers who received the assistance of 16% and 14% in 2013 and 2016, respectively.
In addition to the observed disparities in production across gender, marked differences can be observed in Figure 2 that farmers who received the assistance had higher production of all types of livestock than their counterparts who had not received the assistance. This observation is consistent across the gender of the respondent. However, the production gap among males is higher than the gap among females. While it is evident from these results that the agricultural support programme has the potential to be effective in helping the small-scale farmers to increase their productivity and some fundamental factors such as gender, and geographical differences need to be given critical attention for the programme to yield its intended results.
Across respondent gender, it is depicted in Figure 3, that production is generally lower among females than males. Unlike pig production, there is a significant difference in the number of cattle, sheep and goats produced by males compared to females. The implication that can be drawn from these results is that the implementers of the policy would have to consider gender as an essential factor in the implementation of the policy to ensure that women are given the needed assistance that will enhance their ability to optimise agricultural development support.
As expected, the gender inequality in earnings from agricultural activities is depicted in Figure 4, and this is consistent across all the survey periods. The gap has been widening to the extent that, since 2015, the average income of males who were assisted was more than twice that of their female counterparts. Considering the respondents who never received any support, the gap is relatively lower compared to those who were assisted. These trends support the assertions made in the preceding paragraphs that there is the need for gender mainstreaming in the implementation of the programme to ensure that it does not worsen the already existing inequalities among the small-scale farmers.
Across the geographical location of the respondent, the results in Figure 5 shows that the impact of the support does not have the same effect on the income of the beneficiary farmers. For instance, [78] had investigated the impact of microfinance on agricultural productivity by small-scale farmers in Tanzania, Iramba district; the results have shown that credit beneficiaries realised high agricultural productivity compared to non-credit beneficiaries. In some of the provinces, farmers who never received any assistance had higher agriculture income than those who were assisted. For instance, in the Eastern Cape, Mpumalanga and Limpopo, male farmers who were not supported had an average income higher than their counterparts who were supported. Similarly, female farmers in the Western Cape, Northern Cape, North-west and Gauteng provinces who were not supported had higher average agriculture income than those who received the support. On the bases of these results, the province-specific factors that affect the full realisation of the impact of the programme among all the beneficiary farmers must be considered while implementing and evaluating the effectiveness of the programme. Apart from climatic conditions, institutional bottlenecks, corruption in the form of diversion of the resources intended to support the farmers, and other individual challenges faced by the farmers due to their geographical location, need to be assessed and addressed.
Consistent with the distribution of production and agriculture income across the year of survey and support status of respondents, the results in Figure 6 indicate that food insecurity has reduced within the four years. However, the sudden increase in food insecurity in a 2016 survey period mainly, among females raises concern for more policy effort. The figure shows that food insecurity is relatively higher among females than males, possibly due to the observed low income and productivity among females. Another observation that needs extra policy effort is that the food insecurity gap between respondent who were assisted and those who were not assisted has narrowed. This indicates the growing ineffectiveness of the programme in achieving its intended purpose.
The results across the geographical location of respondents in Figure 7 depict some heterogeneities observed in the previous paragraphs. In the Western Cape Province, information available for food insecurity was for only those who never received the assistance. In the Eastern Cape and Northern Cape provinces, food insecurity is unusually higher among both males and females who received the support than those who never received any support. In the Gauteng province, food insecurity is higher among females who received the support than those who did not receive the support. Two factors can explain these and similar observations across production and income. First, respondents had already high level of food insecurity. The second possible reason includes unequal production capacity, unequal access to the support and regional variation in the climatic conditions.

3.2. Measurement of Variables and a Priori Expectations

Considering the objectives of the study, one of the policy variables of interest in the analysis is agricultural development assistance. During the survey, the respondents were asked if their household had received any agricultural-related assistance from the government during the previous 12 months such as training, extension services, grant (loans), agricultural inputs for production, dipping and vaccination services for livestock and any other assistance to improve their productivity. From this list of variables, agricultural development assistance was computed as a binary to take on the value one if the household responded that it received at least one form of assistance, and zero if nothing materialised.
Food insecurity as another dependent variable was computed as a score from ten questions on food security in the GHS. The household was asked if: In the past 12 months, any adult had suffered from hunger, any child experienced hunger or starvation, Minors which end up in streets, and if money shortage were experienced, reduction in meal portions, food reduction for several days.
Questions 1–3 had six possible responses (Never; Seldom; Sometimes; Often; Always; and Not applicable) while questions 4–10 were binary (Yes or No). Questions 1–3 were recorded as binary to take on the value one if the household’s response was either Seldom, Sometimes, Often, or Always, and 0 if they Never responded or Not applicable. Questions 4–7 were also recorded to take on the value one if the response was Yes, and 0 otherwise. These seven binary variables were used to compute a score of food security. Following [79], this study computed the food security score by summing the positive responses and divided the results by the total number of variables. The final score was multiplied by 100% to enhance the interpretation of the estimates.
The food security index ranged from 0 (Highly Food Secure) to 100 (Highly Food Insecure). The Cronbach’s alpha value was used to test the reliability and consistency of the seven items on a single scale, measuring the score of food insecurity. The rule of thumb requires that a value of 0.80 and above should be considered as a good measure. Different Cronbach’s alpha values were computed for the index of the pooled sample. The estimated Cronbach’s alpha value for the 2013 survey was 0.908 with an average interim covariate of 0.077, while the values for the 2014 survey was 0.900 and the covariate 0.0745. 2015′s alpha value was 0.903 and the covariate 0.076, while 2016′s was 0.903 with a covariate of 0.075. The alpha value for the pooled sample of the four rounds of the survey was 0.904, with an average interim covariate of 0.076.
In addition to these two variables, agricultural income, which is a continuous variable, was computed as the income that households receive from agricultural activities, such as the sale of agricultural products in the past twelve months. This study intended to investigate the household production of both livestock and food. However, the survey did not collect information on food production. The analysis is restricted to only livestock. Information on four main types of livestock (cattle, sheep, goats, and pigs) was available, which was used to compute the average livestock produced by households. Initially, the observations for these four types of livestock were captured as categories of intervals (0, 1–10, 11–100, 100 and above). Following [80], the mid-point value for each category was allocated as the actual production per household.
The dependent variables were also modified from how they were initially captured in the survey. For instance, land size ranged from less than 500 m2 to 20 ha or more. However, the categories had few observations, and the variable land size was categorised into three categories (1 = less than 500 m2; 2 = 500–999 m2; and 3 = 1 ha and above). Responses such as Do not Know and Not Applicable were recorded as missing. Similarly, land ownership was recorded as binary, taking on the value one if the land used for the agricultural activity belonged to the farmer, and 0 otherwise. The observation that takes on the value 0 comprises rented land, sharecropping, tribunal authority, state land, and others. Responses such as Do not Know were recorded as missing.
The variable population group, household head, was categorical, with four options:1 African/Black; 2 Coloured; 3 Indian/Asian; and 4 White. Education measures the level (categories such an ABET and Grade 12) of education that the respondent indicated that he or she completed. In the GHS, the responses ranged from Grade R/0 to a higher degree (Master’s or Doctorate). The responses were categorised into one no education; 2 necessary education/primary; 3 secondary’s; and four higher. Basic education included grades 1 to 9; Secondary covered Grade 10/Standard 8/Form 3 to Diploma with Grade 12/Standard 10; and Higher education comprised those who completed at least a Higher Diploma at a Technikon/University. Age was measured in the GHS as a continuous variable which ranged from 2 to 107 years. However, this study focused on respondents who were engaged in agricultural activities. Marital status was also captured in the GHS as one being legally married; 2 having lived together like husband and wife; 3 being divorced; 4 having separated, but still legally married; 5 being widowed; 6 being single but had been living together; 7 being single and had never been married, and eight unspecified responses. During the analysis, married respondents were classified, and cohabiting were categorised as an informal relationship. Those who were divorced, widowed, had separated, were classified as being single. Also, respondents who were single and had never been married were categorised as single.
Although the context and scope of this study may differ from previous studies, it is a priori expected that the age of the respondent, being male, and being Black/African should have positive effects on one’s access to the programme. On the contrary, the higher level of education, large land size for farming, being the landlord, and being White, Coloured, or Indian/Asian should have a negative correlation with the probability of being assisted. The reason for these expectations is that there is a strong positive correlation between land size, level of education, and race on the one hand, and income level and living standards that warrant assistance on the other. The association between households’ geographical location and the probability of the respondent receiving assistance remains indeterminate, since the characteristics of the province, and those of the beneficiaries of support, play an essential role.

3.3. Determinants of Farmers’ Access to Agricultural Development Support

The results in Table 2 show that age is a significant determinant of a farmer’s probability of being considered for support. The significance of age as a determinant of selection into the programme could also mean the experience in farming, which is a factor that implementers of the programme consider. The results also indicate that education is negatively associated with the probability of being selected for the agriculture development support. The effect of education is significantly higher for respondents who have higher levels of education. This is quite contrary to expectation because one would argue that those educated can put the assistance into better use for optimum outcome. However, from the perspective of the principles of distributive justice, the observed negative effect of education is intuitively acceptable in the sense that those who have low levels of education are more likely to be poor and need extra support to earn a living.
Apart from education and age, the population group of respondents is significantly associated with the probability of receiving agricultural development assistance. An African or specifically, a black South African is more likely to be assisted compared to a farmer who is either a White, an Indian, Asian or a Coloured. From a gender perspective, the results show that a male is more likely to receive support than a female. This observation highlights the need for the government to consider gender mainstreaming and racial diversities in the implementation of the policy in order not to deepen the existing inequality in resource ownership and productivity in the country.
Land size used by farmers is an indication of their access to and use of the resource. In this analysis, land size for agricultural activities appears to be a significant determinant of farmers’ access to agricultural development support. A farmer who owns a land size of at least 500 m square is significantly likely to receive support compared to his/her counterpart, whose land for farming is less than 500 m square. The coefficients are significantly higher for farmers whose land sizes are at least one hector and above. Implementation of the policy is built on the egalitarian principle; it also maintains an element of efficiency and economy of scale. Regarding the effect of land lordship on access to the support, the results reveal that compared to farmers who do not own their lands for farming, landlords are less likely to be assisted. The observed adverse effect of land ownership is that it qualifies as a surrogate for wealth or income level, which is a criterion for selecting the farmers who should or should not benefit from the programme. It can be deduced that those who own lands have the potential to produce without much assistance.
Farmer’s geographical locations are significant in determining their access to the programme. Consistent with the descriptive analysis, a farmer in either Eastern Cape or Kwazulu-Natal Province is more likely to be assisted compared to his/her counterpart in the Western Cape province. On the contrary, a farmer in the Northern Cape, Free State, and North-West, Gauteng, Mpumalanga or Limpopo province is less likely to receive the assistance. An earlier study conducted by [78] suggests that the incidence of both income and multidimensional poverty are higher in the Eastern Cape, Limpopo and Kwazulu-Natal provinces. The simultaneous dominance of these three provinces in the distribution of poverty and agricultural households largely justifies the regression results. It is intuitively expected that provinces that have high poverty rates and more agricultural households would be the focus of every policymaker who aims to reduce inequality.
The results highlight the need for policymakers to pay attention to the difference in the socio-economic factors such as race/population group, geographical location, level of education and household income status which influence farmers’ access to the programme. Those factors have unstated implication for the extent to which the programme will be sufficient. Failure of policymakers to consider these factors in the implementation of the agriculture support programme could worsen the already high inequality in resource ownership, livelihood and welfare that permeates all facets of societies in South Africa. The next subsection discusses the effect of the programme on the livelihood of the beneficiary households, with a focus on their income, productivity and food security.

3.4. Impact of the Agricultural Assistance on Production, Income and Food Security

Having discussed the socio-economic factors that determine households’ access to agricultural development assistance, this study goes further to assess its impact on households’ food security, production and income from agricultural activities. However, before discussing the impacts (Average Treatment Effects), it is essential to discuss the balancing of the propensity scores from the logistic regression, as this shows the extent to which the differences across the two groups of small-scale farmers are reduced to identify a valid counterfactual efficiently. Figure 8 depicts the histograms of the predicted propensity scores for the two groups of small-scale farmers. From this figure, those farmers who received the assistance have equivalent matches from those in the comparison group. The graph suggests that there is overlap and similarity between the propensity scores of the two groups of small-scale farmers.
The estimates of the three propensity matching approaches (see Table 3) indicate that holding other factors constant, a household that receives the agriculture development support is about 1–1.5% less food insecure than a household that does not benefit from the programme. The household that receives the support is about 1–1.5% more food secure than a household that does not receive any support. The indicator of assistance is made up of different variables related to agricultural activities.
These results verify the argument of [81] that the root causes of chronic food insecurity should be the priority objectives for development and that policymakers whose countries have been facing chronic food insecurity should aim to improve productivity and boost demand for the products and labour of food-insecure households. There is a need for reallocation of budgets toward rural populations whose livelihoods depend mainly on their agricultural activities.
Like the results on food security, the estimates of the effect of access to the agricultural development support on the agricultural income of farmers appear significantly positive. This means that a household that receives at least one form of support earns income ranging from R52,000.00 and approximately R60,000 than a household that does not receive any assistance. The results on both food security and agricultural income suggest that agricultural support programme is indeed beneficial to the small-scale farmers. According to [64], access to credit is believed to have a significant impact on the household livelihoods indicators such as agricultural productivity, food security and technology adoption.
The estimates of production of livestock confirm the observed results on food security and income of the beneficiaries of the programme. Holding other factors constant, a small-scale farmer who receives at least one of form assistance can produce 2 to 3 more cattle than his/her counterpart, who receives no assistance. Similarly, a farmer who receives any form of support from the programme can produce at least one more goat than a farmer who receives no support. It is evident from the results that, at the conventional levels of significance, the programme has a positive impact on the production of all the livestock except the pig. This case is supported by [82] who had analysed the demand allocation of credit and capital supports by farm household and impact on production, consumption and investment in the Nusa Tenggara Timur (ENT) province. The results have, however, revealed that allocation of credit and capital support increased cattle production, consumption expenditure and the investment of the household.

4. Conclusions

From 2013 to 2016 survey years, the proportion of households who have access to the agricultural development support has decreased marginally by about two percent. Therefore, this could be partly due to a reduction in the sample sizes of the GHS within this period. It could also be attributed to human and institutional factors that are affecting the effective implementation of the programme to cover the target population. Consistently across the survey years, there are marked differences in access to the support across, gender level of education, race and geographical location of respondents. Access to support has remained high among males than females, farmers with the low level of education than those with high levels of education and also Black/Africans than other race (Coloured/Indians/Asians and Whites).
The regression analysis indicates that a wide range of socio-economic factors underlies the farmers’ access to the agricultural development support programme. Prominent among these factors, which are significant in the models, are the gender, race, age and province of residence of the respondent. Other factors are the size and ownership status of the land used for farming. The Propensity Score Matching (PSM) analysis shows a significant positive impact of the agricultural development support on livestock production, income and food security of households than that benefit from the programme than those who receive no support. Based on these findings, the government must pay attention to the implementation process of the programme, taking into consideration the gender, racial and geographical diversities which may influence households’ access to the support and the extent of effectiveness of the support on their livelihoods. Many times, households face several challenges in their quest to access the support of this nature. Such challenges include unfair distribution that favours only the friends and relatives of the implementers of the programme, corruption which leads to misallocation of the supports and misappropriation of funds earmarked for the implementation of the programme. [83] investigated the problems of supporting smallholder farmers in South Africa, and the findings revealed that the budgetary allocation to the sector had increased impressively over the last decade and the distribution of such resources are such that few farmers benefits but the impact is minimal. On the side of the beneficiaries of the programme, there is a need for effective monitoring and evaluation to ensure that support given to the households is put into efficient and effective use for their benefits and the benefit of the entire country. More importantly, the Ministry of Agriculture and its allied bodies must establish a mechanism to track all inappropriate actions of both the institutions/bodies responsible for the implementation of the programme and the beneficiary households or small-scale farmers. If such practices go unchecked, the government’s rationale for rolling out the programme would not be realised.
Following the observed marked gender, racial and geographical differences in households’ access to the agricultural development support, the Ministry of Agriculture and its allied ministries and departments responsible for the implementation of the agricultural development support programmes must streamline policies to account for the lack of support to farmers in general. Addressing such differences is necessary to ensure that the programme achieves its intended overall objectives.
As a common issue in research, this study has some limitations that need to be mentioned to guide future research and policies on this topic. One of the shortfalls of this study is that it relied on observational data instead of pure RCT data. Nonetheless, this limitation does not have much bearing on the estimates since the PSM, and its bootstrapping procedure, offers enough control measures to reduce any potential bias due to the use of the observational data. Future researchers could consider using observational data that follows the beneficiaries of the programme over time to gain more insight into other confounding factors that may affect the estimated impact of agricultural development support. This study was unable to address the transition from small-scale into commercial farming due to lack of information from the survey. Future studies purposely designed to assess the impact of the programme should critically consider this issue to enable policymakers to address it effectively.

Author Contributions

Conceptualization, M.N.M.; Methodology, M.N.M.; Software, M.N.M.; Validation, M.N.M.; Formal analysis, M.N.M.; Investigation, M.N.M.; Resources, M.N.M.; Data Curation, M.N.M.; Writing—Original Draft Preparation, M.N.M.; Writing—Review & Editing, M.N.M., C.C. and P.F.T.; Visualization, M.N.M.; Supervision, C.C. and P.F.T.; Project Administration, M.N.M., C.C. and P.F.T.; Funding Acquisition, M.N.M. All authors have read and agreed to the published version of the manuscript.

Funding

This study is funded and supported by the University of South Africa. We acknowledge the financial support from the University.

Institutional Review Board Statement

Not applicable.

Informed Consent Statement

Not applicable.

Data Availability Statement

Not applicable.

Acknowledgments

We want to acknowledge and thank the anonymous reviewers for their valuable comments and suggestions.

Conflicts of Interest

The authors declare no conflict of interest.

References

  1. Ortiz-Miranda, D.; Moreno-Pérez, O.; Arnalte-Mur, L.; Cerrada-Serra Martinez-Gomez, V.; Adolph, B.; Atela, J.; Ayambila, S.; Baptista, I.; Barbu, R.; Bjørkhaug, H. The future of small farms and small food businesses as actors in regional food security: A participatory scenario analysis from Europe and Africa. J. Rural. Stud. 2022, 95, 326–335. [Google Scholar] [CrossRef]
  2. Giller, K.E.; Delaune, T.; Silva, J.V.; Descheemaeker, K.; van de Ven, G.; Schut, A.G.; van Wijk, M.; Hammond, J.; Hochman, Z.; Taulya, G.; et al. The future of farming: Who will produce our food? Food Secur. 2021, 13, 1073–1099. [Google Scholar] [CrossRef]
  3. Hlatshwayo, S.I.; Ngidi, M.; Ojo, T.; Modi, A.T.; Mabhaudhi, T.; Slotow, R. A typology of the level of market participation among smallholder farmers in South Africa: Limpopo and Mpumalanga Provinces. Sustainability 2021, 13, 7699. [Google Scholar] [CrossRef]
  4. Moreda, G.; Gedebo, A.; Beshir, H.M.; Haile, A. Ensuring food security of smallholder farmers through improving productivity and nutrition of potato. J. Agric. Food Res. 2022, 10, 100400. [Google Scholar] [CrossRef]
  5. Pascal, L. Impacts of foreign agricultural investment on developing countries: Evidence from case studies. FAO Commod. Trade Policy Res. Work. Pap. 2014, 26, 2014. [Google Scholar]
  6. Setsoafia, E.D.; Ma, W.; Renwick, A. Effects of sustainable agricultural practices on farm income and food security in northern Ghana. Agric. Food Econ. 2022, 10, 1–15. [Google Scholar] [CrossRef]
  7. Pinstrup-Andersen, P. Future perspectives on food supply in developing countries. Outlook Agric. 1993, 22, 225–232. [Google Scholar] [CrossRef]
  8. Hamdan, M.F.; Mohd Noor, S.N.; Abd-Aziz, N.; Pua, T.L.; Tan, B.C. Green Revolution to Gene Revolution: Technological Advances in Agriculture to Feed the World. Plants 2022, 11, 1297. [Google Scholar] [CrossRef]
  9. John, D.A.; Babu, G.R. Lessons from the aftermaths of green revolution on food system and health. Front. Sustain. Food Syst. 2021, 5, 644559. [Google Scholar] [CrossRef]
  10. Aloyce, G.M.; Gabagambi, D.M.; Hella, J. National agricultural input voucher scheme impact on productivity and food security of smallholder farmers in Tanzania. J. Econ. Sustain. Dev. 2014, 5, 21. [Google Scholar]
  11. Dawson, N.; Martin, A.; Sikor, T. Green revolution in sub-Saharan Africa: Implications of imposed innovation for the wellbeing of rural smallholders. World Dev. 2016, 78, 204–218. [Google Scholar] [CrossRef] [Green Version]
  12. Diao, X.; Hazell, P.; Thurlow, J. The role of agriculture in African development. World Dev. 2010, 38, 1375–1383. [Google Scholar] [CrossRef]
  13. Toenniessen, G.; Adesina, A.; DeVries, J. Building an alliance for a green revolution in Africa. Ann. N. Y. Acad. Sci. 2008, 1136, 233–242. [Google Scholar] [CrossRef] [PubMed] [Green Version]
  14. SADC. Regional Agricultural Policy: Country Summary Agricultural Policy Review Reports. 2011. Available online: http://www.sadc.int/files/7113/5293/3509/Regional_Agricultural_Policy_Review_Reports_2011.pdf (accessed on 16 November 2017).
  15. Kirsten, J.F.; Van Zyl, J. Defining small-scale farmers in the South African context. Agrekon 1998, 37, 551–562. [Google Scholar] [CrossRef]
  16. Peach, Y. An Investigation of the Success Factors of Black Commercial Farmers in the North West Province. Ph.D. Thesis, North-West University (South Africa), Potchefstroom, South Africa, 2015. [Google Scholar]
  17. Sikwela, M.M.; Mushunje, A. The impact of farmer support programmes on household income and sustainability in smallholder production: A case study of the Eastern Cape and KwaZulu Natal farmers, South Africa. Afr. J. Agric. Res. 2013, 8, 2502–2511. [Google Scholar]
  18. Kirsten, J.F. Agricultural Support Programmes in the Developing Areas of South Africa. Ph.D. Thesis, University of Pretoria, Pretoria, South Africa, 1994. [Google Scholar]
  19. Vink, N. Food security and African agriculture. South Afr. J. Int. Aff. 2012, 19, 157–177. [Google Scholar] [CrossRef]
  20. Zantsi, S.; Mulanda, S.; Hlakanyane, L. Small-Scale Agriculture, Land Reform, and Government Support in South Africa: Identifying Moral Hazard, Opportunistic Behaviour, and Adverse Selection. Int. J. Afr. Renaiss. Stud.-Multi-Inter-Transdiscipl. 2021, 16, 119–144. [Google Scholar] [CrossRef]
  21. Davies, R.; Kosec, K.; Nkonya, E.; Song, J. Global Land Reform Experiences: A Review for South Africa. Southern Africa–Towards Inclusive Economic Development (SA-TIED) Working Paper. 2020. Available online: https://sa-tied.wider.unu.edu/sites/default/files/images/SA-TIED_WP98.pdf (accessed on 19 October 2022).
  22. Palmer, K.; Sender, J. Prospects for on-farm self-employment and poverty reduction: An analysis of the South African Income and Expenditure Survey 2000. J. Contemp. Afr. Stud. 2006, 24, 347–376. [Google Scholar] [CrossRef]
  23. Mtero, F.; Gumede, N.; Ramantisima, K. Equitable access to land for social justice in South Africa. 2021. Available online: https://repository.uwc.ac.za/handle/10566/7171 (accessed on 19 October 2022).
  24. Stats SA (Statistics South Africa). General Household Survey: Metadata/Statistics South Africa; Statistics South Africa: Pretoria, South Africa, 2013; Statistical Release P0318 2014.
  25. Stats SA (Statistics South Africa). General Household Survey: Metadata/Statistics South Africa; Statistics South Africa: Pretoria, South Africa, 2014; Statistical Release P0318 2015.
  26. Stats SA (Statistics South Africa). General Household Survey: Metadata/Statistics South Africa; Statistics South Africa: Pretoria, South Africa, 2015; Statistical Release P0318 2016.
  27. Stats SA (Statistics South Africa). Media Release 2 June 2016: General Household Survey (GHS) 2015. 2016. Available online: http://www.statssa.gov.za/?p=7765 (accessed on 15 May 2017).
  28. Rusenga, C. Rethinking Land Reform and Its Contribution to Livelihoods in South Africa. Afr. Rev. 2022, 14, 125–150. [Google Scholar] [CrossRef]
  29. Blignaut, J.N.; De Wit, M.; Knot, J.; Midgley, S.; Crookes, D.J.; Drimie, S.; Nkambule, N. Sustainable agriculture: A viable option for enhanced food and nutritional security and a sustainable productive resource base in South Africa: An investigation. Pretoria Green Fund. 2014. [Google Scholar]
  30. Abur, C.C. Assessment of Food Security Status among Rural Farming Households in Guma Local Government Area of Benue State, Nigeria. Int. J. Res. Humanit. Soc. Stud. 2014, 1, 32–42. [Google Scholar]
  31. Ifeoma, I.; Agwu, A. Assessment of food security situation among farming households in rural areas of Kano state, Nigeria. J. Cent. Eur. Agric. 2014, 15, 94–107. [Google Scholar] [CrossRef]
  32. Sekhampu, T.J. Determination of the factors affecting the food security status of households in Bophelong, South Africa. Int. Bus. Econ. Res. J. 2013, 12, 543–549. [Google Scholar] [CrossRef]
  33. Altman, M.; Hart, T.G.; Jacobs, T. Household food security status in South Africa. Agrekon 2009, 48, 345–361. [Google Scholar] [CrossRef]
  34. Baiphethi, M.N.; Jacobs, T. The contribution of subsistence farming to food security in South Africa. Agrekon 2009, 48, 459–482. [Google Scholar] [CrossRef]
  35. Dioula, B.M.; Deret, H.; Morel, J.; Vachat, E.; Kiaya, V. Enhancing the role of smallholder farmers in achieving sustainable food and nutrition security. In ICN2, Second International Conference on Nutrition, Rome: Food and Agriculture Organization of the United Nations; FAO: Rome, Italy, 2013; Volume 13. [Google Scholar]
  36. Matshe, I. Boosting smallholder production for food security: Some approaches and evidence from studies in sub-Saharan Africa. Agrekon 2009, 48, 483–511. [Google Scholar] [CrossRef]
  37. Mizik, T. Climate-smart agriculture on small-scale farms: A systematic literature review. Agronomy 2021, 11, 1096. [Google Scholar] [CrossRef]
  38. Wale, E.; Chipfupa, U.; Hadebe, N. Towards identifying enablers and inhibitors to on-farm entrepreneurship: Evidence from smallholders in KwaZulu-Natal, South Africa. Heliyon 2021, 7, e05660. [Google Scholar] [CrossRef]
  39. Hlatshwayo, S.I.; Modi, A.T.; Hlahla, S.; Ngidi, M.; Mabhaudhi, T. Usefulness of seed systems for reviving smallholder agriculture: A South African perspective. Afr. J. Food Agric. Nutr. Dev. 2021, 21, 17581–17603. [Google Scholar] [CrossRef]
  40. Mpandeli, S.; Maponya, P. Constraints and challenges facing the small scale farmers in Limpopo Province, South Africa. J. Agric. Sci. 2014, 6, 135. [Google Scholar] [CrossRef] [Green Version]
  41. Ortmann, G.F.; King, R. Agricultural cooperatives II: Can they facilitate access of small-scale farmers in South Africa to input and product markets? Agrekon 2007, 46, 219–244. [Google Scholar] [CrossRef]
  42. Sikhweni, N.; Hassan, R. Opportunities and challenges facing small-scale cattle farmers living adjacent to Kruger National Park, Limpopo Province. J. Emerg. Trends Econ. Manag. Sci. 2014, 5, 38–43. [Google Scholar]
  43. Von Loeper, W.; Musango, J.; Brent, A.; Drimie, S. Analysing challenges facing smallholder farmers and conservation agriculture in South Africa: A system dynamics approach. South Afr. J. Econ. Manag. Sci. 2016, 19, 747–773. [Google Scholar] [CrossRef]
  44. Masset, E. A review of hunger indices and methods to monitor country commitment to fighting hunger. Food Policy 2011, 36, S102–S108. [Google Scholar] [CrossRef]
  45. Aliber, M.; Hall, R. Support for smallholder farmers in South Africa: Challenges of scale and strategy. Dev. S. Afr. 2012, 29, 548–562. [Google Scholar] [CrossRef]
  46. Ataguba, J.E.; Akazili, J.; McIntyre, D. Socioeconomic-related health inequality in South Africa: Evidence from General Household Surveys. Int. J. Equity Health 2011, 10, 1–10. [Google Scholar] [CrossRef]
  47. Rogan, M. Food poverty, hunger and household production in rural Eastern Cape households. Dev. S. Afr. 2018, 35, 90–104. [Google Scholar] [CrossRef]
  48. Creswell, J.W. Research Design: Qualitative, Quantitative, and Mixed Method Approaches, 2nd ed.; Sage Publications: Thousand Oaks, CA, USA, 2003. [Google Scholar]
  49. Creswell, J.W. Educational Research: Planning, Conducting, and Evaluating Quantitative and Qualitative Research, Enhanced Pearson eText with Loose-Leaf Version—Access Card Package; Pearson Education, Inc.: London, UK, 2015. [Google Scholar]
  50. Saturni, S.; Bellini, F.; Braido, F.; Paggiaro Sanduzzi, A.; Scichilone, N.; Santus, A.; Morandi, L.; Papi, A. Randomized Controlled Trials and real life studies. Approaches and methodologies: A clinical point of view. Pulm. Pharmacol. Ther. 2014, 27, 129–138. [Google Scholar] [CrossRef] [Green Version]
  51. Becker, S.O.; Ichino, A. Estimation of average treatment effects based on propensity scores. Stata J. 2002, 2, 358–377. [Google Scholar] [CrossRef] [Green Version]
  52. Caliendo, M.; Kopeinig, S. Some practical guidance for the implementation of propensity score matching. J. Econ. Surv. 2008, 22, 31–72. [Google Scholar] [CrossRef] [Green Version]
  53. Heckman, J.J.; Ichimura, H.; Todd, E. Matching as an econometric evaluation estimator: Evidence from evaluating a job training programme. Rev. Econ. Stud. 1997, 64, 605–654. [Google Scholar] [CrossRef]
  54. Rosenbaum, R. Overt bias in observational studies. In Observational Studies; Springer: New York, NY, USA, 2002; pp. 71–104. [Google Scholar]
  55. Smith, L.C.; El Obeid, A.E.; Jensen, H.H. The geography and causes of food insecurity in developing countries. Agric. Econ. 2000, 22, 199–215. [Google Scholar] [CrossRef]
  56. Sianesi, B. An evaluation of the Swedish system of active labor market programs in the 1990s. Rev. Econ. Stat. 2004, 86, 133–155. [Google Scholar] [CrossRef]
  57. Rubin, D.B.; Thomas, N. Matching using estimated propensity scores: Relating theory to practice. Biometrics 1996, 249–264. [Google Scholar] [CrossRef]
  58. Goetz, S.J.; Debertin, D.L. Why farmers quit: A county-level analysis. Am. J. Agric. Econ. 2001, 83, 1010–1023. [Google Scholar] [CrossRef]
  59. Kimhi, A. Is Part-Time Farming Really a Step in the Way Out of Agricultural? Am. J. Agric. Econ. 2000, 82, 38–48. [Google Scholar] [CrossRef]
  60. Kimhi, A.; Bollman, R. Family farm dynamics in Canada and Israel: The case of farm exits. Agric. Econ. 1999, 21, 69–79. [Google Scholar] [CrossRef]
  61. Roemer, J.E.; Trannoy, A. Equality of opportunity. In Handbook of Income Distribution; Elsevier: Amsterdam, The Netherlands, 2015; Volume 2, pp. 217–300. [Google Scholar]
  62. Datta-Chaudhuri, M. Market failure and government failure. J. Econ. Perspect. 1990, 4, 25–39. [Google Scholar] [CrossRef]
  63. Jenal, M.; Cunningham, S. Explore, scale-up, move out: Three phases to managing change under conditions of uncertainty. IDS Bull. 2015, 46, 81–92. [Google Scholar] [CrossRef] [Green Version]
  64. Cuevas, A.C. Transaction costs of exchange in agriculture: A survey. Asian J. Agric. Dev. 2014, 11, 21–38. [Google Scholar]
  65. Winters De Janvry, A.; Sadoulet, E.; Stamoulis, K. The role of agriculture in economic development: Visible and invisible surplus transfers. J. Dev. Stud. 1998, 34, 71–97. [Google Scholar] [CrossRef] [Green Version]
  66. Spriggs, J.; Van Kooten, G.C. The rationale for government intervention in Canadian agriculture: A review of stabilization programs. Can. J. Agric. Econ. Rev. Can. D’agroeconomie 1988, 36, 1–21. [Google Scholar] [CrossRef]
  67. Clark, S.L.; Garite, T.J.; Hamilton, E.F.; Belfort, M.A.; Hankins, G.D. “Doing something” about the cesarean delivery rate. Am. J. Obstet. Gynecol. 2018, 219, 267–271. [Google Scholar] [CrossRef] [PubMed]
  68. Nedergaard, P. Market failures and government failures: A theoretical model of the standard agricultural policy. Public Choice 2006, 127, 385–405. [Google Scholar] [CrossRef] [Green Version]
  69. Herrmann, C.S.; Munk, M.H.; Engel, A.K. Cognitive functions of gamma-band activity: Memory match and utilization. Trends Cogn. Sci. 2004, 8, 347–355. [Google Scholar] [CrossRef] [PubMed]
  70. Nedergaard, P. The political economy of CAP reform. In Renationalisation of the Common Agricultural Policy? Kjeldahl, R., Tracy, M., Eds.; APS—Agricultural Policy Studies: Belgium, 1994; pp. 84–104. Available online: https://www.researchgate.net/publication/23941186_Renationalization_of_the_Common_Agricultural_Policy_Mission_Impossible (accessed on 19 October 2022).
  71. Giles, E.L.; Kuznesof, S.; Clark, B.; Hubbard, C.; Frewer, L.J. Consumer acceptance of and willingness to pay for food nanotechnology: A systematic review. J. Nanoparticle Res. 2015, 17, 467. [Google Scholar] [CrossRef] [Green Version]
  72. Vilkė, R. Provision of Public Goods and Corporate Social Responsibility Paradigm: Theoretical Insights. Int. J. Sci. Eng. Investig. IJSEI 2017, 6, 218–225. [Google Scholar]
  73. Stiglitz, J.E. Some theoretical aspects of agricultural policies. World Bank Res. Obs. 1987, 2, 43–60. [Google Scholar] [CrossRef]
  74. Pingali, P. Westernization of Asian diets and the transformation of food systems: Implications for research and policy. Food Policy 2007, 32, 281–298. [Google Scholar] [CrossRef] [Green Version]
  75. Apergis, N.; Rezitis, A. Mean spillover effects in agricultural prices: The case of Greece. Agribus. Int. J. 2003, 19, 425–437. [Google Scholar] [CrossRef]
  76. Nicita, A. The price effect of tariff liberalization: Measuring the impact on household welfare. J. Dev. Econ. 2009, 89, 19–27. [Google Scholar] [CrossRef]
  77. Girabi, F.; Mwakaje, A.E.G. Impact of microfinance on smallholder farm productivity in Tanzania: The case of Iramba district. Asian Econ. Financ. Rev. 2013, 3, 227–242. [Google Scholar]
  78. David, A.; Guilbert, N.; Hamaguchi, N.; Higashi, Y.; Hino, H.; Leibbrandt, M.; Shifa, M. Spatial Poverty and Inequality in South Africa: A Municipality Level Analysis; AFD: Paris, France, 2018. [Google Scholar]
  79. Asmah, E.E.; Orkoh, E. Self-care knowledge of hypertension prevention and control among women in Contemporary Ghana. Am. J. Health Educ. 2017, 48, 374–381. [Google Scholar] [CrossRef]
  80. Espey, J.; Harper, C.; Jones, N. Crisis, care and childhood: The impact of economic crisis on care work in poor households in the developing world. Gend. Dev. 2010, 18, 291–307. [Google Scholar] [CrossRef]
  81. Boussard, J.M.; Daviron, B.; Gérard, F.; Voituriez, T. Food Security and Agricultural Development in Sub-Saharan Africa; FAO: Rome, Italy, 2006. [Google Scholar]
  82. Spio, K. The Impact and Accessibility of Agricultural Credit: A Case Study of Small-Scale Farmers in the Northern Province of South Africa. Ph.D. Thesis, University of Pretoria, Pretoria, South Africa, 2006. [Google Scholar]
  83. de Rosari, B.B.; Sinaga, B.M.; Kusnadi, N.; Sawit, M.H. The impact of credit and capital supports on economic behavior of farm households: A household economic approach. Int. J. Food Agric. Econ. IJFAEC 2014, 2, 81–90. [Google Scholar]
Figure 1. Number of farmers who received assistance from 2013 to 2016.
Agriculture 12 01760 g001
Figure 2. The difference in the production rate between those who received assistance and those who did not receive.
Agriculture 12 01760 g002
Figure 3. Average livestock production by gender and assistance status of the respondent.
Agriculture 12 01760 g003
Figure 4. Average agriculture income by gender and assistance status of the respondent.
Agriculture 12 01760 g004
Figure 5. Average agriculture income by gender and province of respondent.
Agriculture 12 01760 g005
Figure 6. Food insecurity by gender and assistance status of the respondent.
Agriculture 12 01760 g006
Figure 7. Food insecurity by province and assistance status of the respondent.
Agriculture 12 01760 g007
Figure 8. Propensity score distribution.
Agriculture 12 01760 g008
Table 1. Surveyed and sampled households for agricultural development support.
YearTotal Household SampleSampled HouseholdsPercentage Share in the Total Sample
201325,786590122.89
201425,363581922.94
201521,601420919.49
201621,228369117.39
Total93,97819,62020.88
Source: The General Household Survey [2013, 2014, 2015 and 2016].
Table 2. Determinants of farmers’ access to agricultural development support.
Agricultural Development SupportGHS2013GHS2014GHS2015GHS2016Pooled Sample
Age0.001 ***0.001 ***0.002 ***0.002 ***0.001 ***
Male0.024 ***0.033 ***0.023 ***0.050 ***0.030 ***
Primary0.0010.0070.005−0.0030.003
Secondary education−0.011−0.004−0.008−0.005−0.007 **
Higher education−0.053 ***−0.055 ***0.024−0.036 *−0.035 ***
African0.079 ***0.051 **0.061 ***0.048 **0.066 ***
Coloured−0.058 **−0.069 **−0.029−0.042 *−0.042 ***
Land > 5 ha0.081 ***0.041 ***0.104 ***0.0080.061 ***
>1 ha0.190 ***0.090 ***0.178 ***0.192 ***0.162 ***
Landlord−0.015 **0.012 **−0.004−0.028 ***−0.004
EC0.186 ***0.319 ***0.144 ***0.172 ***0.209 ***
NC0.074−0.007−0.112 ***−0.134 **−0.034 *
FS−0.087 **−0.003−0.123 ***−0.055−0.073 ***
KZN0.180 ***0.236 ***0.0070.073 **0.131 ***
NW−0.105 **0.017−0.112 **−0.073 **−0.072 ***
GP−0.073 *0.013−0.126 ***−0.033−0.057 ***
MP−0.0240.098 ***−0.0250.0360.015
L−0.120 ***0.008−0.126 ***−0.059 *−0.079 ***
Observations19,143196140211,09764,001
Standard errors in parentheses; *** p < 0.01, ** p < 0.05, * p < 0.1.
Table 3. Average Treatment Effects (ATE) of agricultural development support.
Dependent VariableNearest Neighbour MatchingKennel MatchingRadius Matching
Food insecurity (index:0–100)−1.485 ***−1.532 ***−1.099 ***
(0.602)(0.760)(0.447)
Agricultural income (Rand)59,002.380 ***59,671.78 ***51,989.66 **
(21,174.18)(21,802.84)(22,548.75)
Cattle production2.763 ***2.323 ***2.819 ***
(0.392)(0.510)(0.315)
Goat production1.293 ***1.216 **1.754 ***
(0.372)(0.568)(0.315)
Sheep production4.1998 ***3.932 ***5.021 ***
(0.415)(0.647)(0.303)
Pig production0.09980.00670.150 *
(0.106)(0.179)(0.083)
Standard errors in parentheses; *** p < 0.01, ** p < 0.05, * p < 0.1. Source: Author’s computation based on the GHS data.
Publisher’s Note: MDPI stays neutral with regard to jurisdictional claims in published maps and institutional affiliations.

