
An Economic Evaluation of Improved Rice Production Technology in Telangana State, India
by
 , , ,
, , ,
Nirmala Bandumula
1,*,
Santosha Rathod
1,
Gabrijel Ondrasek
2 ,
,
Muthuraman Pitchiah Pillai
1 and
Raman Meenakshi Sundaram
1 1
ICAR-Indian Institute of Rice Research, Hyderabad 500030, India
2
Faculty of Agriculture, University of Zagreb, 10000 Zagreb, Croatia
*
Author to whom correspondence should be addressed.
Agriculture 2022, 12(9), 1387; https://doi.org/10.3390/agriculture12091387
Submission received: 27 July 2022
/
Revised: 28 August 2022
/
Accepted: 29 August 2022
/
Published: 4 September 2022
(This article belongs to the Special Issue Agricultural Development Strategies for Less-Favoured Areas)
Abstract
:The demonstrations on improved rice production technology were organized in the Wanaparthy, Nagarkurnool, Yadadri Bhuvanagiri, and Rangareddy districts of Telangana state of India. These demonstrations were organized under the Scheduled Caste Sub Plan of the Indian Institute of Rice Research during the wet season of 2021. The biofortified varieties assume great significance to achieve nutrition security. Hence, the zinc biofortified rice variety, DRR Dhan 48 was demonstrated on the 142 farmer fields and the economic impact of these demonstrations was assessed with the ‘difference in difference’ approach. The results revealed that the production of rice under demonstration plots was more profitable with a higher benefit-to-cost ratio (B:C; 1.9) compared to that of the control plots (1.4). The independent two-sample t-test revealed that the productivity at the control plots was not statistically different from that of the demonstrations plots (p = 0.112) before the project was implemented, however, with the intervention in the form of the demonstration of improved rice production technology, the productivity differed significantly (p = 0.000) for the control and the demonstration plots for the intervention year. The results of the difference in differences estimator revealed that there was a positive impact of demonstrations on the yield of the beneficiaries. The mean productivity of demonstration plots and control plots were 5.52 t/ha and 4.5 t/ha, respectively. The farmers had an additional yield advantage of 22.6% over the control plots. The results indicated that the adoption of an improved package of practices would enable harnessing higher productivity levels and bridging the yield gaps in similar agroecosystems. Also, the results suggest the practical significance of the popularization of biofortified rice varieties for food and nutritional security.
1. Introduction
Rice is the most important Indian staple food, providing approximately 60% of the daily energy requirements or 41% of total food grain production from 35% of the national food grain area, and thus is crucial for national food security. However, in the future rice production will need to be further increased in order to meet rising food demands under strong competition for limited agro-resources, notably productive land and water [1]. There are two options for achieving this target: one is the horizontal expansion of area under rice cultivation, for which there is very little scope; the second is the vertical expansion—increasing rice yield through the adoption of yield-enhancing technologies [2]. This increase in production has to be achieved against the backdrop of declining and deteriorating resource bases such as land, water, labor, and other inputs without adversely affecting the quality of the environment [3]. Also, several studies have reported wide yield gaps in rice, which demand identifying causes through in-depth research for bridging the gaps to increase rice production [4,5].
The Scheduled Castes (SC) of India make up nearly 17% of the total population [6] and are among the most socioeconomically disadvantaged segment of the national population. The people who belong to SC are distributed throughout the country, although a majority of them live in rural areas (76.4%). In addition, the population of SC has been disproportionately affected by the (post) Covid19 crisis, which has resulted in significant disruption of livelihood opportunities and economic conditions for the SC population, especially in remote and far-flung areas [7]. Rising to the challenges posed by the pandemic crises, the multidisciplinary research team of the Indian Council of Agricultural Research-Indian Institute of Rice Research (ICAR-IIRR) implemented the Scheduled Castes Sub Plan (SCSP) by organizing 2799 demonstrations on SC farmers’ fields in various Indian states during 2021. Namely, the demonstration of new varieties and technologies can be a very effective way to encourage the dissemination of novel and advanced approaches in agroecosystems [8,9]. For instance, frontline demonstrations are an effective tool for the adoption and horizontal expansion of scientific technologies to fill the yield gaps that may exist due to the lack of awareness among the farming community regarding improved cultivation management [10,11].
Biofortification is the enhancement of micronutrient levels of staple crops through biological processes, such as plant breeding and genetic engineering [12,13]. It is identified as the most cost-effective intervention gaining 17 USD worth of benefits for every 1 USD spent [14]. Biofortification provides a feasible means of reaching the undernourished population in remote rural areas, delivering naturally fortified foods to people with limited access to commercially marketed fortified foods that are more readily available in urban areas [15].
According to World Health Organization, zinc deficiency is the fifth most important factor for illness and diseases in developing countries and 11th in the world [16]. Zinc deficiency causes diarrhea and respiratory diseases, leading to 400,000 deaths annually across the world [17,18]. Since rice is the staple food crop of India, biofortification of rice is sustainable and cost-effective means of delivering the target micronutrients to the populations who cannot afford diverse diets. Refs. [19,20] studied the mechanism of consumer acceptance of biofortified crops in China and found that the consumer purchase intention varies depending on the visibility of nutrition traits of biofortified foods.
Ideally, once the rice is biofortified with vital nutrients, the farmer can grow the variety indefinitely without any additional input to produce nutrient-packed rice grains in a sustainable way, so that product reaches the malnourished population in rural India [21]. The development and release of high zinc rice varieties developed by ICAR-IIRR is an effort to address zinc deficiency [22]. The high zinc rice variety, ‘DRR Dhan 48’ is notified at the national level with an overall mean zinc content of 22 ppm in polished rice [23].
Green manure is an efficient nitrogen (N) source when used as an alternative to chemical fertilizer. The partial substitution of chemical fertilizer with green manure is an effective method of promoting rice growth by supplying N for rice uptake and promoting more efficient N use [24]. The chemical fertilization along with green manure crop incorporation results in a higher yield of rice [25]. Front Line Demonstrations with the introduction of green manuring crop Dhaincha (Sesbania rostrata) have been conducted by [26] of Krishi Vigyan Kendra, East Kameng district, Arunachal Pradesh, India, and reported higher net returns. Refs. [27,28] have concluded that the incorporation of green manure legumes can add large quantities of N to the soil.
In this background, the present paper attempts to assess the economics of improved rice production technology with zinc biofortified rice variety, DRR Dhan 48, demonstrated on farmer fields in the Kharif (wet) season, 2021 in Telangana state of India under ICAR-IIRR-SCSP. The results of this study will have a practical significance for the popularization of biofortified rice cultivation which helps to alleviate zinc malnutrition.
2. Materials and Methods
2.1. Study Area
In India, Telangana is a major rice-producing state with a productivity of 3327 kg/ha [29]. Telangana is the 11th largest Indian state with a geographical area of 11.2 Mha. Rice accounted for 50.3% (4.12 Mha) of the total gross cropped area in Telangana during 2020 [30]. Agriculture plays a pivotal role in the economy of Telangana. Besides the fact that the sector helps in ensuring food security, it also provides livelihoods to more than half of the state’s workforce. In the state of Telangana, the agricultural households as a percentage of rural households are 54.2% (2,655,700 agricultural households out of 4,899,600 rural households) in 2019. The normal rainfall received by Telangana is 905.4 mm.
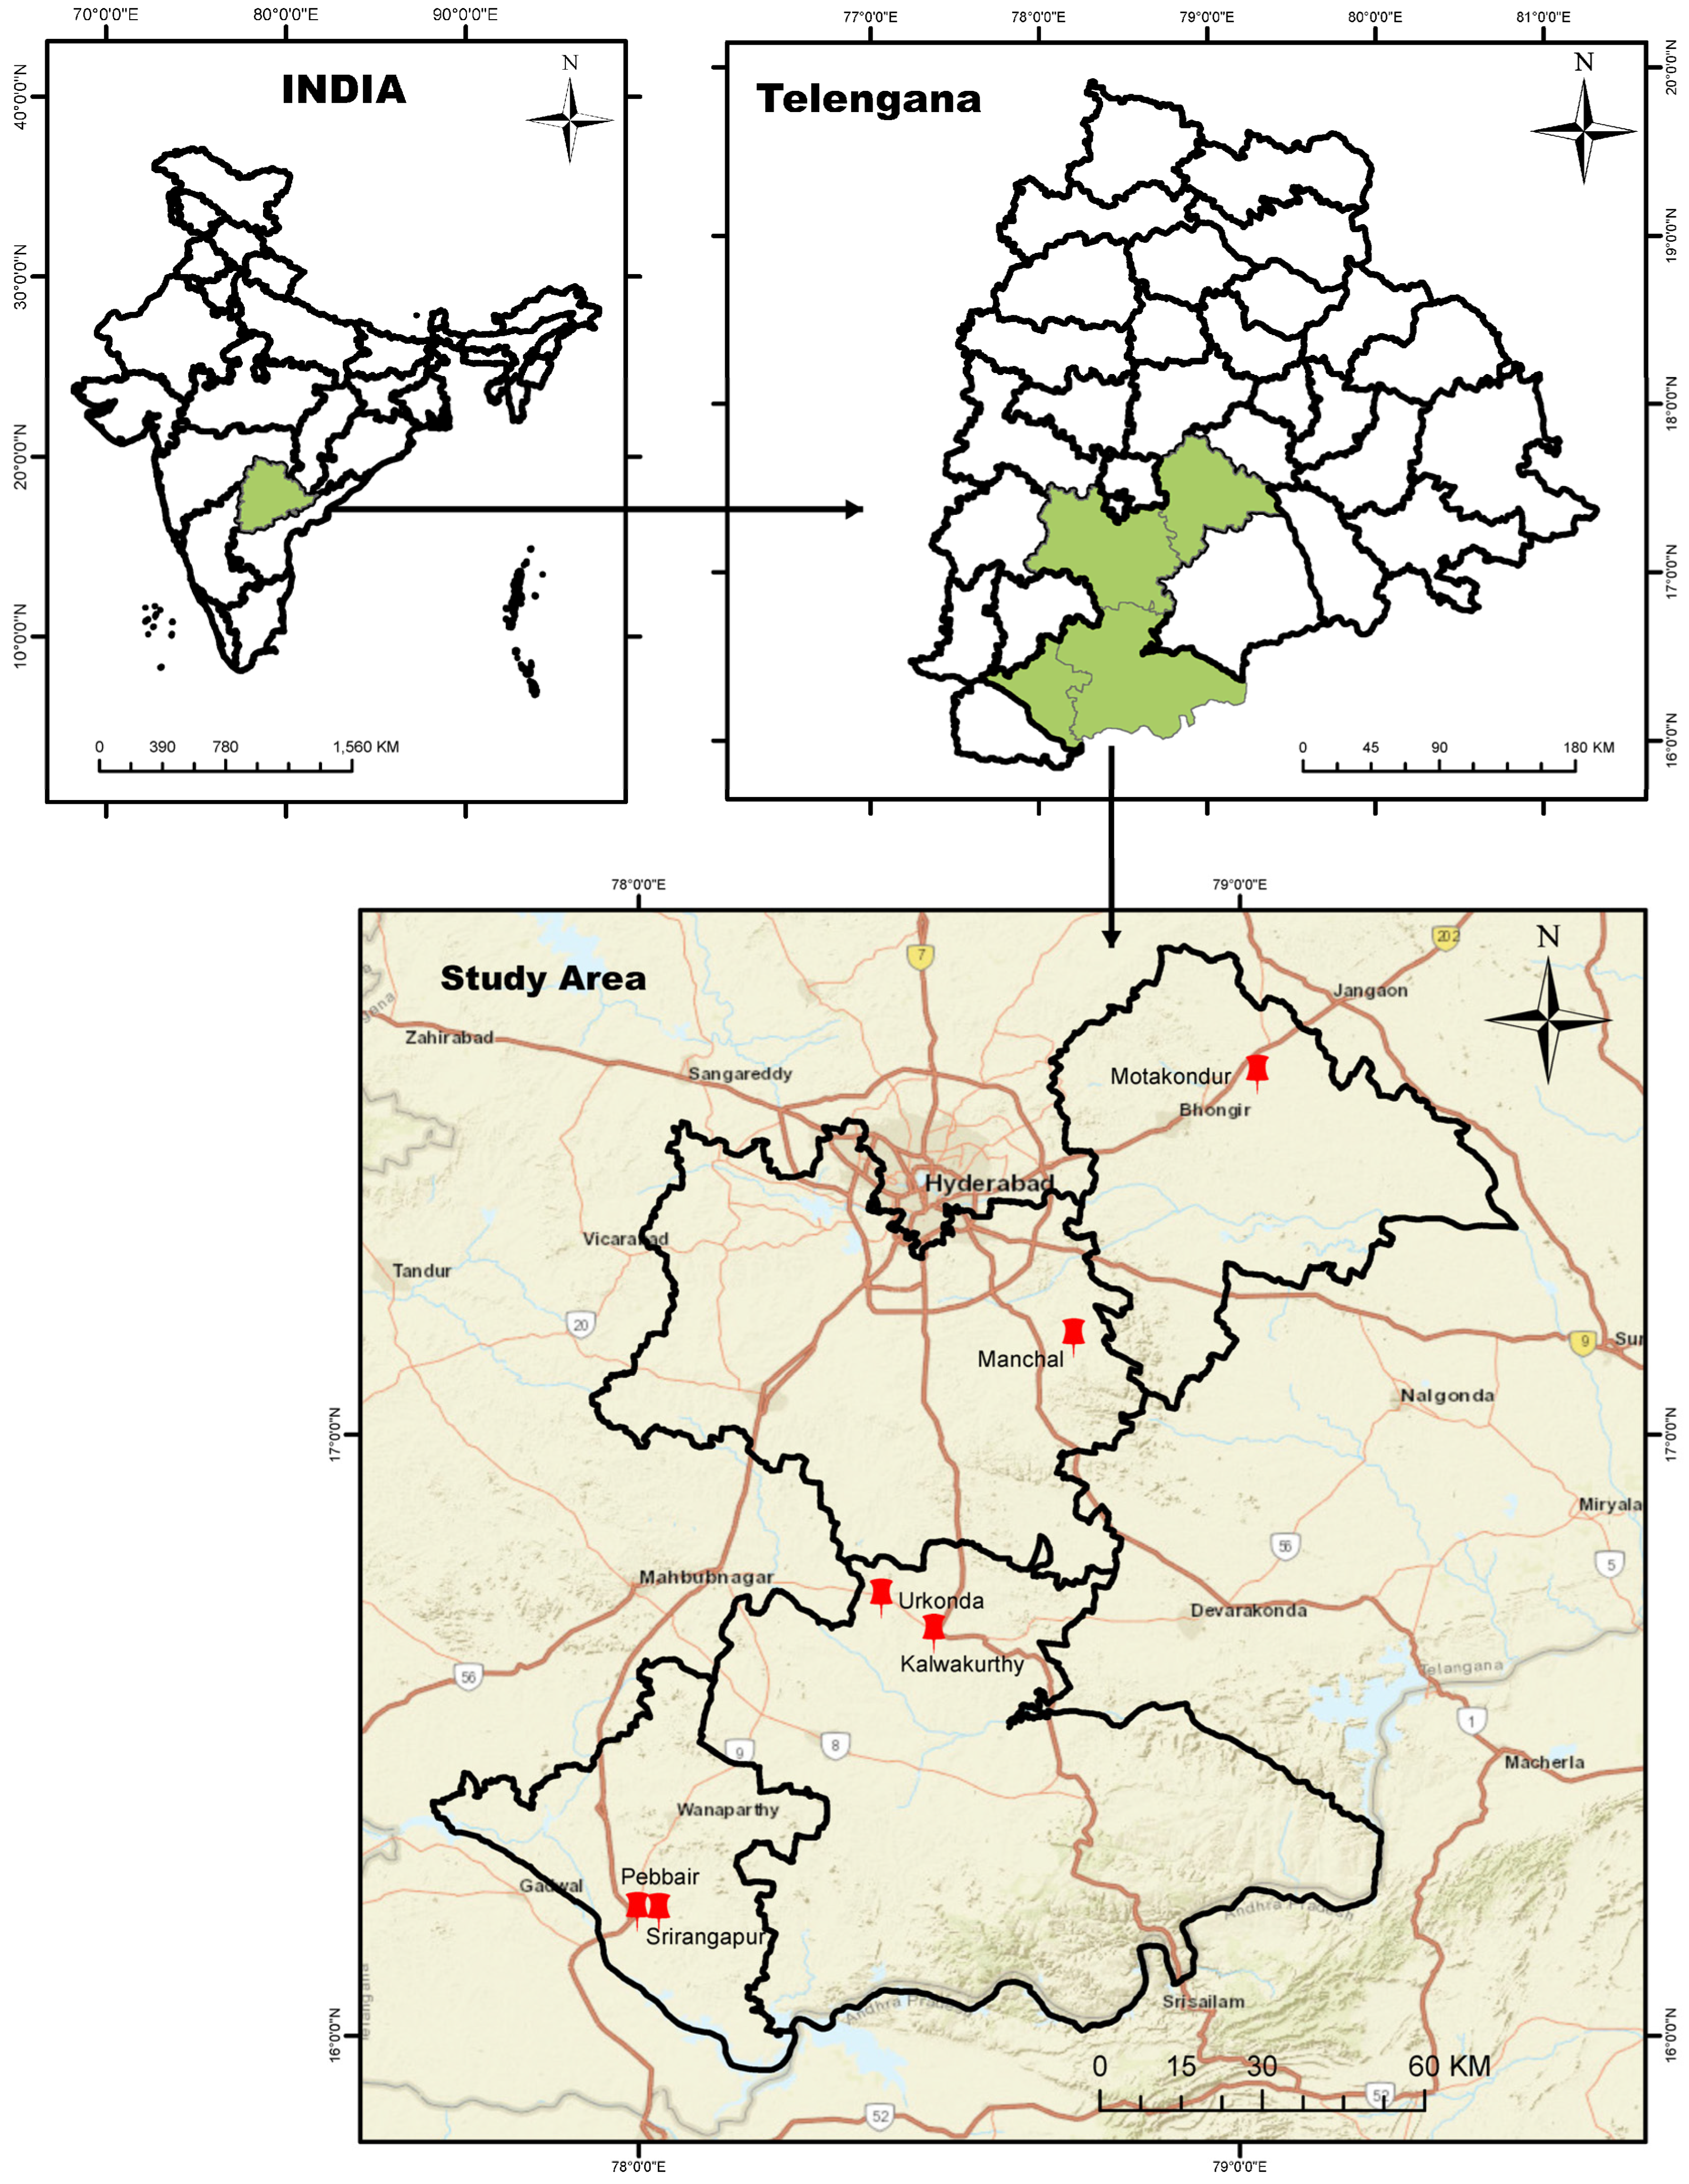
Out of the 33 districts of Telangana, four major rice-growing districts, viz., Wanaparthy, Nagarkurnool, Yadadri Bhuvanagiri, and Rangareddy were selected for implementation of the SCSP project. Further, the beneficiaries were selected from Pebbair and Srirangapur mandals of Wanaparthy district, Kalwakurthy and Urkonda mandals of Nagarkurnool district, Motakondur mandal of Yadadri Bhuvanagiri district, and Manchal mandal of Rangareddy district of Telangana (Figure 1).
2.2. Demonstrations of Improved Rice Production Technology
The demonstrations on ‘improved rice production technology’ were organized in the Telangana state of India during the Kharif (wet season) of 2021. The interventions undertaken under SCSP were oriented towards technology and input support to the beneficiary SC farmers. Under SCSP 142 demonstrations on improved rice production technology were organized in the Telangana state of India in kharif (wet season 2021). The technology demonstrated included biofortified rice variety (DRR Dhan 48), recommended seed rate (50 kg/ha), and integrated nutrient management using green manuring and leaf color charts. In order to enhance soil fertility, a mixture of seeds of green manure crops (25 kg/ha) was distributed to the selected beneficiary farmers. A mixture of green manure crops viz., Green gram, Black gram, Cowpea, Maize, Fenugreek, Sunhemp, Dhaincha, Wheat, Coriander, Castor, Bajra, Mustard, Sesamum, Sunflower, Bengal gram, and Finger millet were grown on the selected fields of beneficiary farmers. The green manure crops were ploughed back into the soil before flowering to enhance the soil fertility level. The green manure crop was incorporated into the soil two weeks before the ploughing of the main field. The nursery was well maintained and 25 days old seedlings were transplanted in the main field. Also, leaf color charts were distributed to the beneficiary farmers and they were trained on the application of fertilizers based on the leaf color charts. The Leaf Color Chart (LCC) is used to determine the N fertilizer needs of rice crops. LCC has four green strips, with colors ranging from yellow-green to dark green. It determines the greenness of the rice leaf, which indicates its N content [31]. The farmers were informed to apply the N fertilizer based on the greenness of the rice leaf after matching it with the LCC. Also, the selected beneficiary farmers were provided with sprayers and drying sheets to dry the harvested produce.
Before the implementation of the SCSP demonstrations in the selected villages of Telangana, 281 rice farmers were interviewed. The data were collected on the existing farming practices adopted by the farmers and the economics of rice cultivation. Out of the 281 rice households surveyed, 142 were selected and included in the experiment. The recommended rice production technology was demonstrated on the fields of the treated group’s farmers. The data on the yield and straw were collected again from all 281 farmers including the 139 from the control group and 142 beneficiary farmers. A comparison was made between the productivity and profits of the control and the demonstration or experimental plots.
2.3. Analytical Framework
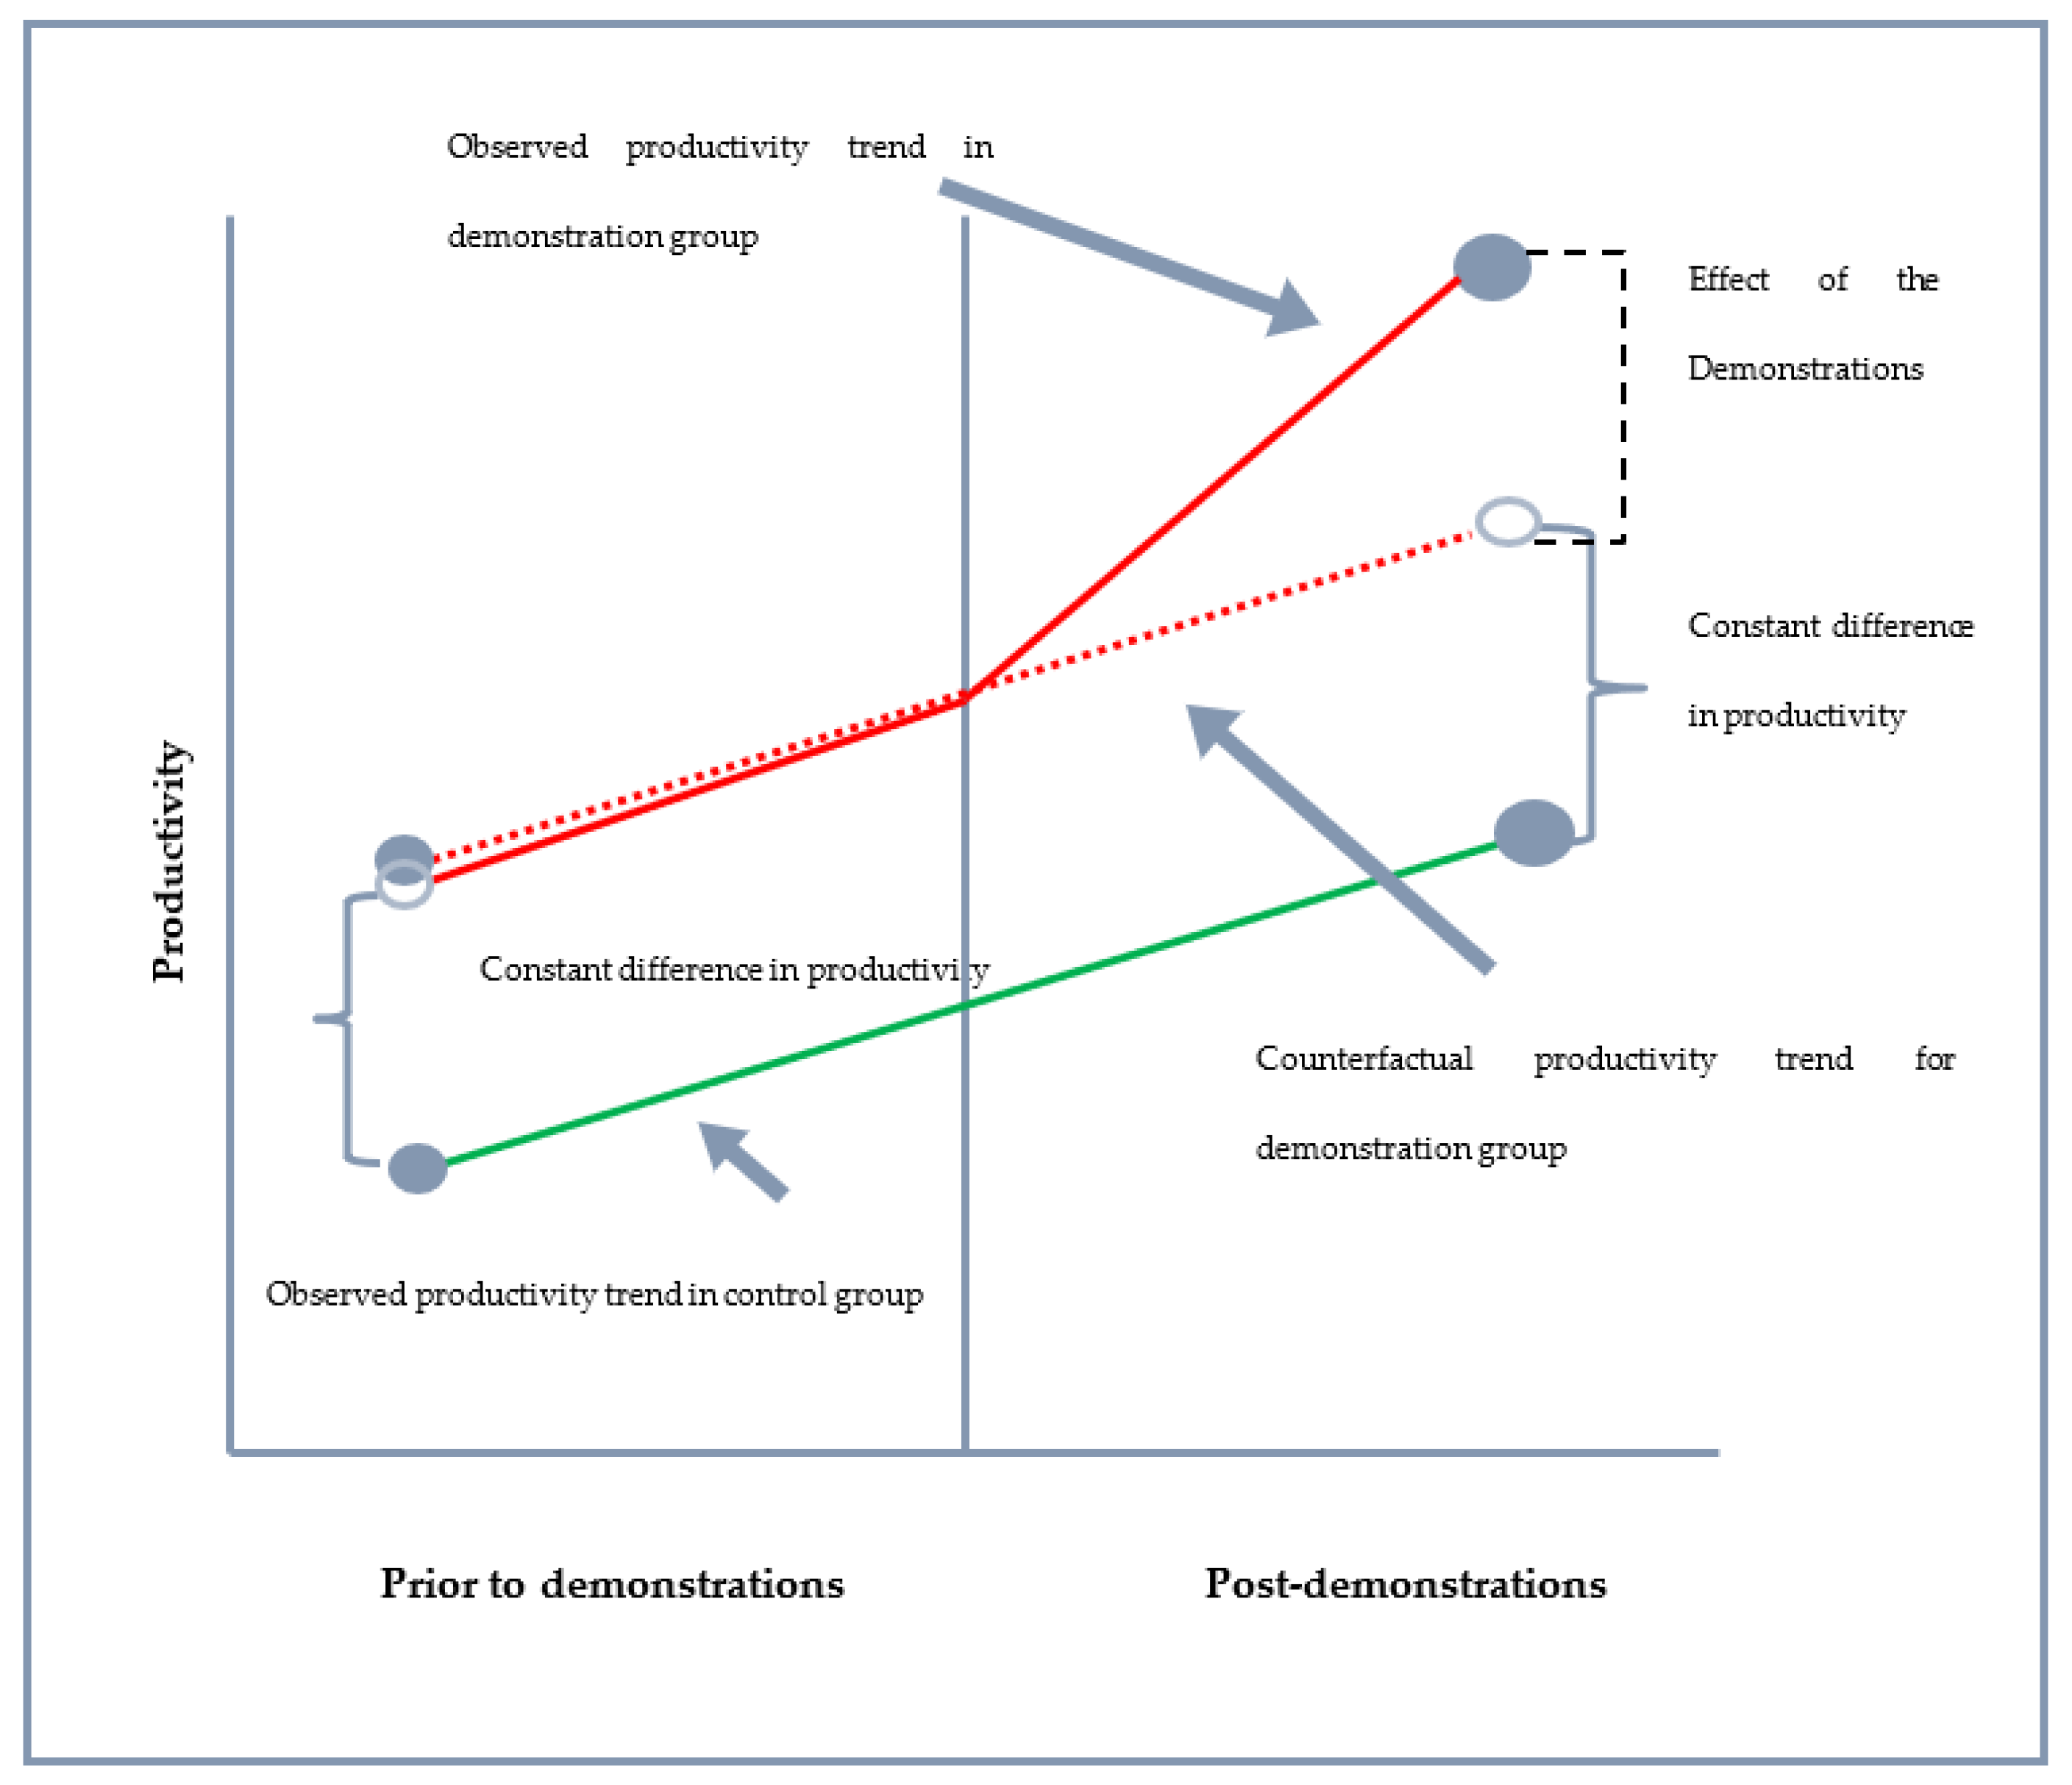
Project impact evaluation studies whether the intervention had a welfare effect on individuals, households, and communities and whether this effect can be attributed to the concerned intervention [32]. Difference-in-Differences (DID) estimator is one of the most popular tools for applied research in economics to assess the impact of public interventions and other treatments of interest on certain relevant outcome variables [33,34,35]. In addition, DID is one of the most commonly used methods in impact evaluation studies known as “controlled before-and-after study” or “treatment-control group comparisons”. When policy changes or treatments are imposed on people, it is common and reasonable to ask how those people have been impacted. This is a more difficult question than it seems at first glance. To truly know how those individuals have been impacted, we need to consider how those individuals would be had the policies or treatments not taken place. However, the changes did take place, and we were not able to observe how those individuals would fair without those changes. The DID approach considers both with and without as well as before and after situations [36].
In brief, DID uses the outcome of the control group as a proxy for what would have occurred in the treatment group if there had been no treatment (Table 1). The difference in average post-treatment outcomes between the treatment and control groups is then used to measure treatment effects. DID model is consisted of:
- A sudden exogenous source of variation, which is usually referred to as the treatment.
- A quantifiable and measurable outcome that is either the direct target of the variation or an indirect proxy.
- A treatment group that is subjected to the change.
- A control group that is similar in characteristic to the treatment group but is not subjected to the change.
DiD as a quasi-experimental design uses longitudinal data from treatment and control groups to obtain an appropriate counterfactual with which to estimate a causal effect [37]. It is commonly used to estimate the effect of a particular intervention or treatment (e.g., implementation of regulation/program, adoption of a policy) by comparing changes in outcomes over time between a population that participates in a program (the intervention group) and a population that does not (the control group) (Figure 2).
The basic DID study has data from two groups and two time periods, and the data are generally at the individual level, which is a lower level than the treatment intervention itself. With two groups and two time periods, and with a sample of data from the population of interest, the DiD estimate of policy effects can be written as follows:
where y is the outcome variable, the bar represents the average value (over individuals, typically indexed by i), the group is indexed by s, while t represents a time scale. With before and after data for treatment and control, the data is thus divided into four groups and the above double difference is calculated [38].
In this paper, the average impact of the demonstrations on productivity is estimated as
where,
DD is the difference in difference
dt –dt+1 is the average difference in the productivity of rice in the demonstration group before and after the demonstrations
ct –ct+1 is the average difference in the productivity of rice in the control group before and after the demonstrations
d number of demonstration farmers
c number of control farmers
dt = observed outcome in the group d in period t
The outcome Yi is modeled by the following equation
where
Yi = α + βTi + γti + δ (Ti × ti) + εi + ζi
The coefficients are given by the letters α, β, γ, δ, and εi are all unknown parameters and ζi is a random, unobserved “error” term which contains all determinants of Yi that the model omits.
α = constant term
β = treatment group-specific effect (to account for average permanent differences between treatment and control)
γ = time trend common to control and treatment groups
δ = true effect of treatment
εi = Socio-economic variables related to a group
The coefficient on the interaction term (δ) is an estimate of the treatment effect under the common trend assumption [39].
3. Results
3.1. Details of SCSP Demonstrations
Table 2 presents the details of the demonstrations on improved rice production technology conducted in the study area. The production practices adopted by the farmers were compared and contrasted with the recommended practices demonstrated on the beneficiary farmers’ fields.
Table 3 presents the socio-economic characteristics of the examined farmers. The sample farmers at the control and demonstration plots were not statistically different in terms of age, education, and family size, but statistically different in terms of operational holding an average area under rice (Table 3).
In the case of the control plots, the average age of the farmer was 48.47 years, the formal education was 2.43 years and the family size was five members. In the case of demonstration plots, the average age of the farmer was 48.94 years, the formal education was 3.42 years and the family size was five members. The beneficiaries at the demonstration plots had comparatively less operational holding and area under rice than that of the control farmers. At the demonstration plots, the operational holding was 1.11 ha and the area under rice was 0.62 ha. At the control plots, the operational holding was 1.64 ha and the area under rice was 0.87 ha.
3.2. A Comparison of Paddy Productivity
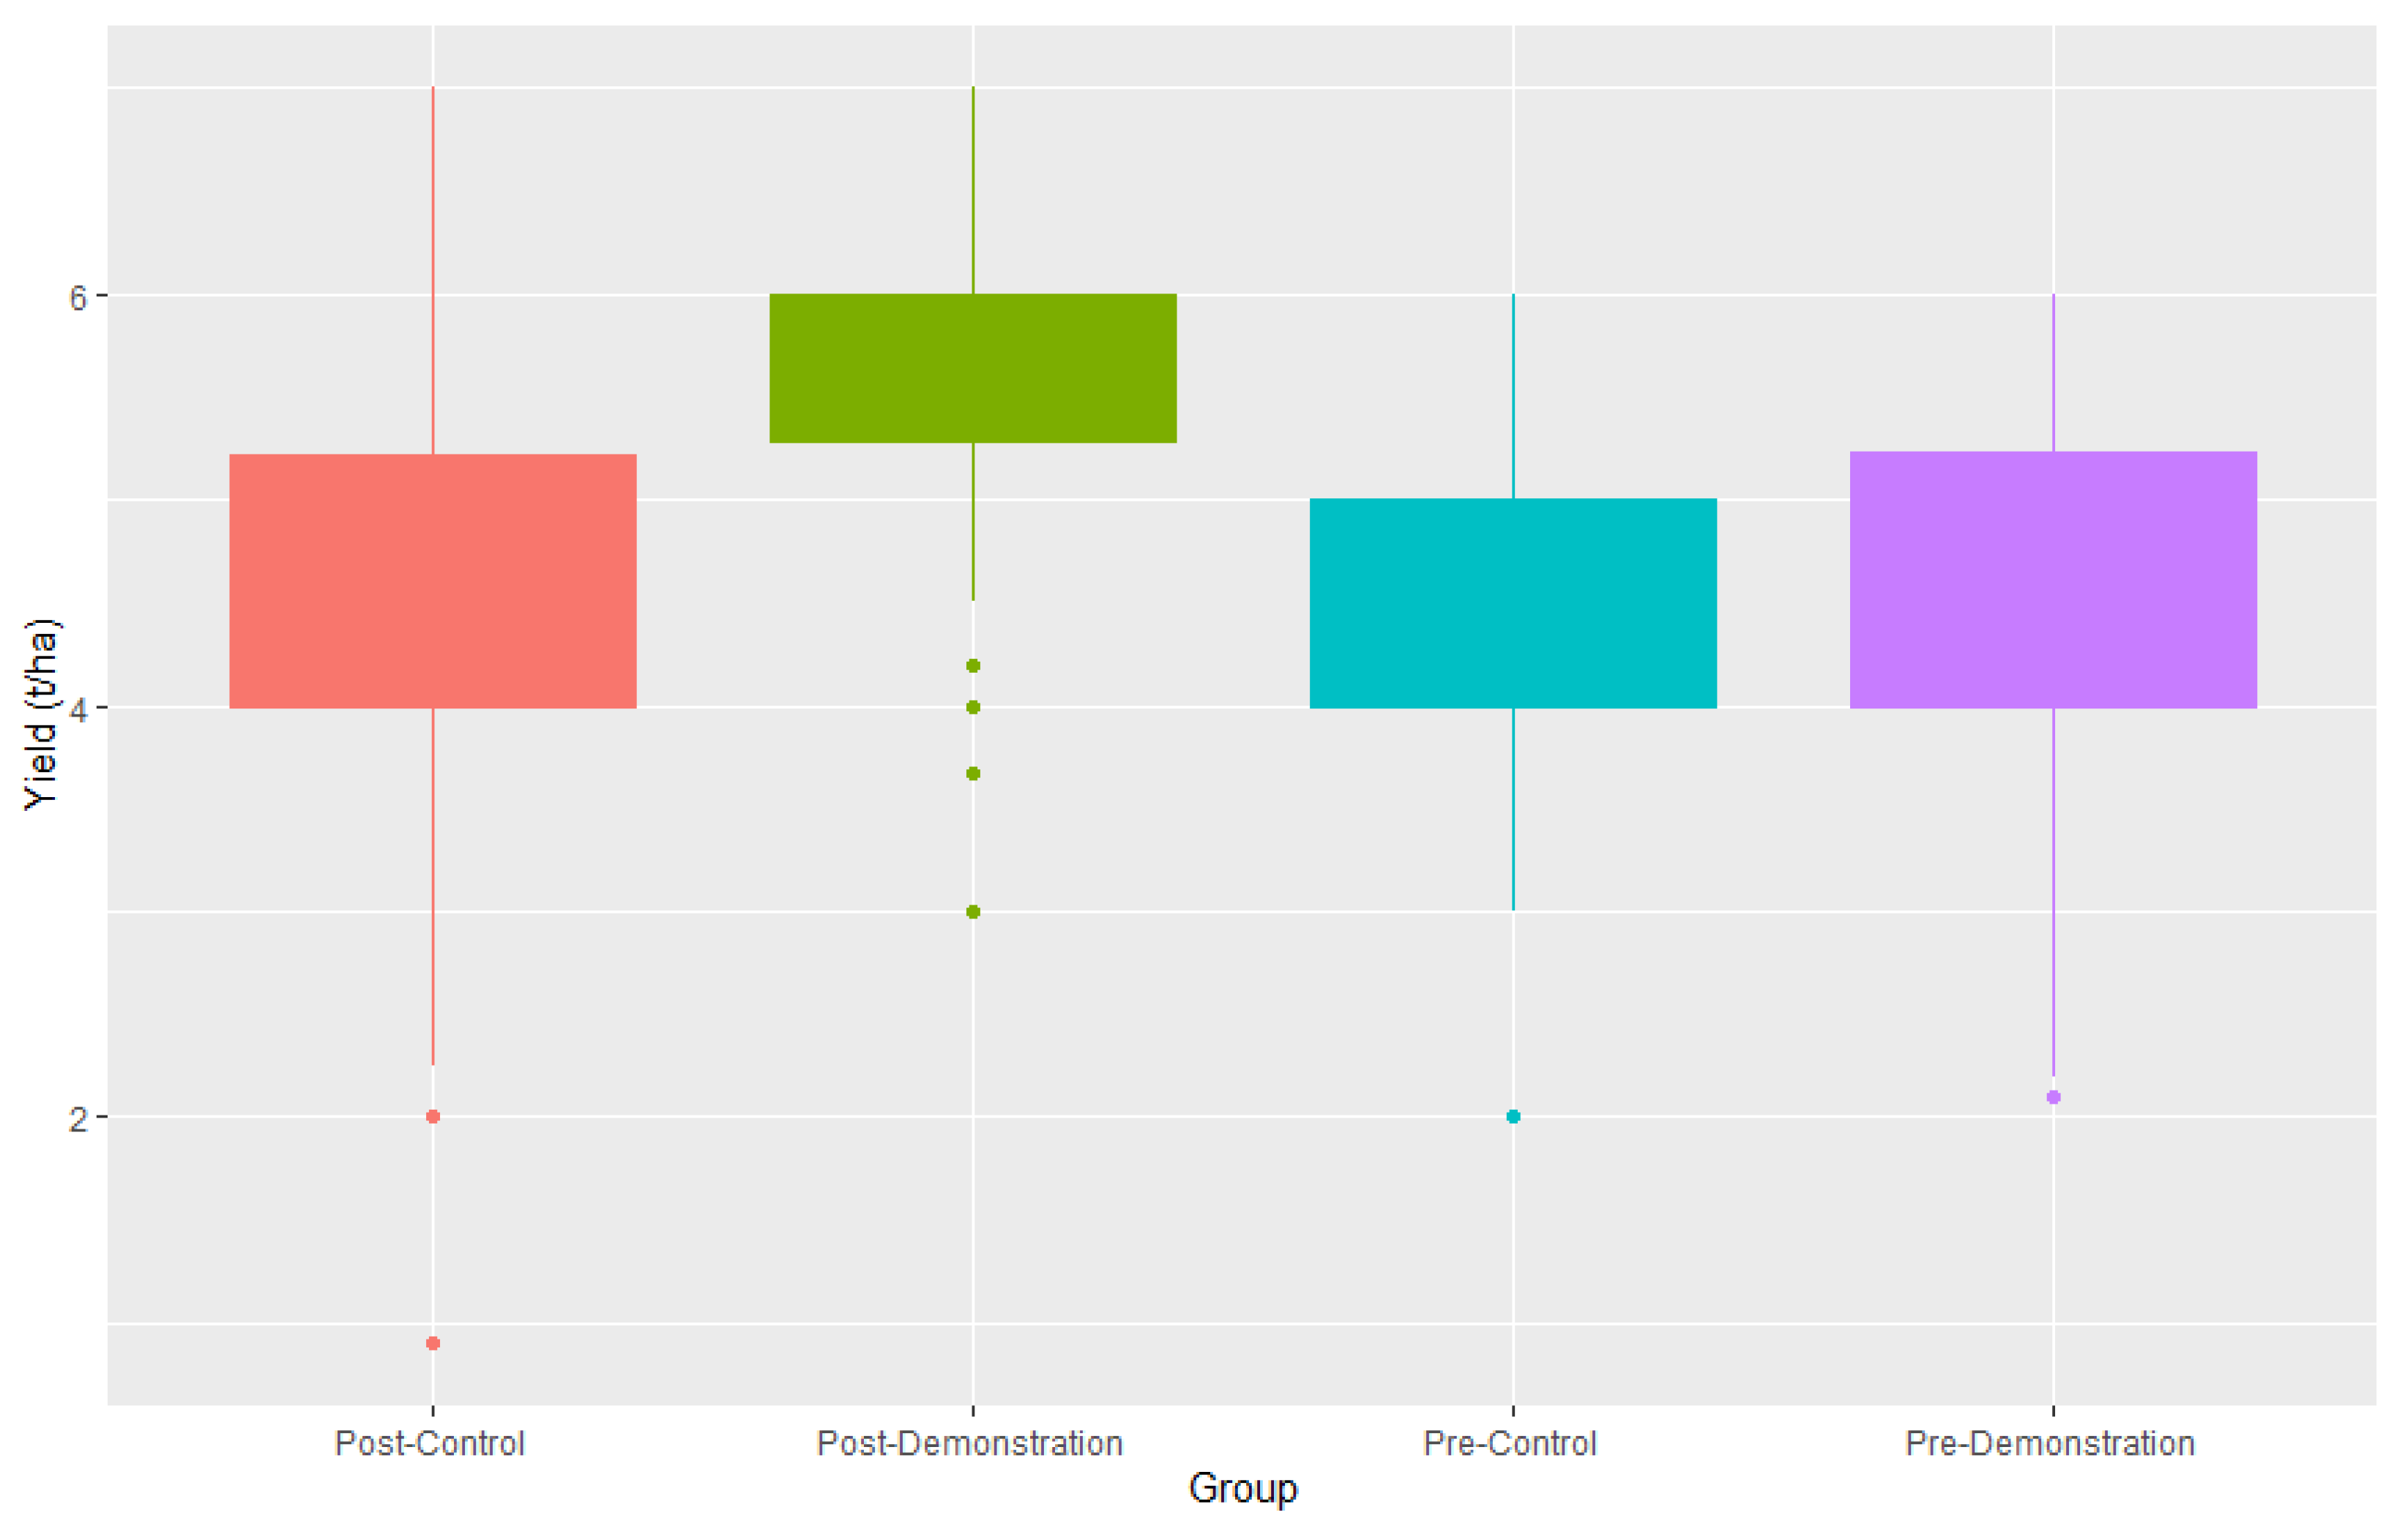
A comparison of paddy productivity before and after the demonstrations was made and the results are presented in Table 4. On average, for the two years 2020 and 2021, the control plots recorded a productivity of 4.54 t/ha whereas the demonstration plots recorded a productivity of 5.13 t/ha.
The productivity status of the demonstration plots and the control plots across two time periods viz., 2020 and 2021 are depicted as box and whisker plots (Figure 3).
To compare the yields of the demonstration plots with that of the local check in two years viz., 2020 (base year) and 2021, the independent two-sample t-test was employed.
The independent two-sample t-test revealed that the productivity at the control plots was not statistically different from that of the demonstrations plots (p = 0.112) before the project was implemented, however, with the intervention in the form of the improved rice production demonstration, the productivity differed significantly (p = 0.000) for the control and the demonstration plots for the intervention year (Table 5) which means that the productivity of the demonstration plot was higher than that of the control group.
The productivity of the rice under SCSP demonstrations was compared with that of the local check plots (Table 6). The mean productivity of demonstration plots and control plots were 5.52 t/ha and 4.5 t/ha, respectively. The farmers had an additional yield advantage of 22.67% over the control plots.
3.3. Double Difference Regression Analysis
The double difference regression model was employed to analyze the impact of improved rice production technology demonstrated under SCSP. The coefficient of the Post-term (time variable, b2 = −0.067) indicates the change in productivity after the implementation of the demonstrations in comparison to prior to implementation of the demonstrations. The results revealed that the coefficient of time term was statistically non-significant, which means that the time does not have any impact on the productivity of rice in control and demonstration plots.
The coefficient of the treatment variable (b1 = 0.125) indicates the mean difference in rice productivity between the demonstration and control plots prior to the implementation of the SCSP activities. The coefficient of the treatment term had a positive coefficient and was not significant, which indicates that the rice productivity at the control and demonstration plots were not significantly different and were the same before the implantation of the project.
The coefficient of the interaction term (treat × post) had a positive coefficient of 0.864 and it was statistically significant at a 1% level of significance (Table 7). These results reveal that the implementation of demonstrations under SCSP has increased the productivity of rice in the demonstration plots of the beneficiary farmers.
The economics of the rice cultivation under control and demonstration plots was computed and presented in Table 8. The cost of cultivation was worked out based on the expenditure incurred on the total inputs used in rice production. The costs incurred on seed, manures and fertilizers, plant protection chemicals, machine labor, and human labor were included in the computation of the total cost of cultivation. The gross returns were calculated as the yield (tonnes per hectare) multiplied by the price per ton. The net returns were computed by deducting the total cost of cultivation per hectare from the gross returns per hectare [40,41]. The total input costs were low in demonstration plots (Rs. 60,632) in comparison to the control plots (Rs. 68,171). However, the gross returns obtained by the demonstration farmers were higher than that of the control group farmers.
4. Discussion
Biofortification is considered a sustainable strategy to combat malnutrition and ensure food quality and security as it refers to improved levels of bioavailable micronutrients (e.g., Zn, Fe, Se) in food crops through genetic selection using plant breeding [42]. For instance, farmers can grow the biofortified variety without additional inputs to produce nutrient-rich rice grains in a sustainable manner so that the produce reaches the malnourished population. More specifically, the development of a high-Zn-containing rice variety, DRR Dhan 48, by ICAR-Indian Institute of Rice Research (ICAR-IIRR) is an attempt to address malnutrition through rice biofortification [43].
The total input costs were comparatively less in demonstration plots than that in the control plots. This is mainly due to the lower level of chemical fertilizers used in demonstration plots. However, the gross returns obtained by the demonstration farmers were higher than that of the control group farmers. The adoption of improved rice production technology resulted in higher yields in demonstration plots and hence higher returns. Also, the benefit-to-cost ratio (B:C) was also higher for the demonstration plots, which indicates that the adoption of the recommended practices in rice cultivation is more profitable to the farmers. Similar results were reported by [44,45,46,47,48,49].
5. Conclusions
Demonstrations of the improved rice production technology were conducted under ICAR-IIRR-SCSP. The results of the difference in differences estimator revealed that there was a positive impact of demonstrations on the yield of the beneficiaries. The results also revealed that the adoption of an improved package of practices would help in harnessing higher productivity levels and bridging the yield gaps under similar agroecological situations. Hence, efforts should be made to disseminate improved rice production technology. Also, awareness should be created about the potential health benefits of biofortified varieties such as DRR Dhan 48. The study suggests the need for the popularization of biofortified rice varieties for food quality and nutritional security. However, the major limitation of the study is that it is confined to the economic analysis of improved rice production technology with biofortified rice variety and there is a scope to conduct studies in the future on marketing, willingness to pay, and consumer acceptance of biofortified rice.
In India, the people belonging to Scheduled Caste remain worse off in nutrition outcomes compared to other communities of the society. The stunting in children, which is mainly caused due to zinc deficiency is higher in children from the SC community than in children of other communities. Hence, it is suggested that for alleviating malnourishment and also to enhance the income from rice production, there is an urgent need to promote the production of biofortified rice varieties.
Author Contributions
Conceptualization, N.B.; methodology, N.B. and S.R.; software, S.R.; validation, N.B., S.R. and M.P.P.; formal analysis, N.B. and S.R.; investigation, N.B.; resources, R.M.S.; data curation, S.R.; writing—original draft preparation, N.B.; writing—review and editing, N.B.; S.R.; M.P.P.; G.O. and R.M.S.; visualization, N.B.; supervision, R.M.S.; project administration, M.P.P.; funding acquisition, R.M.S. All authors have read and agreed to the published version of the manuscript.
Funding
This research was funded by Scheduled Caste Sub Plan of Indian Council of Agricultural Research-Indian Institute of Rice Research.
Institutional Review Board Statement
Article approved for submission. Ref. No. IIRR/ PD/DIR/ PMEC/2022-23/Res.Paper/450 dt. 25 May 2022.
Informed Consent Statement
Informed consent was obtained from all subjects involved in the study.
Conflicts of Interest
The authors declare no conflict of interest.
References
- Nirmala, B.; Tuti, M.D.; Mahender, K.R.; Amtul, W.; Muthuraman, P.; Brajendra, P.; Vidhan, S.T. Integrated assessment of system of rice intensification vs. conventional method of transplanting for economic benefit, energy efficiency and lower global warming potential in India. Agroecol. Sustain. Food Syst. 2021, 45, 745–766. [Google Scholar] [CrossRef]
- Nirmala, B.; Muthuraman, P.; Meera, S.N.; Sain, M.; Viraktamath, B.C. Economics of hybrid rice seed production in India. In Accelerating Hybrid rice Development; Xie, F., Hardy, B., Eds.; International Rice Research Institute: Los Baños, PH, USA, 2009; ISBN 978-971-22-0252-0. [Google Scholar]
- Nirmala, B. Hybrid Rice Seed Production in Telangana and Andhra Pradesh States of India: A Situation Analysis. Int. J. Agric. Sci. 2015, 7, 883–886. [Google Scholar]
- Beigh, M.A.; Rufaida, M.S.Z.A.; Matoo, J.M.; Sibat, F.K. Impact analysis of front line demonstration of rice (Oryza sativa) on the yield, economics and farmer’s knowledge in the temperate region of India. Sci. Res. Essays 2015, 10, 49–455. [Google Scholar] [CrossRef]
- Nirmala, B.; Deshmanya, J.; Muthuraman, P.; Meera, S.N.; Sain, M. Yield gap analysis of rice in Raichur district of Karnataka. Karnataka J. Agric. Sci. 2010, 22, 238–846. [Google Scholar]
- Census of India. Available online: https://censusindia.gov.in (accessed on 24 May 2022).
- Report on Covid-19: Resilience & Capacity Building of Scheduled Caste and Scheduled Tribe Communities at Grassroots. 2021. SEED Division, Department of Science and Technology, Government of India. New Delhi.p.24. Available online: https://dst.gov.in/sites/default/files/Report%20on%20Interventions%20for%20SC%20%26%20ST-01.pdf (accessed on 4 June 2022).
- Dar, M.H.; Alain, J.; Kyle, E.; Erin, M.K.; Elisabeth, S. Endogenous Information Sharing and the Gains from Using Network Information to Maximize Technology Adoption. Working Paper; January 2019. Available online: https://www.povertyactionlab.org/evaluation/impact-demonstration-plots-adoption-new-rice-varieties-bangladesh (accessed on 28 May 2022).
- Rajput, F.K. Group-dynamic techniques In National Book Foundation; Memon, R.A., Bashir, E., Eds.; Extension Methods: Islamabad, Pakistan, 1997; pp. 179–205. [Google Scholar]
- Singha, A.K.; Baruah, M.J. Farmers’ adoption behaviour in rice technology: An analysis of adoption behaviour of farmers in rice technology under different farming systems in Assam. J. Hum. Ecol. 2011, 35, 167–172. [Google Scholar] [CrossRef]
- Singh, R.; Soni, E.L.; Singh, V.; Bugalia, H.L. Dissemination of improved production technologies of solanaceous vegetable in Banswara district of Rajasthan through Frontline demonstrations. Rajasthan J. Ext. Educ. 2011, 19, 97–100. [Google Scholar]
- Bouis, H. Plant breeding: A new tool for fighting micronutrient malnutrition. J. Nutr. 2002, 132, 491S–494S. [Google Scholar] [CrossRef]
- Ondrasek, G.; Rathod, S.; Manohara, K.K.; Gireesh, C.; Anantha, M.S.; Sakhare, A.S.; Parmar, B.; Yadav, B.K.; Bandumula, N.; Raihan, F.; et al. Salt Stress in Plants and Mitigation Approaches. Plants 2022, 11, 717. [Google Scholar] [CrossRef]
- Biofortification. Available online: http://irri.org/biofortification (accessed on 20 June 2022).
- Nestel, P.; Bouis, H.E.; Meenakshi, J.V.; Pfeiffer, P. Biofortification of staple food crops. J. Nutr. 2006, 136, 1064–1067. [Google Scholar] [CrossRef]
- Cakmak, I. Enrichment of cereal grains with zinc: Agronomic or genetic biofortification? Plant Soil. 2008, 302, 1–17. [Google Scholar] [CrossRef]
- Black, E.; Allen, L.H.; Bhutta, Z.A.; Caulfield, L.E.; Onis, M.; Ezzati, M. Maternal and child undernutrition: Global and regional exposures and health consequences. Lancet 2008, 371, 243–260. [Google Scholar] [CrossRef]
- Tan, Z.; Ma, G.; Lin, L.; Liu, C.; Liu, Y.; Jiang, J. Prevalence of subclinical vitamin A deficiency and its affecting factors in 8,669 children of China. Zhonghua Yu Fang Yi XueZaZhi 2002, 6, 161–163. [Google Scholar]
- Razzaq, A.; Tang, Y.; Qing, P. Towards Sustainable Diets: Understanding the Cognitive Mechanism of Consumer Acceptance of Biofortified Foods and the Role of Nutrition Information. Int. J. Environ. Res. Public Health 2021, 18, 1175. [Google Scholar] [CrossRef] [PubMed]
- Birol, E.; Meenakshi, J.V.; Oparinde, A.; Perez, S.; Tomlins, K. Developing country consumers’ acceptance of biofortified foods: A synthesis. Food Secur. 2015, 7, 555–568. [Google Scholar] [CrossRef] [Green Version]
- Babu, V.R. Importance and advantages of rice biofortification with iron and zinc. J. SAT 2013, 1, 1–11. [Google Scholar]
- Nirmala, B.; Babu, V.R.; Neeraja, C.N.; Waris, A.; Muthuraman, P.; Sanjeeva, R.D. Linking agriculture and nutrition: An ex-ante analysis of zinc biofortification of rice in India. Agric. Econ. Res. Rev. 2016, 29, 171–177. [Google Scholar] [CrossRef]
- Indian Institute of Rice Research Developed Technologies. Available online: https://www.icar-iirr.org/index.php/en/institute-research/institue-technologies-developed?id=141 (accessed on 8 June 2022).
- Xiangtian, M.; Yaying, L.; Yang, Z.; Huaiying, Y. Green manure application improves rice growth and urea nitrogen use efficiency assessed using N labeling. Soil Sci. Plant Nutr. 2019, 65, 511–518. [Google Scholar] [CrossRef]
- Amarpreet, S.; Yashbir, S.S. Effect of summer green manuring crops and zinc fertilizer sources on productivity, Zn-uptake and economics of basmati rice. J. Plant Nutr. 2016, 39, 204–218. [Google Scholar] [CrossRef]
- Borthakur, A.K.; Pandey, M.; Singh, K.; Tripathi, P.P. Effect of green manuring on growth, yield, economics of rice production and its influence on soil fertility status of East Kameng, Arunachal Pradesh. India J. AgriSearch 2018, 5, 34–36. [Google Scholar] [CrossRef]
- Becker, M.; Ladha, J.K.; Ali, M. Green manure technology: Potential, usage, and limitations. A case study for lowland rice. In Management of Biological Nitrogen Fixation for the Development of More Productive and Sustainable Agricultural Systems; Ladha, J.K., Peoples, M.B., Eds.; Springer: Dordrecht, The Netherlands, 1995; Volume 65. [Google Scholar] [CrossRef]
- Watanabe, M.; Sumita, Y.; Azechi, I.; Ito, K.; Noda, K. Production Costs and Benefits of Japonica Rice in Mwea, Kenya. Agriculture 2021, 11, 629. [Google Scholar] [CrossRef]
- Agricultural Statistics at a Glance; Directorate of Economics and Statistics, Ministry of Agriculture and Farmers Welfare, Government of India: New Delhi, India, 2021.
- Socio-Economic Outlook; Government of Telangana: Hyderabad, India, 2022.
- Leaf Color Chart. Available online: http://www.knowledgebank.irri.org/step-by-step-production/growth/soil-fertility/leaf-color-chart (accessed on 1 June 2022).
- Binh, T.N.; Erik, B. Impact Evaluation: Methodological and Operational Issues; Economic Analysis and Operations Support Division; Asian Development Bank.40.; Economics and Research Department: Metro Manila, Philippines, 2006. [Google Scholar]
- Abadie, A. Semiparametric difference-in-differences estimators. Rev. Econ. Stud. 2005, 72, 1–19. [Google Scholar] [CrossRef]
- Cao, Z. Difference-in-Difference and Instrumental Variables Approaches. In An Alternative and Complement to Propensity Score Matching in Estimating Treatment Effects; CER Issue Brief; CER Infrastructure: Craigieburn, Australia, 2011. [Google Scholar]
- Galiani, S.; Gertler, P.; Schargrodsky, E. Water for Life: The Impact of the Privatization of Water Services on Child Mortality. J. Political Econ. 2005, 113, 83–120. [Google Scholar] [CrossRef]
- Palanisami, K.; Ranganathan, C.; Sureshkumar, D.; Malik, R. Enhancing the crop yield through capacity building programs: Application of double difference method for evaluation of drip capacity building program in Tamil Nadu State, India. Agric. Sci. 2014, 5, 33–42. [Google Scholar] [CrossRef]
- McEwan, P.J. International Encyclopedia of Education, 3rd ed.; Academic Press: Oxford, UK, 2010. [Google Scholar]
- Fredriksson, A.; Oliveira, G.M.D. Impact evaluation using Difference-in-Differences. RAUSP Manag. J. 2019, 54, 519–532. [Google Scholar] [CrossRef]
- Coady, W.; Kosali, S.; Ricardo, A.; Bello, G. Designing differences in difference studies: Best practices for public health policy research. Annu. Rev. Public Health 2018, 39, 453–469. [Google Scholar]
- Tuti, M.D.; Papolu, M.K.; Sreedevi, B.; Bandumula, N.; Kuchi, S.; Bandeppa, S.; Saha, S.; Parmar, B.; Rathod, S.; Ondrasek, G.; et al. Sustainable Intensification of a Rice–Maize System through Conservation Agriculture to Enhance System Productivity in Southern India. Plants 2022, 11, 1229. [Google Scholar] [CrossRef]
- Pawan, K.S.; Pardeep, W.; Parveen, K.; Rakesh, S.; Rajbir, S.; Chahal, V.P. Economics of demonstrating wheat production technology under rain-fed ecosystems Agric. Econ. Res. Rev. 2020, 33, 109–118. [Google Scholar] [CrossRef]
- Sanjeeva, R.D.; Neeraja, C.N.; Madhu, B.P.; Nirmala, B.; Suman, K.; Rao, L.V.S.; Surekha, K.; Raghu, P.; Longvah, T.; Surendra, P.; et al. Zinc Biofortified Rice Varieties: Challenges, Possibilities, and Progress in India. Front. Nutr. 2020, 7, 26. [Google Scholar] [CrossRef]
- Nirmala, B.; Neeraja, C.N.; Amtul, W.; Sanjeeva, R.D.; Muthuraman, P. An economic analysis of biofortified rice varieties. Oryza Int. J. 2019, 56, 412–417. [Google Scholar]
- Dhaka, B.; Meena, B.S.; Suwalka, R.L. Popularization of improved maize production technology through frontline demonstrations insouth eastern Rajasthan. J. Agric. Sci. 2010, 1, 39–42. [Google Scholar] [CrossRef]
- Singh, D.P.; Chandra, V.; Tiwari, T. Impact Analysis of Front Line Demonstration on Rice (Oryza sativa L.) The Yield, Economics and Farmer’s Knowledge in Eastern Uttar Pradesh, India. Int. J. Curr. Microbiol. Appl. Sci. 2020, 10, 308–313. [Google Scholar]
- Sagar, R.L.; Chandra, G. Performance of Frontline Demonstration on Kharif rice (Oryza sativa L.) in Sundarban, West Bengal. J. Indian Soc. Coast. Agric. Res. 2003, 21, 69–70. [Google Scholar]
- Nirmala, B.; Amtul, W.; Muthuraman, P. Technology dissemination approaches for bridging rice yield gaps on small farms. Indian Res. J. Ext. Educ. 2016, 16, 128–133. [Google Scholar]
- Samanth, T.K. Evaluation of Front Line Demonstration on Drought Tolerant Rice (Oryza sativa L.) Variety Satyabhama in Mid Central Table Land Zone of Odisha. Int. J. Bio-Resour. Stress Manag. 2017, 8, 871–876. [Google Scholar] [CrossRef]
- Savic, R.; Stajic, M.; Blagojević, B.; Bezdan, A.; Vranesevic, M.; Nikolić Jokanović, V.; Baumgertel, A.; Bubalo Kovačić, M.; Horvatinec, J.; Ondrasek, G. Nitrogen and Phosphorus Concentrations and Their Ratios as Indicators of Water Quality and Eutrophication of the Hydro-System Danube–Tisza–Danube. Agriculture 2022, 12, 935. [Google Scholar] [CrossRef]
Figure 1.
Details of the demonstration sites.

Figure 2.
Schematic presentation of the Difference-in-Difference (DID) estimation.

Figure 3.
Box and whisker plots of rice productivity.


Table 1.
The difference in difference approach to estimate the difference in productivity.
| Particulars | Beneficiaries | Non-Beneficiaries | Difference Across Groups |
|---|---|---|---|
| Group I (Demonstrations) | B1 | C1 | B1 − C1 |
| Group II (Control) | B0 | C0 | B0 − C0 |
| Difference across time | B1- B0 | C1- C0 | (B1- B0) – (C1- C0) |
Table 2.
Details of demonstrations.
| Parameters | Conventional Practices | Demonstrations |
|---|---|---|
| Number of farms | 139 | 142 |
| Area (ha) | 0.82 | 0.62 |
| Rice variety | Telangana Sona | DRR Dhan 48 |
| Rice seed rate (kg/ha) | 75 | 50 |
| Integrated Nutrient Management | Green manure crops | |
| Leaf Color Charts (LCC) |
Table 3.
Socio-economic characteristics of the sample farmers.
| Particulars | Control | Demonstration | t-Value | p-Value |
|---|---|---|---|---|
| Age of the farmer (years) | 48.47 (±0.06) | 48.94 (±0.08) | −0.406 | 0.685 |
| Formal education of the farmer (years) | 2.43 (±0.03) | 3.42 (±0.03) | −1.867 | 0.063 |
| Family size (number) | 4.86 (±0.01) | 4.92 (±0.01) | −0.335 | 0.738 |
| Operational holding (ha) | 1.64 *** (±0.01) | 1.11 (±0.01) | 6.759 | 0 |
| Area under rice (ha) | 0.87 *** (±0.4) | 0.62 (0.00) | 4.590 | 0 |
*** Significant at 1% level.
Table 4.
A comparison of paddy productivity before and after the demonstrations.
| Particulars | 2020 | 2021 | Average of Two Years | |||
|---|---|---|---|---|---|---|
| Control Plots | Demonstration Plots | Control Plots | Demonstration Plots | Control Plots | Demonstration Plots | |
| Mean (t/ha) | 4.58 | 4.74 | 4.50 | 5.53 | 4.54 | 5.13 |
| Standard error | 0.006 | 0.006 | 0.008 | 0.006 | 0.006 | 0.004 |
| Skewness | −0.57 | −0.54 | −1.13 | −1.28 | −1.14 | −0.90 |
| Kurtosis | 0.29 | 0.12 | 0.89 | 0.95 | 1.72 | 0.86 |
| Minimum | 2.00 | 2.10 | 0.90 | 3.00 | 1.45 | 3.25 |
| Maximum | 6.00 | 6.00 | 7.00 | 7.00 | 6.40 | 6.15 |
| CV | 19.08 | 17.27 | 25.43 | 14.14 | 19.42 | 11.46 |
Table 5.
Independent two-sample t-test.
| F Test for Equality of Variances | t-Test for Equality of Means | |||
|---|---|---|---|---|
| F | Sig. | T | Sig. (Two-Tailed) | |
| Comparison of control plots yield with demonstration plots yield (2020) Equal variances assumed | 1.139 | 0.22 | −1.594 | 0.112 |
| Comparison of control plots yield with demonstration plots yield (2021) Unequal variance assumed | 2.143 | 0 | −8.763 | 0 |
Table 6.
A comparison of rice productivity at demonstration and control plots.
| Demonstration Plots Average Productivity | Control Plots Average Productivity | Yield Advantage over the Control (%) |
|---|---|---|
| 5.52 | 4.5 | 22.67 |
Table 7.
Difference-in-differences estimator.
| Variable | Coefficients | Standard Error | t-Value | Pr (>|t|) |
|---|---|---|---|---|
| Intercept | 5.724 | 0.234 | 24.447 | 0.000 *** |
| Treatment | 0.125 | 0.110 | 1.131 | 0.258 |
| Post | −0.067 | −0.067 | −0.637 | 0.524 |
| DID (Treat × Post) | 0.864 | 0.1489 | 5.806 | 0.000 *** |
| Age of the farmer | −0.006 | 0.004 | −1.649 | 0.099 |
| Formal education of the farmer | −0.028 | 0.008 | −3.190 | 0.001 ** |
| Family size | −0.101 | 0.025 | −3.934 | 0.000 *** |
| Operational holding | −0.038 | 0.030 | −1.241 | 0.215 |
| Average area under Rice | −0.050 | 0.058 | −0.860 | 0.390 |
| Adjusted R2 | 0.221 | |||
| F value | 20.91 | |||
| p-value | 0.000 |
Significance codes: 0 ‘***’ 0.001 ‘**’.
Table 8.
Economics of rice cultivation at control and demonstration plots in 2021.
| Parameter | Control Plots | Demonstration Plots |
|---|---|---|
| Total cost of inputs (INR/ha) | 68,171 | 60,632 |
| Yield (t/ha) | 4.5 | 5.52 |
| Gross Returns (INR/ha) | 95,000 | 115,072 |
| Net Returns (INR/ha) | 26,829 | 54,440 |
| B:C Ratio | 1.4 | 1.9 |
Publisher’s Note: MDPI stays neutral with regard to jurisdictional claims in published maps and institutional affiliations. |
© 2022 by the authors. Licensee MDPI, Basel, Switzerland. This article is an open access article distributed under the terms and conditions of the Creative Commons Attribution (CC BY) license (https://creativecommons.org/licenses/by/4.0/).
Share and Cite
MDPI and ACS Style
Bandumula, N.; Rathod, S.; Ondrasek, G.; Pillai, M.P.; Sundaram, R.M. An Economic Evaluation of Improved Rice Production Technology in Telangana State, India. Agriculture 2022, 12, 1387. https://doi.org/10.3390/agriculture12091387
AMA Style
Bandumula N, Rathod S, Ondrasek G, Pillai MP, Sundaram RM. An Economic Evaluation of Improved Rice Production Technology in Telangana State, India. Agriculture. 2022; 12(9):1387. https://doi.org/10.3390/agriculture12091387
Chicago/Turabian StyleBandumula, Nirmala, Santosha Rathod, Gabrijel Ondrasek, Muthuraman Pitchiah Pillai, and Raman Meenakshi Sundaram. 2022. "An Economic Evaluation of Improved Rice Production Technology in Telangana State, India" Agriculture 12, no. 9: 1387. https://doi.org/10.3390/agriculture12091387
Note that from the first issue of 2016, this journal uses article numbers instead of page numbers. See further details here.