Article

Predicting the Feed Intake of Cattle Based on Jaw Movement Using a Triaxial Accelerometer

1
Beijing Research Center for Information Technology in Agriculture, Beijing Academy of Agriculture and Forestry Sciences, Beijing 100097, China
2
National Engineering Research Center for Information Technology in Agriculture (NERCITA), Beijing 100097, China
3
Solway Online (Beijing) New Energy Technology Co., Ltd., Beijing 100191, China
*
Author to whom correspondence should be addressed.
Agriculture 2022, 12(7), 899; https://doi.org/10.3390/agriculture12070899
Submission received: 12 May 2022 / Revised: 15 June 2022 / Accepted: 17 June 2022 / Published: 21 June 2022

Abstract

:
The use of an accelerometer is considered as a promising method for the automatic measurement of the feeding behavior or feed intake of cattle, with great significance in facilitating daily management. To address further need for commercial use, an efficient classification algorithm at a low sample frequency is needed to reduce the amount of recorded data to increase the battery life of the monitoring device, and a high-precision model needs to be developed to predict feed intake on the basis of feeding behavior. Accelerograms for the jaw movement and feed intake of 13 mid-lactating cows were collected during feeding with a sampling frequency of 1 Hz at three different positions: the nasolabial levator muscle (P1), the right masseter muscle (P2), and the left lower lip muscle (P3). A behavior identification framework was developed to recognize jaw movements including ingesting, chewing and ingesting–chewing through extreme gradient boosting (XGB) integrated with the hidden Markov model solved by the Viterbi algorithm (HMM–Viterbi). Fourteen machine learning models were established and compared in order to predict feed intake rate through the accelerometer signals of recognized jaw movement activities. The developed behavior identification framework could effectively recognize different jaw movement activities with a precision of 99% at a window size of 10 s. The measured feed intake rate was 190 ± 89 g/min and could be predicted efficiently using the extra trees regressor (ETR), whose R2, RMSE, and NME were 0.97, 0.36 and 0.05, respectively. The three investigated monitoring sites may have affected the accuracy of feed intake prediction, but not behavior identification. P1 was recommended as the proper monitoring site, and the results of this study provide a reference for the further development of a wearable device equipped with accelerometers to measure feeding behavior and to predict feed intake.

1. Introduction

Changes in feeding behavior and feed intake are important indicators to help identifying the health and wellbeing of ruminants, and to understand the interaction between ruminants and their physiological state [1,2]. The reduced feeding time of dairy or beef cattle indicates intake deficiencies, and, in such cases, supplementary feeding is necessary. Cows with subclinical ketosis were shown to have lower dry matter intake and less ruminating time during the precalving period [3]. Dairy and beef cattle under hot or cold weather will change their feed intake and feeding behaviors to cope with environmental stresses and maintain their thermal balance [4]. Therefore, the automatic measurement of feeding behavior and feed intake is of great significance in facilitating daily management, such as providing supplementary feeding.
Cattle collect feed into their mouths and chew through the movement of the jaws. There are several devices on the market that measure feeding behavior. However, these devices can only measure primary behaviors such as feeding, lying, and walking, rather than types of activity including of jaw movements during feeding, such as ingesting (collecting feed into mouth), chewing, etc. The rhythmicity and timeline of jaw movement can be used to deduce the occurrence, duration and daily variation of feeding behaviors and, consequently, estimate cattle’s feed intake [2,5]. Therefore, various sensors have been developed using the rhythmic movement of the jaw to monitor the feeding behavior of ruminants in the past few years. For example, Zehner et al. [6] and Shen et al. [7] developed a system based on noseband pressure to measure the ruminating and eating behavior of cows. Navon et al. [8] developed a machine learning approach to automatically separate true jaw movement sounds from background noise and intense spurious noises. Other than pressure and acoustics sensing, accelerometry is the most promising and well-studied sensing method in the literature because of its commercial availability and low cost [9,10,11,12].
Initially, the accelerometer threshold or quadratic discriminant analysis (QDA) was established by analyzing the acceleration time series [13,14,15]. Then, machine learning methods were used to identify behaviors automatically, and tree models such as decision tree or random forest showed better performance in behavior recognition [16,17]. Furthermore, some deep learning methods were also developed [9,18]. However, a main challenge in accelerometer sensing is to reduce the amount of data while maintaining satisfactory accuracy to increase the battery life of the monitoring device in practical use [15]. Traditionally, acceleration signals were collected at around 10–30 Hz [15,19,20] for behavior classification. The battery life of monitoring devices can be improved two- or threefold when the sampling rate is reduced from 20 Hz to 1 Hz. An efficient classification algorithm at a low sample frequency needs to be developed to reduce the amount of recorded data for processing. Moreover, the position of the mounted sensor and aspects relating to the preprocessing method, such as window size, are important factors affecting the accuracy of behavior classification [21,22]. As shown by Riaboff et al. [22], a window size reduction from 30 s to 3 s would result in a decrease in accuracy of up to 9% in behavior identification. These factors should be considered when reducing the amount of data to obtain a combined strategy and improve the accuracy of behavior classification.
It was shown that jaw movements measured by accelerometers have a strong correlation with grass intake [13]; thus, feed intake can be estimated through the rhythmicity and timeline of jaw movement. Leiber [23] tried to estimate the feed intake of dairy cows fed total mixed diets using a linear mixed-effects model on the basis of feeding behaviors including rumination duration (24 h), feeding duration (24 h), rumination chews (per minute), and bodyweight. The results showed that feeding behavior measurements had potential for estimating feed intake, but the model revealed a low R2, which is not sufficient for quantitative estimations. Giovanetti [2] applied partial least square regression analysis (PLSR) to acceleration variables to predict the behavioral traits and herbage intake of sheep during short-term grazing. It showed a moderate precision (R2 = 0.71) to predict herbage intake, and the authors suggested the external validation of the derived models for better estimates in the future. As far as can be seen from the limited literature, the existing models are mainly traditional statistical models, and their precision is not satisfactory in predicting feed intake though feeding behavior. Efforts should be devoted to the automation of data analysis and the development of a high-precision prediction model to enable use at the commercial farm level.
Compared with traditional statistical models, machine learning is independent of the assumptions of data distribution and the description of limited mathematical formulae, allowing more effective use of the data and better precision. In this study, an integrated machine learning algorithm framework was derived and evaluated to identify jaw movement during feeding at a relatively low sampling frequency of the triaxial accelerometer, and to predict feed intake on the basis of the acceleration variables of ingesting and chewing activities. Moreover, possible monitoring sites and the window size effect in preprocessing were investigated and compared to assess their impact on jaw movement classification and feed intake prediction. The results of this study will contribute to the automatic recognition of feeding behaviors and feed intake modeling, and provide a reference for the appropriate installation position of a wearable device equipped with triaxial accelerometers.

2. Materials and Methods

2.1. Animals

This experiment was conducted on a commercial dairy farm in Beijing (China). Cows were housed in a naturally ventilated dairy barn with free access to outdoor open lots. Cows were fed three times per day with total mixed ration (TMR). Thirteen multiparous and mid-lactating Holstein cows were randomly selected to collect acceleration signals from during feeding time. The experimental cows were clinically healthy, all with a similar liveweight around 600 kg and an average milk production of approximately 26 kg milk/cow/day. The use of cows for data collection was approved through the Animal Experimental Ethical Inspection of NERCITA.

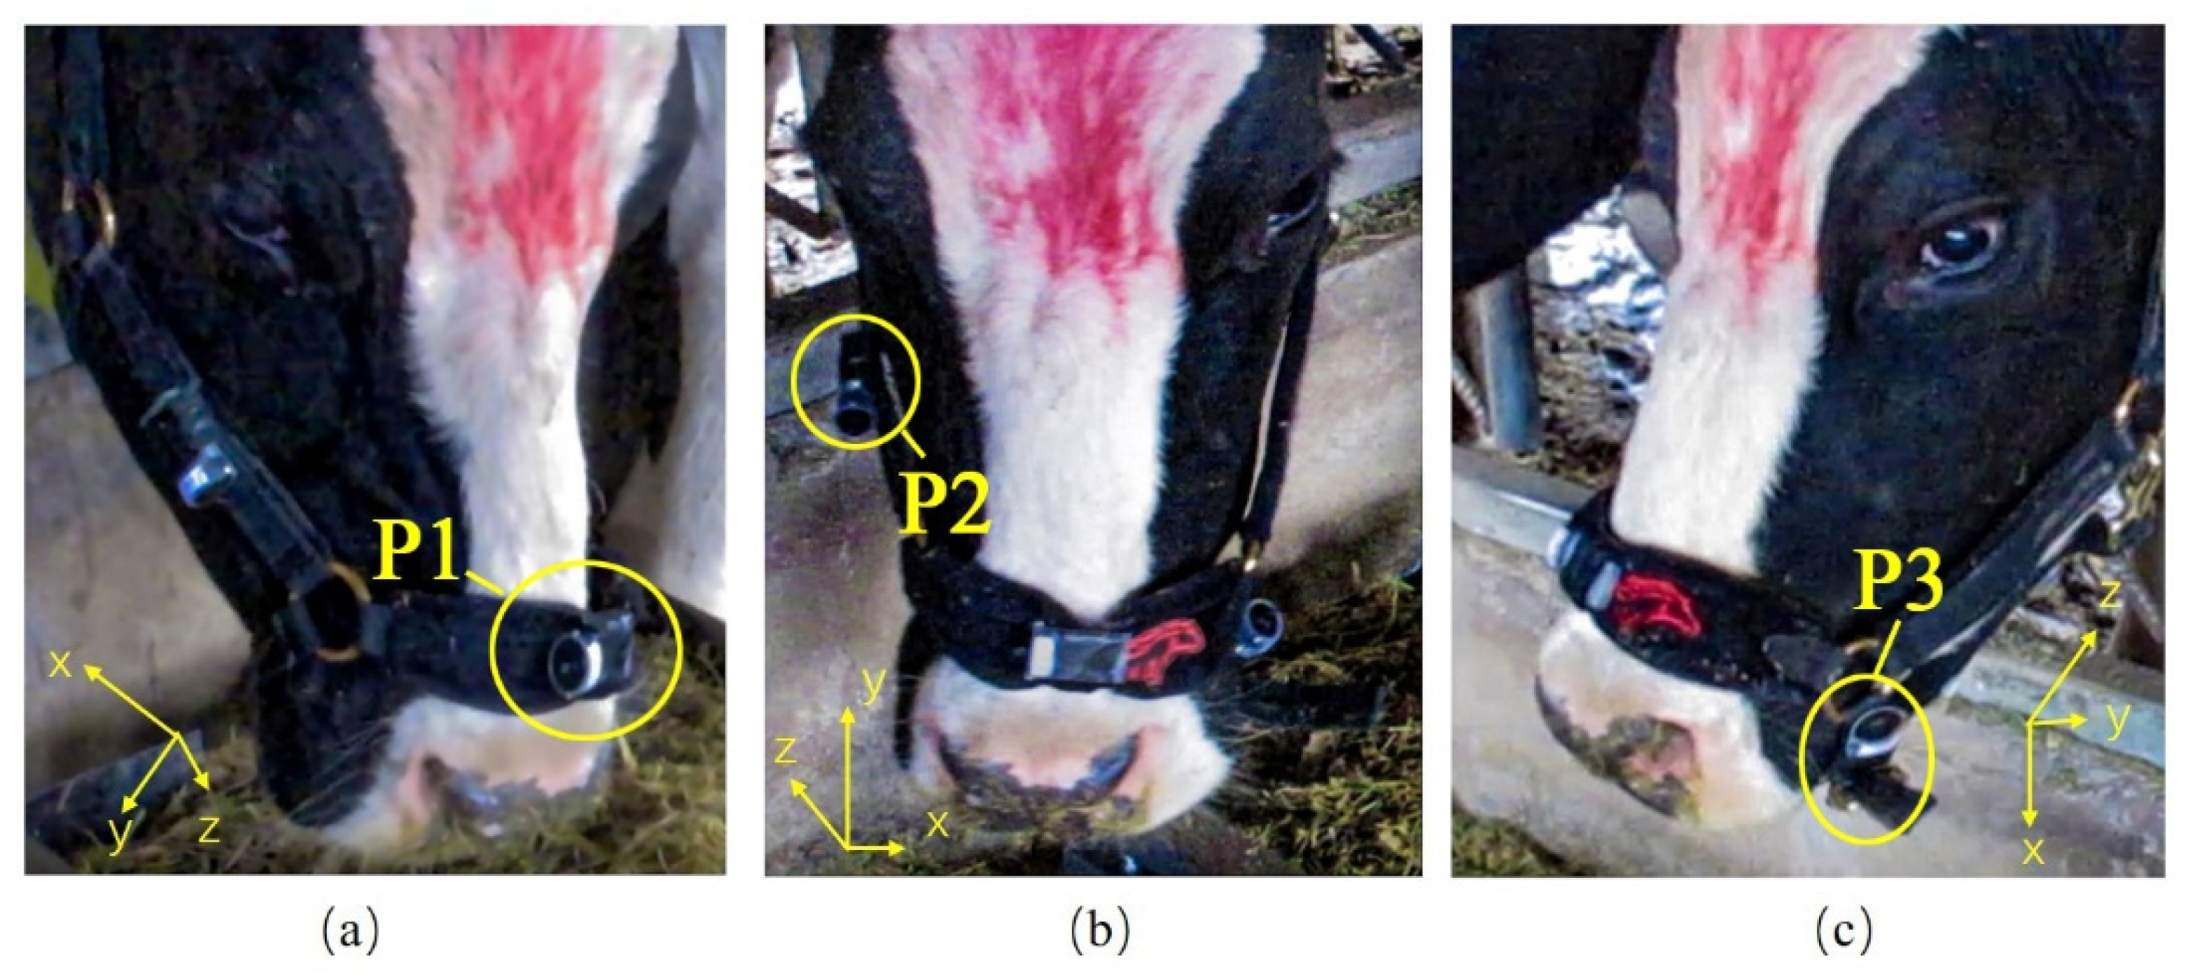
2.2. Data Collection

2.2.1. Accelerometer Signals during Feeding

Each candidate cow was equipped with a tightly adjusted halter and locked by neck-rail during feeding. Three mini triaxial accelerometers (UA-004-64, HOBO, the USA) were integrated into the halter to collect accelerations at 1 Hz (1 samples/s) simultaneously at three locations during feeding (Figure 1). The triaxial accelerometers were attached to the halter at the nasolabial levator muscle (P1), the right masseter muscle (P2), and the left lower lip muscle (P3), locations closely related to jaw movements during feeding. The accelerometers were 58.0 × 33.0 × 23.0 mm in size and weighed 18.0 g. The measurement range of the accelerometers was ±3 g (1 g = 9.8 m/s2), and the detecting accuracy was ±0.075 g.
The mini triaxial accelerometer measured dynamic acceleration along three orthogonal axes (X, Y, and Z) and the sum of the X, Y, and Z vectors (orientation-independent). The X-axis detected the backward–forward direction, the Y-axis detected the up–down direction, and the Z-axis detected the left–right direction. Figure 1 shows the orientations of the X-, Y-, and Z-axes for P1, P2, and P3.

2.2.2. Visual Observation of Jaw Movements

Feeding behaviors and jaw movements were recorded using two cameras (ixus285HS, Canon, Tokyo, Japan) from 60° and 120° front views opposite to the candidate cow when the accelerometer signals were sampled. Video images were 1080p and had an effective number of pixels of 2,200,000. On the basis of jaw movements, the activities related to the feeding behavior of a cow can be defined as ingesting, chewing, ingesting–chewing, and other [24]. Ingesting–chewing is a secondary behavior to ingesting and chewing, whereby these two behaviors occur at the same time, and it was first identified by acoustic techniques [8].
Each cow was recorded to ensure at least 10 min of valid data while feeding behaviors continuously occurred, and measurements were repeated three times in a 1 week sampling period. The clock on the video camera was synchronized with the clock on the accelerometer at the start of each sampling. Jaw movement activities in the video were manually observed and marked by a trained observer, which acted as a reference for automatic behavior identification with acceleration signals.

2.2.3. Feed Intake Rate during Measurement

Feed was continuously weighed and automatically recorded for each experimental cow using a balance with an accuracy of ±5 g. The weight of feed decreased progressively as the intake of the experimental cow and feed intake rate was calculated according to the weight of feed over time. Similarly, the clock on the balance was synchronized with the clock on the accelerometer at the start of each sampling.

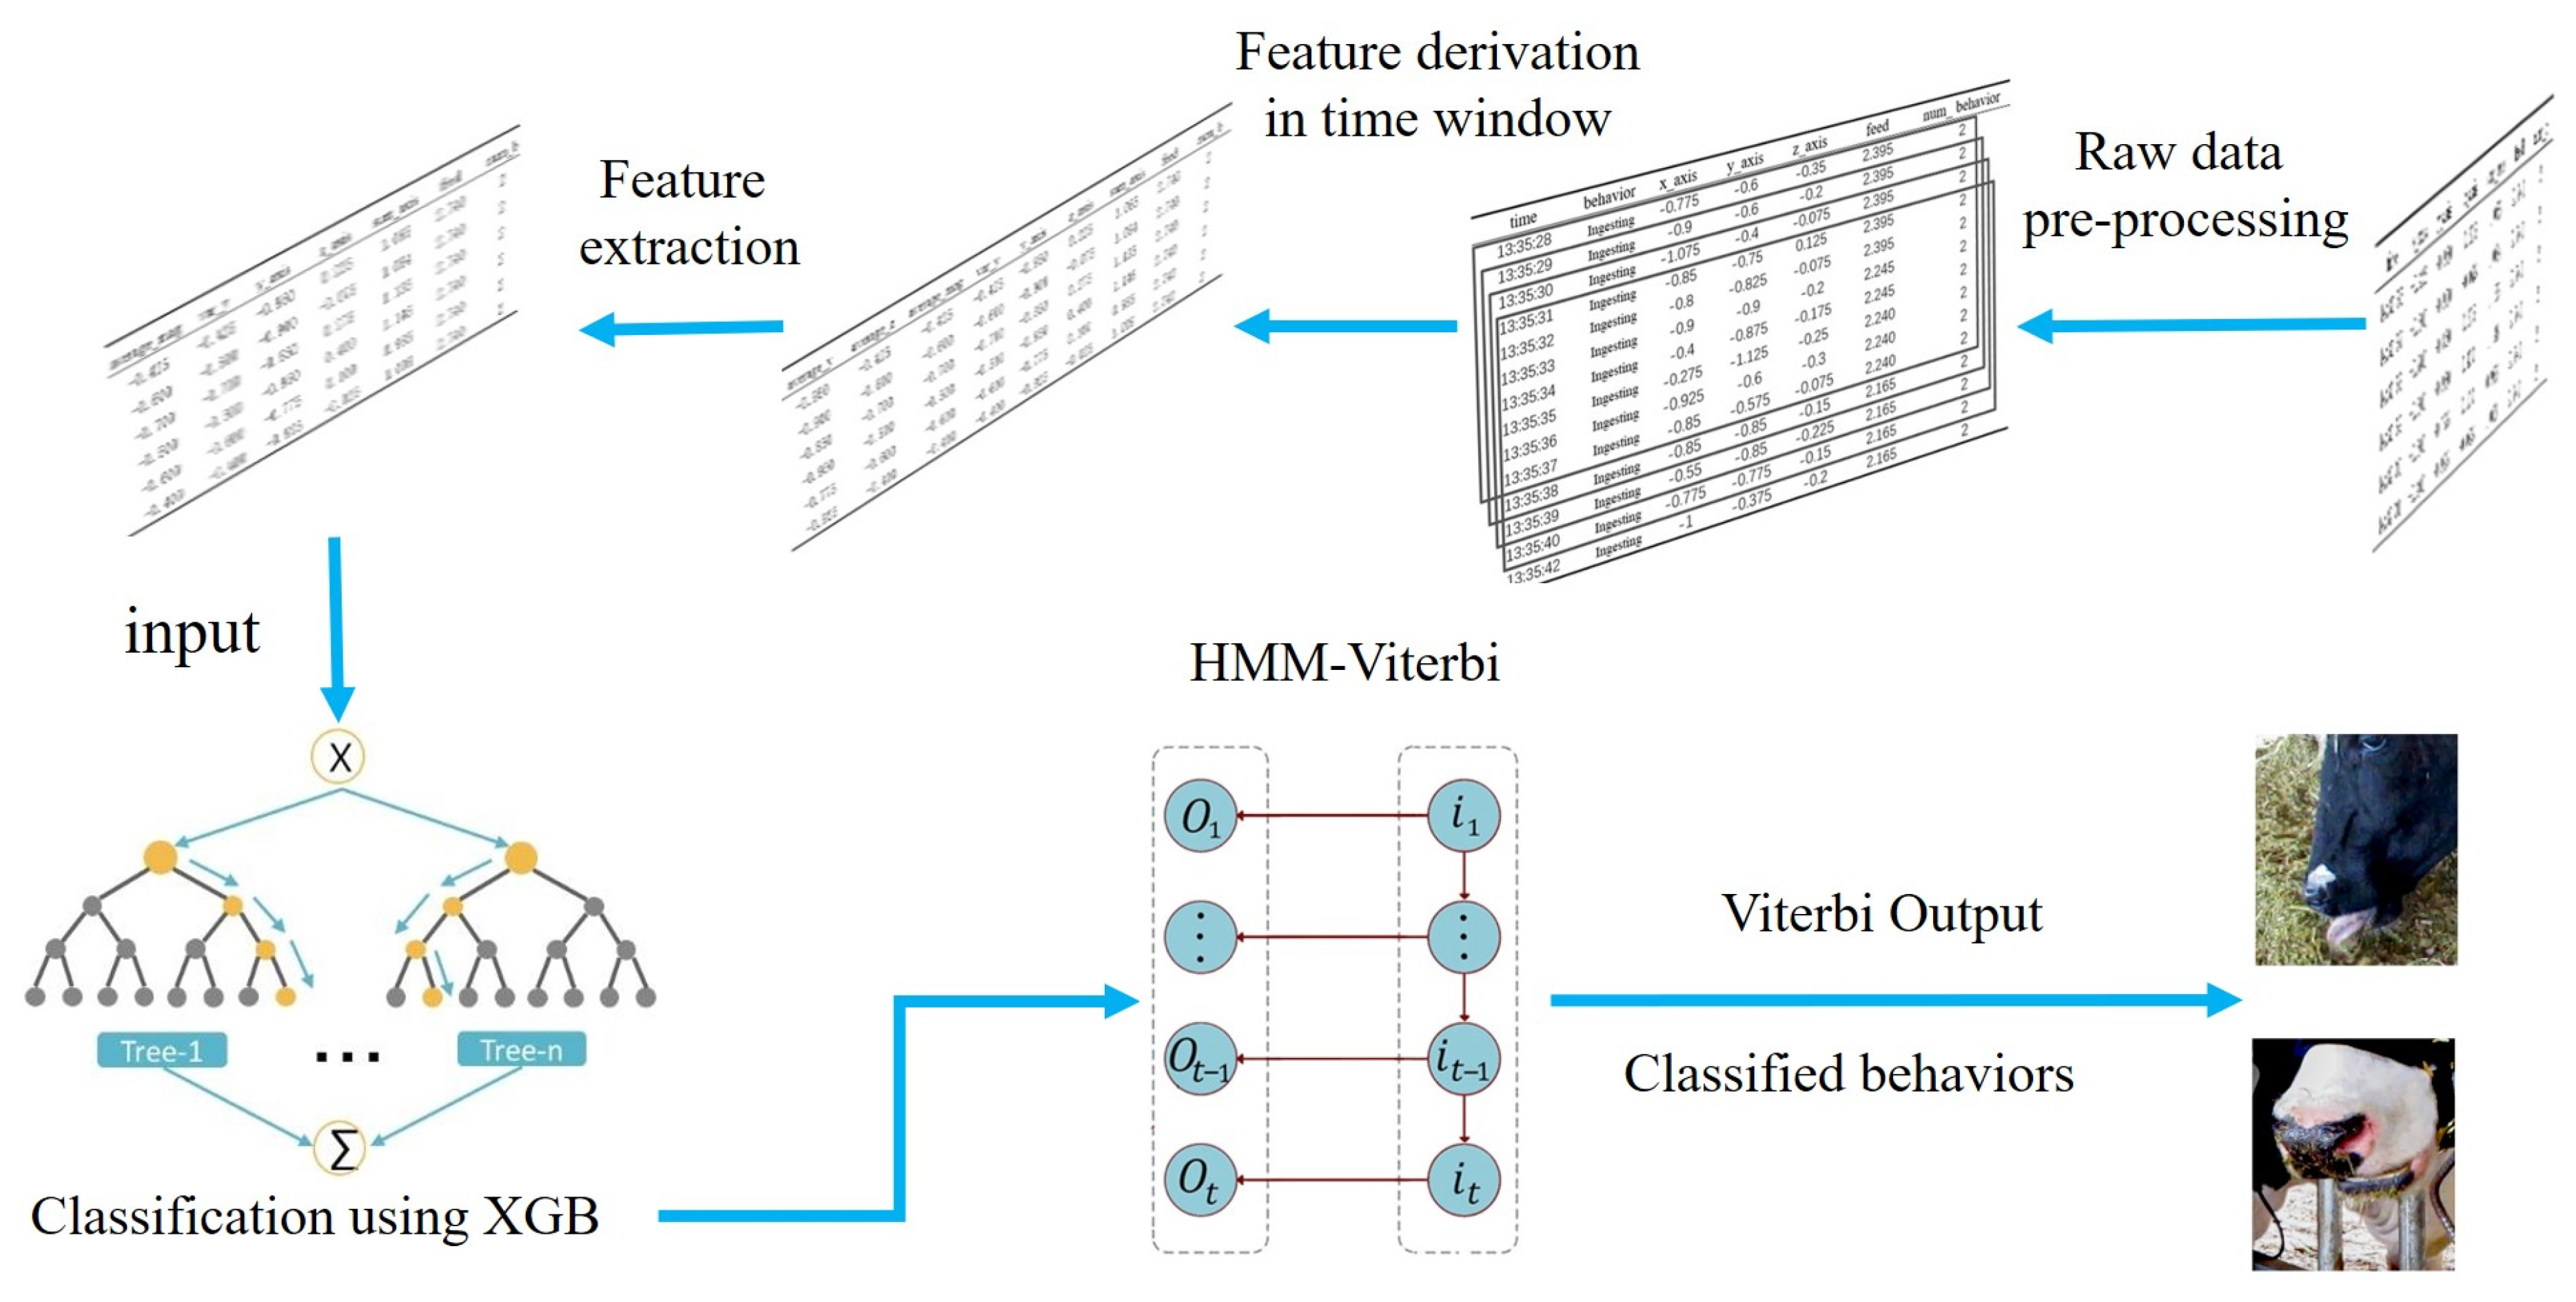
2.3. Data Processing of Raw Accelerometer Signal

The raw data of the accelerometer were preprocessed, aiming to provide suitable datasets and to extract features for subsequent analysis and algorithm application. Signal filtering was the first step applied to the raw data of the accelerometer to remove some data frequencies associated with noise [22]. A low-pass filter and high-pass filter are commonly used for the signal filtering of triaxial accelerometer signals [22,25,26]. However, the method of preprocessing the accelerometer signal ought to be adapted according to the aim and application situation, as suggested by [22]. Previously, the authors investigated different preprocessing methods and found that the continuous wavelet transform (CWT) was more appropriate for denoising the accelerometer signals sampled from jaw movements. Thus, the CWT was applied to the original accelerometer signal, and the raw data consisted of the date, the time, and the related impulse in the X-, Y-, and Z-dimensions, as well as the sum of triaxial vectors after denoising. Then, the signal was split into different windows of the same size, i.e., behavior sequence segmentation. The sliding window algorithm was used for behavior sequence segmentation, and different window sizes could be applied.

2.4. Feature Extraction

With an appropriate window size, 55 features were computed from the raw signals of the X-axis (ax), Y-axis (ay), Z-axis (az), and sum of triaxial vectors (amag) after preprocessing. Features were extracted from the X-axis, Y-axis, Z-axis, and sum of triaxial vectors, including commonly used features such as mean, median, variance, standard deviation, minimum, maximum, quartile, and range [27]. Furthermore, the average intensity for the sum of triaxial vectors, the movement variation, and the signal magnitude area between each axis were considered. Table 1 lists the calculated features used in this study.
Feature extraction can screen out significant features and discard nonsignificant features with respect to behavior classification. This is helpful for dimension reduction and saving computing resources. The filter, wrapper, and embedded methods are frequently used for feature extraction, and the embedded method has the advantages of a better effect and fast speed [28]. In the embedded method, machine learning algorithms or models are first used for training to obtain the weight coefficients of each feature, and then the features are selected according to the magnitude of the coefficient [29]. In this study, the embedded method was adopted, and the extra trees classifier algorithm was used for feature extraction. After performing the extra trees classifier, features with an importance greater than the mean value were selected, and Pearson correlation analysis was performed to remove the selected features that were perfectly correlated.

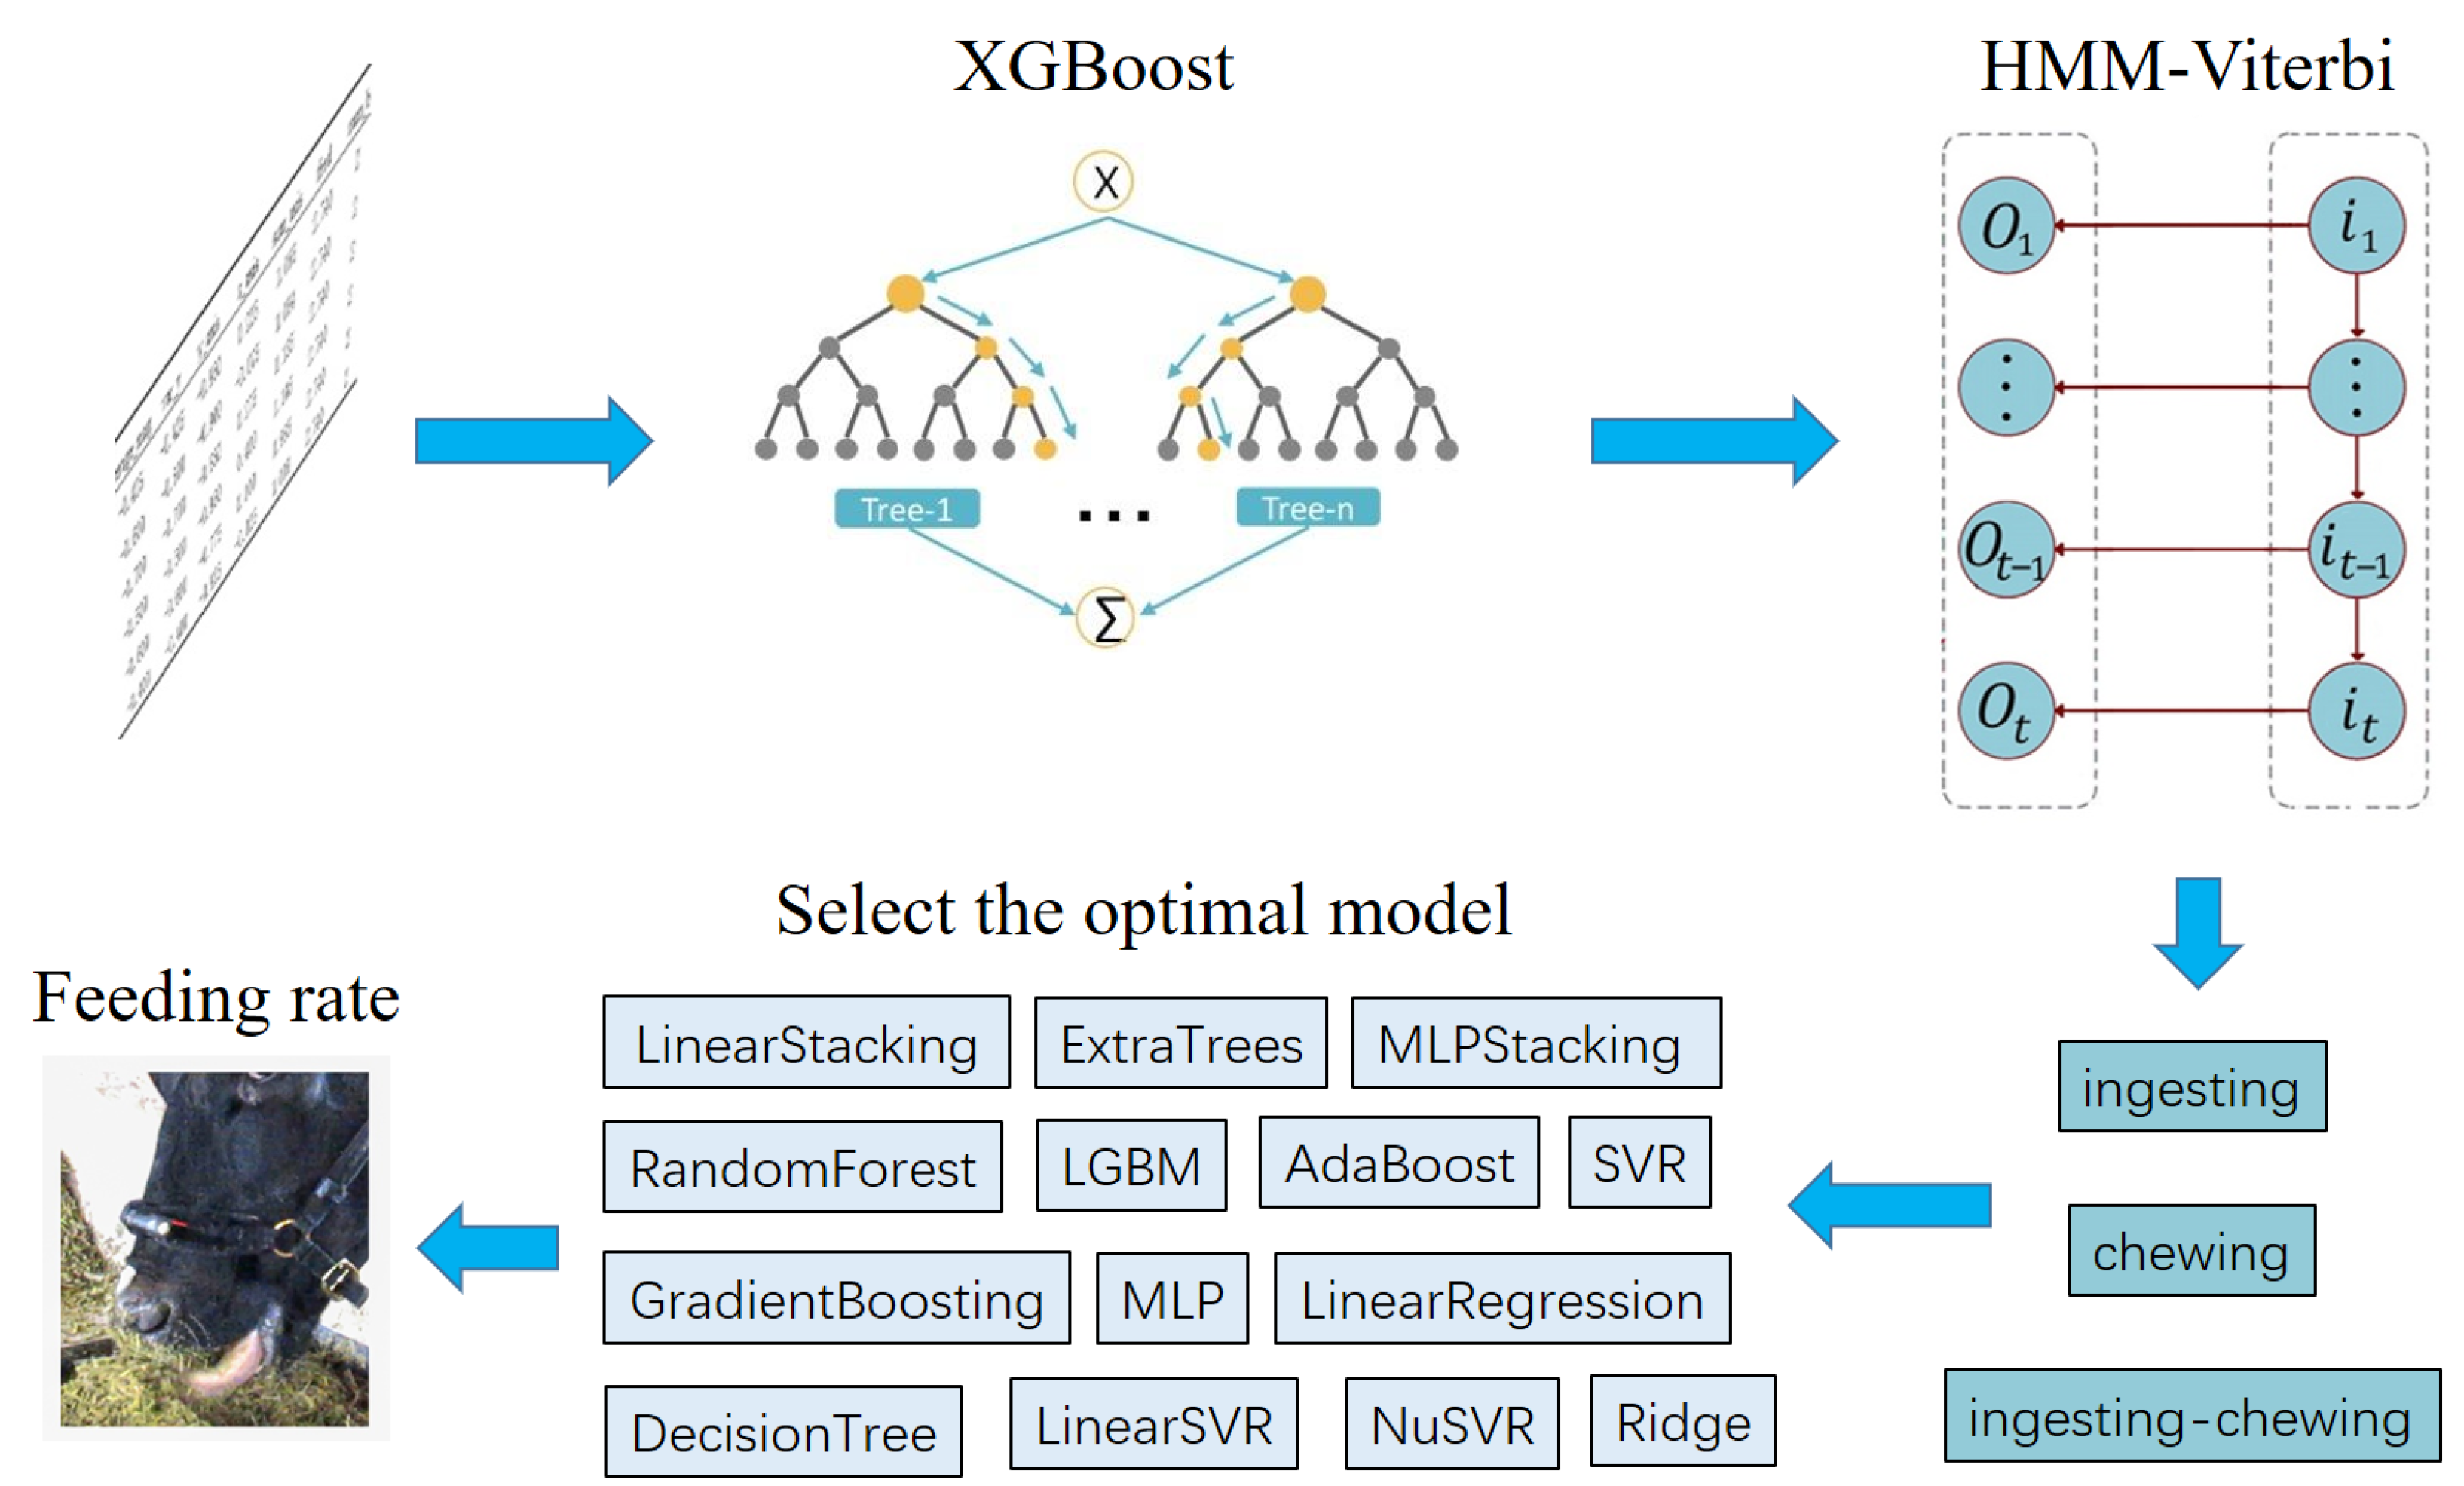
2.5. Activity Classification

Defined as ingesting, chewing, ingesting–chewing, and other, models for classifying different activities during feeding were developed using the supervised machine learning algorithms with the extracted features of accelerometer signals. The extreme gradient boosting (XGB) algorithm was adopted in this study for behavior classification, and the results were further corrected using the hidden Markov model solved by the Viterbi algorithm (HMM–Viterbi). The XGB and HMM–Viterbi algorithms were applied using the xgboost and sklearn packages in python software. The complete dataset of different window sizes was split into two independent datasets. Of the observation sequences, 70% were randomly chosen to train the models, and the remaining observation sequences were used to evaluate the performance of the developed model in behavior classification.
The XGB algorithm is an improved algorithm based on the gradient boosting decision tree, which assigns greater weight to the data with error prediction, increases the attention paid to error samples, constructs boosted trees efficiently, and operates in parallel [30]. This particular method was chosen due to its satisfactory results in machine learning competitions and was successfully used in other studies to predict the main behaviors of dairy cows using accelerometer data [27,31]. A classification and regression tree (CART) was the base classifier used for XGB in this study. Hyperparameters such as max_depth, min_child_weight, colsample_bytree, and gamma in the XGB algorithm were tuned to fit the model.
The four different activities of jaw movements were discrete, sequential, relevant, and periodically recurring, which is similar to the characteristics of Markov chains (irreducibility, recurrency, periodicity, and ergodicity) [32]. Hence, the HMM model was used to modify the probabilistic discrete digraph models in which the hidden states were the true activities in t time ( i t ), and the observable states were the activities predicted by the XGB algorithm in t time ( O t ). The state transition probability matrix and observation probability matrix are the key components in solving the HMM model. The maximum likelihood estimation (MLE) method was used to estimate the above probability matrix. The state transition probability matrix of activities was constructed by computing the probability of each behavior transitioning to all types of behavior in the hidden state sequence, while the observation probability matrix was constructed by computing the probability of each hidden state i t transitioning to the observed state O t for each type of behavior. For a specific observation sequence   O t output by the XGB algorithm and the given HMM model, the potential hidden state i t (the true behavior sequence in t time) could be found using the Viterbi algorithm.
The framework of activity classification for jaw movements is shown in Figure 2. As mentioned previously, the window size in feature derivation highly affects the accuracy of behavior identification. A proper window size in processing the accelerometer signal ought to be explored and adapted in the classification. The window sizes of 3 s, 5 s, 7 s, and 10 s have been frequently used in analyzing animal behavior through accelerometry [15,22]. Thus, the effects of window sizes of 3 s, 5 s, 7 s, and 10 s were evaluated in this study to find the proper window size for activity identification.

2.6. Prediction of Feed Intake Rate

Theoretically, the decrease in feed weight is mainly related to behaviors marked as ingesting and ingesting–chewing. Thus, these two related behaviors were screened out to predict feed intake rate. The selected features of ingesting and ingesting–chewing, computed from the raw signal of the accelerometer, were adopted as the input to compare the effect of different models in predicting feed intake rate (Figure 3). These models included 12 commonly used regression models in sklearn of Python and two stacking models. The 12 regression models were linear regression (LR), decision tree regressor (DTR), gradient boosting regressor (GBR), multilayer perceptron regressor (MLPR), AdaBoost regressor (ABR), extra trees regressor (ETR), linear support vector regressor (LSVR), Nu support vector regressor (NuSVR), support vector regressor (SVR), random forest regressor (RFR) and L2 regularized linear regression (Ridge). The two stacking models adopted the outputs of the above 12 models as inputs to the linear model or MLP model to predict feed intake rate, denoted as linear stacking regressor (LStack) and MLP stacking regressor (MLPStack), respectively.
Stacking is an integration approach for ensemble learning in machine learning. Its aim is to achieve better performance by combining the bias and/or variance of weak learners to create a “strong learner” (or “integration model”) [33]. Yang Peng established a convert channel detection method for the domain name server (DNS) using the stacking model, and the results showed that it was superior to the existing detection methods, with an area under the curve (AUC) of 0.9901 [34]. In this study, the linear model and MLP model were tested as the meta-model to integrate the 12 regression models to obtain the final prediction. The complete dataset was split into two independent datasets for modeling training or validation, and the datasets for training were split again into two parts to train the stacking model, combined with fivefold cross-validation (Figure 4).

2.7. Evaluation of the Models for Behavior Classification and Feed Intake Prediction

2.7.1. Evaluation of Behavior Classification

As mentioned above, the XGB algorithm integrated with the HMM-based Viterbi algorithm was applied for identifying ingestion activities. In this study, accuracy, precision, sensitivity, specificity, recall, and F1-score were calculated to evaluate the performance of the developed model [14,35].
Accuracy = T P + T N T P + F N + F P + T N ,
Precision = T P T P + F P ,
Sensitivity = T P T P + F N ,
Specificity = T N T N + F P ,
Recall = T P T P + F N ,
F 1 score = 2 × Accuracy × Recall Accuracy + Recall ,
where TP is true positive, referring to the number of instances where the interested behavior was correctly identified, FN is false negative, referring to the number of instances where the interested behavior was incorrectly identified as another behavior, TN is true negative, where the interested behavior was correctly identified as not being observed, and FP is false positive, referring to the number of instances where the behavior of interest was incorrectly identified as not being observed. The F1-score is a value between 0.00 and 1.00, which can be interpreted as a weighted average of accuracy and recall. The F1-score reaches the best value at 1 and the worst value at 0.

2.7.2. Evaluation of Feed Intake Prediction

The coefficient of determination (R2), root-mean-square error (RMSE), and normalized mean error (NME) were adopted to evaluate the model performance in predicting feed intake rate. A higher R2 and a lower RMSE or NME indicate better model fitting. In addition to R2, RMSE, and NME, computation time (CT) was compared to evaluate the prediction models.
R 2 ( y , y ^ ) = 1 Σ k = 1 n ( y i y ^ i ) 2 Σ k = 1 n ( y i y ¯ ) 2 ,
R M S E = 1 n i = 1 n ( y ^ i y i ) 2 ,
N M E = Σ i = 1 n | y i y ^ i | Σ i = 1 n | y i | ,
where y i , y ^ i ,   and   y ¯ are the observation, prediction, and mean of observations, respectively, and n is the sample size.

3. Results and Discussion

3.1. Observed Behavior and Feed Intake Rate

A total of 25,430 behavior sequences were observed through a video camera at a frequency of 1 Hz, corresponding to the collection frequency of accelerometer signals for 13 cows. The proportion of available behavior sequences at 1 Hz was 20.6% for ingesting, 30.2% for chewing, 4.9% for ingesting–chewing, and 44.3% for other. Meanwhile, the collected accelerometer signals for jaw movements were 0.0298 ± 0.7005 g, 0.2703 ±0.6388 g, and 0.0796 ± 0.6561 g for ingesting, chewing, and ingesting–chewing. As for different monitoring sites, the collected accelerometer signals at P1 were −0.2325 ± 0.2551 g in the X-axis, −0.2047 ± 0.7771 g in the Y-axis, and 0.1209 ± 0.5085 g in the Z-axis. They were −0.1283 ± 0.5368 g in the X-axis, −0.6317 ± 0.6832 g in the Y-axis, and −0.0451 ± 0.1423 g in the Z-axis for P2, and 0.6729 ± 0.1772 g in the X-axis, −0.4335 ± 0.2151 g in the Y-axis, and −0.5951 ± 0.1380 g in the Z-axis for P3. Table 2 shows the measured feed intake rates of different experimental cows. Different cows showed varied feed intake rates, with an average feed intake rate of 190 ± 89 g/min.

3.2. Jaw Movement Identification

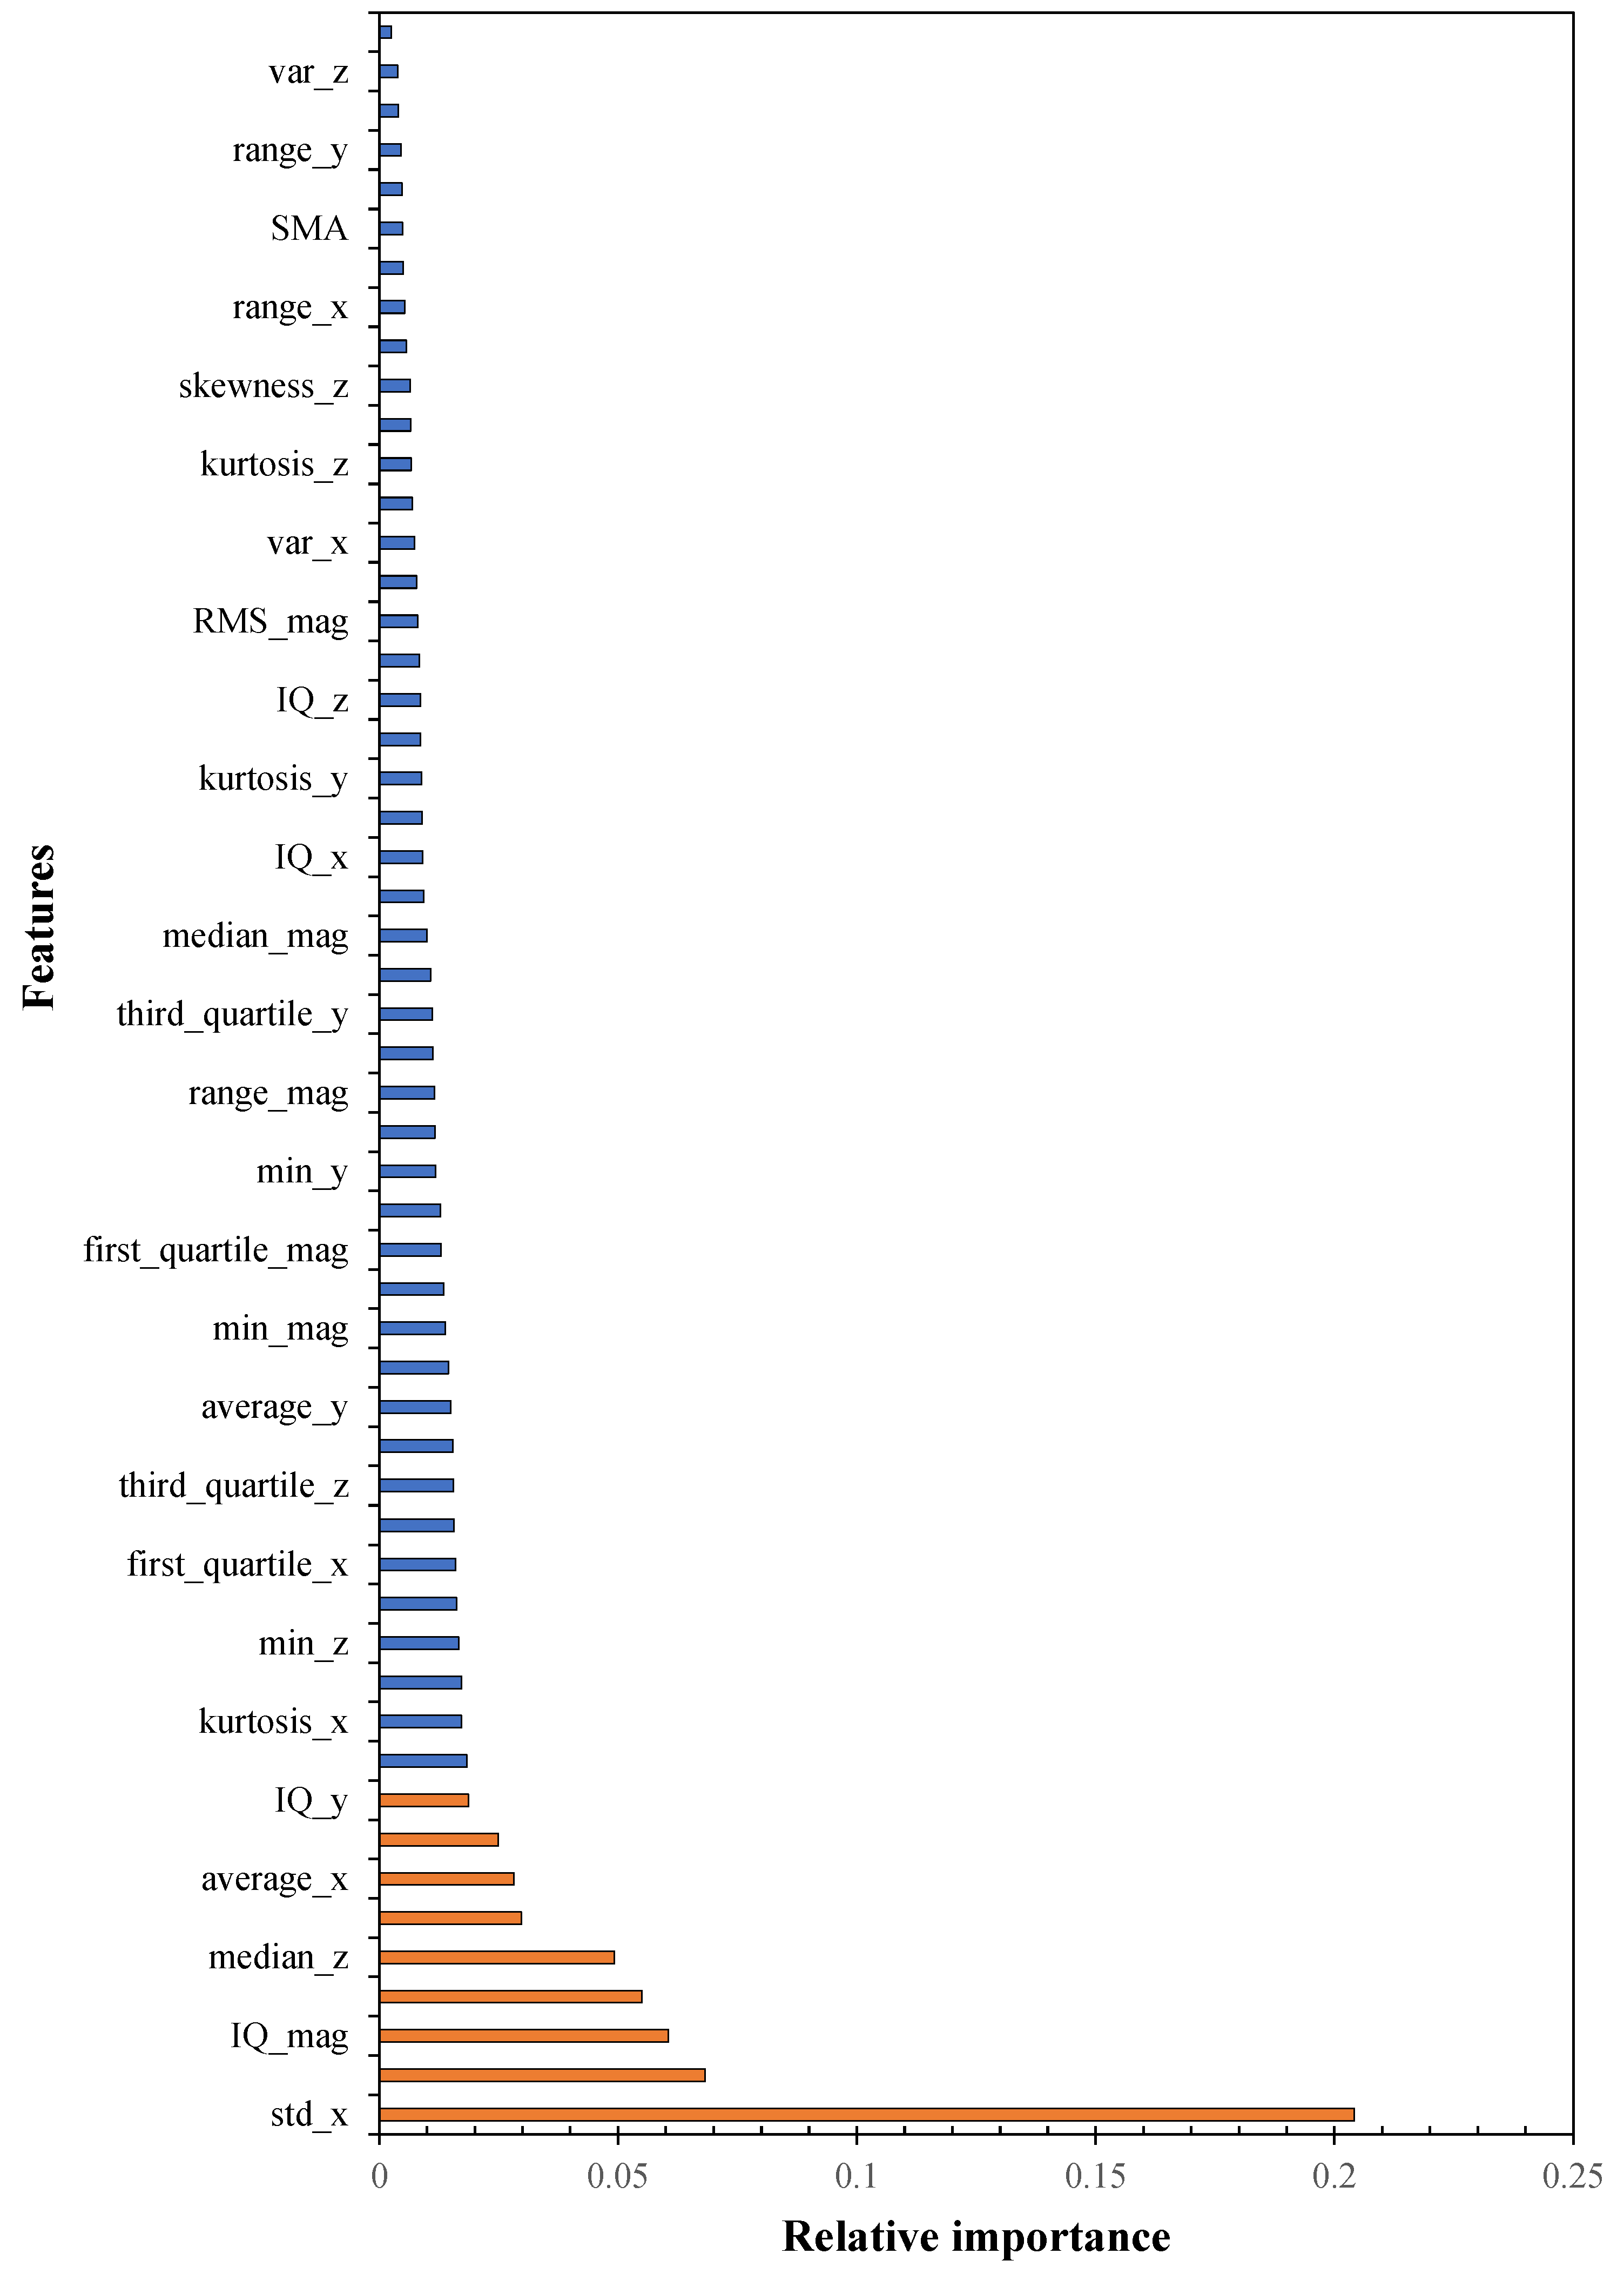
3.2.1. Importance of Features

Fifty-five computed features were investigated to explore which features might be the most valuable to machine learning analysis through the extra trees classifier. Figure 5 shows the relative importance of these 55 features. The nine most important features were the standard deviation of the X-axis, the first quartile of the Z-axis, the IQ of the sum of triaxial vectors, the RMS of the median of the X-axis, the median of the Z-axis, MV, the mean of the X-axis, the median of the Y-axis, and the IQ of the Y-axis. Afterward, Pearson correlation analysis was applied to the nine most important features, which demonstrated a perfect correlation between the median and first quartile of the Z-axis (r = 0.99). Hence, the first quartile of the Z-axis was removed, and the remaining top eight important features were kept as the inputs of the machine learning algorithms for behavior classification and feed intake prediction.

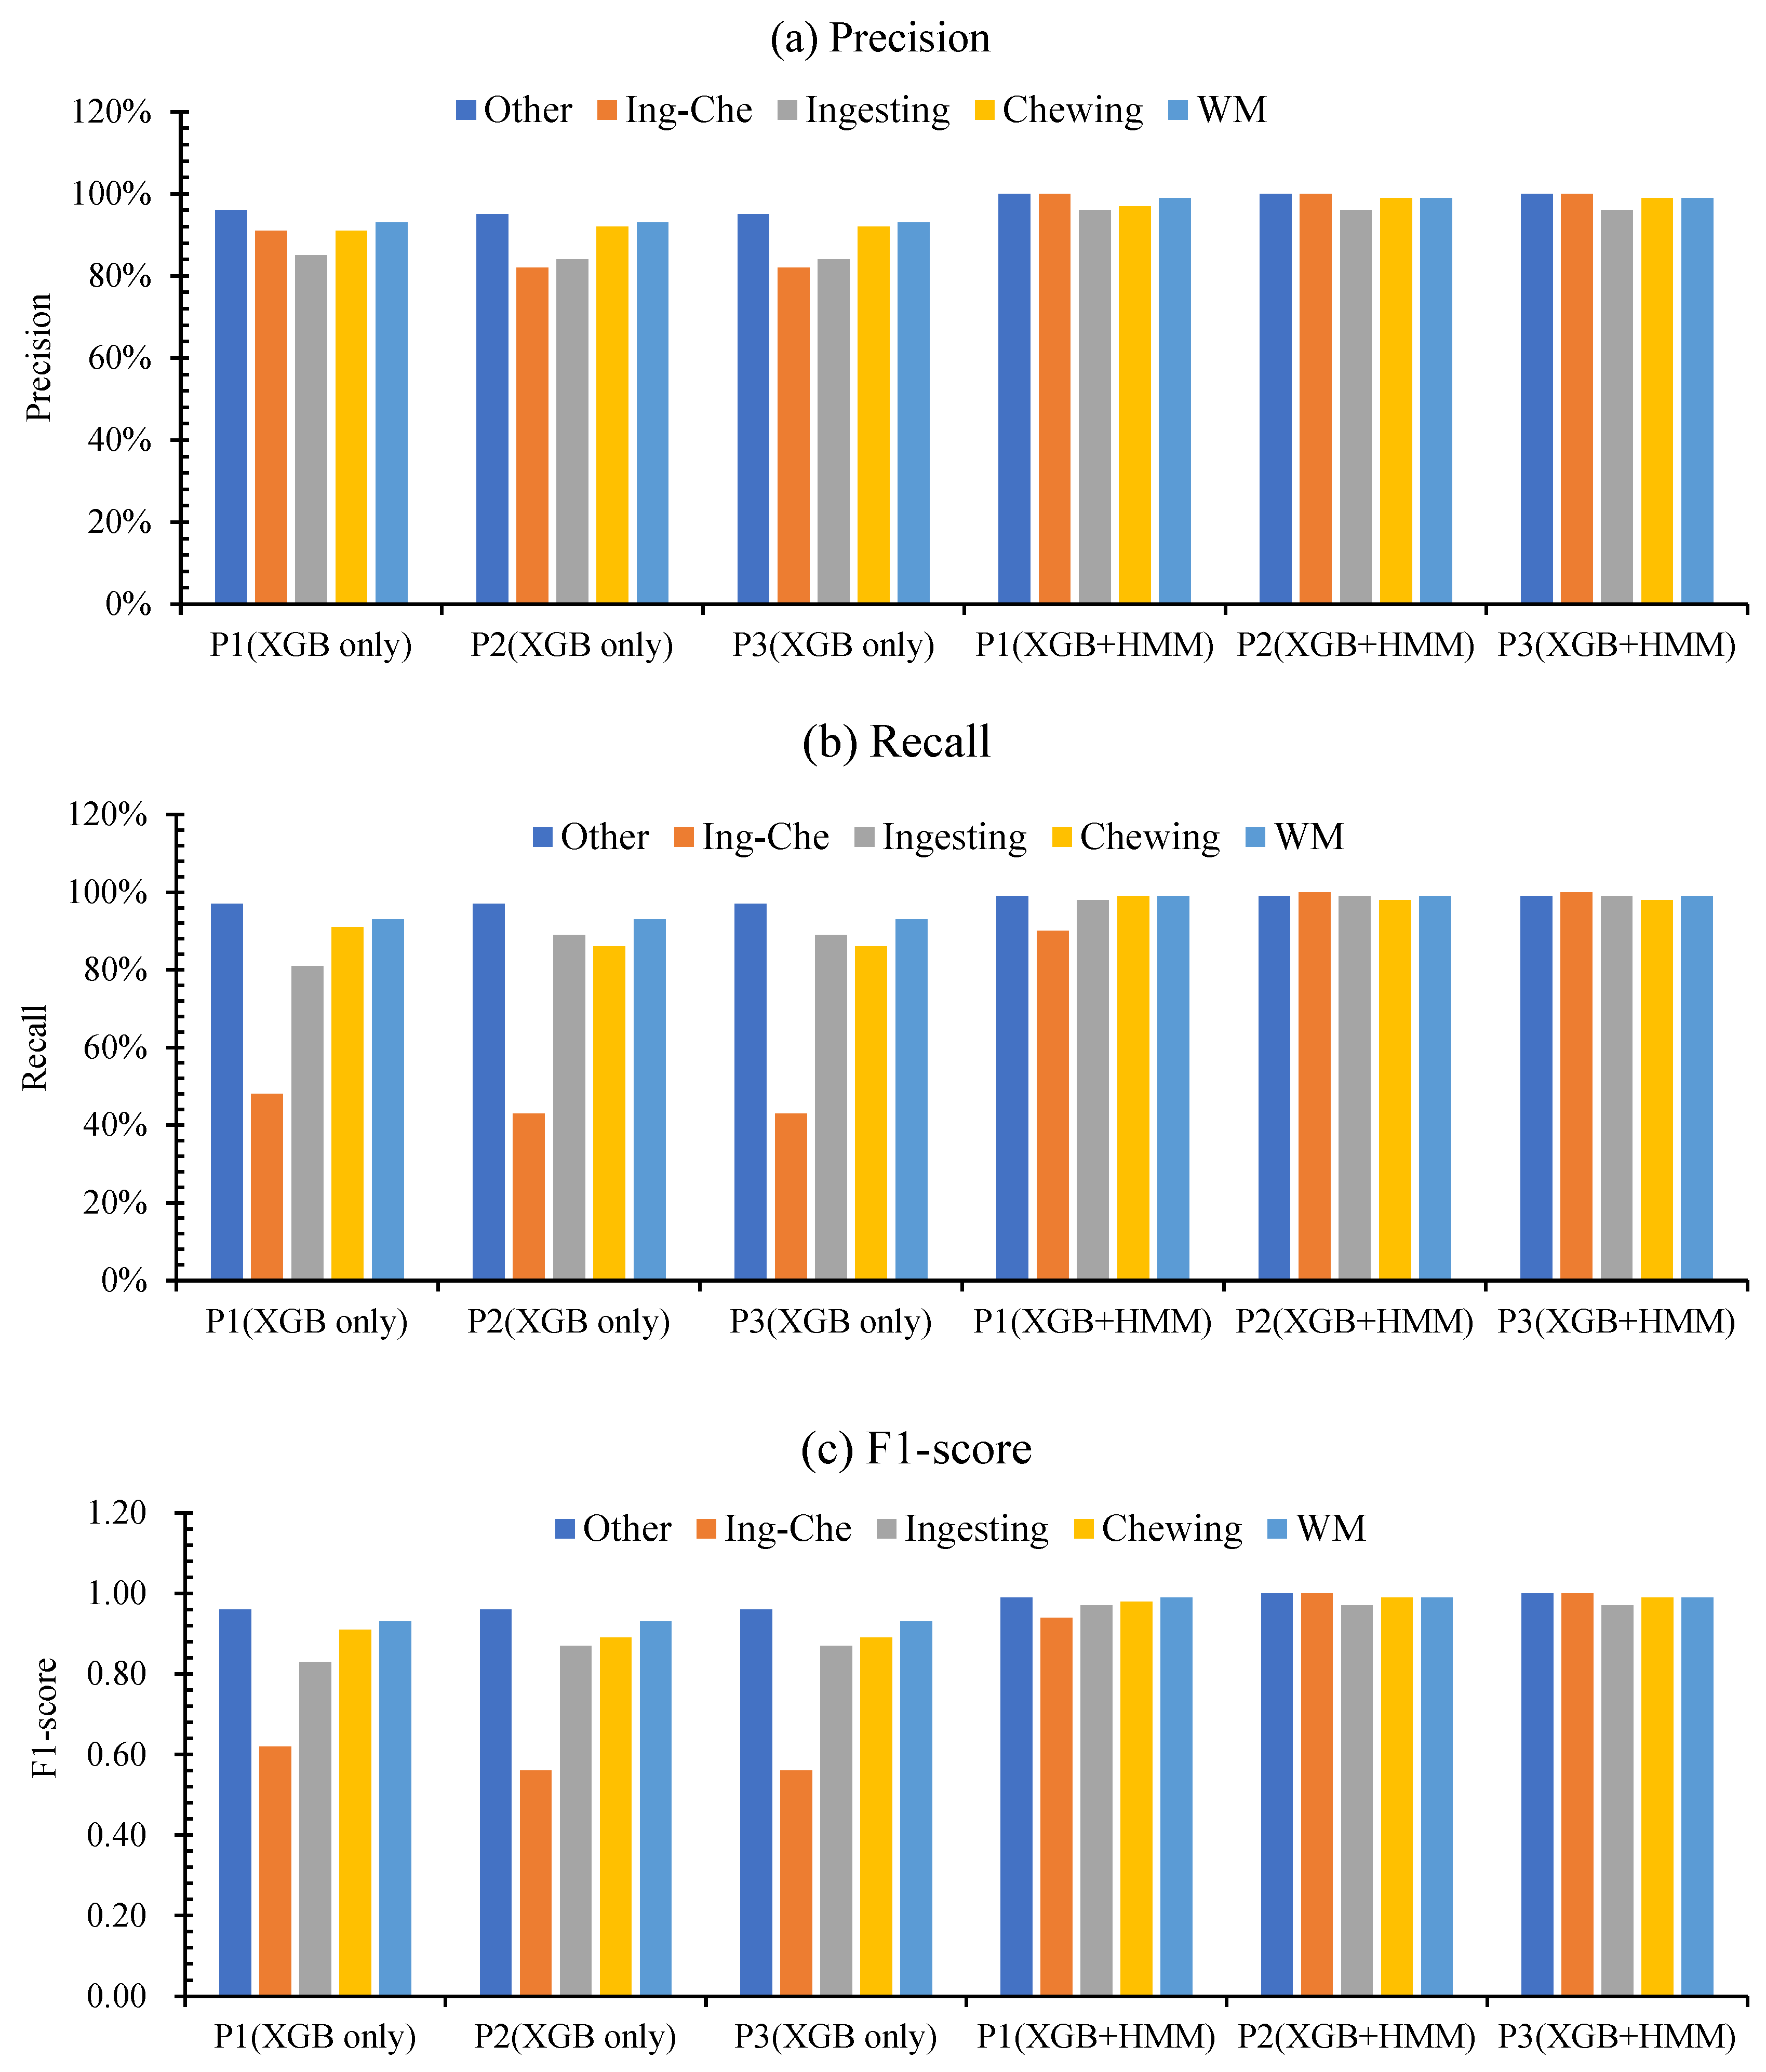
3.2.2. Classification of Jaw Movement Activities

Hyperparameters in the XGB algorithm were adjusted to fit the model, and CART was used as the basic classifier. The number of decisions was 100, and the maximum depth of the tree was 17. When training each tree, the ratio of used features to all features was 0.8, and the weight of controlling each iteration was 0.3. The multiclassification softmax function was adopted as the objective function, and 0.1 was set as the drop in the minimum loss function required for node splitting. Figure 6 shows the computed state transition probability of each behavior transitioning to all types of behavior that were adopted in the HMM–Viterbi algorithm for activity classification.
The performance of the developed model is shown in Table 3 for when the monitoring site was at P1 and the window size was 10 s. Although the harmonic mean of precision was 0.93 at different window sizes, the false positive rate of ingesting–chewing was rather high when only the XGB algorithm was performed. This resulted in a low recall and F1-score, especially for the ingesting–chewing activity. For example, the precision, recall, and F1-score were 0.82, 0.43, and 0.56 when identifying ingesting–chewing activity, respectively. Meanwhile, these scores were 0.84–0.95, 0.86–0.97, and 0.87–0.96 when identifying the remaining activities.
As shown in Table 3, the performance of the classification model was greatly enhanced after using the HMM–Viterbi algorithm to perform an observation state correction. The precision, recall, and F1-score were increased to 0.96–1.00, 0.98–1.00, and 0.97–1.00, respectively, when identifying the four activity categories using XGB and the HMM–Viterbi algorithm at a window size of 10 s. Similar results can be seen when the monitoring site was at P2 and P3. This suggests that the behaviors induced by jaw movements during feeding can be effectively identified using the XGB-integrated HMM–Viterbi algorithm.

3.2.3. Effect of Window Size on Behavior Classification

A smaller window size can capture the characteristics of the accelerometer signals and extract more detailed information, while increasing the risk of the misclassification of different behaviors due to the great similarity between behavioral sequences. An increase in window size leads to a loss of behavior sequence. An appropriate window size can reduce the data loss and improve the specificity and sensitivity of classification [35]. Comparisons were made to assess the effects of window size and monitoring site on behavior classification on the basis of the available data. Table 4 shows the total number of sequences obtained for each behavior obtained in this study.
As shown in Table 4, the loss of behavior sequence increased with the window size. Greater loss was suffered for the behavior categorized as ‘ingesting’, and the loss was independent of the number of each category of behavior sequence. For example, the number of behavior sequences collected for ingesting was 5247, and the loss of behavior sequence was 8.06%, 15.91%, 23.33%, and 33.39% at a window size of 3 s, 5 s, 7 s, and 10 s, respectively. Meanwhile, for ingesting–chewing, the total number of sequences was 1228 and the sequence loss was 2.77%, 5.46%, 8.06%, and 11.97% at a window size of 3 s, 5 s, 7 s, and 10 s, respectively. This was much smaller than that of ingesting behavior, as well as chewing behavior.
The effect of window size on behavior classification was also compared, taking P1 as an example. Table 5 shows the precision, recall, and F1-score of the developed model for activity classification at different window sizes. Generally, the precision, recall, and F1-score increased with window size when using the developed model for behavior classification. Therefore, a window size of 10 s was recommended and adopted in further analysis in this study.

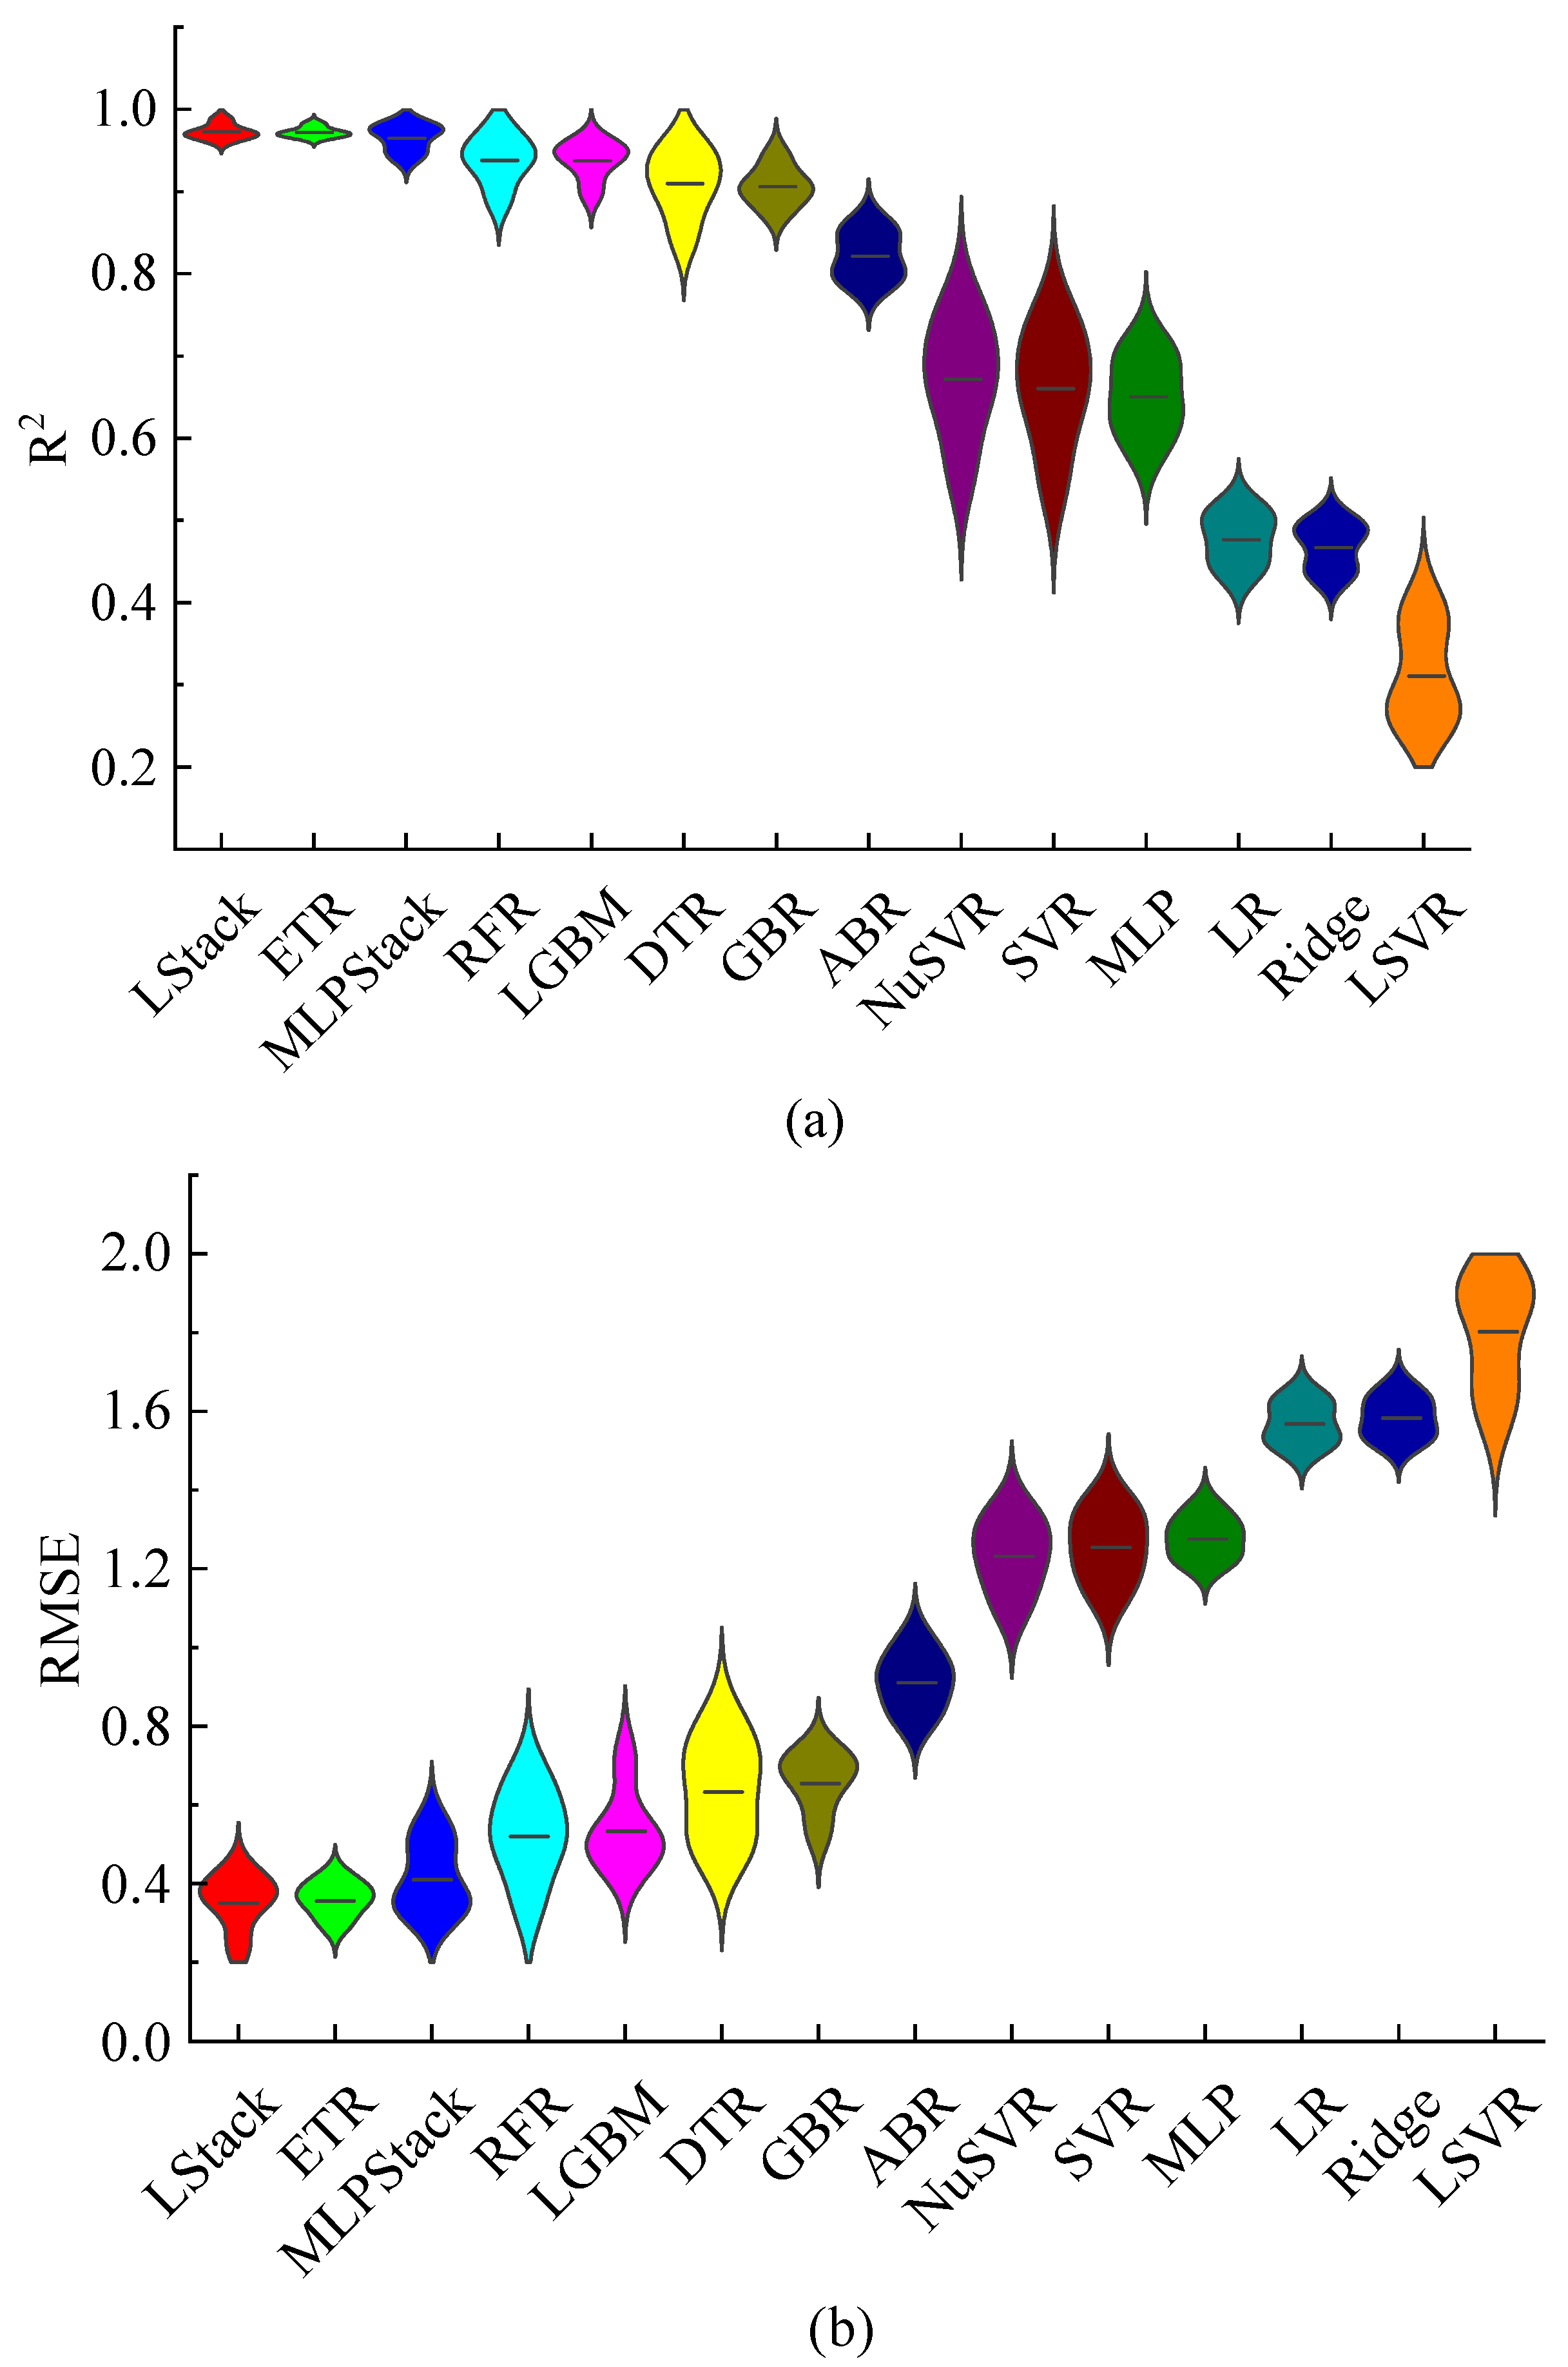
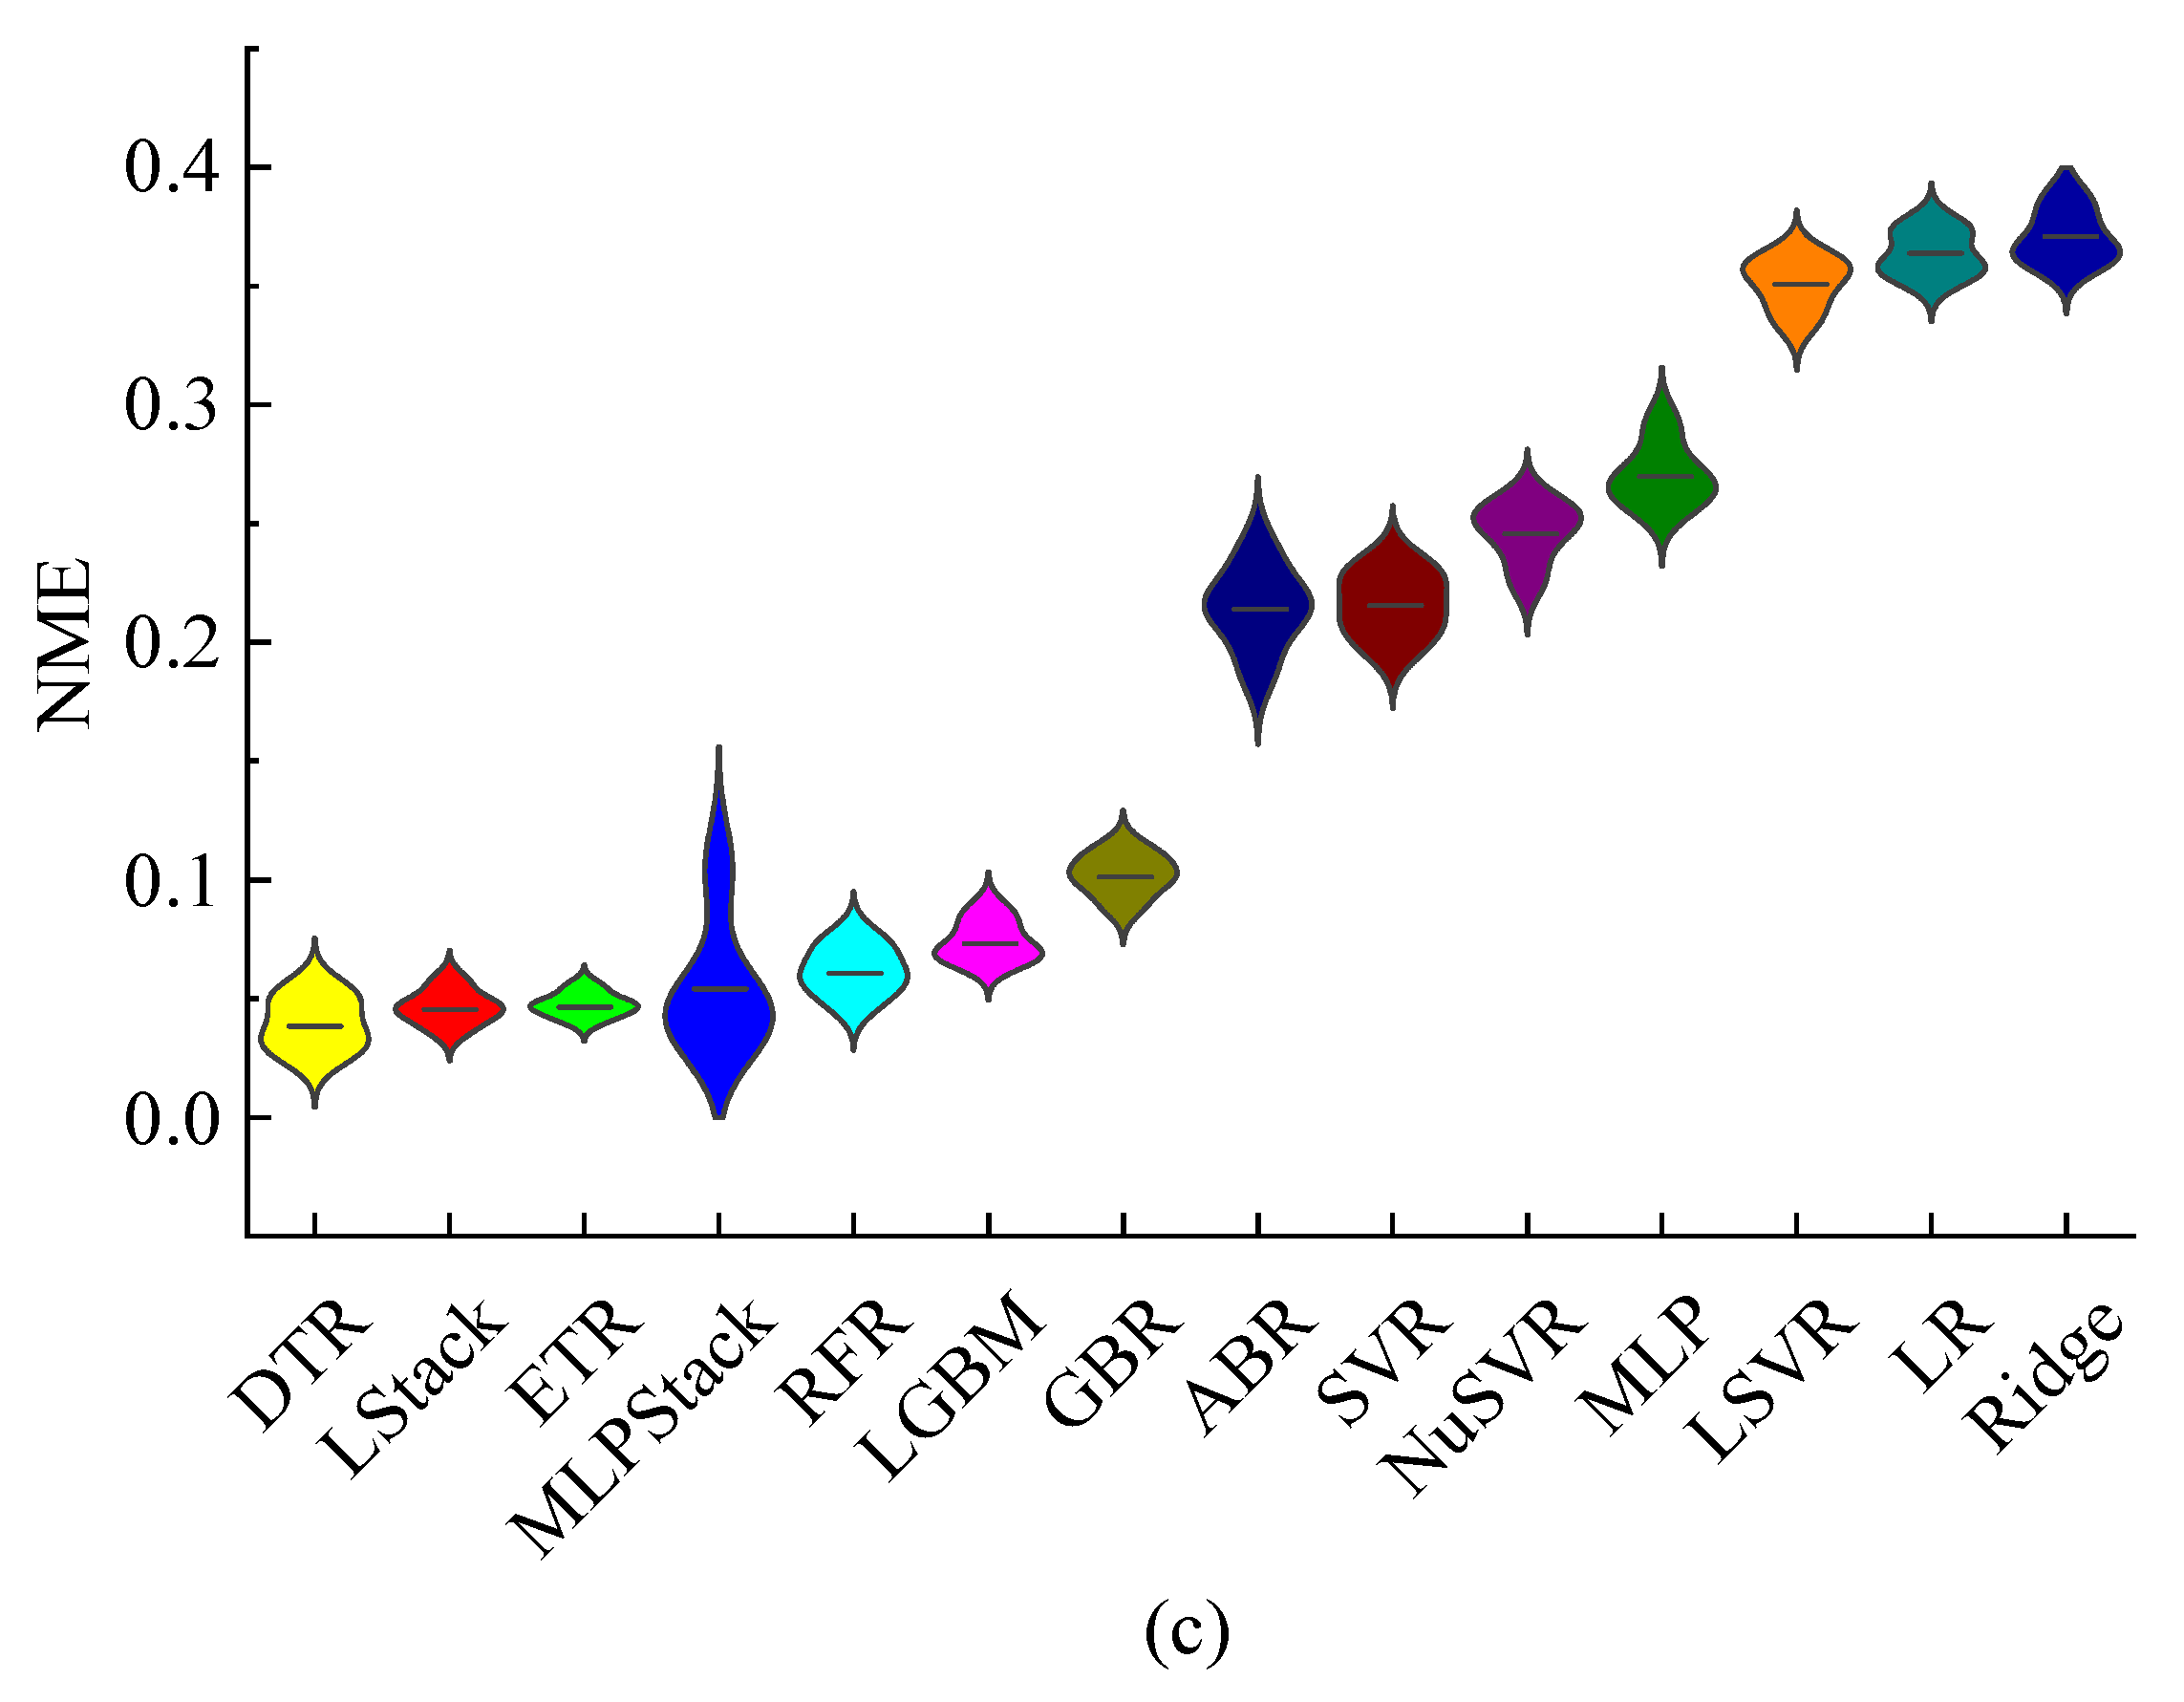
3.3. Prediction of Feed Intake Rate

Figure 7 shows the performance of different models in predicting feed intake rate. LStack, ETR, and MLPStack had the top three highest values of R2 at 0.97, 0.97, and 0.96, respectively, being very similar to each other (Figure 7a). With regard to RMSE, LStack, ETR, and MLPStack were still the three best models, with an RMSE of 0.36, 0.36, and 0.41 g/min, respectively. Meanwhile, for NME, the DTR model had the lowest error, but the value was very close to that of LStack, ETR, and MLPStack. As shown in Figure 7c, the NME of DTR, LStack, ETR, and MLPStack was 0.04, 0.05, 0.05, and 0.06, respectively.
Combining the three indicators of R2, RMSE, and NME, both the LStack model and the ETR model showed better predictions for the feed intake rate. Computation time was compared between these two models for further evaluation. The computation time of a single data sequence for the LStack model and ETR model was 0.003 s and 0.002 s, respectively. The ETR model had a simpler model structure and required less time for data processing. Therefore, the ETR model was recommended as the best predictor for the feed intake rate of cattle fed with total mixed rations when using the accelerometer signals of jaw movements.

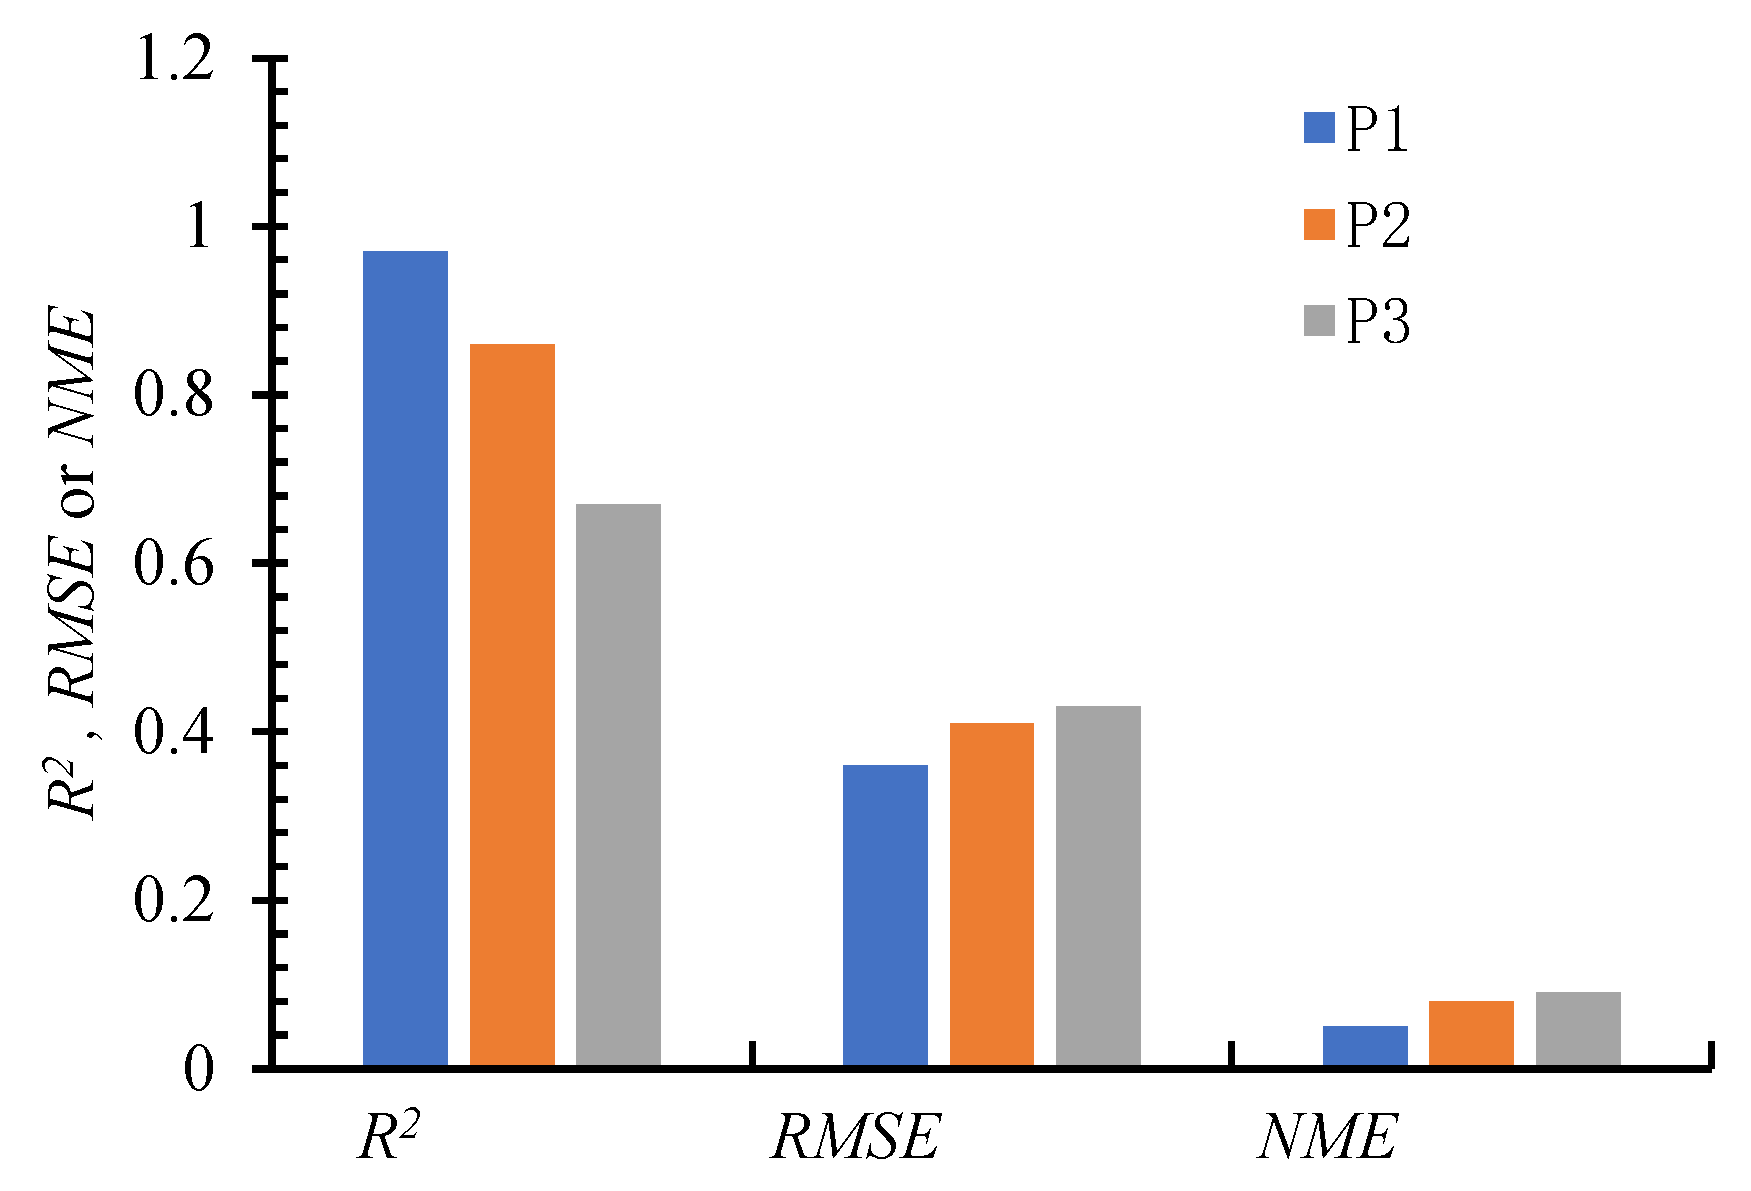
3.4. Effects of Monitoring Sites on Activity Identification and Feed Intake Prediction

Barwick [15] categorized sheep activity using a triaxial accelerometer with quadratic discriminant analysis (QDA) and found that the precision was higher when the sensor was mounted on an ear (94–99%) than when mounted on a collar (54–96%) or leg (56–100%). This indicates that the monitoring site may affect the precision of behavior classification. The nasolabial levator muscle (P1), right masseter muscle (P2), and left lower lip muscle (P3) are closely related to jaw movements during feeding, corresponding to the monitoring sites of near nose, right jaw, and left side of mouth. The effect of these three different monitoring sites on activity classification was investigated and is shown in Figure 8. When only the XGB algorithm was applied, the harmonic mean of precision, recall, and F1-score was 0.93 at different monitoring sites. The monitoring site at P1 showed a slightly better performance in terms of recall and F1-score when identifying the “ingesting–chewing” activity, while P2 and P3 had the same performance in terms of the precision, recall, and F1-score when identifying the four activities. However, similar results were observed at different monitoring sites when XGB and the HMM–Viterbi algorithm were applied. This suggests that the identification of different activities was not affected by the different monitoring sites examined in this study when a proper recognition algorithm was adopted.
Furthermore, this study examined the effects of monitoring site on predicting feed intake rate. Figure 9 shows the R2, RMSE, and NME of the ETR model in predicting feed intake rate according to the accelerometer signals at different monitoring sites. In contrast activity classification, the monitoring site affected the precision of prediction. As shown in Figure 9, P1 had the highest R2 and the lowest RMSE and NME. Moreover, P1 was located above the nose and, thus, was much easier to wear and more able to cling to the muscle, a consideration for practical use in the future. Thus, this study recommends P1 as the proper monitoring site for feeding behavior identification and feed intake prediction.

3.5. Comparison with Similar Studies

Giovanetti et al. [36] tried to automatically measure the different behaviors (including biting activity) of dairy sheep at pasture via triaxial accelerometry using stepwise discriminant analysis (SDA), canonical discriminant analysis (CDA), and discriminant analysis (DA). The precision of predicted grazing, ruminating and resting ranged from 89% to 95%, with an overall accuracy of 93%. Meanwhile, an agreement of only 65% was achieved with visual observation for biting activity due to several reasons, such as the disturbance from undesirable signals caused by head movements. RumiWatch, a commercial automatic jaw movement recorder, had a weakness in differentiating mastication chews and prehension bites (similar to the definition of chewing and ingesting in this study) with an error of over 10% [37]. Navon et al. [8] established an automatic recognition method for the jaw movements of free-ranging ruminants using acoustic monitoring. The results of Navon et al. demonstrated a 94% correct identification rate and a false positive rate of 7%. To address the confusion of background noise and the different sounds when eating different forage types, Chelotti et al. [38] developed a pattern recognition approach for classifying jaw movements in grazing cattle using acoustic signals, which achieved a 90% recognition rate even in noisy environments.
As can be seen from the above, the precision of behavior identification was approximately 90–95% in the literature, even though different sensing methods were adopted. These results are similar to those obtained when XGB was used alone, as shown in Table 3. In this study, the precision was improved to automatically discriminate ingesting, chewing, ingesting–chewing, and other activities, with an overall precision of 99%, when XGB and HMM–Viterbi algorithm were used. There was a large gap between different categories of activities, although a large number of acceleration data points were collected. The most collected behavioral sequence was in the category of “other”, as shown in Table 4. The sequences of ingesting–chewing only accounted for approximately 5% of the total number of behavioral sequences, and the number of sequences for ingesting or chewing was 5–7 times that of ingesting–chewing. Therefore, there were unbalanced sequences of different categories in the dataset, which led to the incomplete learning of the less common behaviors by the XGB model, and the lowered precision of behavior identification. The HMM–Viterbi algorithm calculated the error probability of the XGB model and predicted the maximum probability of the true category for the label, which consequently improved the accuracy of XGB in behavior identification based on the existing dataset.
With regard to feed intake prediction, very few studies can be found. As mentioned in the introduction, the existing models are mainly traditional statistical models, with an R2 of approximately 0.7. In this study, the R2 of the best prediction model was 0.97, and the prediction accuracy of feed intake was highly improved by the established machine learning model. However, it is worth noting that the reliability and generalization ability of machine learning models greatly depend on the quality and quantity of the available datasets. The established ETR model can be further validated with more datasets to improve its reliability in practical use, addressing the drawback of the lower interpretability of machine learning models compared with empirical models.
Moreover, the sample size of experimental animals is essential in behavior identification and feed intake prediction. The commonly used sample size is 2–10 cows/goats for similar studies [10,15,20,38]. The sample size was 13 cows in this study, which is consistent with the sample size commonly used in the existing literature. However, it is important to expand the sample size of experimental animals to enhance and evaluate the robustness of the established models or algorithm framework in practical use. This could provide a new view to study complex behavioral patterns across time and in a wider range of contexts. For example, McVey et al. used 200 cows to discover knowledge of complex behavioral patterns through the commercial sensor platform of CowManager, finding that the tradeoffs between behaviors in time budgets can be improved to mimic the complex error structures of sensor data [39]. In the future, we suggest embedding the developed algorithm framework in a device or sensor platform and validating its effectiveness in practical use with a bigger sample size.

4. Conclusions

The XGB and Viterbi algorithms were developed to identify the jaw movements of cattle during feeding using accelerometer signals at a low frequency of 1 Hz. The three feeding activities, ingesting, chewing, and ingesting–chewing, could be effectively identified with a precision of 99% using these algorithms together. On the basis of the identified feeding activities, the extra trees regressor (ETR) was established and proven to be the best model to predict the feed intake rates of cattle fed with total-mixed rations compared with 13 other models. A window size of 10 s was recommended for dealing with the low-frequency accelerometer signal. The three different monitoring sites of acceleration, the nasolabial levator muscle (P1), the right masseter muscle (P2), and the left lower lip muscle (P3), did not have an impact on the precision of activity identification, but may have affected the accuracy of feed intake prediction. P1 was recommended as the proper monitoring site when using the developed method to automatically monitor feed activity and feed intake.

Author Contributions

Conceptualization and writing—original draft preparation, L.D.; methodology and software, Y.L.; data acquisition and calibration, R.J. and W.Z.; funding acquisition and supervision, Q.L. and B.Y.; writing—review and editing, L.Y.; validation, W.M. and R.G.; project administration, Q.Y. All authors have read and agreed to the published version of the manuscript.

Funding

This research was funded by the Ministry of Science and Technology of China (National Key Research and Development Program of China, NO. 2021YFD1300502) and the Beijing Academy of Agriculture and Forestry Sciences (Youth Funds of Beijing Academy of Agriculture and Forestry Sciences, QNJJ201913; Technological innovation capacity construction of Beijing Academy of agricultural and Forestry Sciences, KJCX20220404).

Institutional Review Board Statement

The use of experimental animals was approved by the Institutional Review Board of NERCITA (No. AW-2019-02-01, approved on 11 February 2019).

Informed Consent Statement

Not applicable.

Data Availability Statement

Data are contained within the article, and datasets for predicting feed intake rate are provided in the non-published materials.

Acknowledgments

The authors thank the Yanzhao Fumin Dairy Farm in Yanqing County of Beijing for providing experimental animals and sites, and they are also deeply grateful for the constructive guidance provided by the expert reviewers and the editor.

Conflicts of Interest

The authors declare no conflict of interest.

References

  1. Green, T.C.; Jago, J.G.; Macdonald, K.A.; Waghorn, G.C. Relationships between residual feed intake, average daily gain, and feeding behavior in grow-ingdairy heifers. J. Dairy Sci. 2013, 96, 3098–3107. [Google Scholar] [CrossRef] [PubMed]
  2. Giovanetti, V.; Cossu, R.; Molle, G.; Acciaro, M.; Dimauro, C. Prediction of bite number and herbage intake by an accelerometer-based system in dairy sheep exposed to different forages during short-term grazing tests. Comput. Electron. Agric. 2020, 175, 105582. [Google Scholar] [CrossRef]
  3. Schirmann, K.; Weary, D.M.; Heuwieser, W.; Chapinal, N.; Cerri, R.L.A.; Keyserlingk, M.A.G.V. Short communication: Rumination and feeding behaviors differ between healthy and sick dairy cows during the transition period. J. Dairy Sci. 2016, 99, 9917––9924. [Google Scholar] [CrossRef] [PubMed]
  4. Hill, D.L.; Wall, E. Weather influences feed intake and feed efficiency in a temperate climate. J. Dairy Sci. 2017, 100, 2240–2257. [Google Scholar] [CrossRef] [PubMed]
  5. Galli, J.R.; Cangiano, C.A.; Milone, D.H.; Laca, E.A. Acoustic monitoring of short-term ingestive behavior and intake in grazing sheep. Livest. Sci. 2011, 140, 32–41. [Google Scholar] [CrossRef]
  6. Zehner, N.; UmstäTter, C.; Niederhauser, J.J.; Schick, M. System specification and validation of a noseband pressure sensor for measurement of ruminating and eating behavior in stable-fed cows. Comput. Electron. Agric. 2017, 136, 31–41. [Google Scholar] [CrossRef]
  7. Shen, W.; Zhang, A.; Zhang, Y.; Wei, X.; Sun, J. Rumination recognition method of dairy cows based on the change of noseband pressure. Inf. Process. Agric. 2020, 7, 479–490. [Google Scholar] [CrossRef]
  8. Navon, S.; Mizrach, A.; Hetzroni, A.; Ungar, E.D. Automatic recognition of jaw movements in free-ranging cattle, goats and sheep, using acoustic monitoring. Biosyst. Eng. 2013, 114, 474–483. [Google Scholar] [CrossRef]
  9. Hosseininoorbin, S.; Layeghy, S.; Kusy, B.; Jurdak, R.; Bishop-Hurley, G.J.; Greenwood, P.L.; Portmann, M. Deep Learning-based Cattle Activity Classification Using Joint Time-frequency Data Representation. Comput. Electron. Agric. 2021, 187, 106241. [Google Scholar] [CrossRef]
  10. Shen, W.; Cheng, F.; Zhang, Y.; Wei, X.; Zhang, Y. Automatic recognition of ingestive-related behaviors of dairy cows based on triaxial acceleration. Inf. Process. Agric. 2020, 7, 427–443. [Google Scholar] [CrossRef]
  11. Arablouei, R.; Currie, L.; Kusy, B.; Ingham, A.; Bishop-Hurley, G. In-situ classification of cattle behavior using accelerometry data. Comput. Electron. Agric. 2021, 183, 106045. [Google Scholar] [CrossRef]
  12. Pereira, G.M.; Sharpe, K.T.; Heins, B.J. Evaluation of the RumiWatch system as a benchmark to monitor feeding and locomotion behaviors of grazing dairy cows. J. Dairy Sci. 2021, 104, 3736–3750. [Google Scholar] [CrossRef] [PubMed]
  13. Oudshoorn, F.W.; Cornou, C.; Hellwing, A.L.F.; Hansen, H.H.; Munksgaard, L.; Lund, P.; Kristensen, T. Estimation of grass intake on pasture for dairy cows using tightly and loosely mounted di- and tri-axial accelerometers combined with bite count. Comput. Electron. Agric. 2013, 99, 227–235. [Google Scholar] [CrossRef]
  14. Arcidiacono, C.; Porto, S.M.C.; Mancino, M.; Cascone, G. Development of a threshold-based classifier for real-time recognition of cow feeding and standing behavioural activities from accelerometer data. Comput. Electron. Agric. 2017, 134, 124–134. [Google Scholar] [CrossRef]
  15. Barwick, J.; Lamb, D.W.; Dobos, R.; Welch, M.; Trotter, M. Categorising sheep activity using a tri-axial accelerometer. Comput. Electron. Agric. 2018, 145, 289–297. [Google Scholar] [CrossRef]
  16. Dutta, R.; Smith, D.; Rawnsley, R.; Bishop-Hurley, G.; Hills, J.; Timms, G.; Henry, D. Dynamic cattle behavioural classification using supervised ensemble classifiers. Comput. Electron. Agric. 2015, 111, 18–28. [Google Scholar] [CrossRef]
  17. Mansbridge, N.; Mitsch, J.; Bollard, N.; Ellis, K.; Kaler, J. Feature Selection and Comparison of Machine Learning Algorithms in Classification of Grazing and Rumination Behaviour in Sheep. Sensors 2018, 18, 3532. [Google Scholar] [CrossRef] [Green Version]
  18. Peng, Y.; Kondo, N.; Fujiura, T.; Suzuki, T.; Wulandari; Yoshioka, H. Classification of multiple cattle behavior patterns using a recurrent neural network with long short-term memory and inertial measurement units. Comput. Electron. Agric. 2019, 157, 247–253. [Google Scholar] [CrossRef]
  19. Martiskainen, P.; Järvinen, M.; SköN, J.P.; Tiirikainen, J.; Kolehmainen, M.; Mononen, J. Cow behaviour pattern recognition using a three-dimensional accelerometer and support vector machines. Appl. Anim. Behav. Sci. 2009, 119, 32–38. [Google Scholar] [CrossRef]
  20. Alvarenga, F.; Borges, I.; Oddy, V.H.; Dobos, R.C. Discrimination of biting and chewing behaviour in sheep using a tri-axial accelerometer. Comput. Electron. Agric. 2020, 168, 105051. [Google Scholar] [CrossRef]
  21. Rayas-Amor, A.A.; Morales-Almaráz, E.; Licona-Velázquez, G.; Vieyra-Alberto, R.; Lama, M. Triaxial accelerometers for recording grazing and ruminating time in dairy cows: An alternative to visual observations. J. Vet. Behav. 2017, 20, 102–108. [Google Scholar] [CrossRef]
  22. Riaboff, L.; Aubin, S.; Bédère, N.; Couvreur, S.; Plantier, G. Evaluation of pre-processing methods for the prediction of cattle behaviour from accelerometer data. Comput. Electron. Agric. 2019, 165, 104961. [Google Scholar] [CrossRef]
  23. Leiber, F.; Holinger, M.; Zehner, N.; Dorn, K.; Probst, J.K.; Neff, A.S. Intake estimation in dairy cows fed roughage-based diets: An approach based on chewing behaviour measurements. Appl. Anim. Behav. Sci. 2016, 185, 9–14. [Google Scholar] [CrossRef]
  24. Ungar, E.D.; Rutter, S.M. Classifying cattle jaw movements: Comparing IGER Behaviour Recorder and acoustic techniques. Appl. Anim. Behav. Sci. 2006, 98, 11–27. [Google Scholar] [CrossRef]
  25. Benson, L.C.; Clermont, C.A.; Osis, S.T.; Kobsar, D.; Ferber, R. Classifying Running Speed Conditions Using a Single Wearable Sensor: Optimal Segmentation and Feature Extraction Methods. J. Biomech. 2018, 71, 94–99. [Google Scholar] [CrossRef]
  26. Oshima, Y.; Kawaguchi, K.; Tanaka, S.; Ohkawara, K.; Hikihara, Y.; Ishikawa-Takata, K.; Tabata, I. Classifying household and locomotive activities using a triaxial accelerometer. Gait Posture 2010, 31, 370–374. [Google Scholar] [CrossRef] [PubMed]
  27. Riaboff, L.; Poggi, S.; Madouasse, A.; Couvreur, S.; Plantier, G. Development of a methodological framework for a robust prediction of the main behaviours of dairy cows using a combination of machine learning algorithms on accelerometer data. Comput. Electron. Agric. 2020, 169, 10517. [Google Scholar] [CrossRef]
  28. Liu, X.Y.; Liang, Y.; Wang, S.; Yang, Z.Y.; Ye, H.S. A Hybrid Genetic Algorithm with Wrapper-Embedded Approaches for Feature Selection. IEEE Access 2018, 6, 22863–22874. [Google Scholar] [CrossRef]
  29. Chen, C.; Tsai, Y.; Chang, F.; Lin, W. Ensemble feature selection in medical datasets: Combining filter, wrapper, and embedded feature selection results. Expert Syst. 2020, 37, e12553. [Google Scholar] [CrossRef]
  30. Zheng, H.; Yuan, J.; Chen, L. Short-Term Load Forecasting Using EMD-LSTM Neural Networks with a Xgboost Algorithm for Feature Importance Evaluation. Energies 2017, 10, 1168. [Google Scholar] [CrossRef] [Green Version]
  31. Torlay, L.; Perrone-Bertolotti, M.; Thomas, E.; Baciu, M. Machine learning–XGBoost analysis of language networks to classify patients with epilepsy. Brain Inform. 2017, 4, 159–169. [Google Scholar] [CrossRef]
  32. Bielecki, T.R.; Jakubowski, J.; Niewgowski, M. Intricacies of dependence between components of multivariate Markov chains: Weak Markov consistency and weak Markov copulae. Electron. J. Probab. 2013, 18, 1–21. [Google Scholar] [CrossRef]
  33. Ledezma, A.; Aler, R.; Sanchis, A.; Borrajo, D. GA-stacking: Evolutionary stacked generalization. Intell. Data Anal. 2010, 14, 89–119. [Google Scholar] [CrossRef] [Green Version]
  34. Yang, P.; Li, Y.; Zang, Y. Detecting DNS Covert Channels Using Stacking Model. China Commun. 2020, 17, 183–194. [Google Scholar] [CrossRef]
  35. Andriamandroso, L.H.A.; Frédéric, L.; Yves, B.; Eric, F.; Isabelle, D.; Bernard, H.; Pierre, D.; Guillaume, B.; Yannick, B.; Jérôme, B. Development of an open-source algorithm based on inertial measurement units (IMU) of a smartphone to detect cattle grass intake and ruminating behaviors. Comput. Electron. Agric. 2017, 139, 126–137. [Google Scholar] [CrossRef]
  36. Giovanetti, V.; Decandia, M.; Molle, G.; Acciaro, M.; Mameli, M.; Cabiddu, A.; Cossu, R.; Serra, M.G.; Manca, C.; Rassu, S.P.G.; et al. Automatic classification system for grazing, ruminating and resting behaviour of dairy sheep using a tri-axial accelerometer. Livest. Sci. 2016, 196, 42–48. [Google Scholar] [CrossRef]
  37. Rombach, M.; Münger, A.; Niederhauser, J.; Südekum, K.-H.; Schori, F. Evaluation and validation of an automatic jaw movement recorder (RumiWatch) for ingestive and rumination behaviors of dairy cows during grazing and supplementation. J. Dairy Sci. 2018, 101, 2463–2475. [Google Scholar] [CrossRef] [PubMed]
  38. Chelotti, J.O.; Vanrell, S.R.; Galli, J.R.; Giovanini, L.L.; Rufiner, H.L. A pattern recognition approach for detecting and classifying jaw movements in grazing cattle. Comput. Electron. Agric. 2018, 145, 83–91. [Google Scholar] [CrossRef]
  39. McVey, C.; Hsieh, U.; Manriquez, D.; Pinedo, P.; Horback, K. Livestock Informatics Toolkit: A Case Study in Visually Characterizing Complex Behavioral Patterns across Multiple Sensor Platforms, Using Novel Unsupervised Machine Learning and Information Theoretic Approaches. Sensors 2022, 22, 1. [Google Scholar] [CrossRef]
Figure 1. The orientations of the X-, Y-, and Z-axes when the triaxial accelerometers were at the positions of P1 (a), P2 (b), and P3 (c).
Agriculture 12 00899 g001
Figure 2. Flow chart of activity classification for jaw movements.
Agriculture 12 00899 g002
Figure 3. Flow chart of predicting feed intake rate after identification of jaw movement activities.
Agriculture 12 00899 g003
Figure 4. Flow chart of feed intake rate prediction by model stacking.
Agriculture 12 00899 g004
Figure 5. The relative importance of 55 features extracted from accelerometer signals.
Agriculture 12 00899 g005
Figure 6. Statistical diagram of state transition probabilities for different activities of feeding behavior (Ing-Che represents ingesting–chewing behavior).
Agriculture 12 00899 g006
Figure 7. (a) R2 for the 14 different models in predicting feed intake rate; (b) RMSE (unit: g/min) for the 14 different models in predicting feed intake rate; (c) NME (dimensionless) for the 14 different models in predicting feed intake rate.
Agriculture 12 00899 g007aAgriculture 12 00899 g007b
Figure 8. (a) The precision (unit: %) of activity identification at different monitoring sites at a window size of 10 s; (b) the recall (unit: %) of activity identification at different monitoring sites at a window size of 10 s; (c) the F1-score (dimensionless, range from 0 to 1) of activity identification at different monitoring sites at a window size of 10 s.
Agriculture 12 00899 g008
Figure 9. The R2 (dimensionless, range from 0 to 1), RMSE (unit: g/min), and NME (dimensionless) of feed intake rate prediction at different monitoring sites using the ETR model.
Agriculture 12 00899 g009
Table 1. Abbreviation and description for each of the calculated features used in this study.
AbbreviationFull NameDescription
1 A J ¯ Average A J ¯ = 1 M i = 1 M a j i
2 δ j 2 Variance (var) δ j 2 = 1 M i = 1 M ( a j i A ¯ j ) 2
3 δ x Standard deviation (SD) δ x = δ x 2
4 M i n j MinimumThe minimum value of data in a certain window size
5 M a x j MaximumThe maximum value of data in a certain window size
6 R a n g e j Range R a n g e j = M a x j M i n j
7 Q 2 ; j MedianThe median value of data in a certain window size
8 Q 1 ; j First quartileThe first quartile of data in a certain window size
9 Q 3 ; j Third quartileThe third quartile of data in a certain window size
10 I Q j Interquartile range I Q j = Q 3 ; j Q 1 ; j
11 R M S j Root mean square R M S = 1 M i = 1 M a j i 2
12 β 1 ; j Skewness β 1 ; j = 1 M i = 1 M ( a j i A ¯ j δ ) 3
13 β 2 ; j Kurtosis β 2 ; j = 1 M i = 1 M ( a j i A ¯ j δ ) 4
14 A I Average intensity A I = 1 M i = 1 M a m a g
15 M V Movement variation M V = 1 M ( i = 1 M 1 | a x , i + 1 a x , i | + i = 1 M 1 | a y , i + 1 a y , i | + i = 1 M 1 | a z , i + 1 a z , i | )
16 S M A Signal magnitude area S M A = 1 M ( r = 1 M | a x i | + r = 1 M | a y i | + r = 1 M | a z i | )
Note: ax, ay, az, and amag represent the raw signal of the X-axis, Y-axis, Z-axis, and sum of triaxial vectors after preprocessing, respectively. The subscript j in the abbreviation can be substituted by x, y, z, and mag, representing the features computed by the raw acceleration signal from the X-axis, Y-axis, Z-axis, and sum of triaxial vectors. For example, A x   ¯ represents the average of ax.
Table 2. Measured feed intake rates (FIR, grams per minute) of experimental cows.
ID of CowsMeasured FIR, g/min
1274 ± 75
2216 ± 193
3226 ± 195
4246 ± 51
5114 ± 49
6126 ± 84
7129 ± 64
8212 ± 92
9192 ± 102
10162 ± 85
1193 ± 29
12171 ± 38
13210 ± 32
Mean190 ± 89
Table 3. Evaluation of the developed mode for activity classification before and after applying the correction of the HMM–Viterbi algorithm when accelerometer signals were sampled at the position of P1.
Window SizeEvaluation FactorsOnly XGB Applied for ClassificationXGB + HMM–Viterbi Applied for Classification
OtherIng-Che 1IngestingChewingWMOtherIng-CheIngestingChewingWM
Precision0.950.820.840.920.931.001.000.960.990.99
10 sRecall0.970.430.890.860.930.991.000.990.980.99
F1-score0.960.560.870.890.931.001.000.970.990.99
1 Ing-Che represents the ingesting–chewing behavior. WM represents the harmonic mean of the four behavior categories.
Table 4. Total number of sequences obtained for each behavior with different window sizes.
BehaviorsWindow Size
1 s3 s5 s7 s10 s
Ingesting52474824 (8.06%) 14412 (15.91%)4023 (23.33%)3495 (33.39%)
Chewing76827196 (6.33%)6720 (12.52%)6280 (18.25%)5685 (26.00%)
Ingesting–chewing12281194 (2.77%)1161 (5.46%)1129 (8.06%)1081 (11.97%)
Other11,27311,047 (2.00%)10,829 (3.94%)10,624 (5.76%)10,342 (8.26%)
1 The percentages in the brackets represent the loss of behavior sequence at a window size of 3 s, 5 s, 7 s, and 10 s with respect to a window size of 1 s.
Table 5. Precision, recall, and F1-score for activity classification at different window sizes using XGB and HMM–Viterbi algorithm when accelerometer signals were sampled at the position of P1.
Window SizeEvaluation FactorsXGB + HMM–Viterbi Applied for Classification
OtherIng-Che 1IngestingChewingWM 2
3 sPrecision0.901.000.870.960.91
Recall0.970.370.770.880.91
F1-score0.930.540.820.920.91
5 sPrecision0.931.000.900.970.94
Recall0.980.750.830.930.94
F1-score0.950.860.860.950.94
7 sPrecision0.991.000.940.970.98
Recall0.980.930.960.980.98
F1-score0.990.960.950.980.98
10 sPrecision1.001.000.960.990.99
Recall0.991.000.990.980.99
F1-score1.001.000.970.990.99
1 Ing-Che represents the behavior of ingesting–chewing. 2 WM represents the harmonic mean of the four behavior categories.
Publisher’s Note: MDPI stays neutral with regard to jurisdictional claims in published maps and institutional affiliations.

