
Humic Acid Fertilizer Incorporation Increases Rice Radiation Use, Growth, and Yield: A Case Study on the Songnen Plain, China


1
School of Hydraulic and Electric Power, Heilongjiang University, Harbin 150080, China
2
School of Water Conservancy and Civil Engineering, Northeast Agricultural University, Harbin 150030, China
*
Author to whom correspondence should be addressed.
Agriculture 2022, 12(5), 653; https://doi.org/10.3390/agriculture12050653
Submission received: 31 March 2022
/
Revised: 26 April 2022
/
Accepted: 29 April 2022
/
Published: 30 April 2022
(This article belongs to the Special Issue Water-Saving Irrigation Technology and Strategies for Crop Production)
Abstract
:Humic acid fertilizer (HA) incorporation is a common method for improving crop growth and soil fertility. However, the effects of HA incorporation on rice growth are still unknown. We conducted a two-year field experiment to determine the radiation use, growth, and yield of rice grown with five different HA rates: 110 kg∙ha−1 100% urea (pure nitrogen) (T1); 30% HA and 70% urea (T2); 50% HA and 50% urea (T3); 70% HA and 30% urea (T4), and 1500 kg∙ha−1 100% HA (T5). The results showed that the T2 treatment had the lowest values of photosynthetic efficiency of PSII (Fv/Fm), relative leaf chlorophyll content (SPAD), plant height and leaf area index (LAI) in both years, which were similar to the photosynthetically active radiation (IPAR), radiation use efficiency (RUE), yield, and biomass. In contrast, the highest harvest index (HI) value was found in the T2 treatment. In the two years, the T4 and T5 treatments showed no significant differences. However, the multivariate statistical method based on principal component analysis showed that in the first principal component, the LAI, biomass, yield, plant height, SPAD, Fv/Fm, IPAR, and RUE had a positive correlation, and the HI had a negative correlation. The LAI, yield, plant height, SPAD, HI, and RUE had a positive correlation, but biomass, Fv/Fm and IPAR had a negative correlation in the second principal component. Across the different HA treatments, the comprehensive scores were T5 > T4 > T3 > T1 > T2, with values of 2.13, 1.38, −0.17, −0.34, and −3.00, respectively. According to the principal component analysis results of each index, the T5 treatment was better than the T4 treatment.
1. Introduction
The black soil region of the Songnen Plain is the main grain production area in China, and its grain production is related to national security and economic development, thus it is an area of major national concern [1]. Protecting black soil, improving its grain production capacity, and implementing grain storage and technology measures to better provide a “ballast” role for ensuring national food security are critical to improving green agricultural development and strengthening agriculture in China [2]. The “14th Five-Year Plan” and “the long-term goal of 2035” clearly state that black soil, which is called the “giant panda in cultivated land”, is an extremely precious agricultural resource that should be effectively protected to promote agricultural modernization in China [3].
In recent years, application of organic fertilizer in China has been insufficient and the amount of nitrogen fertilizer application has increased significantly [4]. By increasing the application amounts of nitrogen in pursuit of high crop yields, pollution problems have been introduced to farmlands. Therefore, identifying the scientifically optimal amount of nitrogen fertilizer needed is critical to the sustainable development of agriculture in the future. Adjusting and solving the disparity between the demand for crop fertilizers and the supply of soil fertilizer to realize a balanced nutrient supply can reduce chemical fertilizer use and improve its efficiency while meeting crop growth needs, achieving win-win results for both crop yield and environmentally sustainable development. Improving and maintaining soil fertility and productivity has always been the focus of soil amelioration. In recent years, due to the substantial application of chemical fertilizers, the fertilizer supply capacity and productivity of black soils have decreased significantly. The substitution of organic fertilizers for chemical nitrogen fertilizers is a measure to reduce the application of chemical fertilizers that can not only improve the soil fertility but also promote crop growth [5]. Previous studies have shown that a reasonable application of organic fertilizer can enhance crop quality [6,7], improve crop photosynthesis, and water and fertilizer utilization efficiency [8,9], increase crop plant height and stem diameter [10], reduce nitrogen leaching in soil [11], affect crop root zone microbial community [12], and decrease greenhouse gas emissions of farmlands [13,14]. Application of organic fertilizers to the soil helps improve the soil quality and maintain crop production. In addition, small molecular organic matter has a positive impact on the soil nutrient cycle, and crop growth and development [15]. Therefore, the development of environmentally friendly fertilizers and reasonable fertilization measures are an important way to ensure crop growth, restore soil fertility, and maintain the sustainable development of agriculture [16]. Consequently, it is necessary to reduce the input of nitrogen fertilizers in farmlands, reduce the amount of chemical fertilizers and apply organic fertilizer in a scientifically sound manner to improve the fertility of black soil, increase the quality of agricultural products, and reduce non-point source pollution [17]. However, the rice planting area in the black soil region of the Songnen Plain is large, and the amount of organic fertilizer applied is still insufficient. Therefore, studying the impact of organic fertilizer application on rice is critical for scientifically formulating a management model for increasing the rice yield (stabilizing yield), reducing chemical fertilizers, and improving fertilizer efficiency in black soil regions. In addition, understanding the effects of organic fertilizer on crop growth is also important for agricultural green development.
At present, many studies on the effects of organic fertilizers on crop growth have been carried out worldwide. However, due to the influences of climate conditions, planting structures, and environmental effects of water and soil resources, there are many uncertainties related to the crop growth and organic fertilizer application in the black soil region of China. Therefore, according to the government work report, the primary agricultural challenge currently is the further improvement of black soil cultivated land quality and the maintenance of crop productivity by increasing organic fertilizer use. To address these issues, we conducted continuous field experiments to determine the effects of HA organic fertilizer application on rice growth in black soil regions to provide technical guidance for the coordinated development of grain production and sustainable agriculture.
2. Materials and Methods
2.1. Experimental Site
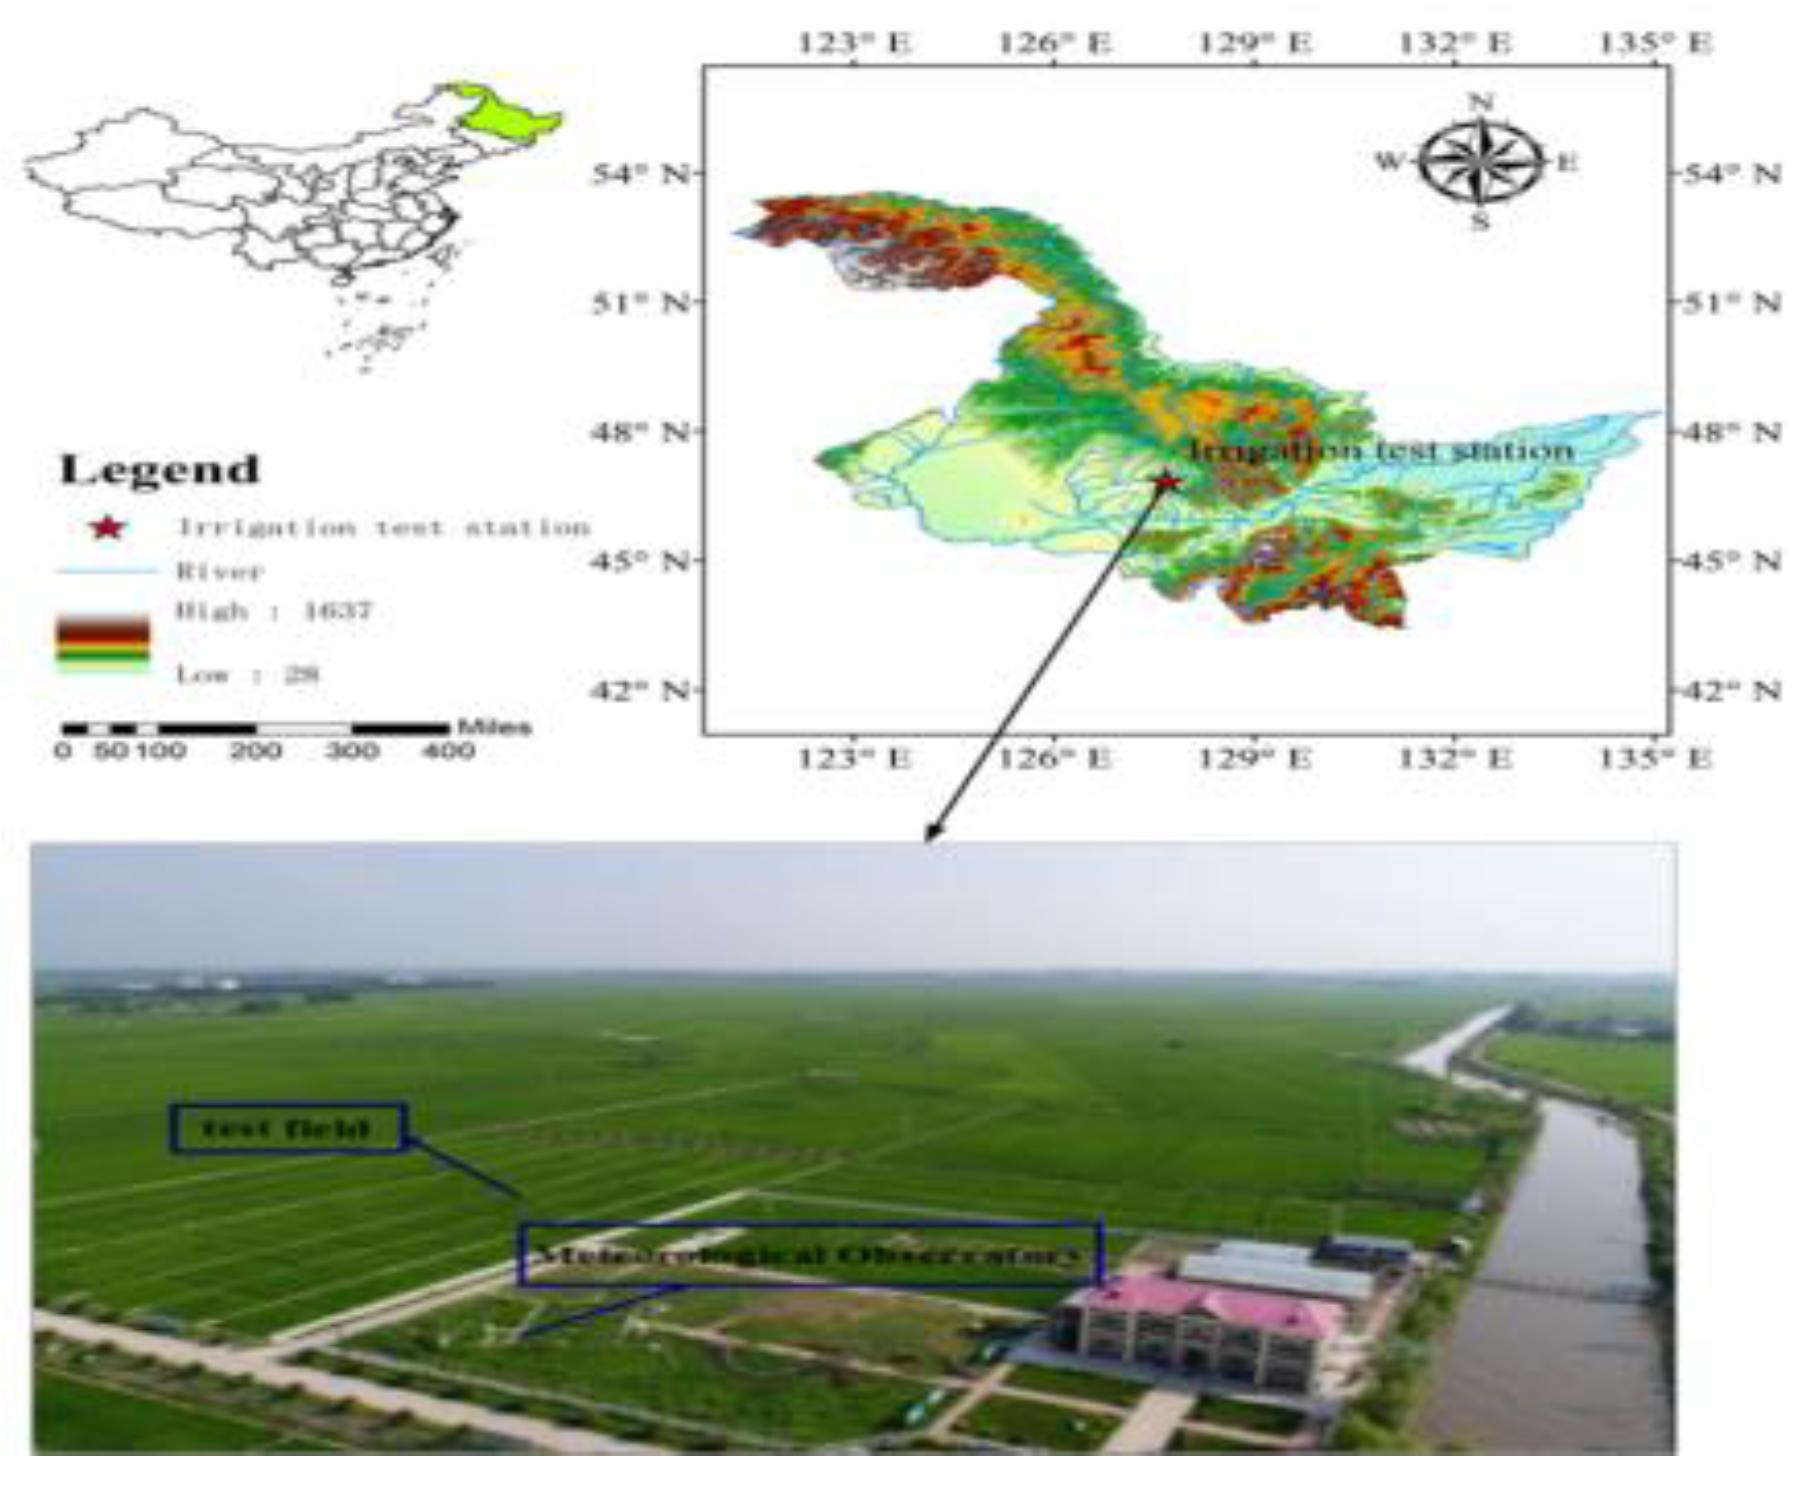
The experimental design in this study was performed at the National Key Irrigation Experimental Station located in the town of Heping in Qing’an County, Suihua, Heilongjiang, China (Figure 1). The experimental site is located at 45°63’ N, 125°44’ E at an elevation of 450 m above sea level. This region has a topography of plains and a semiarid cold, temperate, continental monsoon climate; it is a typical cold region with black soil. The average annual temperature in the study region is 2.5 °C, the average annual precipitation is 550 mm, and the average annual surface evaporation is 750 mm. The growth period of crops ranges from 156–171 days, and a frost-free period of approximately 128 days occurs annually [18].
2.2. Experimental Design and Setup
In our research, five fertilization treatments were applied as shown in Table 1. The 100% pure nitrogen was 110 kg∙ha−1, and the 100% humic acid fertilizer (HA) was 1500 kg∙ha−1. In this experiment, the rice cultivar “Suijing No. 18” was selected, and the ratio of fertilizers applied to the soil was in accordance with Zheng et al. [18]. This study was performed with a randomized complete block design with three replications; for the water management according to the local irrigation method, please refer to the reference [4].
2.3. Sampling and Measurements
The photosynthetic efficiency of PSII (Fv/Fm) was determined using five random selections during the period stages on days with sunshine and no wind by a Li-6400XT portable measurement system (LI-COR, Inc., Lincoln, NE, USA). The detection light intensity was 1500 μmol m−2 s−1, and the saturated pulsed light intensity was 7200 μmolm−2 s−1. The functional leaves were dark-adapted for 30 min, and then the Fv/Fm was measured [19].
The relative leaf chlorophyll content (SPAD) was determined for fully expanded leaves in each plot at the period stages using a leaf chlorophyll meter (Minolta SPAD 502, Minolta Camera Co., Osaka, Japan) during 9:00–11:30 on sunny days. Five leaves were randomly selected from each treatment and their values were averaged to obtain an average value [20].
At the maturity stage, the plants were cut at ground level, and the fresh weight of 5 randomly selected plants was measured. A sub-sample per plot from each treatment was dried at 80 °C to a constant weight to determine the above-ground dry matter.
Data on plant height were determined by measuring the height of five randomly selected plants from the soil surface to the tip of each plant at physiological maturity in each treatment plot, and then averaging the 5 measurements.
To determine the leaf area index (LAI) in each plot, at the beginning of each stage and every five days thereafter, an LI-3000C portable area meter ( Ecotek Technology Co., Ltd., Beijing, China) was used to measure the green leaf area on 20 randomly selected plants in each plot [20].
Photosynthetically active radiation was measured above and below the crop canopy by using a SunScan Canopy Analysis System (Delta T Devices Ltd., Cambridge, England, UK) in the growing seasons, and three measurements were taken from each plot. The intercepted photosynthetically active radiation (IPAR), radiation use efficiency (RUE), and daily fraction of light interception (Fd) were assessed according to the methods of Xiang et al. [21].
In each plot, rice was harvested over an area of 1 m2 (excluding border rows) to determine the yield per unit area. The average number of panicles, number of grains per panicle, grain-filling rate, and 1000-grain weight were measured after harvesting from a representative square-meter area in each plot [20].
The harvest index (HI) was calculated based on the following method:
HI = Yield/Total biomass
2.4. Principal Component Analysis
Principal component analysis is a multivariate statistical method to investigate the correlation between multiple variables. This method reveals the internal structure of multiple variables through analysis of a few principal components, that is, it derives a few principal components from the original variables that retain as much information as possible. Usually, the mathematical treatment is to linearly combine the original n indices into a new comprehensive index. The computational steps of the principal component analysis are as follows:
Step 1: Assume that there are n evaluation objects, and each evaluation object has m variables to establish a data matrix.
where xij is the j-th index in the i-th treatment (i = 1, 2 … n, n = 5 and j = 1, 2 … m, m = 9).
Step 2: Standardize the data, m index variables for principal component analysis: x1, x2 …, xm, n evaluation objects, and the j-th index in the i-th treatment is xij. Convert each index value xij into a standardized index .
where i = 1, 2, …, n; j = 1, 2, …, m
where is the mean value of the j-th index and . is the standard deviation of the j-th index (i = 1, 2, …, n; j = 1, 2, …, m).
Step 3: Calculate the correlation coefficient matrix.
Step 4: Calculate eigenvalues and eigenvectors.
Calculate the eigenvalue of the correlation coefficient matrix λ1 ≥ λ2 ≥…≥ λm ≥ 0 and eigenvectors u1, u2,…,um. Therein, , and M new index vectors are composed of eigenvalue vectors as follows:
where y1 is the first principal component, y2 is the second principal component, …, ym is the m-th principal component.
Step 5: Select P principal components to calculate the comprehensive evaluation value (P ≤ m).
Calculate eigenvalue λj (j = 1, 2..., m), information contribution rate, and cumulative contribution rate.
where bj is the information contribution rate of the main component yj.
where is the cumulative contribution rate of the principal components y1, y2..., yp. When ≥ 85%, the first P index variables y1, y2..., yp are selected as the P principal components instead of the original m index variables so that the P principal components can be comprehensively analyzed.
Comprehensive scores are calculated as follows:
where bj is the information contribution rate of the j-th principal component and is the j-th principal component.
2.5. Statistical Analysis
The experimental data obtained for different parameters were statistically analyzed using the analysis of variance technique, as this method is applicable to randomized complete block designs. Duncan’s multiple range test was employed to assess differences among the treatment means at a 5% probability level. All statistical analyses were performed using SPSS 22.0 for Windows [20].
3. Results
3.1. The Fv/Fm and SPAD
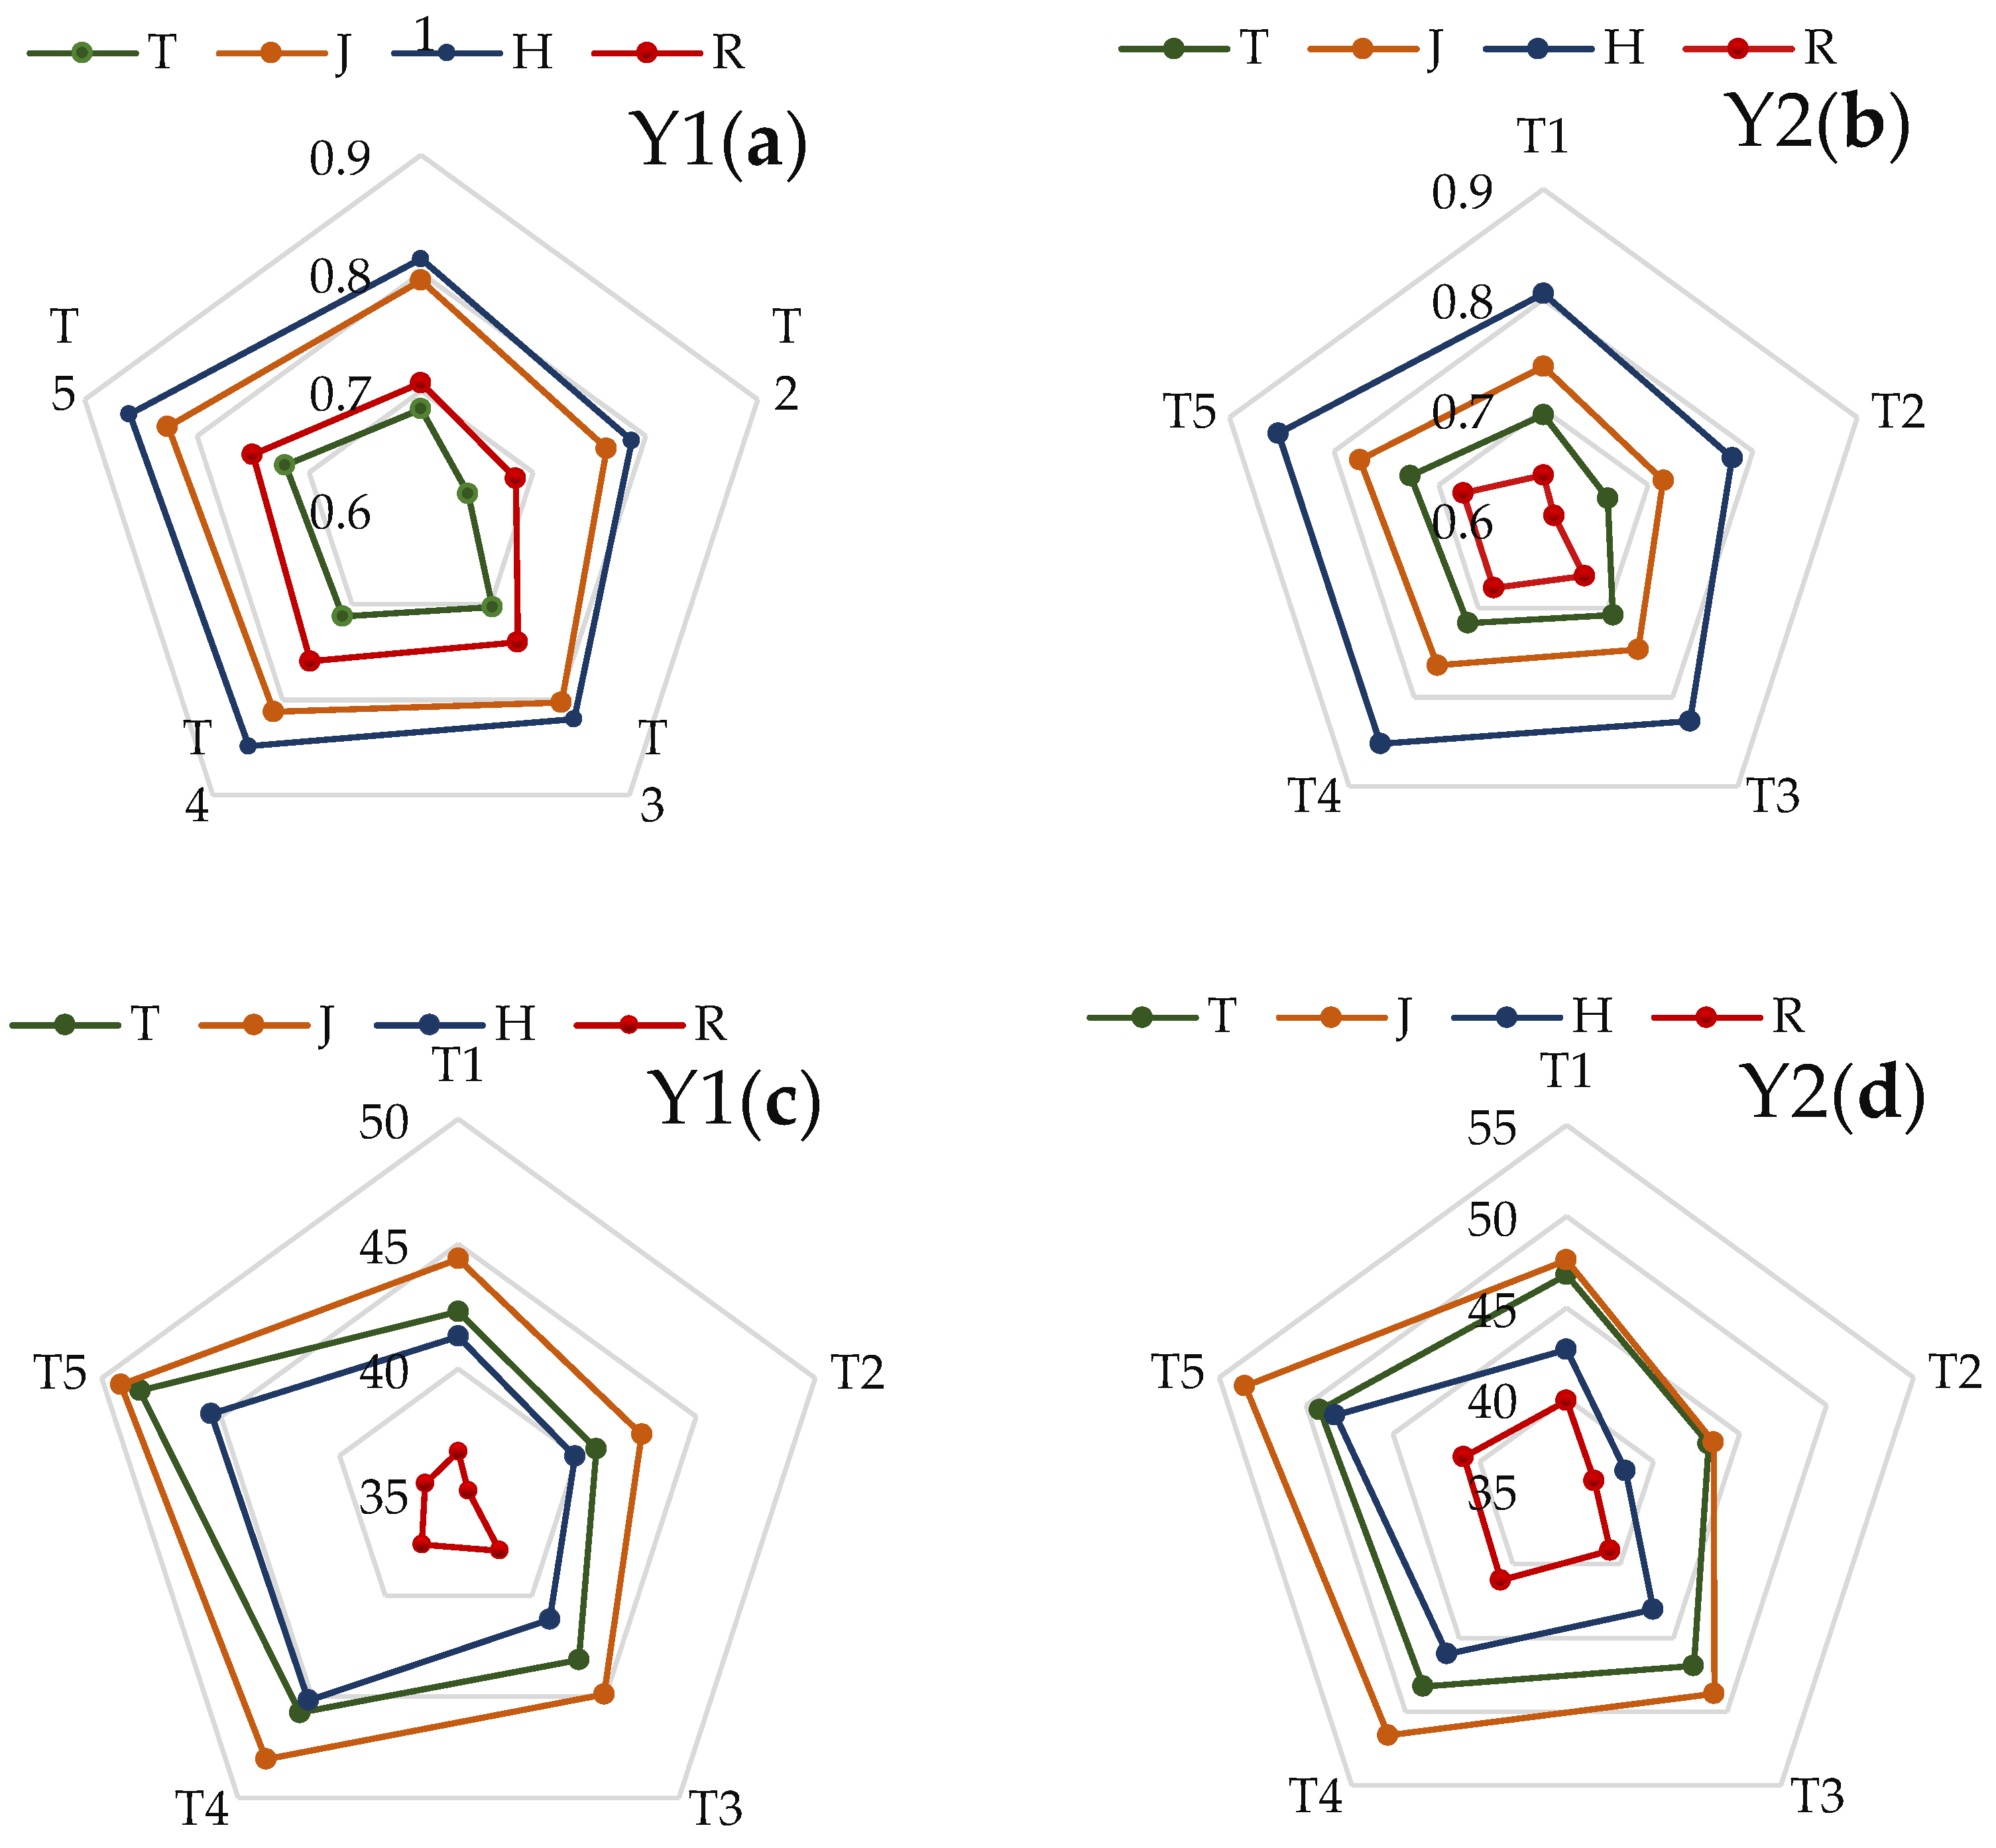
The Fv/Fm during different plant growth stages in Y1 (first year) and Y2 (second year) under different treatments are shown in Figure 2a,b. The Fv/Fm showed an increasing trend with increasing HA incorporation. There were no significant differences among the T1, T3, T4, and T5 treatments, however, they were significantly higher than the T2 treatment. The T5 treatment had the highest values of 0.79 in Y1 and 0.76 in Y2, on average. Compared with the T2 treatment, the T1, T3, T4, and T5 treatments increased the Fv/Fm by 4.1%, 6.5%, 8.8%, and 9.6% on average in Y1 and Y2, respectively. The impact of HA incorporation application on the rice SPAD was consistent with that of HA on the Fv/Fm (Figure 2c,d). The T5 treatment had the highest values of 44.85 in Y1 and 47.98 in Y2. Compared with the T2 treatment, the T1, T3, T4, and T5 treatments increased the SPAD by 6.6%, 7.6%, 13.5% and 15.9% on average in Y1 and Y2, respectively, and the increase in SPAD in the T4 and T5 treatments was greater than that in the other treatments. Both Fv/Fm and SPAD in the T4 and T5 treatments had no significant differences in the two years.
3.2. The Plant Height and LAI
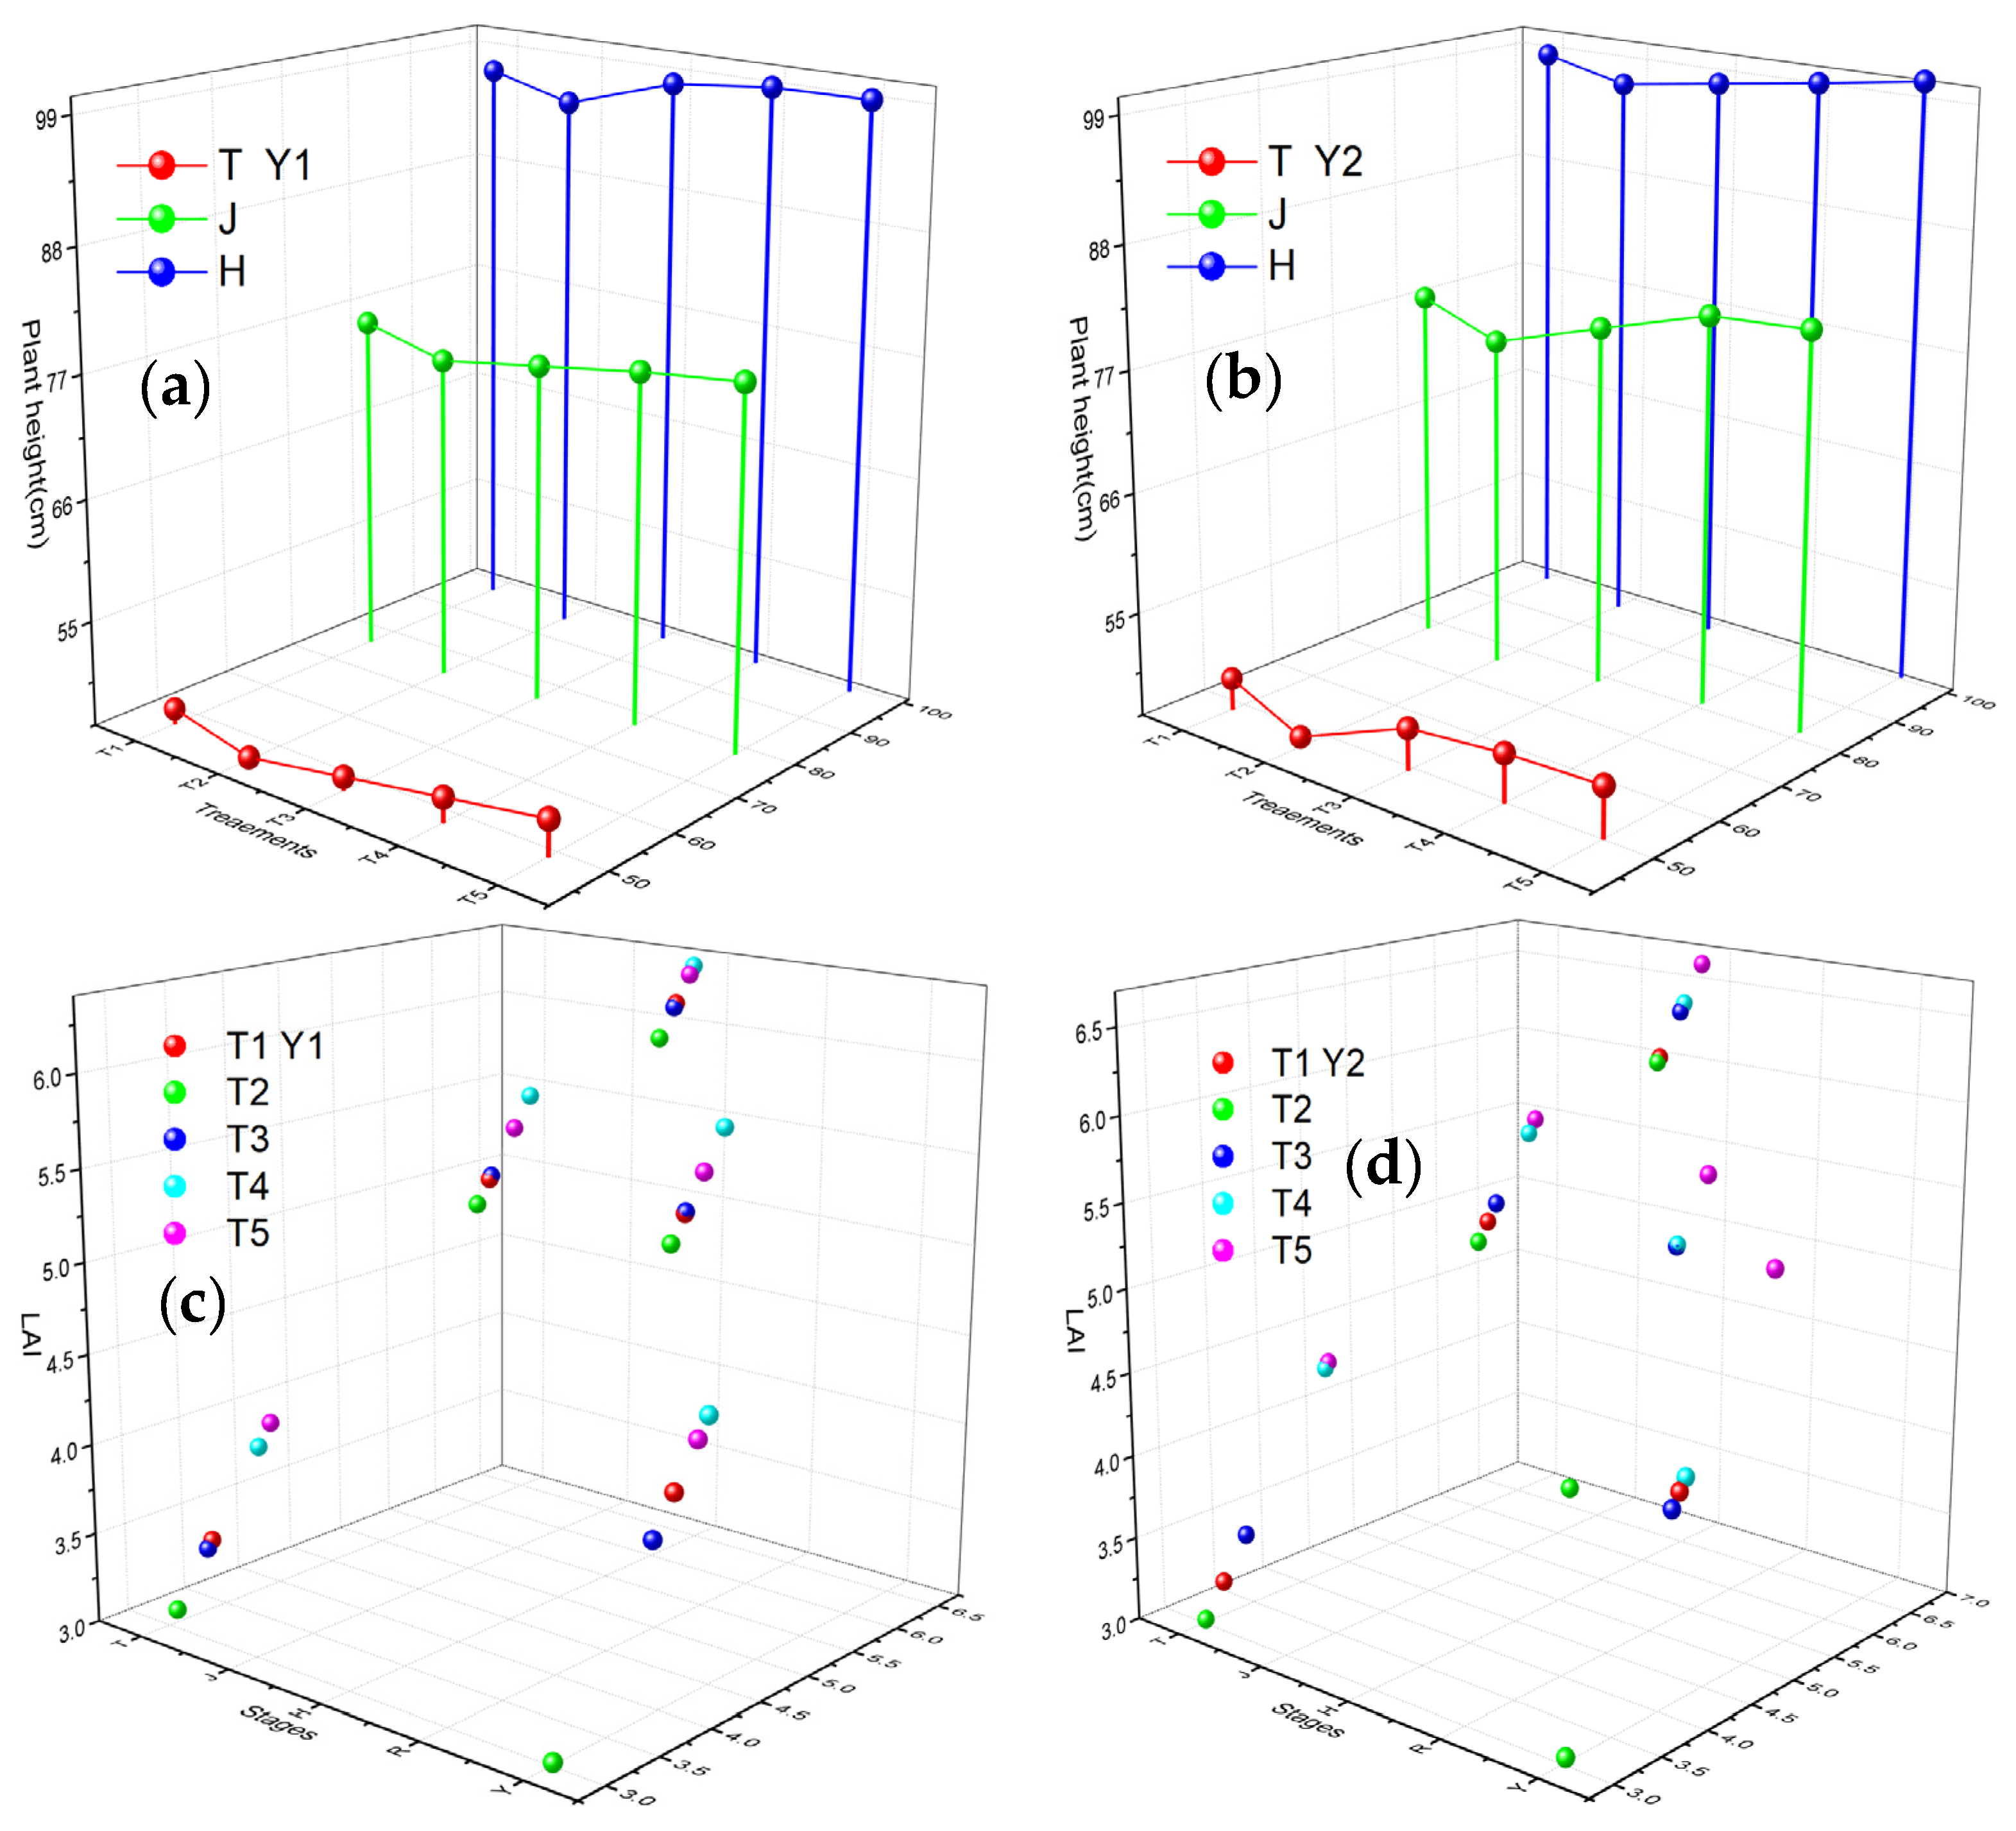
Plant height is the main agronomic trait used to describe the vertical growth and developmental abilities of crops. The plant heights during each of the plant growth stages in Y1 and Y2 under different treatments are shown in Figure 3a,b. Under the 30% HA and 70% urea treatment, the plant height reached the minimum value, while the maximum plant height appeared in the T5 treatment in Y1 and Y2. However, there was notably no significant difference in plant height among the T1, T3, T4, and T5 treatments in the same year. The LAI under different fertilization methods are shown in Figure 3c,d. In the two-year experiment, the results showed that the LAI value across all treatments first increased and then decreased, and reached the maximum value at the heading stage. Compared with the T2 treatment, the average LAI values in the T1, T3, T4, and T5 treatments were 8.38%, 7.32%, 16.34%, and 14.52%, higher, respectively, in Y1, and 12.53%, 14.85%, 21.54%, and 29.29%, higher, respectively in Y2. In the two years, the increase in LAI in the T4 and T5 treatments was significantly greater than that in the other treatments.
3.3. The IPAR and RUE
Increased HA improved the RUE (Table 2), and the RUE of the rice distinctly increased after the application of HA. During rice development, the RUE increased rapidly after fertilization and then decreased significantly. Similar to Fd, it peaked during the heading stage. At all stages, the RUE in the T4 and T5 treatments was higher than that in the T1 and T3 treatments, with significant differences in the T2 treatment. The RUE in the T4 and T5 treatments was, on average, 8.2% higher than that in the T2 treatment in Y1 and 9.6% higher in Y2. Increased HA also promoted the RUE, IPAR, and Fd at all stages, but no significant differences were observed in the T4 and T5 treatments. However, both of them were significantly higher than those in the T1, T2, and T3 treatments. The IPAR in the T4 and T5 treatments was on average 19.2% higher in Y1 and 24% higher in Y2, relative to the T1, T2, and T3 treatments. The Fd in the T4 and T5 treatments was on average 19.5% higher in Y1 and 23.6% higher in Y2, relative to the T1, T2, and T3 treatments.
3.4. Yield, Biomass, and HI
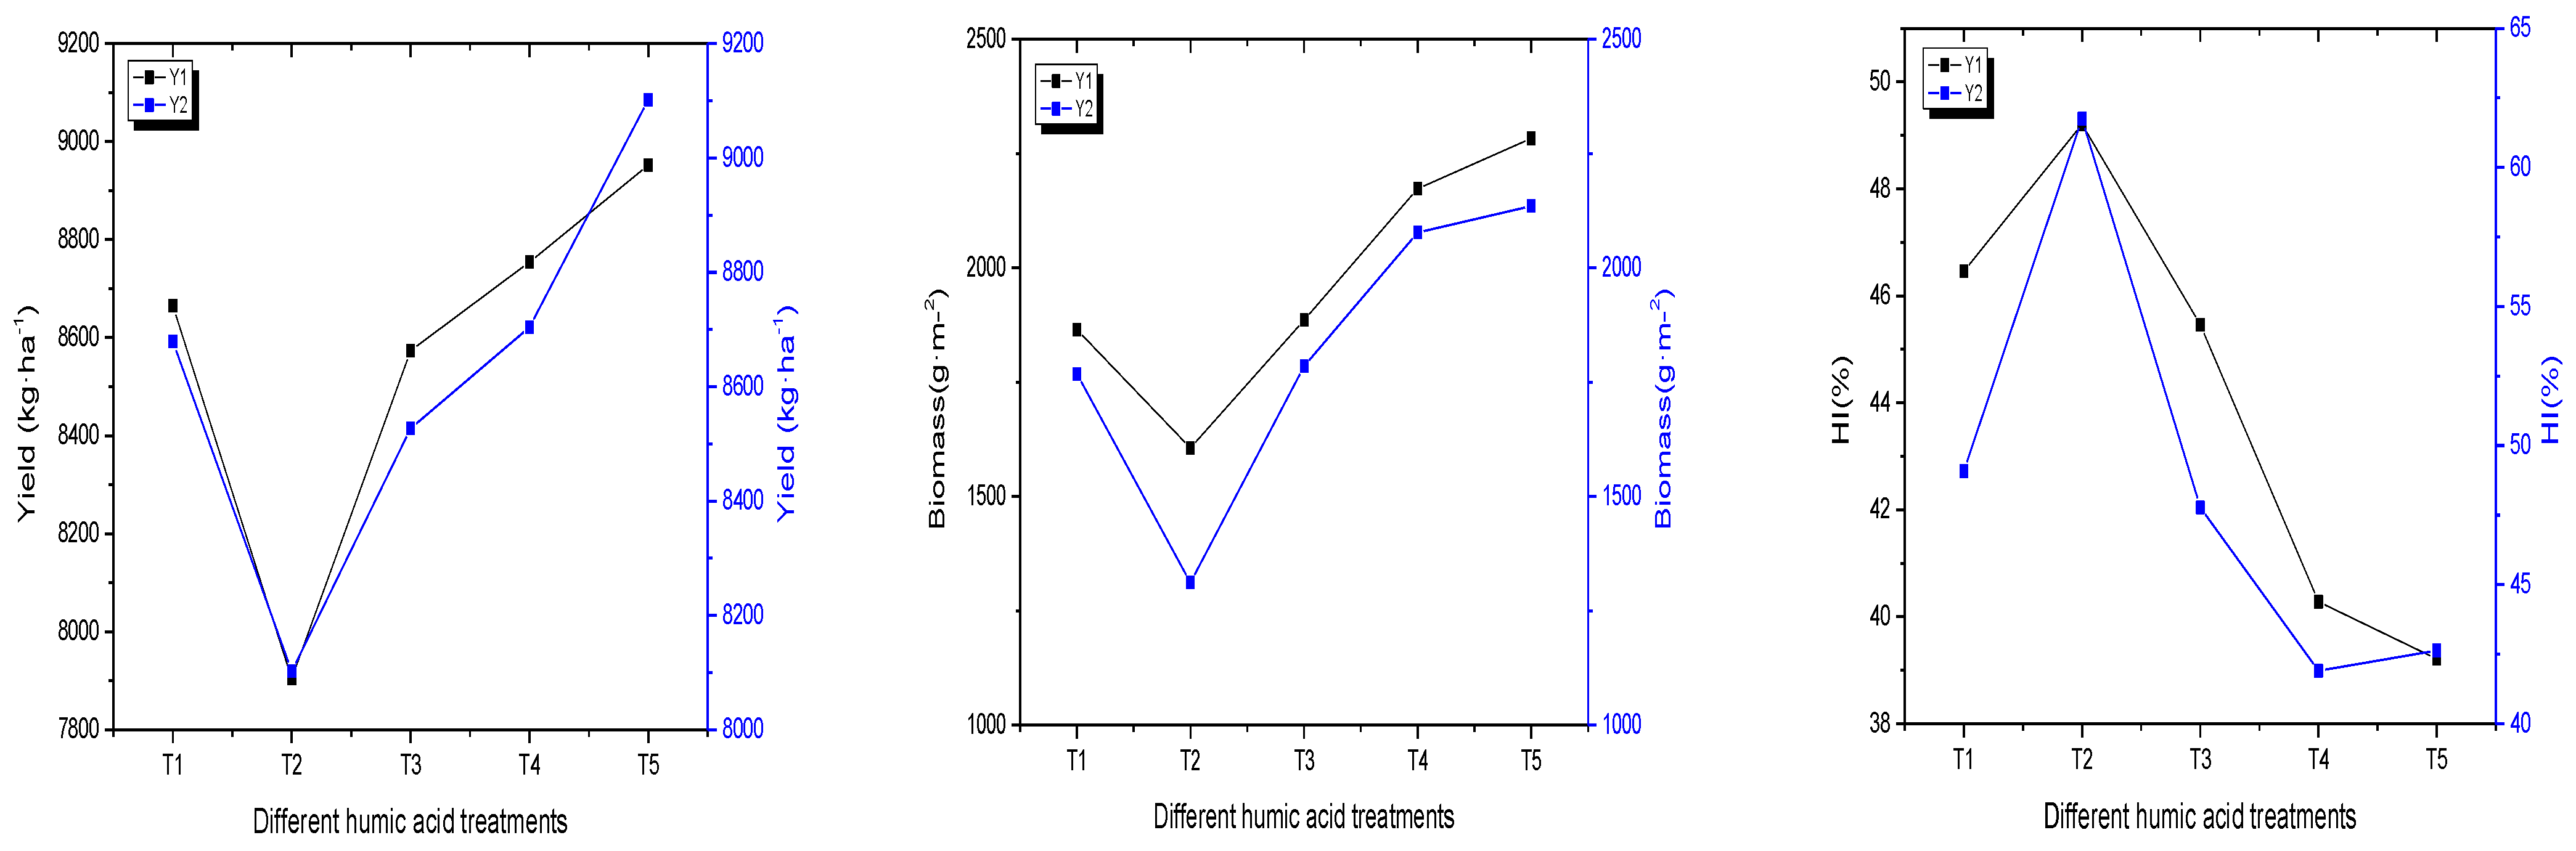
HA incorporation significantly improved the yield and biomass of rice (p < 0.05) (Figure 4). The highest dose of HA (1500 kg·ha−1) increased the yield and biomass by 5.6% and 21.3%, respectively, in Y1, and by 7.0% and 23.0%, respectively, in Y2, relative to the other treatments on average. To evaluate the impact of HA application on HI, the plants were harvested at the maturity stage to determine the HI. However, in growth duration, the HI was not significantly different in Y1 and Y2, and except for the T2 treatment, there were also no significant differences between treatments. However, the higher dose of HA induced a lower HI. Therefore, additional future research is required on how to improve the harvest index while increasing yield.
3.5. Comprehensive Evaluation Based on Principal Component Analysis
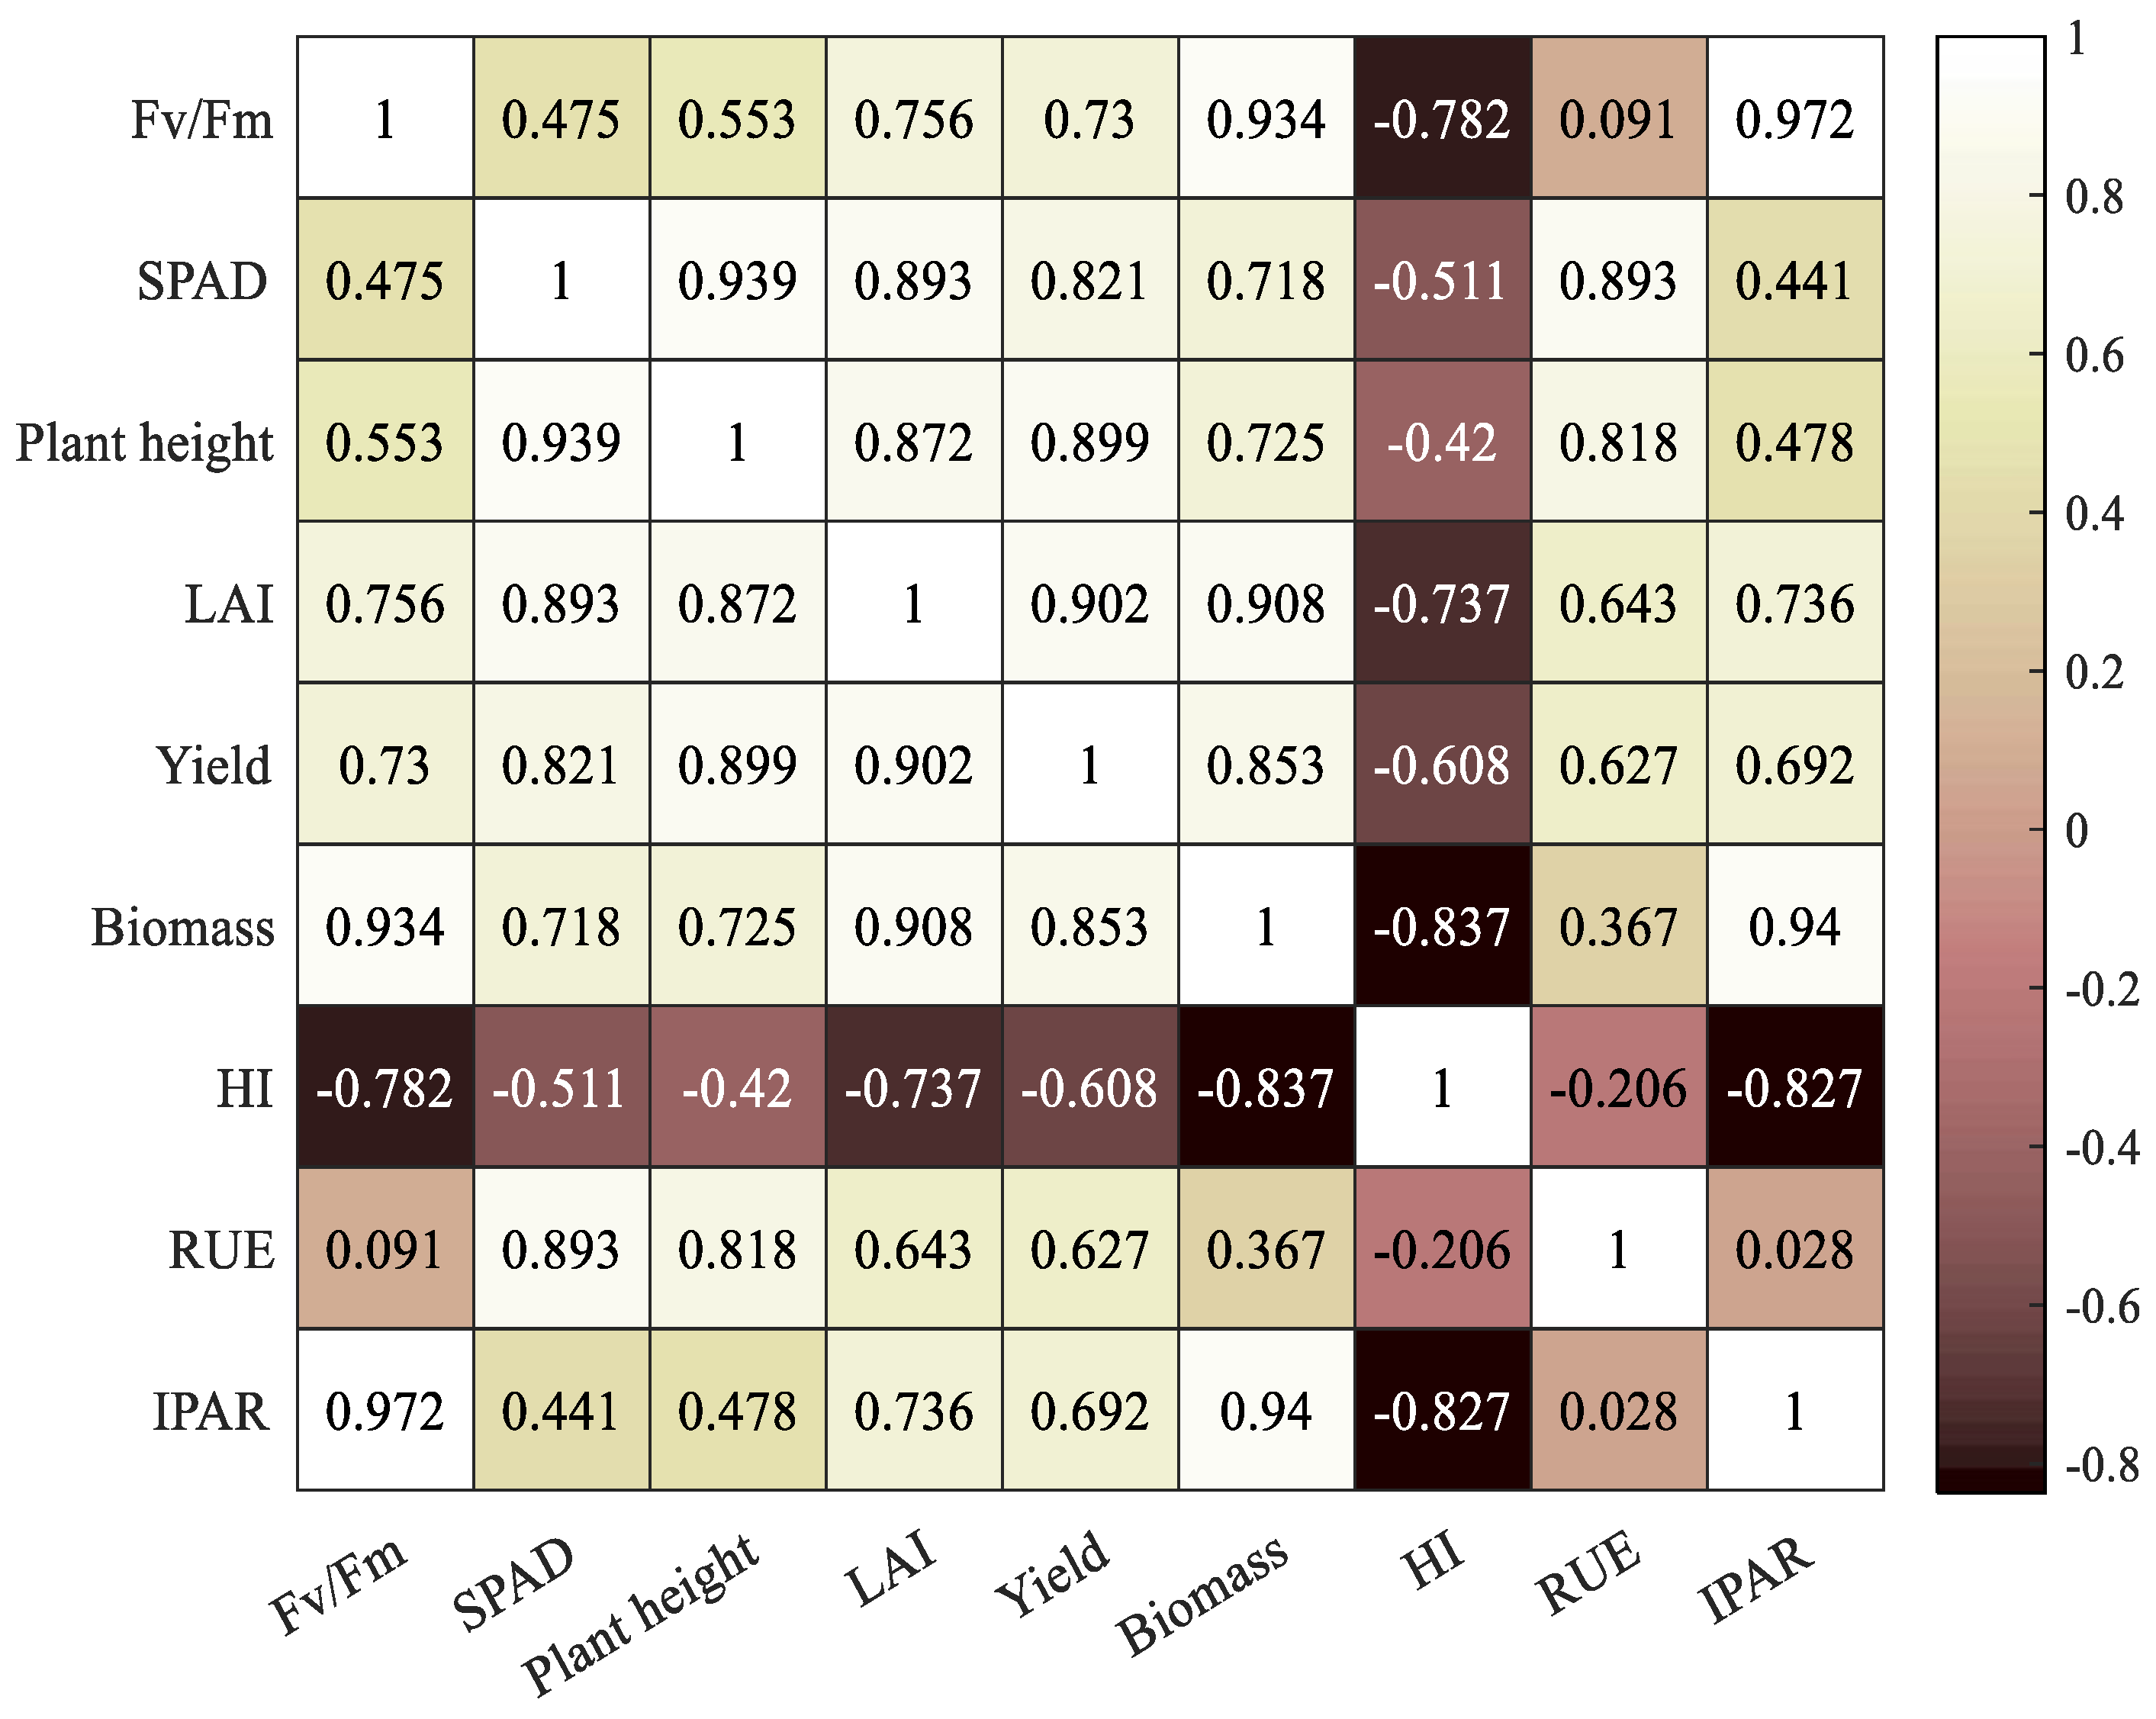
Principal component analysis requires a strong correlation among the variables. Here, the correlation coefficients of most of the variables were greater than 0.3 (Figure 5). Therefore, principal component analysis could be used. In our study, the KMO (Kaiser–Meyer–Olkin) value was 0.570, and the P value of Bartlett’s sphericity test was 0.000 (less than 0.05), further indicating that the data were suitable for principal component analysis.
Through the analysis of total variance, it was concluded that the eigenvalues of the first principal component and the second principal component were 6.577 and 1.851, respectively, and the eigenvalue of the third principal component was 0.352 (i.e., less than 1). Therefore, the first two principal components were selected, and the total variance interpretation of the two principal components reached 93.645%. Selecting the two principal components could explain 93.645% of the variation of the 9 variables and was suitable for the general comprehensive analysis.
The principal component expressions were as follows:
The principal component expressions were:
Comprehensive score:
where Y1 is the first principal component score, Y2 is the second principal component score, and Y is the comprehensive score.
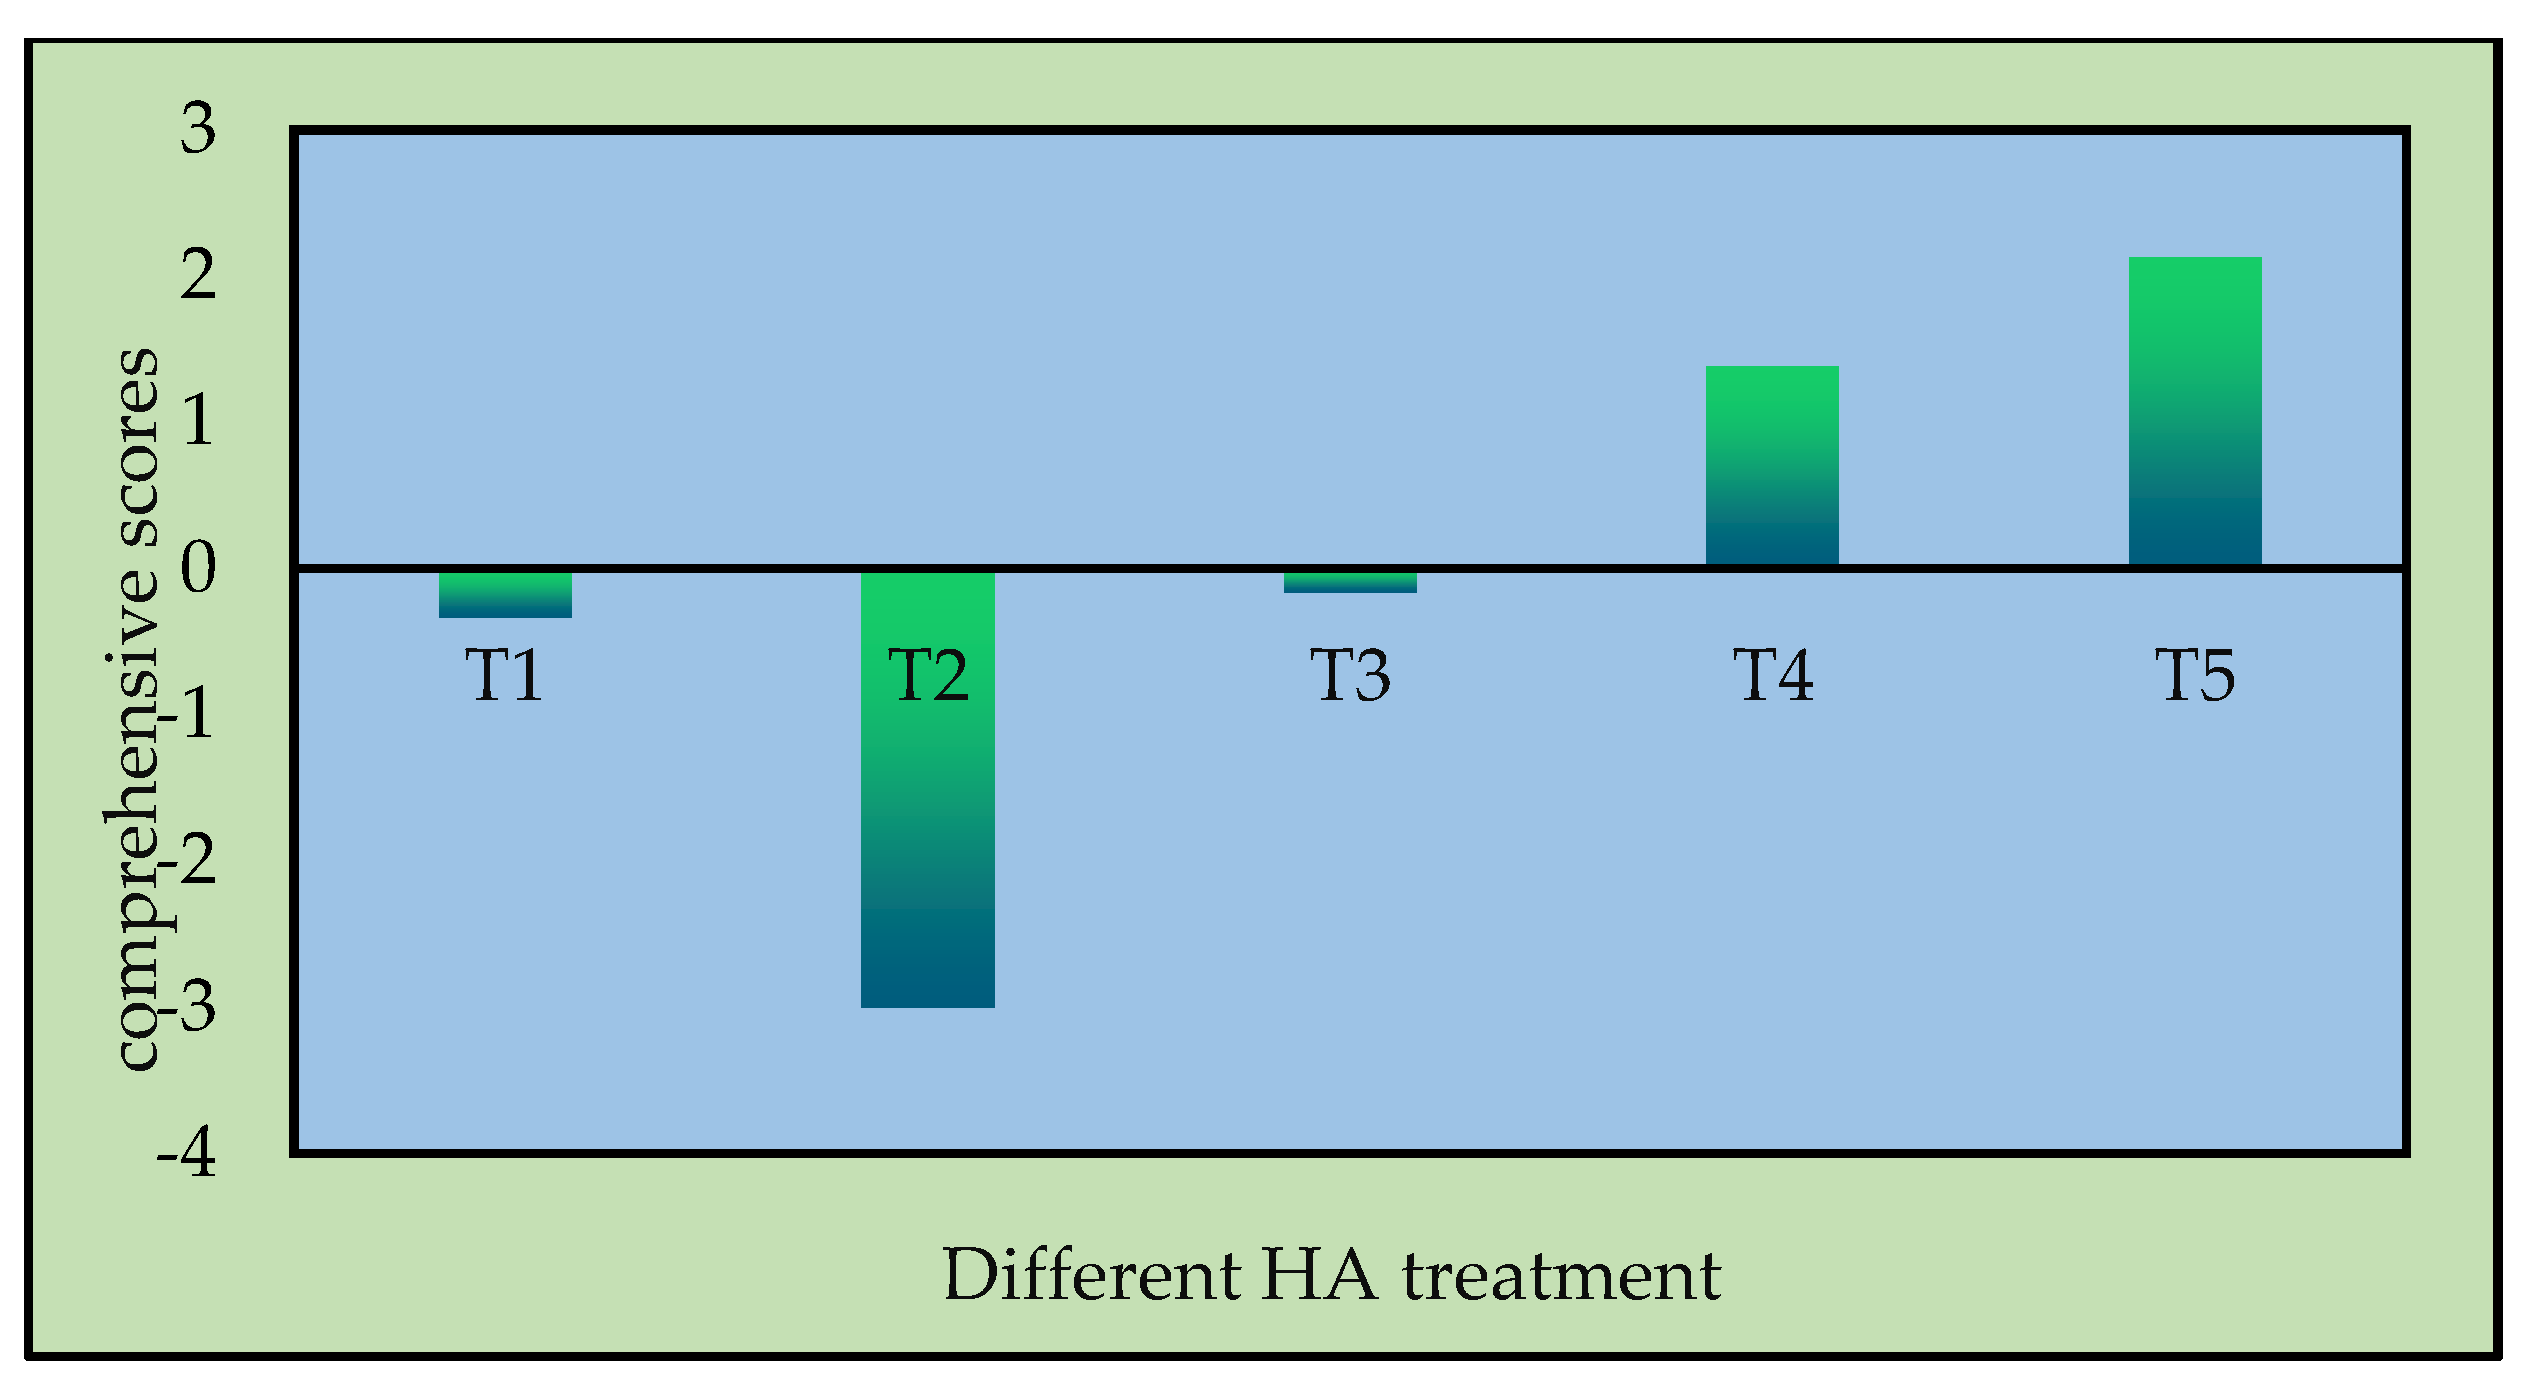
In the first principal component, the LAI, biomass, yield, plant height, SPAD, Fv/Fm, IPAR, and RUE had a positive correlation, and the HI had a negative correlation. The LAI, yield, plant height, SPAD, HI, and RUE had a positive correlation, but the biomass, Fv/Fm, and IPAR had a negative correlation in the second principal component. Considering the different humic acid fertilizer treatments, the comprehensive scores were T5 > T4 > T3 > T1 > T2, with values of 2.13, 1.38, −0.17, −0.34, and −3.00, respectively (Figure 6). According to the principal component analysis results of each index, the T5 treatment was the best HA treatment.
4. Discussions
An increase in Fv/Fm is helpful for photosynthetic pigment molecules to convert captured light energy into chemical energy with a faster efficiency [22], provide energy for crop carbon assimilation, improve the photosynthetic rate, and promote dry matter accumulation. In our study, the Fv/Fm increased with increasing HA. However, the Fv/Fm in the T2 treatment was lower than that in the T1 treatment, on which urea was applied, indicating that the light reaction process of photosynthesis was inhibited to a certain extent when a lower HA was applied. The results were consistent with Yang et al. [23], which showed that organic fertilizer could reduce the degree of photo-inhibition and the proportion of non-photochemical dissipation, and improve the utilization rate of light energy. SPAD is an important pigment in plant photosynthesis [24], and its content can indicate the accumulation of plant photosynthetic products and is positively correlated with the photosynthetic capacity of plants. Our study showed that different HA treatments had a significant impact on the SPAD, which first increased and then decreased as the growth period progressed, while the SPAD of the T4 and T5 treatments in the entire growth period was higher than that of the other treatments, indicating that the application of HA can promote rice photosynthesis, promote plant growth, obtain a higher photosynthetic efficiency, and produce and accumulate more organic matter. These results were also in accordance with Cao et al. [25] and Zhang et al. [26].
Rational fertilization is an effective means of improving crop yield. This experimental study showed that the application of HA could affect the growth and radiation utilization of rice, as similarly reported by Kalteh et al. [27]. Based on this analysis of two years of experimental data, compared with the T4 and T5 treatments, the other HA and urea treatments had no obvious impact on the growth of rice. In the two growth seasons, the plant height growth rate in the T4 and T5 treatments was significantly higher than that in the other treatments. Khattak and Dost [28] also reported an increase in plant height with HA, which suggested that the application of HA with different fertilizers may have beneficial effects on plant growth and nutrient uptake. This could be associated with the capability of HA to improve the biochemical environment of the soil by promoting soil enzymatic activity, microbial activity and populations, cation exchange capacity, and water retention of the soil that ultimately enhance plant growth and nutrient uptake. These results were also in accordance with Tahir et al. [29], who reported that the application of HA significantly improved plant height. LAI is an important agronomic parameter that reflects crop growth and predicts crop yield; almost all biomass is formed through its photosynthesis, and it is also one of the most important indices for evaluating the photosynthetic performance of plant populations. The results showed that the LAI increased gradually with increasing HA and increased significantly at the heading stage, which was also in accordance with Ye et al. [30]. An appropriate leaf area index is the basis of a high yield of rice. Appropriate increases in leaf area can promote the formation of effective panicles, grains per panicle and full grains per panicle, and improve the seed setting rate, which provides scientific support for increasing the application of HA to improve the radiation interception rate of rice and ultimately, increase the yield [31].
To a certain extent, the characteristics of light distribution within a population affect crop photosynthesis and crop yield. In our study, the light interception rate of the crops first increased and then decreased, and had a good correlation with the green leaf area, showing an increasing trend with the increase in HA, which was similar to the results of Liu et al. [32]. The light energy utilization rate was closely related to crop light interception and bio-accumulation. To improve the crop light energy utilization rate, one method is to improve the light energy conversion efficiency, and the other is to increase light interception. It was found that with the increase in HA, the RUE gradually increased, and was significantly higher than that of the other treatments under the T4 and T5 treatments, but there was no significant difference between them. The possible reason was that after the light interception reached a certain limit, continuing to improve the light interception rate led to a rapid decline in light conversion efficiency. Therefore, high light interception may inhibit crop growth and development, as suggested by Chen et al. [33]. Comparing the RUE of crops in different periods, the RUE was low in the early and late growth stages of the rice. Meng et al. [34] and Liu et al. [35] also obtained the same results. The possible reason was that the leaves in the early stage are small and no new leaves are produced in the late growth stage of crops, and that the photosynthetic capacity of existing leaves gradually weakens, which reduces the light energy utilization rate of the crops. The improvement of crop yield and resource efficiency is of great importance to food security, and crop yield mainly depends on the RUE of crops. Photosynthesis is the basic process of the formation of primary productivity of green plants, and the basic link among light energy absorption, fixation, and transformation, which are closely related to crop yield [36]. This study also found that changing the fertilization method could increase the radiation interception rate and RUE. Appropriately increasing the radiation interception rate and RUE are key factors to improving the dry matter and yield of rice. Through the analysis of rice agronomic characteristics and RUE under different HA conditions, it was concluded that the T4 and T5 treatments had obvious advantages, and the T5 treatment was better based on principal component analysis.
5. Conclusions
In this study, the application of 1500 kg∙ha−1 HA to paddy fields increased rice radiation use, growth, and yield more than other treatments. Under the T5 treatment, the yield and biomass increased by 5.6% and 21.3%, respectively, in Y1, and by 7.0% and 23.0%, respectively, in Y2, relative to the other treatments on average. Moreover, the application of 1500 kg∙ha−1 HA significantly increased the LAI and SPAD, and improved the RUE. In the two years, the T4 and T5 treatments showed no significant difference. However, based on the two years of data, the principal component analysis method used to evaluate the different treatments found that, across all treatments, the comprehensive scores were T5 > T4 > T3 > T1 > T2, with values of 2.13, 1.38, −0.17, −0.34, and −3.00, respectively. According to the principal component analysis results of each index, the T5 treatment was better than the T4 treatment.
Author Contributions
Conceptualization, E.Z. and T.X.; methodology, E.Z.; software, M.Q.; validation, Z.Z.; formal analysis, M.Q.; investigation, M.Q.; resources, E.Z.; data curation, M.Q.; writing—original draft preparation, E.Z.; writing—review and editing, M.Q.; visualization, Z.Z.; supervision, Z.Z.; project administration, T.X.; funding acquisition, T.X. All authors have read and agreed to the published version of the manuscript.
Funding
This work was jointly supported by the Basic Scientific Research Fund of the Heilongjiang Provincial Universities (2020-KYYWF-1042).
Institutional Review Board Statement
Not applicable.
Informed Consent Statement
Not applicable.
Data Availability Statement
The data presented in this study are available on request from the corresponding author.
Conflicts of Interest
All authors declare no conflicts of interest.
References
- Chen, P.; Xu, J.; Zhang, Z.; Wang, K.; Li, T.; Wei, Q.; Li, Y. Carbon pathways in aggregates and density fractions in Mollisols under water and straw management: Evidence from 13C natural abundance. Soil Bio. Biochem. 2022, 169, 108684. [Google Scholar] [CrossRef]
- Liang, J. Accelerate the construction of long-term mechanism for black land protection in Longjiang. Heilongjiang Dly. 2021. [Google Scholar]
- Zhang, D.J.; Hu, X.; Ma, J.H.; Guo, Y.X.; Zong, J.J.; Yang, X.Q. Effects of tillage and fertility on soil nitrogen balance and greenhouse gas emissions of wheat-maize rotation system in Central Henan Province, China. Chin. J. Appl. Ecol. 2021, 32, 1753–1760. [Google Scholar]
- Chen, P.; Nie, T.; Chen, S.; Zhang, Z.; Qi, Z.; Liu, W. Recovery efficiency and loss of 15N-labelled urea in a rice-soil system under water saving irrigation in the Songnen Plain of Northeast China. Agric. Water Manag. 2019, 222, 139–153. [Google Scholar] [CrossRef]
- Xu, D.B.; Zhao, S.J.; Yuan, J.F.; Peng, C.L.; Zhou, J.X.; Xia, X.G.; Lu, G.H. Chemical N fertilizer replaced with organic fertilizer affecting yield and quality of leaf vegetable and N leaching in soils. Trans. Chin. Soc. Agric. Eng. 2018, 34 (Suppl. S1), 13–18. [Google Scholar]
- Lu, S.C.; Wang, X.B.; Weng, F.J.; Wang, R.; Xiao, J.Z. Effect of different fertilization treatments on soil nitrate nitrogen movement and the growth and quality of celery in greenhouse. Tianjin Agric. Sci. 2015, 21, 8–11. [Google Scholar]
- Li, Y.B.; Li, P.; Wang, S.H.; Xu, L.Y.; Deng, J.J.; Jiao, J.G. Effects of organic fertilizer application on crop yield and soil properties in rice-wheat rotation system: A meta-analysis. Chin. J. Appl. Ecol. 2021, 32, 3231–3239. [Google Scholar]
- Huang, G.D.; Song, Q.H.; Wang, X.H.; Wang, X.; Feng, Y.; Sun, S.; Li, H.; Zhang, Z.; Wang, N.; Song, F. Effects of fertilizers containing bacillus subtilis on photosynthesis of soybean leaves and soil enzyme activities. Soils Crops 2021, 10, 99–107. [Google Scholar]
- Zhang, Z.X.; Feng, Z.J.; Qi, Z.J.; Zheng, E.N.; Yang, H.; Chen, P. Effects of compound microbial organic fertilizer with water-saving irrigation on photosynthetic and yield of rice. Trans. Chin. Soc. Agric. Mach. 2019, 50, 313–321. [Google Scholar]
- He, H.; Zhang, Y.T.; Wei, C.Z.; Li, J. Effects of different organic substitution reducing fertilizer patterns on maize growth and soil fertility. J. Soil Water Conserv. 2019, 33, 281–287. [Google Scholar]
- Xie, S.; Yang, F.; Feng, H.; Yu, Z.; Liu, C.; Wei, C.; Liang, T. Organic fertilizer reduced carbon and nitrogen in runoff and buffered soil acidification in tea plantations: Evidence in nutrient contents and isotope fractionations. Sci. Total Environ. 2021, 762, 143059. [Google Scholar] [CrossRef] [PubMed]
- Liang, J.P.; Xue, Z.Q.; Yang, Z.Y.; Chai, Z.; Niu, J.P.; Shi, Z.Y. Effects of microbial organic fertilizers on astragalus membranaceus growth and rhizosphere microbial community. Ann. Microbiol. 2021, 71, 11. [Google Scholar] [CrossRef]
- Shu, X.; Wang, Y.; Wang, Y.; Ma, Y.; Men, M.; Zheng, Y.; Xue, C.; Peng, Z.; Noulas, C. Response of soil N2O emission and nitrogen utilization to organic matter in the wheat and maize rotation system. Sci. Rep. 2021, 11, 4396. [Google Scholar] [CrossRef] [PubMed]
- Zhang, Q.W. Protect the black land and be a good “ballast” for national food security. Environ. Sci. Manag. 2021, 46, 1. [Google Scholar]
- Ma, X.; Li, H.; Xu, Y.; Liu, C. Effects of organic fertilizers via quick artificial decomposition on crop growth. Sci. Rep. 2021, 11, 3900. [Google Scholar] [CrossRef] [PubMed]
- Yu, X.F.; Yang, S.M.; Zou, B.L.; Xie, Y.; Liu, J.; Zhang, R.; Lv, Y.; Cai, Y.; Zhang, S.; Li, J.; et al. Effects of combined application of rapeseed-cake as organic manure and chemical fertilizer on yield, quality and nutrient use efficiency of flue-cured tobacco. Acta Pedol. Sin. 2020, 57, 1564–1574. [Google Scholar]
- Du, W.Y.; Tang, S.; Wang, H. The status of organic fertilizer industry and organic fertilizer resources in China. Soil Fertil. Sci. China 2020, 3, 210–219. [Google Scholar]
- Zheng, E.; Zhu, Y.; Hu, J.; Zhang, Z.; Xu, T. Effects of humic acid on japonica rice production under different irrigation practices and a TOPSIS-based assessment on the Songnen Plain, China. Irrig. Sci. 2022, 40, 87–101. [Google Scholar] [CrossRef]
- Zheng, E.N.; Yang, H.; Zhang, Z.X. Influence of different nitrogen forms application on rice photosynthesis: Fluorescence with water-saving irrigation in black soil region of Songnen Plain, Northeast China. Paddy Water Environ. 2018, 16, 795–804. [Google Scholar]
- Zheng, E.; Zhang, C.; Qi, Z.; Zhang, Z. Experimental study on radiation utilization efficiency and soil temperature in paddy field with different irrigation methods in northeast china. Paddy Water Environ. 2020, 18, 179–191. [Google Scholar] [CrossRef]
- Du, X.; Chen, B.; Shen, T.; Zhang, Y.; Zhou, Z. Effect of cropping system on radiation use efficiency in double cropped wheat-cotton. Field Crops Res. 2015, 170, 21–31. [Google Scholar] [CrossRef]
- Zhang, Z.X.; Zheng, E.N.; Wang, C.M.; Fu, N.H. Effect of different water and nitrogen levels on chlorophyll fluorescence parameters and photosynthetic characteristics of rice. Trans. Chin. Soc. Agric. Mach. 2017, 48, 176–183. [Google Scholar]
- Yang, F.F.; Li, C.F.; Liu, D. Effects of organic fertiizer on photosynthetic characteristics and yield of sugar beet under miixed salinealkali stress. Journl Northwest AF Univ. 2019, 47, 74–82. [Google Scholar]
- Wang, B.K.; Yu, D.B.; Zhao, H.Y.; Meng, F.G.; Zhang, W.; Wei, D.X.; Li, Z.G. Analysis of net photosynthetic rate and SPAD values of super-high yield soybean leaves at different nodes during different developing stages. Soybean Sci. 2022, 41, 172–178. [Google Scholar]
- Dan, C.; Liang-Gang, Z.; Jun, X.; Qian, Z.; Yan, Z. Effects of bio-fertilizer on organically cultured cucumber growth and soil biological characteristics. Chin. J. Appl. Ecol. 2010, 21, 2587–2592. [Google Scholar]
- Zhang, C.C.; Shangguan, C.P. Effects of nitrogen fertilizeration on photosynthethc pigment and fluorescence characteristics in leaves of winter wheat cultivars on deyland. J. Nucl. Agric. Sci. 2007, 21, 299–304. [Google Scholar]
- Kalteh, M.; Norouzi, H.A.; Faraji, A.; Haghighi, A.A.; Alamdari, E.G. Effect of plant density, humic acid and weed managements on yield, yield components and water use efficiency in direct-seeded rice (Oryza sativa) production. Rom. Agric. Res. 2021, 38, 311–321. [Google Scholar]
- Khattak, R.A.; Dost, M. Seed cotton yield and nutrient concentrations as influenced by lignitic coal derived humic acid in salt-affected soils. Sarhad J. Agric. 2010, 26, 43–49. [Google Scholar]
- Tahir, M.M.; Khurshid, M.; Khan, M.Z.; Abbasi, M.K.; Kazmi, M.H. Lignite-derived humic acid effect on growth of wheat plants in different soils. Pedosphere 2011, 21, 124–131. [Google Scholar] [CrossRef]
- Ye, H.C.; Huang, Q.H.; Yu, X.C.; Xu, X.L.; Liao, Z.M.; Chen, M. Effects of long-term application of potassium and organic fertilizer on leaf area index and yield components of rice in red soil paddy field. Acta Agric. Jiangxi. 2010, 22, 6–9. [Google Scholar]
- Wei, Y.H.; He, S.H.; Xu, C.M. Influence of water-fertilizer coupling on rice LAI and yield under the condition of controlling irrigation. Syst. Sci. Compr. Agric. 2010, 26, 500–505. [Google Scholar]
- Liu, T.; Yang, X.G.; Gao, J.Q.; He, B.; Bai, F.; Zhang, F.; Liu, Z.; Wang, X.; Sun, S.; Wan, N.; et al. Radiation use efficiency of different grain crops in northeast China. Trans. Chin. Soc. Agric. Eng. 2020, 36, 186–193. [Google Scholar]
- Chen, Y.H.; Yu, S.L.; Yu, Z.W. Relationship between amount or distribution of PAR interception and grain output of wheat communities. Acta Agron. Sin. 2003, 29, 730–734. [Google Scholar]
- Meng, X.; Zhou, L.; Zhang, Z.; Wu, Q. Effects of different irrigation patterns on growth, water and radiation use efficiency of rice. Trans. Chin. Soc. Agric. Mach. 2019, 50, 285–292. [Google Scholar]
- Liu, T.D.; Song, F.B. The effect of wide-narrow row planting pattern on light interception and RUE of maize. Acta Agric. Boreali-Sin. 2011, 26, 118–123. [Google Scholar]
- Liu, Z.; Sun, N. Enhancing photosynthetic CO2 use efficiency in rice: Approaches and challenges. Acta Physiol. Plant. 2013, 35, 1001–1009. [Google Scholar] [CrossRef]
Figure 1.
Location of study site.

Figure 2.
Fv/Fm (a,b) and SPAD (c,d) under the different HA treatments. Note: T1 represents 100% N (110 kg∙ha−1), T2 represents 70% N and 30% HA, T3 represents 50% N and 50% HA, T4 represents 30% N and 70% HA, T5 represents 0% N and 100% HA (1500 kg∙ha−1), and T, J, H and R represent the tillering, jointing, heading, and ripening stages, respectively.

Figure 3.
The plant height (a,b) and LAI (c,d) under the different HA treatments.

Figure 4.
The yield, biomass, and the HI under the different HA treatments.

Figure 5.
Evaluation index correlation matrix. Note: Fv/Fm represents the photosynthetic efficiency of PSII; SPAD represents the relative leaf chlorophyll content; LAI represents the leaf area index; HI represents the harvest index; RUE represents the radiation use efficiency, and IPAR represents the amount of intercepted photosynthetically active radiation.

Figure 6.
The comprehensive scores based on the principal component analysis.


Table 1.
The different fertilizer treatments.
| Treatments | Pure Nitrogen N (kg∙ha−1) | HA (kg∙ha−1) | P (kg∙ha−1) | K (kg∙ha−1) |
|---|---|---|---|---|
| T1 | 100% | 0 | 45 | 80 |
| T2 | 70% | 30% | 45 | 80 |
| T3 | 50% | 50% | 45 | 80 |
| T4 | 30% | 70% | 45 | 80 |
| T5 | 0 | 100% | 45 | 80 |
Table 2.
The RUE at different stages with different HA treatments.
| The Key Stages (g·MJ−1) | The Key Stages (Fd%) | The Whole Stage | ||||||||||
|---|---|---|---|---|---|---|---|---|---|---|---|---|
| Years | Treatments | Tillering | Jointing | Heading | Ripening | Tillering | Jointing | Heading | Ripening | Fd% | IPAR (MJ·m−2) | RUE (g·MJ−1) |
| T1 | 1.67 a | 1.86 ab | 1.68 ab | 0.87 a | 16.03 c | 63.92 c | 78.11 c | 62.65 c | 47.45 b | 1036 b | 1.80 a | |
| T2 | 1.68 a | 1.78 b | 1.49 c | 0.87 a | 12.92 d | 60.18 d | 74.66 d | 56.46 d | 42.54 c | 937 c | 1.71 b | |
| Y1 | T3 | 1.62 a | 1.89 ab | 1.65 b | 0.85 a | 17.22 c | 65.34 c | 79.14 a | 64.37 c | 48.01 b | 1051 b | 1.79 a |
| T4 | 1.64 a | 1.98 a | 1.76 a | 0.89 a | 19.24 b | 72.36 b | 87.52 b | 71.87 b | 53.47 a | 1170 a | 1.85 a | |
| T5 | 1.68 a | 1.93 a | 1.76 a | 0.87 a | 22.58 a | 74.85 a | 90.15 a | 75.50 a | 56.36 a | 1234 a | 1.85 a | |
| T1 | 1.69 a | 2.21 b | 2.38 ab | 1.05 a | 23.15 b | 70.74 c | 82.78 c | 69.05 b | 49.73 b | 906 b | 1.95 a | |
| T2 | 1.66 a | 1.72 c | 1.92 c | 1.03 a | 16.23 c | 58.01 a | 73.17 d | 56.10 c | 39.31 c | 717 c | 1.83 b | |
| Y2 | T3 | 1.69 a | 2.24 b | 2.27 b | 1.04 a | 23.32 b | 71.44 c | 83.10 c | 68.99 b | 50.00 b | 910 b | 1.96 a |
| T4 | 1.67 a | 2.37 a | 2.45 a | 1.02 a | 30.31 a | 79.84 b | 90.98 a | 76.83 a | 56.56 a | 1034 a | 2.00 a | |
| T5 | 1.62 a | 2.38 a | 2.44 a | 1.01 a | 31.42 a | 82.90 a | 92.52 a | 78.15 a | 58.03 a | 1060 a | 2.01 a | |
Note: Mean values followed by different letters within columns differ significantly at p < 0.05 according to Duncan’s range test. RUE represents radiation use efficiency. IPAR represents the amount of intercepted photosynthetically active radiation. Fd represents the daily fraction of intercepted light.
Publisher’s Note: MDPI stays neutral with regard to jurisdictional claims in published maps and institutional affiliations. |
© 2022 by the authors. Licensee MDPI, Basel, Switzerland. This article is an open access article distributed under the terms and conditions of the Creative Commons Attribution (CC BY) license (https://creativecommons.org/licenses/by/4.0/).
Share and Cite
MDPI and ACS Style
Zheng, E.; Qin, M.; Zhang, Z.; Xu, T. Humic Acid Fertilizer Incorporation Increases Rice Radiation Use, Growth, and Yield: A Case Study on the Songnen Plain, China. Agriculture 2022, 12, 653. https://doi.org/10.3390/agriculture12050653
AMA Style
Zheng E, Qin M, Zhang Z, Xu T. Humic Acid Fertilizer Incorporation Increases Rice Radiation Use, Growth, and Yield: A Case Study on the Songnen Plain, China. Agriculture. 2022; 12(5):653. https://doi.org/10.3390/agriculture12050653
Chicago/Turabian StyleZheng, Ennan, Mengting Qin, Zhongxue Zhang, and Tianyu Xu. 2022. "Humic Acid Fertilizer Incorporation Increases Rice Radiation Use, Growth, and Yield: A Case Study on the Songnen Plain, China" Agriculture 12, no. 5: 653. https://doi.org/10.3390/agriculture12050653
Note that from the first issue of 2016, this journal uses article numbers instead of page numbers. See further details here.