
Optimization of Strip Fertilization Planter for Straw Throwing and Paving

1
College of Engineering, Nanjing Agricultural University, Nanjing 210031, China
2
School of Electronics & Information Engineering, Nanjing University of Information Science & Technology, Nanjing 210044, China
3
State Key Laboratory of Power System of Tractor, YTO Group Corporation, Luoyang 471039, China
*
Author to whom correspondence should be addressed.
Agriculture 2022, 12(5), 613; https://doi.org/10.3390/agriculture12050613
Submission received: 1 April 2022
/
Revised: 22 April 2022
/
Accepted: 24 April 2022
/
Published: 26 April 2022
(This article belongs to the Special Issue Innovations and Practices of Agricultural Green Mechanized Production Technology)
Abstract
:To enhance the operation effect and working performance of our previously developed strip fertilization planter for broken straw back throwing and inter-row laying, and to improve the stability of straw crushing and consistency of straw mulching between rows (broken straw inter-row mulching), the key operation parameters of the planter were optimized in this study. On the basis of determining the transmission route and matching power consumption, the discrete element method was used to establish a mechanical model of straw particles using the EDEM software, which was then imported into the rigid–flexible coupled system of the ‘shredded straw-mechanism’. Quadratic regression orthogonal methods and rotation combination experiments were then designed to carry out a DEM virtual simulation and numerical simulation, and the optimal combination of operating parameters affecting planter working performance was obtained, which was also verified by field tests. The simulation test results showed that the smashing spindle speed (A) had the most significant influence on the coefficient of variation (Y1) of straw crushing, followed by the planter working forward speed (C). The conveying impeller speed (B) had the most significant influence on the coefficient of variation (Y2) of inter-row straw mulching, also followed by (C). The optimal combination of operating parameters after optimization were A = 2060.79 rpm, B = 206.25 rpm, and C = 0.95 m·s−1, and the optimal working performance of the planter was obtained as Y1 = 8.51% and Y2 = 10.34%. The evaluation index results corresponding to the field test were Y1 = 9.35% and Y2 = 10.97%, which met the technical requirements of the relevant operation machinery; the relative errors of the simulation test results were 9.87% and 9.63%, respectively, indicating the effectiveness of the virtual numerical simulation and the rationality of the optimized operation parameters. Our results provide a technical reference for realizing high-quality and smooth no-tillage seeding operations.
1. Introduction
The effective promotion of conservation tillage technology based on straw returning and minimal/no tillage has improved the organic structure of soil, enhanced the agricultural ecological benefits, increased the soil fertility, and ensured the safety of national grain production [1,2,3]. However, due to the large amount of straw remaining in the field, the planting environment undergoes considerable changes, and it is difficult for traditional agricultural machinery to adapt to the operating conditions associated with returning straw to the field [4,5]. Therefore, there is a particularly urgent need to develop tillage and planting machinery that is suitable for straw returning.
At this stage, in view of the planting problem under the conditions of returning the full amount of crop straw to the field, scholars have mostly adopted methods such as straw crushing, throwing and covering, rotary tillage into the soil for burying, ditching and deep burial, and collecting straw on the side [6,7,8,9], so as to accelerate the decomposition of straw and facilitate the smooth operation of subsequent fertilization and sowing. Zhang Zhiqiang et al. designed an adjustable straw crushing, throwing, and returning machine. By optimizing the design of the crushing device, throwing device, and transmission device, the straw throwing width and uniformity after crushing could be adjusted [10]. Zhang Xinyue et al. developed the 1GSZ-350 combined machine for stubble removal and rotary tillage to solve the problems of small tillage width and high fuel consumption; the machine can complete multiple operations of stubble cleaning, rotary tillage, deep soiling, and ridge raising simultaneously [11]. Chen Qingchun et al. analyzed and compared the effects of straw mixing and burying under forward and reverse rotary tillage operations, and comparative tests of the straw burial of forward and reverse rotary tillage were conducted [12]. The 1JHL-2 straw deep burying and returning machine was developed by Lin Jing et al.; it collects two ridges of straw and buries them in a ditch in order to realize the alternate deep burying of straw in ridges and ditches and is able to complete multiple operations, such as straw crushing, collection, ditching, deep burying, and suppression, simultaneously [13]. The 2BMFJ series no-tillage precision seeder designed by Chen Haitao et al. adopts the method of lateral throwing to make the stubble collect on the side of the sowing area [14]. Wang Weiwei et al. developed an active straw shifting anti-blocking device based on the anti-blocking idea of “straw displacement”, which solved the problems of difficulty in sowing and the slow rise of low temperature in the later stage, and ensured the passability of the no-tillage planter when returning the full amount of straw to the field [15].
In recent years, Gu Fengwei and Hu Zhichao’s team have developed a series of no-tillage planters to solve the problem of the effects on crop yield induced by the return of straw to the field by the uniform throwing and returning of broken stubble [16], the controllable returning of broken stubble [17], and the collecting and returning of broken stubble between rows [18]. Shi Yinyan et al. designed a new device for full-volume straw crushing with strip paving and seed-belt cleaning that can complete multiple procedures, such as straw crushing, straw mulching between rows, seed belt cleaning and subsequent seed bed arrangement, fertilization and sowing, soil covering, and pressing, in a single operation [19,20,21]. Existing research on straw returning equipment mainly focuses on the design and creation of important components [22,23,24] or key structures [25,26,27] that achieve a specific function, and the optimization and evaluation of the operating parameters and performance of the equipment itself are insufficiently explored.
Therefore, in order to better evaluate its working performance and optimize its operation parameters, the main working parameters of the developed strip fertilization planter for broken straw back throwing and inter-row laying were optimized in this study through the experimental investigation and analysis of the operation effects and working performance. The optimal combination of operation parameters was obtained by discrete element simulation and response surface optimization analysis, and field tests were carried out to verify the optimal working performance in order to provide technical references for improving the operation effect of no-tillage seeding under the conditions of crushing and returning the full amount of straw to the field.
In order to simplify the issues to be solved and improve the simulation model reasonability, the following assumptions were put forward, which contributed to making our research results more accurate, reliable, credible, and convincing: (1) The influence of atmospheric, wind speed, and other environmental factors on the test process was not considered. (2) It was assumed that the rice straw was covered uniformly and the water content was consistent within the working range. (3) The rice straw was assumed as the theoretical flexible body particle model. (4) It was assumed that the forward working speed of the fertilizing planter was stable during operation.
2. Machine Structure and Working Principle
2.1. Overall Structure
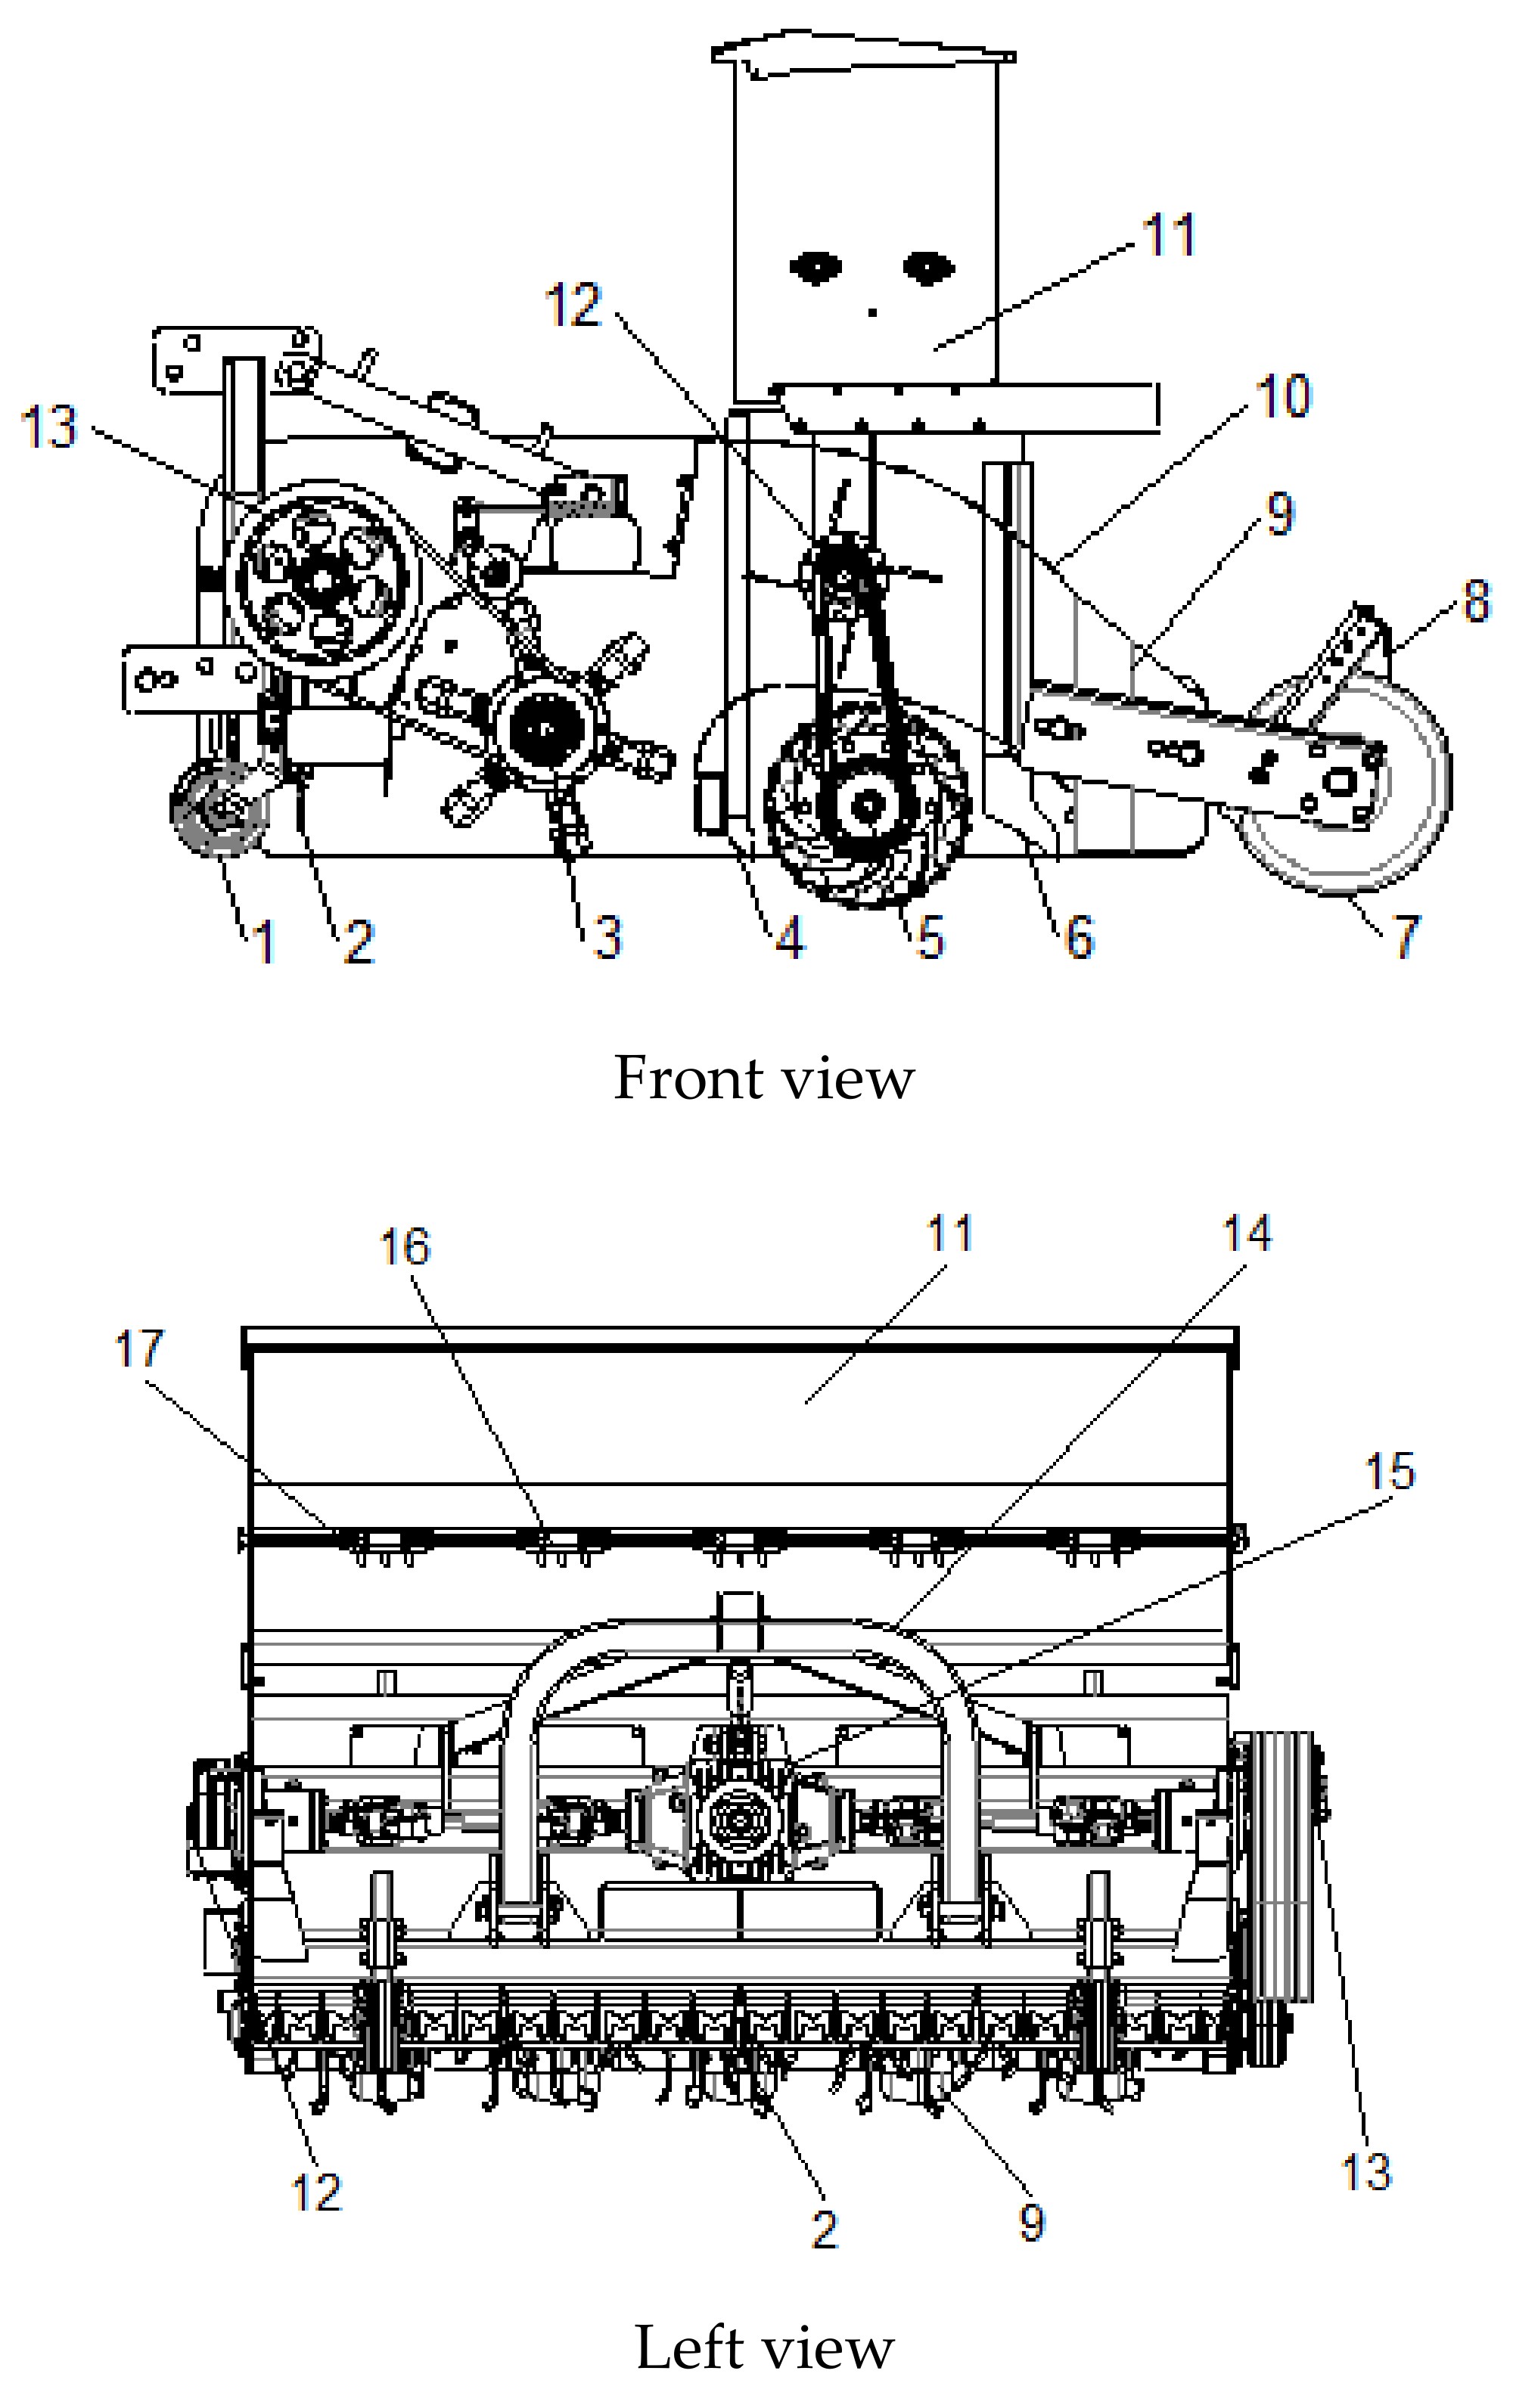
As shown in Figure 1, the overall structure of the developed strip fertilization planter for broken straw back throwing and inter-row laying is mainly composed of a frame, a power transmission system, a straw crushing device, a crushed straw conveying and diverting device, a rotary tillage device, a fertilization and seeding device, a suppression device, and other components.
2.2. Working Process
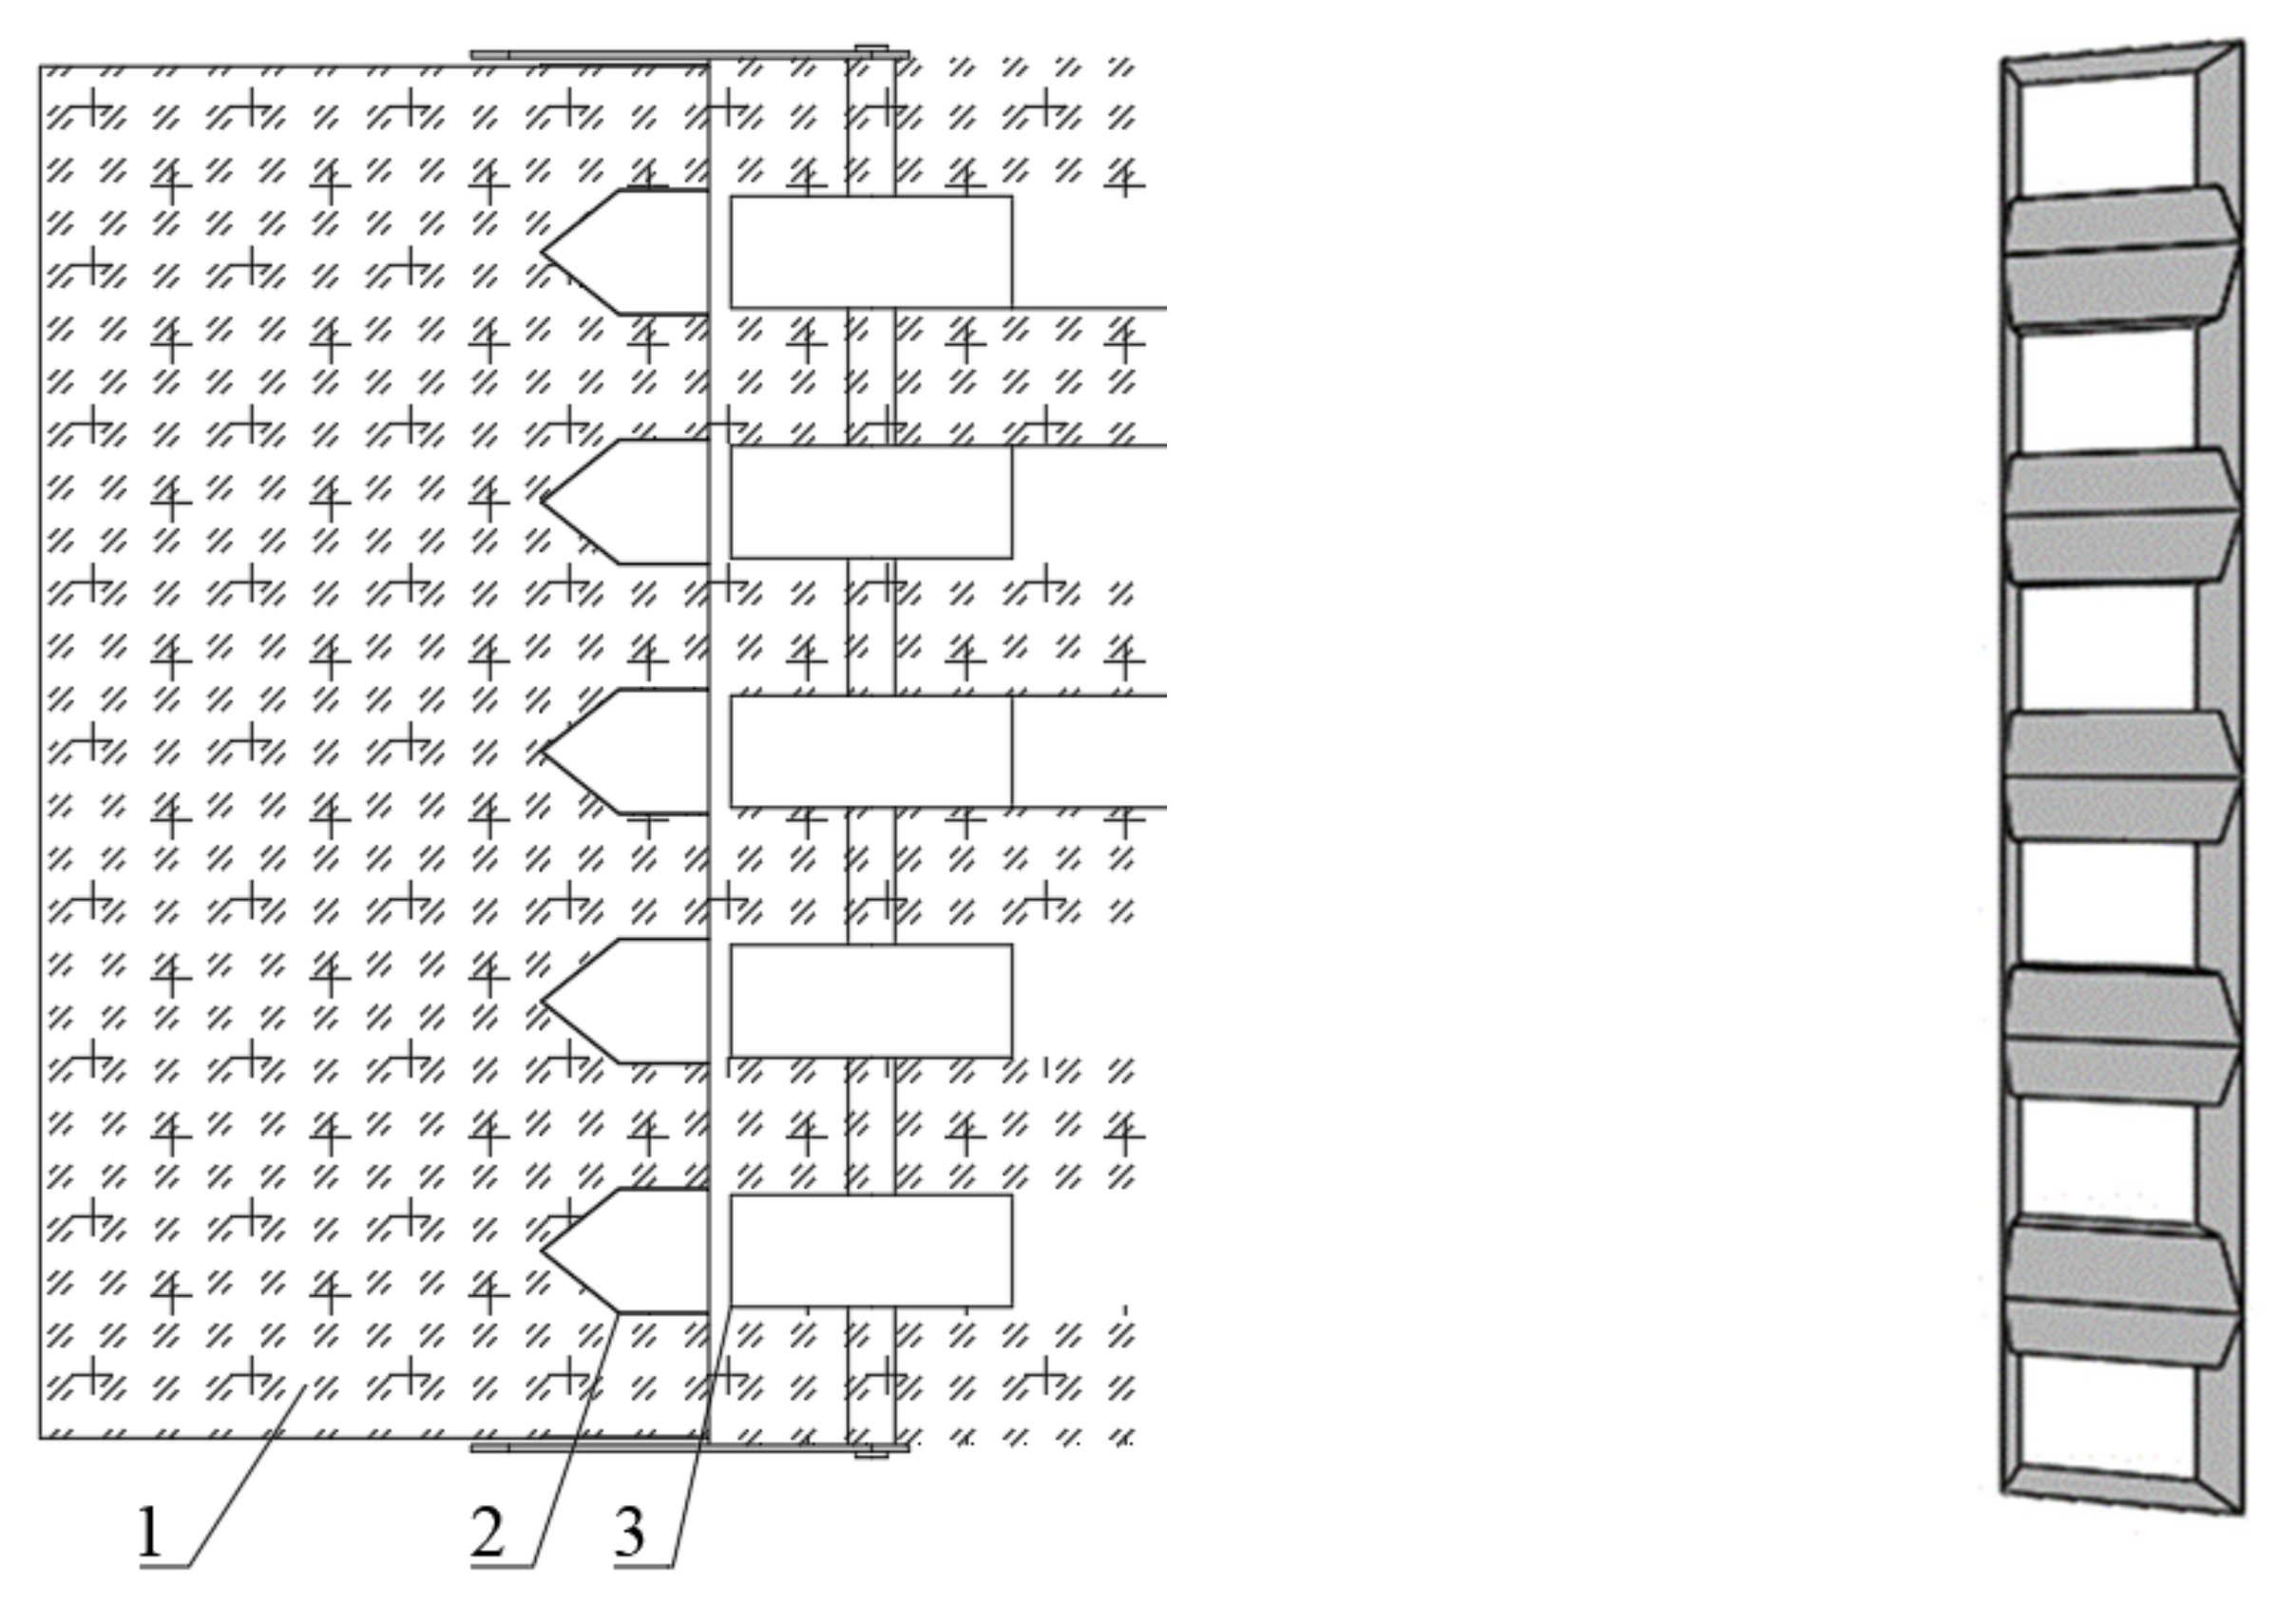
In a ‘clean area’ with no straw obstacles, the developed strip fertilization planter is driven by three-point suspension. When the machine moves forward, the crushing blades rotate in the rear direction through the speed change transmission mechanism; the straw entering the protection curtain is picked up by the high-speed airflow and the high-speed impact of the moving blades and is smashed by the fixed blades. The crushed straw sprayed backward in the cavity is captured by the throwing device and then accelerated and sprayed to the rear, where it is guided by the straw diversion device to be laid in the non-sowing area in the middle of the ground wheels. A temporary straw-free area is formed between the straw picking/crushing device and the ground wheel, which avoids the interference of the straw with the rotary tillage and seed bed arrangement and creates a planting and fertilizing condition without a straw barrier. At the same time, the crushed straw is paved in the non-sowing area to form a straw belt, which has the effects of water retention, moisture retention, and heat preservation. The working process of straw strip paving is shown in Figure 2.
The straw diverting and strip-laying device is a key component to complete the process of broken straw collection and covering between the rows. The broken straw thrown backward by the rotating blades is blocked by five sets of control devices in a fixed array at the outlet of the conveying cavity and then flows along the two sides of the guide deflector, until it slides down to the soil surface of the non-seed belt and is paved on the ground surface to form six regular straw-covered belts. Meanwhile, five clean area seeding belts are formed between adjacent straw-covered belts, corresponding to the diversion control device.
2.3. Transmission System
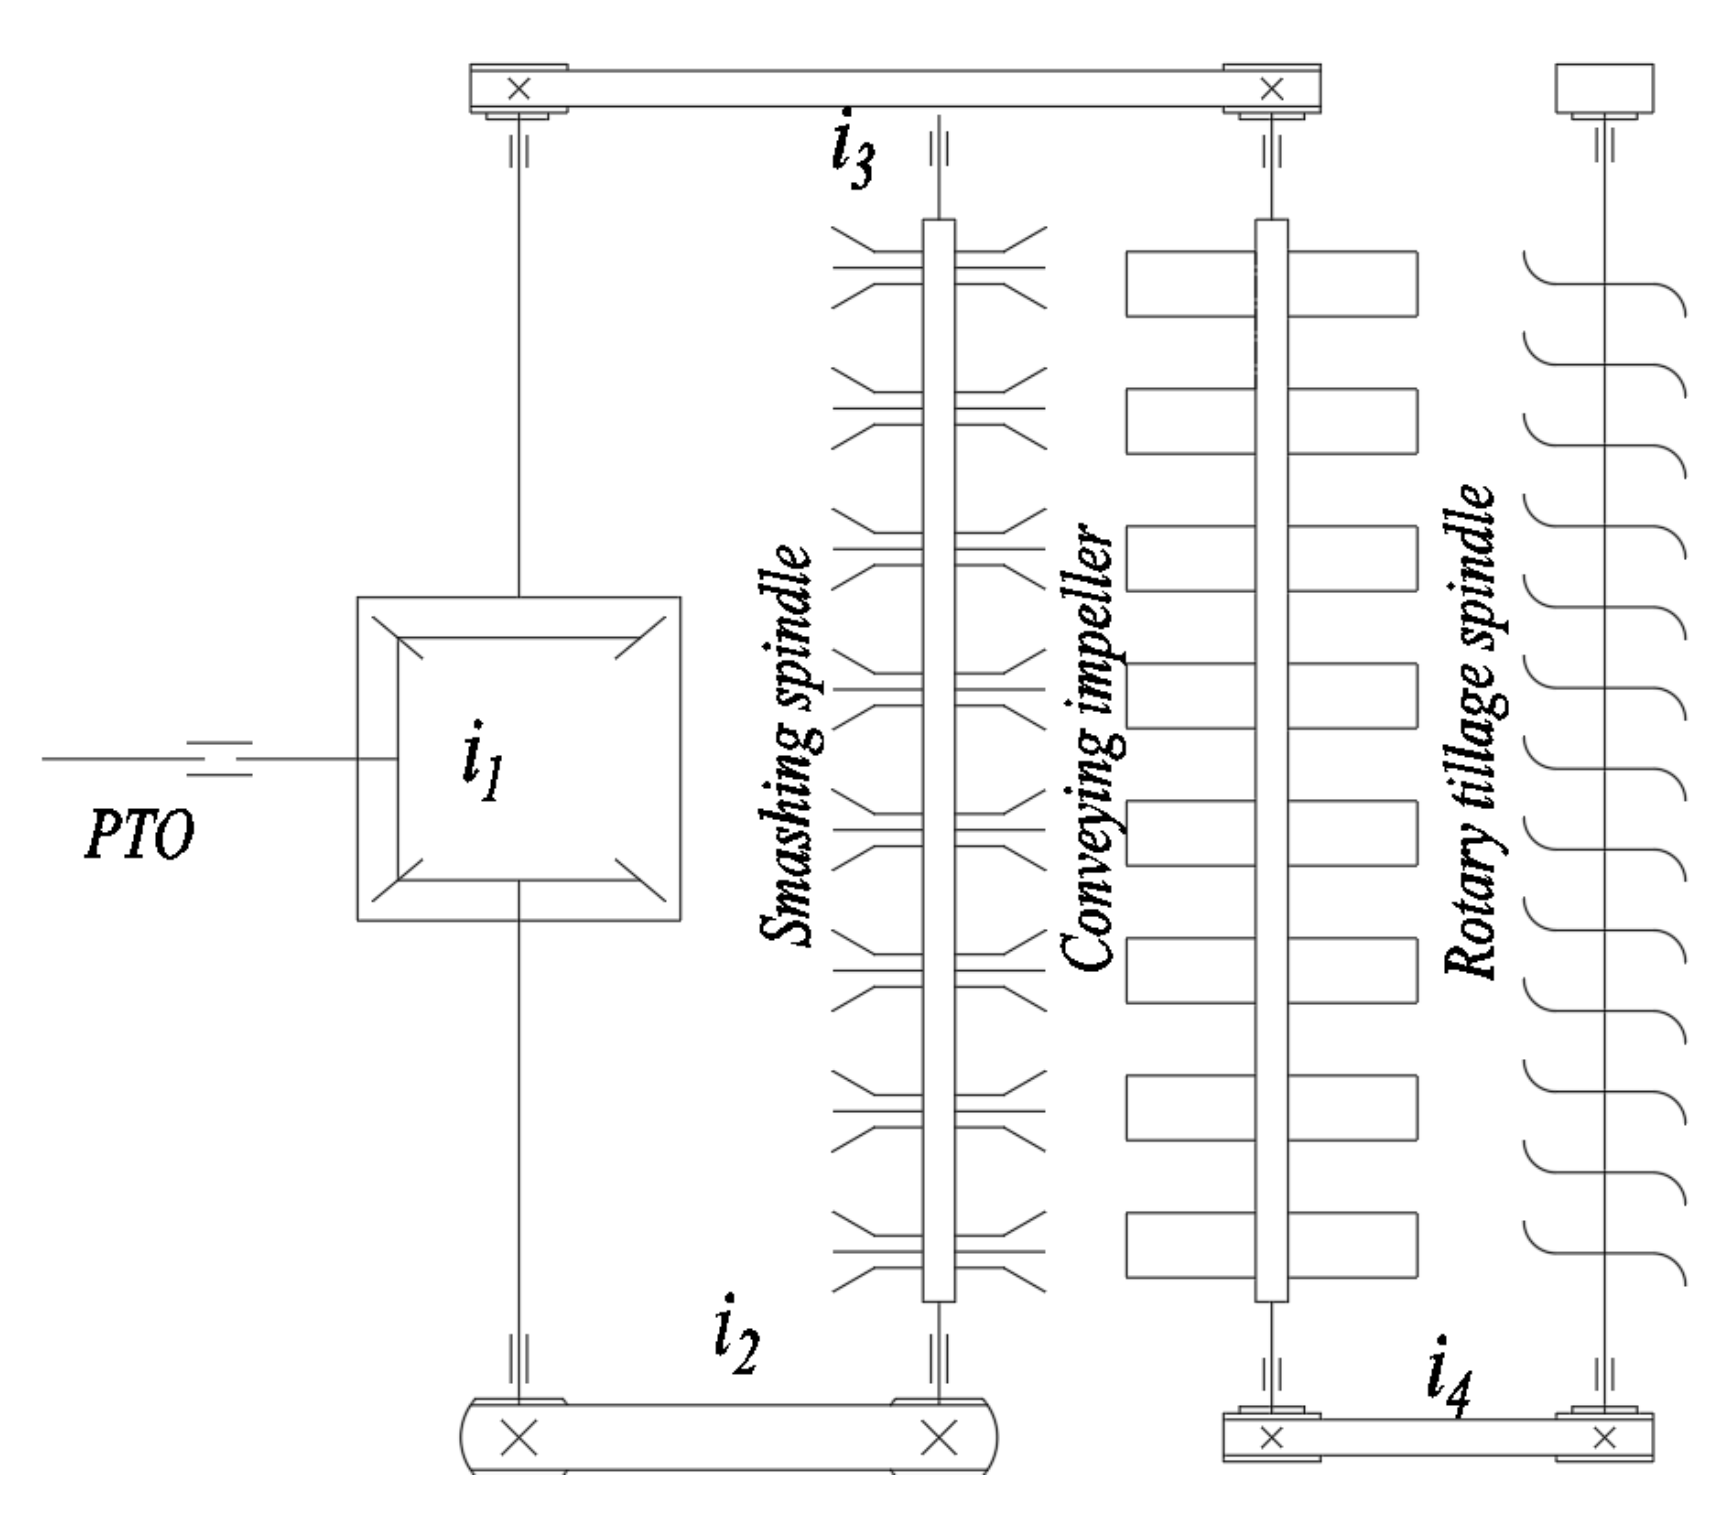
The power of the whole planter is provided by the output shaft of the traction tractor, which is divided into two transmission routes after passing through the gearbox, and the power is transmitted to the straw crushing device, the broken straw conveying device, and the rotary tiller and soiling covering device through the multi-wedge belt transmission. The transmission route is shown in Figure 3.
According to the system transmission route shown in Figure 3, the transmission ratios of the whole planter can be calculated as follows:
where iA is the total transmission ratio of the straw crushing device; iB is the total transmission ratio of the broken straw conveying device; and iC is the total transmission ratio of the rotary tillage and soil covering device.
Combined with the speed analysis requirements of key components in previous studies [18,19,21], the selected rotating speed of the crushing spindle was 2100 rpm, the selected rotating speed of the conveying impeller was 210 rpm, and the selected rotating speed of the tillage cutter spindle was 250 rpm. Considering the power consumption of the whole planter, the PTO output speed of the traction tractor was determined to be 720 rpm; from this, iA = 0.34, iB = 3.43, and iC = 2.888 were calculated. In addition, with the comprehensive consideration of the actual size, structural layout, operating environment, agricultural requirements, and other factors of the entire transmission system, the transmission ratio of each branch can be distributed scientifically and reasonably, depending on the actual selection.
2.4. Power Matching
When the tractor is used as a traction tool during the operation of the strip fertilization planter, the power consumption of the whole machine can be approximated as the sum of the power consumed by the tractor to overcome the frictional resistance, traction resistance, and the load it carries [13]. Ignoring the power consumption caused by wear and tear between the various parts (much less than the above-mentioned main consumption), the empirical formula for the maximum power output of the tractor PTO can be expressed as:
where P is the PTO output power (kW); k is the safety factor, which is generally between 1.1 and 1.2 (k = 1.2 here); Pn is the average power consumption of the load (kW); and Fn is the average traction resistance of the planter (N). Here, compared with ditching and deep spinning, the magnitude of traction resistance is smaller and can be ignored; thus, m is the mass of the whole machine (kg). m = 5330 kg is selected here, combined with the design technical parameters and the rated parameters of the traction tractor. g is the acceleration due to gravity (m·s−2); here, g = 10 m·s−2. f is the rolling friction coefficient between the machine and the ground, which is taken as f = 0.7. v is the working forward speed (km·h−1). Generally, the field working speed of the whole machine is v = 0.8 m·s−1; that is, v = 2.88 km·h−1.
In this study, the power consumption for the load output by the tractor PTO mainly includes the power consumption Pn1 for the straw crushing operation and the power consumption Pn2 for the rotary tillage and soil covering operation, while the power consumption required by the broken straw throwing impeller is relatively small and can be ignored for a simplified calculation; thus, the power consumed by the load of the whole machine can be calculated according to the following formula:
where kt is the soil specific resistance of the straw crushing device (N·cm−2), generally taken as 5 N·cm−2, and B is the width of the crushing operation (cm); according to the design parameters, B = 220 cm here. ht is the straw mulching depth (cm), and according to the analysis of the design requirements, its value is ht = 13 cm. kr is the specific resistance of the rotary tillage (N·cm−2), which is generally kr = 10 N·cm−2 for shallow rotary tillage. b is the working width of the rotary tillage device (cm,) and can be taken as b = 220 cm according to the design parameters. Finally, hr is the rotary tillage depth of the seed belt (cm); here, its value is hr = 6 cm.
Substituting these parameters into Equations (2) and (3), the maximum power consumption of the tractor output load, Pmax = 68.82 kW, can be obtained, which can provide a certain theoretical basis for the selection of the technical parameters of traction machines and tools.
3. Materials and Methods
Although the strip fertilization planter developed by our research group in the early stage had a certain operating performance, it could guarantee a better uniformity of straw mulching between rows and the variability of the seed belt width under the combination of operating parameters determined through theoretical analysis and calculation. However, through repeated test comparisons and in-depth analysis, it was found that the pulverization length was uneven, the smashing stability was poor in the process of full straw crushing, the difference between the broken straw mulching strips was large, and the consistency between the rows was disappointing, as shown in Figure 4. Therefore, in order to optimize the operation performance of the developed strip fertilization planter and improve the stability of straw crushing and the consistency of broken straw mulching between rows, the discrete element method (DEM) was used to conduct virtual simulation tests of straw crushing and strip paving by the planter, so as to obtain better operating parameters on the basis of avoiding labor intensity and shortening the test period.
3.1. Creation of Simulation Model
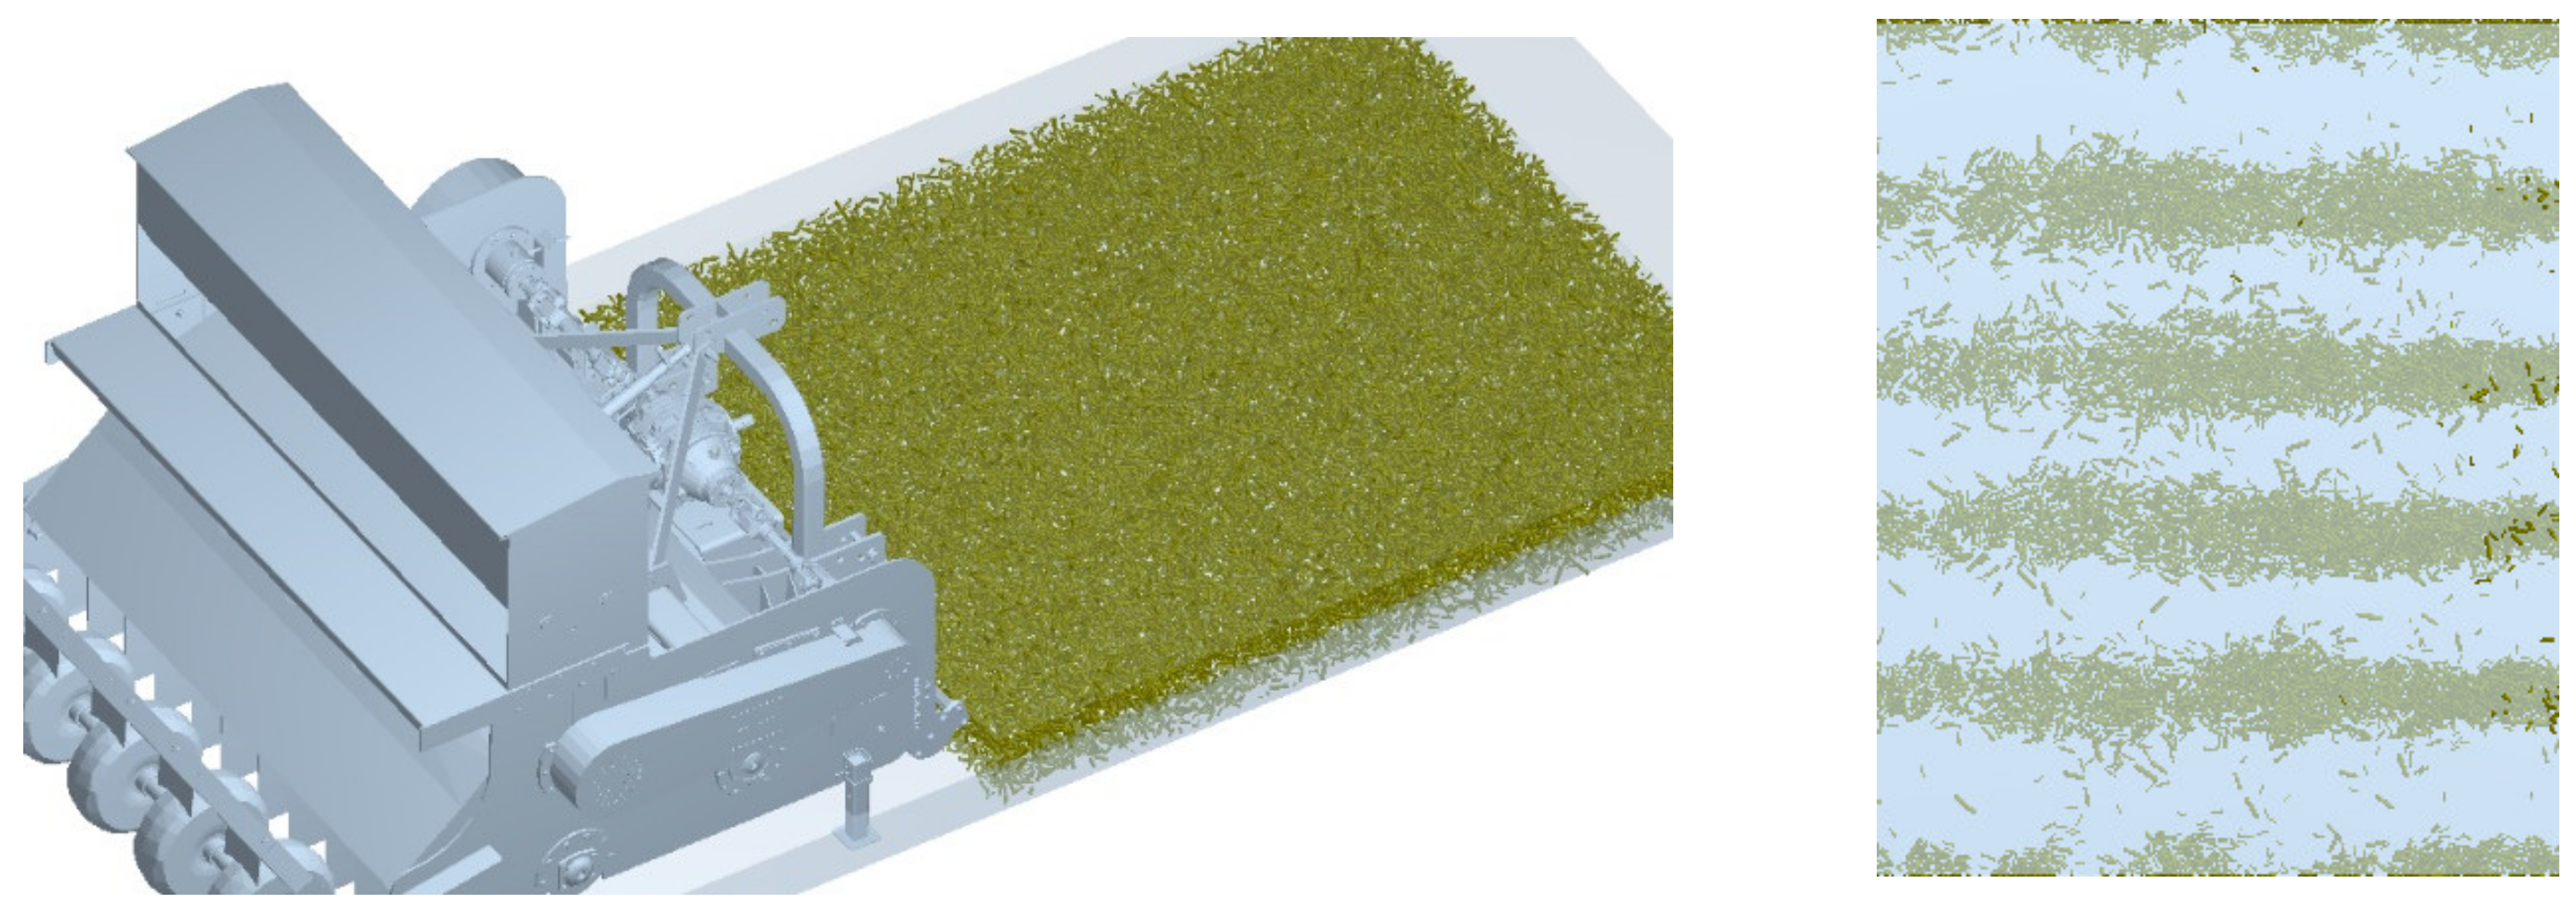
A 3D solid model of the strip fertilization planter was constructed according to a 1:1 scale in the parametric modeling software SolidWorks 2019; the necessary virtual drives and constraint assemblies were set based on the actual working conditions. The simplified model file was saved in STP. format and imported into the solution environment of the discrete element simulation software EDEM 2020, as shown in Figure 5.
According to the shape characteristics and physical properties of rice straw in the test area, 16 soft sphere models with a diameter of 10 mm and a center distance of 4 mm were used to fill in the long-line straw model based on the multi-spherical polymerization method. At the same time, in order to ensure the accuracy of the model, the sphere diameter was generated in a normal random distribution to fit the diversity and irregularity of the actual straw.
3.2. Setting of Virtual Parameters
In view of the fact that the rice straw model approximates flexible soft spherical particles, the hysteretic spring plastic deformation contact model was selected with reference to the research methods of the related literature [18,19]; the straw contact mechanical characteristic parameters measured by random sampling are shown in Table 1.
According to the actual coverage of the rice straw in the test field, the particle factory was set to statically generate 2.1 kg·m−2 within the operating width (2.2 m) in the model pre-processing module in the EDEM software. Considering the results of previous research and actual operating conditions, the smashing spindle speed was set at 1850–2200 rpm, the conveying impeller speed was set at 190–220 rpm, and the planter forward speed was set at 0.7–1.1 m·s−1. A single simulation test lasted for 20 s, and the test results were obtained within 12 s of stable working conditions for subsequent statistical analysis. In order to ensure the continuity of the simulation motion process, the fixed time step was set as 20% of the Rayleigh time step (6.23 × 10⁻⁵ s).
3.3. Test Design and Methods
During the simulation tests, the necessary motion parameters were set for the imported planter–straw/rigid–flexible coupled model according to the actual working conditions in the field, and the whole working process was carried out in the virtually generated straw mulching area (2.2 m × 12 m). Based on the long-term research experience of our research group in fertilization and seeding equipment in clean areas [20,21], and referring to the theoretical analysis of similar protective tillage machines [9,17], the main operation parameters affecting the straw crushing stability and the broken straw mulching consistency of the planter were selected as the test factors—these included the rotating speed of smashing spindle A, the rotation speed of conveying impeller B, and the planter forward speed C. The coefficient of variation of straw crushing Y1 and the coefficient of variation of inter-row straw mulching Y2 were used as evaluation indexes, and a virtual simulation combining tests of quadratic regression orthogonal rotating with three factors and five levels was designed. The appropriate level of each test factor is shown in Table 2, and the test scheme is shown in Table 3, including 14 analysis factors and 9 zero-point tests to estimate errors. There were 23 running test points in total.
The test method was carried out in accordance with the operation specifications and requirements specified in the national standard GB/T 20865-2007 ‘No-tillage fertile-Seeding drill’ [28] and the agricultural industry standard NY/T 500-2002 ‘Operating quality for crop straw returning-back-to field machine’ [29]. In the single test, the influencing factors were adjusted to the corresponding specified value according to the design scheme; after the simulation operation of the EDEM solution module was completed, the grid cells were set in the virtual straw mulching area (6 rows in total) within the effective working width through the post-processing module. Five collection points (30 collection points in total) with an area of 150 mm × 150 mm were randomly selected at equal intervals on the diagonal, and the average length Li of the virtual straw particles at each collection point was measured. Similarly, 6 collection points with an area of 210 mm × 210 mm were randomly selected in different rows of straw mulching areas, and the weight of virtual broken straw particles wj at each collection point was measured. Each group of experiments was repeated 3 times and the mean value was taken. The calculation formulas of the evaluation indicators, the coefficient of variation of straw crushing (Y1), and the coefficient of variation of inter-row broken straw mulching (Y2), are as follows:
where, Y1 is the coefficient of variation of straw crushing (%); Y2 is the coefficient of variation of inter-row broken straw mulching (%); Li is the average length of the broken straw particle at test point I (mm); is the mean value of the broken straw length at each test point in a single test (mm); wj is the mass of the broken straw at the test point j (g); is the mean value of the broken straw mass at each test point in a single test (g); SL is the standard deviation of the broken straw length at the test point (mm); and Sw is the standard deviation of the broken straw mass at the test point (g).
3.4. Data Analysis
The test data were analyzed using Microsoft Office Excel 2019 (Microsoft Corporation, Albuquerque, NM, USA). Design-Expert 8.0.6 software (Stat-Ease, Inc., Minneapolis, MN, USA) was used for statistical analysis (ANOVA) and RSM optimization analysis and EDEM 2018 software was used for discrete element numerical analysis (DEM Solutions, Edinburgh, UK).
4. Results and Analysis
According to the test scheme described above, a numerical simulation of the virtual operation of straw crushing and strip laying was carried out; the simulation results are shown in Table 3. The Design-Expert 8.0.6 software was used to conduct quadratic multiple regression analysis on the test data, and response surface methodology (RSM) was used to discuss the correlation and interaction effect of each factor.
4.1. Multiple Regression Analysis
Through the multiple regression fitting analysis, regression models between the influencing factors and evaluation indicators were established, as shown in Equation (6).
A significance test and variance analysis were conducted for the quadratic regression models of the evaluation indicators Y1 and Y2, respectively, and the results are shown in Table 4. It can be seen that the P values of the lack-of-fit items of the Y1 and Y2 regression models (PL1 = 0.1886 > 0.05 and PL2 = 0.0936 > 0.05, respectively) were not significant, indicating that there was no lack-of-fit factor in the regression analysis and the regression model had a high degree of fitting, meaning it could correctly reflect the relationship between each factor and the error. The P values of the model regression terms PM1 and PM2 were both <0.01, which were highly significant, indicating that the regression results had a certain reliability and could better predict the test.
According to the significance of the influencing factors in Table 4, it can be seen that for the evaluation indicator Y1, the influence of the factors A and A2 was highly significant and the influence of factors C and AC was significant. For the evaluation indicator Y2, factors B and B2 had a highly significant influence, while the factors C, BC, and C2 had a significant influence. An analysis of the F value of each factor showed that the greater the F value, the higher the influence of the factor on the test evaluation indicator; the influence order of each test factor on the evaluation indicator Y1 was A, C, and B, and the influence order on the evaluation indicator Y2 was B, C, and A.
4.2. Response Surface Analysis
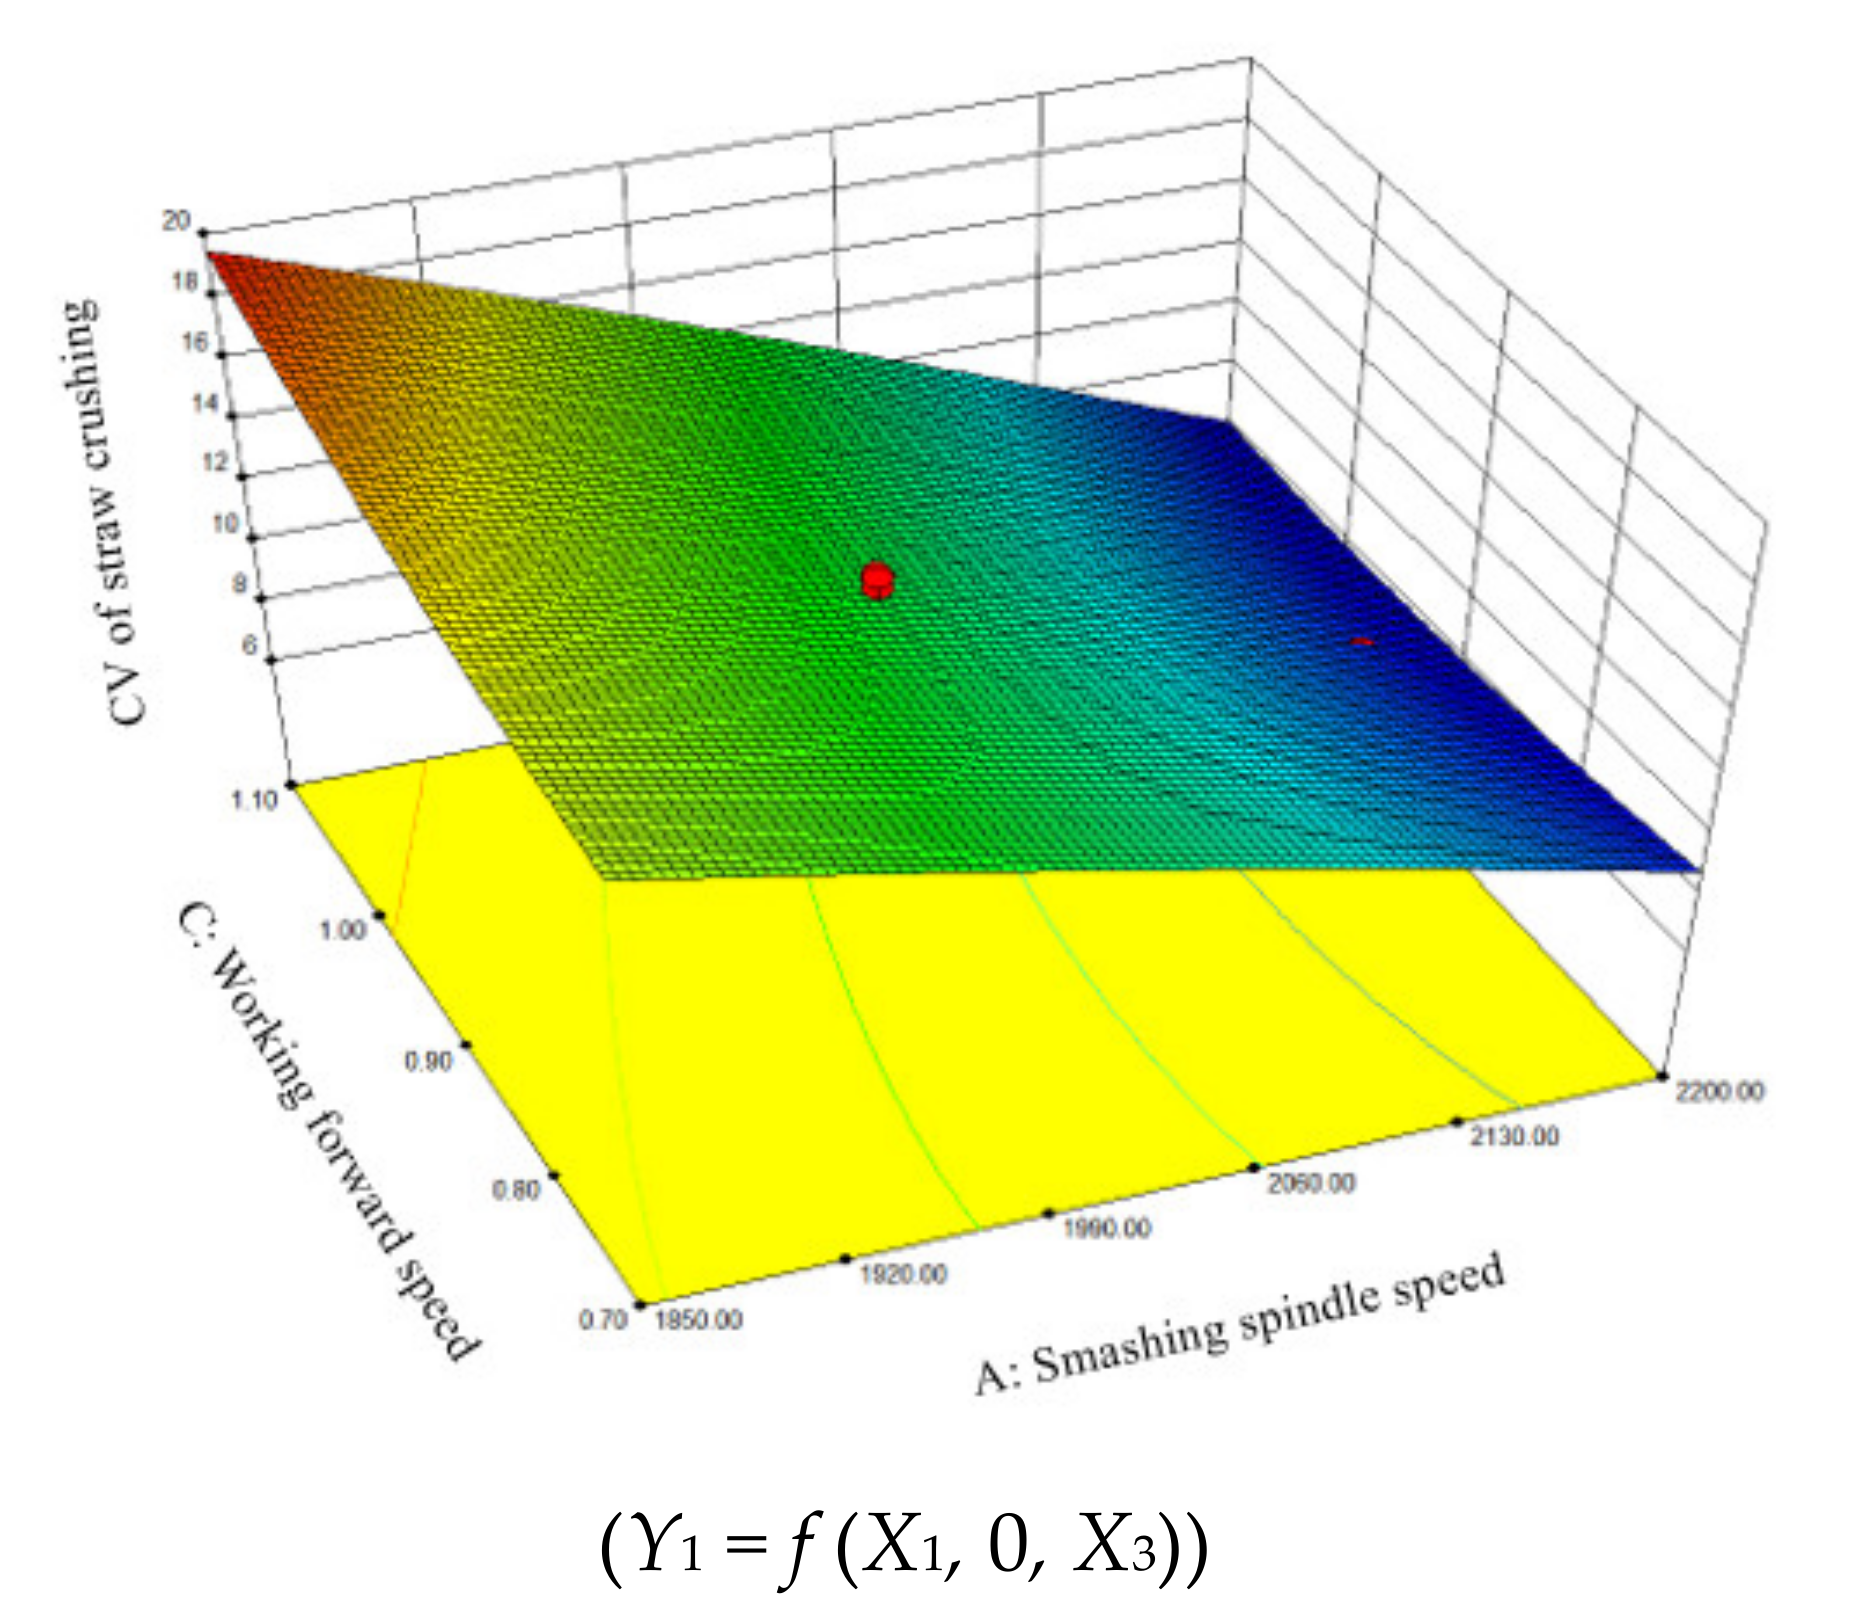
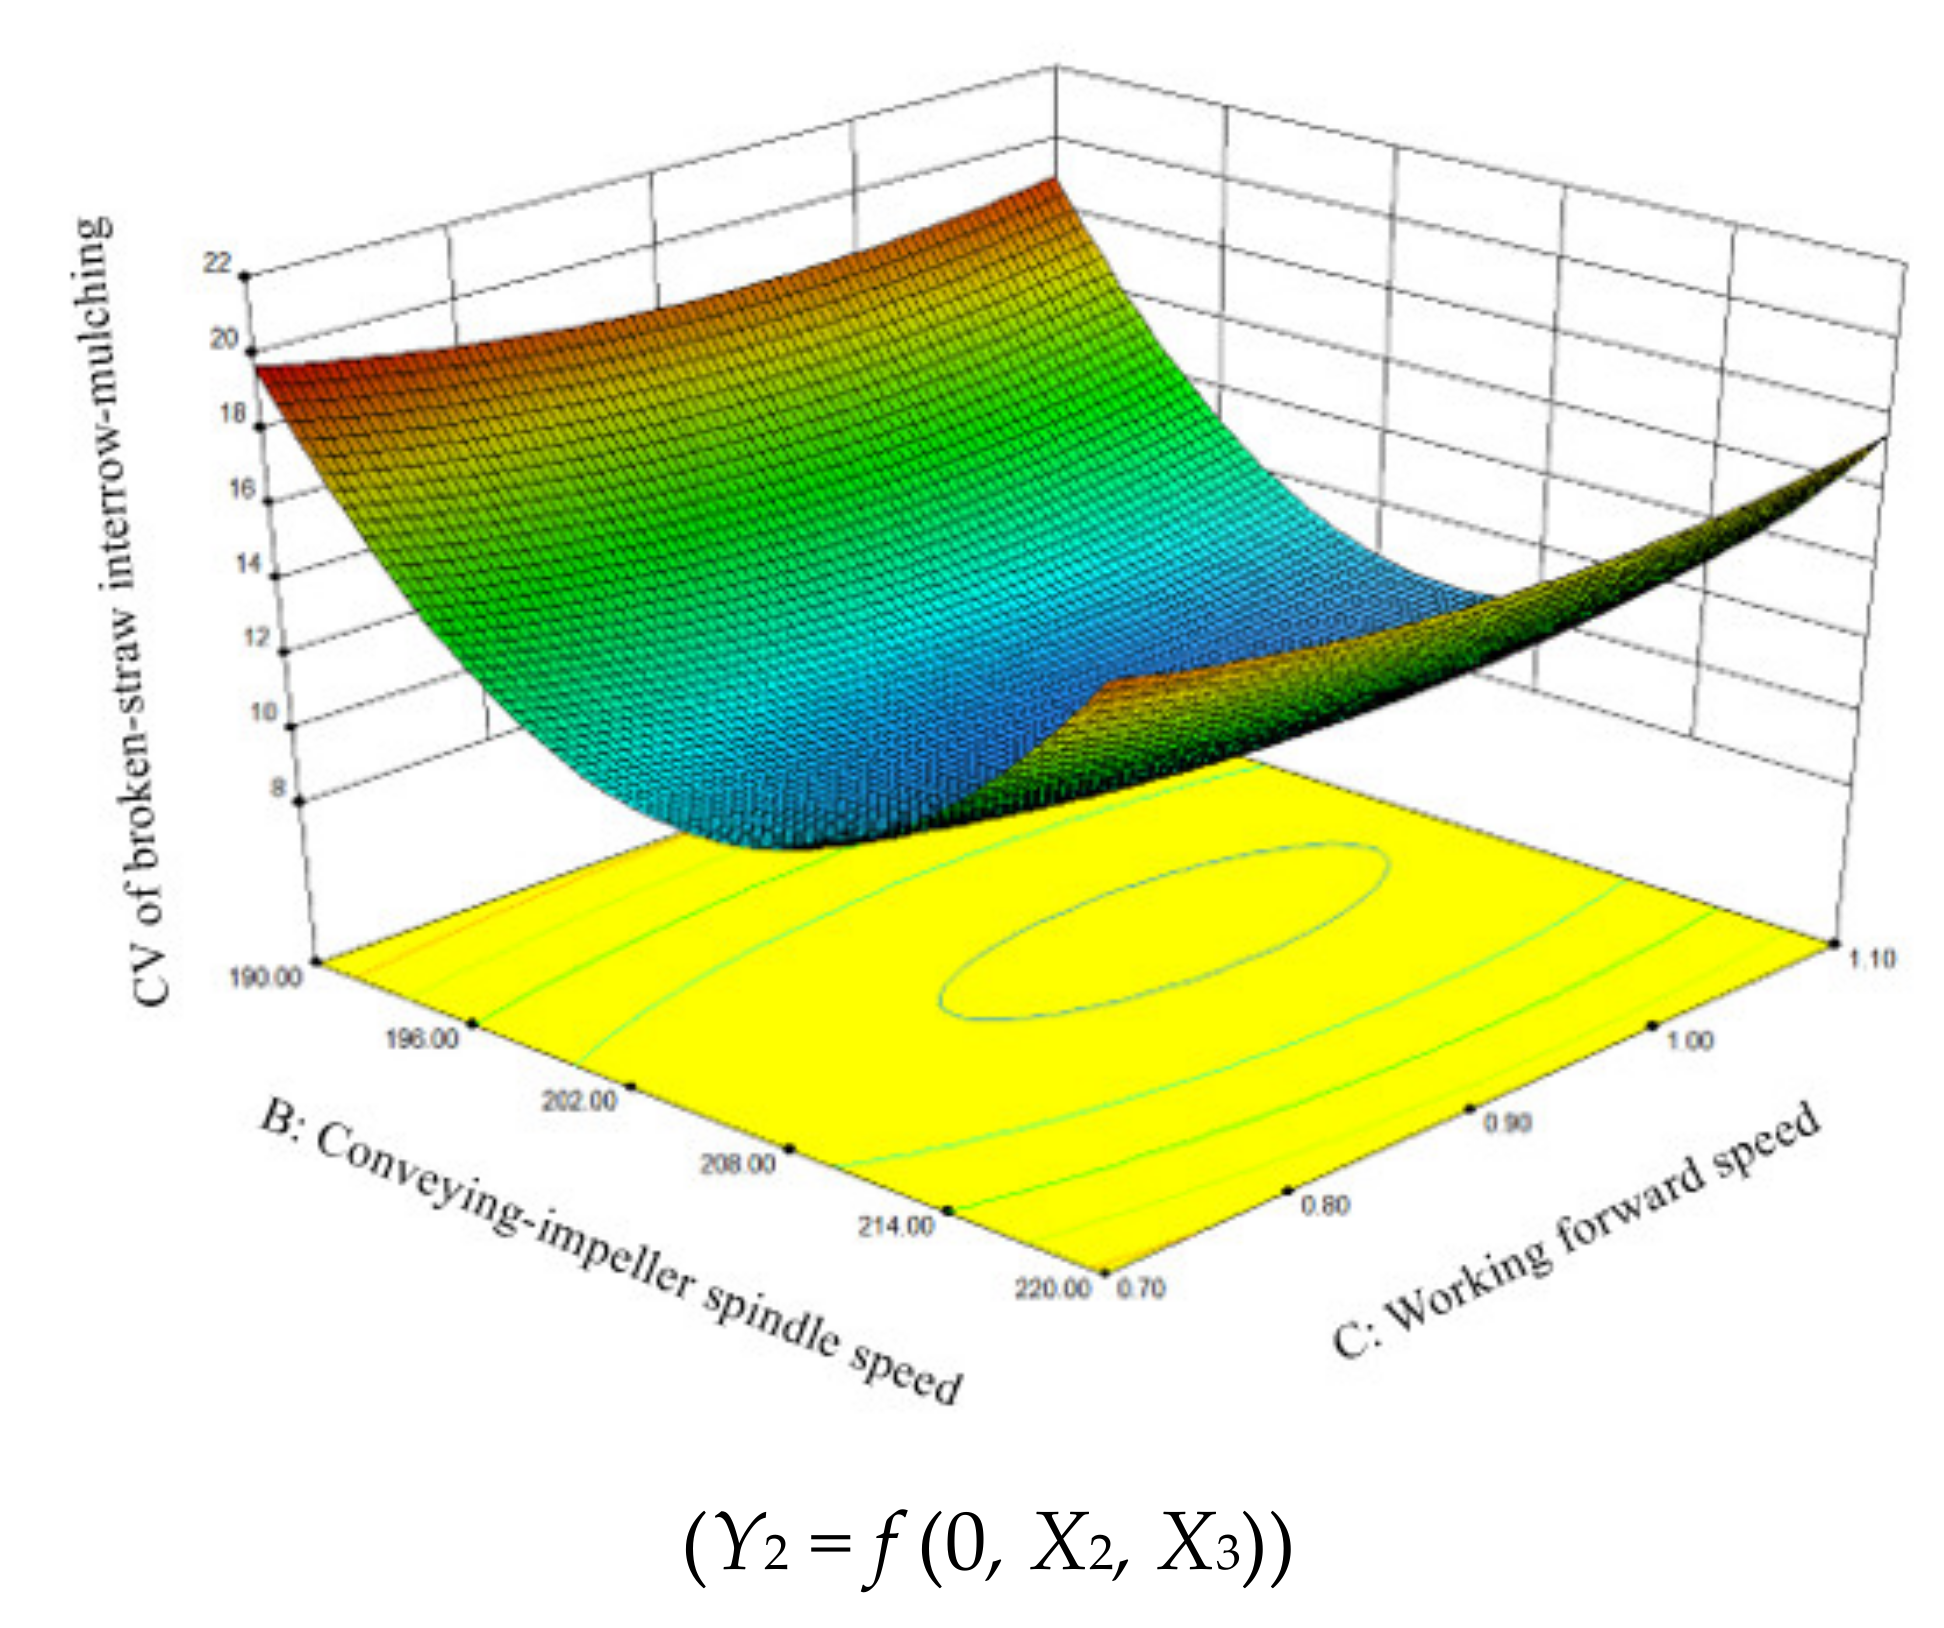
In order to study the interaction effect of each influencing factor on the evaluation indicators Y1 and Y2, a response surface analysis was performed on the regression models. First, the dimension of the quadratic polynomial regression equation of the above evaluation indicator was reduced, one of the factors was set to 0 level, the interaction effect of the other two influencing factors was analyzed (excluding the insignificant items), and the influence laws of factors A and C on the evaluation indicator Y1 and factors B and C on the evaluation indicator Y2 were examined. The corresponding response surfaces generated are shown in Figure 6 and Figure 7.
From the response surface analysis of the factor interaction on the evaluation indicator Y1 in Figure 6, it can be seen that when the factor B was constant (at the 0 level, i.e., 205 rpm), the CV of straw crushing Y1 decreased with the increase in the smashing spindle speed A. On the other hand, the CV of straw crushing Y1 increased with the increase in the planter forward speed C. Further in-depth analysis indicated that the change rate of the response surface for evaluation indicator Y1 in the direction of the smashing spindle speed was faster than that in the direction of the planter forward speed, indicating that the smashing spindle speed A had a more significant influence on the CV of straw crushing Y1 than the planter forward speed C.
Similarly, according to the response surface analysis of the factor interaction on evaluation indicator Y2 in Figure 7, it can be seen that when the factor A was constant (at the 0 level, i.e., 2000 rpm), the CV of inter-row straw mulching Y2 showed an obvious trend of first decreasing and then increasing with an increase in the conveying impeller speed B, indicating that the specific conveying impeller speed B could reduce the CV of inter-row straw mulching Y2; Y2 had a minimum value when B was in the range of 2050–2150 rpm. The CV of inter-row straw mulching Y2 decreased with an increase in the planter forward speed C; however, when C was increased to a certain value, Y2 showed a gradually increasing trend. That is, when C was in the range of 0.85–1.0 m·s−1, Y2 had a minimum value.
4.3. Parameter Optimization Analysis
In order to achieve the best operating performance of the strip fertilization planter and seek the optimal combination of working parameters affecting the straw crushing stability and the inter-row mulching consistency, a multi-objective variable optimization method was adopted through the above two-factor interaction response surface analysis. Taking the minimum CV of straw crushing Y1 and the minimum CV of inter-row straw mulching Y2 as the objective principles, combined with the constraint conditions of the preliminary tests and the agronomic requirements of local rice and wheat crop planting, the objective function and constraint function were established to complete the optimization design of the response surface ridge for the planter working parameters, as shown in Equation (7).
By optimizing and solving the above mathematical model, the optimal combination of operating parameters that affected the stability of straw crushing and the consistency of inter-row straw mulching was obtained as follows: the smashing spindle speed was 2060.79 rpm, the conveying impeller speed was 206.25 rpm, and the working forward speed was 0.95 m·s−1. In this case, the CV of straw crushing was Y1 = 8.51%, the CV of inter-row straw mulching was Y2 = 10.34%, and the operation effect met the relevant standards and requirements.
4.4. Test Verification
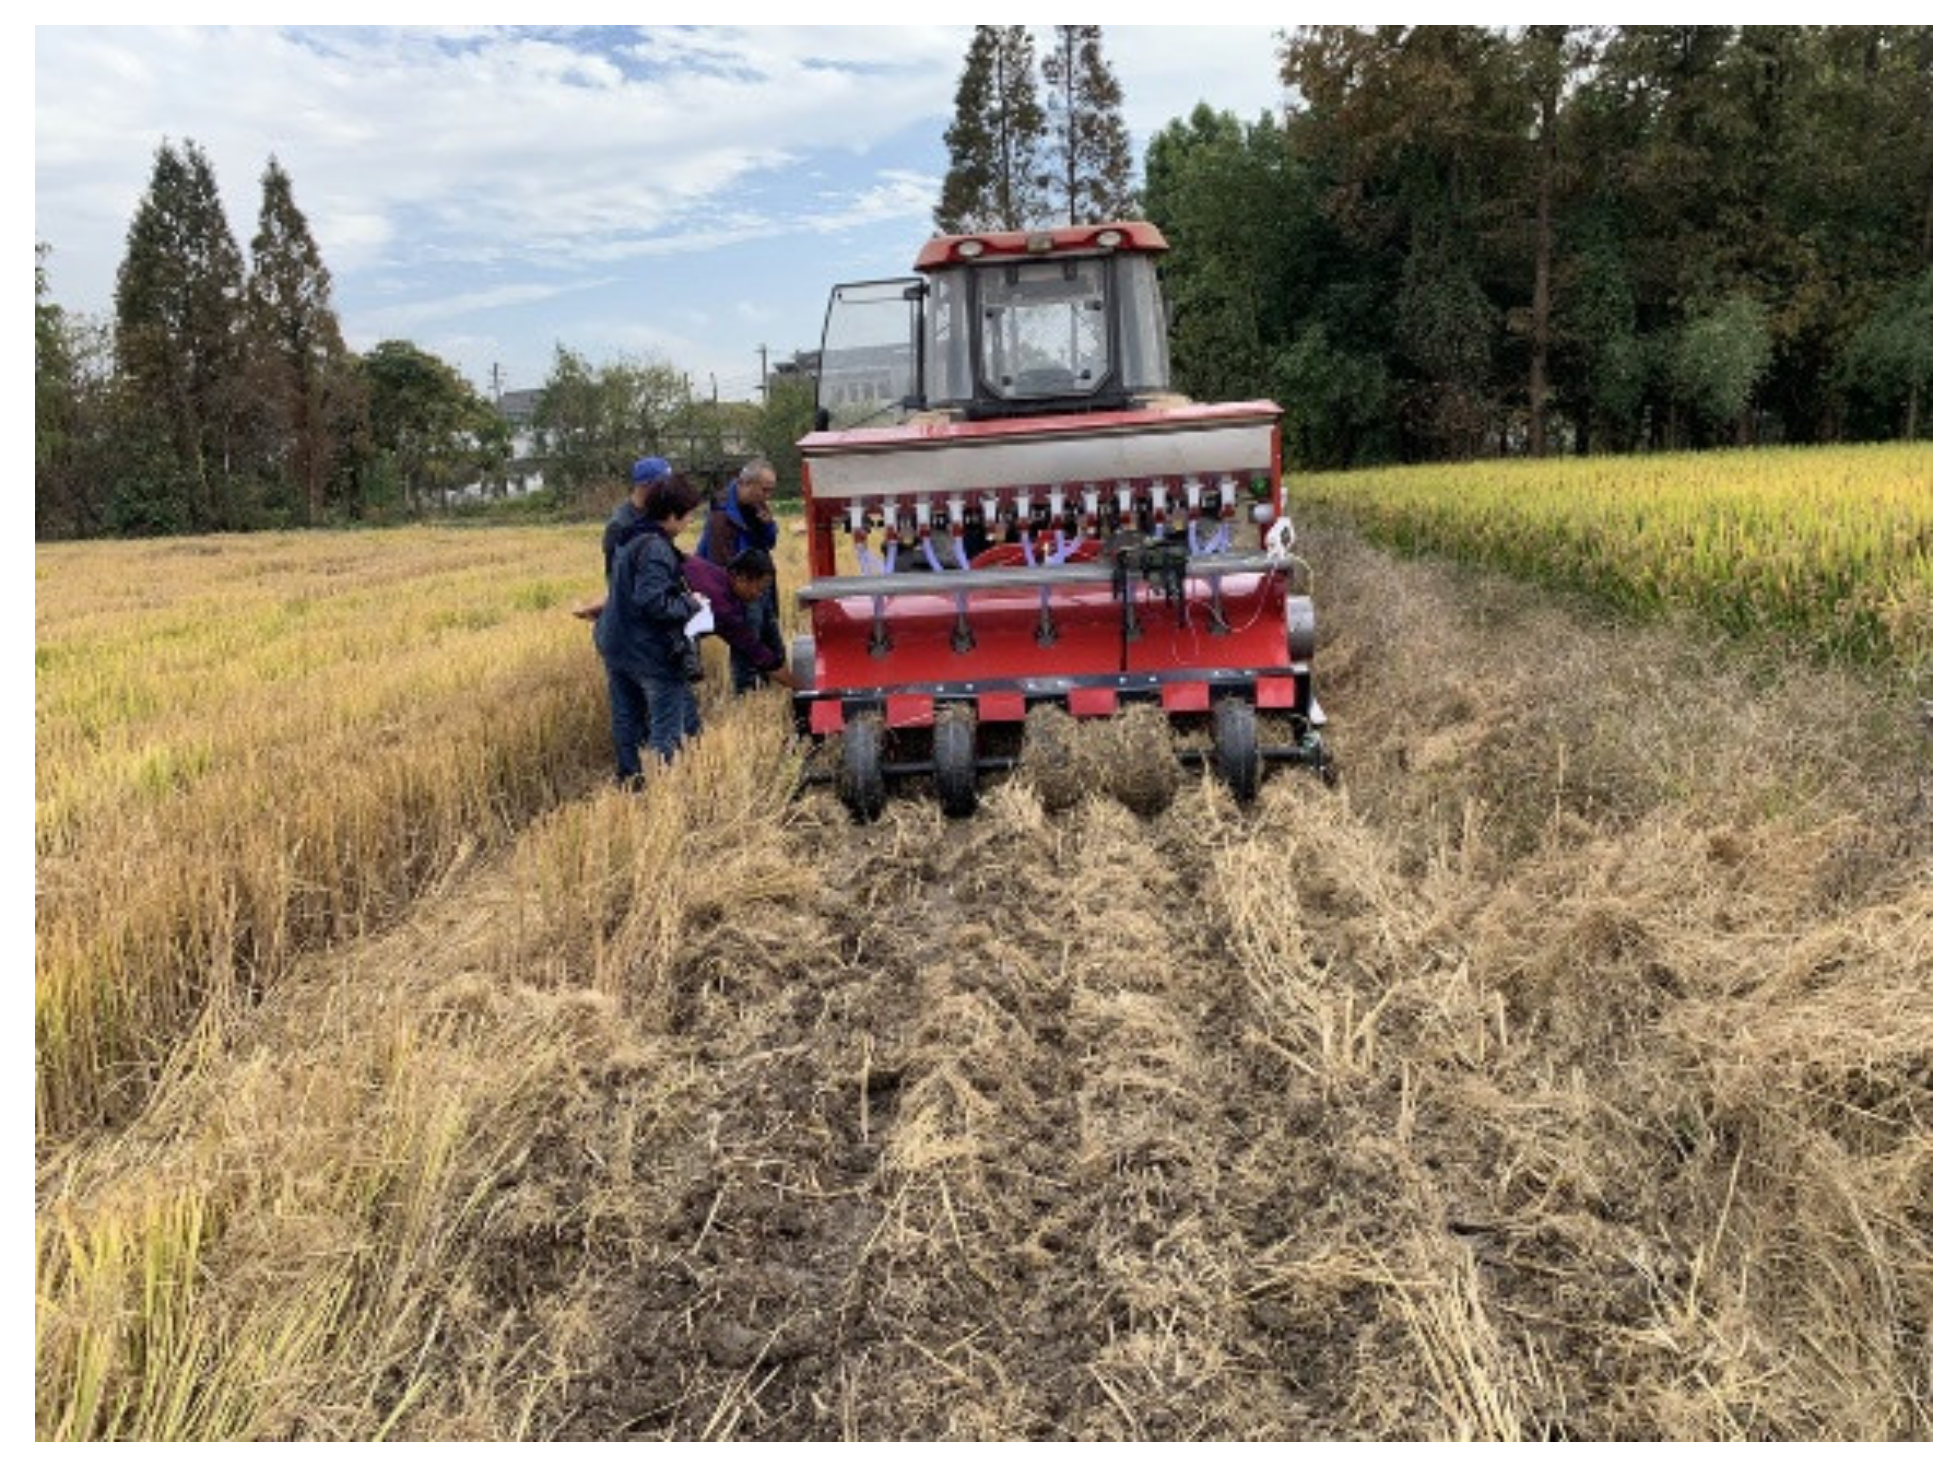
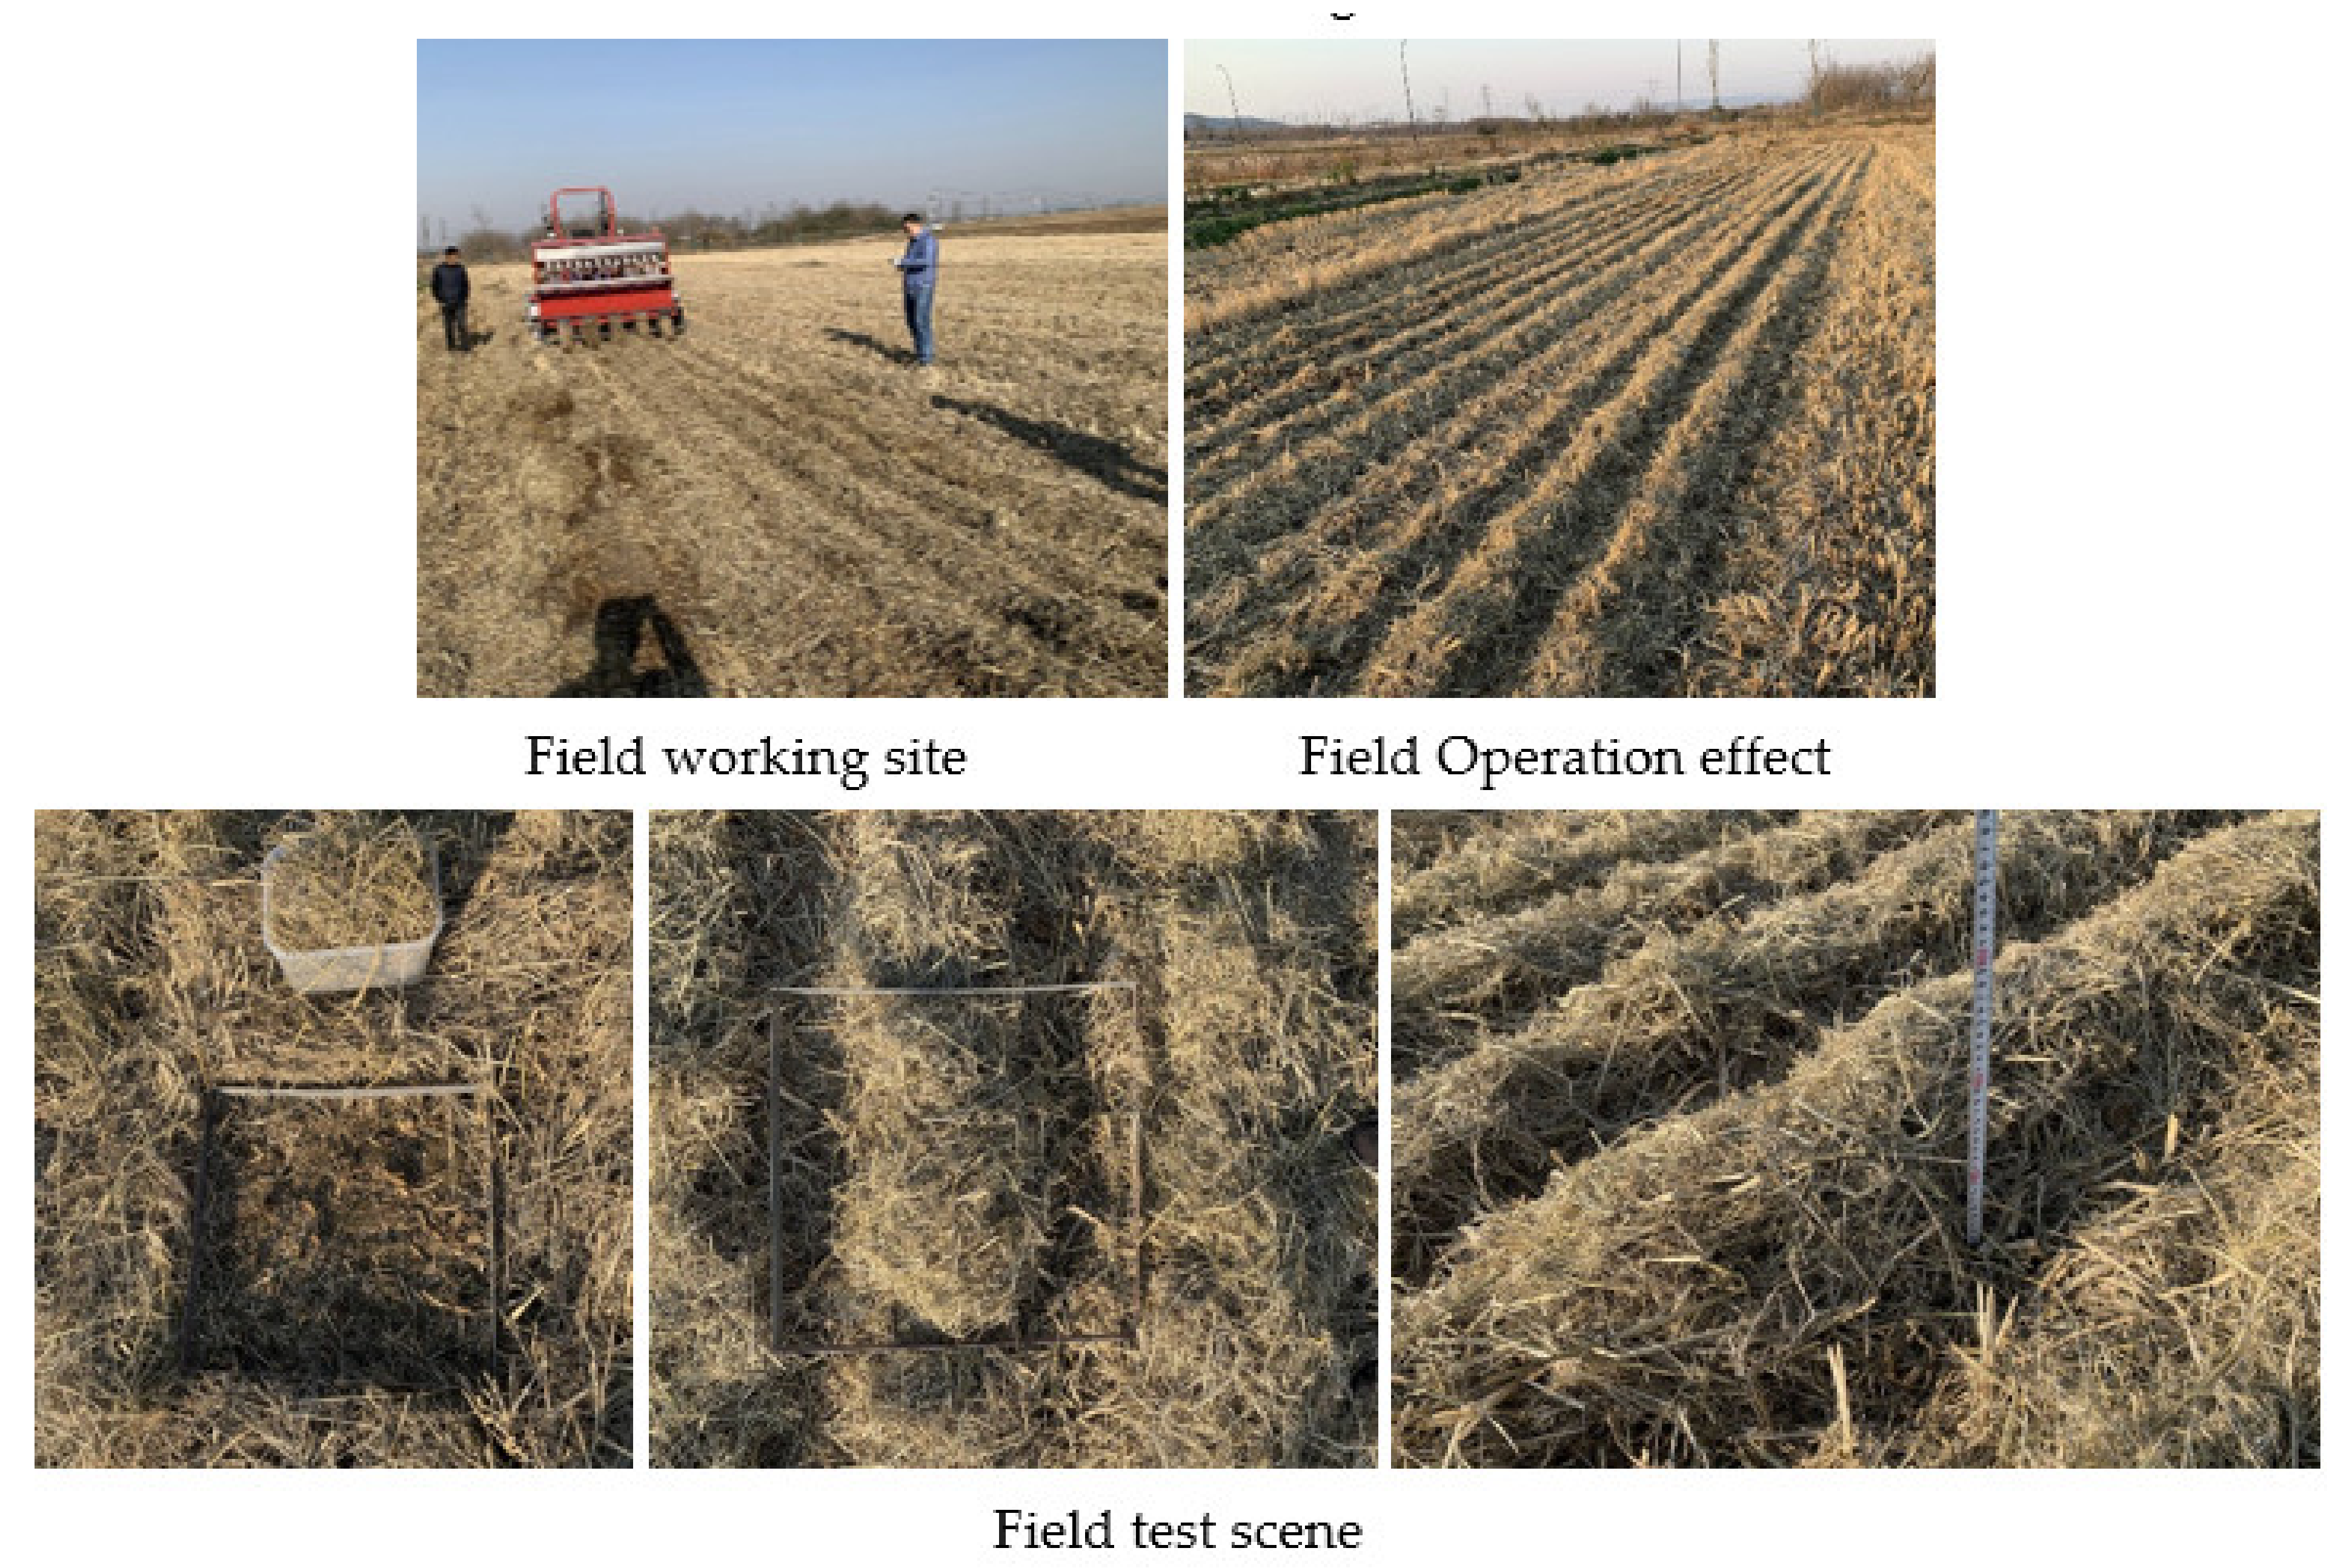
In order to verify the accuracy of the discrete element simulation and evaluate the rationality of the working parameter combination optimized by the virtual tests, field performance verification tests of straw crushing and inter-row mulching by the strip fertilization planter were carried out. The tests were conducted at the Baima Teaching and Research Base of Nanjing Agricultural University (Lishui District, Nanjing City, Jiangsu Province) in December 2021. The rice variety was Nanjing 9108, the measured straw coverage amount was 2.17 kg·m−2, and the average stubble height was >280 mm. The tests were carried out in strict accordance with the requirements of relevant national standards and agricultural industry standards. Before a single test, the planter working parameters were adjusted to the above-mentioned combination. After rounding, the smashing spindle speed was 2050 rpm, the conveying impeller speed was 205 rpm, and the working forward speed was 0.95 m·s−1. The data acquisition method was consistent with Section 3.3: the CV of straw crushing Y1 and the CV of inter-row straw mulching Y2 were measured. The measurement at the collection point of a single test was repeated three times to take the average value, and a total of five groups of tests were conducted. The field test scene is shown in Figure 8.
The field verification tests showed that the strip fertilization planter, under the optimized combination of operation parameters, had improved straw crushing stability and inter-row straw mulching consistency. The test results showed that the average CV of straw crushing was Y1 = 9.35% and the average CV of inter-row straw mulching was Y2 = 10.97%, which indicated that the optimized combination of working parameters for the strip fertilization planter was reasonable and feasible, and the working quality met the specification requirements of relevant industry standards for straw crushing and returning to the field and no-tillage sowing machinery. Meanwhile, the mean relative errors of the simulated test values were 9.87% and 9.63%, respectively, indicating that the established discrete element simulation model and virtual test analysis was accurate and valid.
5. Discussions
The changing trend of the response surface analysis shown in Figure 6 indicated that the higher the rotating speed of the smashing spindle was, the better the straw picking and crushing performance, the smaller the CV of straw crushing, and the better the crushing stability. However, an excessively high smashing spindle speed will bring about excessive power consumption; thus, it is generally advisable to use a smashing spindle speed that can ensure the CV of straw crushing Y1 is < 10%. Moreover, with a higher forward speed, the collected straw cannot be crushed in the pulverizing cavity for a short time, resulting in a poor straw crushing effect; thus, the CV of straw crushing Y1 is increased. With a lower forward speed, the straw can be fully and completely crushed in enough time, thus improving the straw crushing effect and reducing the CV of straw crushing. However, in order to ensure a certain working efficiency, the planter forward speed should not be too low.
Considering the changes in the trend of the evaluation index Y2 in Figure 7, we concluded that with an increase in the rotational speed of the conveying impeller, the crushed straw was smoothly transported to the diversion device for branch strip laying, which avoided the clogging of the straw in the cavity, reduced the CV of inter-row straw mulching, and improved the consistency of straw mulching in each row. However, the high-speed airflow generated by the increase in the impeller speed disturbed the straw, due to the weight of the straw in the cavity being relatively light; the high-speed inertial airflow caused the straw to be disordered, and the straw entering each row of the diversion device was disorderly, resulting in a decreased consistency of inter-row straw mulching. In addition, the slower the forward speed C, the greater the randomness of the limited amount of straw being strip laid among the rows; thus, the greater the variability of inter-row straw mulching and the worse the consistency of the broken straw mulching among the rows. However, if the forward speed C was excessively fast, the feeding amount of collected straw increased, and the impeller could not bear the large throughput in a short period of time; this easily caused a straw blockage in the cavity, resulting in an increase in the CV of inter-row straw mulching Y2 and a deterioration in the consistency of straw mulching in each row.
Further in-depth analysis showed that the change rate of the response surface for the evaluation indicator Y2 in the direction of the conveying impeller speed was better than that in the forward speed direction, indicating that the conveying impeller speed B had a more significant influence on the CV of inter-row straw mulching Y2 in this interaction, and B was the dominating factor affecting the CV of inter-row straw mulching Y2.
6. Conclusions
To improve the stability of straw crushing and the consistency of inter-row mulching, the main working parameters of the developed strip fertilization planter for broken straw back throwing and inter-row laying were optimized in this study. A discrete element model of the planter and a mechanics model of the straw particle were established for virtual numerical simulation and response surface optimization analysis. The optimal combination of working parameters was obtained, and the better operation performance and quality effectiveness were achieved.
Different evaluation indexes had different influencing factors: the simulation tests clarified that the most significant factor affecting the CV of straw crushing Y1 was the smashing spindle speed A, while the most significant factor affecting the CV of inter-row straw mulching Y2 was the conveying impeller speed B. The optimal combination of planter working parameters was obtained to prove that the innovative technology method and the developed technology equipment could meet the hydrothermal conditions, agronomic requirements, and operating conditions of different crops and different producing areas.
Field tests verified the excellent working performance, which satisfied the relevant technical standards and agronomic requirements. In the future, our research group will aim to improve the performance and effect of the developed fertilization planter, carry out a demonstration application of the high-quality and smooth no-tillage machine seeding technology for a whole straw field, and extend its use to surrounding rice and wheat planting. Meanwhile, regular technical training and on-site demonstrations for large planters and professional cooperative organizations will be actively organized.
Author Contributions
Conceptualization, Y.S. and X.W.; methodology, Y.J.; software, Y.J. and H.Y.; experiment, Y.J. and Y.S.; data collation, H.Y. and H.L.; funding acquisition, Y.S. and X.W.; supervision, X.W. and H.C.; writing—original draft, Y.S. and H.Y.; writing—review and editing, Y.J. and H.L. All authors have read and agreed to the published version of the manuscript.
Funding
This work was supported financially by the National Natural Science Foundation of China (Grant No. 51905281), Project of State Key Laboratory of Power System of Tractor (Grant No. SKT2022005), and Natural Science Foundation of Jiangsu Province (Grant No. BK20210410).
Institutional Review Board Statement
Not applicable.
Informed Consent Statement
Not applicable.
Data Availability Statement
Not applicable.
Acknowledgments
The authors would like to thank the teachers and supervisors for their technical support. We would also like to acknowledge the assistance provided by brothers and sisters during the tests. Finally, we are grateful to the editor and anonymous reviewers for providing helpful suggestions to improve the quality of this paper.
Conflicts of Interest
The authors declare no conflict of interest.
References
- Sarker, K.K.; Xu, C.L.; Wang, X.Y.; Li, M.J.; Li, L.H.; Liu, G.M. Band tillage with fertilizer application for unpuddled transplanting rice in northeast of China. Int. J. Agric. Biol. Eng. 2016, 9, 73–83. [Google Scholar]
- He, J.; Li, H.W.; Chen, H.T.; Lu, C.Y.; Wang, Q.J. Research progress of conservation tillage technology and machine. Trans. Chin. Soc. Agric. Mach. 2018, 49, 1–19. (In Chinese) [Google Scholar]
- Seleiman, M.F.; Kheir, A.M.S.; Al-Dhumri, S.; Alghamdi, A.G.; Omar, E.-S.H.; Aboelsoud, H.M.; Abdella, K.A.; Abou El Hassan, W.H. Exploring optimal tillage improved soil characteristics and productivity of wheat irrigated with different water qualities. Agronomy 2019, 9, 233. [Google Scholar] [CrossRef] [Green Version]
- Zhao, S.H.; Liu, H.P.; Yang, C.; Yang, L.L.; Gao, L.L.; Yang, Y.Q. Design and discrete element simulation of interactive layered subsoiler with maize straw returned to filed. Trans. Chin. Soc. Agric. Mach. 2021, 52, 75–87. [Google Scholar]
- Wu, H.C.; Hu, Z.C.; Wu, F.; Gu, F.W.; Qiu, T.; Zhang, Y.H.; Chen, Y.Q. Development of automatic control system for straw smashing height adjustment device of back throwing type no-tillage planter. Trans. CSAE 2019, 35, 1–9. [Google Scholar]
- Jiang, M.; Liu, C.L.; Wei, D.; Du, X.; Cai, P.Y.; Song, J.N. Design and test of wide seedling strip wheat precision planter. Trans. Chin. Soc. Agric. Mach. 2019, 50, 53–62. (In Chinese) [Google Scholar]
- Jia, H.L.; Jiang, X.M.; Yuan, H.F.; Zhuang, J.; Zhao, J.L.; Guo, M.Z. Stalk cutting mechanism of no-tillage planter for wide/narrow row farming mode. Int. J. Agric. Biol. Eng. 2017, 10, 26–35. [Google Scholar]
- Liu, P.; He, J.; Li, Y.J.; Li, H.W.; Wang, Q.J.; Lu, C.Y.; Zhang, Z.G.; Li, S.H. Design and experiment of double rollers maize stalk chopping device with different rotation speeds. Trans. CSAE 2020, 36, 69–79. [Google Scholar]
- Qin, K.; Cao, C.M.; Liao, Y.S.; Wang, C.Q.; Fang, L.F.; Ge, J. Design and optimization of crushing and throwing device for straw returning to field and fertilizing hill-seeding machine. Trans. CSAE 2020, 36, 1–10. (In Chinese) [Google Scholar]
- Zhang, Z.Q.; He, J.; Li, H.W.; Wang, Q.J.; Ju, J.W.; Yan, X.L. Design and experiment on straw chopper cum spreader with adjustable spreading device. Trans. Chin. Soc. Agric. Mach. 2017, 48, 76–87. [Google Scholar]
- Zhang, X.Y.; Li, L.H.; Wang, C.; Zhao, D.Y. Design and test of 1GSZ-350 stubble-breaking and rotary tilling combined cultivating machine. Trans. CSAE 2009, 25, 73–77. (In Chinese) [Google Scholar]
- Chen, Q.C.; Shi, Y.; Ding, Q.S.; Ding, W.M.; Tian, Y.C. Comparison of straw incorporation effect with down-cut and up-cut rotary tillage. Trans. CSAE 2015, 31, 13–18. (In Chinese) [Google Scholar]
- Lin, J.; Ma, T.; Li, B.F. Design and test of 1JHL-2 type straw deep burying and returning machine. Trans. CSAE 2017, 33, 32–40. (In Chinese) [Google Scholar]
- Chen, H.T.; Zha, S.H.; Dun, G.Q.; Cong, G.B.; Li, A.; Feng, Y.N. Optimization and experiment of cleaning device of 2BMFJ type no-till precision planter. Trans. Chin. Soc. Agric. Mach. 2016, 47, 96–102. [Google Scholar]
- Wang, W.W.; Zhu, C.X.; Chen, L.Q.; Li, Z.D.; Huang, X.; Li, J.C. Design and experiment of active straw-removing anti-blocking device for maize no-tillage planter. Trans. CSAE 2017, 33, 10–17. (In Chinese) [Google Scholar]
- Gu, F.W.; Hu, Z.C.; Chen, Y.Q.; Wu, F. Development and experiment of peanut no-till planter under full wheat straw mulching based on ‘clean area planting’. Trans. CSAE 2016, 32, 15–23. (In Chinese) [Google Scholar]
- Xu, H.B.; Hu, Z.C.; Wu, F.; Gu, F.W.; Chen, Y.Q. Design of straw distributed retention device of wheat planter under full rice straw retention. Trans. CSAE 2019, 35, 19–28. (In Chinese) [Google Scholar]
- Luo, W.W.; Hu, Z.C.; Wu, F.; Gu, F.W.; Xu, H.B.; Chen, Y.Q. Design and optimization for smashed straw guide device of wheat clean area planter under full straw field. Trans. CSAE 2019, 35, 1–10. (In Chinese) [Google Scholar]
- Shi, Y.Y.; Sun, X.; Wang, X.C.; Hu, Z.C.; David, N.; Ding, W.M. Numerical simulation and field tests of minimum-tillage planter with straw smashing and strip laying based on EDEM software. Comput. Electron. Agric. 2019, 166, 105021. [Google Scholar] [CrossRef]
- Shi, Y.Y.; Luo, W.W.; Hu, Z.C.; Wu, F.; Gu, F.W.; Chen, Y.Q. Design and test of equipment for straw crushing with strip-laying and seed-belt classification with cleaning under full straw mulching. Trans. Chin. Soc. Agric. Mach. 2019, 50, 58–67. (In Chinese) [Google Scholar]
- Shi, Y.Y.; Wang, X.C.; Hu, Z.C.; Gu, F.W.; Chen, Y.Q. Optimization and experiment on key structural parameters of no-tillage planter with straw-smashing and strip-mulching. Int. J. Agric. Biol. Eng. 2021, 13, 103–111. [Google Scholar] [CrossRef]
- Cao, X.P.; Wang, Q.J.; Li, H.W.; He, J.; Lu, C.Y. Combined row cleaners research with side cutter and stubble clean disk of corn no-till seeder. Trans. Chin. Soc. Agric. Mach. 2021, 52, 36–44. [Google Scholar]
- Matin, M.A.; Desbiolles, M.A.; Fielke, J.M. Strip-tillage using rotating straight blades: Effect of cutting-edge geometry on furrow parameters. Soil Tillage Res. 2016, 155, 271–279. [Google Scholar] [CrossRef]
- Yuan, P.P.; Li, H.W.; Jiang, G.J.; He, J.; Lu, C.Y.; Huang, S.H. Design and experiment of straw cleaning device for wide-narrow maize no-tillage sowing strip in drip irrigation area. Trans. Chin. Soc. Agric. Mach. 2021, 52, 43–52. [Google Scholar]
- Wang, Q.; Jia, H.L.; Zhu, L.T.; Li, M.W.; Zhao, J.L. Design and experiment of star-toothed concave disk row cleaners for no-till planter. Trans. Chin. Soc. Agric. Mach. 2019, 50, 68–77. [Google Scholar]
- Zhao, H.B.; He, J.; Zheng, Z.Q.; Zhang, Z.G.; Liu, W.Z. Strip tillage inter-row residue side-throwing device of no/minimum-till seeder for anti-blocking and seedbed-cleaning. Trans. Chin. Soc. Agric. Mach. 2020, 51, 24–34. [Google Scholar]
- Zhao, Y.Z.; Wang, Y.; Gong, Z.P.; Yang, Y.Q.; Zhao, S.H.; Gou, J.B. Design and experiment on side deep and layered fertilizing and seeding components of no-tillage planter. Trans. Chin. Soc. Agric. Mach. 2021, 52, 40–50. [Google Scholar]
- GB/T 20865-2007; No-Tillage Fertile-Seeding Drill. Standardization Administration of China: Beijing, China, 2007.
- NY/T 500-2002; Operating Quality for Crop Straw Returning-Back-to Field Machine. Standardization Administration of China: Beijing, China, 2002.
Figure 1.
Structure of strip fertilization planter for straw back throwing and inter-row laying. 1—depth limiting wheel; 2—protection curtain; 3—crushing spindle; 4—fertilization port; 5—rotary tillage spindle; 6—seed port; 7—suppression wheel; 8—scraper board; 9—diversion device; 10—cover plate; 11—seed fertilizer box; 12—fan shaft; 13—transmission mechanism; 14—frame; 15—reducer; 16—fertilizer fluted roller; 17—seed fluted roller.

Figure 2.
Workflow of broken straw division and strip laying. 1—full amount of straw; 2—diverting and strip-laying device; 3—seed belt in clean area.
Figure 2.
Workflow of broken straw division and strip laying. 1—full amount of straw; 2—diverting and strip-laying device; 3—seed belt in clean area.

Figure 3.
Schematic diagram of transmission system.

Figure 4.
Existing problems with straw back throwing and strip laying.

Figure 5.
DEM model establishment and numerical simulation.

Figure 6.
Effect of interaction between factors on straw crushing stability.

Figure 7.
Effect of interaction between factors on inter-row straw mulching consistency.

Figure 8.
Picture of field validation and test scene.


Table 1.
Contact mechanical property parameters of the simulation model.
| Parameters | Straw | Soil | Steel |
|---|---|---|---|
| Poisson ratio | 0.365 | 0.41 | 0.3 |
| Shear modulus (MPa) | 5.26 × 10³ | 4.0 | 7.90 × 10⁴ |
| Density (kg·m−3) | 0.45 × 10³ | 1.55 × 10³ | 7.86 × 10³ |
| Contact mechanical parameters | Collision restitution coefficient | Straw to straw | 0.26 |
| Straw to soil | 0.34 | ||
| Straw to steel | 0.41 | ||
| Rolling friction coefficient | Straw to straw | 0.01 | |
| Straw to soil | 0.05 | ||
| Straw to steel | 0.12 | ||
| Static friction coefficient | Straw to straw | 0.38 | |
| Straw to soil | 0.33 | ||
| Straw to steel | 0.26 |
Table 2.
Factors and levels of virtual test.
| Test Factors | Coded Value | Interval Δi | |||||
|---|---|---|---|---|---|---|---|
| (−γ) −1.6818 | (−1) | 0 | (+1) | (+γ) +1.6818 | |||
| A | Smashing spindle speed (rpm) | 1838.20 | 1900 | 2000 | 2100 | 2168.18 | 100 |
| B | Conveying impeller speed (rpm) | 188.18 | 195 | 205 | 215 | 221.82 | 10 |
| C | Working forward speed (m·s−2) | 0.56 | 0.70 | 0.90 | 1.10 | 1.23 | 0.2 |
Table 3.
Test schemes and results.
| Test Number | Test Factor | CV of Straw Crushing Y1/% | CV of Inter-Row Straw Mulching Y2/% | ||
|---|---|---|---|---|---|
| A | B | C | |||
| 1 | 1 | 1 | 1 | 9.27 | 12.97 |
| 2 | 1 | 1 | −1 | 10.42 | 14.68 |
| 3 | 1 | −1 | 1 | 11.76 | 15.41 |
| 4 | 1 | −1 | −1 | 10.38 | 16.75 |
| 5 | −1 | 1 | 1 | 17.25 | 13.86 |
| 6 | −1 | 1 | −1 | 14.71 | 14.92 |
| 7 | −1 | −1 | 1 | 16.92 | 15.27 |
| 8 | −1 | −1 | −1 | 14.06 | 16.49 |
| 9 | −1.682 | 0 | 0 | 19.64 | 9.72 |
| 10 | 1.682 | 0 | 0 | 8.51 | 10.25 |
| 11 | 0 | −1.682 | 0 | 15.24 | 18.46 |
| 12 | 0 | 1.682 | 0 | 15.73 | 19.72 |
| 13 | 0 | 0 | −1.682 | 14.57 | 12.07 |
| 14 | 0 | 0 | 1.682 | 16.86 | 11.84 |
| 15 | 0 | 0 | 0 | 14.09 | 8.44 |
| 16 | 0 | 0 | 0 | 10.82 | 9.67 |
| 17 | 0 | 0 | 0 | 12.91 | 10.38 |
| 18 | 0 | 0 | 0 | 14.26 | 8.72 |
| 19 | 0 | 0 | 0 | 13.75 | 9.86 |
| 20 | 0 | 0 | 0 | 14.13 | 10.74 |
| 21 | 0 | 0 | 0 | 10.89 | 9.68 |
| 22 | 0 | 0 | 0 | 13.72 | 11.02 |
| 23 | 0 | 0 | 0 | 12.94 | 8.97 |
Table 4.
ANOVA analysis of the regression model.
| Indicator | Source of Variance | Sum of Squares | Freedom | Mean Square | F | P | Significant |
|---|---|---|---|---|---|---|---|
| CV of straw crushing Y1 | Model | 134.65 | 9 | 14.96 | 6.09 | 0.0019 | * |
| A | 99.39 | 1 | 99.39 | 40.48 | <0.0001 | ** | |
| B | 0.29 | 1 | 0.29 | 0.12 | 0.7346 | ||
| C | 3.58 | 1 | 3.58 | 1.46 | 0.0026 | * | |
| AB | 1.47 | 1 | 1.47 | 0.60 | 0.4528 | ||
| AC | 3.34 | 1 | 3.34 | 1.36 | 0.0043 | * | |
| BC | 1.02 | 1 | 1.02 | 0.41 | 0.5314 | ||
| A2 | 0.11 | 1 | 0.11 | 0.043 | <0.0001 | ** | |
| B2 | 2.68 | 1 | 2.68 | 1.09 | 0.3450 | ||
| C2 | 3.90 | 1 | 3.90 | 1.59 | 0.2295 | ||
| Residual | 31.92 | 13 | 2.46 | / | Not significant | ||
| Lack of fit | 17.60 | 5 | 3.52 | 1.97 | 0.1886 | ||
| Pure error | 14.32 | 8 | 1.79 | / | |||
| Cor total | 166.57 | 22 | / | ||||
| CV of inter-row straw mulching Y2 | Model | 221.94 | 9 | 24.66 | 18.19 | <0.0001 | ** |
| A | 0.34 | 1 | 0.34 | 0.25 | 0.6264 | ||
| B | 2.40 | 1 | 2.40 | 1.77 | <0.0001 | ** | |
| C | 2.18 | 1 | 2.18 | 1.61 | 0.0024 | * | |
| AB | 0.29 | 1 | 0.29 | 0.22 | 0.6499 | ||
| AC | 0.074 | 1 | 0.074 | 0.055 | 0.8188 | ||
| BC | 0.0055 | 1 | 0.0055 | 0.1140 | 0.0001 | * | |
| A2 | 1.82 | 1 | 1.82 | 1.34 | 0.2674 | ||
| B2 | 199.45 | 1 | 199.45 | 147.14 | <0.0001 | ** | |
| C2 | 16.33 | 1 | 16.33 | 12.05 | 0.0041 | * | |
| Residual | 17.62 | 13 | 1.36 | / | Not significant | ||
| Lack of fit | 11.23 | 5 | 2.25 | 2.81 | 0.0936 | ||
| Pure error | 6.39 | 8 | 0.80 | / | |||
| Cor total | 239.56 | 22 | / | ||||
Note: ** P < 0.01 (highly significant); * P < 0.05 (significant). A P value greater than 0.05 was considered non-significant.
Publisher’s Note: MDPI stays neutral with regard to jurisdictional claims in published maps and institutional affiliations. |
© 2022 by the authors. Licensee MDPI, Basel, Switzerland. This article is an open access article distributed under the terms and conditions of the Creative Commons Attribution (CC BY) license (https://creativecommons.org/licenses/by/4.0/).
Share and Cite
MDPI and ACS Style
Shi, Y.; Yu, H.; Jiang, Y.; Wang, X.; Chen, H.; Liu, H. Optimization of Strip Fertilization Planter for Straw Throwing and Paving. Agriculture 2022, 12, 613. https://doi.org/10.3390/agriculture12050613
AMA Style
Shi Y, Yu H, Jiang Y, Wang X, Chen H, Liu H. Optimization of Strip Fertilization Planter for Straw Throwing and Paving. Agriculture. 2022; 12(5):613. https://doi.org/10.3390/agriculture12050613
Chicago/Turabian StyleShi, Yinyan, Hanwen Yu, Ye Jiang, Xiaochan Wang, Hongtao Chen, and Hui Liu. 2022. "Optimization of Strip Fertilization Planter for Straw Throwing and Paving" Agriculture 12, no. 5: 613. https://doi.org/10.3390/agriculture12050613
Note that from the first issue of 2016, this journal uses article numbers instead of page numbers. See further details here.