Article

Machine Learning Approach to Predict Air Temperature and Relative Humidity inside Mechanically and Naturally Ventilated Duck Houses: Application of Recurrent Neural Network

1
Department of Rural Systems Engineering, Research Institute for Agriculture and Life Sciences, College of Agriculture and Life Sciences, Seoul National University, 1 Gwanakno, Gwanakgu, Seoul 08826, Korea
2
Department of Rural Systems Engineering, Research Institute of Agriculture and Life Sciences, Global Smart Farm Convergence Major, College of Agriculture and Life Sciences, Seoul National University, 1 Gwanakno, Gwanakgu, Seoul 08826, Korea
3
Research Institute of Green Eco Engineering, Institute of Green Bio Science and Technology, Seoul National University, 1477 Pyeongchang-daero, Daehwa-myeon, Pyeongchang-gun 25354, Korea
4
Agriculture, Animal & Aquaculture Intelligence Research Center, Electronics and Telecommunications Research Institute, 218 Gajeongno, Yuseong-gu, Daejeon 305-700, Korea
5
Department of Smart Farm Engineering, College of Industrial Sciences, Kongju National University, 54 Daehak-ro, Yesan-eup, Yesan-gun 32439, Korea
*
Author to whom correspondence should be addressed.
Agriculture 2022, 12(3), 318; https://doi.org/10.3390/agriculture12030318
Submission received: 26 January 2022 / Revised: 19 February 2022 / Accepted: 21 February 2022 / Published: 22 February 2022
(This article belongs to the Special Issue The Application of Machine Learning in Agriculture)

Abstract

:
The duck industry ranks sixth as one of the fastest-growing major industries for livestock production in South Korea. However, there are few studies quantitatively predicting the internal thermal and moisture environment of duck houses. In this study, high-accuracy recurrent neural network (RNN) models were used to predict the internal air temperature and relative humidity of mechanically and naturally ventilated duck houses. The models were developed according to the type of duck houses, seasons, and environmental variables by learning the monitoring data of the internal and external environments. The optimal sequence length of learning data for the development of the RNN model was selected as 120 min. As a result of the validation, both air temperature and relative humidity could be accurately predicted within 1% error. In addition, simplified RNN models were additionally developed by learning only from the data of external air temperature, relative humidity, and duck weight, which are relatively easy to acquire at the farms. The accuracy of the simplified RNN models was similar to the basic model for predicting the internal air temperature and relative humidity of duck houses in real time. In the future, for the convergence of information and communications technologies (ICTs) and application of smart farms in duck houses, the RNN models of duck houses developed in this study can be applied to predict and control the internal environments of duck houses using the model predictive control (MPC) technique.

1. Introduction

The livestock industry has continuously grown in South Korea, with the total production of livestock reaching about 17 billion USD in 2019, about 40% of the total agricultural production [1]. In Korea, the duck production has rapidly increased since 2005. Duck farming was the sixth largest industry in 2017 among the livestock industries in South Korea with a production of 729 million USD [1].
Information and communications technology (ICT)-based smart farms have been actively developed and disseminated in accordance with the fourth industrial revolution. The Rural Development Administration has promoted the development of smart farms by dividing them into first, second, and third generations as shown in Table 1 [2]. The first-generation smart farms aim to improve convenience through remote control of environments based on communication technology. The second-generation smart farms aim to improve productivity through precision management. A representative example of a second-generation smart farm is a smart farm controlled through decision making by computers and humans on the basis of big data and artificial intelligence technology. The third-generation smart farms aim to improve sustainability by realizing high quality and high productivity through automatic management using robots.
In South Korea, the agricultural facilities for rearing pigs, chickens, and cows have reached the level of second-generation smart farms. However, the development speed of duck houses has been relatively slow, obtaining only first-generation smart farms. Conventional duck houses converted from plastic greenhouses account for approximately 34% of the total. This percentage is higher than those of other livestock houses such as pig houses and broiler houses [3]. Although the initial installation cost of conventional duck houses is low, they are weak to meteorological disasters such as typhoons, as well as to the outbreak of infectious diseases. In conventional duck houses, it is hard to properly manage the internal environment because of high temperatures in the summer and low thermal insulation and infiltration in the winter. Furthermore, conventional duck houses are inappropriate for the maintenance and application of ICT equipment. Additionally, only 1.9% of farmers want to use a mechanically ventilated duck house according to a survey [4], acting as a barrier for duck smart farms.
To manage and control the internal environments of duck houses, field-measured data have been mainly used. However, the internal environments of duck houses such as temperature, relative humidity, dust, and concentration of corrosive gas are usually high. Because the sensors for environmental monitoring of duck houses are directly and continuously exposed, these poor environments often cause sensor corrosion or malfunction. Thus, it is hard to continuously accumulate reliable data of the environment inside duck houses. Predicted internal environments inside duck houses could be applied for management and control instead of measured data when the environmental sensors are not working. Recent studies related to numerical model-based control have been conducted for precise control of the environments inside livestock facilities. Additionally, in order to upgrade a first-generation smart farm to a second-generation smart farm, it is necessary to develop a control technology using model prediction according to the application of artificial intelligence technology. The accurate prediction of the internal environments of duck houses must be implemented for accurately environmental management and control.
Several studies have been conducted to analyze and predict the internal environments of livestock houses using numerical models [5,6,7,8,9,10,11,12,13,14,15]. Most previous studies have been conducted for air temperature in broiler houses and pig houses. Furthermore, there have been a few studies predicting and analyzing the internal environments of duck houses. Among them, the building energy simulation (BES) model for analyzing the internal air temperature and relative humidity of a mechanically ventilated duck house was developed [11]. The heat stress of ducks and the energy loads of the duck house were evaluated using the developed BES model. However, among the previous studies, there were few studies on naturally ventilated duck houses.
Recently, artificial neural networks (ANNs) have been actively used because of their ability to accurately predict the dependent variables from independent variables [16,17]. The recurrent neural network (RNN) model, which is a type of ANN model, has been actively applied to the agricultural field due to the advantage of being suitable for dealing with time-series data [18,19,20,21,22]. Several studies have also used ANN models to analyze and predict the weather data [23,24]. However, few studies focused on predicting the internal environment of livestock houses. The RNN model has the advantage of high accuracy and improving the model through continuous learning. Therefore, it is expected that the RNN model can be applied to develop the model for predicting the internal environments of duck houses in real time.
In this study, RNN models according to the type of duck houses, seasons, and environmental variables were developed for predicting the internal air temperature and relative humidity of mechanically and naturally ventilated duck houses. The internal and external environmental data of the duck houses monitored during field experiments, such as external air temperature, relative humidity, solar radiation, wind speed, wind direction, ventilation rate of the mechanically ventilated duck house, and weight of the duck, were used as learning data for RNN model development. Because ventilation is one of the most important factors affecting the internal environments of duck houses, the ventilation rates of the mechanically ventilated duck house were monitored and used as learning data. The data of wind speed and direction were used as learning data instead of the ventilation rate of the naturally ventilated duck house because it was hard to quantitatively monitor the natural ventilation rate during field experiments. The accuracy of the developed RNN models was evaluated according to the type of duck houses, seasons, and environmental variables. In addition, the simplified RNN models were developed to improve the applicability of the RNN model to the field. The simplified RNN models were developed by learning only from external air temperature and relative humidity data, which are relatively easy to acquire at the farms. Lastly, the accuracy of the simplified RNN models was compared with that of the basic model for predicting the internal air temperature and relative humidity of duck houses in real time.

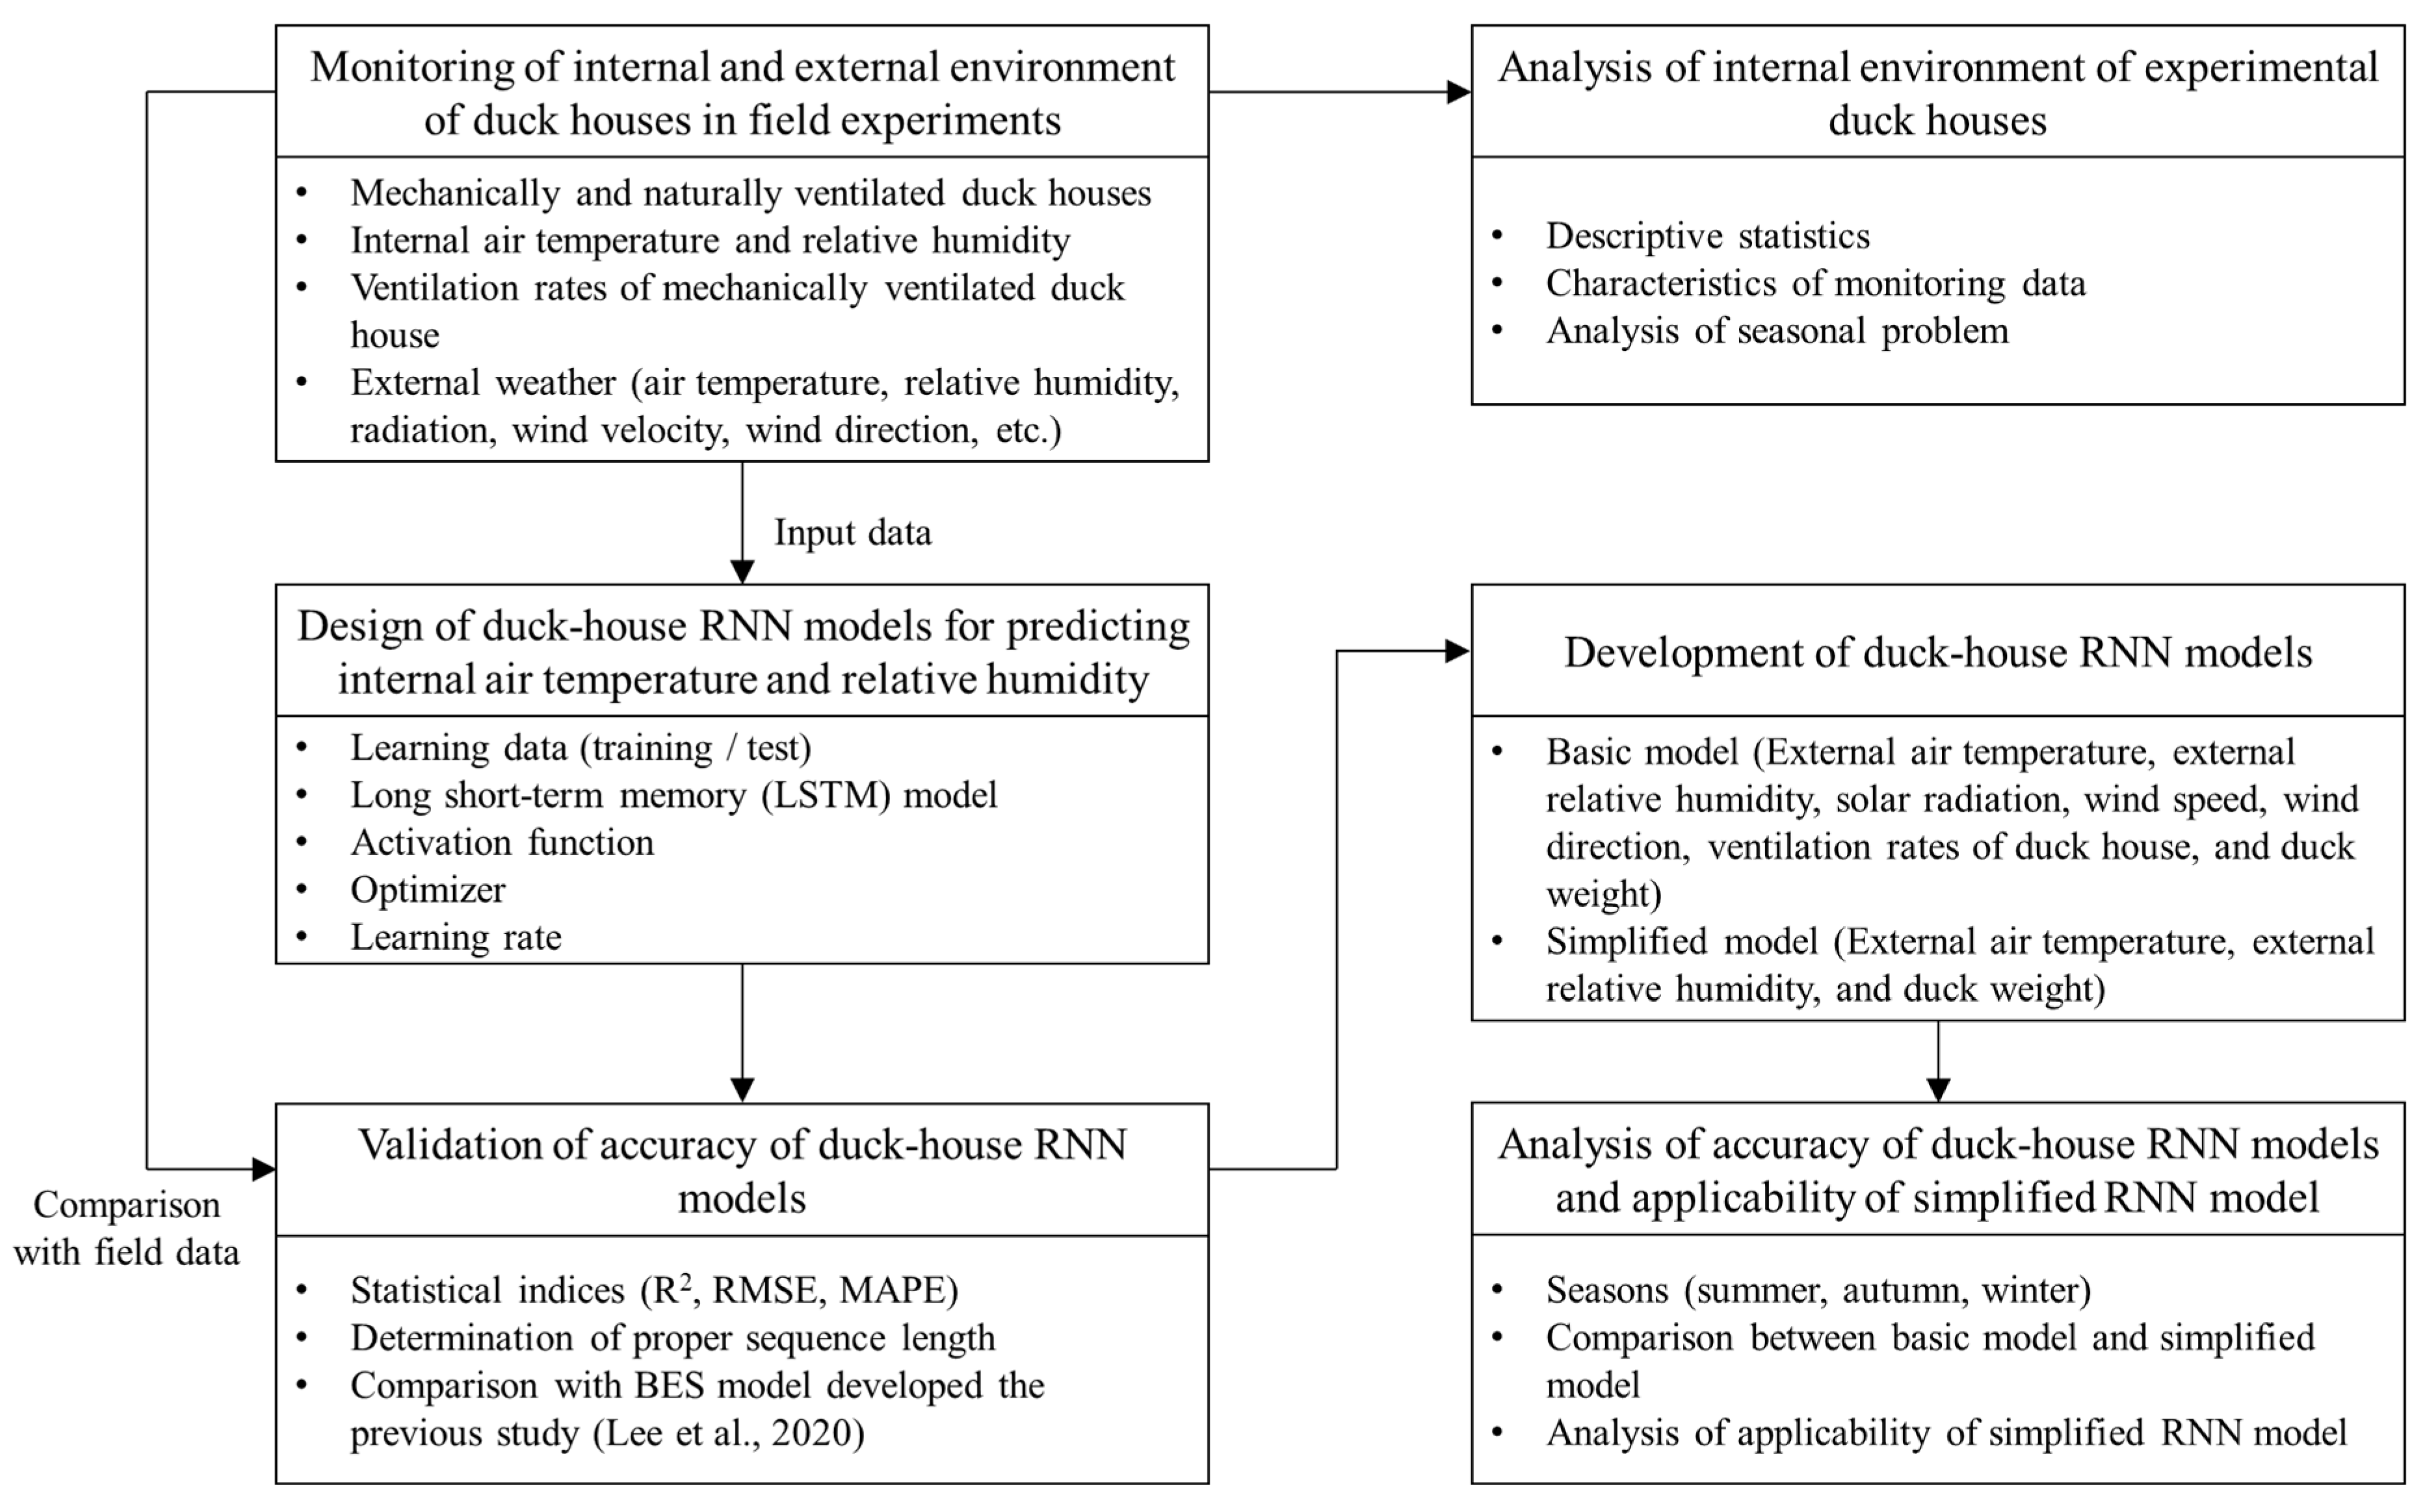
2. Materials and Methods

RNN models were developed for predicting the internal air temperature and relative humidity of duck houses following the research flow in Figure 1. First, field experiments were conducted to monitor the internal and external environments of the mechanically and naturally ventilated duck houses. The data of the air temperature, relative humidity, ventilation rate, solar radiation, wind direction, wind speed, etc. were acquired through field experiments. According to the results of field experiments, descriptive statistics were applied to analyze the problems of the environmental management of duck houses according to seasons. RNN models were developed through the learning of monitoring data, and the RNN models developed in this study were validated through a comparison with the data measured during the field experiments. In addition, the optimal sequence length was selected by comparing the accuracy of the RNN models trained in various conditions of sequence length. The accuracies of the developed RNN models were evaluated according to the type of duck houses, seasons, environmental variables, etc. Lastly, simplified RNN models were developed by learning only the external air temperature and relative humidity data, which are relatively easy to acquire at the farms.

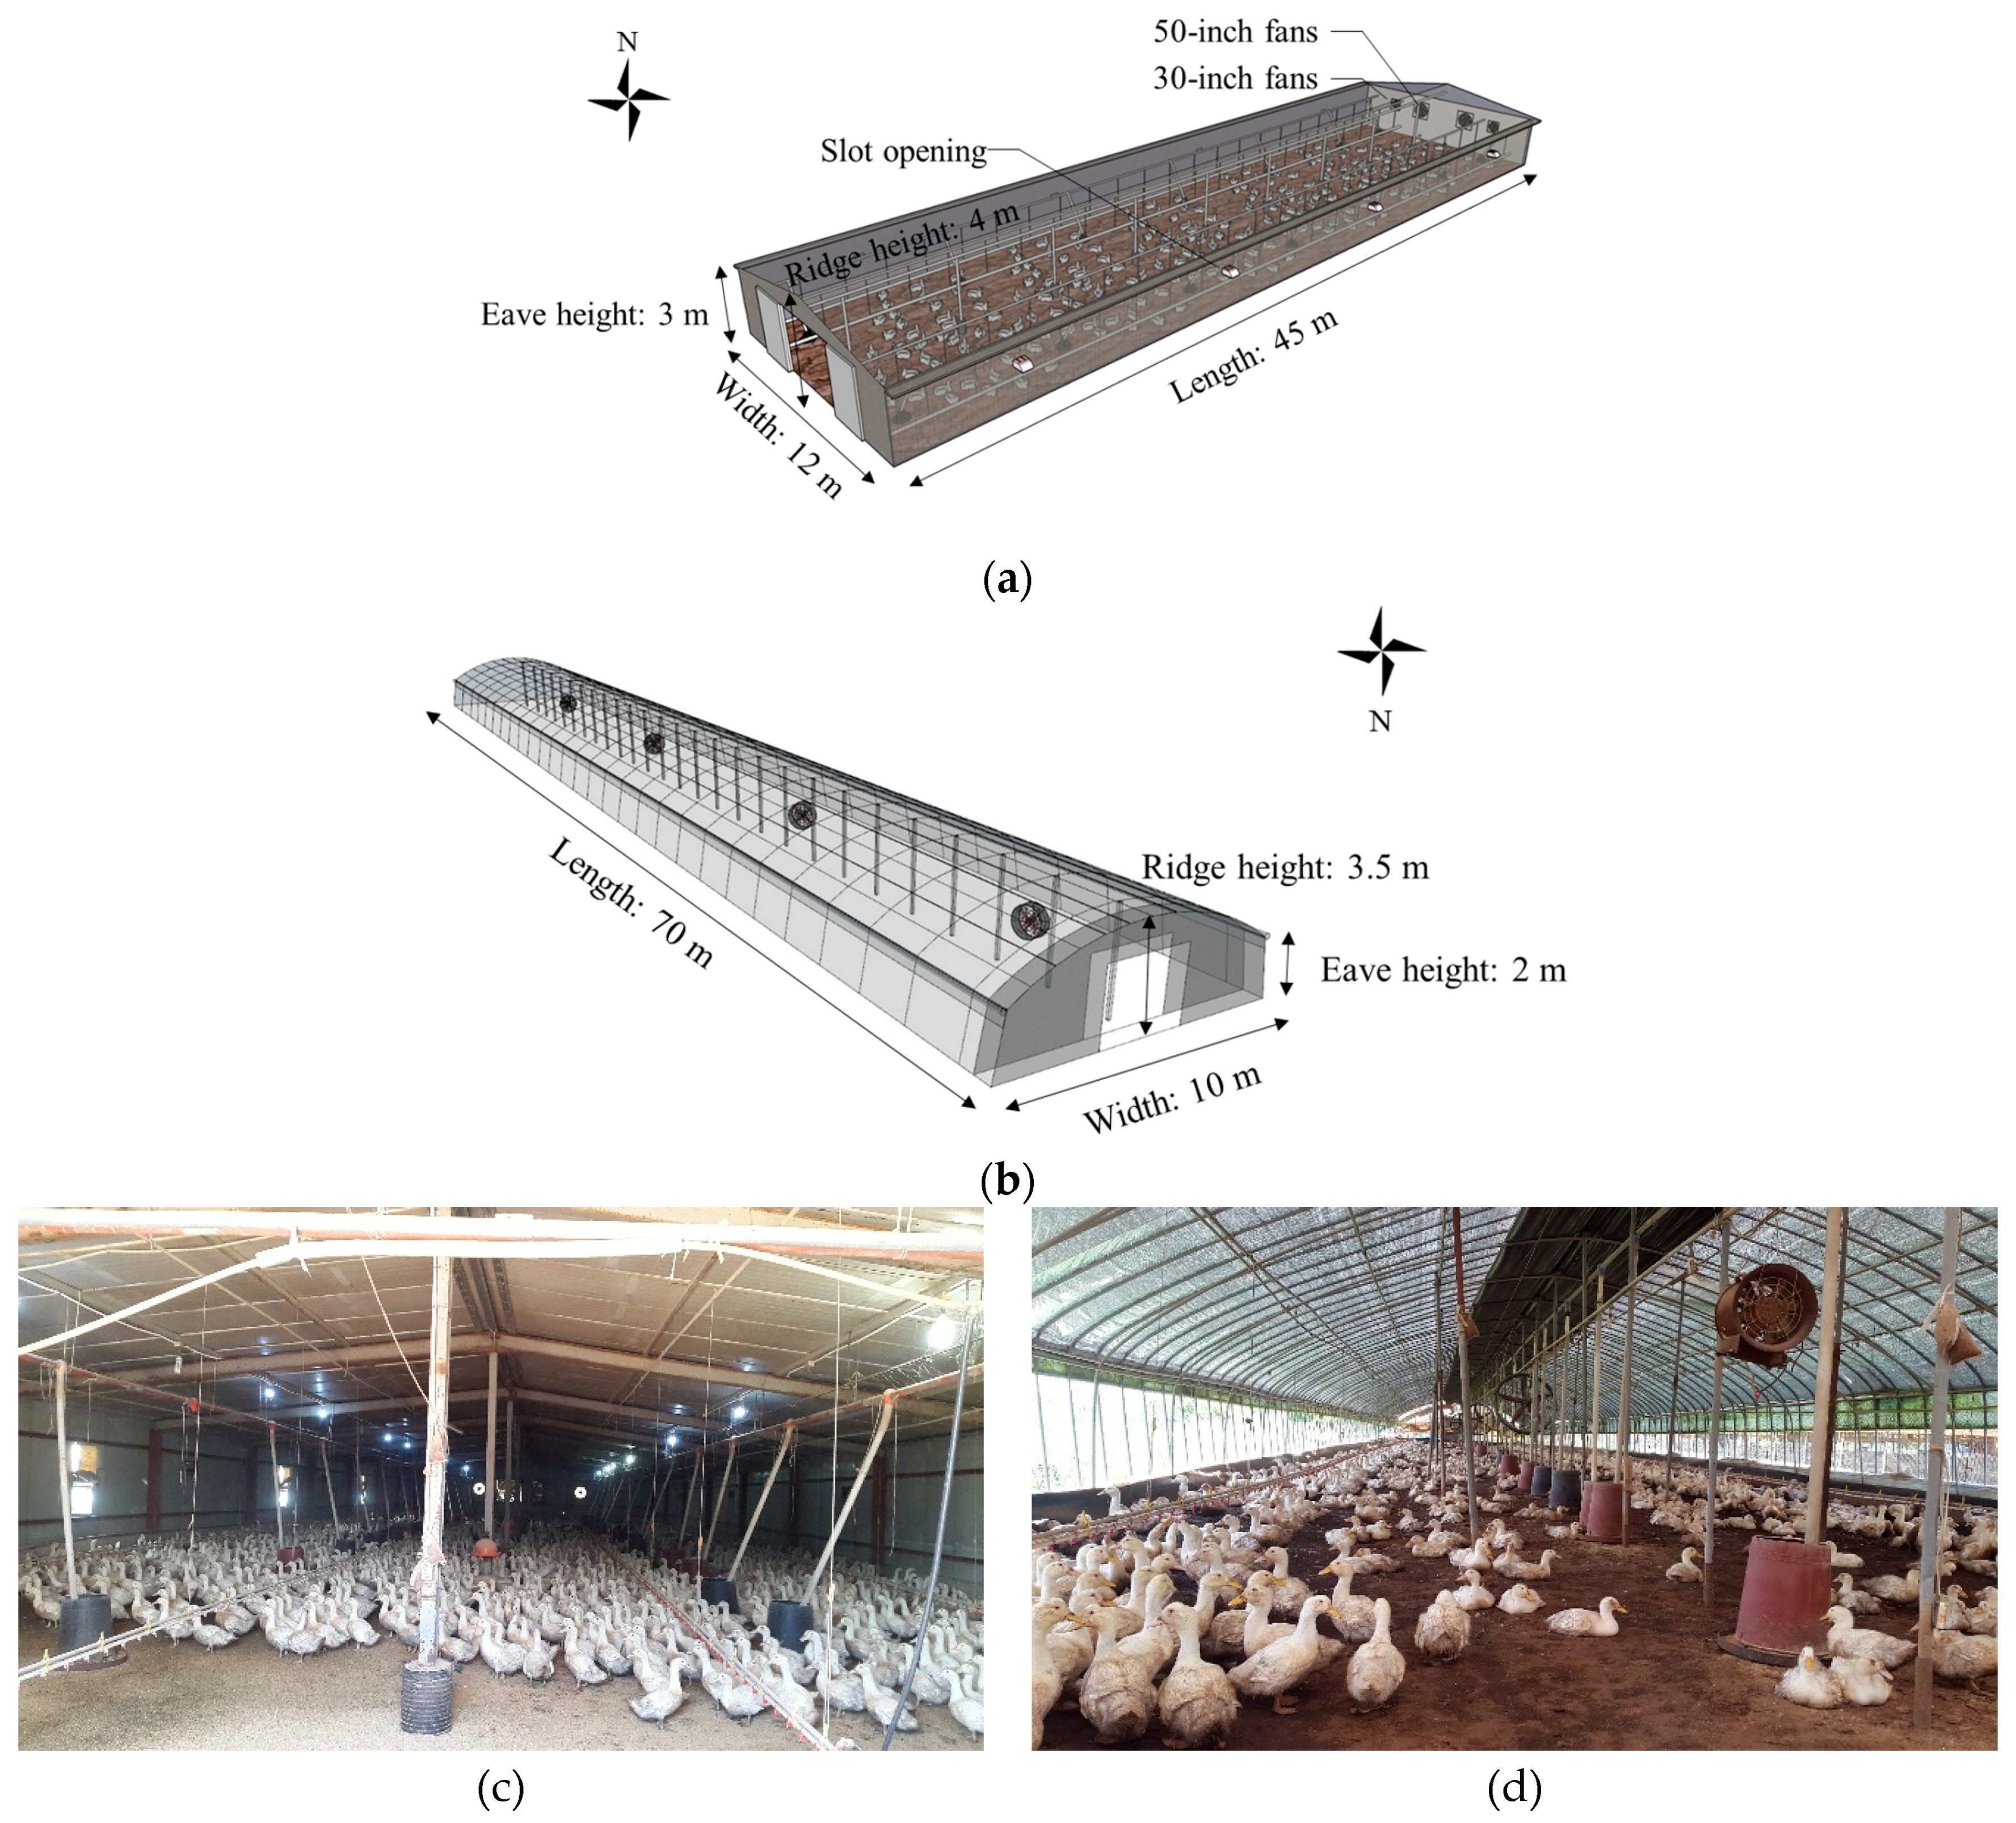
2.1. Experimental Duck Houses

A mechanically ventilated duck house and a duck house converted from a plastic greenhouse were used for developing the RNN model of mechanically and naturally ventilated duck houses, respectively (Figure 2). The internal environments of these duck houses could be directly compared with each other because these duck houses were located at the same farm (Sinbuk-myeon, Yeongam-gun, Jeollanam-do Province (126°38′ E, 34°53′ N)). Environmental monitoring data from 30 July 2018 to 7 January 2019 (three rearing periods) were used as the learning data for developing the RNN model of duck houses. The mechanically ventilated duck house had a width of 12 m, a length of 45 m, an eave height of 3 m, and a ridge height of 4 m. On the other hand, the naturally ventilated duck house had a width of 10 m, a length of 70 m, an eave height of 2 m, a ridge height of 3.5 m, and a height of vent openings of 1.2 m. A total of 1900 and 2460 ducks were reared within the mechanically and naturally ventilated duck houses, respectively. On the basis of the number of reared ducks in each duck house, the space allowance was 0.28 m2·animal−1, which is higher than the standard of 0.246 m2·animal−1 [25]. The ducks were moved to the experimental duck houses only after the ducklings reached 1–2 weeks old from other facilities to reduce the environment management costs pertaining to heating, electricity, etc. After rearing ducks, the duck houses were ventilated to dry the litter for 15 days. The bedding materials of the duck houses were not replaced but were managed by spraying chaff following the farmer’s discretion. There were eight slot openings (0.3 m × 0.5 m) in the sidewalls, two 1.4 m diameter exhaust fans, and two 0.75 m diameter exhaust fans in the mechanically ventilated duck house. The 1.4 m diameter exhaust fans were operated via a simple on/off control. The 0.75 m diameter exhaust fans were operated according to the control level (0–100%). A control level of 100% meant that the 0.75 m diameter exhaust fan was fully operated. When all four exhaust fans were fully operating, the ventilation rate of the mechanically ventilated duck house was about 62,300 m3·h−1 (equivalent to an air change of 34.6 h−1). In winter and during the change of season, a small amount of external air was allowed into the mechanically ventilated duck house through slot openings. During summer, the slot openings, the exhaust fans, and open entrance were used for the ventilation of the mechanically ventilated duck house. Although no cooling system was implemented for reducing the high temperature in the naturally ventilated duck house during summer, the vent openings were fully open to allow the entry of fresh air. In winter, vent openings were rarely opened to reduce energy costs and manage the temperature inside the duck houses. Ventilation of the naturally ventilated duck house was performed only during the daytime in winter. However, a kerosene heater (MS-101, Samsung Industry Co., Busan, Korea) with a maximum heating capacity of 418,400 kJ·h−1 was used to properly maintain the thermal environment inside the duck houses in winter.

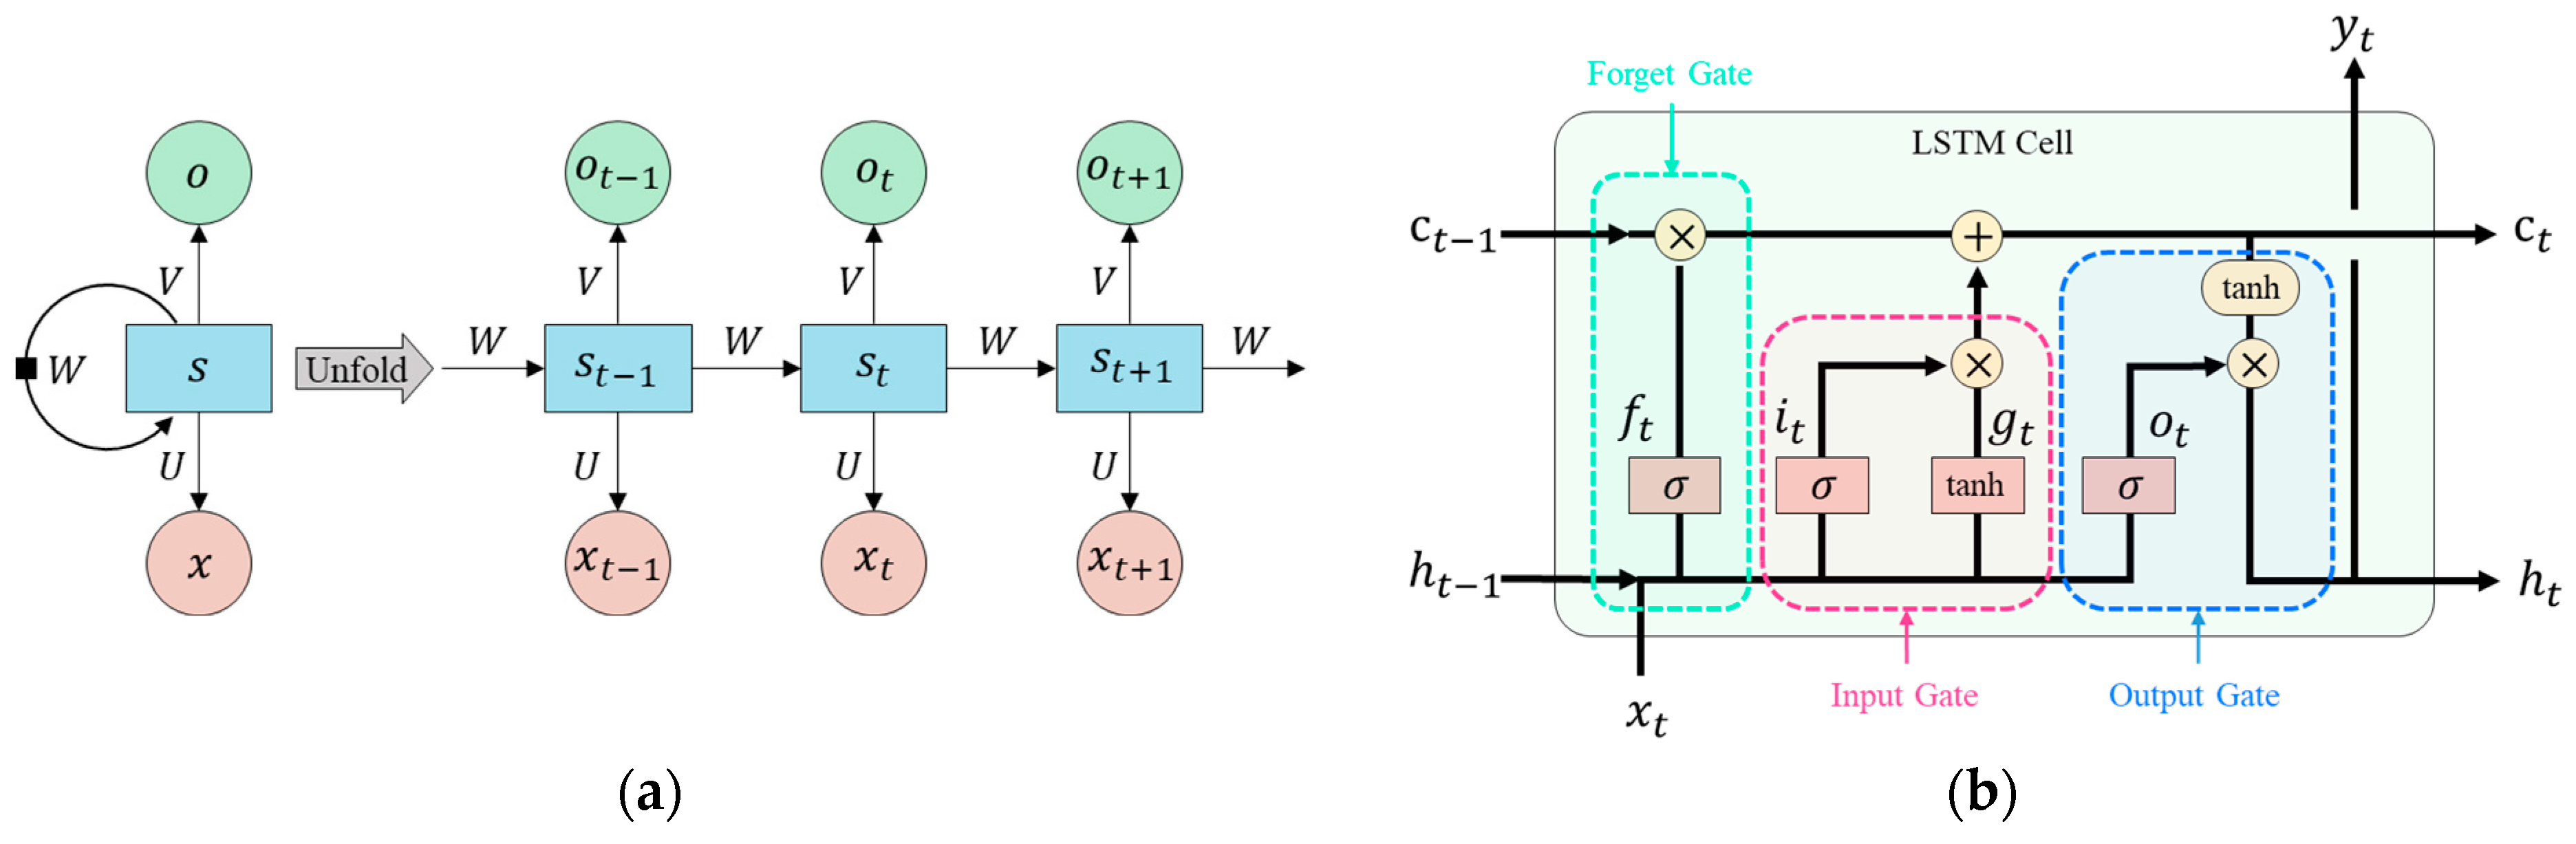
2.2. Recurrent Neural Network

Recently, machine learning has been actively used in several fields with the development of computer performance. Machine learning in the livestock field is also actively used to analyze animal behavioral pattern [19,20,26,27,28], to analyze behavior prior to calving [29,30,31], to analyze the voice of livestock [32], and to predict dependent variables according to various environmental variables [18]. Among several machine learning techniques, ANN has been actively used as a method to accurately predict the dependent variables from independent variables. In this study, the RNN model, which is a type of ANN, was used to predict the internal air temperature and relative humidity of the duck houses using the external air temperature and relative humidity, solar radiation, wind environment, ventilation rate, and growth data of the duck. The RNN is an artificial neural network suitable for dealing with time-series data. Using an RNN, iterative learning is possible through the memory inside the artificial neural network. The memory can store the information obtained at the previous stage of learning, and it provides a feedback function that takes into account the information from the previous stage as the input data. The structure of the RNN features a path for reinserting the output value of the hidden layer at the previous timepoint (t − 1) as the input value of the hidden layer at the next timepoint (t). This structure is an artificial neural network structure that repeats the process in which the result of the current time (t) affects the next time (t + 1). The basic structure of an RNN model is shown in Figure 3a.
LSTM was developed to solve the vanishing gradient problem of a general RNN algorithm [33], whereby the gradient of a timestep far from the current timestep (t) has little effect on the learning process when learning data for a long time. It is impossible to learn about long-term dependence using the general RNN model. LSTM remembers the data of a long previous sequence. The core of the LSTM algorithm is a cell with several gates. LSTM accepts previous data with an addition operation; hence, the vanishing gradient problem does not occur. The basic structure of an LSTM model is shown in Figure 3b. Compared with other time-series models, the LSTM model does not need to specify the nonlinear functions to be estimated, and it has demonstrated superior performance in a wide range of sequence modeling applications [33,34,35,36]. Additionally, if the number of layers is the same, LSTM has a more complex structure and has more parameters than gated recurrent units (GRUs) [37], which are also usually used for predicting some data in real time, resulting in higher accuracy [38]. The LSTM model has also shown higher accuracy compared with the GRU model in previous studies [27,39]. In this study, an LSTM model suitable for learning long-term data was used to predict the internal environments of duck houses.

2.3. Experimental Procedure

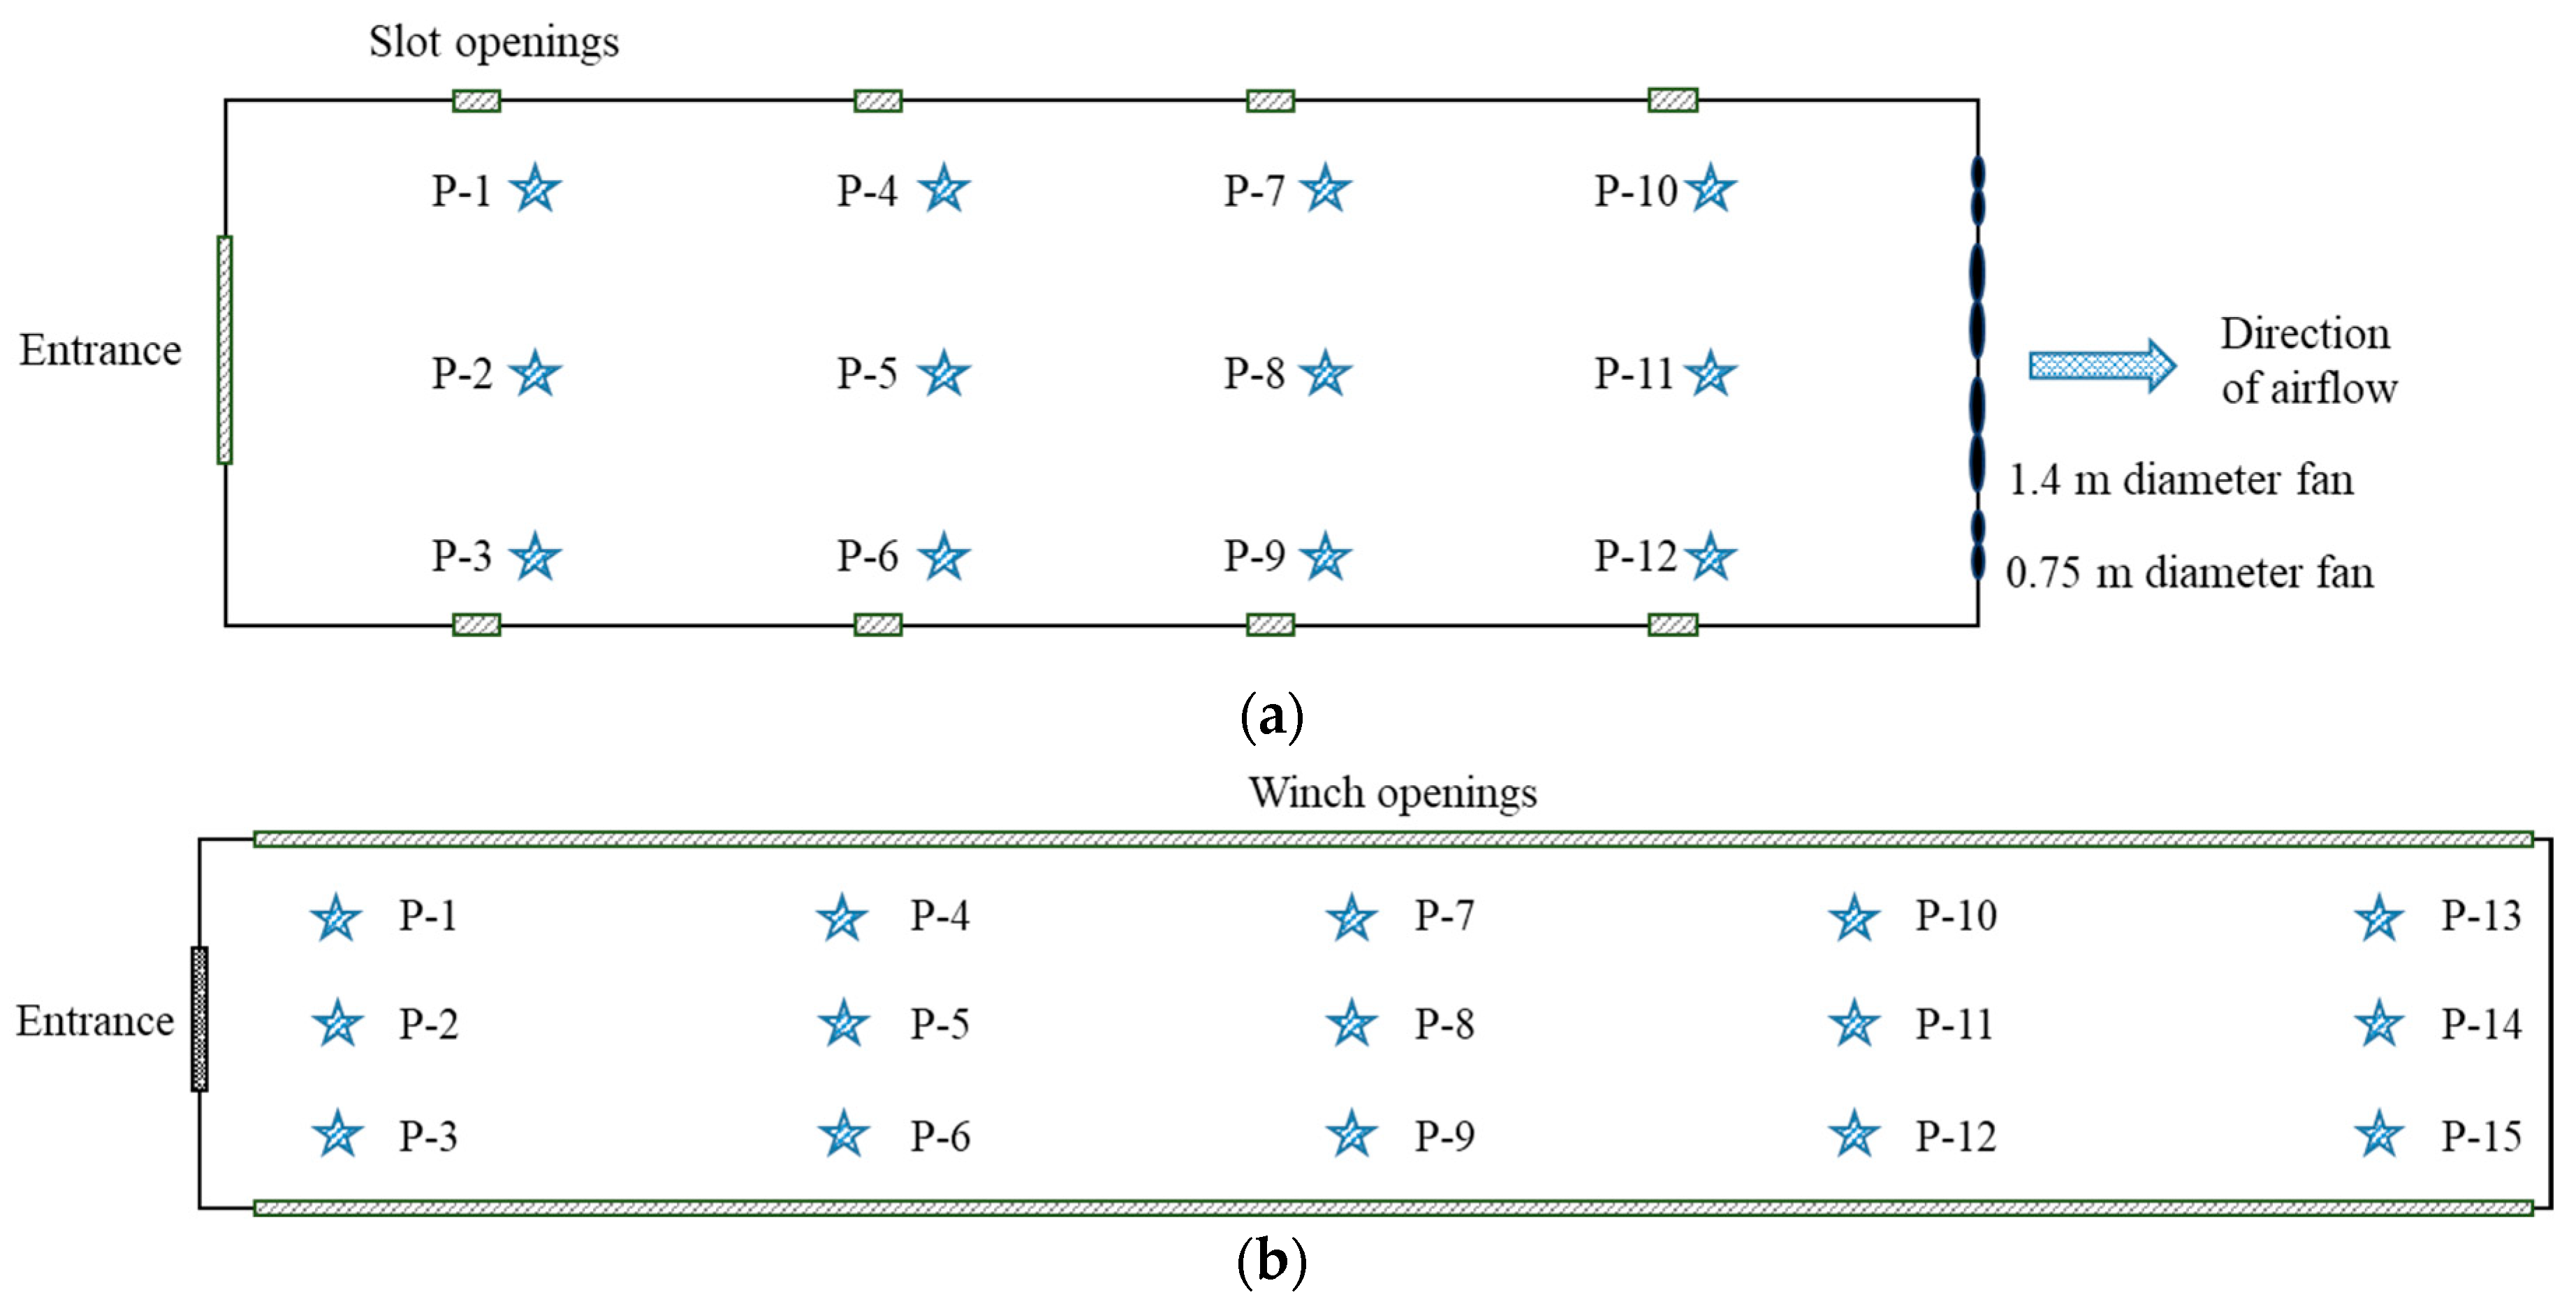
2.3.1. Data Collection of Internal and External Environments of Duck Houses

To develop the RNN models for predicting the internal environments of duck houses, validate them, and then enhance their accuracy, the monitoring data of the external and internal environments observed during the field experiments were used. Each RNN model according to seasons was developed using monitoring data during the summer, autumn, and winter. As shown in Figure 4, 12 and 15 sensors (HTX 75 series, Dotech Inc., Ansan-si, Gyeonggi-do, Korea) were installed to measure the internal air temperature and relative humidity of the mechanically and naturally ventilated duck houses, respectively. These sensors were installed at a height of 1.2 m at regular intervals to prevent breakdown by birds. When the exhaust fans were operated in the mechanically ventilated duck house, AC clamp sensors and an electrometer were installed for the monitoring of electric current flow. The ventilation rates of the mechanically ventilated duck house were converted from the monitoring data of the electric current flow in real time. The data of the ventilation rates, air temperature, and relative humidity inside the duck house were monitored at 1 s intervals. However, the data averaged over 5 min were used to develop the RNN model. To observe the weather data, a portable weather station (Watchdog weather station 2900ET, Aurora, IL, USA) was installed on the roof of the control room in the farm. Weather data such as the wind environments, solar radiation, air temperature, relative humidity, and rainfall were measured at 1 s intervals, and data averaged over 5 min were recorded. Ducks were reared for the same period in the mechanically and naturally ventilated duck houses. The ducks were reared to about 3.5 kg, and the weights data for the development of the RNN model were considered as the growth curve of the duck [40].

2.3.2. Design of RNN Model of Duck House

In this study, the RNN models for predicting the internal temperature and relative humidity of the duck houses were developed by learning the monitoring data measured inside and outside of the mechanically and naturally ventilated duck houses. A vanishing gradient problem may occur when long-term data are used for training data with a general RNN model. Therefore, in this study, a single-layered LSTM model suitable for learning long-term data was used. As learning parameters, the learning rate was set to 0.01, and the tanh function, which is known to generally have high accuracy for the RNN model, was used as the activation function. The Adam optimizer was applied as the optimizer [41], and the loss was learned so that the mean square error was minimized [42,43,44]. For RNN learning, missing data were linearly interpolated. Detailed information of the dataset for development of the RNN model such as the monitoring period, the number of total dataset, training dataset, and test dataset is presented in Table 2. The total dataset according to summer, autumn, and winter was 12,960, 11,808, and 8640, respectively. Specifically, 70% of the data measured for each rearing period were used as the learning data for model development considering the time series, while 30% of the data for each rearing period were used as data to validate the developed RNN models [21,22,31,45,46].
External weather conditions such as air temperature, relative humidity, and solar radiation are the factors affecting the internal air temperature and relative humidity of duck houses. Furthermore, ventilation is one of the main factors with the greatest influence on the internal environment of duck houses. Because the sensible heat and latent heat of ducks change with their growth, it is necessary to consider the weight of the ducks when developing the RNN models. Therefore, the data of external air temperature, relative humidity, and solar radiation, as well as ventilation rate and weight of the duck, were used as training data in order to develop the RNN model for predicting the internal air temperature and relative humidity of the mechanically ventilated duck house. Although it is hard to quantitatively monitor the ventilation rates of the naturally ventilated duck house, the external wind speed and wind direction are the main factors for natural ventilation. Therefore, when the RNN models of the naturally ventilated duck house were developed, the wind speed and wind direction data were used as training data instead of the ventilation rate.
Because the ranges of learning variables are different, the ranges of data according to several variables should be unified from 0 to 1. If the data range is not unified, the model diverges during the training process. For successful learning, all training data were normalized in the range of 0 to 1 using the min–max scaler in Equation (1).
x s c a l e d = x x m i n ( x m a x x m i n ) + 10 7 ,
where x is the learning data, x s c a l e d is the scaled learning data, x m a x is the maximum value of a variable, x m i n is the minimum value of a variable, and 10−7 is a noise term for preventing zero division.

2.3.3. Validation of RNN Model

The developed RNN model of the duck houses was validated by comparing the predicted data of the air temperature and relative humidity using the RNN model with the measured data of the air temperature and relative humidity data during the field experiments. Thirty percent of the total data for each rearing period were used to validate the developed RNN models. In general, the accuracy of the RNN model increases as the sequence length increases, and there is a threshold value of sequence length for which the accuracy of the RNN model no longer improves. A longer sequence length necessitates a longer learning time for the development of the RNN model. Therefore, the optimal sequence length was selected by comparing the accuracy of the RNN model developed according to sequence lengths of 5, 10, 30, 60, 120, and 240 min. Additionally, the accuracy and characteristics of the RNN model for the mechanically ventilated duck house were compared with those of the BES model developed in a previous study [11]. Statistical indices such as coefficient of determination (R2), root-mean-square error (RMSE), and mean absolute percentage error (MAPE) were calculated to validate the RNN models by comparing the predicted data obtained using the developed RNN model with the data measured during the field experiments using Equations (2)–(4), respectively. R2 and RMSE, which are generally used have a no-constant criterion for comparing the predicted and measured data. Therefore, MAPE was additionally used as a measure for evaluating the predicted accuracy of the developed RNN models.
R 2 = ( i = 1 n ( R i R i ¯ ) ( C i C i ¯ ) i = 1 n ( R i R i ¯ ) 2 × i = 1 n ( C i C i ¯ ) 2 ) 2 ,
RMSE = i = 1 n ( R i C i ) 2 n ,
MAPE = 100 n i = 1 n | R i C i R i | ,
where R 2 is the coefficient of determination, RMSE is the root-mean-square error (°C, %), MAPE is the mean absolute percentage error (%), n is the total data according to time, R i is the measured data at a specific time, R i ¯ is the average of the measured data at a specific time, C i is the predicted data at a specific time, and C i ¯ is the average of the predicted data at a specific time.

2.3.4. Comparison of Accuracy of RNN Models

Analysis conditions for the developed RNN model were a total of 48 cases as shown in Table 3. The data of external air temperature, relative humidity, solar radiation, ventilation rate, and weight of the duck were used as training data in order to develop the RNN model of the mechanically ventilated duck house for estimating the internal air temperature and relative humidity. The data of external air temperature, relative humidity, solar radiation, wind speed, wind direction, and weight of the duck were used as training data in order to develop the RNN model of the naturally ventilated duck house for estimating the internal air temperature and relative humidity.
Considering the applicability of the RNN models to the field, simplified RNN models were additionally developed by learning only the data of the external air temperature, relative humidity, and duck weight, which are relatively easy to acquire at duck farms. It was generally difficult to quantitatively monitor the ventilation rate of duck houses at duck farms. Because most farms do not install their own weather stations, it is difficult to observe the external wind environment and radiation in real time. However, it is relatively easy to obtain the data of external air temperature and relative humidity from simple sensor installation and through the Meteorological Agency. The duck weight is an important factor affecting the internal environment of duck houses. These data could be calculated from growing days. The accuracy of simplified RNN models was then compared and analyzed.
Additionally, the accuracy of RNN models can be improved when time-series data are trained in reverse order according to previous studies [11,47,48,49]. Therefore, in this study, the RNN models were developed by learning time-series data in reverse to improve their accuracy, and the accuracy of these RNN models was then compared.

3. Results and Discussion

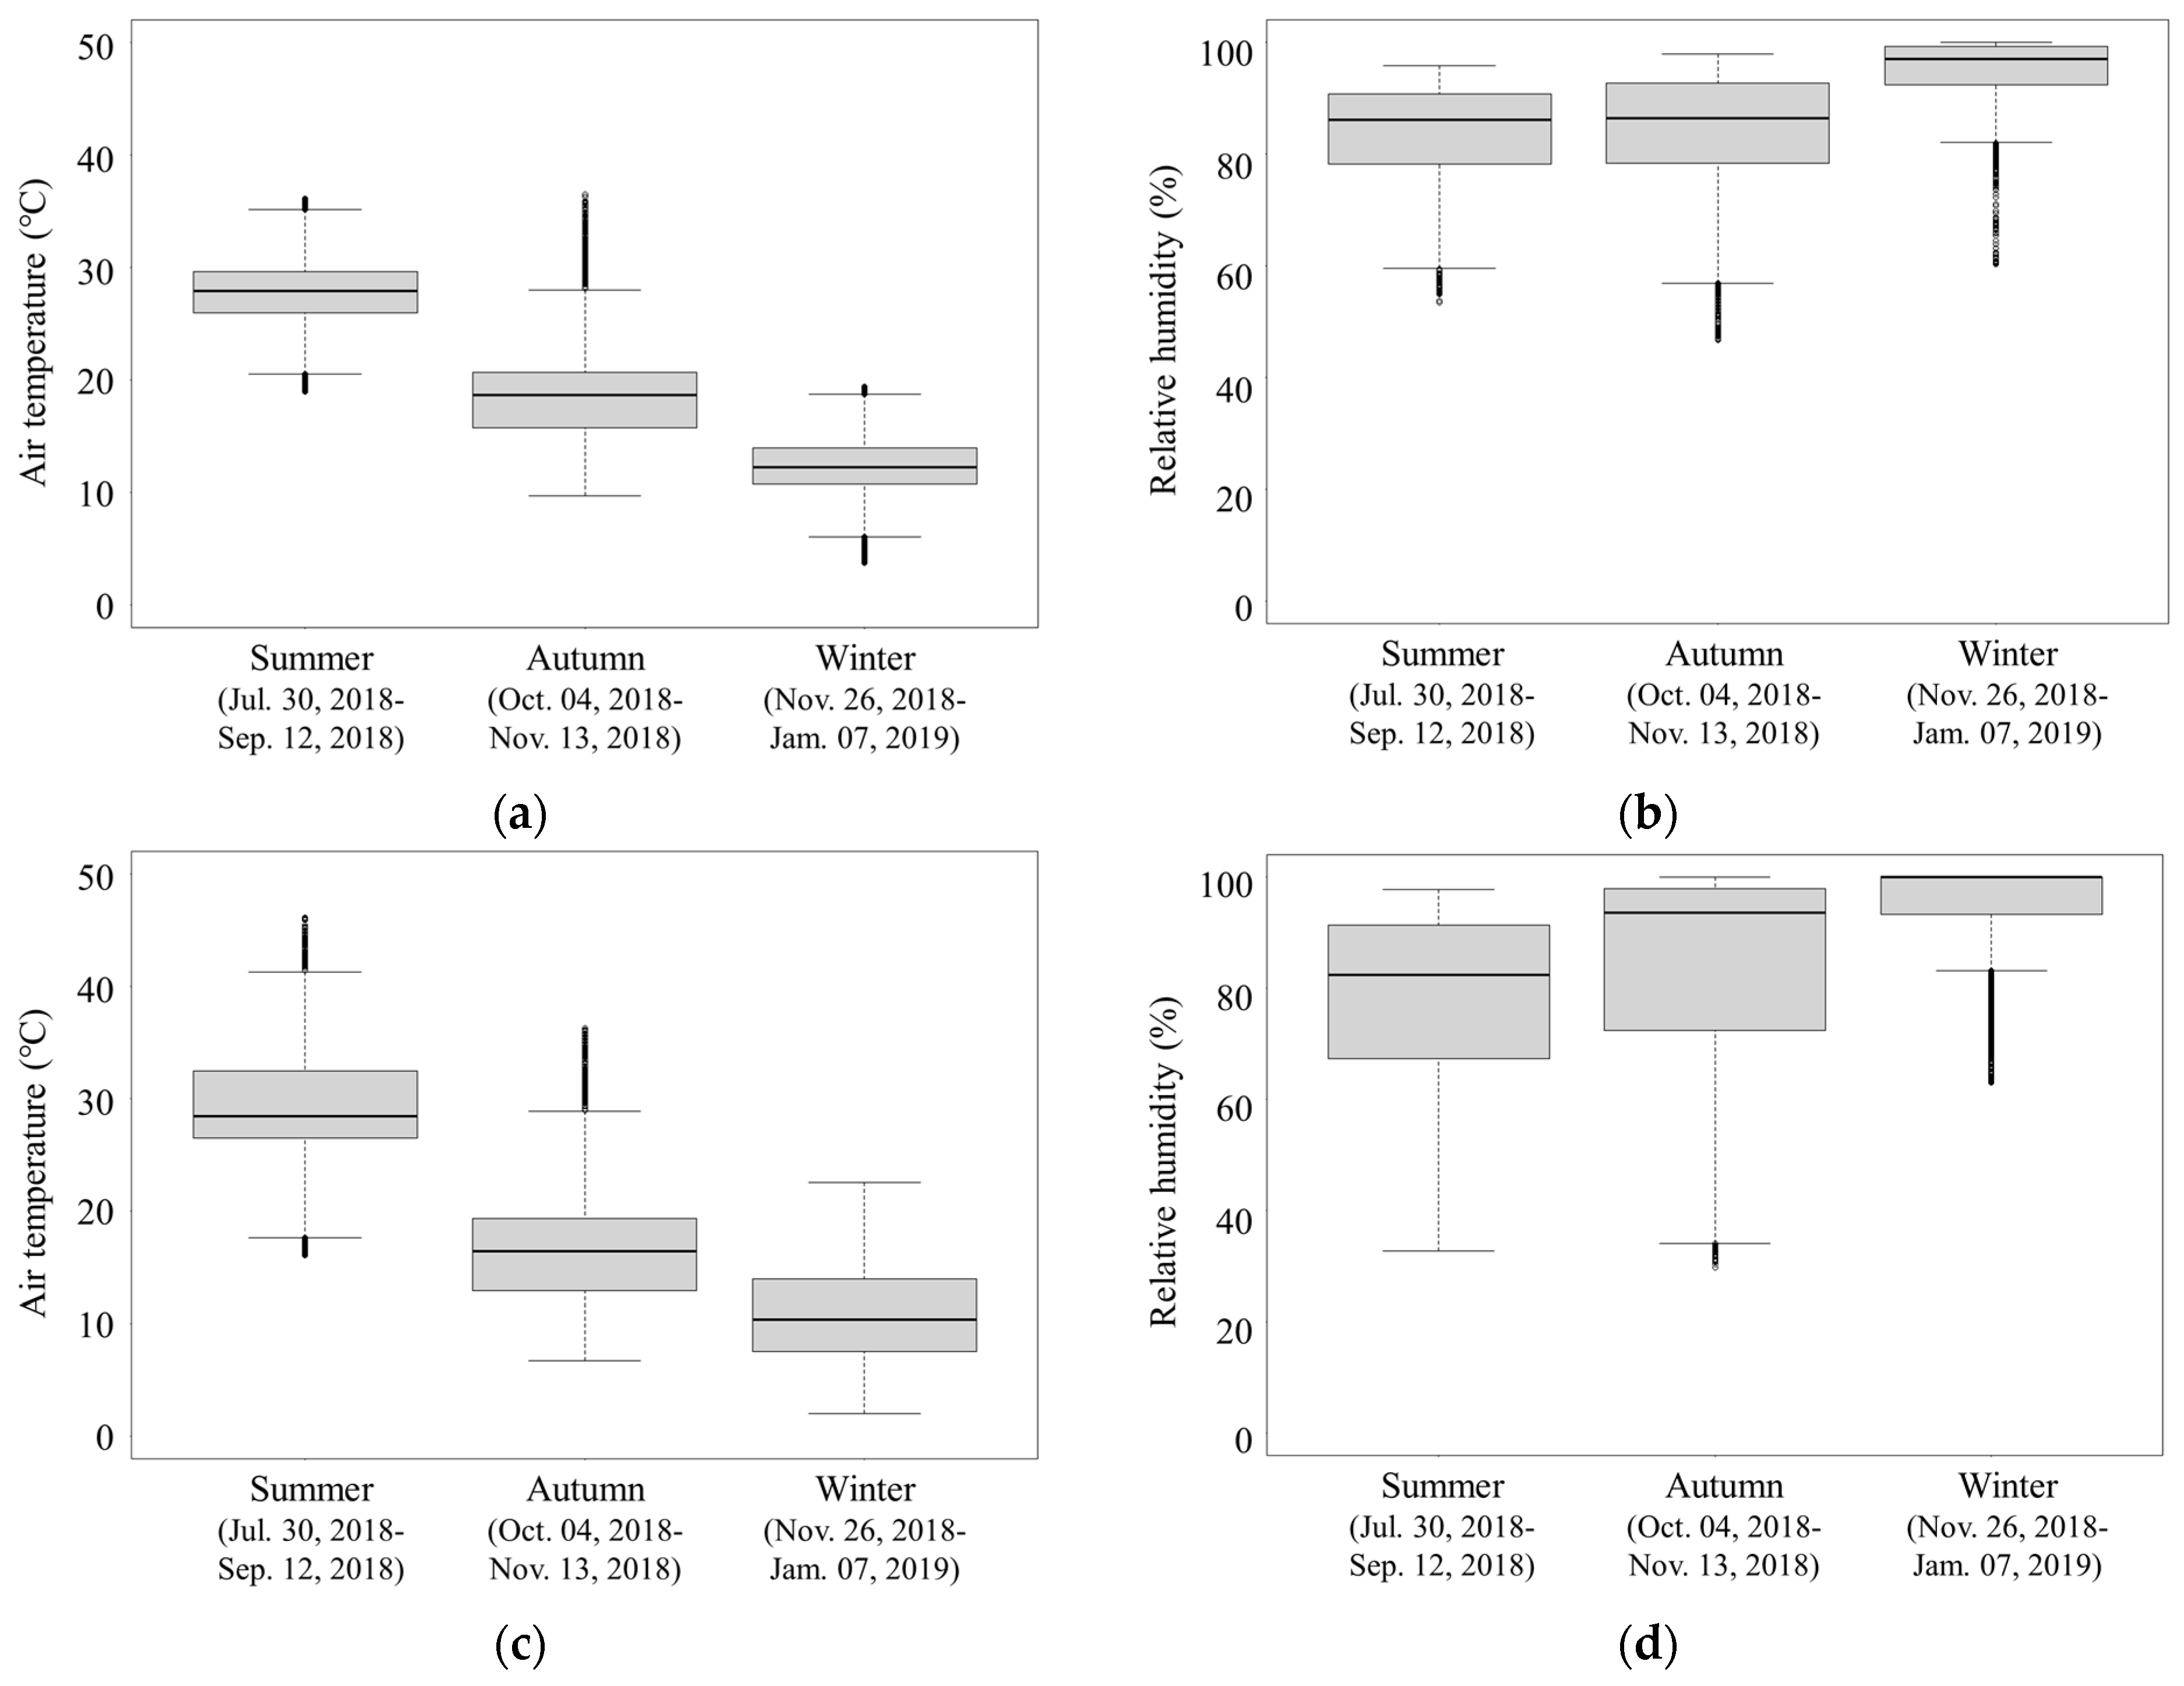
3.1. Analysis of Internal Environment of Experimental Duck Houses

To develop RNN models for predicting internal air temperature and relative humidity and to validate the RNN models, air temperature and relative humidity sensors were installed to monitor the internal air temperature and relative humidity of the duck houses. The box plots shown in Figure 5 describe the measured distributions of the air temperature and relative humidity data of the experimental duck house in different seasons. Descriptive statistical analysis was conducted to analyze the characteristics of the internal air temperature and relative humidity data according to seasons. Descriptive statistics of the internal air temperature and relative humidity of the mechanically and naturally ventilated duck houses during the monitoring periods are presented in Table 4.
Considering that the threshold temperature of high-temperature stress is 26.7 °C [25], ducks suffered high-temperature stress in the summer because the average air temperatures inside the mechanically and naturally ventilated duck houses were 27.4 and 29.3 °C, respectively. Even though the highest outside air temperature was 39.1 °C in summer, the highest air temperature of the mechanically and naturally ventilated duck house was as high as 35.2 °C and 46.1 °C. In summer, the air temperature inside the naturally ventilated duck house was higher than the air temperature inside the mechanically ventilated duck house. The naturally ventilated duck house was vulnerable to high-temperature stress in the summer.
In winter, the differences in air temperature between the inside and outside of the duck houses were relatively large because of the use of heaters and the minimal ventilation. In particular, the average air temperature inside the naturally ventilated duck house with relatively low thermal insulation was lower than that inside the mechanically ventilated duck house. Furthermore, the deviation between the lowest and highest air temperatures of the naturally ventilated duck was larger than that of the mechanically ventilated duck house. The exhaust fans were minimally operated to control the internal temperature environments and to reduce the energy costs of the mechanically ventilated duck house. The vent openings of the naturally ventilated duck house were minimally open. This is why the average relative humidity of the mechanically and naturally ventilated duck house was measured as 95.0% and 95.2%, respectively. In addition to the low temperature in winter, the high relative humidity could affect the disease management and productivity of ducks. The standard deviation of the air temperature during autumn was larger than that in summer and winter because the daily difference in the air temperature between day and night was high. Therefore, environmental control inside the duck houses was necessary although the average air temperature and relative humidity inside the duck house during autumn were more suitable.
The deviations of environments inside the naturally ventilated duck house were larger than those inside the mechanically ventilated duck house in all seasons. The deviation of the relative humidity inside the naturally ventilated duck house was measured to be relatively large because the vent openings were continuously open for natural ventilation in the summer and autumn. On the other hand, in the winter season, the deviation of the relative humidity inside the natural ventilated duck house was smaller than that in the summer and autumn because vent openings were rarely open.
Through the analysis of monitoring data, it was found that there were problems with the environmental management inside the duck houses according to seasons. In particular, the internal environments of the naturally ventilated duck house were worse than those of the mechanically ventilated duck house. Therefore, it was necessary to properly manage the internal environments of the duck houses. It was also essential to accurately predict the internal environments of the duck house for optimal management. Furthermore, differences in characteristics of the internal environments of the duck houses were distinct in each season. When monitoring data were trained without distinction of seasons, it was expected that seasonal differences would act as a factor reducing the accuracy of the RNN models. Therefore, when training the RNN models, the monitoring data were classified each season.

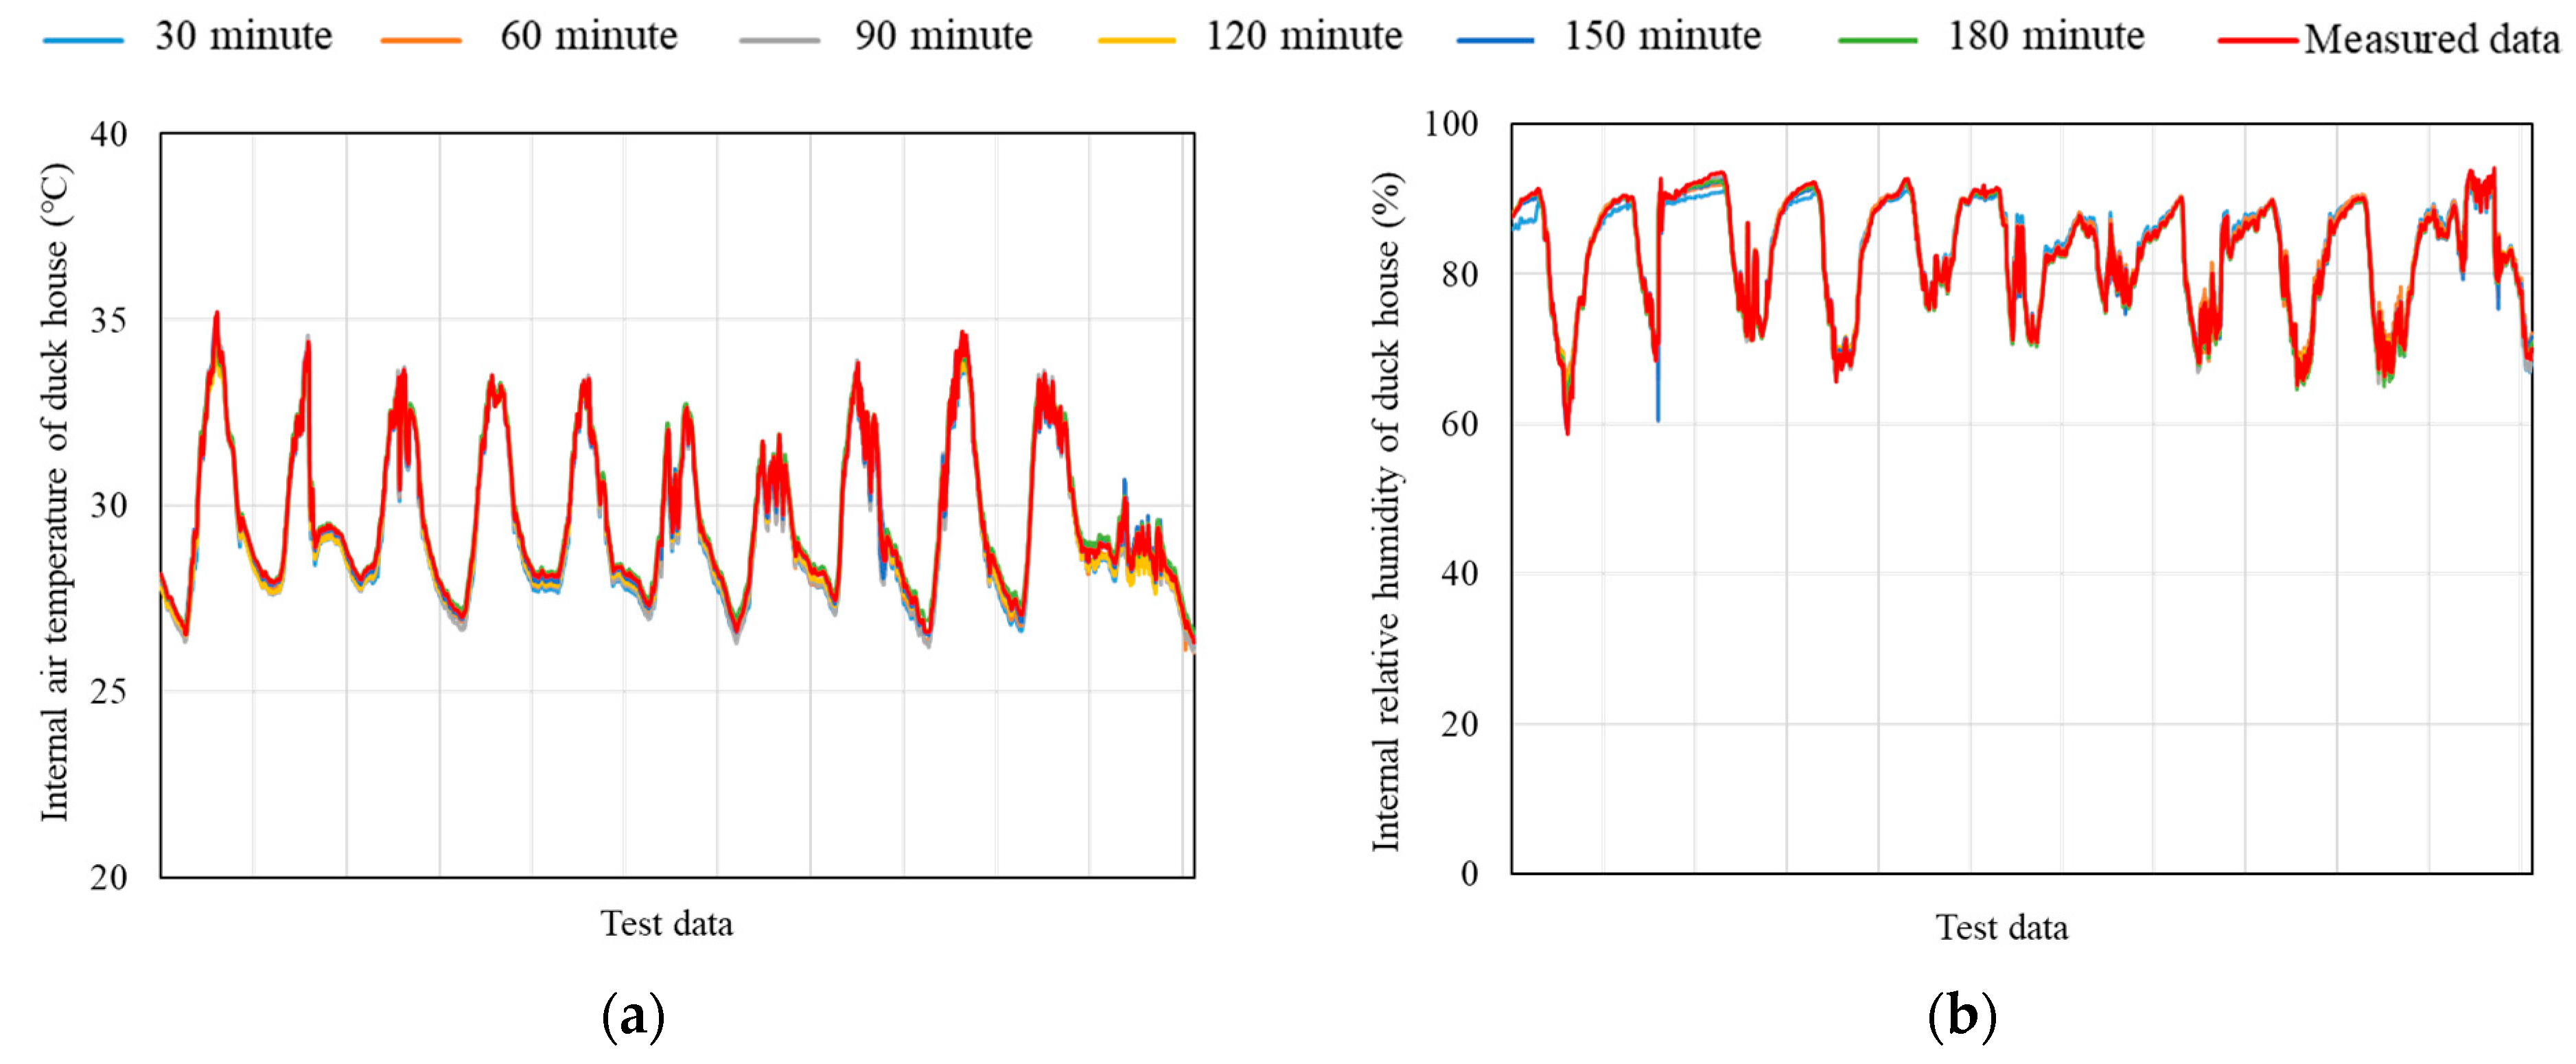
3.2. Validation of Duck House RNN Model

The developed RNN model of the duck houses was validated by comparing the predicted data of the air temperature and relative humidity using the RNN model with the data of the air temperature and relative humidity data measured during the field experiments. For developing the RNN model, the accuracy according to several sequence lengths was compared to determine the sequence length of the training data. The air temperature and relative humidity predicted by the developed RNN model and measured during the field experiments are shown in Figure 6 as a representative case. To quantitatively compare the accuracy of the RNN models, the statistical indices of R2, RMSE, and MAPE were calculated, and the results are shown in Table 5.
When the sequence length was 90 min, the R2, RMSE, and MAPE values for the internal air temperature data predicted by the RNN models and measured at the field experiments were 0.98, 0.35 °C, and 0.85%, respectively. When the sequence length was 120 min, the R2, RMSE, and MAPE values for the air temperature data predicted by the RNN model and measured at the field experiments were 0.99, 0.23 °C, and 0.45%, respectively. The sequence length should be at least 90 min to ensure that the deviation between internal air temperature data predicted by the RNN model and measured during field experiments was within 1%. On the other hand, when the sequence length was 120 min, the R2, RMSE, and MAPE values for the internal relative humidity data predicted by the RNN models and measured at the field experiments were 0.98, 1.11 °C, and 0.79%, respectively. The sequence length should be at least 120 min to ensure that the deviation between internal relative humidity data predicted by the RNN model and measured during field experiments was within 1%. When the sequence length was 120 min, both air temperature and relative humidity data could be predicted by the RNN model within 1% error compared to the measured data. When the sequence length was 150 and 180 min, the accuracy of the RNN model was not significantly improved compared to other sequence lengths, but it took a long time to develop the RNN model. Therefore, the optimal sequence length was selected at 120 min, and it was applied to the development of RNN models. The accuracy of the RNN model for both air temperature and relative humidity was high. It was deemed suitable to use the RNN model to predict the internal temperature and humidity of the duck houses from the external air temperature, relative humidity, solar radiation, wind speed, wind direction, ventilation rate, and weight of the duck.
Additionally, the RNN model was able to predict more accurately compared with the BES model developed in the previous study [11]. Since the BES model in the previous study and RNN model in this study were developed on the basis of the same measurement data, these two models could be directly compared. The BES model was developed using the equilibrium equation of physical factors, and it was possible to apply it in changing conditions. For example, the BES model could be applied to predict the air temperature and relative humidity of duck houses which were different from the size of the developed duck house model. Although the accuracy of the RNN model was high for the condition of the trained data, the accuracy of the RNN model was uncertain for untrained new data. For example, the accuracy of the RNN model was low when the RNN model was applied to predict the air temperature and relative humidity of duck houses which were different from the size of the developed duck house model. However, the RNN models were expected to be highly applicable to the field because the RNN models could be continuously improved by learning the monitoring data in the future.

3.3. Analysis of Accuracy of RNN Model according to Seasons and Applicability of Simplified RNN Model

Ventilation operation, evaporation of litters, condensation at the wall, etc. were different according to seasons. However, the RNN models were developed by dividing the training data according to seasons because it was difficult to quantitatively monitor the data as these factors constantly changed. The accuracy of the RNN models trained in sequential order is shown in Table 6 and Table 7. The accuracy of the RNN models trained in reverse order is shown in Table 8 and Table 9. It is generally difficult to quantitatively monitor solar radiation, ventilation rates, and wind environments (wind speed, wind direction) because a weather station is generally not installed at duck farms. Considering the applicability of the RNN models to the field, the simplified RNN models were developed by learning only the data of the external air temperature, external relative humidity, and duck weight, which are relatively easy to acquire at duck farms. The accuracy of simplified RNN models was analyzed according to the type of duck house and seasons.
In this study, comparing the accuracy of the RNN models trained in sequential and reverse order for learning data showed no significant difference in accuracy. Therefore, the RNN models trained in reverse order, which are known to have higher accuracy, were analyzed as the representative cases following the results of previous studies [47,48,49].
The RNN model of the mechanically ventilated duck house in summer predicted the air temperature and relative humidity with errors of 0.412% and 0.731%, respectively. In autumn, the RNN model of the mechanically ventilated duck house predicted the air temperature and relative humidity with errors of 0.526% and 0.401%, respectively. In winter, the RNN model of the mechanically ventilated duck house predicted the air temperature and relative humidity with errors of 2.317% and 0.332%, respectively. The RNN model of the mechanically ventilated duck house was able to accurately predict the internal air temperature and relative humidity with an accuracy of 0.401–0.731% in all seasons. Since the internal environments of the mechanically ventilated duck houses were controlled through the operation of exhaust fans, there were few abnormal situations in the duck house. For this reason, the accuracy of the RNN model of the mechanically ventilated duck house was high.
The RNN model of the naturally ventilated duck house in summer predicted the air temperature and relative humidity with errors of 0.813% and 1.254%, respectively. In autumn, the RNN model of the naturally ventilated duck house predicted the air temperature and relative humidity with errors of 1.891% and 1.048%, respectively. In winter, the RNN model of the naturally ventilated duck house predicted the air temperature and relative humidity with errors of 1.187% and 0.490%, respectively. The RNN model of the mechanically ventilated duck house was able to accurately predict the internal air temperature and relative humidity with an accuracy of 0.490–1.891% in all seasons.
The average MAPE calculated using the data of air temperature and relative humidity, which were predicted the RNN models of the mechanically ventilated duck house, was 0.99% and 0.51%, respectively. The average MAPE calculated using the data of air temperature and relative humidity, which were predicted the RNN models of the naturally ventilated duck house, was 1.29% and 1.11%, respectively. The accuracy of the RNN model of the naturally ventilated duck house was lower than that of the mechanically ventilated duck house. Because the internal environments of the naturally ventilated duck houses were operated through natural ventilation, there were several uncertainties such as nonuniformity of the internal environments.
As a result of comparing the accuracy of the RNN model trained in reverse order according to seasons, the RNN models of both the mechanically and the naturally ventilated duck houses predicted the internal air temperature and relative humidity with errors of less than 1% in the summer. In summer, the accuracy of the RNN models was the highest compared with other seasons. In summer, the exhaust fans were maximally operated in the mechanically ventilated duck house, and the vent openings of the naturally ventilated duck house were maximally open. Because the internal air temperature and relative humidity of the duck houses were similar to the external air temperature and relative humidity, the internal air temperature and relative humidity could be accurately predicted through learning the external air temperature and relative humidity data. In the case of the naturally ventilated duck house, which is sensitively affected by the external environment, the accuracy of the RNN models was lower than for other seasons in the autumn when the external air temperature and relative humidity environment changed significantly. In the case of the mechanically ventilated duck house, the accuracy of the RNN model in winter was lower than that in other seasons.
In the case of the simplified RNN model for applicability to the field, the accuracy of the simplified RNN models for both the mechanically and the naturally ventilated duck houses was similar to the accuracy of the basic RNN models. This is because the time factor included the changes over time of solar radiation, ventilation rate, ventilation configuration, etc. Therefore, the internal air temperature and relative humidity of the duck houses could be predicted by obtaining the data of external air temperature and relative humidity from installed sensors and the Meteorological Agency. In addition, the internal environments of duck houses could be more appropriately managed using these simplified RNN models.
However, the simplified RNN models could not consider the changes in solar radiation, ventilation, wind environment, etc. in the future, because the data of solar radiation, ventilation, and wind environment, which are the major factors affecting the internal air temperature and relative humidity of the duck houses, were not considered when learning these data for the development of the simplified RNN models. On the contrary, the basic RNN models would be more accurate than the simplified RNN models for the changes in solar radiation, ventilation, and wind environments in the future because these were considered during learning for the development of the basic RNN models.

4. Conclusions

RNN models were developed for predicting the internal air temperature and relative humidity of duck houses in this study according to the type of duck house, seasons, and environmental variables. The environmental data inside and outside the duck houses were monitored to analyze the seasonal problems of the experimental duck houses, to develop RNN models for predicting the internal environments of duck houses, and to validate the developed RNN models. The data of the air temperature, relative humidity, solar radiation, wind direction, wind speed, ventilation rate of the mechanically ventilated duck house, etc. were acquired through field experiments.
Descriptive statistical analysis was conducted to analyze the characteristics of the internal air temperature and relative humidity data according to seasons. Ducks suffered high-temperature stress because the average air temperatures inside the mechanically and naturally ventilated duck houses during summer were 27.4 and 29.3 °C, respectively. The naturally ventilated duck house was particularly vulnerable to high-temperature stress in the summer. The standard deviation of the air temperature and relative humidity during autumn was large because the daily difference in the air temperature between day and night was high. The high relative humidity of the mechanically and naturally ventilated duck houses in winter could affect the disease management and productivity of ducks. Therefore, it is necessary to properly manage the internal environments of the duck houses. It is also essential to accurately predict the internal environments of the duck house for optimal management.
The developed RNN model of the duck houses was validated by comparing the predicted results for the air temperature and relative humidity obtained using the RNN model with the air temperature and relative humidity data measured during the field experiments. The optimal sequence length was selected as 120 min. As a result of the validation, both air temperature and relative humidity data by the RNN model could be predicted within 1% error compared to the measured data. The RNN model of the mechanically ventilated duck house was able to accurately predict the internal air temperature and relative humidity with an accuracy of 0.401–0.731% in all seasons. The RNN model of the naturally ventilated duck house was able to accurately predict the internal air temperature and relative humidity with an accuracy of 0.490–1.891% in all seasons. In the case of the simplified RNN model for applicability to the field, accuracies of the RNN models were similar to the accuracies of the basic RNN models. Therefore, the internal air temperature and relative humidity of the duck houses could be predicted by obtaining the data of external air temperature and relative humidity from sensor installation and the Meteorological Agency. In addition, the internal environments of duck houses could be more appropriately managed using these RNN models.
The RNN models developed in this study have the advantage that they can be continuously improved by learning monitoring data in the future. The simplified RNN models with high accuracy are expected to be highly applicable to the field. They can be applied to control the internal environment of livestock farms and identify the occurrence of high-temperature stress for livestock. Furthermore, predicting the internal environments of livestock houses is important because the poor internal environment of livestock houses cause sensor corrosion or malfunction. In the future, for the convergence of ICTs and application of smart farms in duck houses, the RNN models of duck houses developed in this study can be applied to predict and control the internal environments of duck houses using the model predictive control (MPC) technique.

Author Contributions

Conceptualization, S.-y.L. and I.-b.L.; data curation, S.-y.L.; methodology, S.-y.L. and U.-h.Y.; software, S.-y.L.; supervision, I.-b.L.; visualization, S.-y.L. and J.-g.K.; writing—original draft, S.-y.L.; writing—review and editing, I.-b.L., U.-h.Y., J.-g.K. and R.-w.K. All authors have read and agreed to the published version of the manuscript.

Funding

This work was supported by the ICT R&D program of MSIT/IITP (IITP-2021-0-01816, A Research on Core Technology of Autonomous Twins for Metaverse).

Institutional Review Board Statement

Not applicable.

Informed Consent Statement

Not applicable.

Data Availability Statement

All data will be made available on request to the correspondent author’s email with appropriate justification.

Acknowledgments

This work was supported by the ICT R&D program of MSIT/IITP (IITP-2021-0-01816, A Research on Core Technology of Autonomous Twins for Metaverse).

Conflicts of Interest

The authors declare no conflict of interest.

References

  1. Ministry of Agriculture Food and Rural Affairs. 2020. Available online: https://www.mafra.go.kr (accessed on 1 February 2022).
  2. Rural Development Administration. Development of Next-Generation Korean Smart Farm; Rural Development Administration: Jeon-ju, Korean, 2019.
  3. Statistics Korea. 2015. Available online: www.kostat.go.kr (accessed on 1 February 2022).
  4. National Institute of Animal Science of Korea. Investigation and Improvement of Duck Houses; National Institute of Animal Science of Korea: Jeon-ju, Korean, 2014.
  5. Costantino, A.; Fabrizio, E.; Ghiggini, A.; Bariani, M. Climate control in broiler houses: A thermal model for the calculation of the energy use and indoor environmental conditions. Energy Build. 2018, 169, 110–126. [Google Scholar] [CrossRef]
  6. Fabrizio, E.; Costantino, A.; Comba, L. A calculation model for the energy performance assessment of fattening pig houses. In Proceedings of the 4th International Conference on Building Energy, Environment, Melbourne, Australia, 5–9 February 2018; pp. 769–774. [Google Scholar]
  7. Ha, T.; Kwon, K.-s.; Hong, S.-W.; Choi, H.-c.; Lee, J.-y.; Lee, D.-h.; Woo, S.; Yang, K.-y.; Kim, R.-w.; Yeo, U.-h. Estimation of THI index to evaluate thermal stress of animal-occupied zone in a broiler house using BES method. J. Korean Soc. Agric. Eng. 2018, 60, 75–84. [Google Scholar]
  8. Ha, T.; Kwon, K.-s.; Lee, I.-b.; Kim, R.-w.; Yeo, U.-h.; Lee, S.; Choi, H.-c.; Kim, J.-b.; Lee, J.-y.; Jeon, J.-h. Estimation of THI Index to Evaluate Thermal Stress of Piglets in Summer Season. J. Korean Soc. Agric. Eng. 2018, 60, 113–122. [Google Scholar]
  9. Kim, R.-w.; Kim, J.-g.; Lee, I.-b.; Yeo, U.-h.; Lee, S.-y. Development of a VR simulator for educating CFD-computed internal environment of piglet house. Biosyst. Eng. 2019, 188, 243–264. [Google Scholar] [CrossRef]
  10. Kwon, K.-s.; Ha, T.; Choi, H.-c.; Kim, J.-b.; Lee, J.-y.; Jeon, J.-h.; Yang, K.-y.; Kim, R.-w.; Yeo, U.-h.; Lee, S.-y. Evaluation of thermal stress of poultry according to stocking densities using mumerical BES model. J. Korea Acad.-Ind. Coop. Soc. 2019, 20, 456–463. [Google Scholar]
  11. Lee, S.-Y.; Lee, I.-B.; Kim, R.-W.; Yeo, U.-H.; Kim, J.-G.; Kwon, K.-S. Dynamic energy modelling for analysis of the thermal and hygroscopic environment in a mechanically ventilated duck house. Biosyst. Eng. 2020, 200, 431–449. [Google Scholar] [CrossRef]
  12. Rojano, F.; Bournet, P.-E.; Hassouna, M.; Robin, P.; Kacira, M.; Choi, C.Y. Modelling heat and mass transfer of a broiler house using computational fluid dynamics. Biosyst. Eng. 2015, 136, 25–38. [Google Scholar] [CrossRef]
  13. Schauberger, G.; Piringer, M.; Petz, E. Steady-state balance model to calculate the indoor climate of livestock buildings, demonstrated for finishing pigs. Int. J. Biometeorol. 2000, 43, 154–162. [Google Scholar] [CrossRef]
  14. Tong, X.; Hong, S.-W.; Zhao, L. CFD modelling of airflow pattern and thermal environment in a commercial manure-belt layer house with tunnel ventilation. Biosyst. Eng. 2019, 178, 275–293. [Google Scholar] [CrossRef]
  15. Yeo, U.-H.; Lee, I.-B.; Kim, R.-W.; Lee, S.-Y.; Kim, J.-G. Computational fluid dynamics evaluation of pig house ventilation systems for improving the internal rearing environment. Biosyst. Eng. 2019, 186, 259–278. [Google Scholar] [CrossRef]
  16. Mnih, V.; Kavukcuoglu, K.; Silver, D.; Rusu, A.A.; Veness, J.; Bellemare, M.G.; Graves, A.; Riedmiller, M.; Fidjeland, A.K.; Ostrovski, G.; et al. Human-level control through deep reinforcement learning. Nature 2015, 518, 529–533. [Google Scholar] [CrossRef] [PubMed]
  17. Silver, D.; Huang, A.; Maddison, C.J.; Guez, A.; Sifre, L.; Van Den Driessche, G.; Schrittwieser, J.; Antonoglou, I.; Panneershelvam, V.; Lanctot, M.; et al. Mastering the game of Go with deep neural networks and tree search. Nature 2016, 529, 484–489. [Google Scholar] [CrossRef] [PubMed]
  18. Demmers, T.G.; Cao, Y.; Gauss, S.; Lowe, J.C.; Parsons, D.J.; Wathes, C.M. Neural predictive control of broiler chicken and pig growth. Biosyst. Eng. 2018, 173, 134–142. [Google Scholar] [CrossRef] [Green Version]
  19. Li, H.; Cryer, S.; Acharya, L.; Raymond, J. Video and image classification using atomisation spray image patterns and deep learning. Biosyst. Eng. 2020, 200, 13–22. [Google Scholar] [CrossRef]
  20. Liu, D.; Oczak, M.; Maschat, K.; Baumgartner, J.; Pletzer, B.; He, D.; Norton, T. A computer vision-based method for spatial-temporal action recognition of tail-biting behaviour in group-housed pigs. Biosyst. Eng. 2020, 195, 27–41. [Google Scholar] [CrossRef]
  21. Moon, T.; Choi, H.Y.; Jung, D.H.; Chang, S.H.; Son, J.E. Prediction of CO2 Concentration via Long Short-Term Memory Using Environmental Factors in Greenhouses. Hortic. Sci. Technol. 2020, 38, 201–209. [Google Scholar]
  22. Wang, L.; Zhang, T.; Wang, X.; Jin, X.; Xu, J.; Yu, J.; Zhang, H.; Zhao, Z. An approach of improved Multivariate Timing-Random Deep Belief Net modelling for algal bloom prediction. Biosyst. Eng. 2019, 177, 130–138. [Google Scholar] [CrossRef]
  23. Hu, Q.; Zhang, R.; Zhou, Y. Transfer learning for short-term wind speed prediction with deep neural networks. Renew. Energy 2016, 85, 83–95. [Google Scholar] [CrossRef]
  24. Liu, Y.; Racah, E.; Correa, J.; Khosrowshahi, A.; Lavers, D.; Kunkel, K.; Wehner, M.; Collins, W. Application of Deep Convolutional Neural Networks for Detecting Extreme Weather in Climate Datasets. arXiv 2016, arXiv:1605.01156. Available online: https://arxiv.org/abs/1605.01156 (accessed on 1 February 2022).
  25. Rural Development Administration. Duck Agricultural Technology Guide 186; Rural Development Administration: Jeon-ju, Korea, 2014.
  26. Peng, Y.; Kondo, N.; Fujiura, T.; Suzuki, T.; Wulandari; Yoshioka, H.; Itoyama, E. Classification of multiple cattle behavior patterns using a recurrent neural network with long short-term memory and inertial measurement units. Comput. Electron. Agric. 2019, 157, 247–253. [Google Scholar] [CrossRef]
  27. Wu, D.; Wu, Q.; Yin, X.; Jiang, B.; Wang, H.; He, D.; Song, H. Lameness detection of dairy cows based on the YOLOv3 deep learning algorithm and a relative step size characteristic vector. Biosyst. Eng. 2020, 189, 150–163. [Google Scholar] [CrossRef]
  28. Zhao, K.; Jin, X.; Ji, J.; Wang, J.; Ma, H.; Zhu, X. Individual identification of Holstein dairy cows based on detecting and matching feature points in body images. Biosyst. Eng. 2019, 181, 128–139. [Google Scholar] [CrossRef]
  29. Borchers, M.; Chang, Y.; Proudfoot, K.; Wadsworth, B.; Stone, A.; Bewley, J. Machine-learning-based calving prediction from activity, lying, and ruminating behaviors in dairy cattle. J. Dairy Sci. 2017, 100, 5664–5674. [Google Scholar] [CrossRef] [PubMed]
  30. Keceli, A.S.; Catal, C.; Kaya, A.; Tekinerdogan, B. Development of a recurrent neural networks-based calving prediction model using activity and behavioral data. Comput. Electron. Agric. 2020, 170, 105285. [Google Scholar] [CrossRef]
  31. Peng, Y.; Kondo, N.; Fujiura, T.; Suzuki, T.; Ouma, S.; Wulandari; Yoshioka, H.; Itoyama, E. Dam behavior patterns in Japanese black beef cattle prior to calving: Automated detection using LSTM-RNN. Comput. Electron. Agric. 2020, 169, 105178. [Google Scholar] [CrossRef]
  32. Milone, D.H.; Galli, J.R.; Cangiano, C.A.; Rufiner, H.L.; Laca, E.A. Automatic recognition of ingestive sounds of cattle based on hidden Markov models. Comput. Electron. Agric. 2012, 87, 51–55. [Google Scholar] [CrossRef]
  33. Hochreiter, S.; Schmidhuber, J. Long short-term memory. Neural Comput. 1997, 9, 1735–1780. [Google Scholar] [CrossRef]
  34. Khaki, S.; Wang, L.; Archontoulis, S.V. A CNN-RNN framework for crop yield prediction. Front. Plant Sci. 2020, 10, 1750. [Google Scholar] [CrossRef]
  35. Pham, V.; Bluche, T.; Kermorvant, C.; Louradour, J. Dropout improves recurrent neural networks for handwriting recognition. In Proceedings of the 2014 14th International Conference on Frontiers in Handwriting Recognition, Crete, Greece, 1–4 September 2014; pp. 285–290. [Google Scholar]
  36. Sherstinsky, A. Fundamentals of recurrent neural network (RNN) and long short-term memory (LSTM) network. Phys. D Nonlinear Phenom. 2020, 404, 132306. [Google Scholar] [CrossRef] [Green Version]
  37. Cho, K.; Van Merriënboer, B.; Gulcehre, C.; Bahdanau, D.; Bougares, F.; Schwenk, H.; Bengio, Y. Learning Phrase Representations Using RNN Encoder-Decoder for Statistical Machine Translation. arXiv 2014, arXiv:1406.1078. Available online: https://arxiv.org/abs/1406.1078 (accessed on 1 February 2022).
  38. Chung, J.; Gulcehre, C.; Cho, K.; Bengio, Y. Empirical Evaluation of Gated Recurrent Neural Networks on Sequence Modeling. arXiv 2014, arXiv:1412.3555. Available online: https://arxiv.org/abs/1412.3555 (accessed on 1 February 2022).
  39. Moon, T.; Ahn, T.I.; Son, J.E. Forecasting root-zone electrical conductivity of nutrient solutions in closed-loop soilless cultures via a recurrent neural network using environmental and cultivation information. Front. Plant Sci. 2018, 9, 859. [Google Scholar] [CrossRef] [PubMed]
  40. Kaewtapee, C.; Prahkarnkaeo, K.; Bunchasak, C. Effect of sex on growth curve, production performance and carcass quality of Cherry Valley ducks. J. Appl. Anim. Res. 2018, 11, 9–18. [Google Scholar]
  41. Kingma, D.P.; Ba, J. Adam: A Method for Stochastic Optimization. arXiv 2014, arXiv:1412.6980. Available online: https://arxiv.org/abs/1412.6980 (accessed on 1 February 2022).
  42. Esfe, M.H.; Ahangar, M.R.H.; Rejvani, M.; Toghraie, D.; Hajmohammad, M.H. Designing an artificial neural network to predict dynamic viscosity of aqueous nanofluid of TiO2 using experimental data. Int. Commun. Heat Mass Transf. 2016, 75, 192–196. [Google Scholar] [CrossRef]
  43. Rumelhart, D.E.; Hinton, G.E.; Williams, R.J. Learning representations by back-propagating errors. Nature 1986, 323, 533–536. [Google Scholar] [CrossRef]
  44. Wang, F.; Xiang, X.; Liu, C.; Tran, T.D.; Reiter, A.; Hager, G.D.; Quon, H.; Cheng, J.; Yuille, A.L. Transferring Face Verification Nets to Pain and Expression Regression. arXiv 2017, arXiv:1702.06925. Available online: https://arxiv.org/abs/1702.06925 (accessed on 1 February 2022).
  45. Gharghory, S.M. Deep Network based on Long Short-Term Memory for Time Series Prediction of Microclimate Data inside the Greenhouse. Int. J. Comput. Intell. Appl. 2020, 19, 2050013. [Google Scholar] [CrossRef]
  46. Liu, H.; Yang, Y.; Wan, X.; Cui, J.; Zhang, F.; Cai, T. Prediction of soil moisture and temperature based on deep learning. In Proceedings of the 2021 IEEE International Conference on Artificial Intelligence and Computer Applications (ICAICA), Dalian, China, 28–30 June 2021; pp. 46–51. [Google Scholar]
  47. Srivastava, N.; Mansimov, E.; Salakhudinov, R. Unsupervised learning of video representations using LSTMs. In Proceedings of the International Conference on Machine Learning, Lille, France, 6–11 July 2015; pp. 843–852. [Google Scholar]
  48. Sutskever, I.; Vinyals, O.; Le, Q.V. Sequence to sequence learning with neural networks. In Proceedings of the Advances in Neural Information Processing Systems, Montreal, QC, Canada, 8–13 December 2014; pp. 3104–3112. [Google Scholar]
  49. Vinyals, O.; Bengio, S.; Kudlur, M. Order Matters: Sequence to Sequence for Sets. arXiv 2015, arXiv:1511.06391. Available online: https://arxiv.org/abs/1511.06391 (accessed on 1 February 2022).
Figure 1. Flow chart of the experimental procedure of this study.
Agriculture 12 00318 g001
Figure 2. Experimental duck houses located at Sinbuk-myeon, Yeongam-gun, Jeollanam-do Province (126°38′ E, 34°53′ N). (a) Schematic information of mechanically ventilated duck house; (b) schematic information of naturally ventilated duck house; (c) inside of mechanically ventilated duck house; (d) inside of naturally ventilated duck house.
Agriculture 12 00318 g002
Figure 3. Basic architecture of RNN and LSTM models [33]: (a) RNN model; (b) LSTM model.
Agriculture 12 00318 g003
Figure 4. Sensor locations for air temperature and relative humidity in mechanically and naturally ventilated duck houses. (a) Schematic information of mechanically ventilated duck house; (b) schematic information of naturally ventilated duck house. Agriculture 12 00318 i001 Air temperature and relative humidity sensors.
Agriculture 12 00318 g004
Figure 5. Box plots of the measured air temperature and relative humidity inside the duck houses according to seasons. (a) Air temperature inside the mechanically ventilated duck house; (b) relative humidity inside the mechanically ventilated duck house; (c) air temperature inside the naturally ventilated duck house; (d) relative humidity inside the naturally ventilated duck house.
Agriculture 12 00318 g005
Figure 6. Test data measured during field experiment and predicted by RNN model according to sequence lengths (mechanically ventilated duck house, summer). (a) Air temperature inside the mechanically ventilated duck house; (b) relative humidity inside the mechanically ventilated duck house.
Agriculture 12 00318 g006
Table 1. Development plan for smart farms in South Korea [2].
Contents1st Generation2nd Generation3rd Generation
Realization period202020252030
Main objectiveTo improve convenienceTo improve productivityTo improve sustainability
Main functionRemote environmental
control
Precision environmental
control
Automatic management
of all related production
Main techniqueCommunication techniqueBig data processing,
artificial intelligence
Big data processing, artificial intelligence, robotics
Decision makingHumanHuman and computerComputer
Table 2. Date according to growing period during the experimental period.
Monitoring PeriodSeasonsGrowing DaysStarting Date of MonitoringDate of ShipmentTotal DatasetTraining DatasetTest Dataset
1st growing periodSummer45 days6 August 201812 September 201812,96090723888
2nd growing periodAutumn41 days11 October 201813 November 201811,80882663542
3rd growing periodWinter30 days9 December 20187 January 2019864060482592
Table 3. Experimental conditions of learning data for developing RNN model.
ConditionsConditionsNumber of Cases
Learning data
(Independent variables)
Mechanically ventilated duck houseBasic model(1) External air temperature, external relative humidity, solar radiation, ventilation rates of duck house, and duck weight4
Simplified model(2) External air temperature, external relative humidity, and duck weight
Naturally ventilated duck houseBasic model(3) External air temperature, external relative humidity, solar radiation, wind speed, wind direction, and duck weight
Simplified model(4) External air temperature, external relative humidity, and duck weight
Dependent variableInternal air temperature and internal relative humidity2
SeasonsSummer (30 July 2018–12 September 2018),
autumn (4 October 2018–13 November 2018), and
winter (26 November 2018–7 January 2019)
3
Order of sequenceSequential order and reverse order2
Total-48
Table 4. Date information according to growing period during experimental period.
Air temperature according to seasonsAverage
air remperature (°C)
Standard
deviation (°C)
Lowest air
temperature (°C)
Highest air
temperature (°C)
SummerMV27.42.919.035.2
NV29.34.716.046.1
Outside26.64.713.239.1
AutumnMV18.44.19.736.5
NV16.54.66.736.2
Outside12.54.91.227.1
WinterMV12.32.63.719.4
NV10.94.32.022.5
Outside2.95.9−10.719.6
Relative humidity according to seasonsAverage relative
humidity (%)
Standard
deviation (%)
Lowest relative
humidity (%)
Highest relative
humidity (%)
SummerMV84.08.553.495.8
NV78.414.732.797.7
Outside80.514.240.7100.0
AutumnMV83.811.446.898.0
NV83.819.229.6100.0
Outside81.217.928.7100.0
WinterMV95.05.760.3100.0
NV95.28.762.9100.0
Outside75.217.118.4100.0
Table 5. Validation of RNN model according to sequence lengths (mechanically ventilated duck house, summer).
Internal air temperatureSequence length for LSTM modelBES model [11]
30 min60 min90 min120 min150 min180 min
R20.960.960.980.990.990.990.95
RMSE (°C)0.610.510.350.230.250.220.70
MAPE (%)1.501.220.850.450.470.441.71
Internal relative humiditySequence length for LSTM modelBES model [11]
30 min60 min90 min120 min150 min180 min
R20.910.950.960.980.980.980.92
RMSE (°C)3.162.351.621.111.081.094.61
MAPE (%)3.122.161.570.790.780.794.33
Table 6. Accuracy of RNN model of mechanically ventilated duck house according to seasons and variables (sequential order).
SummerBasic modelSimplified model
Internal
air Temperature
Internal
relative Humidity
Internal
air Temperature
Internal
relative Humidity
R20.9950.9890.9950.990
RMSE (°C, %)0.1820.9470.1780.867
MAPE (%)0.4240.6520.4610.618
AutumnBasic modelSimplified model
Internal
air temperature
Internal
relative humidity
Internal
air temperature
Internal
relative humidity
R20.9970.9930.9980.990
RMSE (°C, %)0.2990.4530.1500.550
MAPE (%)1.3150.3370.6790.361
WinterBasic modelSimplified model
Internal
air temperature
Internal
relative humidity
Internal
air temperature
Internal
relative humidity
R20.9930.9950.9970.995
RMSE (°C, %)0.1730.3580.0950.277
MAPE (%)0.9860.2960.5050.193
Table 7. Accuracy of RNN model of naturally ventilated duck house according to seasons and variables (sequential order).
SummerBasic modelSimplified model
Internal
air Temperature
Internal
relative Humidity
Internal
air Temperature
Internal
relative Humidity
R20.9810.9860.9780.983
RMSE (°C, %)0.9391.9760.6801.931
MAPE (%)2.8541.9881.5511.877
AutumnBasic modelSimplified model
Internal
air temperature
Internal
relative humidity
Internal
air temperature
Internal
relative humidity
R20.9950.9970.9940.996
RMSE (°C, %)0.2631.2000.2601.003
MAPE (%)1.2951.0601.1400.838
WinterBasic modelSimplified model
Internal
air temperature
Internal
relative humidity
Internal
air temperature
Internal
relative humidity
R20.9930.9950.9970.976
RMSE (°C, %)0.3060.6190.2091.492
MAPE (%)2.7100.4022.1140.803
Table 8. Accuracy of RNN model of mechanically ventilated duck house according to seasons and variables (reverse order).
SummerBasic modelSimplified model
Internal
air Temperature
Internal
relative Humidity
Internal
air Temperature
Internal
relative Humidity
R20.9880.9800.9870.981
RMSE (°C, %)0.2211.0650.2241.070
MAPE (%)0.4120.7310.3900.761
AutumnBasic modelSimplified model
Internal
air temperature
Internal
relative humidity
Internal
air temperature
Internal
relative humidity
R20.9980.9980.9990.998
RMSE (°C, %)0.1370.4990.1210.482
MAPE (%)0.5260.4010.6430.406
WinterBasic modelSimplified model
Internal
air temperature
Internal
relative humidity
Internal
air temperature
Internal
relative humidity
R20.9830.9910.9850.991
RMSE (°C, %)0.4870.6470.4030.728
MAPE (%)2.3170.3321.6540.463
Table 9. Accuracy of RNN model of naturally ventilated duck house according to seasons and variables (reverse order).
SummerBasic modelSimplified model
Internal
air Temperature
Internal
relative Humidity
Internal
air Temperature
Internal
relative Humidity
R20.9940.9960.9950.995
RMSE (°C, %)0.4141.1030.3901.313
MAPE (%)0.8131.2540.8911.512
AutumnBasic modelSimplified model
Internal
air temperature
Internal
relative humidity
Internal
air temperature
Internal
relative humidity
R20.9960.9980.9970.996
RMSE (°C, %)0.3850.9140.3521.496
MAPE (%)1.8911.0481.7011.819
WinterBasic modelSimplified model
Internal
air temperature
Internal
relative humidity
Internal
air temperature
Internal
relative humidity
R20.9970.9840.9970.989
RMSE (°C, %)0.2290.8660.2390.744
MAPE (%)1.1870.4901.2850.550
Publisher’s Note: MDPI stays neutral with regard to jurisdictional claims in published maps and institutional affiliations.

