
Fuzzy Sensory Quality Certification in Intensive Organic Beekeeping
by
 , , and
Florin Marian Buhociu
1, 
Constanta Laura Augustin (Zugravu)
1,*.bmp) ,
,
Maria Magdalena Turek Rahoveanu
1,
Adrian Turek Rahoveanu
2 and
Gheorghe Adrian Zugravu
1 1
Department of Engineering and Management in Agriculture and Rural Development, Doctoral School of Fundamental Sciences and Engineering, “Dunarea de Jos” University of Galaţi, 800008 Galaţi, Romania
2
Management and Marketing Department, Faculty of Management, Economic Engineering in Agriculture and Rural Development, University of Agricultural Sciences and Veterinary Medicine of Bucharest, 11464 Bucureşti, Romania
*
Author to whom correspondence should be addressed.
Agriculture 2021, 11(7), 644; https://doi.org/10.3390/agriculture11070644
Submission received: 9 June 2021
/
Revised: 28 June 2021
/
Accepted: 7 July 2021
/
Published: 9 July 2021
(This article belongs to the Special Issue Emerging Problems of Modern Beekeeping)
Abstract
:The current paper presents a fuzzy sensory quality certification of organic mint honey as a component of the strategy to promote intensive beekeeping. This sensory analysis is based on fuzzy logic that allows the processing of data represented by linguistic terms. For the development of the fuzzy sensory analysis model of bee honey, we develop a MATLAB application, with the help of which we modeled the sensory perceptions in relation to the main quality characteristics of mint honey in relation to the other varieties of honey. The sensory quality index of each honey assortment is obtained by converting qualitative assessments through linguistic terms into a set of three numerical values on a sensory scale of assessment of results with five linguistic values: unsatisfactory, satisfactory, average, good, excellent. Indices of fuzzy sensory quality associated with honey varieties are certified using a blockchain model that is an information technology that offers the opportunity to develop local markets for organic bee products.
1. Introduction
The concept of sensory sensitivity was represented by the ability of the sense organs to record sensations concerning external and internal stimuli [1,2]. The sensory sensitivity of sense organs is a size inversely proportional to the sensory threshold, which provides a quantitative picture of the reaction capacity of various analyzers. If a person experiences sensations at low concentrations of stimulants, his sensitivity threshold is higher. The differential threshold is considered the smallest difference between the values of the stimuli, capable of producing a change in sensations. Differential sensitivity to certain stimuli is considered to express fineness in distinguishing stimuli, which is inversely proportional to the differential threshold. In the analysis of the factors that influence sensory sensitivity, there is the induction phenomenon through which the sensitization of one sense organ is transferred to another sense organ. There are many examples in which a certain sequence of sounds generates a sensitization of sight with different colors. Another example of a factor that influences sensitivity is temperature. Thus, the temperature considered optimal for taste sensitivity is 30–40 °C [3]. The sense organs can also adapt to the intensity of arousal caused by various stimuli. The sensory analysis uses the ability of sense organs to identify and interpret sensations, perceived by their receptors and transmitted to the cerebral hemispheres [4]. Thus, this complex system that participates in the identification and interpretation of sensations is called the analyzer system. The receptor sensors of the sense organs identify a specific source of energy. The energy is taken up and transformed into nervous excitation and transmitted to the cerebral hemispheres, which transform it into sensation.
Fuzzy comparative sensory analysis is a scientific method that can be used to interpret recorded data, because of sensations perceived by the senses of sight, smell, taste, touch, and hearing. This method is also an important criterion for evaluating the quality of honey [5,6,7].
Sensory analysis is a particularly important method for assessing the quality of food, which can be objective and subjective in determining sensory properties, having an important role in establishing authenticity, in classification and standardization, in rapid assessment of freshness, and in identifying defects difficult to identify by other laboratory methods [8,9,10].
Objective testing is based on the determination of sensory properties performed by a group of trained experts in honey sensory analysis, while subjective testing is based on consumer reactions to sensory properties [11,12].
One of the methods that is used to determine how much a certain assortment of honey is accepted by the consumer is the so-called nine-point hedonic scale [13,14].
This scale was introduced by Peryam and Pilgrim in 1957 to assess food preferences. The numerical values of this scale are between 1 and 9, being used to qualitatively evaluate the taste, aroma, color, consistency, and appearance [15,16,17].
The symbols used to mark perceptions are:
- +; −; 0; =;
- 0;1;2;3;
- 0;5;10;15;20.
In the sensory analyzes a numerical rating from 1 to 9 is used, as follows:
- -
- from 1 to 3, lower,
- -
- from 4 to 6, medium,
- -
- from 7 to 9, superior.
In sensory analysis, the perception of experts in honey sensory analysis may be affected by uncertainty and, for this reason, the qualitative assessment, based on linguistic terms. Zadeh and Kacprzyk consider that the qualitative method for assessing the sensory perception in this context is more realistic than the quantitative approach [18,19].
The blockchain quality certification model can create a specific market for organic bee products based on short supply chains, without intermediaries.
The blockchain is used for quality certification in the supply chain. The honey consumers are overwhelmed by the low-quality products and amount and complexity of certification labels. The use of chemicals in agriculture is the major issue that impacts honey quality.
The blockchain solution for the lack of transparency is certification of honey quality by allowing any person to participate in fuzzy sensory analysis.
The smart contract is created for each physical organic honey order and deployed to the blockchain network. All those involved in the supply chain of the organic bee product can interact with the blockchain system to obtain quality certificates. A blockchain system is thus used to certify the quality of the bee product [20].
2. Methodology
Sensory analysis, as the scientific method of appreciation of food owners, plays an important role in stabilizing authentic products, being used independently for comparison with the reference, classification, and standardization, as well as detecting prospects, defects, and other shortcomings. Although the sensory analysis is still dependent on human appreciation, having a certain degree of subjectivism, due to the professionalization of the body of tasters and the interpretation of statistics, it is a useful tool, and in some points, it becomes irreplaceable in the assessment of quality. Honey must not contain organic or inorganic bodies foreign to its composition, such as mold, insects, insect fragments, seedlings, or impurities when honey is marketed as such or used in another product for human consumption. Each attribute in the sensory analysis has a relative weight in the total quality index. This relative weight is established based on the assessments of a set of 20 experts in honey sensory analysis who provide assessments on the sensory quality of bee honey, as well as based on chemical determination performed to highlight the quality of honey according to European and national standards.
The values of sensory perception are qualitative evaluations represented by linguistic terms with which experts in honey sensory analysis assess the taste, aroma, color, consistency, and appearance of honey. The results recorded for these characteristics regarding the sensory quality of food products can be:
- unsatisfactory,
- satisfying,
- medium,
- good,
- excellent.
These linguistic terms used for the qualitative assessment of sensory attributes (color, aroma, taste, smell, and general appearance) are transformed into triplets of numerical values using the membership functions. Thus, the quality of a sensory attribute is assessed using fuzzy logic (working with values between 0 and 1) through three numerical values (on a scale from 0 to 100), which reflects the share of belonging to three of the five values. linguistic.
For example, if the experts in honey sensory analysis’ assessment of color is represented by the linguistic term “good”, using a triangular affiliation function, this linguistic value is associated with a triplet (75 25 25) which reflects the fact that, in the case of the color of the honey sample, it belongs to:
- the linguistic term “good” with a weight of 75% of the maximum fuzzy value 1;
- the linguistic term “average” with a weight of 25% of the maximum fuzzy value 1;
- the linguistic term “excellent” with a weight of 25% of the maximum fuzzy value 1.
For the fuzzy sensory analysis of the honey samples, we used membership functions with the triangular distribution. Thus, the linguistic terms of perception with which experts in honey sensory analysis appreciate the sensory characteristics of honey varieties are converted into so-called triplets belonging to three of the values of the scale.
For the calculation of the global sensory quality indices of the honey assortments, the relation (1) is used, in which we have a series of operations of vector multiplication, addition, and extended product with fuzzy numbers (triplets) of SD type. The fuzzy SD triplet contains the values assigned for 3 linguistic terms (the one at the top of the triangle, on the left S, and the right D).
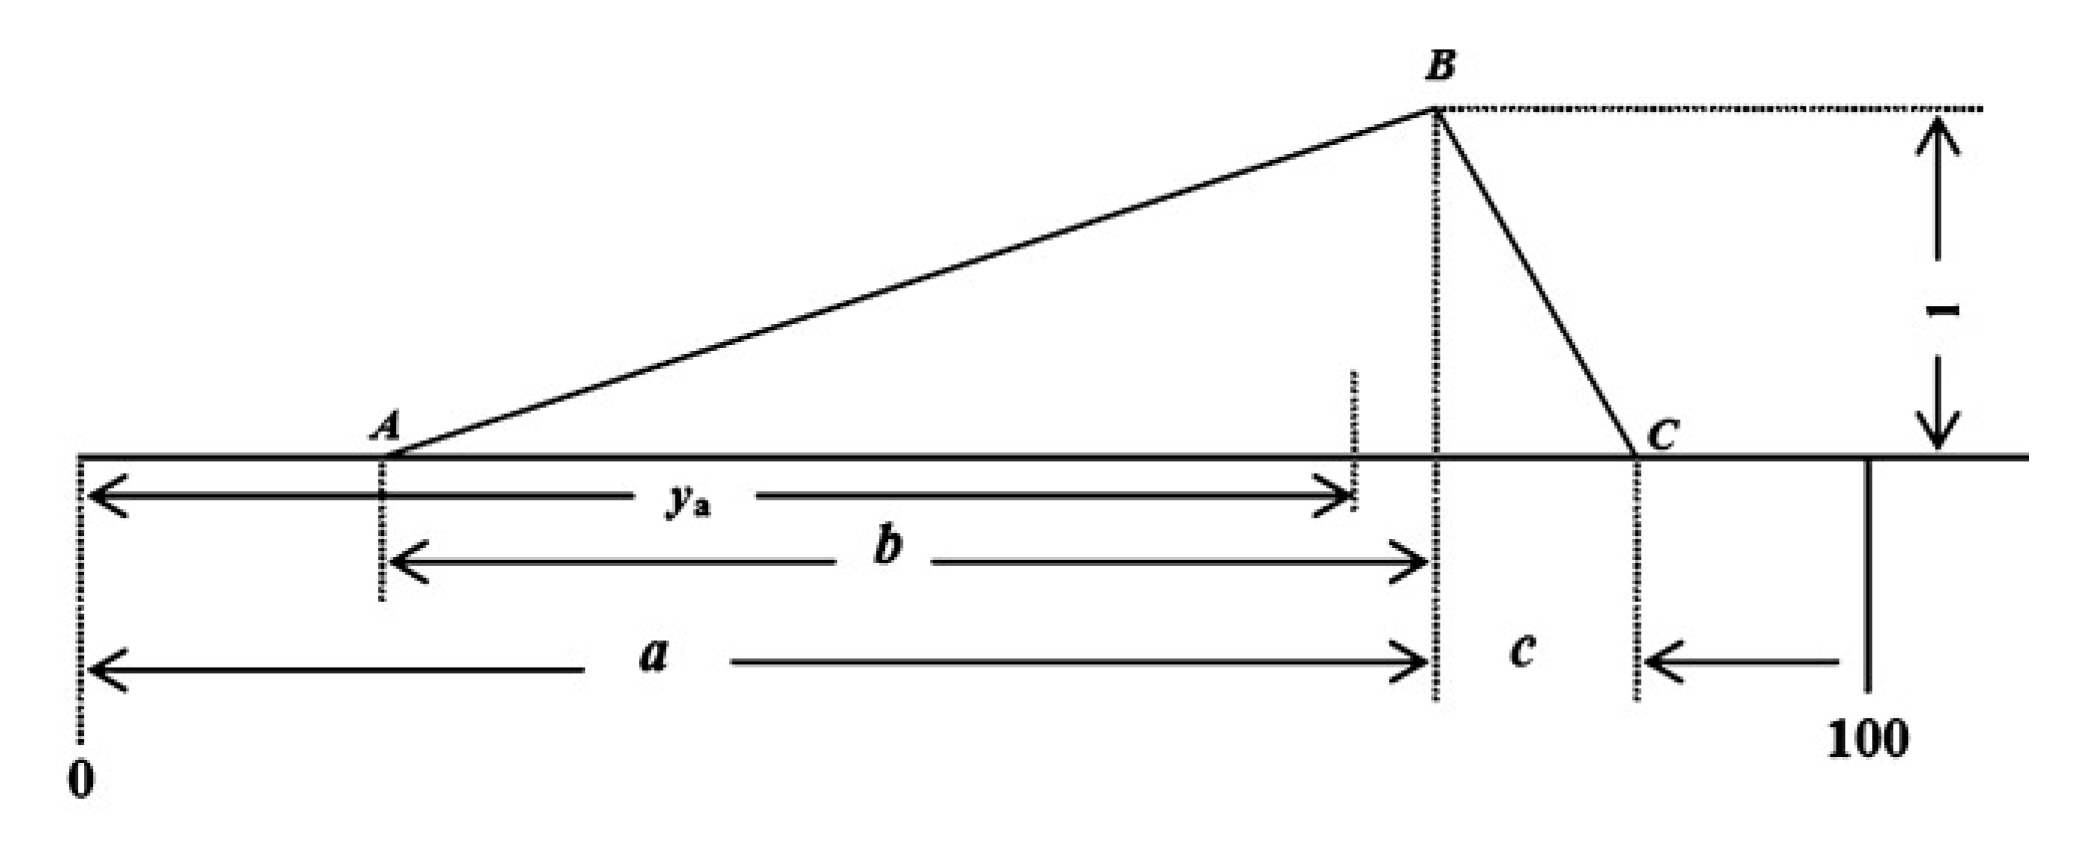
A fuzzy number is of type SD when there are membership functions S (for left), D (for right). The triplet being a scalar quantity (a, b, c), b > 0, c > 0 its membership function is shown in Figure 1, and Equations(1) and (2):
Expression of the fuzzy triangular belonging function of type SD:
The description of the function of belonging to the linguistic terms using the triangular fuzzy sizes of type SD defined using triplets (a b c) has the following expression:
SD type fuzzy triangular membership function:
To construct the fuzzy mathematical model of sensory analysis of bee honey, the number and linguistic terms of the sensory perception analysis scale must be established. Each linguistic term used to assess sensory qualities has a certain meaning, which is represented by a set of values in the range [0, 1], described by a member, generally to a set of three linguistic terms from the total set of dimension linguistics. For the fuzzy sensory analysis of the honey samples, we used membership functions with a triangular distribution. Thus, the linguistic terms of perception with which experts in honey sensory analysis appreciate the sensory characteristics of honey varieties are transformed into so-called triplets belonging to three of the values of the scale. The triangular belonging functions were used in this model to assess the degree of belonging to three of the linguistic terms, with different weights.
The algebraic operations with fuzzy sizes of SD type used in the sensory analysis model of the quality of mint varieties are:
to a, b, c > 0.
The triangular belonging functions were used in this model to assess the degree of belonging to three of the linguistic terms, with different weights.
To develop the model of fuzzy sensory analysis of bee honey, we used MATLAB R2020b (MathWorks, Natick, MA, USA), which offers through its toolkit the Fuzzy Logic Designer application with which we can model sensory perceptions concerning the main quality characteristics of mint honey in relation with the other varieties of honey [14,15,16].
The sensory quality index of each honey assortment is obtained by converting qualitative assessments through linguistic terms into a set of 3 numerical values on a sensory scale of assessment of results with 5 linguistic values: unsatisfactory, satisfactory, average, good, excellent (Table 1).
This set of 3 numerical values describes the function of triangular belonging to the five linguistic values. Each of the quality attributes in the sensory analysis has a relative weight in the total quality index. This relative weight is established based on assessments of a set of 20 experts in honey sensory analysis who provide assessments on the sensory quality of bee honey, as well as based on physicochemical determinations performed to highlight the quality of honey according to European and national standards. The relative weight that each sensory quality attribute has in the calculation of the global sensory quality index is established using qualitative assessments, based on linguistic terms, using a fuzzy sensory scale with the following five linguistic values (Table 2):
The relative weight that each quality sensory attribute has in the calculation of the global sensory quality index is established using qualitative assessments, based on linguistic terms, using a fuzzy sensory scale with the following five linguistic categories.
Thus, for the color of honey, the relative weight of this attribute in the calculation of the total quality index is calculated:
where, QCrel is the relative weight of the color quality index (QC) in the total amount of quality quantity weights (Qt)
For the honey flavor, the relative weight of this attribute in the calculation of the total quality index is calculated:
where, QArel is the relative weight of the flavor quality index (QA) in the total sum of the quality quantity weights (Qt).
For the taste of honey, the relative weight of this attribute in the calculation of the total quality index is calculated:
where, QGrel is the relative weight of the quality index on taste (QG) in the total sum of the weights of quality quantities (Qt).
For the consistency (texture) of bee honey, the relative weight of this attribute in the calculation of the total quality index is calculated:
where, QTrel is the relative weight of the consistency quality index (QT) in the total amount of quality quantity weights (Qt).
For the overall look of honey, the relative weight of this attribute in the calculation of the total quality index is calculated:
where: QOrel is the relative weight of the overall appearance quality index (QO) in the total amount of quality quantity weights (Qt).
Qt is calculated as the sum of the first values in the triplets QC, QA, QG, QT, and QO with which the sensory quality is evaluated through the functions of belonging to the linguistic values by experts in honey sensory analysis. The quality of each attribute of the sensory analysis CC, CA, CG, CT, and CO is calculated based on the assessments of 20 experts in honey sensory analysis who participated in this sensory analysis and who made qualitative assessments using linguistic terms (unsatisfactory, satisfactory, average, good, excellent). These linguistic values are transformed into triplets of numerical values, with the help of the functions belonging to three of the linguistic terms. This set of three numerical values that are used to reflect the quality for each sensory attribute, in the comparative assessment of bee samples, were used to obtain a global sensory quality index (CS) that sums the products between the calculated sensory triplets. For each of the quality attributes with the relative weight of each attribute:
The following relationship is used to calculate the global sensory quality indices of honey varieties:
where:
CS = CC⊗QCrel⊕CA⊗QArel⊕CG⊗QGrel⊕CT⊗QTrel⊕QO⊗QOrel
- CC—the set of three numerical values of color belonging to three of the 5 linguistic terms of the quality assessment scale,
- CA—the set of three numerical values of the aroma belonging to three of the 5 linguistic terms of the quality assessment scale,
- CG—the set of three numerical values of taste belonging to three of the 5 linguistic terms of the quality assessment scale,
- CT—the set of three numerical values of belonging of the consistency (texture) to three of the 5 linguistic terms of the quality assessment scale,
- CO—the set of three numerical values of belonging of the general aspect to three of the 5 linguistic terms of the quality assessment scale.
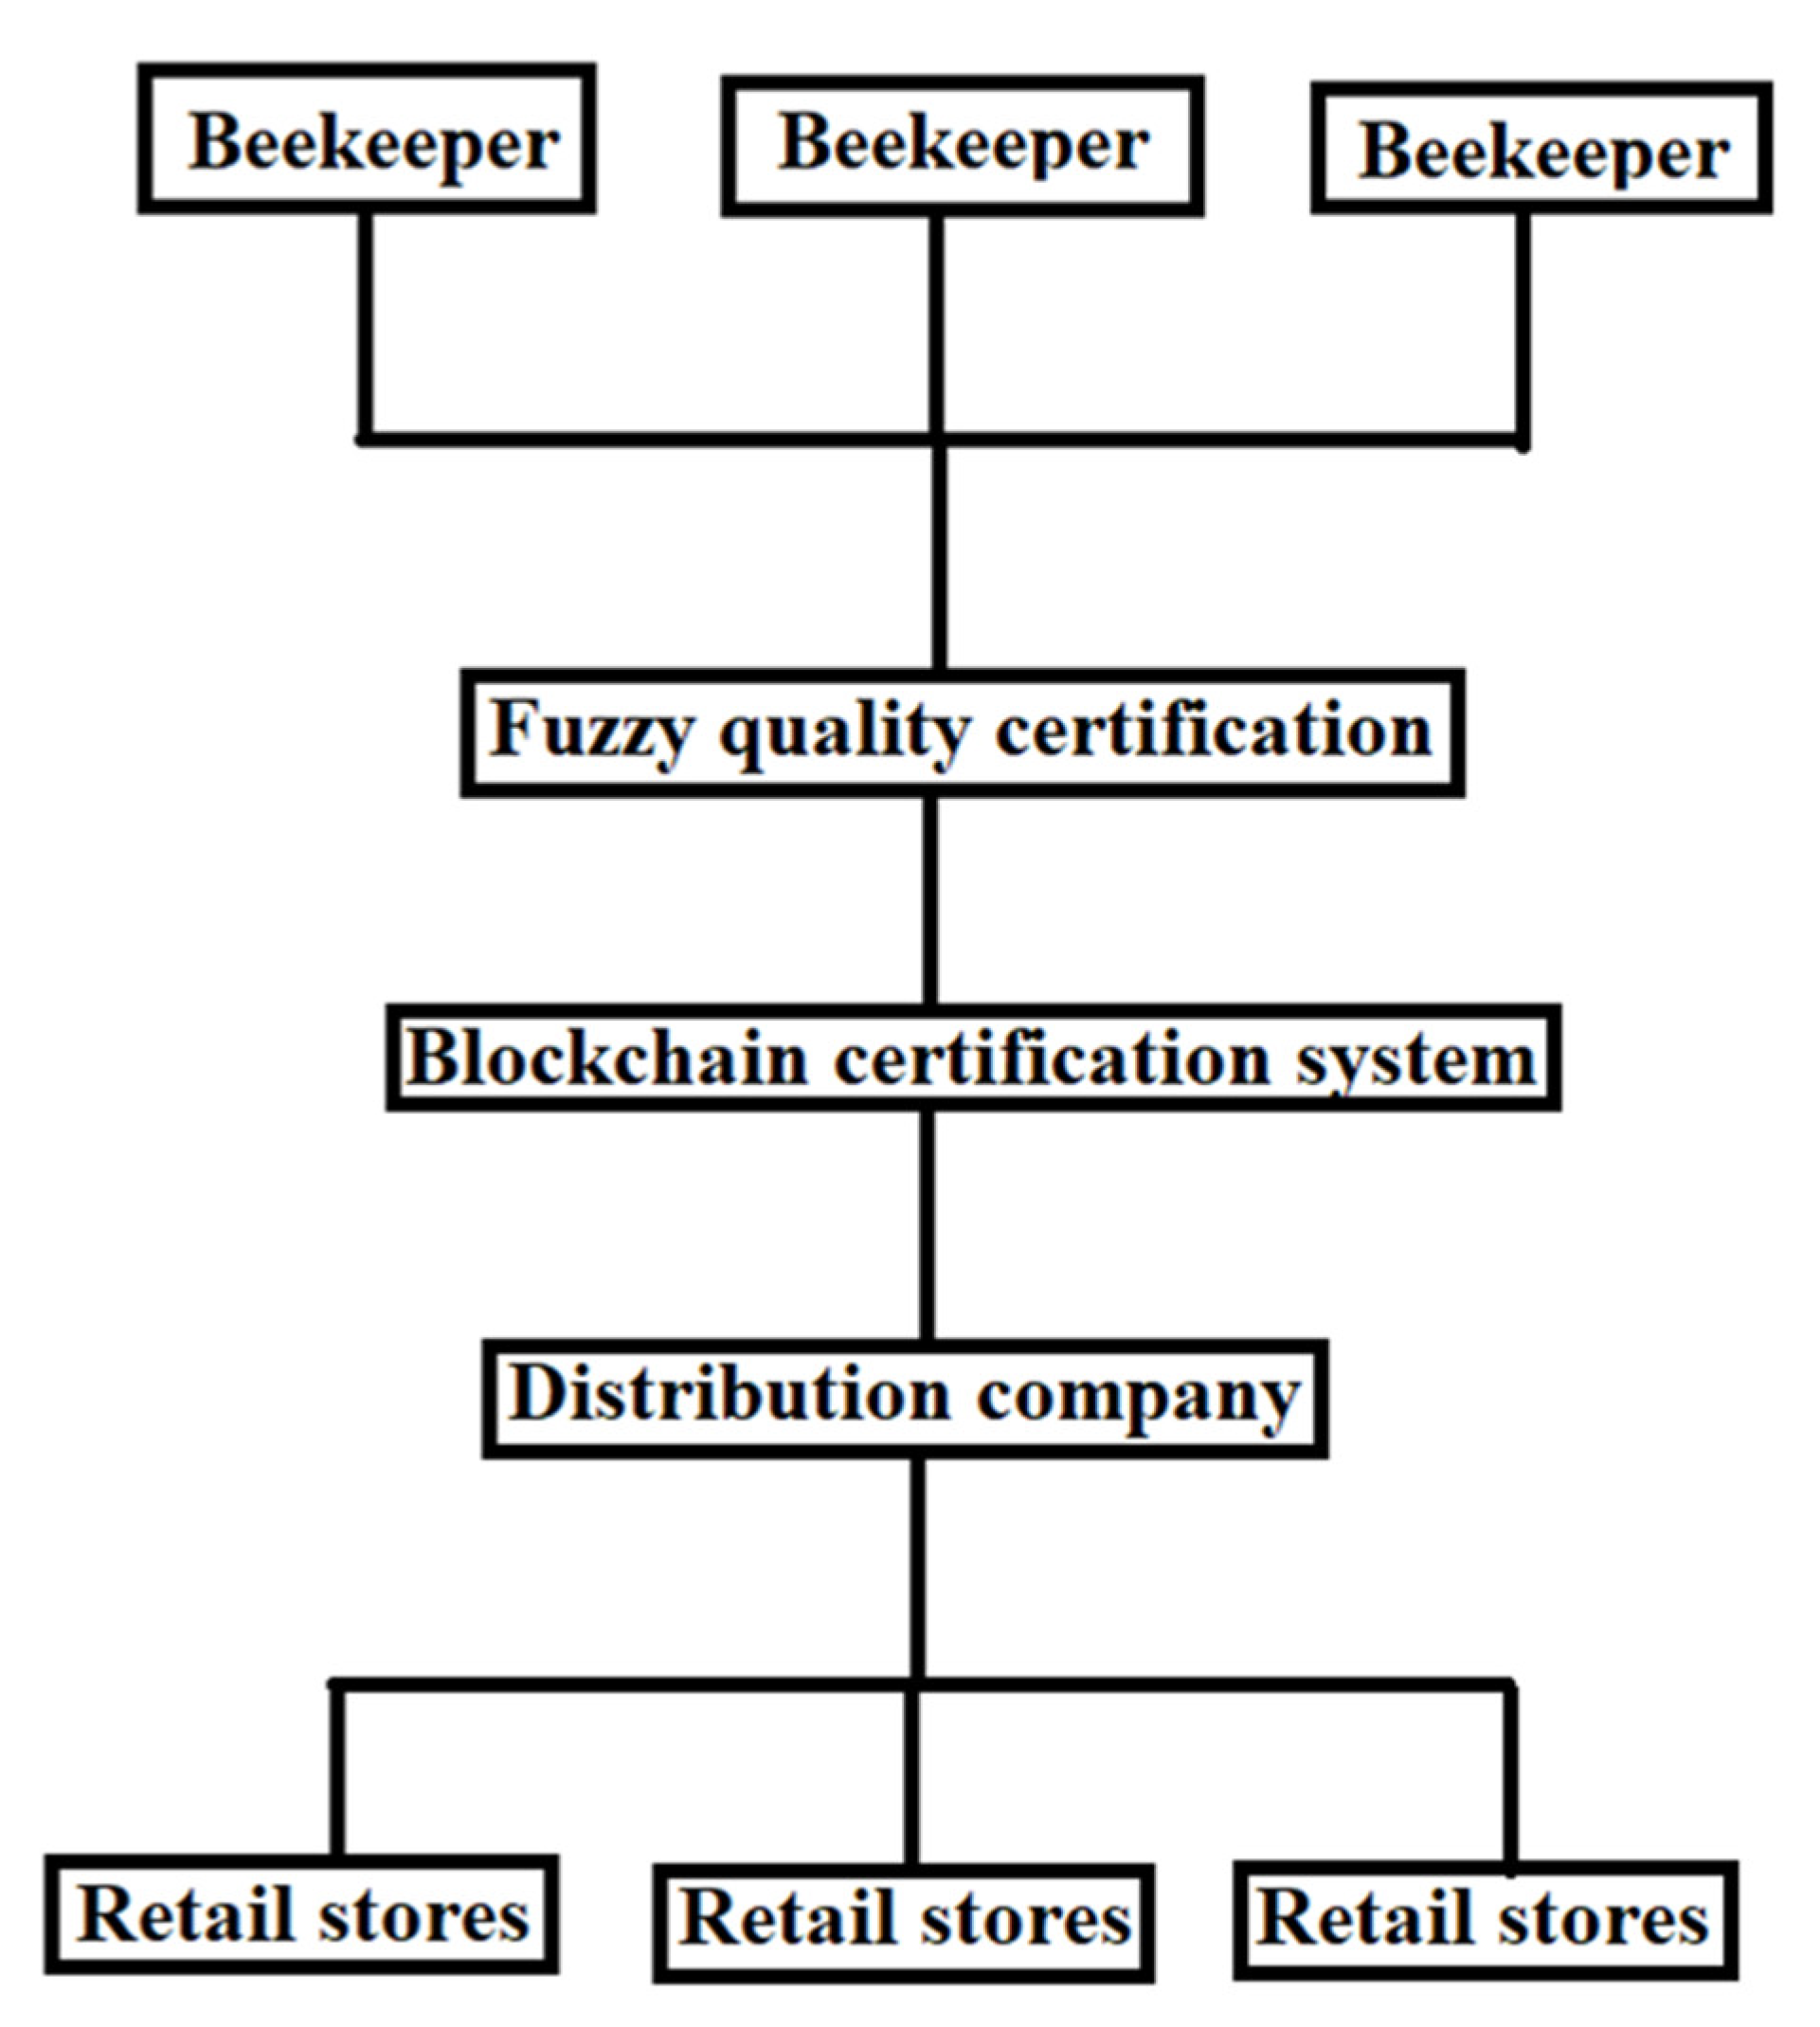
Within this model of bee honey quality certification, beekeepers and distributors are supposed to register the lots sold in the blockchain system. The data entered in the blockchain system is verified and then protected by the hash function [21,22,23].
The structure of a block consists of two main components: a header and a body. The header includes the version current of the current block, a counter type signature and target bits, and the body is consisting of transactions. A hash function applied to an object helps to obtain a sequence of character, called the hash key, which represents the digital signature of the object. A hash key is unique and can only be reproduced if they are known all the initial components from which it was obtained [24,25].
Within the blockchain system for certifying the quality of organic honey, in addition to the information provided by beekeepers, data on geographical indications, meteorological conditions, soil management, nutrients, seeds, etc. are also introduced.
The distributor adds a new block that enters data on packaging, transport conditions, food safety, temperature, and vehicle and delivery conditions.
Retailers or retail stores register a new block with data on the conditions of reception, storage, and food safety (Figure 2).
The blockchain model for certifying the quality of organic honey represents a decentralized system that, through the transparency of information, offers the opportunity to develop the market of organic products.
Each block records the following information:
- Index: position of the block in the chain (the first block has the index 0).
- Time: the time when the block was created.
- BlockHash: a unique numeric value that identifies block data.
- PreviousBlockHash: a unique hash reference of the previous block.
- MerkleRoot: the summary of all transactions in the block.
For each assortment of organic honey each beekeeper adds a new block with index 0, also called Genesis.
Each block is sent to a blockchain node which will keep its copy within a shared register. The implementation of the blockchain model for the certification of the quality of organic honey using geographical data, realizes a mapping of the nodes of the supply chain, offering the possibility to optimize the market relations.
Through this blockchain quality certification system, consumers can access all of this information about the respective batch of organic honey that can be found in the shared register by simply scanning the QR code.
3. Results
The concept of quality of a food product sums up all of the characteristics which satisfy the needs of consumers. From this perspective, sensory analysis is considered part of the concept of quality.
We used these operations with fuzzy triplets for the calculation of the global indices of the sensory quality of the honey assortments (Table 3 and Table 4), analyzed through a function created in MATLAB, initiated pe.m:
% extended product
function C = on (A, B)
C (1) = A (1) * B (1);
C (2) = A (1) * B (2) + B (1) * A (2);
C (3) = A (1) * B (3) + B (1) * A (3);
function C = on (A, B)
C (1) = A (1) * B (1);
C (2) = A (1) * B (2) + B (1) * A (2);
C (3) = A (1) * B (3) + B (1) * A (3);
For the defuzzification of the global sensory quality indices we used a function created in MATLAB entitled df.m:
% defuzzification
function Y = df (A)
Y = (3 * A (1) − A (2) + A (3))/3
function Y = df (A)
Y = (3 * A (1) − A (2) + A (3))/3
To order the global sensory quality indices of the honey assortments, obtained after defuzzification and to determine the position in this comparative analysis, the following relations are used in MATLAB:
CS = [df (CS1) df (CS2) df (CS3) df (CS4) df (CS5) df (CS6) df (CS7) df (CS8) df (CS9) df (CS10) df (CS11) df (CS12)) df (CS13) df (CS14)];
[CSd, Ld] = sortrows (CS ‘, - 1);
[La, L] = sortrows (Ld);
[CSd, Ld] = sortrows (CS ‘, - 1);
[La, L] = sortrows (Ld);
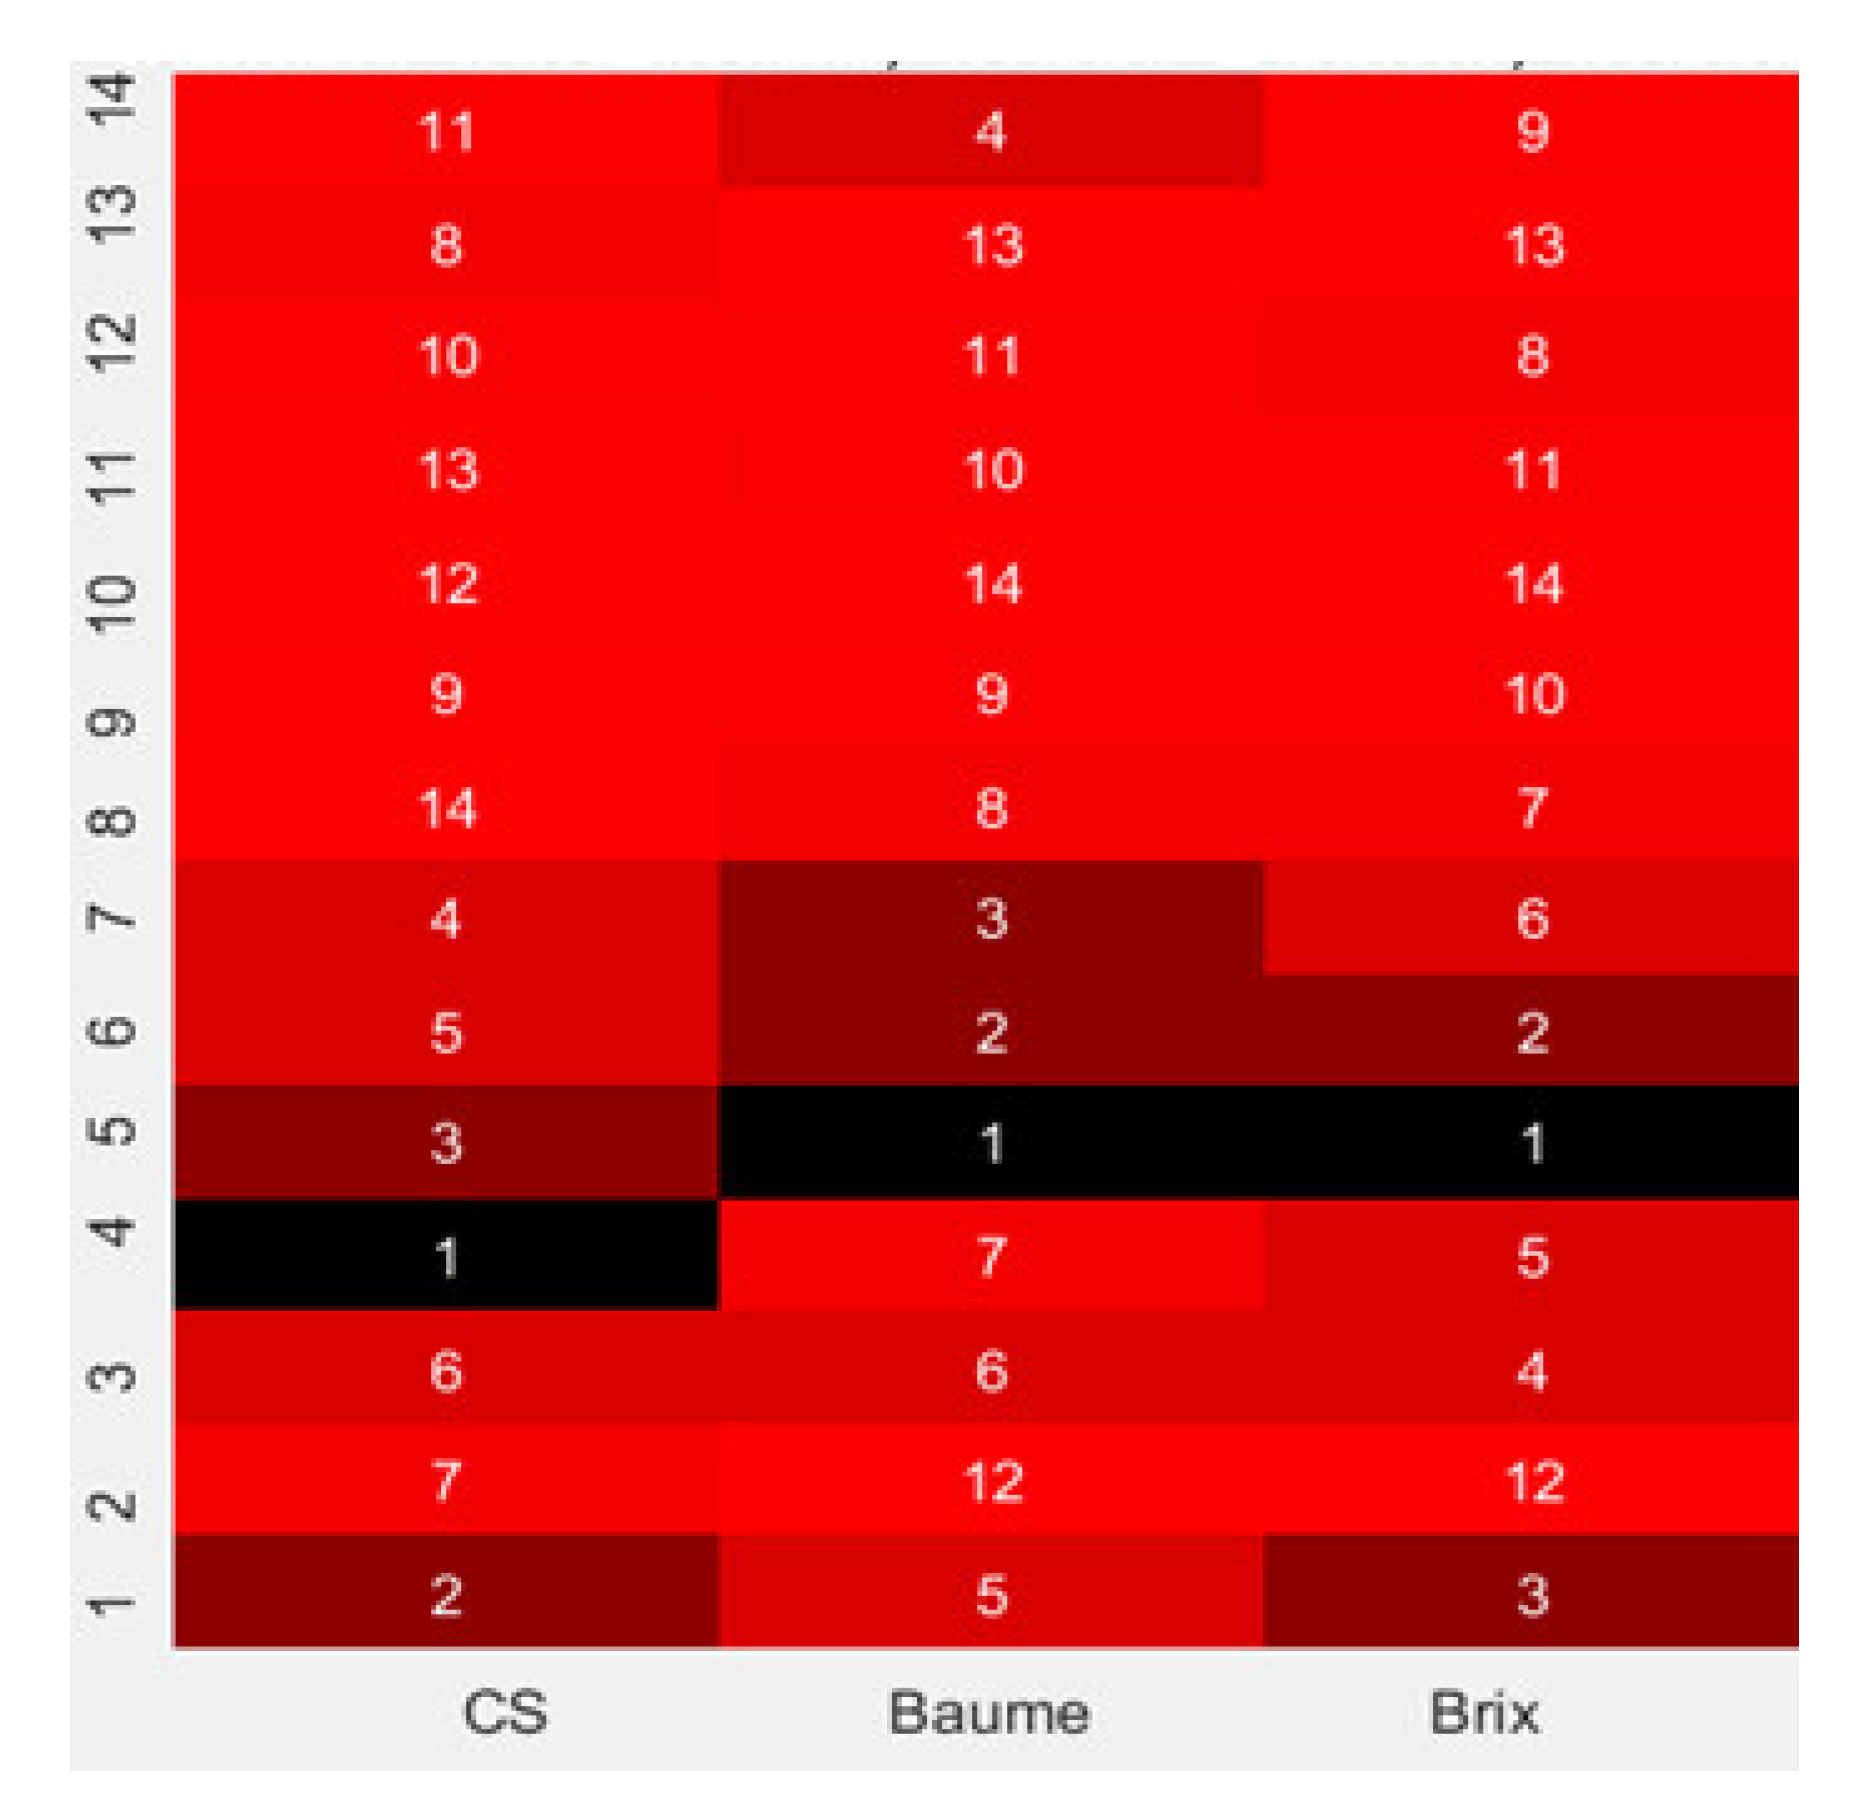
The fuzzy sensory analysis applied for the comparative analysis of American mint honey shows that this honey assortment is close from the perspective of the global sensory qualities to acacia honey (Figure 3). This result is very close to the one obtained by physico-chemical sensory comparative analysis based on the global indices of comparative sensory quality, Baume indices, and Brix indices according to honey European standards CE 834/2007, and CE 889/2008 (Figure 3). The Brix index is used to measure the ratio of sugar density to water, in which the given amount of sugar is dissolved. The Baume index expresses the relative density of liquids by hydrometrics.The name comes from the name of the inventor Baume, who invented the aerometer, a device used to determine the density expressed in degrees Baume.
Blockchain technology offers the opportunity to implement smart contracts in the field of bee products, which through the transparency of quality certification offers the advantage of promoting local resources on global markets. Smart contract is a useful term to develop an informative program that is easy to market to your business or to use a blessing to buy a sale [26,27].
The presence of blockchain certification for organic honey is a form of consumer protection. Thus, the blockchain system offers a shared and verifiable certification of qualities, which is secure and not centrally coordinated.
The risk of food security has necessitated the adoption of a system of blockchain traceability technology, which is an effective tool for quality certification. In this paper, we proposed the certification of the sensory quality of organic honey using a blockchain system that provides safety and integrity. The blockchain system is based on the use of smart contracts [28].
The blockchain model of quality certification achieves the traceability of organic honey throughout the chain, offering a sustainable competitive advantage, especially in the case of bee products with a protected geographical indication (PGI), or those with a protected designation of origin (DOP) [29].
The digitalization of the current agro-food system and the regulations on the safety and traceability of organic products require increasing the certification of origin and quality throughout the beekeeping chain to ensure compliance of practices with regulations in force in the field of organic beekeeping.
4. Conclusions
The organic honey revealed that seven attributes were significant, including color, floral aroma, viscosity, consistency, and acceptability. This blockchain system that certifies the sensory quality of honey, one of the common methods of qualitative analysis, provides secure and easy-to-understand information by consumers, contributing to the development of local markets in the virtual environment.
The adoption of a model based on blockchain technology allows certification of the quality of organic honey, offering consumers certain guarantees regarding the safety and quality of honey, contributing to the development of local strains. Thus, through this blockchain model for certifying the quality of organic honey, a strategic advantage is obtained in terms of capitalizing on organic products and developing local markets.
Promoting the development of markets for organic honey is part of all measures to combat climate change, produce efficient management of bio-resources, reduce costs, and reduce risks of production by promoting models of intensive organic beekeeping. The blockchain model for honey quality certification offers local producers protection against practices of illegal competition with counterfeit products.
American mint honey induces a menthol aroma because mint is rich in volatile oils, being considered a tonic product for the nervous system and a strong stimulant for the immune system through the action it has on the digestive system. American mint honey has exceptional qualities, being comparable to royal jelly or manuka honey in terms of quality and purity. Unlike honey obtained from arboreal flowers, it, like poly-floral honey and honey obtained from the flowers of annual plants, has heavy metals in its composition (according to determinations with specific tests). In the usual honey from arboreal flowers or multiannual plants located near urban areas or roads, we identified high concentrations of heavy metals, due to air pollution in these areas. The antibacterial properties of American mint have been exploited through products such as mint jam or mint liqueur.
Author Contributions
Conceptualization, C.L.A. and M.M.T.R.; Methodology, F.M.B. and A.T.R.; Software, G.A.Z.; Validation, F.M.B. and A.T.R.; Formal analysis, C.L.A. and M.M.T.R.; Investigation, C.L.A. and M.M.T.R.; Resources, F.M.B. and A.T.R.; Data curation, C.L.A. and M.M.T.R.; Writing—original draft preparation, C.L.A. and M.M.T.R.; Writing—review and editing, G.A.Z.; Visualization, F.M.B. and A.T.R.; Supervision, G.A.Z.; Project administration, F.M.B. and A.T.R.; All authors have read and agreed to the published version of the manuscript.
Funding
This research received no external funding.
Institutional Review Board Statement
Not applicable.
Informed Consent Statement
Not applicable.
Data Availability Statement
Data is contained within the article.
Conflicts of Interest
The authors declare no conflict of interest.
References
- Chistol, L.T.; Bandini, L.G.; Must, A.; Phillips, S.; Cermak, S.A.; Curtin, C. Sensory Sensitivity and Food Selectivity in Children with Autism Spectrum Disorder. J. Autism Dev. Disord. 2018, 48, 583–591. [Google Scholar] [CrossRef] [PubMed]
- Grimen, H.L.; Diseth, Å. Sensory Processing Sensitivity. Compr. Psychol. 2016, 5. [Google Scholar] [CrossRef] [Green Version]
- Sharif, M.K.; Butt, M.S.; Sharif, H.R.; Nasir, M. Sensory Evaluation and Consumer Acceptability. In Handbook of Food Science and Technology; Khan, I.A., Farooq, M., Eds.; University of Agriculture: Faisalabad, Pakistan, 2017; pp. 361–386. [Google Scholar]
- Qiong, O.U. A Brief Introduction to Perception. Stud. Lit. Lang. 2017, 15, 18–28. [Google Scholar]
- Garitta, L.; Langohr, K.; Gómez, G.; Hough, G.; Beeren, C. Sensory cut-off point obtained from survival analysis statistics. Food Qual. Prefer. 2015, 43, 135–140. [Google Scholar] [CrossRef] [Green Version]
- Ciappini, M.; Gatti, M.; Cabreriso, M.; Chaín, P. Modificaciones fisicoquímicas y sensoriales producidas durante las frituras domésticas sobre aceite de girasol refinado y aceite de oliva virgen extra. Invenio 2016, 37, 153–161. [Google Scholar]
- Ciappini, M.C. Polyhenolic profile of floral honeys in correlation with their pollen spectrum. J. Apic. Res. 2019, 58, 772–779. [Google Scholar] [CrossRef]
- Garitta, L.; Langohr, K.; Elizagoyen, E.; Ottaviano, F.G.; Gómez, G.; Hough, G. Survival analysis model to estimate sensory shelf life with temperature and illumination as accelerating factors. Food Qual. Prefer. 2018, 68, 371–376. [Google Scholar] [CrossRef] [Green Version]
- Esmerino, E.; Paixão, J.; Cruz, A.; Garitta, L.; Hough, G.; Bolini, H. Survival analysis: A consumer-friendly method to estimate the optimum sucrose level in probiotic petit suisse. J. Dairy Sci. 2015, 98, 7544–7551. [Google Scholar] [CrossRef] [PubMed]
- Elizagoyen, E.S.; Hough, G.; Garitta, L.; Fiszman, S.; Vasquez, J.E.B. Consumer’s expectation of changes in fruit based on their sensory properties at purchase. The case of banana (Musa Cavendish) appearance evaluated on two occasions: Purchase and home consumption. J. Sens. Stud. 2017, 32, e12278. [Google Scholar] [CrossRef]
- Patrignani, M.; Ciappini, M.C.; Tananaki, C.; Fagúndez, G.A.; Thrasyvoulou, A.; Lupano, C.E. Correlations of sensory parameters with physicochemical characteristics of Argentinean honeys by multivariate statistical techniques. Int. J. Food Sci. Technol. 2017, 53, 1176–1184. [Google Scholar] [CrossRef]
- Ciappini, M.C.; Calvino, A. A Holistic View to Develop Descriptive Sheets for Argentinean Clover and Eucalyptus Unifloral Honey. Curr. Nutr. Food Sci. 2020, 16, 919–927. [Google Scholar] [CrossRef]
- Crabtree, R.H. NHC ligands versus cyclopentadienyls and phosphines as spectator ligands in organometallic catalysis. J. Organomet. Chem. 2005, 690, 5451–5457. [Google Scholar] [CrossRef]
- Lee, S.-Y.; Allgeyer, L.; Neely, E.; Kreger, J. Sensory analysis of fruit and fermented fruit product flavors. In Handbook of Plant-Based Fermented Food and Beverage Technology, 2nd ed.; CRC Press: Boca Raton, FL, USA, 2012; pp. 165–178. ISBN 9781439870693. [Google Scholar]
- Heymann, H. A personal history of sensory science. Food Cult. Soc. 2019, 22, 203–223. [Google Scholar] [CrossRef]
- Stone, H.; Sidel, J. Sensory Science and Consumer Behavior. In Global Issues in Food Science and Technology; Academic Press: Cambridge, MA, USA, 2009. [Google Scholar] [CrossRef]
- Morten, C.M.; Vance, C.G.; Thomas, C.B. Sensory Evaluation Techniques, 5th ed.; CRC Press: Boca Raton, FL, USA, 2016. [Google Scholar]
- Kacprzyk, J. Fuzzy dynamic programming: Interpolative reasoning for an efficient derivation of optimal control policies. Control Cybern. 2013, 42, 63–84. [Google Scholar]
- Kacprzyk, J.; Zadeh, L. “Foreword”, IS’2012. In Proceedings of the 2012 6th IEEE International Conference Intelligent Systems, Sofia, Bulgaria, 6–8 September 2012. [Google Scholar] [CrossRef]
- Sander, F.; Semeijn, J.; Mahr, D. The acceptance of blockchain technology in meat traceability and transparency. Br. Food J. 2018, 120, 2066–2079. [Google Scholar] [CrossRef] [Green Version]
- Keviczky, L.; Bars, R.; Hetthéssy, J.; Bányász, C. Introduction to MATLAB. In Advanced Textbooks in Control and Signal Processing; Springer: Singapore, 2019. [Google Scholar] [CrossRef]
- Dorfman, K.D.; Daoutidis, P. MATLAB ‘Tutorial’. In Numerical Methods with Chemical Engineering Applications; Cambridge University Press: Cambridge, UK, 2018; ISBN 9781107135116. [Google Scholar]
- Kim, P. Convolutional neural network. In MATLAB Deep Learning; Apress: Berkeley, CA, USA, 2017; ISBN 978-1-4842-2844-9. [Google Scholar] [CrossRef]
- Ramos-Calderer, S.; Bellini, E.; Latorre, J.I.; Manzano, M.; Mateu, V. Quantum search for scaled hash function preimages. Quantum Inf. Process. 2021, 20, 1–28. [Google Scholar] [CrossRef]
- Saez, Y.; Estebanez, C.; Quintana, D.; Isasi, P. Evolutionary hash functions for specific domains. Appl. Soft Comput. 2019, 78, 58–69. [Google Scholar] [CrossRef]
- Chang, P.-Y.; Hwang, M.-S.; Yang, C.-C. A blockchain-based traceable certification system. In Advances in Intelligent Systems and Computing; Springer: Cham, Switzerland, 2018; Volume 733. [Google Scholar] [CrossRef]
- Basnayake, B.M.A.L.; Rajapakse, C. A Blockchain-based decentralized system to ensure the transparency of organic food supply chain. In Proceedings of the IEEE International Research Conference on Smart Computing and Systems Engineering, SCSE 2019, Colombo, Sri Lanka, 28 March 2019. [Google Scholar] [CrossRef]
- Prashar, D.; Jha, N.; Jha, S.; Lee, Y.; Joshi, G.P. Blockchain-Based Traceability and Visibility for Agricultural Products: A Decentralized Way of Ensuring Food Safety in India. Sustainability 2020, 12, 3497. [Google Scholar] [CrossRef] [Green Version]
- Bandi, A.C.; Cristea, V.; Dediu, L.; Petrea, S.M.; Cretu, M.; Rahoveanu, A.T.; Zugravu, A.G.; Turek, M.M.; Rahoveanu, D.N.M.; Soare, I. The review of existing and in-progress technologies of the different subsystems required for the structural and functional elements of the model of multi-purpose aquaponic production system. Rom. Biotechnol. Lett. 2016, 21, 11621. [Google Scholar]
Figure 1.
Graphic representation of sensory perception through the fuzzy triplet (a, b, c).

Figure 2.
Model of organic honey certification system.

Figure 3.
HeatMap with sensory quality indices, Baume degrees, and Brix degrees content for the analyzed honey varieties. Source: determinations using the MATLAB application of the synthetic results of fuzzy and physico-chemical sensory comparative analysis based on the global indices of comparative sensory quality, Baume indices, and Brix indices.


Table 1.
Numerical triplets associated with a fuzzy sensory scale with five linguistic terms for the qualitative evaluation of each sensory attribute.
Table 1.
Numerical triplets associated with a fuzzy sensory scale with five linguistic terms for the qualitative evaluation of each sensory attribute.
| Unsatisfied | Satisfy | Average | Hi | Excellency |
|---|---|---|---|---|
| 0 0 25 | 25 25 25 | 50 25 25 | 75 25 25 | 100 25 0 |
Table 2.
Numerical triplets associated with a fuzzy sensory scale with five linguistic terms for evaluating the relative weight that each sensory attribute has in the calculation of the global sensory quality index.
Table 2.
Numerical triplets associated with a fuzzy sensory scale with five linguistic terms for evaluating the relative weight that each sensory attribute has in the calculation of the global sensory quality index.
| Unimportant | Small Unimportant | Important | Very Important | Extremely Important |
|---|---|---|---|---|
| 0 0 25 | 25 25 25 | 50 25 25 | 75 25 25 | 100 25 0 |
Table 3.
Global indices of sensory quality of honey varieties.
| Assortments of Honey | Calculation of the Set of Numerical Values Associated with the Color of the Honey Sample, in MATLAB |
|---|---|
| American Mint Honey (2020) | CS1 = pe (CC1, QCrel) + pe (CA1, QArel) + pe (CG1, QGrel) + pe (CT1, QTrel) + pe (CO1, QOrel); |
| American Mint Honey (2019) | CS2 = pe (CC2, QCrel) + pe (CA2, QArel) + pe (CG2, QGrel) + pe (CT2, QTrel) + pe (CO2, QOrel); |
| Mint honey | CS3 = pe (CC3, QCrel) + pe (CA3, QArel) + pe (CG3, QGrel) + pe (CT3, QTrel) + pe (CO3, QOrel); |
| Acacia honey (2020) | CS4 = pe (CC4, QCrel) + pe (CA4, QArel) + pe (CG4, QGrel) + pe (CT4, QTrel) + pe (CO4, QOrel); |
| Acacia honey (2019) | CS5 = pe (CC5, QCrel) + pe (CA5, QArel) + pe (CG5, QGrel) + pe (CT5, QTrel) + pe (CO5, QOrel); |
| Lime honey | CS6 = pe (CC6, QCrel) + pe (CA6, QArel) + pe (CG6, QGrel) + pe (CT6, QTrel) + pe (CO6, QOrel); |
| Lavender honey | CS7 = pe (CC7, QCrel) + pe (CA7, QArel) + pe (CG7, QGrel) + pe (CT7, QTrel) + pe (CO7, QOrel); |
| Mana honey | CS8 = pe (CC8, QCrel) + pe (CA8, QArel) + pe (CG8, QGrel) + pe (CT8, QTrel) + pe (CO8, QOrel); |
| Polyfloral honey (2020) | CS9 = pe (CC9, QCrel) + pe (CA9, QArel) + pe (CG9, QGrel) + pe (CT9, QTrel) + pe (CO9, QOrel); |
| Polyfloral honey (2019) | CS10 = pe (CC10, QCrel) + pe (CA10, QArel) + pe (CG10, QGrel) + pe (CT10, QTrel) + pe (CO10, QOrel); |
| Rapeseed honey | CS11 = pe (CC11, QCrel) + pe (CA11, QArel) + pe (CG11, QGrel) + pe (CT11, QTrel) + pe (CO11, QOrel); |
| Lime honey + manna honey | CS12 = pe (CC12, QCrel) + pe (CA12, QArel) + pe (CG12, QGrel) + pe (CT12, QTrel) + pe (CO12, QOrel); |
| Sunflower honey | CS13 = pe (CC13, QCrel) + pe (CA13, QArel) + pe (CG13, QGrel) + pe (CT13, QTrel) + pe (CO13, QOrel); |
| Mother bee milk | CS14 = pe (CC14, QCrel) + pe (CA14, QArel) + pe (CG14, QGrel) + pe (CT14, QTrel) + pe (CO14, QOrel); |
Source: Determinations using the MATLAB application of global sensory quality indices for honey varieties.
Table 4.
The place obtained by the honey assortments in the comparative analysis based on the Global Sensory Quality Indices.
Table 4.
The place obtained by the honey assortments in the comparative analysis based on the Global Sensory Quality Indices.
| The Value Associated with the Global Index of Sensory Quality, CS | The Place Obtained in the Comparative Sensory Analysis |
|---|---|
| CS1 = 70.8170 | 2 |
| CS2 = 68.5185 | 7 |
| CS3 = 68.7418 | 6 |
| CS4 = 71.3521 | 1 |
| CS5 = 70.3976 | 3 |
| CS6 = 69.6882 | 5 |
| CS7 = 69.9728 | 4 |
| CS8 = 64.2647 | 14 |
| CS9 = 67.8268 | 9 |
| CS10 = 65.8129 | 12 |
| CS11 = 65.2710 | 13 |
| CS12 = 67.2767 | 10 |
| CS13 = 67.9017 | 8 |
| CS14 = 66.9050 | 11 |
Source: Determinations using the MATLAB application of the initial position that the honey assortments had the comparative analysis based on the global indices of comparative sensory quality of the American mint honey with the main honey assortments.
Publisher’s Note: MDPI stays neutral with regard to jurisdictional claims in published maps and institutional affiliations. |
© 2021 by the authors. Licensee MDPI, Basel, Switzerland. This article is an open access article distributed under the terms and conditions of the Creative Commons Attribution (CC BY) license (https://creativecommons.org/licenses/by/4.0/).
Share and Cite
MDPI and ACS Style
Buhociu, F.M.; Augustin, C.L.; Turek Rahoveanu, M.M.; Turek Rahoveanu, A.; Zugravu, G.A. Fuzzy Sensory Quality Certification in Intensive Organic Beekeeping. Agriculture 2021, 11, 644. https://doi.org/10.3390/agriculture11070644
AMA Style
Buhociu FM, Augustin CL, Turek Rahoveanu MM, Turek Rahoveanu A, Zugravu GA. Fuzzy Sensory Quality Certification in Intensive Organic Beekeeping. Agriculture. 2021; 11(7):644. https://doi.org/10.3390/agriculture11070644
Chicago/Turabian StyleBuhociu, Florin Marian, Constanta Laura Augustin (Zugravu), Maria Magdalena Turek Rahoveanu, Adrian Turek Rahoveanu, and Gheorghe Adrian Zugravu. 2021. "Fuzzy Sensory Quality Certification in Intensive Organic Beekeeping" Agriculture 11, no. 7: 644. https://doi.org/10.3390/agriculture11070644
Note that from the first issue of 2016, this journal uses article numbers instead of page numbers. See further details here.