
Modal Analysis of Conceptual Microsatellite Design Employing Perforated Structural Components for Mass Reduction
by
 ,
,
Sarmad Dawood Salman Dawood
1,2 ,
,
Ahmad Salahuddin Mohd Harithuddin
1 and 
Mohammad Yazdi Harmin
1,*
1
Department of Aerospace Engineering, Faculty of Engineering, Universiti Putra Malaysia, Serdang 43400, Selangor, Malaysia
2
Ministry of Science and Technology, Baghdad 10070, Iraq
*
Author to whom correspondence should be addressed.
Aerospace 2022, 9(1), 23; https://doi.org/10.3390/aerospace9010023
Submission received: 15 July 2021
/
Revised: 25 August 2021
/
Accepted: 31 August 2021
/
Published: 4 January 2022
(This article belongs to the Special Issue Verification Approaches for Nano- and Micro-Satellites II)
Abstract
:Mass reduction is a primary design goal pursued in satellite structural design, since the launch cost is proportional to their total mass. The most common mass reduction method currently employed is to introduce honeycomb structures, with space qualified composite materials as facing materials, into the structural design, especially for satellites with larger masses. However, efficient implementation of these materials requires significant expertise in their design, analysis, and fabrication processes; moreover, the material procurement costs are high, therefore increasing the overall program costs. Thus, the current work proposes a low-cost alternative approach through the design and implementation of geometrically-shaped, parametrically-defined metal perforation patterns, fabricated by standard processes. These patterns included four geometric shapes (diamonds, hexagons, squares, and triangles) implemented onto several components of a structural design for a conceptual satellite, with a parametric design space defined by two scale factors and also two aspect ratio variations. The change in the structure’s fundamental natural frequency, as a result of implementing each pattern shape and parameter variation, was the selection criterion, due to its importance during the launcher selection process. The best pattern from among the four alternatives was then selected, after having validated the computational methodology through implementing experimental modal analysis on a scaled down physical model of a primary load-bearing component of the structural design. From the findings, a significant mass reduction percentage of 23.15%, utilizing the proposed perforation concept, was achieved in the final parametric design iteration relative to the baseline unperforated case while maintaining the same fundamental frequency. Dynamic loading analysis was also conducted, utilizing both the baseline unperforated and the finalized perforated designs, to check its capability to withstand realistic launch loads through applying quasi-static loads. The findings show that the final perforated design outperformed the baseline unperforated design with respect to the maximum displacements, maximum Von Mises stresses, and also the computed margin of safety. With these encouraging outcomes, the perforated design concept proved that it could provide an opportunity to develop low-cost satellite structural designs with reduced mass.
1. Introduction
Reduction of the mass of a satellite is one of the primary design drivers that must be considered when developing its system design. The satellite’s mass will contribute to the launcher selection process, which will directly affect the launch costs, since these costs vary in direct proportion to the launcher’s class, as given by Drenthe et al. [1]. Based on information given in Jones [2,3], the cost of launching one kilogram into low Earth orbit, i.e., an orbital altitude of between 200–2000 km above Earth’s surface, is around $2720/kg for one of the most widely utilized launch systems, the SpaceX Falcon 9. A reduction in mass for any satellite will result in significant cost savings for its space program.
Another primary design driver for satellite design is the requirement imposed by launch providers onto any satellite being launched; namely, the value of the satellite’s fundamental natural frequency (or FNF in the current work) must be far from the FNF of the launcher, a value known as the critical natural frequency. Emphasis is placed on this specific modal parameter because launch service providers specify this critical value for the fundamental frequency in their user manuals, such as the mission planning guide published by Spaceflight, Inc. [4], a major provider of small satellite launch services. This value is specified to avoid the possibility that the satellite’s fundamental natural frequency, that could be excited due to the highly dynamic launch loads, might synchronize with one of the launcher’s natural frequencies, causing mutual resonance between the two and leading to the loss of the launcher and its payloads, as mentioned by Garcia-Perez et al. [5] as well as Fakoor et al. [6]. Hence, the key parameter considered for comparison in the current work is the FNF of the cases taken under consideration in the current work, as will be shown in the relevant sections below.
The current trend in satellite design is to focus on the so-called “small satellite” category, with masses ranging from 1 kg (or less) up to 1000 kg, as described by Sweeting [7], Kramer and Cracknell [8], Xue et al. [9], and others. Satellites in this mass range include enough volume to carry power-efficient payloads that can perform scientifically meaningful missions without requiring relatively large power budgets. Small satellites are mostly utilized for remote sensing and Earth observation missions, data collection missions from remotely installed ground sensors, scientific missions such as astronomical observations, and other types of missions that do not involve time-dependent constraints or high-power budget requirements.
Reducing the mass of a satellite involves making choices regarding its structural configuration, either through selecting a suitable overall geometric shape or reducing the number of structural members required for the structure to maintain its integrity while under load. This process is considered part of the larger process of topology optimization, through which a mass reduction goal (among other goals) can be achieved through making changes in the geometry of a certain structural component. Examples of topology optimization towards mass reduction and control include Lim et al. [10], Viviani et al. [11], and many others.
However, mission requirements might not always allow the satellite’s structural configuration to be modified, e.g., the payload must be placed in a specific location relative to the Earth, necessitating a specific structural support design. Thus, a second mass reduction method that can be utilized is to choose the materials that are included in the structural subsystem design such that the structural components are relatively light-weight, but also strong and stiff enough to withstand the various dynamic loads imposed upon the satellite during its operational lifetime, especially during the launch phase.
This has been achieved in previous satellite projects, especially for larger-sized systems having masses of 30–40 kg and higher, through introducing advanced materials into the structural design. Cho and Ree [12], Kuo et al. [13], Zhengchun et al. [14], Kwon et al. [15], and many others describe the implementation of composite materials, mostly in the shape of honeycomb cores with composite faceplates. This widespread implementation in satellite systems is due to the improved mass savings and stiffness characteristics these materials offer to designers. However, implementing composite materials in any design leads to high budgetary requirements since the design, analysis, and especially the fabrication costs of implementing them are high. This high cost is due to the specialized knowledge required for efficient implementation, with fabrication cost modeling described by Centea and Nutt [16] and Lester and Nutt [17]. This high cost is further exacerbated when dealing with space qualified composites because a critical requirement is minimal outgassing. This is the expulsion of certain chemical compounds from the composite in gaseous form while in orbit due to the vacuum of the orbital environment. These gaseous compounds are then deposited onto critical components of the satellite, such as imager lenses, as described by Anwar et al. [18]. Exact cost figures for specific space qualified composites are difficult to find, due to the custom nature of their design for each specific application; however, Lester and Nutt (mentioned above) as well as Shama et al. [19] strongly suggest at least a tenfold price difference between them and aerospace grade aluminum 6061 alloy stock, a widespread metallic material used in satellite structures.
As described previously, the significant knowledge required to design, analyze, and fabricate advanced space qualified composite materials leads to technical difficulties in implementing these materials in an efficient way, especially since materials employed for space systems must meet higher standards than those employed for ground-based systems. One example of this constraint is the Turkish small satellite RASAT, as described by Yüksel et al. [20]. In addition, the cost of purchasing these materials, relative to standard metals, is also relatively high (e.g., Shama et al. [19]), thus raising the overall cost.
The current work offers an alternative mass reduction approach, namely introducing metal perforations into a small satellite’s structural subsystem instead of using advanced materials. This approach was achieved through material removal instead of the material’s inherent properties. Accordingly, the current work’s approach to mass reduction was based upon configuration modification. Implementing its proposed approach can result in total program costs approaching a tenth, or even more, of the total cost for a conventional composites-based approach to mass reduction. A major advantage to implementing the proposed process is that the perforations can be fabricated through standard, low-cost machining processes, instead of the demanding fabrication processes employed by advanced materials. Another option that is now emerging is to employ additive manufacturing to fabricate the metallic satellite structural components, which is a new frontier in fabrication technology, as described by Borgue et al. [21], in which relatively complex geometric shapes and cross sections can be fabricated.
The concept of introducing perforations into structural components is not entirely new. The effect of perforations, in various perforation shapes and distributions, on the natural frequencies of plates has been described in works by Cunningham et al. [22], Abdelrahman et al. [23], Ghonasgi et al. [24], Jeong and Jhung [25], and others, where it was found in all these works that the presence of perforations reduced the overall stiffness of the plates and which hence reduced their natural frequencies. Almitani et al. [26] studied the effect of the presence of perforations in multilayered beams on their natural frequencies and found a similar effect, namely that the number of perforations had an inversely proportional effect on the natural frequencies due to the reduction of stiffness. Sun et al. [27] considered the effect of perforations on the aerodynamic flutter of large composite wind turbine blades and concluded that a higher rigidity and better flutter suppression damping was achieved through implementing the perforations. Perforated structures have also been utilized in civil engineering; Formisano et al. [28] studied their effect when implemented in shear panels utilized as bracing devices for seismic-resistant structures and found that by choosing a suitable perforation pattern for implementation in the shear panels, it was possible for the building to undergo relatively large shear deflections without excessively compromising its stiffness and ductility. In other fields, Sailesh et al. [29] studied their effect on acoustic soundproofing materials and found that their presence in the form of variable geometry variations had a positive effect on the sound proofing performance.
In terms of the perforation concept’s use in the astronautics field, a review of past satellite designs showed that metal perforations had been previously used in small satellites, a class of satellites that was introduced in 1999, as described by Millan et al. [30], with masses ranging from a few grams up to 1000 kg. Perforations were implemented in systems falling in the smaller mass classifications, up to masses of around 30–40 kg. The most well-known small satellite design is the ISO standardized CubeSat Design [31] developed by the California Polytechnic State University (Cal-Poly) [32], in its basic configuration (the so-called 1U design, with a volume of 10 cubic centimeters and a mass of around 1.5 kg) and also its larger configurations (2U, 3U, 6U, and larger) [33,34]. However, a review of past works failed to identify satellite structures falling into higher satellite mass ranges, such as 40 kg and above, that employed the metal perforation technique. Instead, these satellites predominantly relied on space qualified composite materials or honeycomb structures to reduce mass, as described in works by Jin et al. [35], Wagih et al. [36], Ontaç et al. [37], Salem et al. [38], Slimane et al. [39], and others.
The current work’s alternate approach to mass reduction, as given above, was proposed as a possible solution to small satellite projects that are constrained in terms of available budget and may also be constrained in terms of the technical knowledge of implementing advanced structural materials. It strives to provide this alternate approach to mass reduction with the long-term goal of producing mass savings that can be favorably compared to the mass savings offered by advanced materials, but at a small fraction of their costs and need for technical expertise.
Employment of modal analysis has been one of the mainstay fixtures in satellite structural design since its inception, as specified in standardized astronautic design references. Its employment has always been in downstream processes, after the design phase has ended, to assess the structure’s basic dynamic properties, as shown in works by Wei et al. [40], Liu et al. [41], and others, while also acting as a gateway to downstream dynamic loads analyses. However, the current work proposes to extend its utilization. Specifically, modal analysis was an integral part of the structural design process itself. Namely, computational modal analysis (henceforth referred to as CMA in the current work) was utilized to select a geometrically defined perforation pattern from among four geometric shapes and a design space of five geometric variations. The pattern which yielded the closest value of FNF to the baseline unperforated assembly’s FNF was selected. Due to budgetary constraints, it was not possible to validate the computationally acquired results through experimental modal testing; as a result of these constraints, the current work employed experimental testing to validate the computational methodology itself.
The current work employed a process known as “tailoring the structural design” in order to achieve a specific value for a required parameter—in this case, the system FNF— through making changes to the structural design in a way that does not adversely affect the structural performance. This process has been utilized in numerous other works in various fields: for example, Chan et al. [42] employed the process to change the natural frequency of a wing by changing the angles of its ribs with respect to a range of sweep angles; Tsiatas and Charalampakis [43] employed it to change the natural frequency of axially functionally graded beams and arches by changing their material distribution; and Muc [44] employed the process by changing the ply angles of a laminated plate, among others.
2. Research Methodology
The research effort given in the current work is a continuation of earlier works performed by the primary author [45,46] by expanding upon the geometric pattern shapes included in those works, hence exploring a larger range of possible perforation pattern shapes. The aim of both the current and previous works was to develop the conceptual design for a structural subsystem of a small satellite bus with a mass range between 50 kg and 100 kg, developed to support an Earth resources or remote sensing mission placed in a sun-synchronous low Earth orbit.
2.1. Development of the Baseline Structural Design
The baseline structural design was originally developed in the previous work after taking into account the allowable static and dynamic envelopes (i.e., the volumes taken up by the outer dimensions of the satellite during both the period before launch and during it, respectively) for three launchers that were active at the time when the design was developed, namely the Russian Dnepr-1, the SpaceX Falcon 9, and the ESA Soyuz. Thus, after taking these envelopes as the maximum limits to the width, depth, and height of the outer dimensions of the satellite, it was determined that taking the maximum value of one meter for each of these three dimensions would meet the envelope limitations for any of the three launchers that were considered, and any one of them could be selected as a launch vehicle.
The next step was to set the actual outer dimensions of the satellite, which was done after selecting a suitable payload for the mission, namely a multispectral imaging system that met the mission requirements. Moreover, a set of components was selected for the various subsystems mounted on-board the satellite (e.g., power, attitude dynamics and control, onboard computer, etc.) and which would support the imaging payload.
Taking into consideration past small satellite designs launched into orbit, the right prismatic geometric shape was selected for the overall configuration of the satellite being designed, since this shape provides the best use in terms of volume with minimal volumetric waste, as described in works such as Aborehab et al. [47], compared to other geometric shapes, e.g., cylindrical, hexagonal, octagonal, and others, besides being easier to fabricate and assemble. Taking inspiration from past designs, e.g., [48], a central load bearing assembly was added to the structure to act as its backbone and to withstand the highly dynamic loads imposed on the satellite during the launch phase of its operational life, as will be seen in Section 3.4, describing the results of quasi-static launch loads analyses.
Figure 1a shows the conceptual subsystem configuration after performing several component distribution designs. The subsystem components shown were color coded based on the subsystem, with red being power, green being attitude control, and blue being communications. Based on the conceptual subsystem configuration, it was determined that outer dimensions of 0.65 m in both the width and depth, and 0.75 m in height, were sufficient to contain all the subsystems efficiently and to meet the minimum requirements for thermal control and harness design, as shown in Figure 1b. It should be noted that the current work’s scope did not include performing any analyses on a fully configured satellite containing all major subsystem components; instead, its scope was only to develop the structural subsystem as a basis for a family of scalable satellite structures. Future works will investigate the current work’s research efforts on a fully configured satellite.
2.2. Structural Components
Based on the selected geometric shape of the satellite and its outer dimensions, a set of structural components were designed and assembled, as shown in the exploded view of the structural assembly given in Figure 2, fabricated from Aluminum 6061. In addition to the parts shown in Figure 2, a total of 444 titanium fasteners of various sizes were included to interconnect the various parts, along with 24 stainless steel 304 alloy fasteners to connect a Lightband separation ring, fabricated from Aluminum 7075, to the base plate.
A digital assembly model of the structure was constructed through three dimensional solid models of the structural components and fasteners, complete with the relevant materials assigned to each component as defined in the design. In order to ensure that the fasteners would not become loose due to vibrations, during both the launch and in-orbit operational phases of the lifetime of the satellite, they were locked into place using Heli-Coil inserts, as described in works by LaRocca et al. [49] and Rainville et al. [50], which were selected based on the sizes defined for each set of fasteners. The modeling software’s mass properties calculation routine gave the total mass of the fully assembled structure as 84.48 kg.
2.3. Implementation of the Metal Perforations
At this point in the development process, advanced materials would have been introduced into the structural design in order to reduce its relatively high structural mass to more acceptable values, hence decreasing its launch costs. However, following the stated goal of the current work to develop and employ an alternative method of mass reduction to the structural design, three of the structural components shown in Figure 2, namely the side plates, central box plates, and the middle plate, were modified by implementing metal perforation patterns onto them. This modification resulted in the removal of material from these components, reducing the total mass of the satellite as a result, while having as little adverse effect on the system’s modal characteristics as possible. These perforations also reduced the structure’s overall mechanical stiffness due to the removal of material. The current work’s metal perforation patterns were developed with parametric definitions in mind, in terms of:
- The method of defining the basic geometry of each pattern.
- The method that each pattern was to be defined and implemented onto the assigned areas upon each of the perforated components.
The basic design concept for implementing the metal perforation patterns in the current work was developed from the open isogrid pattern design concept that was introduced in the original work. This concept involved designating specific areas defined on the faces of the three structural components that were to be perforated, and then developing grids of square-shaped sub-areas, or unit areas, contained within these areas that would implement the actual metal perforations. Each of these sub-areas contained a single unit of the geometry that defined the pattern. A specific number of repetitions of this unit area, containing the perforation geometry, defined the full perforation pattern for that specific structural component.
The area of remaining material calculated for the original open isogrid patterns after implementation of the perforation shape geometries onto the three components was considered the target parameter while defining the shapes. This value was chosen to ensure consistency between the geometries.
Four perforation geometric shape alternatives, as shown in Figure 3, were developed: diamonds, hexagons, squares, and triangles. The parametric equations defining these shapes included trigonometric functions involving the angles within each geometric alternative, plus the lengths of the straight-line segments.
The aforementioned concept of taking the values of the areas of remaining material area for each of the three components from the original work meant that after taking into account the thickness of each of the three parts, equal unit volumes for all cases were the same. Consequently, the amount of mass removed from each of the three parts after implementing each part’s perforation patterns was the same across all cases.
The parametric equations defining the geometric patterns were based upon three overall geometric parameters, as shown in Figure 3:
- The overall width of each unit area, denoted by the symbol H.
- The overall height of each unit area, denoted by the symbol V.
- The thickness of the webs of the remaining material sub-area, denoted by symbol t.
Each unit area contained two sub-areas:
- One or more sub-areas that included voids resulting from the removal of material, providing open regions devoid of material within the unit areas.
- One sub-area that included the remaining material, which constituted, after taking into account the thickness of the plate that was being perforated, a unit volume of material.
These two sub-areas are shown in Figure 3, with the open regions in white and the remaining material in grey.
The dimensions of the unit areas were selected, for both the H and V parameters, such that these values ensured that the resulting perforation patterns would not include any fractional repetitions of the unit areas. Hence, the unit areas dimensions for each part were:
- The central box plate unit area: H = V = 50 mm.
- The middle plate unit area: H = V = 37.5 mm.
- The side plate unit area: H = V = 70 mm.
These dimensions were considered to be the 1.0 aspect ratio/full scaled unit area variation for each part in terms of the subsequent geometric parameter variations that will be presented in the following sections. Figure 4 shows a single central box plate, the middle plate, and a single side plate after implementing each of the geometric patterns, utilizing the dimensions of the unit areas given above.
Other shape alternatives were attempted, namely circular and elliptical shapes. However, these alternatives were found to produce relatively small values of remaining material web thicknesses, namely the parameter t mentioned above. These values would have caused significant fabrication problems due to their relatively small values. They would also have resulted in major stiffness problems when calculating modal characteristics, due to the reduced thicknesses of the webs of remaining material that resulted from the calculations. These reduced thicknesses would have caused localized stiffness problems in the form of local vibrational modes when the modal analyses were run. Thus, these types of perforation shape geometries were disregarded in the current work.
Implementing the process given above on each geometry resulted in cases where some of the geometries required more than one repetition of a particular shape in order for that particular pattern shape to meet the requirement of including the required value of remaining material. As a result, it can be seen from Figure 3 that the diamonds pattern required only one instance of the geometry without repetition, the hexagons pattern required two instances of the geometry, and both the squares and triangles required four instances of their respective geometries.
In order to define the design space considered in the current work, the overall unit area geometric parameters H and V, as given above, were changed to yield the variations in aspect ratio and scale factor shown in Figure 5.
The fact that the perforations were parametrically defined meant that they were scalable in terms of both the dimensions of the unit areas and the pattern geometries as well as in terms of the number of perforation unit areas. The scalability of the unit area numbers will be employed in Section 3.2 to tailor the fundamental natural frequency of the structural assembly towards a certain goal value, as an illustration of this scalability. Moreover, the parametric nature of the perforations leads to the fact that they are not locked, in terms of the areas of implementation, to the current structural design; they can be modified to cover any implementation area on any satellite structure. The modifications can involve the sizes of the implementation areas and hence the sizes of the perforation unit areas, and they can also involve changing the numbers of unit areas across a given implementation area, in tandem with changing the size of the implementation areas or independent from them.
The masses of the assembly for the baseline unperforated parts and the perforated cases were computed to be 84.48 kg and 62.42 kg, respectively. Hence, the reduction in mass that resulted from the perforation process proposed in the current work equaled 22.06 kg, a mass reduction percentage of 26.11% relative to the baseline unperforated case.
2.4. Mathematical Basis of Modal Analysis
The equation of motion for a multi-degree of freedom system (i.e., including more than one discrete mass) with free vibration and no damping is given in Equation (1).
where:
- {x} is N × 1 vector of the system’s displacements, with the () term implying a second derivative with respect to time.
- [M] is the system’s N × N symmetric mass matrix.
- [K] is the system’s N × N symmetric stiffness matrix.
The transformation from the physical to the modal space can be defined as follows:
where:
- is N × N underlying linear mode shapes.
- is N × 1 generalized modal coordinate.
Substituting Equation (2) and its respective second derivative into Equation (1) and pre-multiplying with the transpose matrix of yields
This conversion process is performed through utilizing a property that the system’s modes possess known as orthogonality, whereby a set of coupled physical systems are transformed into a set of uncoupled systems such that
where matrix and are the diagonal matrices with the size N×N. Hence, the natural frequency for any particular mode can be represented as follows:
Equation (5) will be heavily referenced in the following sections, regarding results and discussion.
2.5. Computational Modal Analysis (CMA) Methodology
As a starting point for the process, solid models of the single parts, both unperforated and perforated, were developed and included in assembled models of the structure. These assembled models also included the shared components that are common to all the cases (the base plate, upper plate, separation ring, the four side panels, and the fasteners that interconnect all the parts together). Solid models were chosen to model the components, instead of two-dimensional faces and shells, for two reasons. The first reason was due to the fact that the design included a large number of irregular shapes, especially the cross sections of the main frame of the satellite; it was decided that solid models could capture these irregular cross sections more accurately, without the need to simplify the geometries of the parts. The second reason was the intent to consider the bearing stresses imposed by the fasteners onto the various structural components, when eventual downstream dynamic analyses simulating the highly dynamic launch loads would be carried out in future works, and which will utilize the same carried-over finite element models.
In this work, the Nastran finite element solver was employed for all computational modal analyses, also known as normal modes analysis, which is a widely employed solver in the aerospace industry, such as in aircraft [51], rotorcraft [52], and spacecraft [33] analyses. The assembled models were meshed after defining the material properties of each constituent part. The analysis type was selected to be Nastran’s Normal Modes Analysis (Nastran Solution Type 103), employing the Block Lanczos modal calculation numerical method. For all analysis cases, the Nastran tetrahedral CTETRA solid element type was employed, with the quadratic option activated, that adds a mid-side node to each side activated, for a total of ten nodes per element. This option ensured that the element calculated stiffness in a reasonable manner.
Both the process of implementing Heli-Coil inserts to ensure that the fasteners would not become loose during the operation lifetime of the satellite, and also the process of mechanically assembling the structure through the use of the fasteners, was simulated through contact definitions between the parts and fasteners. These contact definitions employed the bonded contact method (sometimes called glued in some finite element solvers) to simulate the assembled nature of the structure. Hence, they prevented any relative motion between the parts themselves and between the parts and the fasteners while the structures underwent their mode shape deformations during the course of the analyses. Finally, fully clamped boundary conditions were applied to the lower face of the separation ring to calculate the modal characteristics of the structure while the satellite was in the launch configuration.
The final mesh density (dimensions of the individual finite elements) for the assembled structure analyses was achieved by conducting a mesh convergence study. Figure 6 shows a typical plot of the noted change in the fundamental frequency as a result of systematically decreasing the element size, hereby increasing the mesh density, after conducting a mesh convergence study for one of the cases in the current work. Figure 7 shows the converged finite element meshes for both the baseline unperforated case and a typical perforated case (the half scale triangles case is shown). The converged mesh for the baseline unperforated case included approximately 1 million 10-noded tetrahedral elements with approximately 1.95 million nodes. The element and node count for the converged mesh developed for the final perforated design will be given in a subsequent section.
2.5.1. Validation of Computational Methodology
Experimental modal analysis (EMA in the current work) was employed to validate the CMA methodology developed for implementation in the current work. EMA processes acquire the required modal results directly from physical specimens of the particular parts undergoing testing. The process involves acquiring vibration data, in the form of accelerations, from the physical models through accelerometers attached directly to them and processing this data by employing specialized analysis software to determine the modal characteristics. This process has been employed in works by Teter and Gawryluk [53], Nirmalkumar et al. [54], Ondra and Titurus [55], Donaldson and Mechefske [56], Shahgholian-Ghahfarokhi et al. [57], and many others to acquire modal data experimentally, both for primary modal analysis and for comparison with computational data.
When attempting to implement experimental modal analysis in the current work, the research team was hindered by the relatively high monetary cost of fabricating physical models of the structural components included in the design, both unperforated and perforated. The monetary budget available to the research team was inadequate to undertake such fabrication procedures. Thus, an alternate approach to performing EMA on physical models of all the cases was proposed and implemented. Instead of performing physical analyses of the various cases given above, as direct counterparts of the computational analyses detailed in the previous sections, it was decided that the computational methodology itself was to be validated. If this methodology could be validated, henceforth any computational results produced by this methodology could be considered reasonably valid.
A process was proposed towards validating the computational methodology which included fabricating a set of five single central box plates, one plate each for the baseline unperforated and each perforation pattern shape. The central box was selected for this process, instead of the other two perforated parts, due to the fact that the central box was the primary load-bearing structural component withstanding the dynamic loads imposed upon the structure at launch, and also because it was a major mounting structure for a large number of system components, including the imager [58]. These plates were scaled down to half the designed outer dimensions and also simplified by removing the upper and lower lips and simplifying the fastener holes. This scaling down and simplification process was done to bring the fabrication cost down to a manageable level within the available budget, and also to expedite the fabrication times. At the same time, the computational methodology given in Section 2.5 was implemented to produce natural frequencies and attendant mode shapes for the same five scaled down and simplified central box plates. The computational analyses were performed under free−free boundary conditions, to capture the plates’ inherent fundamental modal characteristics without the influence of external fixtures. Figure 8 shows the scaled down and simplified central box plates for the tested cases.
It was decided to implement the impact hammer technique, as described in works by Fadel Miguel et al. [59], Walunj Prashant et al. [60], Sharma [61], Siriguleng et al. [62], Boudjemai et al. [63], Arena et al. [52], Rosly et al. [64], and Mali [65], among others, to excite the modes of each plate as an impulse loading and also to implement four accelerometers to capture the induced vibrations in each plate. This decision was taken due to the relative ease with which an impact hammer testing setup could be arranged, especially for the testing of small physical models (instead of utilizing a vibration shaker) which require a more elaborate setup and are more suitable for the testing of larger models, as mentioned by Luczak et al. [66]. An impact hammer with a force sensor sensitivity of 1.1 mV/N was utilized to excite the plates in the EMA testing process, while four accelerometers, all of the same type and with sensitivities ranging from 10.17 to 10.49 mV/g, were employed to capture the dynamic responses of the plates. The four accelerometers were each placed at a corner of each plate so that they would not be located on a zero-node location, in terms of the modal displacement patterns computed for each model as described by Kammer and Tinker [67], Ostachowicz et al. [68], Feng and Jia [69], and Lin et al. [70], based upon a review of the computational mode shapes of each case and so that they could correctly capture the required fundamental mode. The plates were hung by a thin cord to the test stand from one fastener hole to simulate a free−free boundary condition imposed upon each plate. Finally, the impact hammer and the four accelerometers were connected to a data acquisition system, produced by Siemens LMS, type SCADAS Mobile, which in turn was connected to a computer for data logging and subsequent analysis within specialized software, the Siemens LMS Testlab Package. Figure 9 shows a general view of the test setup, as described, and also a view of the interface of the acquisition software that was utilized to capture the modal data.
A total of 70 hammer strike points were defined upon each of the five plates, distributed such that these strike points were located away from the outer edges of the plates. This number of strike points was seen to be required to characterize the acquired mode shapes in a better manner than if lower numbers were implemented, in terms of the averaging process integral to the EMA data acquisition process; furthermore, it was required to acquire sufficiently detailed modal information to ensure that no local modes developed in the plates, within the frequency range the current work was interested in, would be undetected. The same strike point map was implemented on all five plates; the points were designed to fall at the nodes joining the corners of the perforation unit areas. Figure 10 shows the hammer strike points for the EMA measurement points.
Due to the fact that physical specimens of the plates, both baseline unperforated and perforated, were to be fabricated, the chance was taken to compare the masses of each plate, for each case, with its computational counterpart. This would validate the masses calculated for the computational parts and lend their mass calculation results a higher level of confidence that they would be reasonably close to their masses had they been physically fabricated. This confidence level could then be carried over to the mass calculations of the fully assembled structure, for each case. The masses of the physical models were measured by a precision scale.
It was decided to expand the number of modes that were to be considered in the validation process, in terms of their natural frequencies, to six modes, in order to include the first three bending and first three torsional modes instead of depending upon the fundamental mode only. This gave a more complete picture of the correlation between the acquired and computed result sets, from the EMA and CMA processes respectively.
In terms of correlating the mode shapes attendant to the six modes, to provide a complete correlation picture, a method known as the modal assurance criterion (MAC) statistical comparison method was utilized in the current work to compare the experimental and computational mode shapes. This method was sufficiently summarized by Pastor et al. [71] and Allemang [72] and was also employed by Greś [73], Altunışık et al. [74], Wagih et al. [75], Yan et al. [76], Arena et al. [52], and others to compare mode shapes. The method involves calculating numerical correlation indices, with these indices arranged on the diagonal terms of MAC matrices, giving the correlation between the experimental and computational mode shapes. The main correlation results were on the diagonals of the matrices in an increasing layout. A value close to unity denoted a high degree of correlation, whereas a value close to zero denoted almost no correlation. The MAC matrices were computed through Equation (6):
where {φEMA} and {φCMA} are the eigenvectors (the displacements of each measurement point of the respective model while the model undergoes the overall mode shape deformation) for the EMA and CMA models, respectively, and r and q represent the notations of the constituent elements of each eigenvector. This correlation method was utilized in the current work instead of performing a less accurate, subjective visual comparison between the mode shapes because numerical results confirming a relatively high degree of correlation between the two sets of results were considered to be of higher importance in the overall validation process than mere visual mode shape deformation patterns.
2.5.2. Experimental Modal Analysis Results and Discussion
As mentioned above, the EMA results acquired from the physical models in the current work included three results sets: (1) the first six natural frequencies acquired for each case, (2) the attendant mode shapes, and (3) the measured mass of each plate. The decision to validate the current work’s computational methodology, and by extension the computational results given in Section 3, depended upon the comparison between the experimental and computational results for each of the result sets. Six modes were considered for the EMA and CMA processes, instead of only the fundamental mode, to increase the correlation data sets, which yielded more accurate comparisons. Table 1 gives the percentage difference between the first six EMA and CMA natural frequencies. Knowing that the percentage difference values were calculated taking the EMA values as the reference values, the positive and negative values of the percentage values indicate whether the computed CMA values were larger (positive) or smaller (negative) than those acquired by the EMA process. Table 2 gives the MAC matrices.
A review of the result sets given in Table 1 showed a maximum percentage difference of less than 5%, whereas the correlation indices given in the MAC matrices of Table 2 were all significantly higher than 0.9, which indicated high levels of correlation between the mode shapes originating from the EMA and CMA processes. Moreover, comparisons between the masses measured from the physical models and computed for the computational models indicated a maximum percentage difference, across all cases, of only 2.64%. Hence, it was seen that the current work’s computational methodology was reasonably validated, and that there was a reasonably high level of confidence that the computational results would have been reproduced to a large degree had physical models of the cases been fabricated.
2.5.3. Quasi-Static Launch Load Analysis
The final step performed in the current work was to impose one of the expected launch loads onto the finalized design and compute both its total displacement and the Von Mises stress levels that developed within the structure, hence also computing the margin of safety (MoS) for the design. This was done to investigate the response of the finalized perforated design to one of the types of dynamic loading environments that the satellite would experience within its operational lifetime and hence investigate whether the structural design reached the yield stress of Aluminum 6061, since this material comprised the majority of the structural design and the components fabricated from it would support the expected payload placed inside the structure. As mentioned previously in Section 2.1, the satellite’s payload was meant to be an Earth observation imaging system, and this payload must be placed onto its mounting locations very accurately to minimize any geometric distortions in the images produced; thus, any yielding in the material supporting the imaging payload would hence disrupt the mounting accuracy of the payload, leading to distorted images and a mission failure. As an additional method to compare the performance of the finalized perforated design, relative to that of the baseline unperforated design, the same dynamic launch load was also imposed upon the baseline unperforated structure, and the displacements and Von Mises stresses developing within the two designs was compared.
The dynamic launch load selected for simulation in the current work was the quasi-static loading. This type of dynamic loading is generated during launch due to the nearly constant acceleration of the launch vehicle during its ascent from the launch pad to orbit. Every launcher has its own dynamic loading environment; thus, in the current work, the value of quasi-static loading was taken from the mission planning guide published by Spaceflight, Inc. cited previously, one of the leading launch service providers currently in operation, and dealing with multiple launchers based upon the size of the satellite being launched and the availability of suitable launchers for that satellite.
The Spaceflight, Inc. mission planning guide [4] gives a limit load (i.e., the maximum expected load that will be imposed upon the satellite during launch) of 10 g in all directions (10 times the standard acceleration constant on Earth, g = 9.81 m/s2), i.e., 98.1 m/s2 for a microsatellite with a mass less than 100 kg. However, this loading value cannot be imposed directly onto the satellite, since it must be multiplied by a number of design and safety factors. Knowing that the current design is still conceptual, it can be considered relatively immature in terms of the eventual space-worthy system. Hence, only the two factors given below were applied to it in the current work—those related to the uncertainties of the relatively early stages of the design—and future works will consider more advanced design factors related to testing and qualification when the design is at a more mature level.
Table 3 gives factors drawn from the ECSS standard concerning structural factors of safety for space hardware (ECSS-E-ST-32-10C Rev.1) [77]. The values of these factors were chosen as being conservative due to the uncertainty of the various criteria.
The design factor is the product of the multiplication of these three factors:
Hence, the axial and lateral design limit loads, including the calculated design factor DF, were:
ADLL = 98.1 × 1.44 = 141.264 m/s2
LDLL = 98.1 × 1.44 = 141.264 m/s2
Following this, the “design yield load” was computed, through multiplying the design limit loads by the yield factor of safety, (FOSY). The loads will be subsequently applied to the model and the resulting stresses, known as the “Design Yield Stress”. The value of FOSY was taken as 1.25 from the ECSS standard given above, even though they may be more conservative than the ones given by the launch vehicle user manuals, but this will give a higher confidence in the capability of the design to withstand all the loads it will undergo.
Thus,
Axial Yield Design Load = ADLL × FOSY = 141.264 × 1.25 = 176.58 m/s2
Lateral Yield Design Load = LDLL × FOSY = 141.264 × 1.25 = 176.58 m/s2
The values of both the axial and lateral yield design loads were imposed upon the finalized perforated design to compute its maximum displacement and maximum Von Mises stress values. Furthermore, these same loadings were imposed upon the baseline unperforated design to investigate the effect of the perforated design on the structural performance of the structure.
As an additional check of the structural design’s capacity to withstand the quasi-static loads imposed during launch, the Margin of Safety (MoS) for the structure was calculated for the highest value of Von Mises stress that developed in the perforated case, which was in the lateral loading case. The MoS was computed according to the following equation:
3. Results and Discussion
After having validated the computational methodology presented in Section 2.5, it was deemed acceptable to proceed with utilizing it to compute the current work’s main result sets. Therefore, the current section gives the results computed for the assembled cases that were analyzed in the first design iteration of the current work, which included the baseline unperforated and perforated parts, in their various cases, and culminates in the selection of the best pattern geometry and parametric variation. It subsequently presents the process of improving the FNF for the selected case in the final design iteration.
3.1. Preliminary FNF Results
Table 4 gives a summary of the fundamental natural frequencies and mode shapes computed for all the assembled structure cases, for both the baseline unperforated case and all perforated cases.
A review of the results given in Table 4 leads to the following observations:
- The effect of the ratio between modal stiffness and modal mass given in Equation (5) was noted. Removing material in the perforated cases affected both the modal stiffness and modal mass in the aforementioned ratio. However, as seen in the calculated values of FNF, the perforation process caused a larger reduction in modal stiffness than that caused in modal mass, causing reductions of FNF for all cases of the perforated structure relative to the baseline unperforated structure.
- The highest value of FNF for the perforated cases occurred for the half scale triangles case relative to that calculated for the unperforated case. The percentage reduction between this perforation case and the baseline unperforated case was 7.00%.
- A review of the mode shapes shows a uniform modal deformation pattern for all cases, a rotational motion around either the global X or Y axes, or a combination of the two (a rocking motion). This variation in axes was determined to be a result of the specific stiffness distribution for each specific case. Moreover, for all cases, a secondary out-of-plane bending of the side plates (a bulging motion) was noted.
The half scale triangles perforation case was selected as the best perforation case, since its computed FNF was the highest among all the others and was the closest to that computed for the baseline unperforated case. However, further improvement of the perforated FNF of the half scale triangles was required to match its FNF to that of the baseline unperforated case.
3.2. Refinement of FNF Results
The 7.00% decrease in FNF for the half scale triangles case, relative to the baseline unperforated case, indicated a potential to improve the FNF further through minimizing the aforementioned percentage difference as much as possible. It was determined that the improvement process would involve finding an optimum number of repetitions of the perforation unit areas implemented upon one or more of the perforated components towards changing the total mass and total stiffness values of the structural assembly. This would result in increasing the FNF of the half scale triangles case to match that computed for the baseline unperforated case as closely as possible.
The first step of the improvement process was to identify the component or components that had the greatest influence on the FNF of the perforated structural assembly. This identification process was achieved by modifying the baseline unperforated assembly through changing only one of the three unperforated components into its perforated counterpart and keeping the other two components unperforated. Hence, the FNF of the assembly was computed along with its attendant mode shape. The process was repeated for another of the three components, changing the other two back to their unperforated versions. The results of this process are given in Table 5, noting that the FNF for the baseline unperforated case was 113.93 Hz, with a total mass of 84.48 kg.
A review of the values of FNF given in Table 5 yielded the following observations:
- The total mass values indicated that the case with the perforated middle plate had the least effect on the reduction of system mass, followed by the four perforated central box plates, and the eight perforated side plates resulted in the most reduction in mass.
- The least change in FNF was computed for the perforated middle plate case. This indicated that perforating the middle plate had the least influence on the results, so this case was disregarded from further consideration.
- It was seen that perforating the central box plates reduced the FNF, whereas perforating the eight side plates increased the computed FNF. These variations came from the variation in total mass and total stiffness for the system as given in Equation (5), with the effect of total stiffness being more pronounced than that of total mass in the central box plates case and the opposite for the side plates case. Because the central box assembly played a critical role in withstanding the external loads imposed upon the assembled structure, the importance of its total stiffness played a decisive role in its structural performance. In contrast, the side plates had a relatively small structural role to play in the system’s structural performance. This reasoning contributed to the decision to focus exclusively on the central box plates in another work previously published by the current authors with others [46].
Further to point 3 above, it must be mentioned that the FNF value given for the fully perforated case is in fact composed of the contributions of the values of FNF for each of the three perforated components. Based upon this concept of contributions, the relative influence of each component can be inferred by reviewing the values given in Table 5 for each of the three components, when the assembly contained only that particular component in its perforated form, with the other two being unperforated. Hence, it can be seen that the middle plate and eight side plates added to the overall value of FNF for the fully perforated assembly, being higher in value, for both cases, than that of the baseline unperforated case. However, their additive influence could not compensate for the relatively stronger subtractive influence of the central box plates on the overall FNF for the fully perforated case. This led to the decision to focus solely on the central box plates in the second step of the FNF improvement process, which was achieved through changing the number of perforations imposed upon the central box plates until the desired value of FNF was reached. Thus, a design space was constructed that included defining 12 variations in the numbers of unit area repetitions for the two perforation regions defined on each plate, above and below the location of connections to the middle plate. Table 6 summarizes this design space as well as the computed FNF values resulting from the implementation of this design space upon the four central box plates.
The 8 × 12 unit area repetitions were the ones implemented during the earlier phases of the work; hence, they were considered the starting point of the improvement process. After reviewing the computed results across the design space, as given in Table 6, the 5 × 12 case was chosen as the best case since its computed FNF was the closest to that computed for the baseline unperforated case. Figure 11 shows both the original 8 × 12 and the final 5 × 12 unit area repetition cases.
The numbers of finite element nodes and elements for the converged mesh of the 5 × 12 design, implemented to compute the FNF value given in Table 6, were approximately 1.32 million 10-noded tetrahedral elements, including approximately 2.27 million nodes.
The computed FNF for the 5 × 12 case was slightly higher than that computed for the baseline unperforated case (namely 113.93 Hz), with a percentage difference of +0.16%, and the total system mass for the selected case was computed to be 64.92 kg, with a percentage reduction of 23.15% relative to the total mass of the baseline unperforated case.
3.3. Modal Characteristics Comparisons
Table 7 provides the visualizations of the mode shapes and their corresponding natural frequency between the baseline unperforated and the final perforated design. Table 8 tabulates their effective modal mass fractions, which indicates the percentage of the influence of the total mass in each degree of freedom direction. These results were presented in order to investigate the degree of change in modal characteristics caused by implementing the perforated design when compared with its baseline unperforated counterpart.
From the results given in both Table 7 and Table 8, it can clearly be seen that the mode shapes were more or less similar, with a mode swap noted between modes 3 and 4. These similarities could also be deduced from the values of the effective modal mass fractions, which indicated a similar trend. Apart from this, it can be seen that the first two modes were in the form of global modes of the system, where the whole structure was in motion. However, for the rest of the considered modes, the displacements of the mode shapes were only prominent on the side panels of the satellite structural component. These changes in mode shape displacements can also be deduced from the effective modal mass fractions values, which indicate a higher degree of fraction for the first two modes as compared with others.
Even though the unperforated concept was designed with its fundamental natural frequency to be as close as possible (if not similar) to its baseline unperforated counterpart, their differences in natural frequency were noticeable at much higher order modes. Note that for mode 2, the natural frequency for the perforated design was slightly higher than its corresponding unperforated baseline counterpart, thus demonstrating that the perforation concept enables a positive influence on this particular mode. On the other hand, a negative influence can be seen for the remaining considered modes, whereby their natural frequencies were significantly reduced when compared with the baseline unperforated counterpart. Besides, it is also noticeable that the natural frequencies of these modes were getting closer to each other.
Overall, the proposed perforated concept resulted in a minimal impact in terms of its overall characteristics of the mode shape when compared with its baseline counterpart. Nevertheless, differences in natural frequencies should be expected due to the change in mass and stiffness distribution imposed by the perforated concept.
3.4. Quasi-Static Load Analysis Results
Table 9 shows the contours of the maximum displacements for both the baseline unperforated and finalized perforated cases for three quasi-static loading directions: longitudinal along the -Z direction and lateral along the -X and -Y directions, while Table 10 gives a summary of the quasi-static loading analysis results.
A review of the values of the contours and results shown in Table 9 and Table 10 gave a number of observations. The displacement contours resulting from the longitudinal loading case clearly illustrate the critical role that the central box plays in terms of being the primary load-bearing structural component, as mentioned before in the current work. It is very clear that its displacement in the vertical direction is very small relative to the displacements of the other components, such as the upper plate connected to it.
The critical structural role of the central box in resisting the longitudinal load was also very clear in the Von Mises stress contour, where the maximum stresses developed on the upper plate in locations directly above the corners of the central box clearly indicate what was mentioned in the first observation above, namely that the central box’s displacement was much lower than that of the other structural components; hence, stress buildup was higher in the upper plate. On the other hand, the relatively large bulging noted in the side plates, especially the lower side plates, indicated that they were the weakest structural component in the design and hence cannot be relied upon to act as mounting surfaces for any subsystem components in future subsystem component distributions. It was noted that the values of displacement for all loading cases were never higher than 0.5 mm, which was encouraging, especially when viewed with the goal of not developing any large deformations in the structure, as mentioned earlier in the current work.
Reviewing the displacement contours of the lateral loading cases, it can clearly be noted that the symmetry of the design in the X-Z and Y-Z planes resulted in almost identical displacements of the structure. These displacements reflected the fact that the clamping of the lower face of the separation ring caused the structure to respond to the lateral loadings as a cantilever structure. This cantilever type response was also noted in the Von Mises stress contours, since the maximum stress values developed in the base plate in locations adjacent to the lower end of the central box. Due to the aforementioned fact that the central box was the strongest structural component of the design, this led to the base plate being squeezed in these corner locations, hence developing the high stress concentrations.
It was also noted that the highest values of Von Mises stress were still lower than the yield stress of Aluminum 6061, with a value of 2.76 × 10⁸ N/m2. Knowing that the loadings in all cases were deliberately conservative and hence would never be experienced by the satellite to its full extent during launch, it was seen that the current work’s structural design, despite the presence of the perforations, was successful in withstanding the quasi-static loading conditions that would be imposed upon it during launch.
Knowing that the loading value was conservative, the actual loading experience by the satellite would thus be less than that imposed upon it in the current work after the design had matured, and the values of the MoS given in Table 10 were considered encouraging since all the values were more than zero. It must be noted here that the MoS values computed for the final perforated design were markedly higher than those computed for the baseline unperforated case, indicating that for the baseline unperforated case, the design was not optimum and had a relatively large capacity for improvement. Even though the MoS values for the final perforated case were all higher than those for the baseline unperforated case, indicating a higher capacity to withstand loading, further improvement of the perforated design would further improve its structural performance significantly, thus providing a potential direction of research for further works. In a related observation, the comparison between the maximum displacements and Von Mises stresses that developed in the baseline unperforated and final perforated designs clearly showed reduced levels of both in the final perforated design cases for all loading directions. This was attributed to the fact that the perforated design had less mass than the baseline unperforated design, and hence the inertial effects of the mass on the structure were lower.
4. Conclusions
As a conclusion, the proposed perforated satellite design concept enabled a significant percentage reduction in mass of more than 20% when compared to the baseline unperforated case. This was deemed to be very favorable as their fundamental natural frequencies were almost matched in value. Further to this, the findings from the dynamic loading analyses showed that the final perforated design outperformed its baseline unperforated counterpart with respect to the maximum displacements, maximum Von Mises stresses, and the computed margin of safety. Hence, the proposed perforation concept was considered validated and very encouraging, thereby providing an opportunity for a low-cost and reduced mass satellite structural design to be realized.
Author Contributions
Research investigation and draft preparation, S.D.S.D.; project administration, funding acquisition, and supervision, M.Y.H.; manuscript review and co-supervision, A.S.M.H. All authors have read and agreed to the published version of the manuscript.
Funding
This research work was funded by Universiti Putra Malaysia (UPM), Selangor, Malaysia through research grant number GP-IPS-9536500.
Data Availability Statement
Not applicable.
Acknowledgments
The authors acknowledge the support from Universiti Putra Malaysia (UPM), Selangor, Malaysia, on the research effort for the current work through research grant GP-IPS-9536500. The authors also acknowledge the help of Nur Asyikin Rosly during the experimental modal analysis phase of the work.
Conflicts of Interest
The authors declare no conflict of interest in the current work.
References
- Drenthe, N.T.; Zandbergen, B.T.C.; Curran, R.; van Pelt, M.O. Cost Estimating of Commercial Smallsat Launch Vehicles. Acta Astronaut. 2019, 155, 160–169. [Google Scholar] [CrossRef]
- Jones, H.W. The Future Impact of Much Lower Launch Cost. In Proceedings of the 48th International Conference on Environmental Systems, Albuquerque, NM, USA, 8–12 July 2018; pp. 1–11. [Google Scholar]
- Jones, H.W. The Recent Large Reduction in Space Launch Cost. In Proceedings of the 48th International Conference on Environmental Systems, Albuquerque, NM, USA, 8–12 July 2018. [Google Scholar]
- Spaceflight, Inc. Spaceflight Mission Planning Guide; Spaceflight, Inc.: Seattle, WA, USA, 2019. [Google Scholar]
- García-Pérez, A.; Sanz-Andrés, Á.; Alonso, G.; Chimeno Manguán, M. Dynamic Coupling on the Design of Space Structures. Aerosp. Sci. Technol. 2019, 84, 1035–1048. [Google Scholar] [CrossRef]
- Fakoor, M.; Mohammad Zadeh, P.; Momeni Eskandari, H. Developing an Optimal Layout Design of a Satellite System by Considering Natural Frequency and Attitude Control Constraints. Aerosp. Sci. Technol. 2017, 71, 172–188. [Google Scholar] [CrossRef]
- Sweeting, M.N. Modern Small Satellites-Changing the Economics of Space. Proc. IEEE 2018, 106, 343–361. [Google Scholar] [CrossRef]
- Kramer, H.J.; Cracknell, A.P. An Overview of Small Satellites in Remote Sensing. Int. J. Remote. Sens. 2008, 29, 4285–4337. [Google Scholar] [CrossRef]
- Xue, Y.; Li, Y.; Guang, J.; Zhang, X.; Guo, J. Small Satellite Remote Sensing and Applications-History, Current and Future. Int. J. Remote Sens. 2008, 29, 4339–4372. [Google Scholar] [CrossRef]
- Lim, J.; You, C.; Dayyani, I. Multi-Objective Topology Optimization and Structural Analysis of Periodic Spaceframe Structures. Mater. Des. 2020, 190, 108552. [Google Scholar] [CrossRef]
- Viviani, A.; Iuspa, L.; Aprovitola, A. Multi-Objective Optimization for Re-Entry Spacecraft Conceptual Design Using a Free-Form Shape Generator. Aerosp. Sci. Technol. 2017, 71, 312–324. [Google Scholar] [CrossRef]
- Cho, H.K.; Rhee, J. Vibration in a Satellite Structure with a Laminate Composite Hybrid Sandwich Panel. Compos. Struct. 2011, 93, 2566–2574. [Google Scholar] [CrossRef]
- Kuo, J.C.; Hung, H.C.; Yang, M.Y.; Chen, C.R.; Lin, J. Composite Materials Application on FORMOSAT-5 Remote Sensing Instrument Structure. Terr. Atmos. Ocean. Sci. 2017, 28, 157–165. [Google Scholar] [CrossRef] [Green Version]
- Zhengchun, D.; Mengrui, Z.; Zhiguo, W.; Jianguo, Y. Design and Application of Composite Platform with Extreme Low Thermal Deformation for Satellite. Compos. Struct. 2016, 152, 693–703. [Google Scholar] [CrossRef]
- Kwon, S.-C.; Son, J.-H.; Song, S.-C.; Park, J.-H.; Koo, K.-R.; Oh, H.-U. Innovative Mechanical Design Strategy for Actualizing 80 Kg-Class X-Band Active SAR Small Satellite of S-STEP. Aerospace 2021, 8, 149. [Google Scholar] [CrossRef]
- Centea, T.; Nutt, S.R. Manufacturing Cost Relationships for Vacuum Bag-Only Prepreg Processing. J. Compos. Mater. 2016, 50, 2305–2321. [Google Scholar] [CrossRef]
- Lester, C.; Nutt, S. Composite Materials: Advantages and Cost Factors; Los Angeles, California, USA, 2018; Available online: https://www.semanticscholar.org/paper/Composite-Materials%3A-Advantages-and-Cost-Factors-Lester-Nutt/5215db8142f705cf87cd760774177c98c4809948#paper-header (accessed on 25 August 2021).
- Anwar, A.; Albano, M.; Hassan, G.; Delfini, A.; Volpini, F.; Marchetti, M.; Elfiky, D. Vacuum Effect on Spacecraft Structure Materials. Int. Conf. Aerosp. Sci. Aviat. Technol. 2015, 16, 1–10. [Google Scholar] [CrossRef]
- Shama Rao, N.; Simha, T.G.A.; Rao, K.P.; Ravi Kumar, G.V.V. Carbon Composites Are Becoming Competitive and Cost Effective. Exter. Doc. 2018. Available online: https://www.infosys.com/engineering-services/white-papers/documents/carbon-composites-cost-effective.pdf (accessed on 25 August 2021).
- Yüksel, G.; Okan, A.; Leloǧlu, U.M. First LEO Satellite Built in Turkey: RASAT. In Proceedings of the 3rd International Conference on Recent Advances in Space Technologies, RAST 2007, Istanbul, Turkey, 14–16 June 2007; pp. 78–82. [Google Scholar] [CrossRef]
- Borgue, O.; Müller, J.; Leicht, A.; Panarotto, M.; Isaksson, O. Constraint Replacement-Based Design for Additive Manufacturing of Satellite Components: Ensuring Design Manufacturability through Tailored Test Artefacts. Aerospace 2019, 6, 124. [Google Scholar] [CrossRef] [Green Version]
- Cunningham, S.M.; Tanner, D.A.; Clifford, S.; Butan, D.; Southern, M. Effect of Perforations on Resonant Modes of Flat Circular Plates. In Key Engineering Materials; Trans Tech Publications Ltd.: Freienbach, Switzerland, 2020; Volume 865, pp. 31–35. [Google Scholar]
- Abdelrahman, A.A.; Eltaher, M.A.; Kabeel, A.M.; Abdraboh, A.M.; Hendi, A.A. Free and Forced Analysis of Perforated Beams. Steel Compos. Struct. 2019, 31, 489–502. [Google Scholar] [CrossRef]
- Ghonasgi, K.; Bakal, K.; Mali, K.D. A Parametric Study on Free Vibration of Multi-Perforated Rectangular Plates. Procedia Eng. 2016, 144, 60–67. [Google Scholar] [CrossRef] [Green Version]
- Jeong, K.H.; Jhung, M.J. Free Vibration Analysis of Partially Perforated Circular Plates. Procedia Eng. 2017, 199, 182–187. [Google Scholar] [CrossRef]
- Almitani, K.H.; Abdelrahman, A.A.; Eltaher, M.A. Influence of the Perforation Configuration on Dynamic Behaviors of Multilayered Beam Structure. Structures 2020, 28, 1413–1426. [Google Scholar] [CrossRef]
- Sun, D.G.; Guo, J.J.; Song, Y.; Yan, B.J.; Li, Z.L.; Zhang, H.N. Flutter Stability Analysis of a Perforated Damping Blade for Large Wind Turbines. J. Sandw. Struct. Mater. 2019, 21, 973–989. [Google Scholar] [CrossRef]
- Formisano, A.; Lombardi, L.; Mazzolani, F.M. Perforated Metal Shear Panels as Bracing Devices of Seismic-Resistant Structures. J. Constr. Steel Res. 2016, 126, 37–49. [Google Scholar] [CrossRef] [Green Version]
- Sailesh, R.; Yuvaraj, L.; Pitchaimani, J.; Doddamani, M.; Mailan Chinnapandi, L.B. Acoustic Behaviour of 3D Printed Bio-Degradable Micro-Perforated Panels with Varying Perforation Cross-Sections. Appl. Acoust. 2021, 174, 107769. [Google Scholar] [CrossRef]
- Millan, R.M.; von Steiger, R.; Ariel, M.; Bartalev, S.; Borgeaud, M.; Campagnola, S.; Castillo-Rogez, J.C.; Fléron, R.; Gass, V.; Gregorio, A.; et al. Small Satellites for Space Science: A COSPAR Scientific Roadmap. Adv. Space Res. 2019, 64, 1466–1517. [Google Scholar] [CrossRef]
- International Standardization Organization ISO 17770:2017(En) Space Systems—Cube Satellites (CubeSats), Geneva, Switzerland, 2017. Available online: https://www.iso.org/standard/60496.html (accessed on 25 August 2021).
- CalPoly. Cubesat Design Specification; California Polytechnic State University: San Luis Obispo, CA, USA, 2009; Volume 8651. [Google Scholar]
- Park, Y.-K.; Kim, G.-N.; Park, S.-Y. Novel Structure and Thermal Design and Analysis for CubeSats in Formation Flying. Aerospace 2021, 8, 150. [Google Scholar] [CrossRef]
- Bhattarai, S.; Go, J.-S.; Kim, H.; Oh, H.-U. Development of a Novel Deployable Solar Panel and Mechanism for 6U CubeSat of STEP Cube Lab-II. Aerospace 2021, 8, 64. [Google Scholar] [CrossRef]
- Jin, Y.; Shi, Y.; Yu, G.C.; Wei, G.T.; Hu, B.; Wu, L.Z. A Multifunctional Honeycomb Metastructure for Vibration Suppression. Int. J. Mech. Sci. 2020, 188, 105964. [Google Scholar] [CrossRef]
- Wagih, A.M.; Hegaze, M.M.; Kamel, M.A. FE Modeling of Satellite’s Honeycomb Sandwich Panels Using Shell Approach and Solid Approach. In Proceedings of the AIAA SPACE and Astronautics Forum and Exposition, SPACE 2017, Orlando, FL, USA, 12–14 September 2017. [Google Scholar]
- Ontaç, S.; Daǧ, S.; Gökler, M.I. Structural Finite Element Analysis of Stiffened and Honeycomb Panels of the RASAT Satellite. In Proceedings of the 3rd International Conference on Recent Advances in Space Technologies, RAST 2007, Istanbul, Turkey, 14–16 June 2007; pp. 171–175. [Google Scholar]
- Salem, H.; Boutchicha, D.; Boudjemai, A. Modal Analysis of the Multi-Shaped Coupled Honeycomb Structures Used in Satellites Structural Design. Int. J. Interact. Des. Manuf. 2018, 12, 955–967. [Google Scholar] [CrossRef]
- Slimane, S.; Kebdani, S.; Boudjemai, A.; Slimane, A. Effect of Position of Tension-Loaded Inserts on Honeycomb Panels Used for Space Applications. Int. J. Interact. Des. Manuf. 2018, 12, 393–408. [Google Scholar] [CrossRef]
- Wei, J.; Cao, D.; Wang, L.; Huang, H.; Huang, W. Dynamic Modeling and Simulation for Flexible Spacecraft with Flexible Jointed Solar Panels. Int. J. Mech. Sci. 2017, 130, 558–570. [Google Scholar] [CrossRef]
- Liu, L.; Wang, X.; Sun, S.; Cao, D.; Liu, X. Dynamic Characteristics of Flexible Spacecraft with Double Solar Panels Subjected to Solar Radiation. Int. J. Mech. Sci. 2019, 151, 22–32. [Google Scholar] [CrossRef]
- Chan, Y.N.; Harmin, M.Y.; Othman, M.S. Parametric Study of Varying Ribs Orientation and Sweep Angle of Un-Tapered Wing Box Model. Int. J. Eng. Technol. 2018, 7, 155–159. [Google Scholar] [CrossRef]
- Tsiatas, G.C.; Charalampakis, A.E. Optimizing the Natural Frequencies of Axially Functionally Graded Beams and Arches. Compos. Struct. 2017, 160, 256–266. [Google Scholar] [CrossRef]
- Muc, A. Natural Frequencies of Rectangular Laminated Plates-Introduction to Optimal Design in Aeroelastic Problems. Aerospace 2018, 5, 95. [Google Scholar] [CrossRef] [Green Version]
- Dawood, S.D.S.; Inayatullah, O.B.; Samin, R.B. Computational Study of the Effect of Using Open Isogrids on the Natural Frequencies of a Small Satellite Structure. Acta Astronaut. 2015, 106, 120–138. [Google Scholar] [CrossRef]
- Dawood, S.D.S.; Harmin, M.Y.; Harithuddin, A.S.M.; Ciang, C.C.; Rafie, A.S.M. Computational Study of Mass Reduction of a Conceptual Microsatellite Structural Subassembly Utilizing Metal Perforations. J. Aeronaut. Astronaut. Aviat. 2021, 53, 57–66. [Google Scholar] [CrossRef]
- Aborehab, A.; Kassem, M.; Farid Nemnem, A.; Kamel, M.; Kamel, H. Configuration Design and Modeling of an Efficient Small Satellite Structure. Eng. Solid Mech. 2020, 8, 7–20. [Google Scholar] [CrossRef]
- Fajardo, I.; Lidtke, A.A.; Bendoukha, S.A.; Gonzalez-Llorente, J.; Rodríguez, R.; Morales, R.; Faizullin, D.; Matsuoka, M.; Urakami, N.; Kawauchi, R.; et al. Design, Implementation, and Operation of a Small Satellite Mission to Explore the Space Weather Effects in LEO. Aerospace 2019, 6, 108. [Google Scholar] [CrossRef] [Green Version]
- LaRocca, D.M.; Kaaret, P.; Kirchner, D.L.; Zajczyk, A.; Robison, W.; Johnson, T.E.; Jahoda, K.M.; Fuelberth, W.; Gulick, H.C.; McCurdy, R.; et al. Design and Construction of the X-Ray Instrumentation Onboard the HaloSat CubeSat. J. Astron. Telesc. Instrum. Syst. 2020, 6, 014003. [Google Scholar] [CrossRef]
- Rainville, E.; Wagner, J.; Whitesel, P. Final Design Report Deployable Cover for CubeSat FUV Imager. California Polytechnic State University, 2019. Available online: https://core.ac.uk/download/pdf/286031374.pdf (accessed on 25 August 2021).
- Arena, M.; Nagel, C.; Pecora, R.; Schorsch, O.; Concilio, A.; Dimino, I. Static and Dynamic Performance of a Morphing Trailing Edge Concept with High-Damping Elastomeric Skin. Aerospace 2019, 6, 22. [Google Scholar] [CrossRef] [Green Version]
- Arena, M.; Chiariello, A.; Castaldo, M.; Palma, L. di Vibration Response Aspects of a Main Landing Gear Composite Door Designed for High-Speed Rotorcraft. Aerospace 2021, 8, 52. [Google Scholar] [CrossRef]
- Teter, A.; Gawryluk, J. Experimental Modal Analysis of a Rotor with Active Composite Blades. Compos. Struct. 2016, 153, 451–467. [Google Scholar] [CrossRef]
- Nirmalkumar, G.; Kumar, C.V.S.; Venkatesh, S. Experimental Modal Analysis of Compressor Rotor Blades. AIP Conf. Proc. 2020, 2311, 030010. [Google Scholar]
- Ondra, V.; Titurus, B. Theoretical and Experimental Modal Analysis of a Beam-Tendon System. Mech. Syst. Signal Process. 2019, 132, 55–71. [Google Scholar] [CrossRef]
- Donaldson, I.A.; Mechefske, C.K. Experimental Modal Analysis of Business Jet Fuselage Tail Section Subassemblies. In Proceedings of the ASME Design Engineering Technical Conference, 17–19 August 2020; American Society of Mechanical Engineers (ASME): New York, NY, USA, 2020; Volume 7. [Google Scholar]
- Shahgholian-Ghahfarokhi, D.; Rahimi, G.; Zarei, M.; Salehipour, H. Free Vibration Analyses of Composite Sandwich Cylindrical Shells with Grid Cores: Experimental Study and Numerical Simulation. Mech. Based Des. Struct. Mach. 2020, 1–20. [Google Scholar] [CrossRef]
- Dawood, S.D.S. Effect of Implementing Open Isogrid Patterns on Modal Characteristics of a Conceptual Small Satellite Design. Master’s Thesis, Faculty of Engineering, Universiti Putra Malayisa, Seri Kembangan, Malaysia, 2016. [Google Scholar]
- Fadel Miguel, L.F.; Fadel Miguel, L.F.; Kern Thomas, C.A. Theoretical and Experimental Modal Analysis of a Cantilever Steel Beam with a Tip Mass. Proc. Inst. Mech. Eng. Part C J. Mech. Eng. Sci. 2009, 223, 1535–1541. [Google Scholar] [CrossRef]
- Walunj Prashant, S.; Chougule, V.N.; Mitra, A.C. Investigation on Modal Parameters of Rectangular Cantilever Beam Using Experimental Modal Analysis. Mater. Today Proc. 2015, 2, 2121–2130. [Google Scholar] [CrossRef]
- Sharma, J.K. Theoretical and experimental modal analysis of beam. In Lecture Notes in Electrical Engineering; Springer: India, 2019; Volume 478, pp. 177–186. [Google Scholar]
- Siriguleng, B.; Zhang, W.; Liu, T.; Liu, Y.Z. Vibration Modal Experiments and Modal Interactions of a Large Space Deployable Antenna with Carbon Fiber Material and Ring-Truss Structure. Eng. Struct. 2020, 207, 109932. [Google Scholar] [CrossRef]
- Boudjemai, A.; Amri, R.; Mankour, A.; Salem, H.; Bouanane, M.H.; Boutchicha, D. Modal Analysis and Testing of Hexagonal Honeycomb Plates Used for Satellite Structural Design. Mater. Des. 2012, 35, 266–275. [Google Scholar] [CrossRef]
- Rosly, N.A.; Harmin, M.Y.; Majid, D.L.A.A. Preliminary Investigation on Experimental Modal Analysis of High Aspect Ratio Rectangular Wing Model. Int. J. Eng. Technol. 2018, 7, 151–154. [Google Scholar] [CrossRef]
- Mali, K.D.; Singru, P.M. Study on the Effect of the Impact Location and the Type of Hammer Tip on the Frequency Response Function (FRF) in Experimental Modal Analysis of Rectangular Plates. IOP Conf. Ser. Mater. Sci. Eng. 2018, 330, 012102. [Google Scholar] [CrossRef] [Green Version]
- Luczak, M.M.; Peeters, B.; Manzato, S.; di Lorenzo, E.; Reck-Nielsen, K.; Berring, P.; Haselbach, P.U.; Branner, K. Research Sized Wind Turbine Blade Modal Tests: Comparison of the Impact Excitation with Shaker Excitation. J. Phys. Conf. Ser. 2018, 1102, 12022. [Google Scholar] [CrossRef]
- Kammer, D.C.; Tinker, M.L. Optimal Placement of Triaxial Accelerometers for Modal Vibration Tests. Mech. Syst. Signal Process. 2004, 18, 29–41. [Google Scholar] [CrossRef]
- Ostachowicz, W.; Soman, R.; Malinowski, P. Optimization of Sensor Placement for Structural Health Monitoring: A Review. Struct. Health Monit. 2019, 18, 963–988. [Google Scholar] [CrossRef]
- Feng, S.; Jia, J. Acceleration Sensor Placement Technique for Vibration Test in Structural Health Monitoring Using Microhabitat Frog-Leaping Algorithm. Struct. Health Monit. 2018, 17, 169–184. [Google Scholar] [CrossRef]
- Lin, T.Y.; Tao, J.; Huang, H.H. A Multiobjective Perspective to Optimal Sensor Placement by Using a Decomposition-Based Evolutionary Algorithm in Structural Health Monitoring. Appl. Sci. 2020, 10, 7710. [Google Scholar] [CrossRef]
- Pastor, M.; Binda, M.; Harčarik, T. Modal Assurance Criterion. Procedia Eng. 2012, 48, 543–548. [Google Scholar] [CrossRef]
- Allemang, R.J. The Modal Assurance Criterion-Twenty Years of Use and Abuse. Sound Vib. 2003, 37, 14–21. [Google Scholar]
- Greś, S.; Döhler, M.; Mevel, L. Uncertainty Quantification of the Modal Assurance Criterion in Operational Modal Analysis. Mech. Syst. Signal Process. 2021, 152, 107457. [Google Scholar] [CrossRef]
- Altunışık, A.C.; Okur, F.Y.; Kahya, V. Modal Parameter Identification and Vibration Based Damage Detection of a Multiple Cracked Cantilever Beam. Eng. Fail. Anal. 2017, 79, 154–170. [Google Scholar] [CrossRef]
- Wagih, A.M.; Hegaze, M.M.; Kamel, M.A. Satellite FE Model Validation for Coupled Load Analysis Using Conventional and Enhanced Correlation Criteria. In Proceedings of the AIAA SPACE and Astronautics Forum and Exposition, SPACE 2017, Orlando, FL, USA, 12–14 September 2017; American Institute of Aeronautics and Astronautics Inc.: Reston, VA, USA, 2017. [Google Scholar]
- Yan, S.; Li, B.; Li, F.; Li, B. Finite Element Model Updating of Liquid Rocket Engine Nozzle Based on Modal Test Results Obtained from 3-D SLDV Technique. Aerosp. Sci. Technol. 2017, 69, 412–418. [Google Scholar] [CrossRef]
- ECSS ECSS-E-ST-32-10C-Structural Factors of Safety for Spaceflight Hardware. Space Sci. 2004, 443–458. Available online: https://ecss.nl/get_attachment.php?file=2019/09/ECSS-E-ST-32-10C_Rev.2-Corr.1(1August2019).pdf (accessed on 25 August 2021).
Figure 1.
Conceptual satellite designs, as developed in the previous work.

Figure 2.
Exploded view of the baseline unperforated structure.

Figure 3.
Considered perforation pattern shapes, including the geometric parameters.

Figure 4.
The three perforated structural components after implementation of the patterns.

Figure 5.
The parameter design space for the considered cases.

Figure 6.
Mesh convergence study (typical case); converged mesh density shown in black.

Figure 7.
Converged finite element meshes.

Figure 8.
Scaled down and simplified central box plates.

Figure 9.
Experimental modal analysis testing setup and software interface.

Figure 10.
Impact hammer strike points, as implemented in the considered cases.

Figure 11.
Perforation unit area repetitions—central box plate, original, and final.


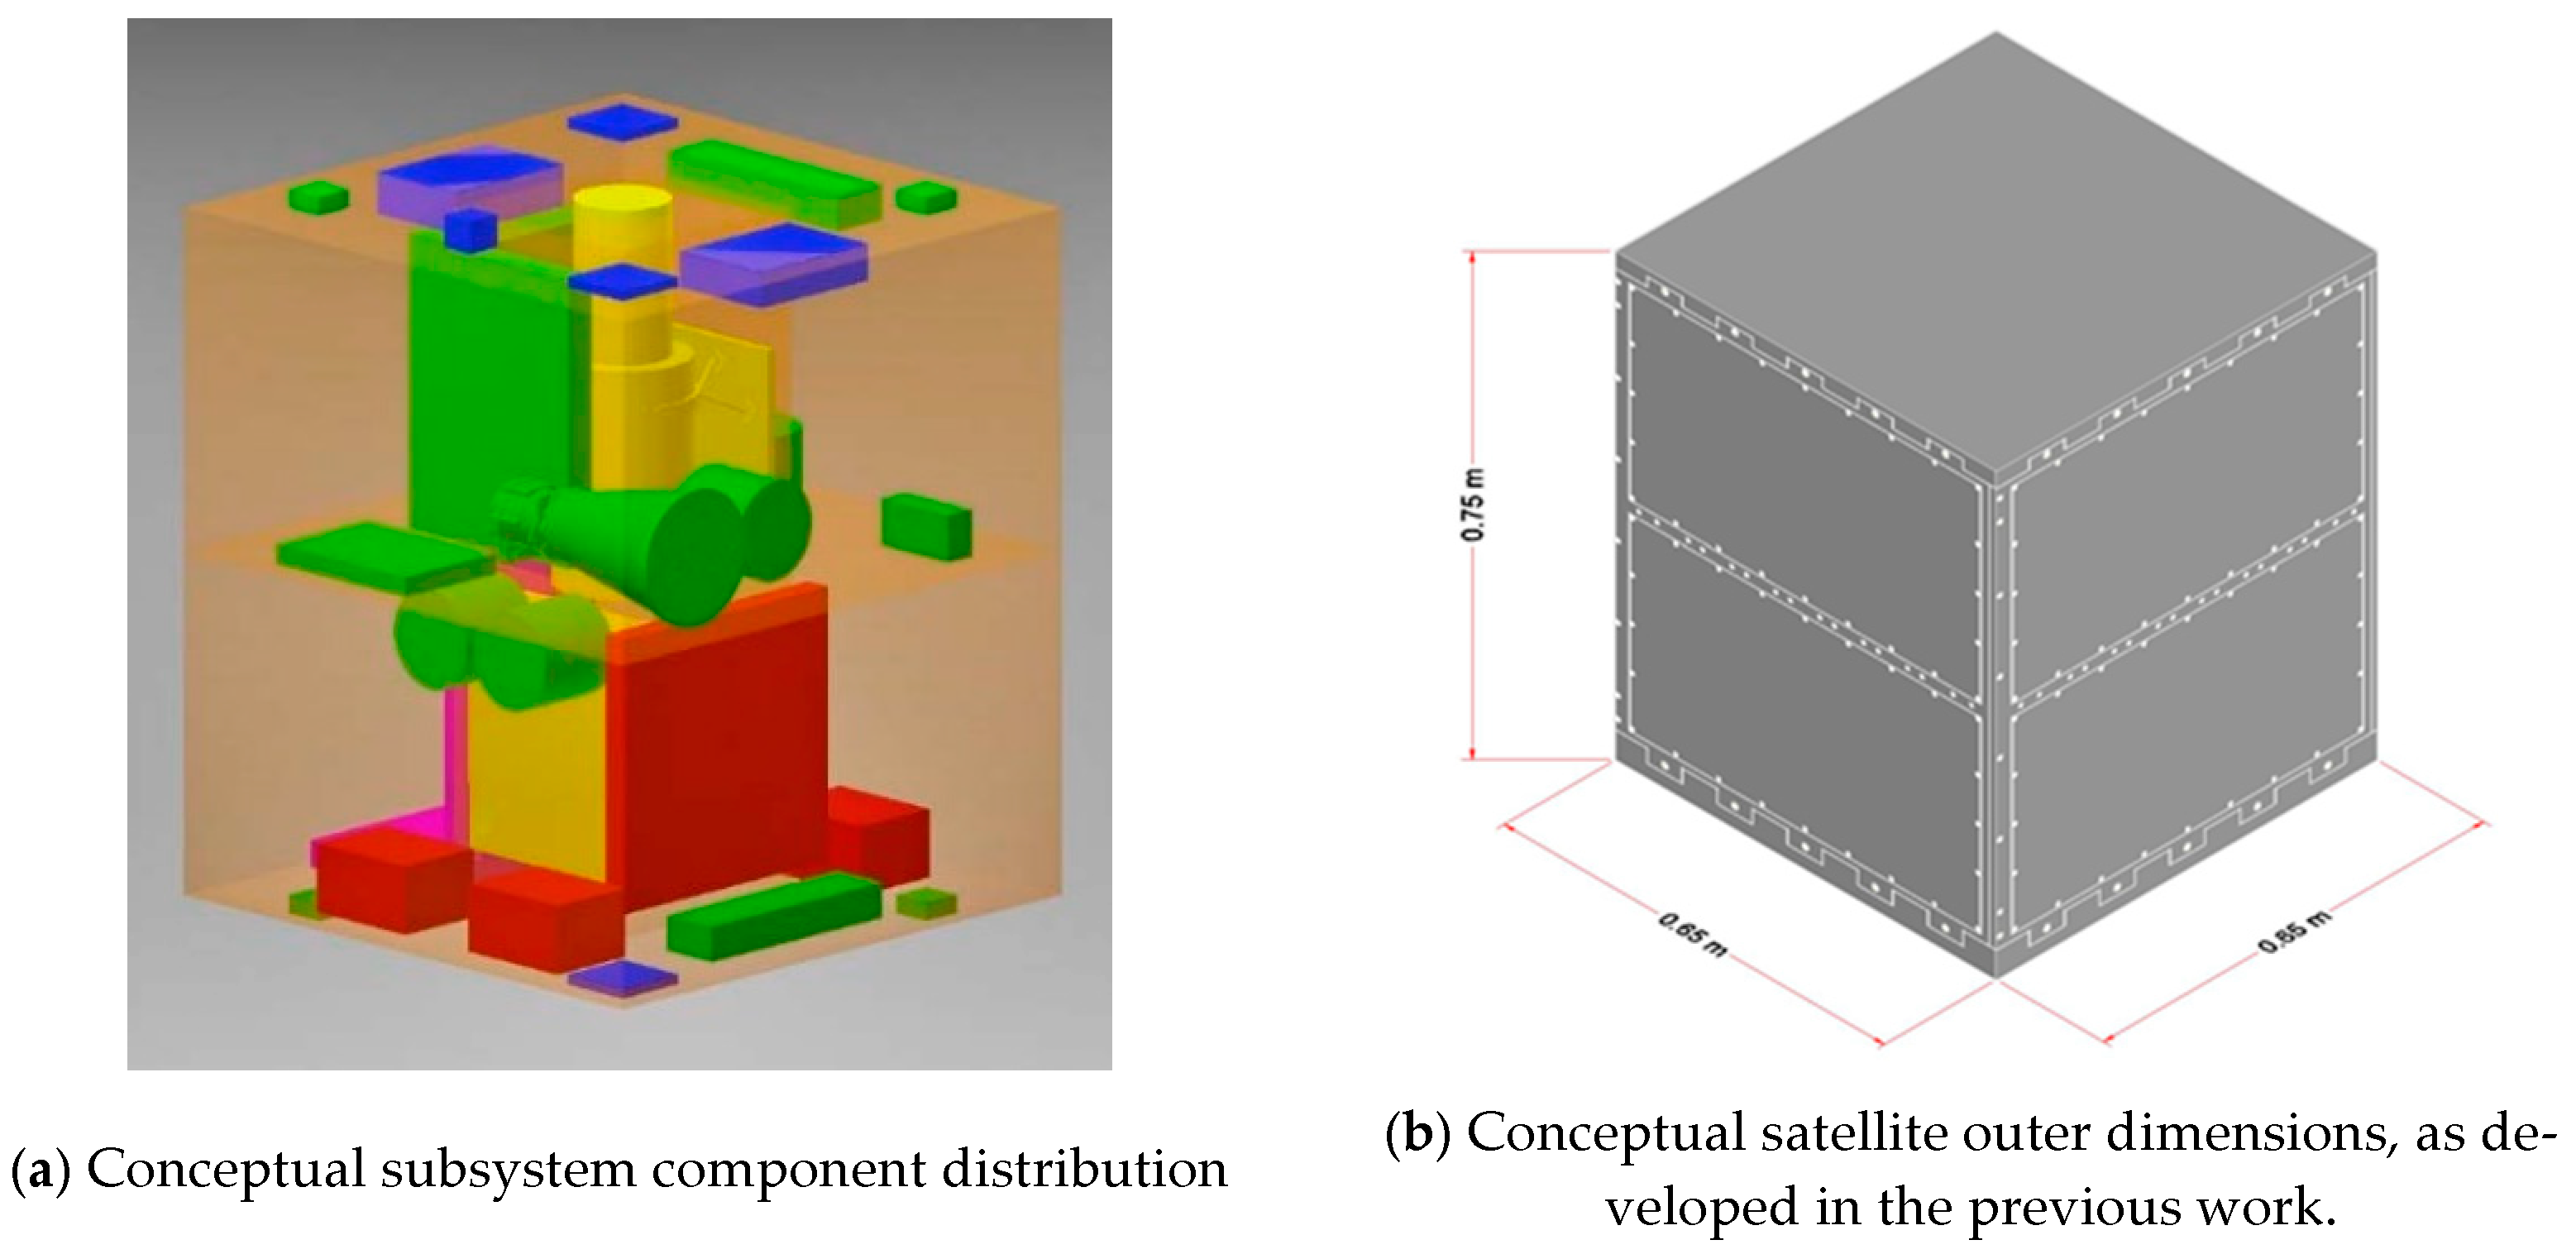
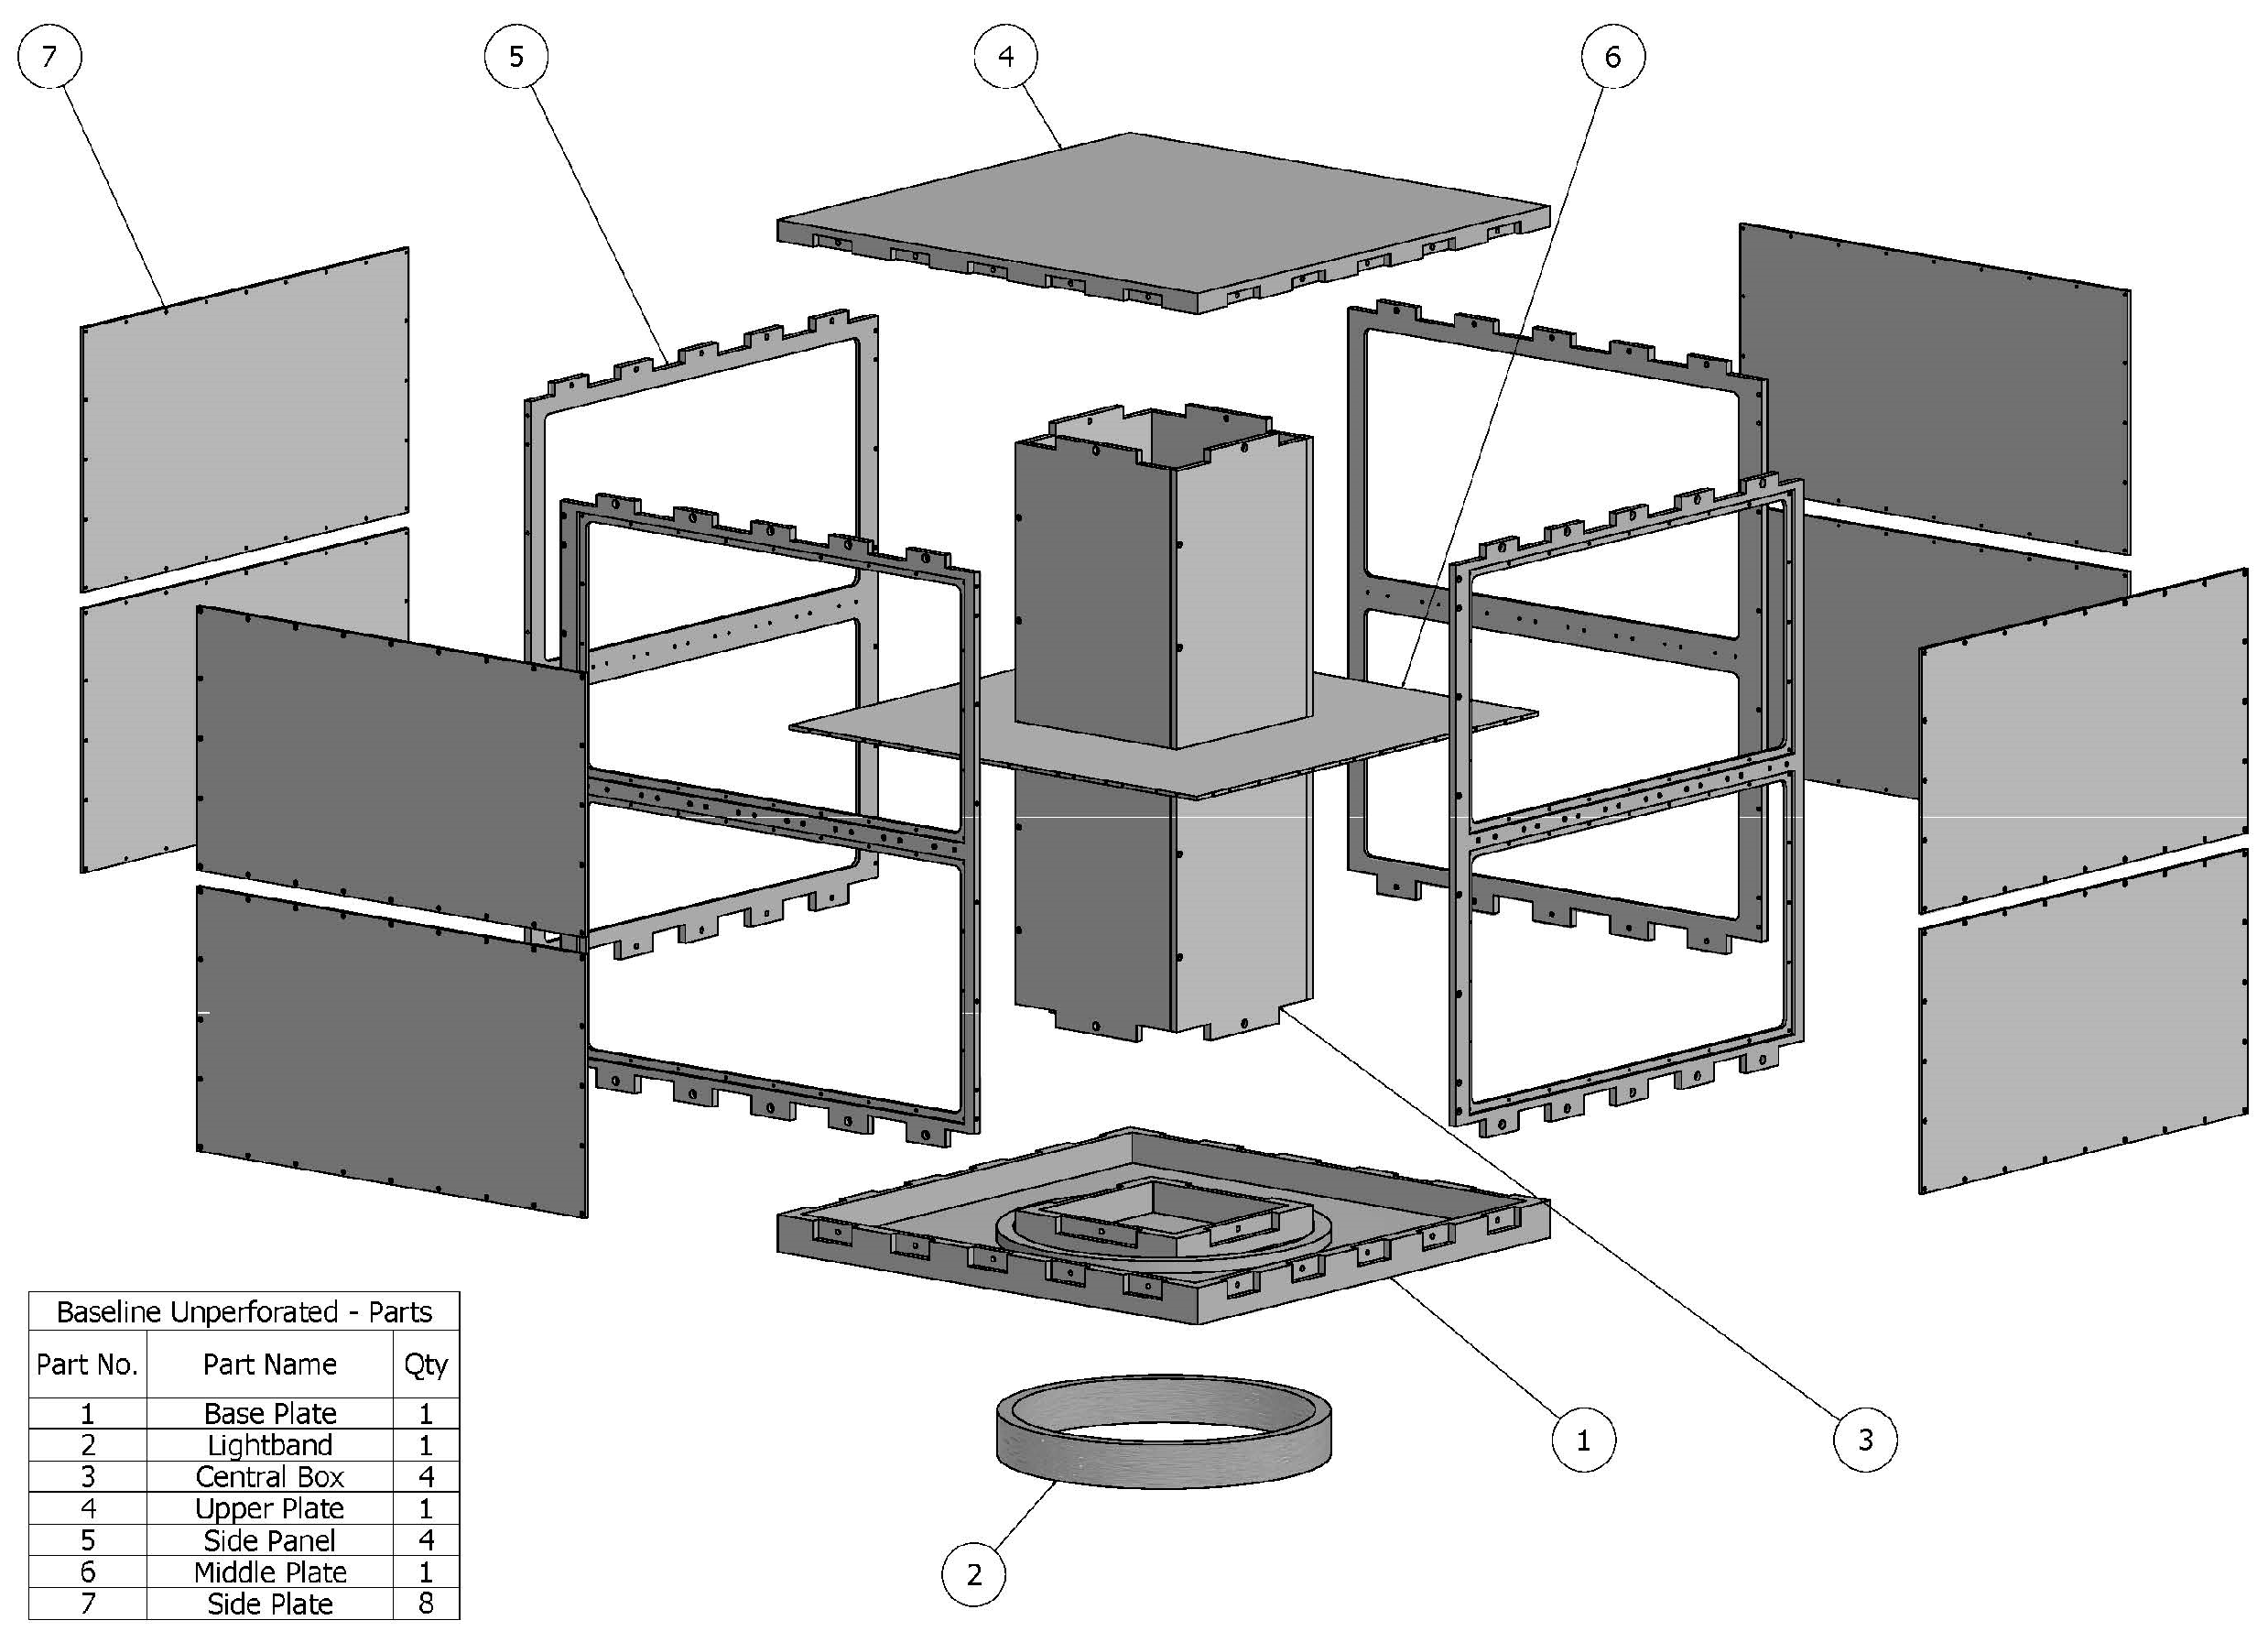
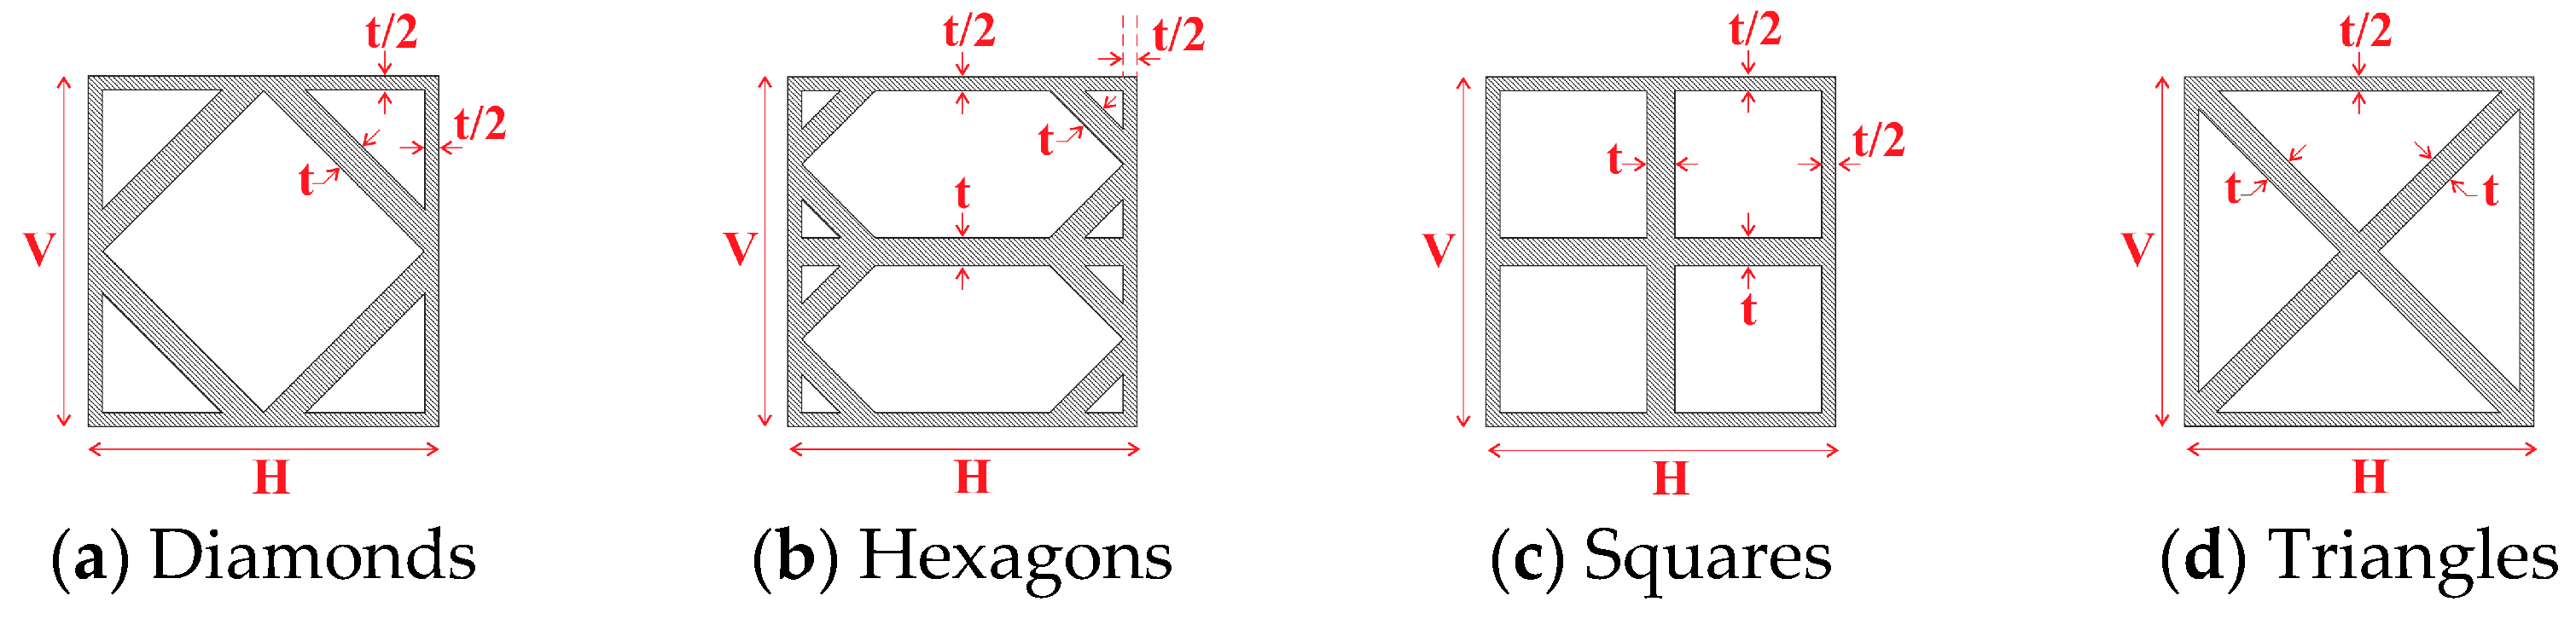
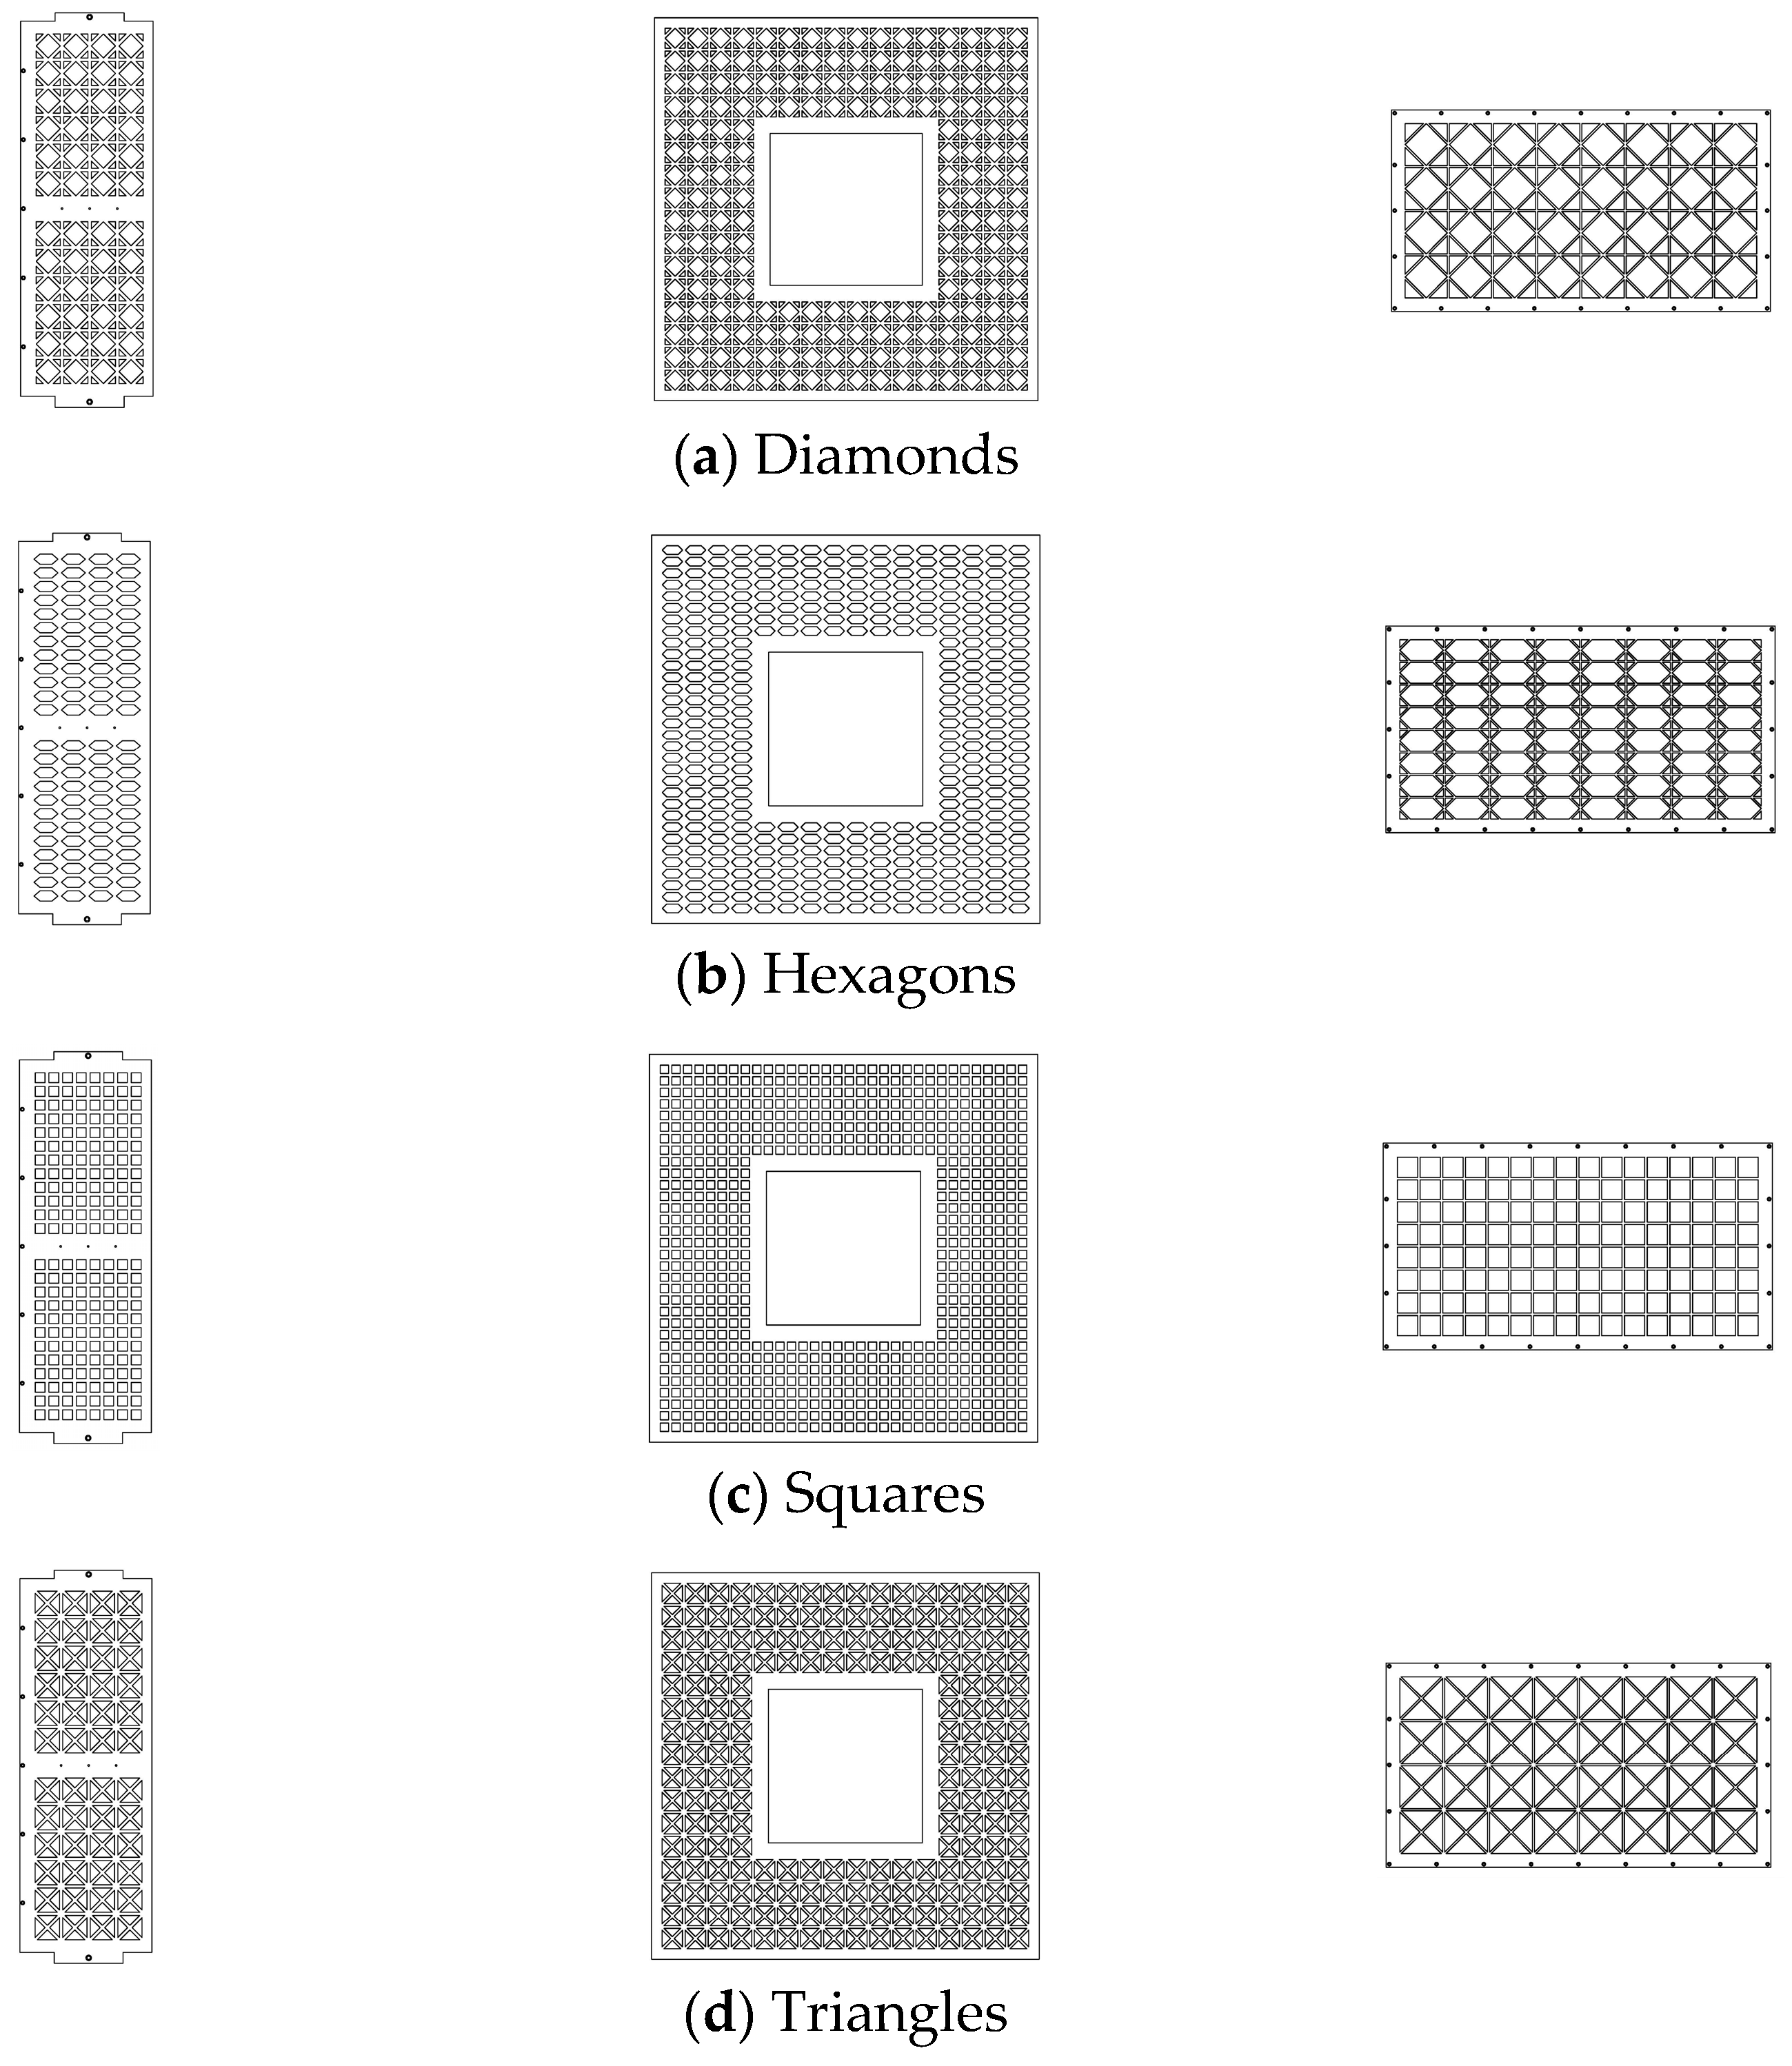
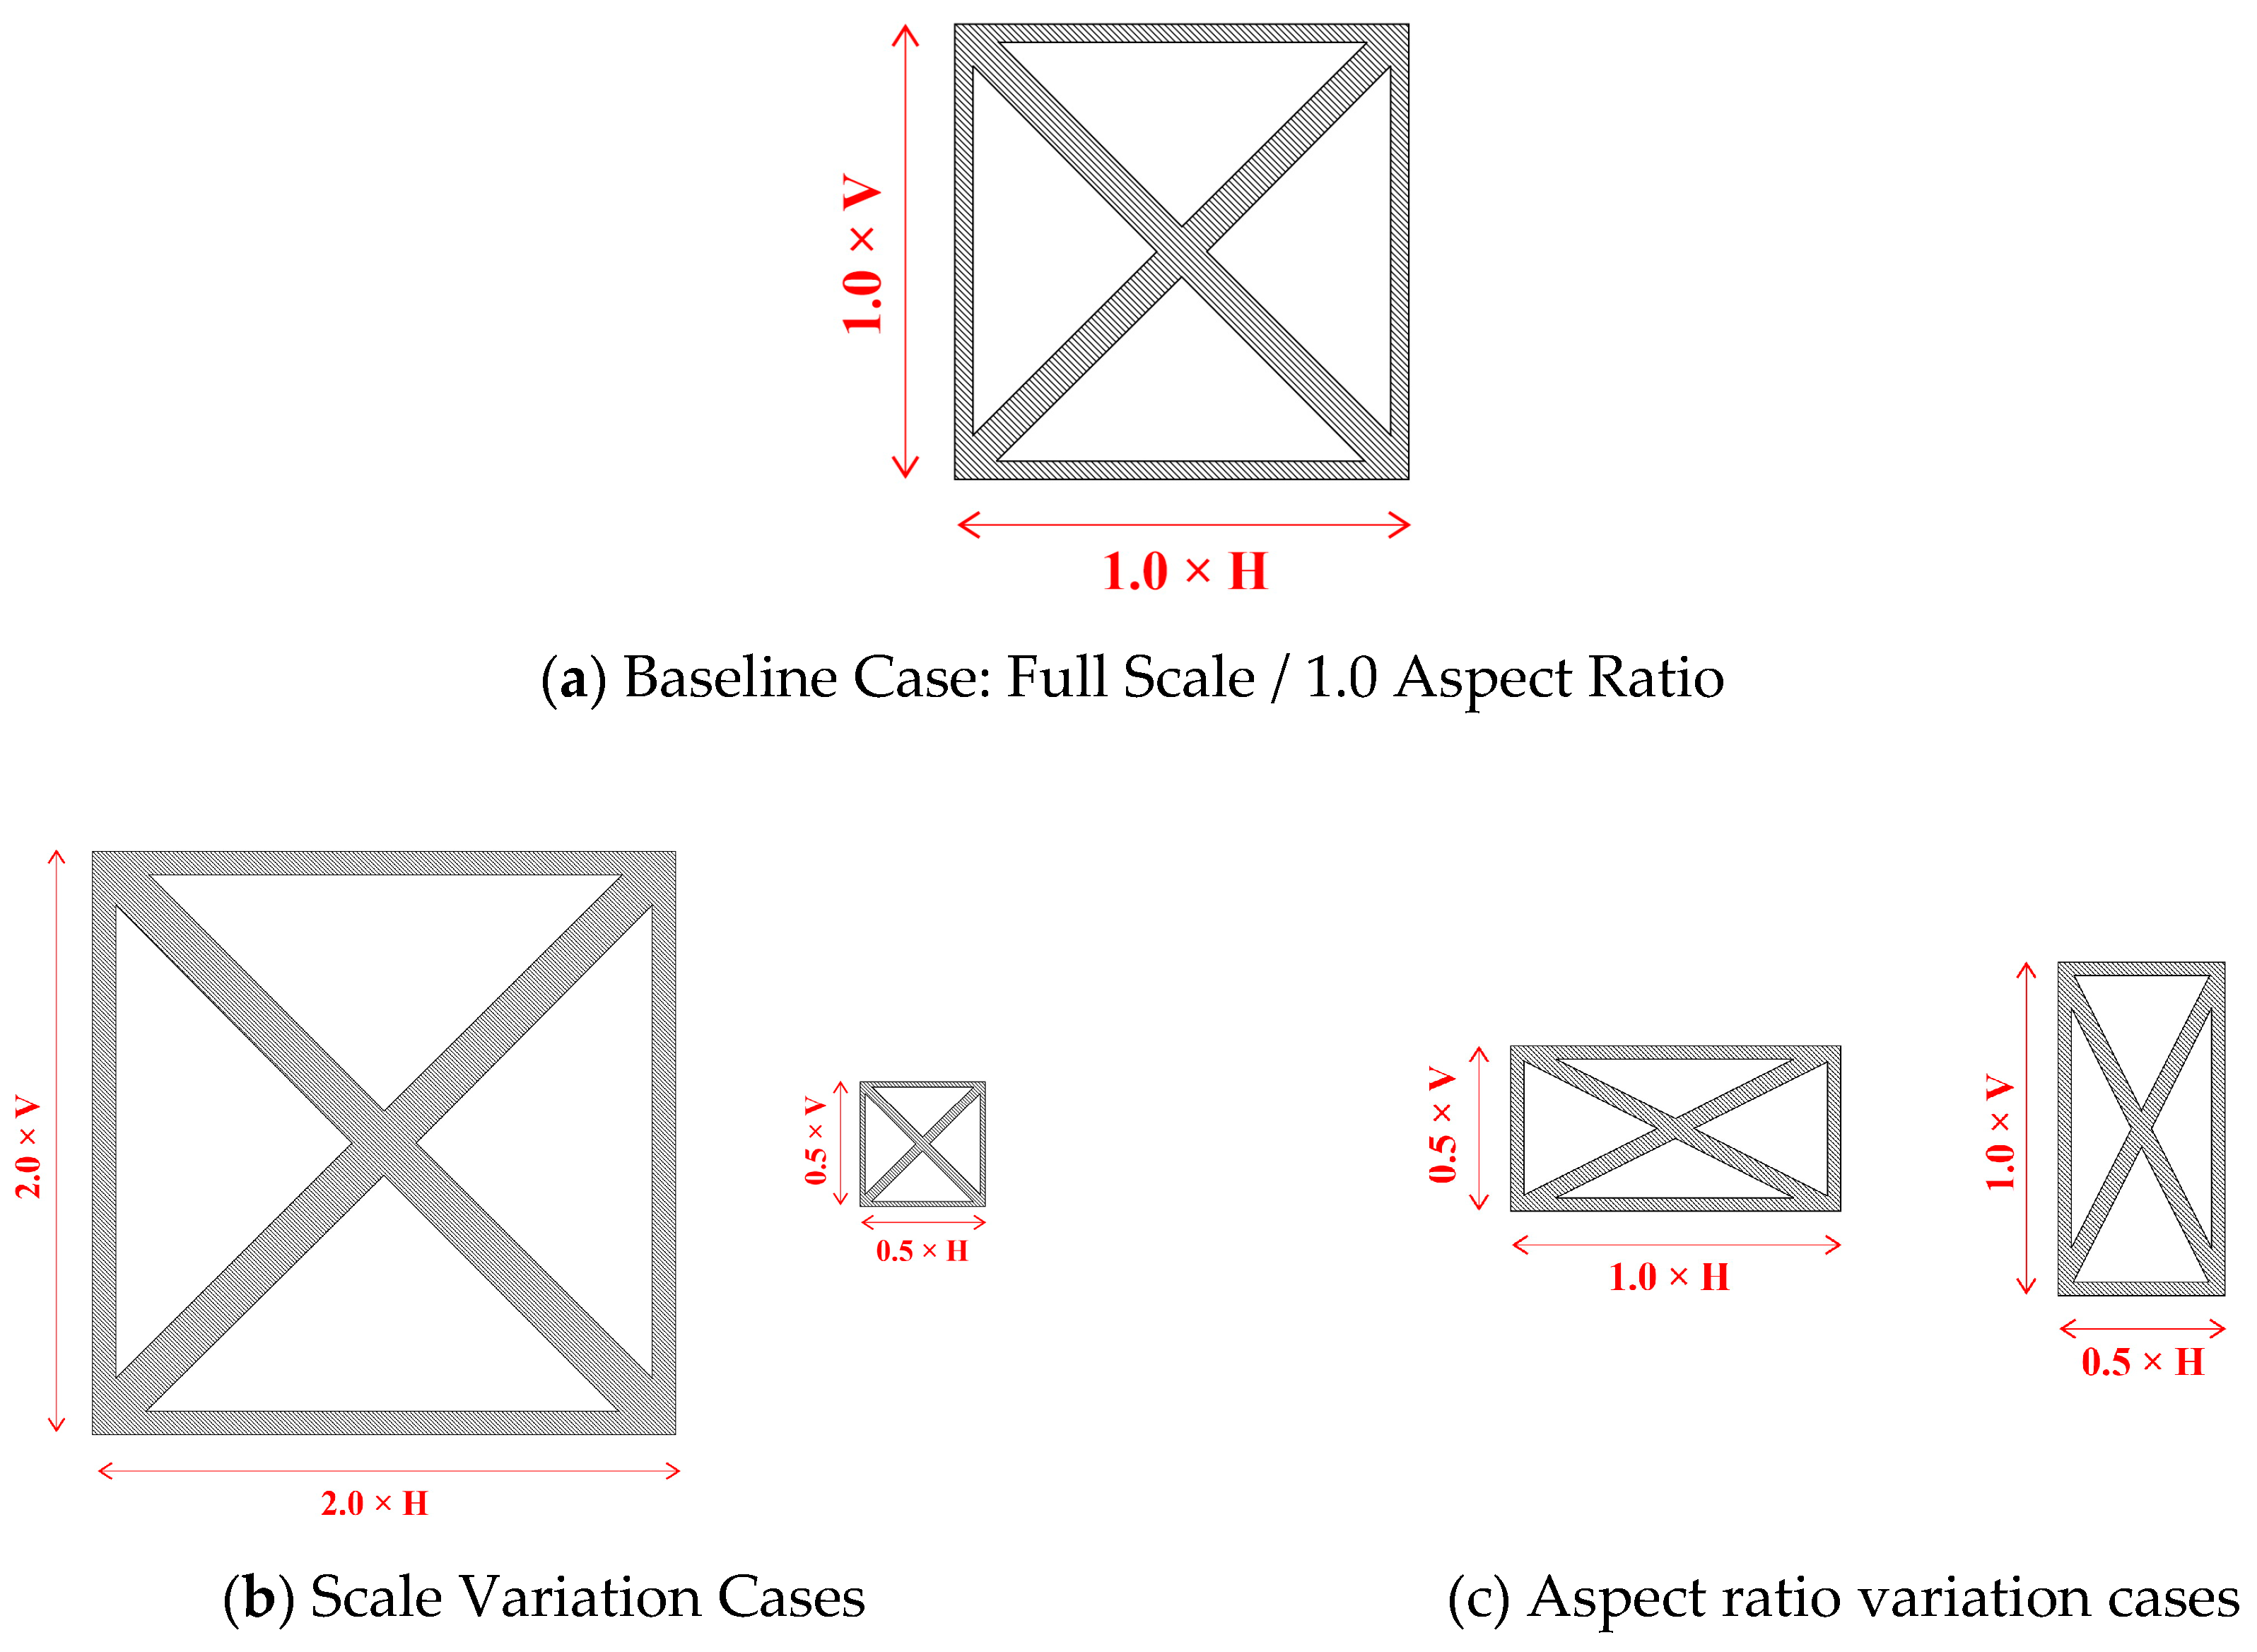
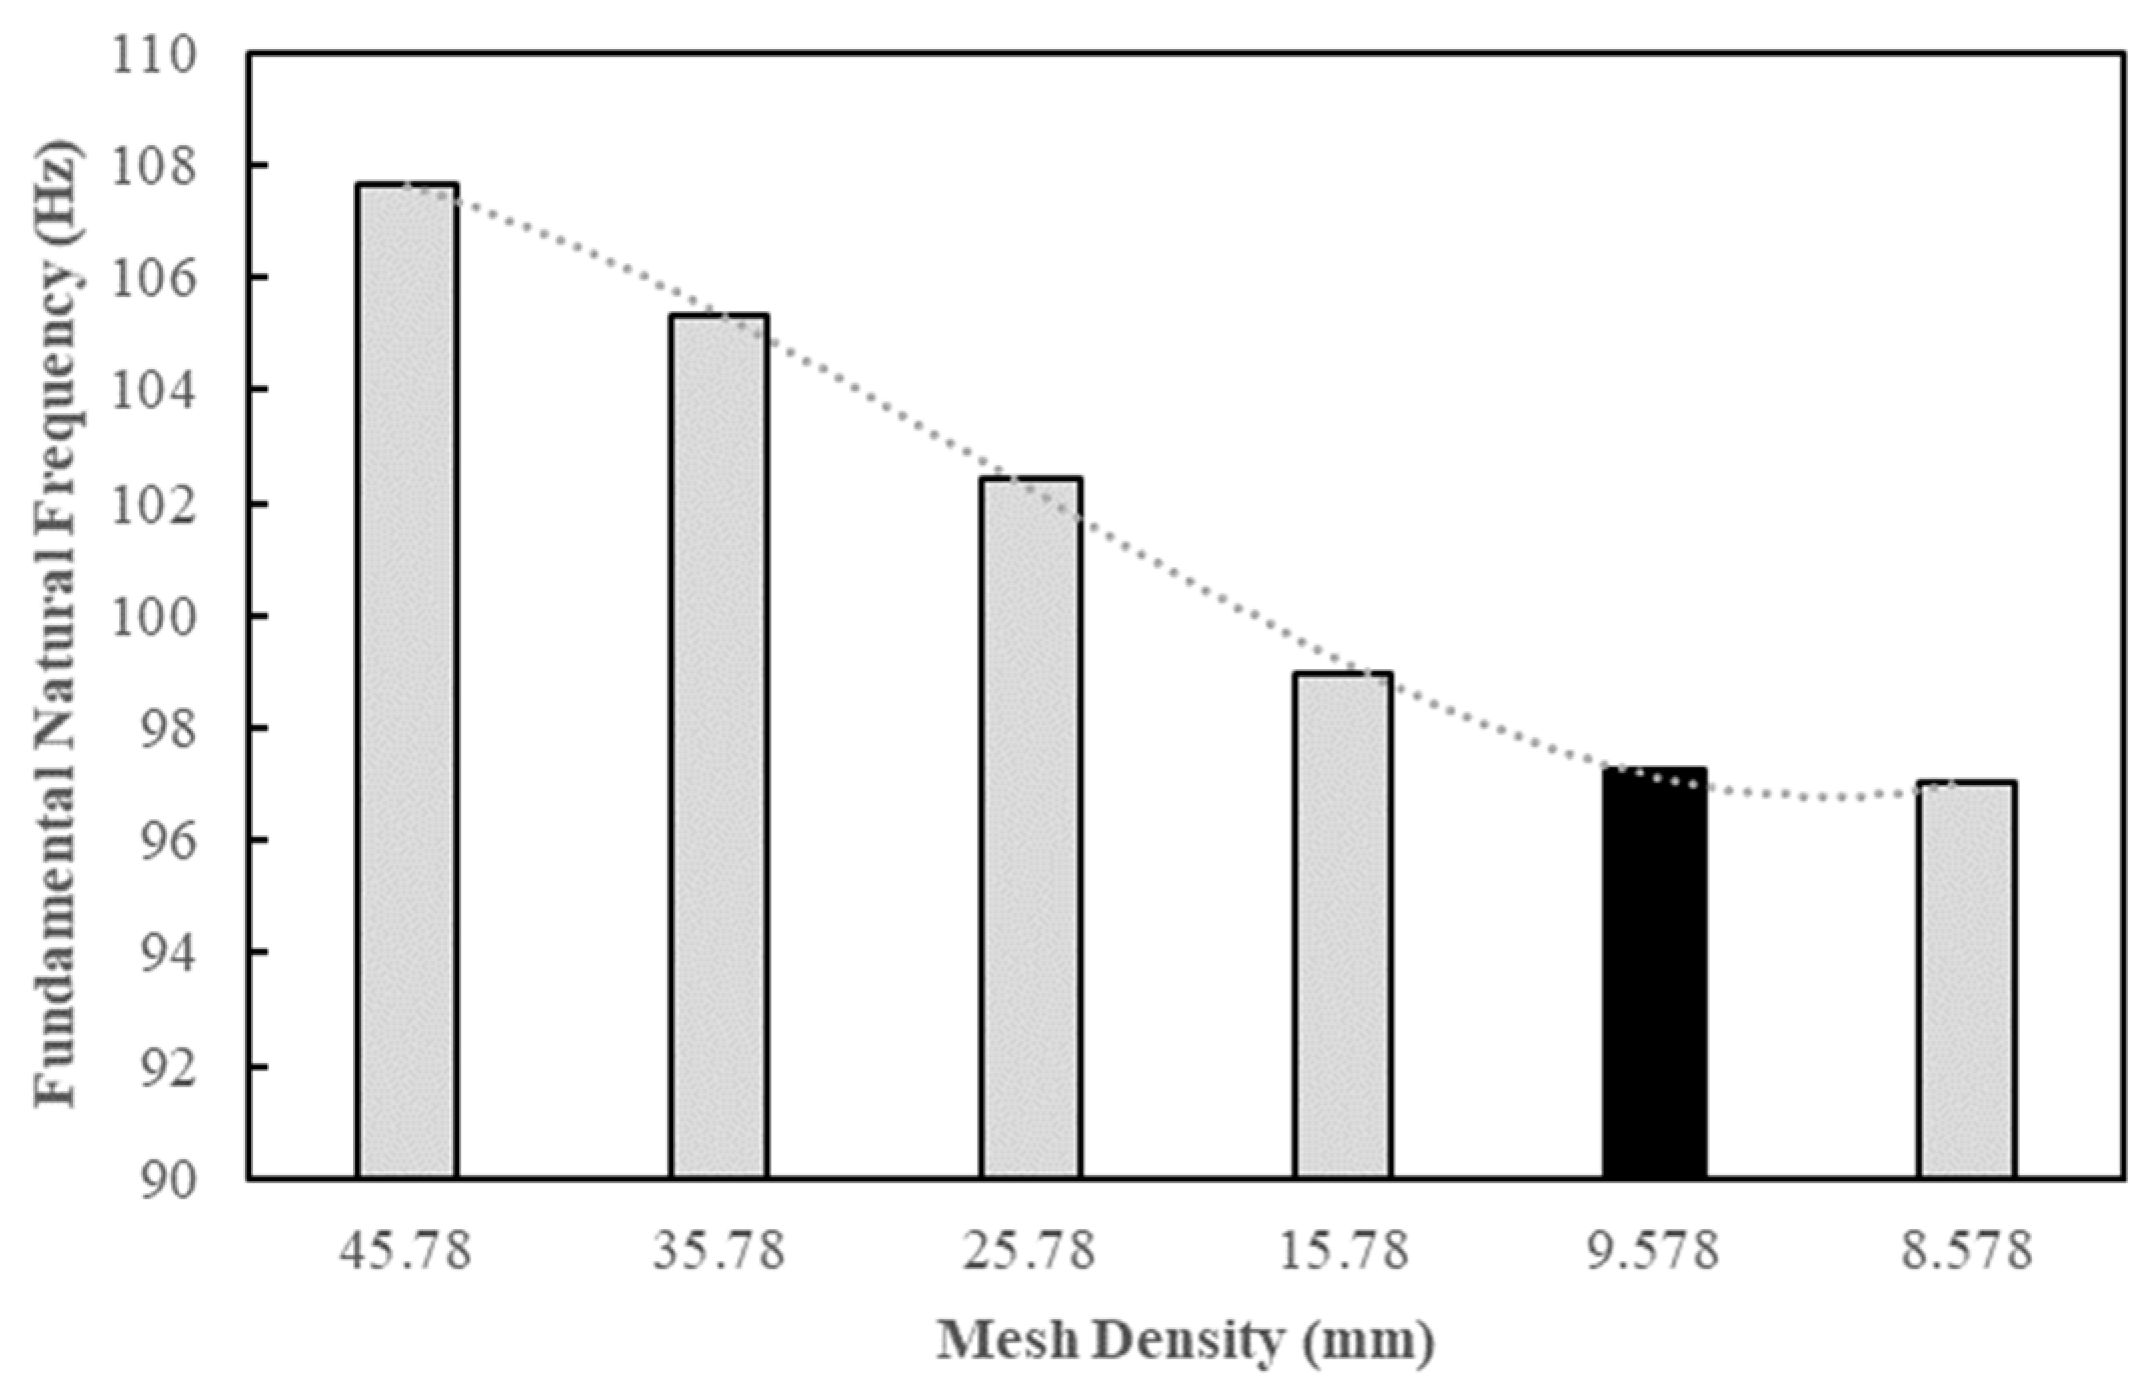
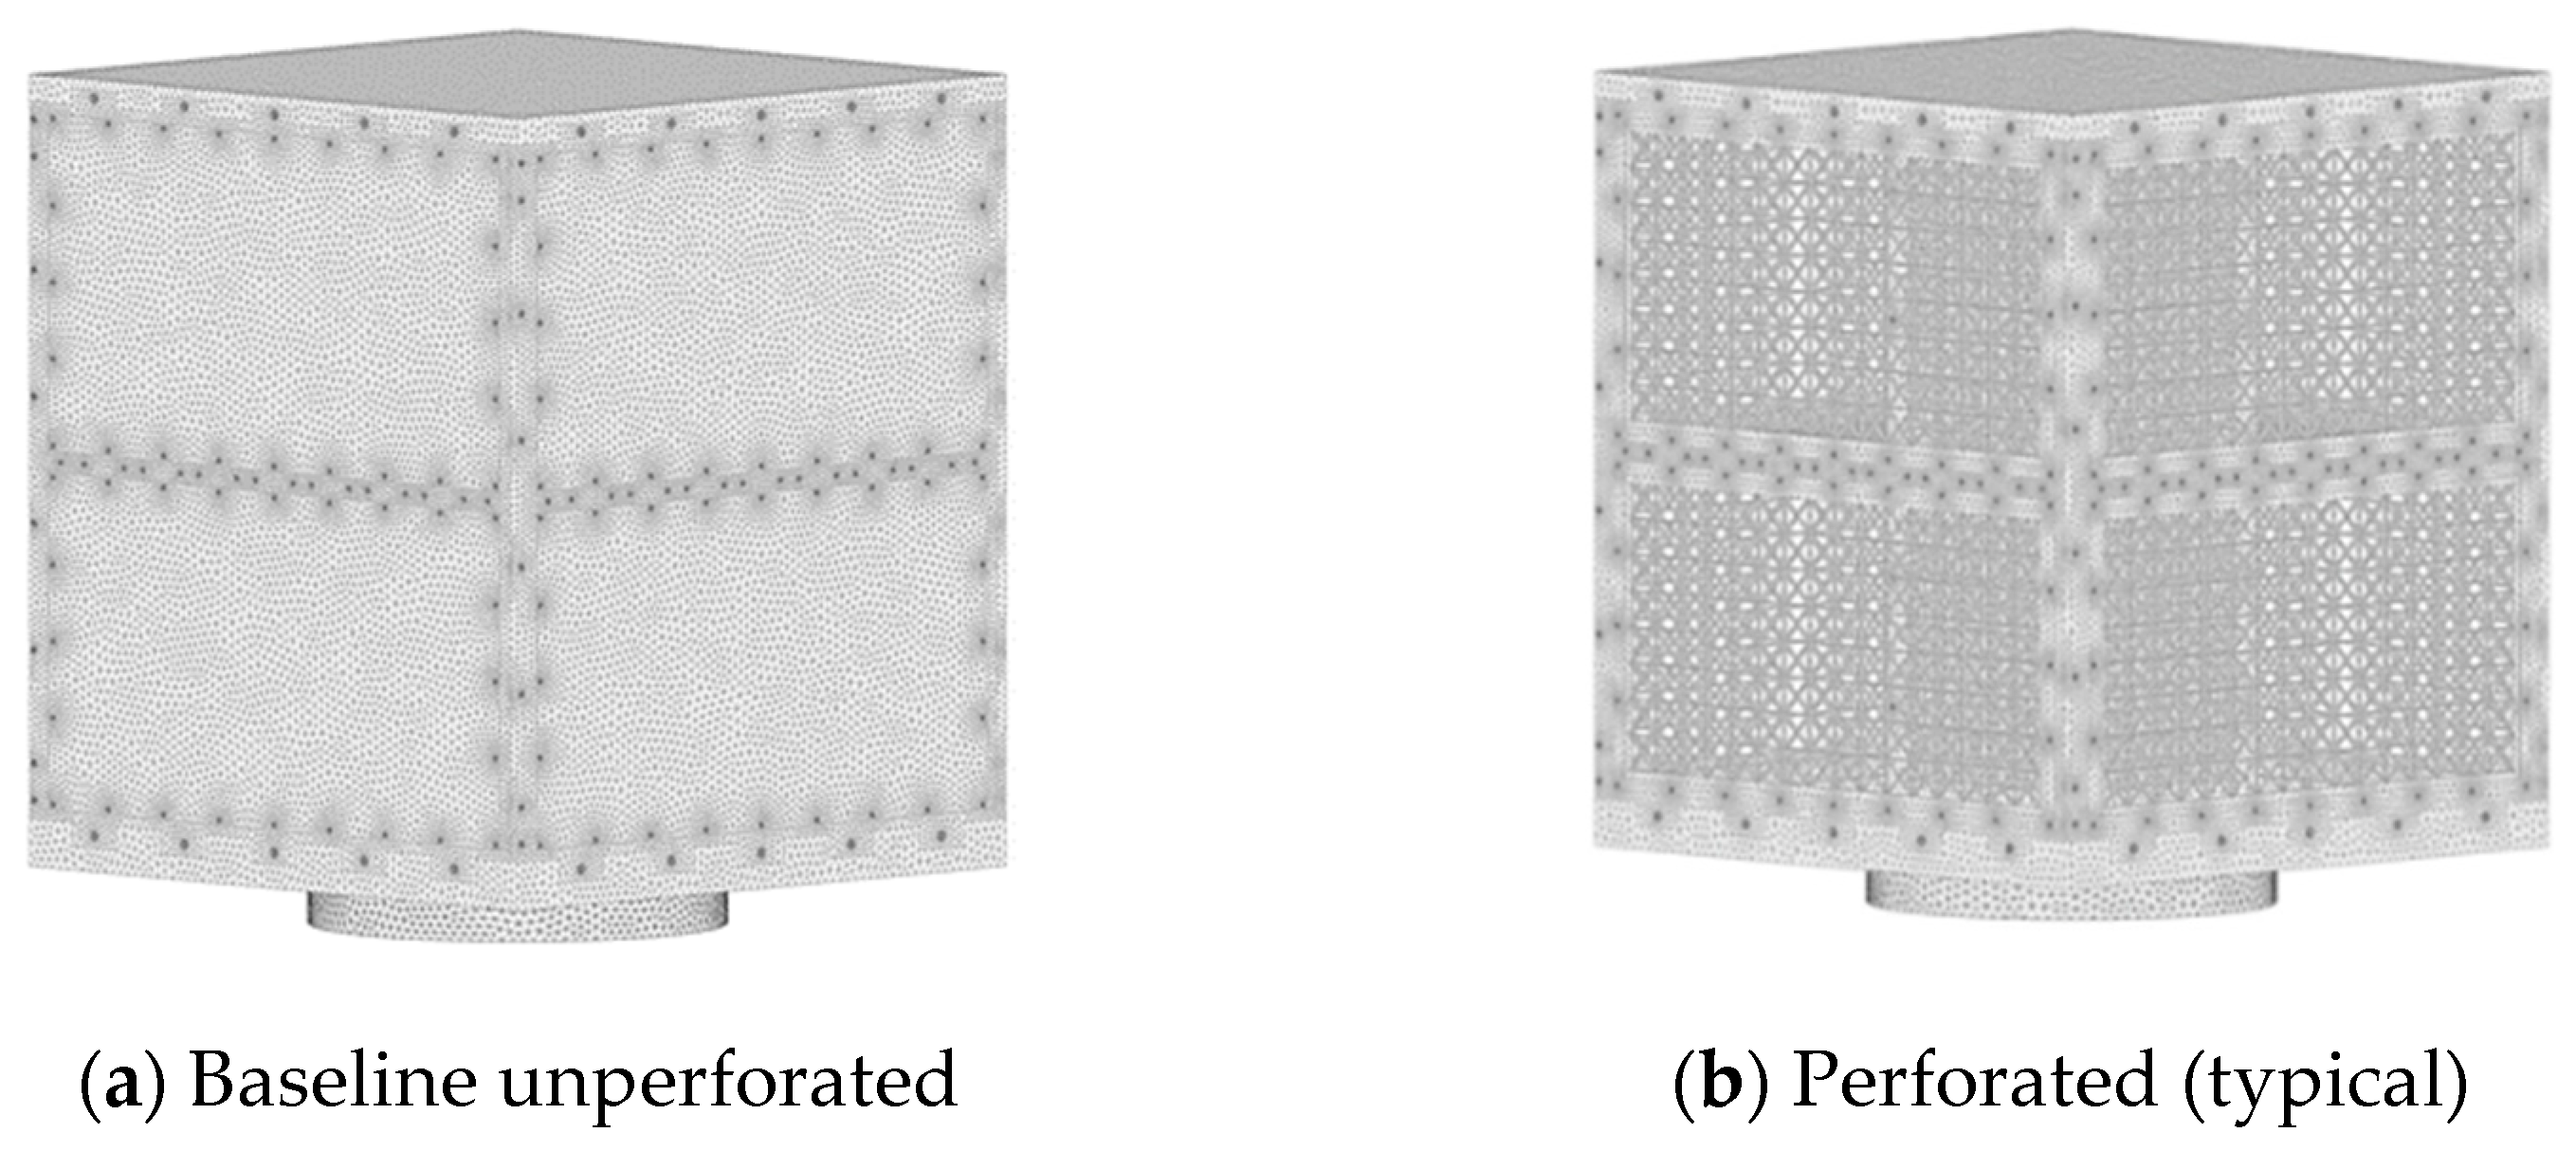
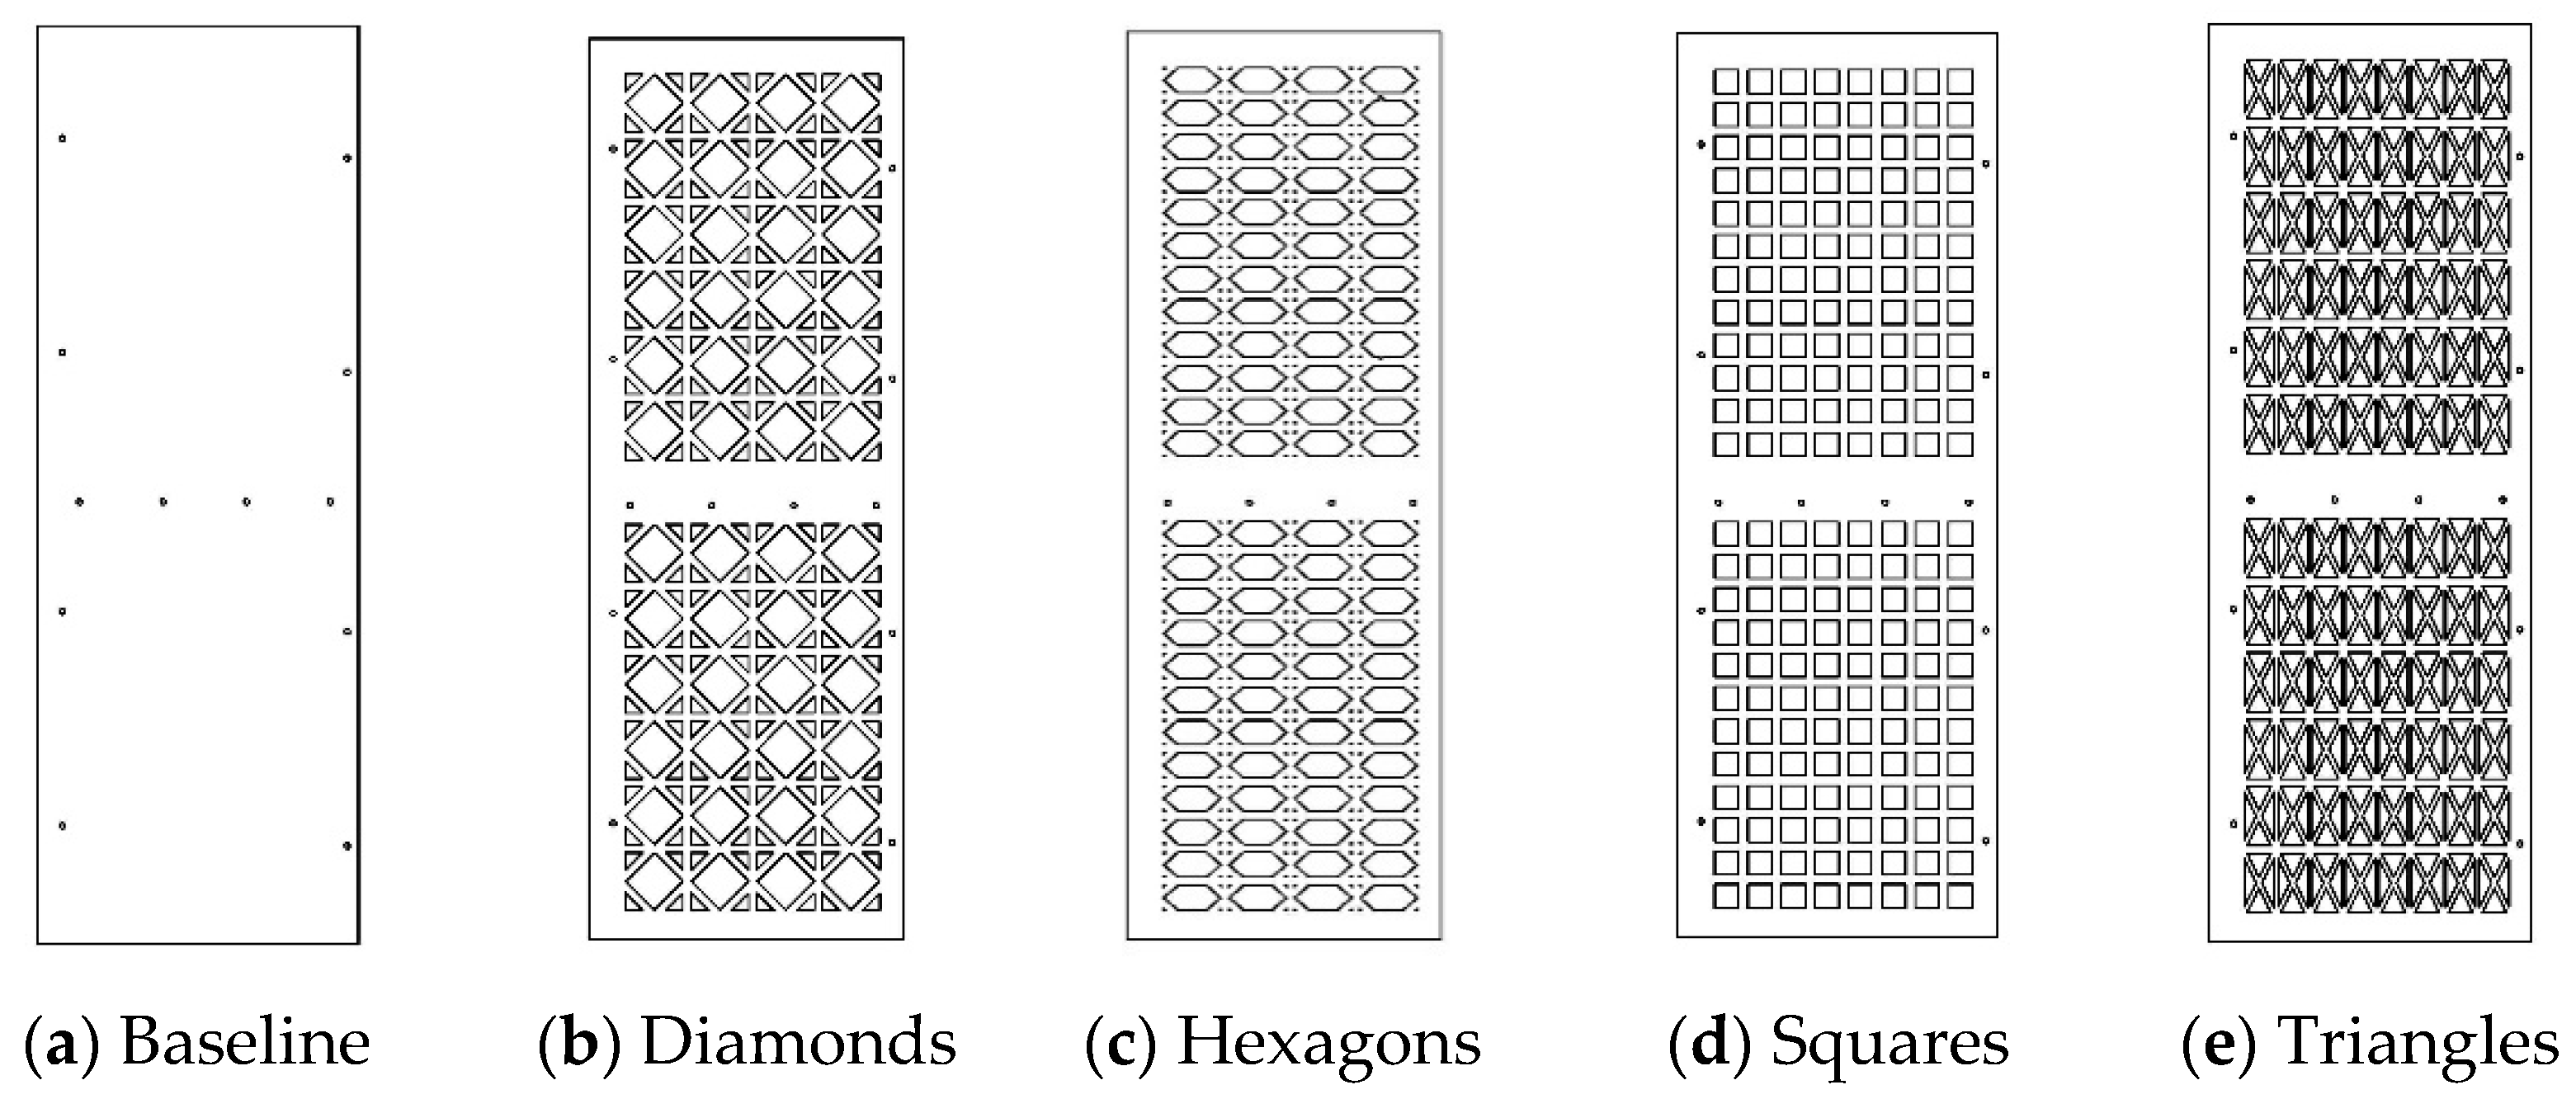
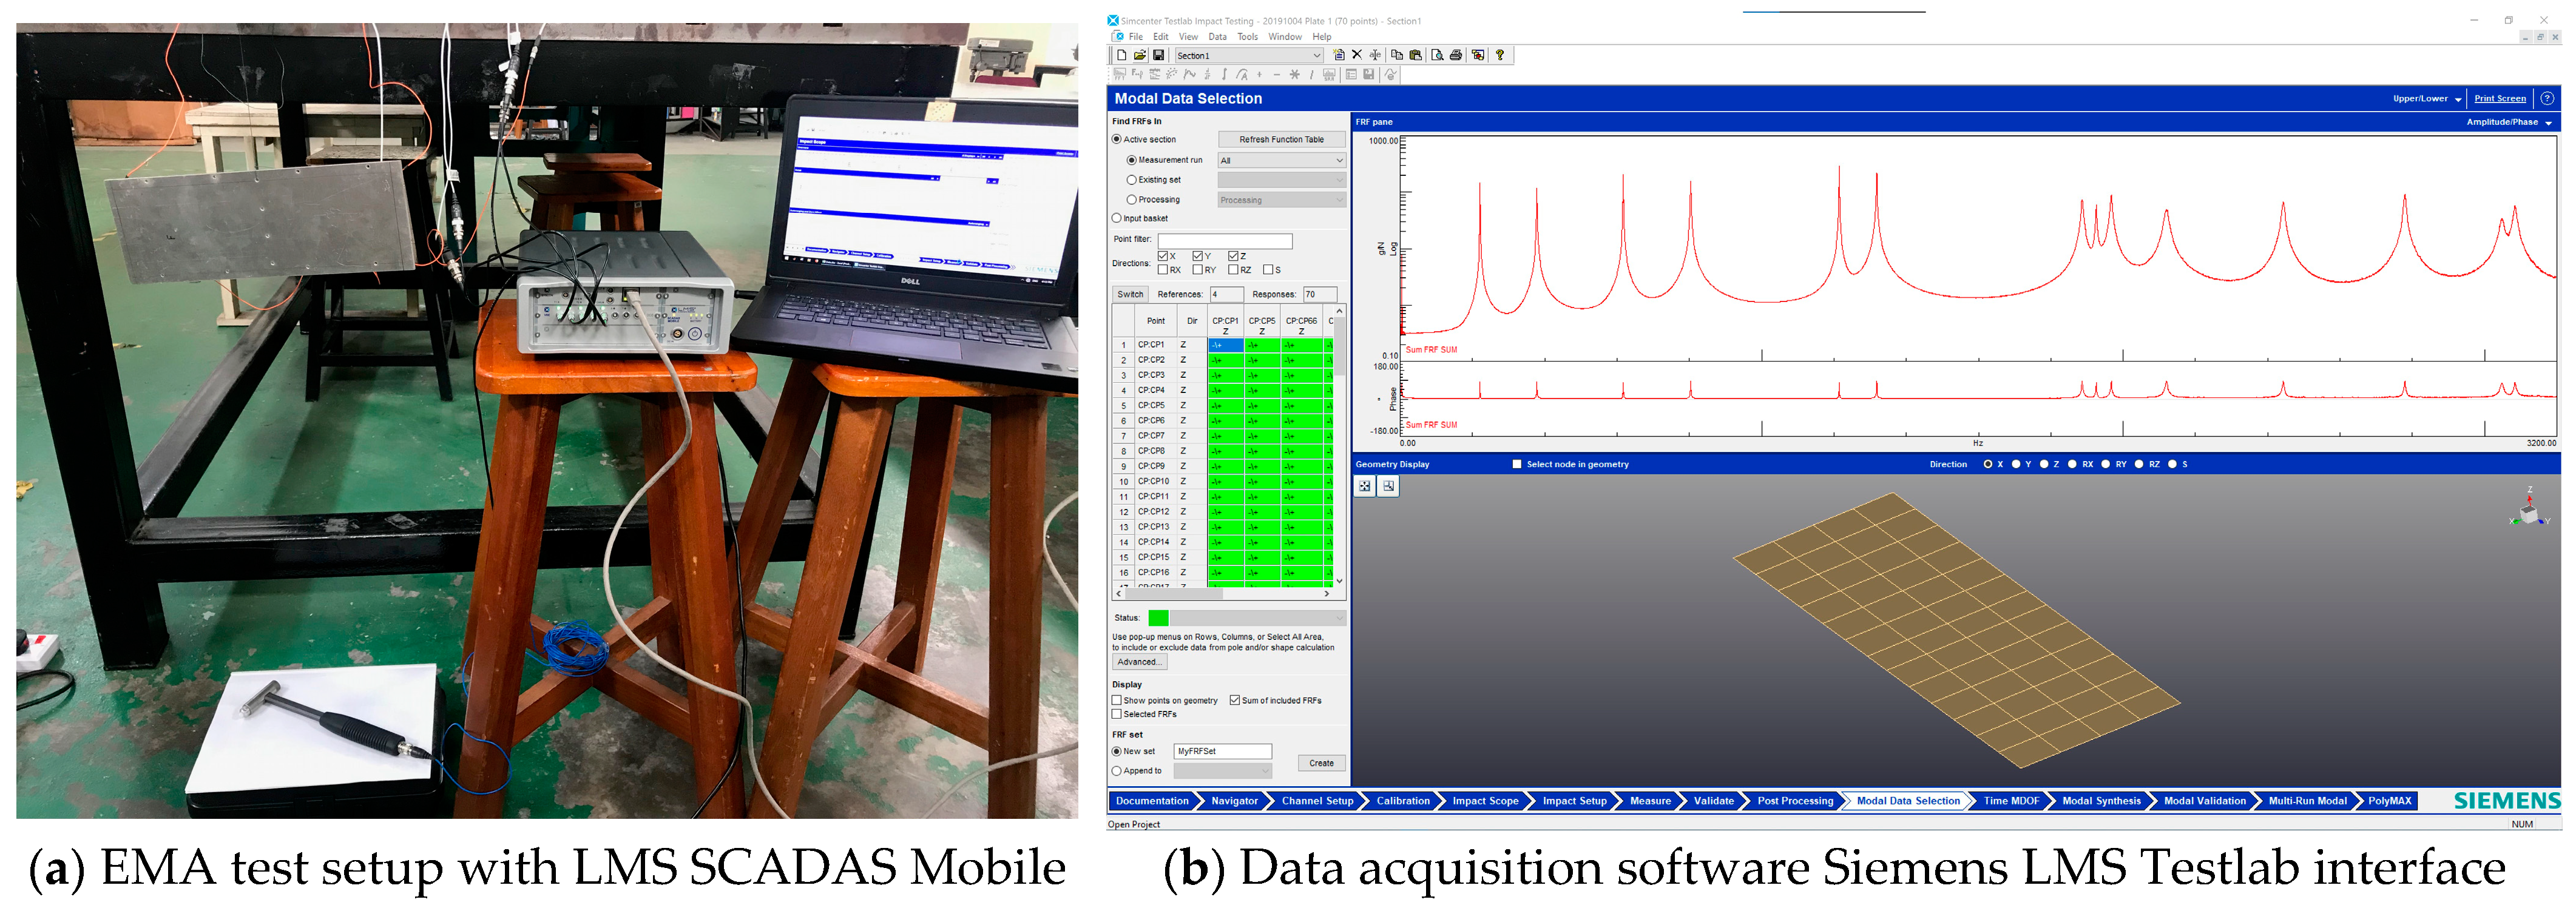
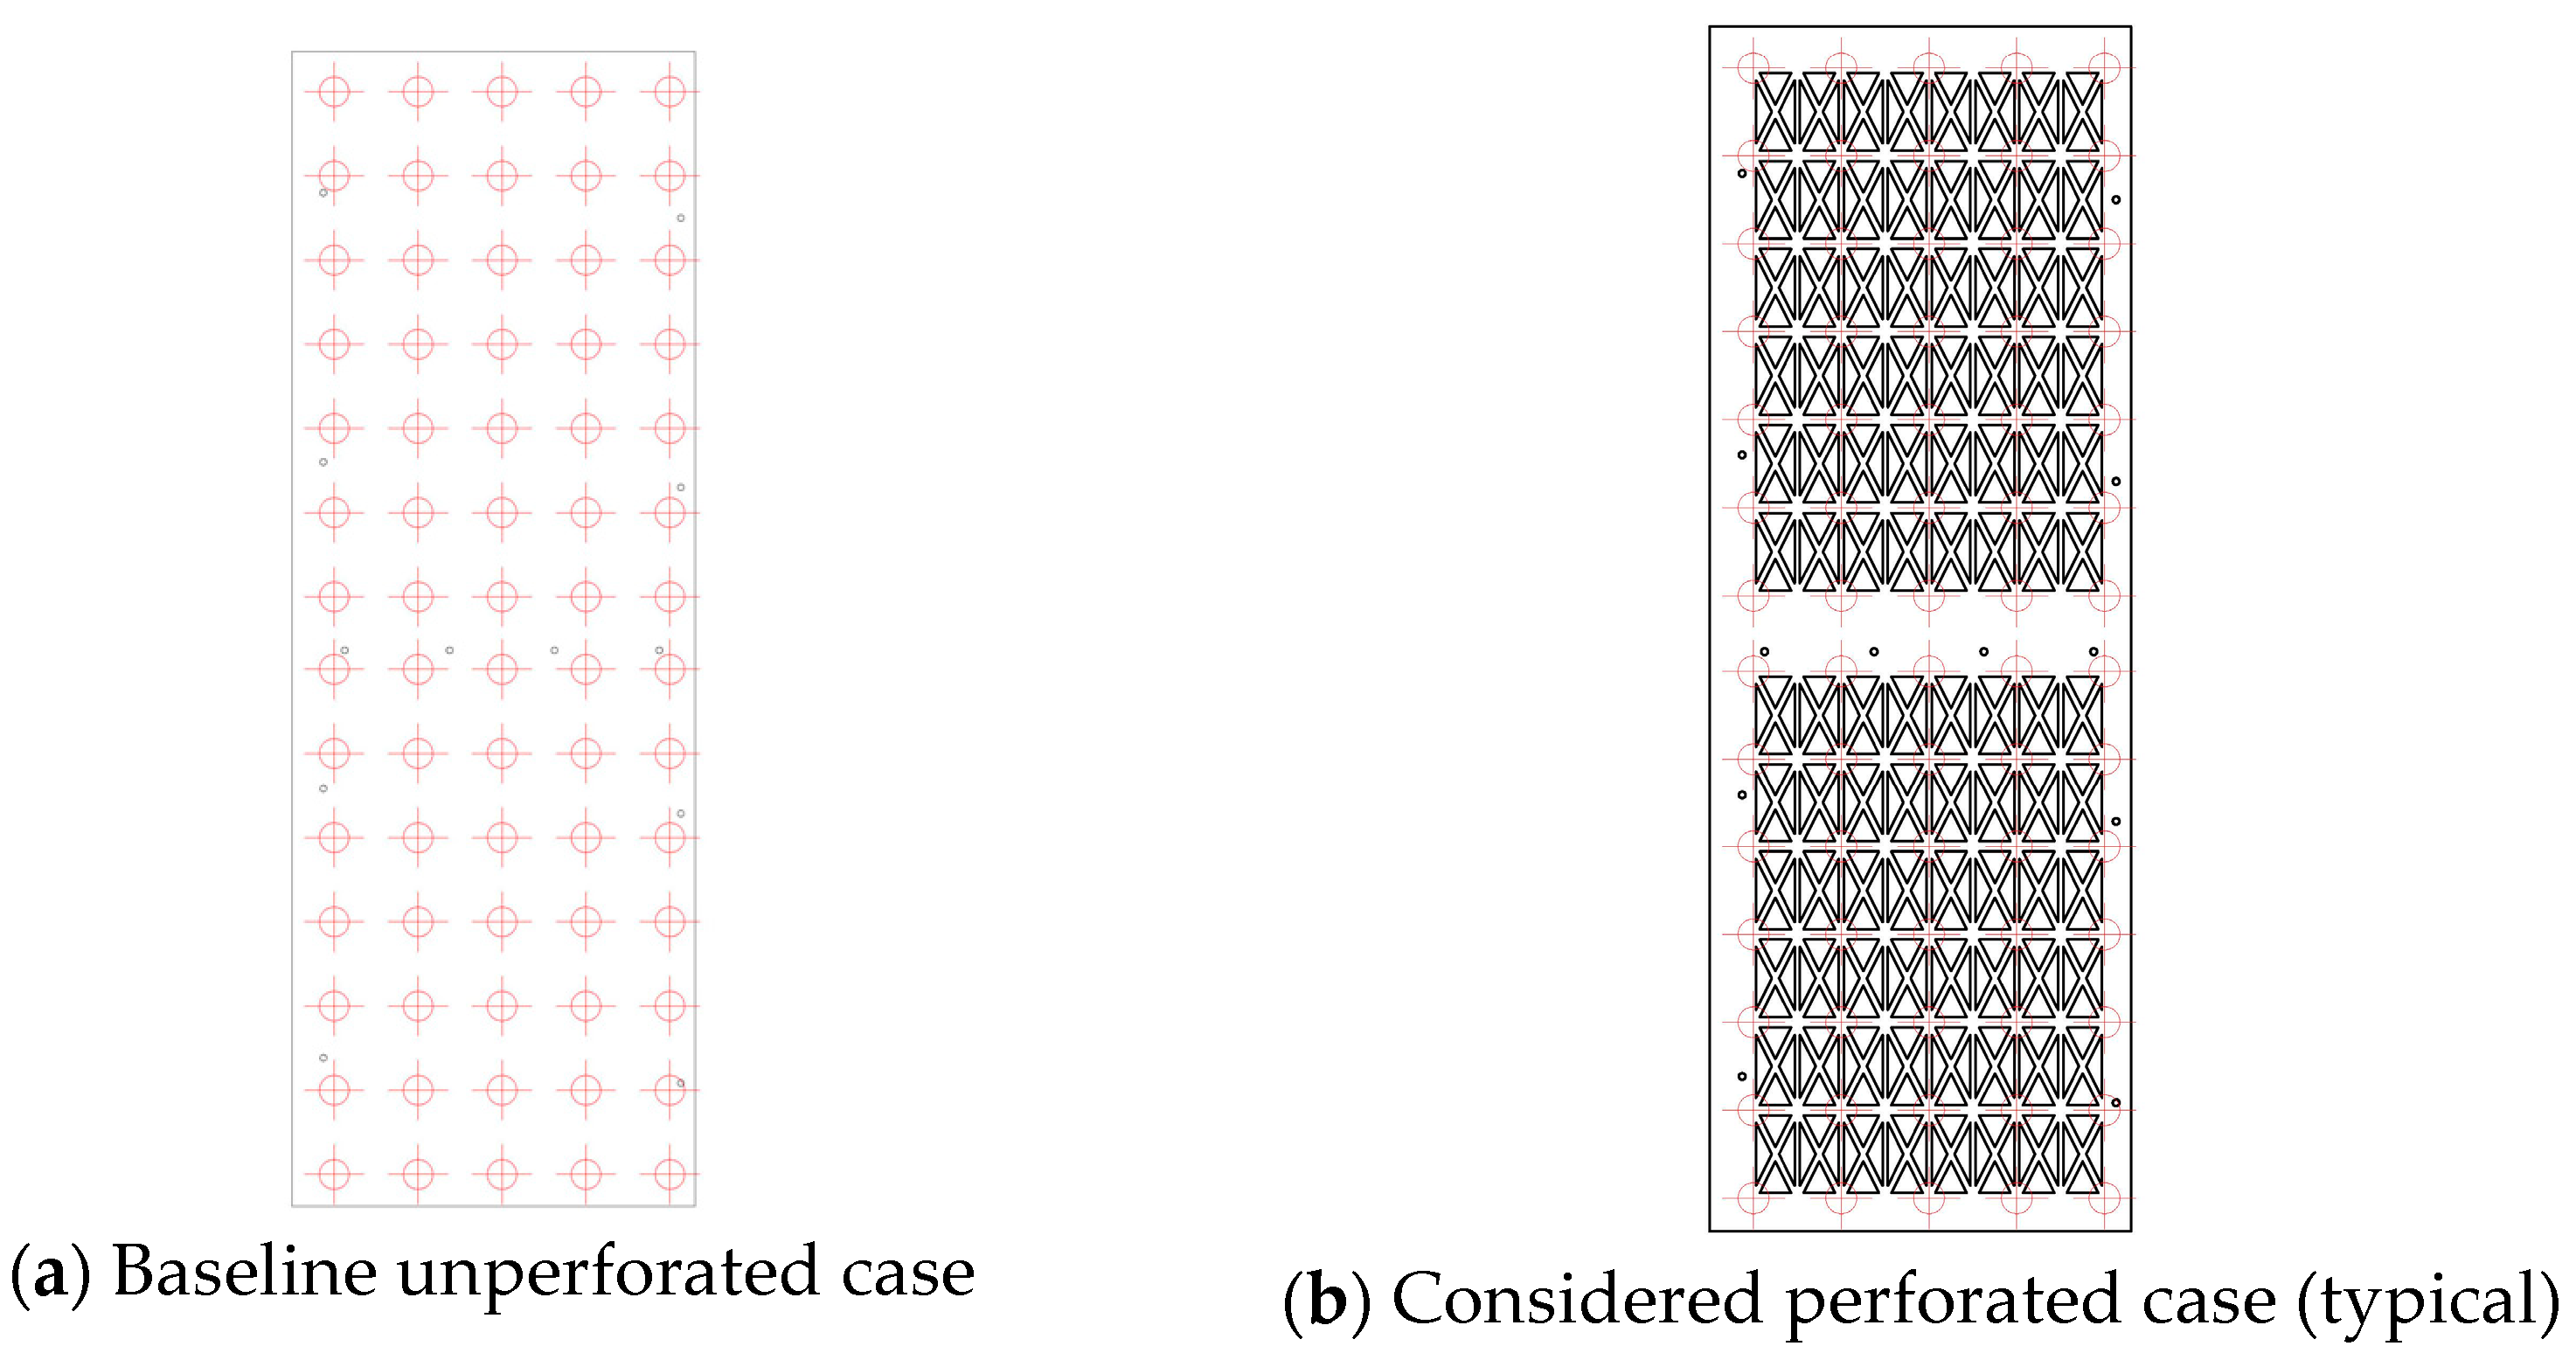
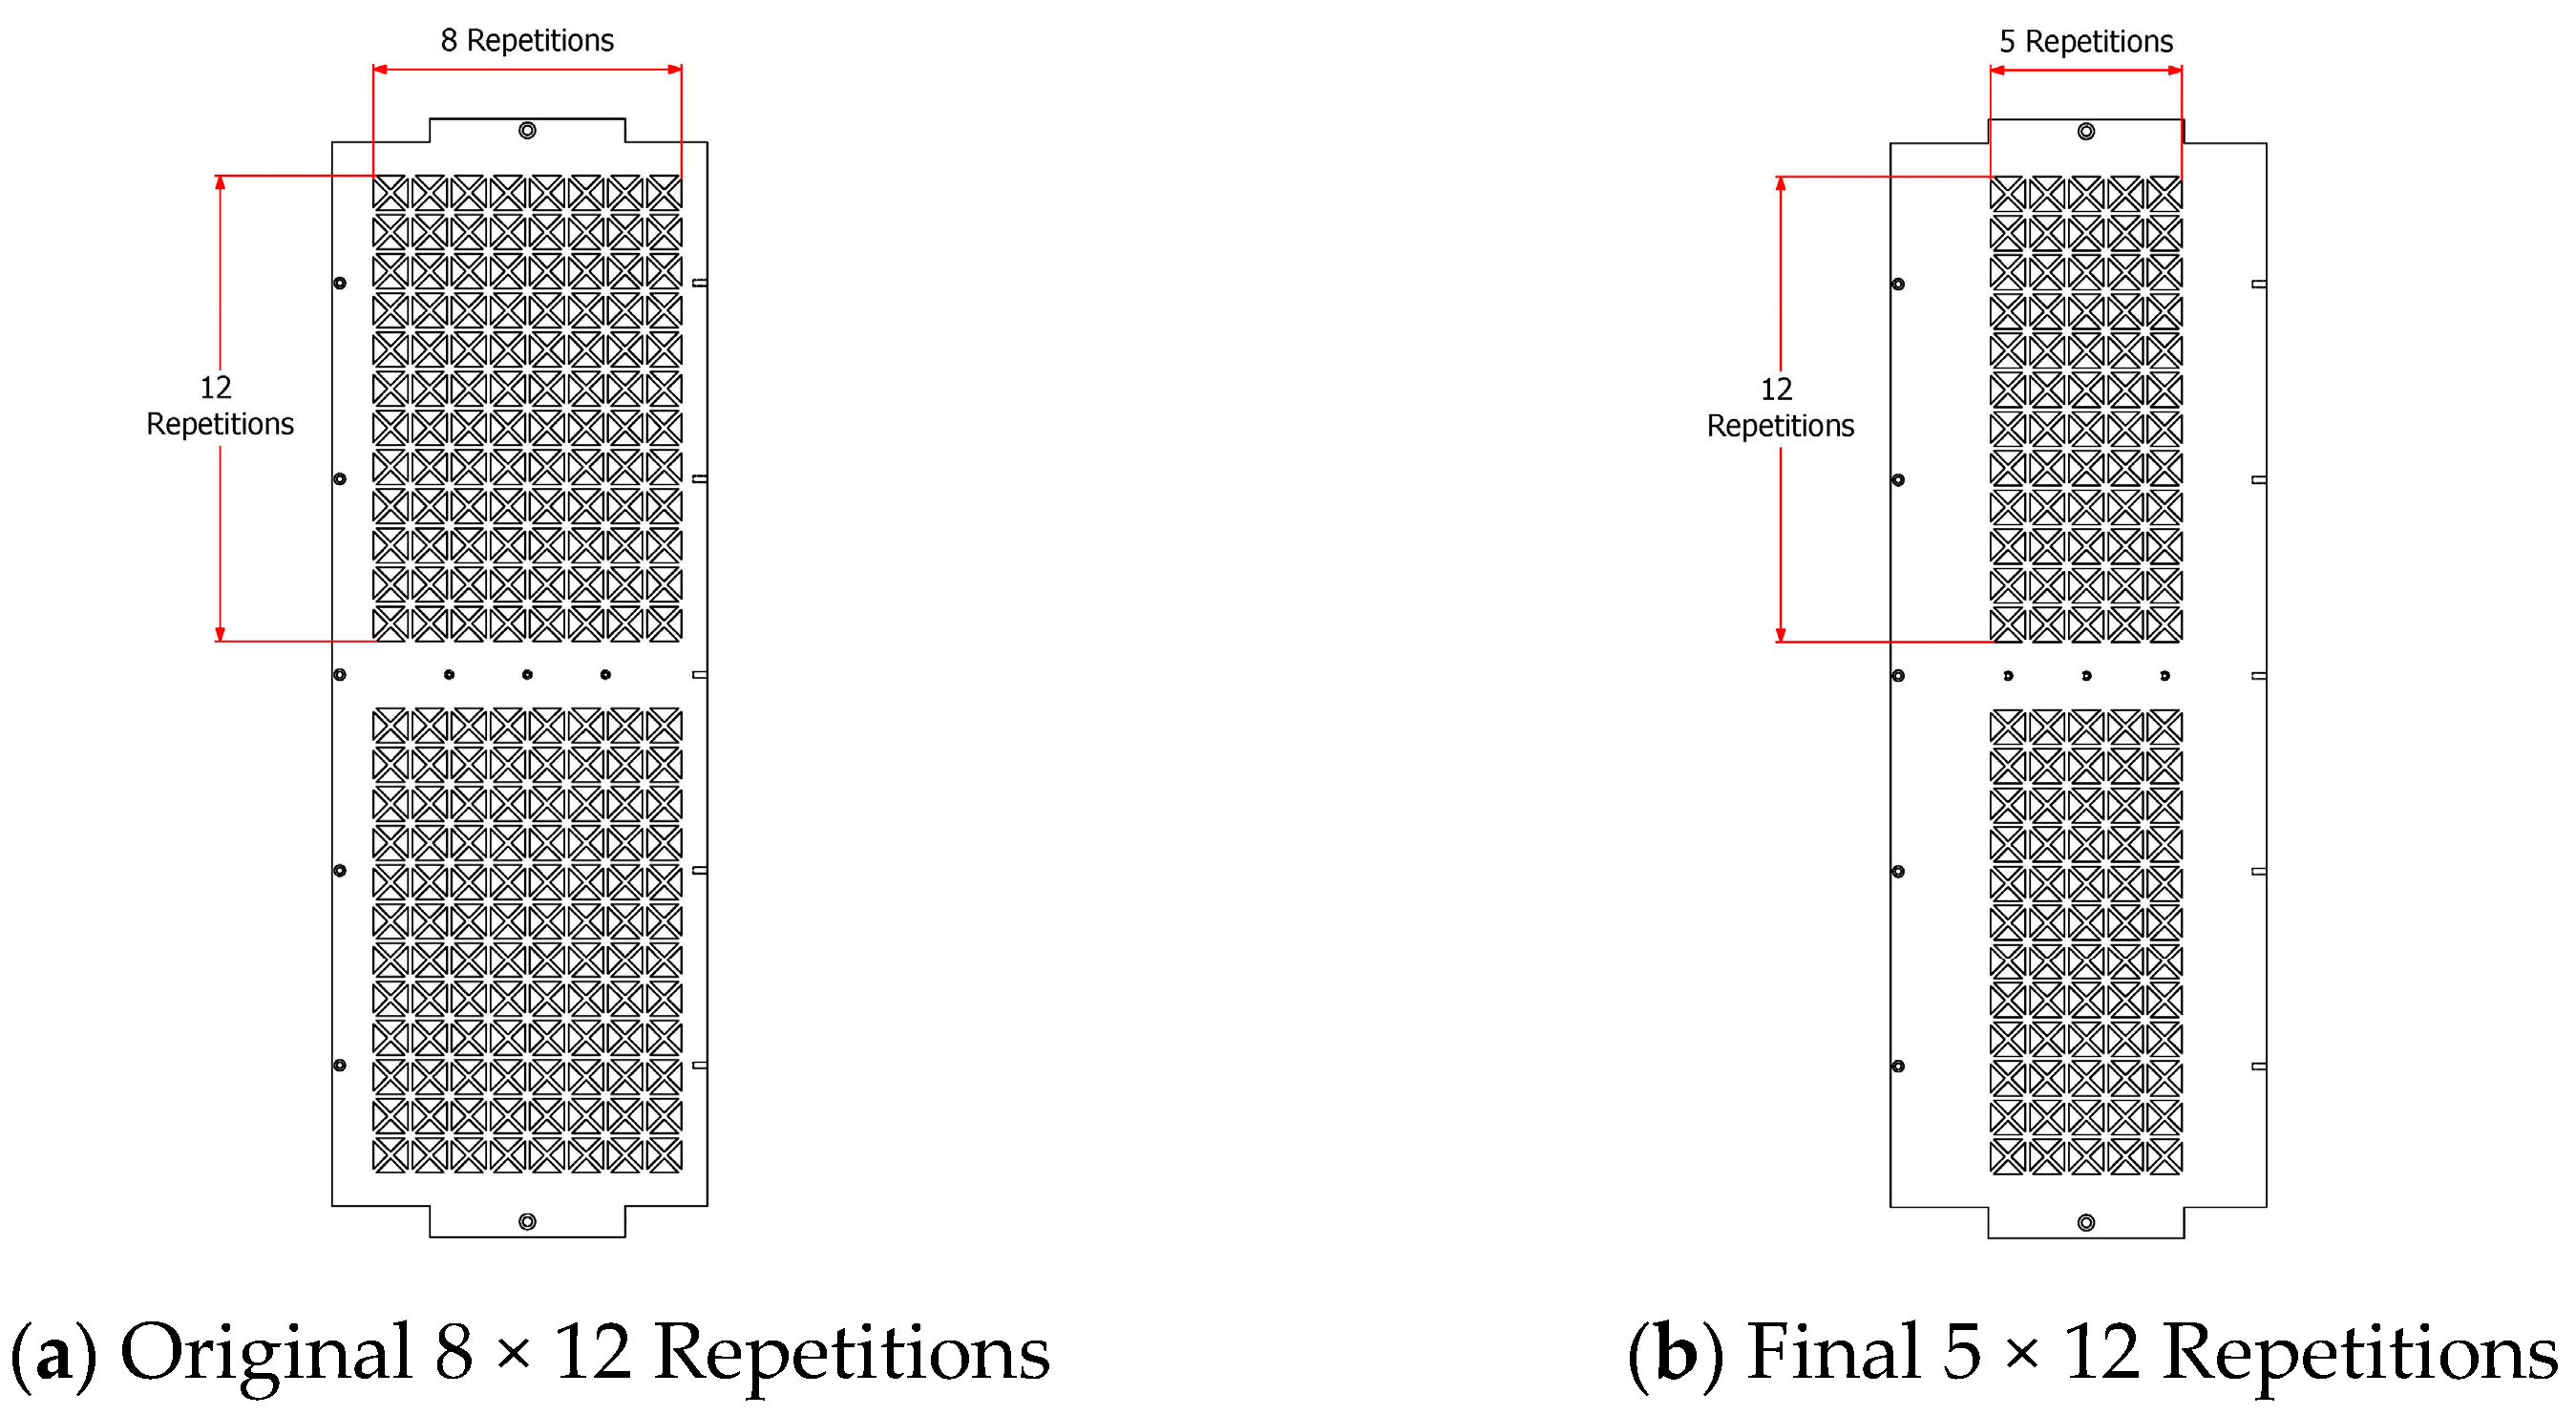
Table 1.
EMA and CMA results for the first six modes for the considered cases.
| (a) Baseline | |||
|---|---|---|---|
| Mode | EMA | CMA | % Diff. |
| Mode 1 | 221.298 | 221.567 | 0.122 |
| Mode 2 | 378.323 | 378.893 | 0.151 |
| Mode 3 | 617.142 | 615.578 | −0.253 |
| Mode 4 | 803.691 | 804.918 | 0.153 |
| Mode 5 | 1214.500 | 1208.320 | −0.509 |
| Mode 6 | 1318.130 | 1321.200 | 0.233 |
| (b) Diamonds | |||
| Mode | EMA | CMA | % Diff. |
| Mode 1 | 177.232 | 181.966 | 2.671 |
| Mode 2 | 279.300 | 278.262 | −0.372 |
| Mode 3 | 488.675 | 502.292 | 2.787 |
| Mode 4 | 561.978 | 557.753 | −0.752 |
| Mode 5 | 967.987 | 983.430 | 1.595 |
| Mode 6 | 1003.000 | 1012.190 | 0.917 |
| (c) Hexagons | |||
| Mode | EMA | CMA | % Diff. |
| Mode 1 | 169.48 | 175.601 | 3.612 |
| Mode 2 | 271.698 | 278.843 | 2.630 |
| Mode 3 | 466.997 | 482.727 | 3.368 |
| Mode 4 | 544.946 | 559.020 | 2.583 |
| Mode 5 | 925.451 | 952.315 | 2.903 |
| Mode 6 | 979.439 | 1011.880 | 3.312 |
| (d) Squares | |||
| Mode | EMA | CMA | % Diff. |
| Mode 1 | 171.871 | 179.358 | 4.356 |
| Mode 2 | 244.215 | 247.487 | 1.34 |
| Mode 3 | 474.773 | 494.985 | 4.257 |
| Mode 4 | 491.956 | 498.041 | 1.237 |
| Mode 5 | 919.222 | 943.009 | 2.588 |
| Mode 6 | 940.318 | 973.101 | 3.486 |
| (e) Triangles | |||
| Mode | EMA | CMA | % Diff. |
| Mode 1 | 177.625 | 182.451 | 2.717 |
| Mode 2 | 278.069 | 277.368 | −0.252 |
| Mode 3 | 493.942 | 506.743 | 2.592 |
| Mode 4 | 561.198 | 557.005 | −0.747 |
| Mode 5 | 970.010 | 982.102 | 1.247 |
| Mode 6 | 1006.16 | 1014.25 | 0.805 |
Table 2.
MAC correlation between the EMA and CMA mode shapes for the first six modes.
| (a) Baseline | |||||||
|---|---|---|---|---|---|---|---|
| CMA | |||||||
| MODES | Mode 1 | Mode 2 | Mode 3 | Mode 4 | Mode 5 | Mode 6 | |
| EMA | Mode 1 | 0.999 | 0.000 | 0.001 | 0.005 | 0.000 | 0.000 |
| Mode 2 | 0.000 | 0.997 | 0.000 | 0.001 | 0.000 | 0.000 | |
| Mode 3 | 0.001 | 0.000 | 0.999 | 0.000 | 0.002 | 0.005 | |
| Mode 4 | 0.004 | 0.000 | 0.000 | 0.999 | 0.001 | 0.001 | |
| Mode 5 | 0.000 | 0.000 | 0.000 | 0.000 | 0.999 | 0.000 | |
| Mode 6 | 0.000 | 0.000 | 0.004 | 0.000 | 0.000 | 0.999 | |
| (b) Diamonds | |||||||
| CMA | |||||||
| MODES | Mode 1 | Mode 2 | Mode 3 | Mode 4 | Mode 5 | Mode 6 | |
| EMA | Mode 1 | 0.997 | 0.001 | 0.000 | 0.003 | 0.003 | 0.000 |
| Mode 2 | 0.000 | 0.990 | 0.000 | 0.001 | 0.000 | 0.008 | |
| Mode 3 | 0.001 | 0.001 | 0.997 | 0.000 | 0.000 | 0.006 | |
| Mode 4 | 0.008 | 0.001 | 0.000 | 0.993 | 0.001 | 0.000 | |
| Mode 5 | 0.002 | 0.000 | 0.000 | 0.000 | 0.975 | 0.003 | |
| Mode 6 | 0.000 | 0.007 | 0.005 | 0.000 | 0.002 | 0.990 | |
| (c) Hexagons | |||||||
| CMA | |||||||
| MODES | Mode 1 | Mode 2 | Mode 3 | Mode 4 | Mode 5 | Mode 6 | |
| EMA | Mode 1 | 0.985 | 0.000 | 0.003 | 0.004 | 0.003 | 0.000 |
| Mode 2 | 0.000 | 0.994 | 0.000 | 0.000 | 0.000 | 0.005 | |
| Mode 3 | 0.001 | 0.000 | 0.988 | 0.000 | 0.001 | 0.006 | |
| Mode 4 | 0.006 | 0.002 | 0.000 | 0.992 | 0.002 | 0.000 | |
| Mode 5 | 0.004 | 0.000 | 0.004 | 0.000 | 0.979 | 0.000 | |
| Mode 6 | 0.000 | 0.001 | 0.004 | 0.003 | 0.000 | 0.992 | |
| (d) Squares | |||||||
| CMA | |||||||
| MODES | Mode 1 | Mode 2 | Mode 3 | Mode 4 | Mode 5 | Mode 6 | |
| EMA | Mode 1 | 0.993 | 0.001 | 0.000 | 0.007 | 0.005 | 0.000 |
| Mode 2 | 0.000 | 0.995 | 0.000 | 0.001 | 0.000 | 0.007 | |
| Mode 3 | 0.005 | 0.001 | 0.991 | 0.002 | 0.001 | 0.007 | |
| Mode 4 | 0.006 | 0.002 | 0.000 | 0.992 | 0.001 | 0.000 | |
| Mode 5 | 0.005 | 0.000 | 0.005 | 0.000 | 0.974 | 0.003 | |
| Mode 6 | 0.000 | 0.004 | 0.005 | 0.001 | 0.001 | 0.990 | |
| (e) Triangles | |||||||
| CMA | |||||||
| MODES | Mode 1 | Mode 2 | Mode 3 | Mode 4 | Mode 5 | Mode 6 | |
| EMA | Mode 1 | 0.990 | 0.000 | 0.001 | 0.011 | 0.000 | 0.006 |
| Mode 2 | 0.000 | 0.997 | 0.000 | 0.000 | 0.005 | 0.000 | |
| Mode 3 | 0.000 | 0.000 | 0.991 | 0.003 | 0.010 | 0.001 | |
| Mode 4 | 0.007 | 0.002 | 0.002 | 0.982 | 0.001 | 0.000 | |
| Mode 5 | 0.000 | 0.002 | 0.005 | 0.000 | 0.980 | 0.008 | |
| Mode 6 | 0.003 | 0.000 | 0.001 | 0.000 | 0.012 | 0.978 | |
Table 3.
Factors related to dynamic launch loads.
| Factor | Value | Description |
|---|---|---|
| Model Factor (KM) | 1.2 | Applied to account for uncertainties in mathematical models when predicting dynamic response, loads, and evaluating load paths. |
| Project Factor (KP) | 1.2 | Applied to account for the degree of maturity of a specific astronautic project in terms of how stable the mass budget is, how well the design is developed, and how much confidence is given to the specifications that have been provided for the project. |
| Yield Factor of Safety (FOSY) | 1.25 | Applied to take into account the possibility of material yielding as a result of load application. It was assumed that structural testing facilities would be available in future stages of the design development. |
Table 4.
Assembled structure fundamental modes.
| Unperforated (Baseline) | |||
| 113.93 Hz | |||
 | |||
| Half Scale | |||
| Diamonds | Hexagons | Squares | Triangles |
| 104.55 Hz | 92.33 Hz | 91.95 Hz | 105.95 Hz |
 |  |  |  |
| Double Scale | |||
| Diamonds | Hexagons | Squares | Triangles |
| 104.26 Hz | 89.68 Hz | 87.74 Hz | 104.94 Hz |
 |  |  |  |
| 1.0 Aspect Ratio/Full Scale | |||
| Diamonds | Hexagons | Squares | Triangles |
| 104.21 Hz | 89.74 Hz | 89.71 Hz | 105.42 Hz |
 |  |  |  |
| 0.5 Aspect Ratio | |||
| Diamonds | Hexagons | Squares | Triangles |
| 102.66 Hz | 99.21 Hz | 84.51 Hz | 105.07 Hz |
 |  |  |  |
| 2.0 Aspect Ratio | |||
| Diamonds | Hexagons | Squares | Triangles |
| 98.58 Hz | 76.41 Hz | 79.95 Hz | 97.34 Hz |
 |  |  |  |
Table 5.
Fundamental natural frequencies for the half scale triangles case.
| Fully Perforated | All Components Unperforated Except | |||
|---|---|---|---|---|
| Central Box Perforated | Middle Plate Perforated | Side Plates Perforated | ||
| Assembly Fundamental Natural Frequency (Hz) | 105.95 | 99.73 | 117.36 | 122.97 |
| Total Assembly Mass (kg) | 62.42 | 77.82 | 82.58 | 70.98 |
Table 6.
Fundamental natural frequency and total mass for the unit area repetition cases.
| (a) 12 Unit Area Repetitions | ||||
| Unit Area Repetitions | 8 × 12 | 6 × 12 | 5 × 12 | 4 × 12 |
| Assembly Fundamental Natural Frequency (Hz) | 105.95 | 111.91 | 114.11 | 116.03 |
| Total Assembly Mass (kg) | 62.42 | 64.09 | 64.92 | 65.75 |
| (Mass Reduction from Baseline Unperforated (%)) | (26.11) | (24.14) | (23.15) | (22.17) |
| (b) 10 Unit Area Repetitions | ||||
| Unit Area Repetitions | 8 × 10 | 6 × 10 | 5 × 10 | 4 × 10 |
| Assembly Fundamental Natural Frequency (Hz) | 107.29 | 113.11 | 115.19 | 117.00 |
| Total Assembly Mass (kg) | 63.53 | 64.92 | 65.61 | 66.31 |
| (Mass Reduction from Baseline Unperforated (%)) | (24.80) | (23.15) | (22.34) | (21.51) |
| (c) 8 Unit Area Repetitions | ||||
| Unit Area Repetitions | 8 × 8 | 6 × 8 | 5 × 8 | 4 × 8 |
| Assembly Fundamental Natural Frequency (Hz) | 109.26 | 114.40 | 116.29 | 117.89 |
| Total Assembly Mass (kg) | 64.64 | 65.75 | 66.31 | 66.86 |
| (Mass Reduction from Baseline Unperforated (%)) | (23.48) | (22.17) | (21.51) | (20.86) |
Table 7.
Comparison between the mode shapes and natural frequencies of the baseline unperforated and final perforated designs.
Table 7.
Comparison between the mode shapes and natural frequencies of the baseline unperforated and final perforated designs.
| Mode | Baseline Unperforated | Final Perforated |
|---|---|---|
| Mode 1 |  113.931 Hz |  114.112 Hz |
| Mode 2 |  123.000 Hz |  137.190 Hz |
| Mode 3 |  271.200 Hz |  228.294 Hz |
| Mode 4 |  277.717 Hz |  228.606 Hz |
| Mode 5 |  309.120 Hz |  235.842 Hz |
| Mode 6 |  312.896 Hz |  236.415 Hz |
Table 8.
Comparison between the effective modal mass fractions of the baseline unperforated and final perforated designs.
Table 8.
Comparison between the effective modal mass fractions of the baseline unperforated and final perforated designs.
| (a) Baseline Unperforated Design | ||||||
|---|---|---|---|---|---|---|
| Mode | Degree of Freedom | |||||
| T1 | T2 | T3 | R1 | R2 | R3 | |
| Mode 1 | 25.2163 | 26.5313 | 0.0012 | 50.7786 | 48.2635 | 0.0000 |
| Mode 2 | 0.0083 | 0.0014 | 59.6165 | 0.0028 | 0.0164 | 0.0000 |
| Mode 3 | 0.0022 | 0.0031 | 0.0014 | 0.0002 | 0.0003 | 0.0000 |
| Mode 4 | 0.0024 | 0.0114 | 0.7140 | 0.0003 | 0.0000 | 0.0000 |
| Mode 5 | 0.0000 | 0.0003 | 0.0000 | 0.0001 | 0.0000 | 0.0000 |
| Mode 6 | 0.0000 | 0.0008 | 0.0019 | 0.0003 | 0.0000 | 0.0001 |
| (b) Final Perforated Design | ||||||
| Mode | Degree of Freedom | |||||
| T1 | T2 | T3 | R1 | R2 | R3 | |
| Mode 1 | 14.7388 | 33.1611 | 0.0001 | 68.4071 | 30.4100 | 0.0000 |
| Mode 2 | 0.0000 | 0.0004 | 54.6244 | 0.0008 | 0.0000 | 0.0000 |
| Mode 3 | 0.0339 | 0.0333 | 0.0312 | 0.0010 | 0.0016 | 0.0002 |
| Mode 4 | 0.0187 | 0.0351 | 0.0029 | 0.0014 | 0.0006 | 0.0000 |
| Mode 5 | 0.0000 | 0.0000 | 0.0000 | 0.0000 | 0.0000 | 0.0000 |
| Mode 6 | 0.0000 | 0.0000 | 0.0013 | 0.0000 | 0.0000 | 0.000 |
Table 9.
Maximum displacements from quasi-static launch loadings.
| Longitudinal (-Z) loading direction | Lateral (-X) loading direction | Lateral (-Y) loading direction | |
| Baseline unperforated |  |  |  |
| Finalized perforated |  |  |  |
Table 10.
Summary of quasi-static loading analysis results.
| Loading Direction | Result Set | Baseline Unperforated | Finalized Perforated |
|---|---|---|---|
| Longitudinal (-Z) | Maximum displacement | 4.15 × 10⁻⁴ m | 3.51 × 10⁻⁴ m |
| Maximum Von Mises stress | 4.57 × 10⁷ N/m2 | 2.85 × 10⁷ N/m2 | |
| MoS | 3.832 | 7.747 | |
| Lateral (-X) | Maximum displacement | 4.85 × 10⁻⁴ m | 4.73 × 10⁻⁴ m |
| Maximum Von Mises stress | 2.02 × 10⁸ N/m2 | 1.53 × 10⁸ N/m2 | |
| MoS | 0.093 | 0.443 | |
| Lateral (-Y) | Maximum displacement | 4.85 × 10⁻⁴ m | 4.73 × 10⁻⁴ m |
| Maximum Von Mises stress | 2.02 × 10⁸ N/m2 | 1.53 × 10⁸ N/m2 | |
| MoS | 0.093 | 0.443 |
Publisher’s Note: MDPI stays neutral with regard to jurisdictional claims in published maps and institutional affiliations. |
© 2022 by the authors. Licensee MDPI, Basel, Switzerland. This article is an open access article distributed under the terms and conditions of the Creative Commons Attribution (CC BY) license (https://creativecommons.org/licenses/by/4.0/).
Share and Cite
MDPI and ACS Style
Dawood, S.D.S.; Harithuddin, A.S.M.; Harmin, M.Y. Modal Analysis of Conceptual Microsatellite Design Employing Perforated Structural Components for Mass Reduction. Aerospace 2022, 9, 23. https://doi.org/10.3390/aerospace9010023
AMA Style
Dawood SDS, Harithuddin ASM, Harmin MY. Modal Analysis of Conceptual Microsatellite Design Employing Perforated Structural Components for Mass Reduction. Aerospace. 2022; 9(1):23. https://doi.org/10.3390/aerospace9010023
Chicago/Turabian StyleDawood, Sarmad Dawood Salman, Ahmad Salahuddin Mohd Harithuddin, and Mohammad Yazdi Harmin. 2022. "Modal Analysis of Conceptual Microsatellite Design Employing Perforated Structural Components for Mass Reduction" Aerospace 9, no. 1: 23. https://doi.org/10.3390/aerospace9010023
Note that from the first issue of 2016, this journal uses article numbers instead of page numbers. See further details here.