Minimum-Cost Drone–Nest Matching through the Kuhn–Munkres Algorithm in Smart Cities: Energy Management and Efficiency Enhancement


1
Department of Computer Science and Engineering, New Mexico Tech, Socorro, NM 87801, USA
2
Department of Mechanical Engineering, New Mexico Tech, Socorro, NM 87801, USA
*
Author to whom correspondence should be addressed.
Aerospace 2019, 6(11), 125; https://doi.org/10.3390/aerospace6110125
Submission received: 15 October 2019
/
Revised: 10 November 2019
/
Accepted: 15 November 2019
/
Published: 17 November 2019
(This article belongs to the Special Issue Biomimetics in Aerospace Engineering)
Abstract
:The development of new concepts for smart cities and the application of drones in this area requires different architecture for the drones’ stations (nests) and their placement. Drones’ stations are designed to protect drones from hazards and utilize charging mechanisms such as solar cells to recharge them. Increasing the number of drones in smart cities makes it harder to find the optimum station for each drone to go to after performing its mission. In classic ordered technique, each drone returns to its preassigned station, which is shown to be not very efficient. Greedy and Kuhn–Munkres (Hungarian) algorithms are used to match the drone to the best nesting station. Three different scenarios are investigated in this study; (1) drones with the same level of energy, (2) drones with different levels of energy, and (3) drones and stations with different levels of energy. The results show that an energy consumption reduction of 25–80% can be achieved by applying the Kuhn–Munkres and greedy algorithms in drone–nest matching compared to preassigned stations. A graphical user interface is also designed to demonstrate drone–station matching through the Kuhn–Munkres and greedy algorithms.
1. Introduction
In recent years, the concept of smart cities has been developing rapidly. The main goal of smart cities is improving the quality of the life of the residents [1,2,3,4]. Smart cities deploy many different sensors to capture information from different parts of the city, such as on traffic, air pollution, waste, rain and snow, electric grids, etc. [5,6,7]. Different parts of the smart cities make up the smart environment, such as smart water, smart metering, security and emergency, retail, logistic, industrial control, smart agriculture, smart animal farming, domotic and home automation, and eHealth [8,9]. Different types of fixed and mobile means are proposed to achieve the abovementioned goals.
Unmanned aerial vehicles (UAVs) or drones are the main mobile means to perform different functionalities [10,11,12,13,14,15]. For a decade, autonomous systems have received more attention than before, which has led to the invention of a wide range of mobile vehicles with various configurations [16]. For example, drones are categorized in a broad spectrum and equipped with different types of sensors. Drones can perform various types of missions in urban environments as well as indoor spaces depending on their shape, size, and capabilities [16]. To perform different types of missions in smart cities, drones should be able to satisfy given performance requirements, such as high performance, high endurance, hovering capabilities, robustness, and the ability to withstand potential obstacles [17]. In smart city applications, drones equipped with various sensors can be used for reconnaissance, surveillance, delivery, search and rescue, and other missions that cannot be carried out without multifunctional sensors [18].
As the applications of drones are increasing, it is expected that they will play a key role in the future of smart cities. Information and communication technology (ICT) solutions are used in smart cities for various applications. Generally, the design of smart cities requires the integration of ICT and other physical tools, infrastructure, and services [8]. Unmanned aerial systems, as one of these physical tools, can contribute to achieving the future goals of smart cities. The use of drones in smart cities will continue to increase at a fast pace, due to their diverse applications.
Different researchers have performed studies on the uses of drones in smart cities. For example, Mohammed et al. in 2014 investigated the applications of drones in smart cities, in addition to their challenges and opportunities [19]. In 2014, Yu et al. described a cooperative path planning algorithm for tracking a moving target in urban environments using both drones and autonomous ground vehicles. This algorithm was able to consider the vision occlusions due to obstacles in urban environments. In this work, a dynamic occupancy grid was used to model the target state [20]. In 2015, Ataei and Paschalidis deployed multirotor drones for surveying damage and providing aid after disasters. They provided object avoidance algorithms and path planning that depend only on local environmental sensing [21]. Foina et al., in 2015, focused on the using of microdrones in highly populated cities to deliver goods and information. They proposed a cloud-based system for city-wide unmanned air traffic management and the analysis of control systems for collision avoidance [22]. A similar study was also carried out by Gallacher in 2015 for utilizing high- and low-altitude drones for urban environmental analysis and addressing the concerns about their security, privacy, and safety [23]. In 2016, Vattapparamban et al. discussed the technical and societal concerns and challenges that need to be addressed in smart cities, such as privacy, cybersecurity, and public safety [24]. In the same year, Jensen also addressed drones and their potential relationship with the city from a “motilities design” point of view [25].
Menouar et al. highlighted the challenges and potential of drone-enabled ITS for the next generation of smart cities in 2017 [26]. In 2018, Asghar Khan et al. elaborated the key role of unmanned aerial systems in a smart city for applications such as traffic monitoring, policing, package delivery, ambulance drones, pollution control drones, and firefighting and rescue operations [27]. In 2018, Yang and Yoo used multi-objective bio-inspired algorithms to develop an optimal flight path planning approach for drones [28]. In their methodology, they applied ant colony optimization and joint genetic algorithm to find possible drone flight paths, considering energy, time, and risk utilities [28]. Bahabry et al., in 2019, proposed a path routing approach for multiple multirotor drones in urban environments with the presence of different obstacles with different heights [29]. The objective of their work was to find the best trajectories in urban areas while ensuring collision-free navigation. In this work, a mixed-integer linear program was developed to achieve the optimal navigation of the fleet [29]. In 2019, Ghazzai et al. developed a generic management framework of drones for intelligent transportation systems applications [30]. In this study, they investigated the problem of charging station placement in urban environments to find the best locations for a given number of stations and drones. The flying time and the risk of battery failure of the drone during the mission were taken into consideration. Ghazzai et al. applied particle swarm optimization algorithm and a penalized weighted k-means algorithm for this purpose [30].
As discussed above, besides the research performed on path planning and collision avoidance in smart cities, the safety and crash resilience of drones in these cluttered environments is important. Thus, the configuration of the drones operating in smart cities should be taken into consideration. There have been some efforts toward designing and manufacturing drones that can fly safely in the presence of people and obstacles. In 2012, Briod et al., inspired by insects, developed a new class of flying robots that can recover from collisions [31]. Mulgaonkar et al., in 2016, designed, fabricated, and tested a novel lightweight yet sturdy cage for micro aerial vehicle drones [32]. In 2018, Sareh et al. designed and developed a novel impact protection system for a drone to be able to fly easily, safely, and efficiently in cluttered environments [33,34]. Recently, spherical drones and drones with cages have been designed for confined spaces and can be also applied in urban environments [35,36].
Most previous studies focused on the applications of drones in smart cities, path planning, and urban obstacle avoidance. There are no consolidated efforts in terms of how drones should be distributed and how they can be more efficient in terms of energy in smart cities. One of the main issues raised about applying drones in smart cities is assigning the charging stations for drones before and after performing the missions. Drones, after performing their missions in a smart environment, should be able to return to their stations to be recharged. The main objective of this paper is to determine which station is most suitable for a drone to land at after accomplishing its mission. Thus, in this paper, we propose an innovative concept for the optimized networking and assigning of stations for drones. The Kuhn–Munkres and greedy algorithms are used to minimize the power required for the drones to land in the defined stations in smart cities.
The rest of this paper is organized as follows. In Section 2, the applications of drones in smart cities are presented. Drones’ nests and charging stations are discussed in Section 3. In Section 4 and Section 5, drone–nest matching and the Kuhn–Munkres algorithm for power consumption of drone stations are described, respectively. Matching demonstration through Kuhn–Munkres and greedy algorithms is presented in Section 6. A summary and conclusions are given in Section 7.
2. Drone Applications in Smart Cities
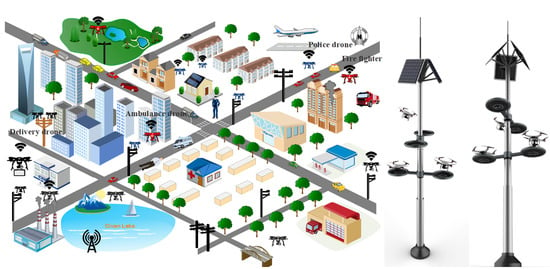
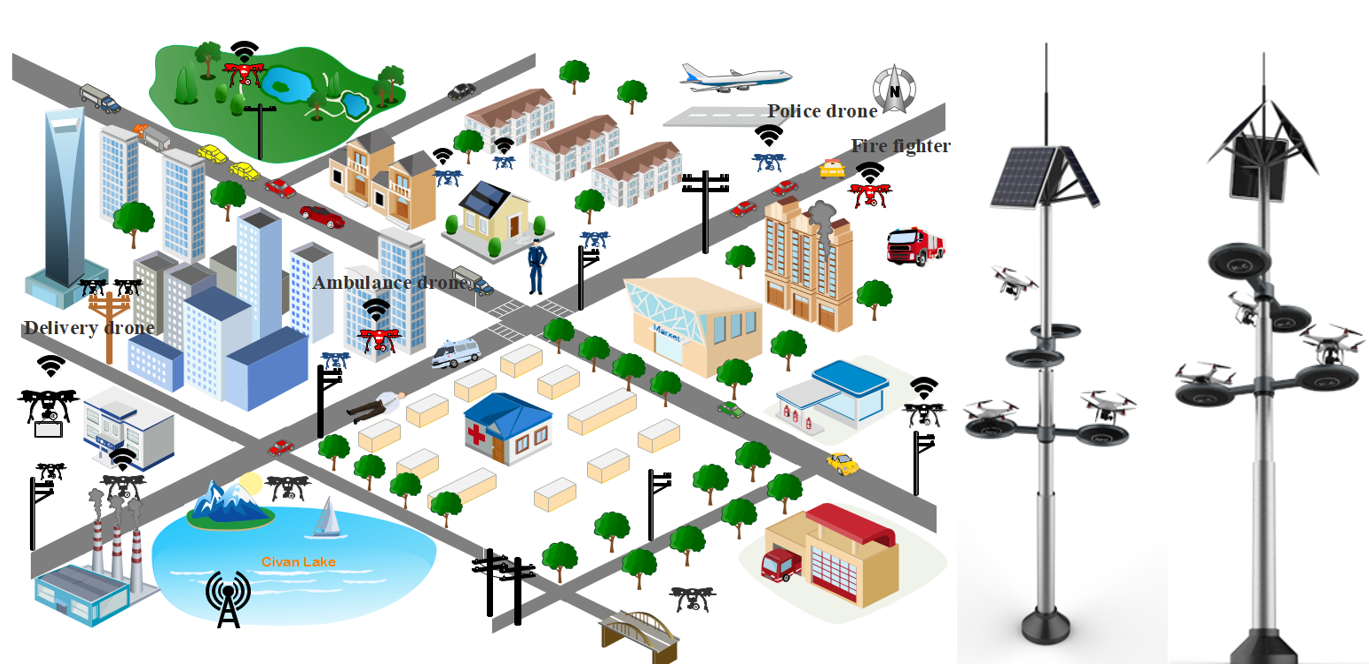
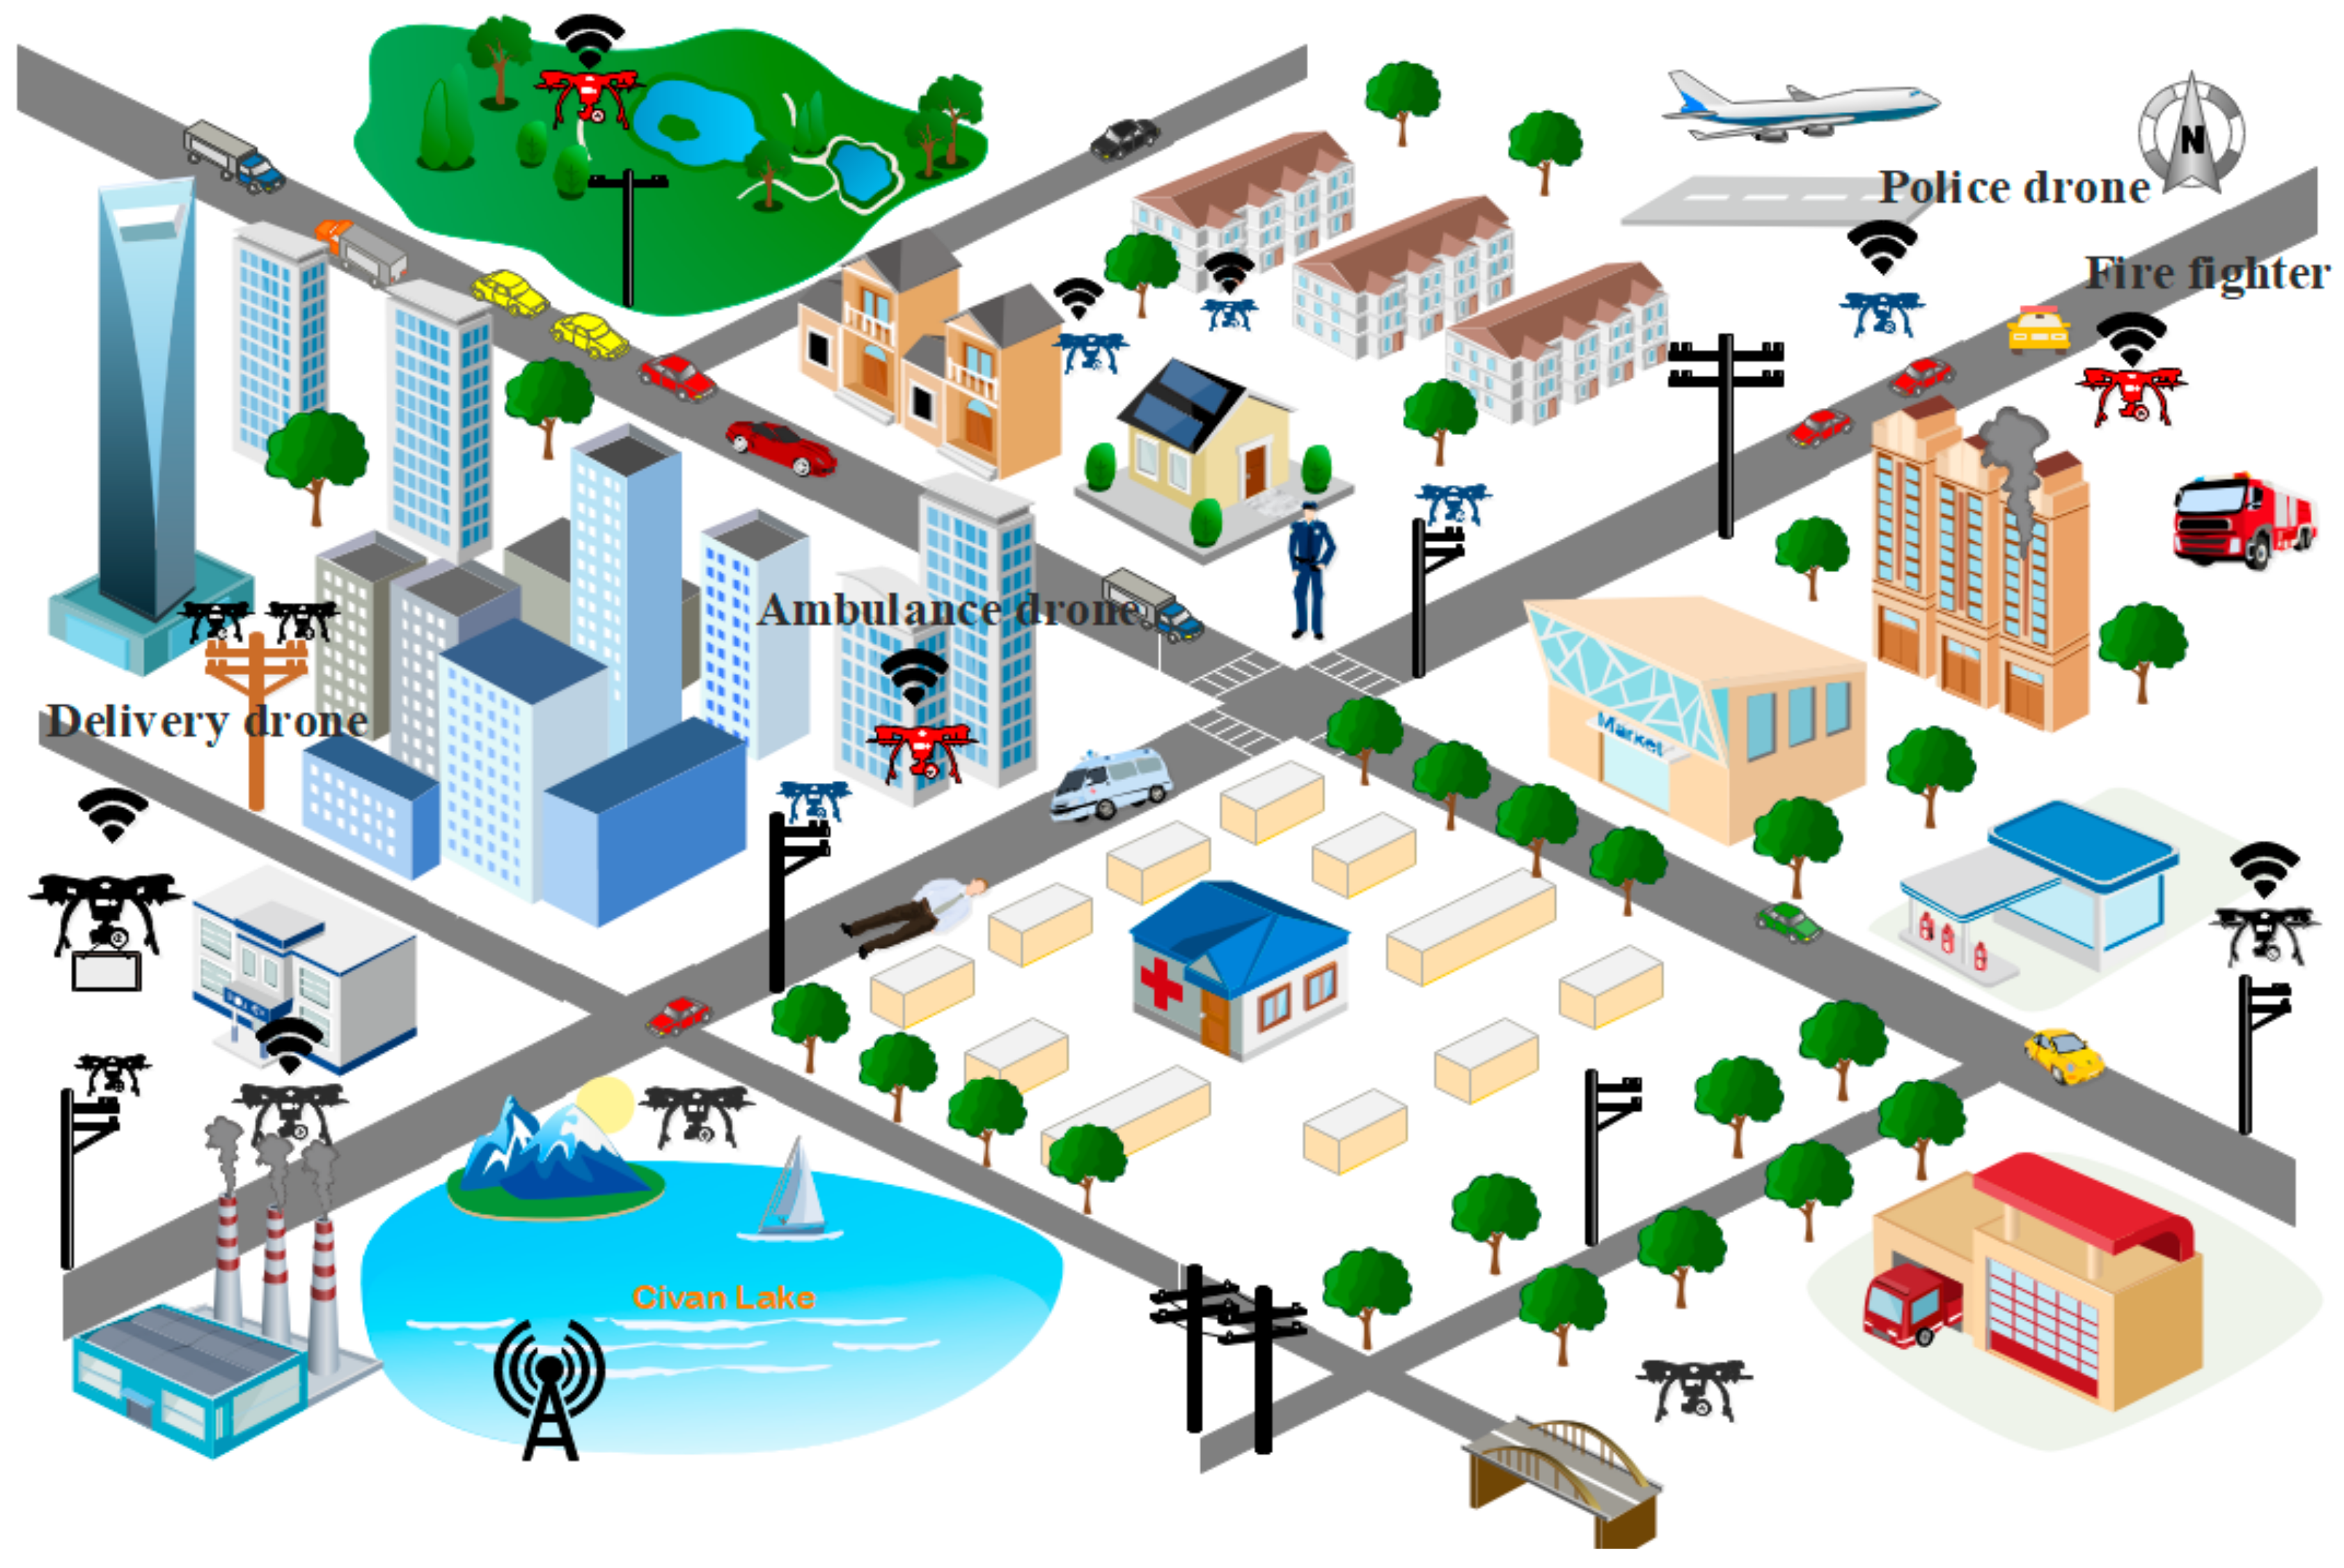
Drones have a wide range of applications in cities, beaches, highways, deserts, forests, state and national parks, etc. [16]. They can be used for hazardous environment and pollution monitoring, traffic management, cargo delivery, emergency response, and civil applications. They can even serve as mobile hotspots for broadband wireless access [16]. Considering the aforementioned applications, it is necessary to locate a certain type of drone in specific areas as each drone has different objectives and applications. For this purpose, a geographic information system (GIS) can be utilized to specify the applications of drones in different areas. This implies that one needs to create a GIS map for the applications of drones. Following this study, the best locations for the drones’ stations and the appropriate configurations of the drones can be specified. In the sequel, the applications of drones in a smart city can be classified into three major categories: civil, emergency, and governmental applications. Some examples and suggested locations for drones’ stations are shown in Table 1.
A schematic view of the proposed applications and drones’ locations is shown in Figure 1.
3. Drones’ Nests and Charging Stations
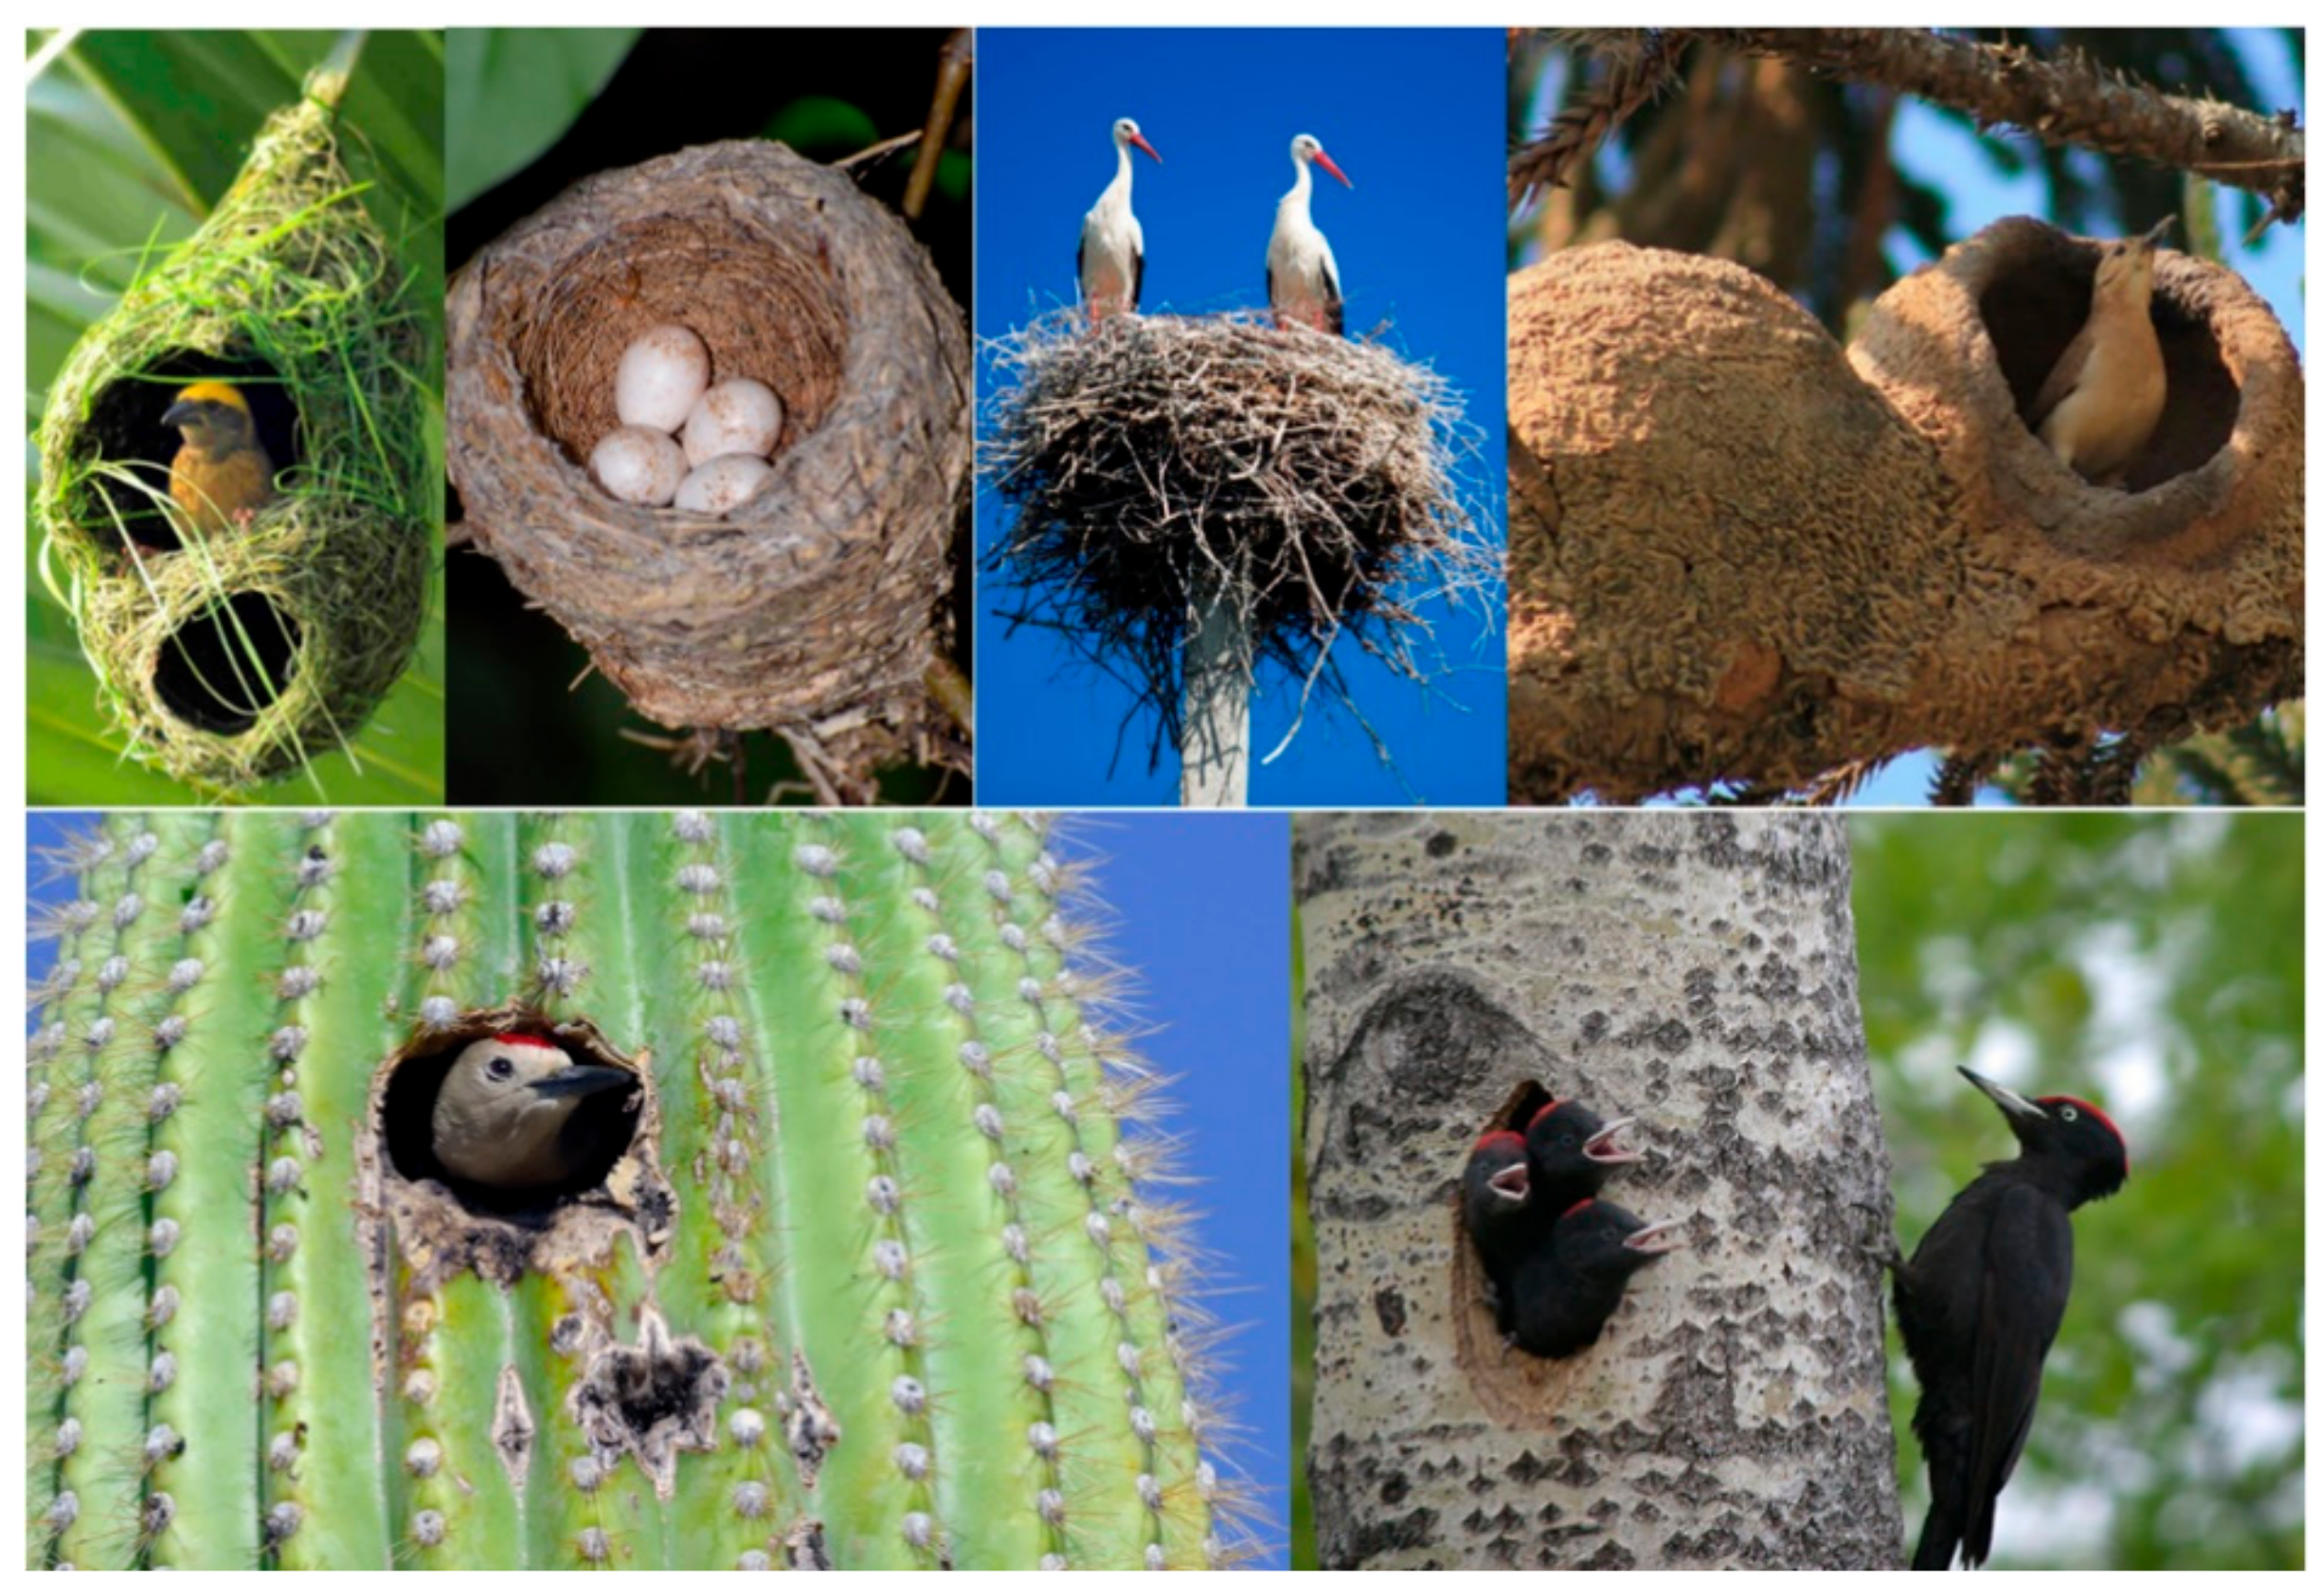
Inspired by the nests of birds, different objects available in cities can be considered as possible stands for drone stations. These stations can be used for charging and protecting the drones. Various stations have been designed by companies like Amazon to charge drones. Amazon has recently patented docking stations that can be integrated into buildings, streetlights, power poles, and cell towers [37]. In 2017 SkyX Company made a vertical takeoff landing fixed-wing drone that can land on small charging stations set up in fields alongside oil and gas pipelines [38]. The designed drones are able to fly long distances and leap from station to station to recharge [38]. Riskmatrix Company has also designed a drone docking station at which drones can be stationed in standby mode and be protected against bad weather conditions [39]. Some researchers also proposed docking mechanisms for charging the drones. For example, in 2015, a spherical drone-docking concept was designed by Bruni and Sardo to provide a place for drones to settle during bad weather and between tasks [40].
Since nature has developed processes, objects, and materials to increase its efficiency, it has the best solutions when we seek to improve or optimize a system [41,42,43,44]. Nature and especially birds’ nests and locations provide ideas for designing stations for drones in smart city applications. In Figure 2, different types of birds’ nests are shown.
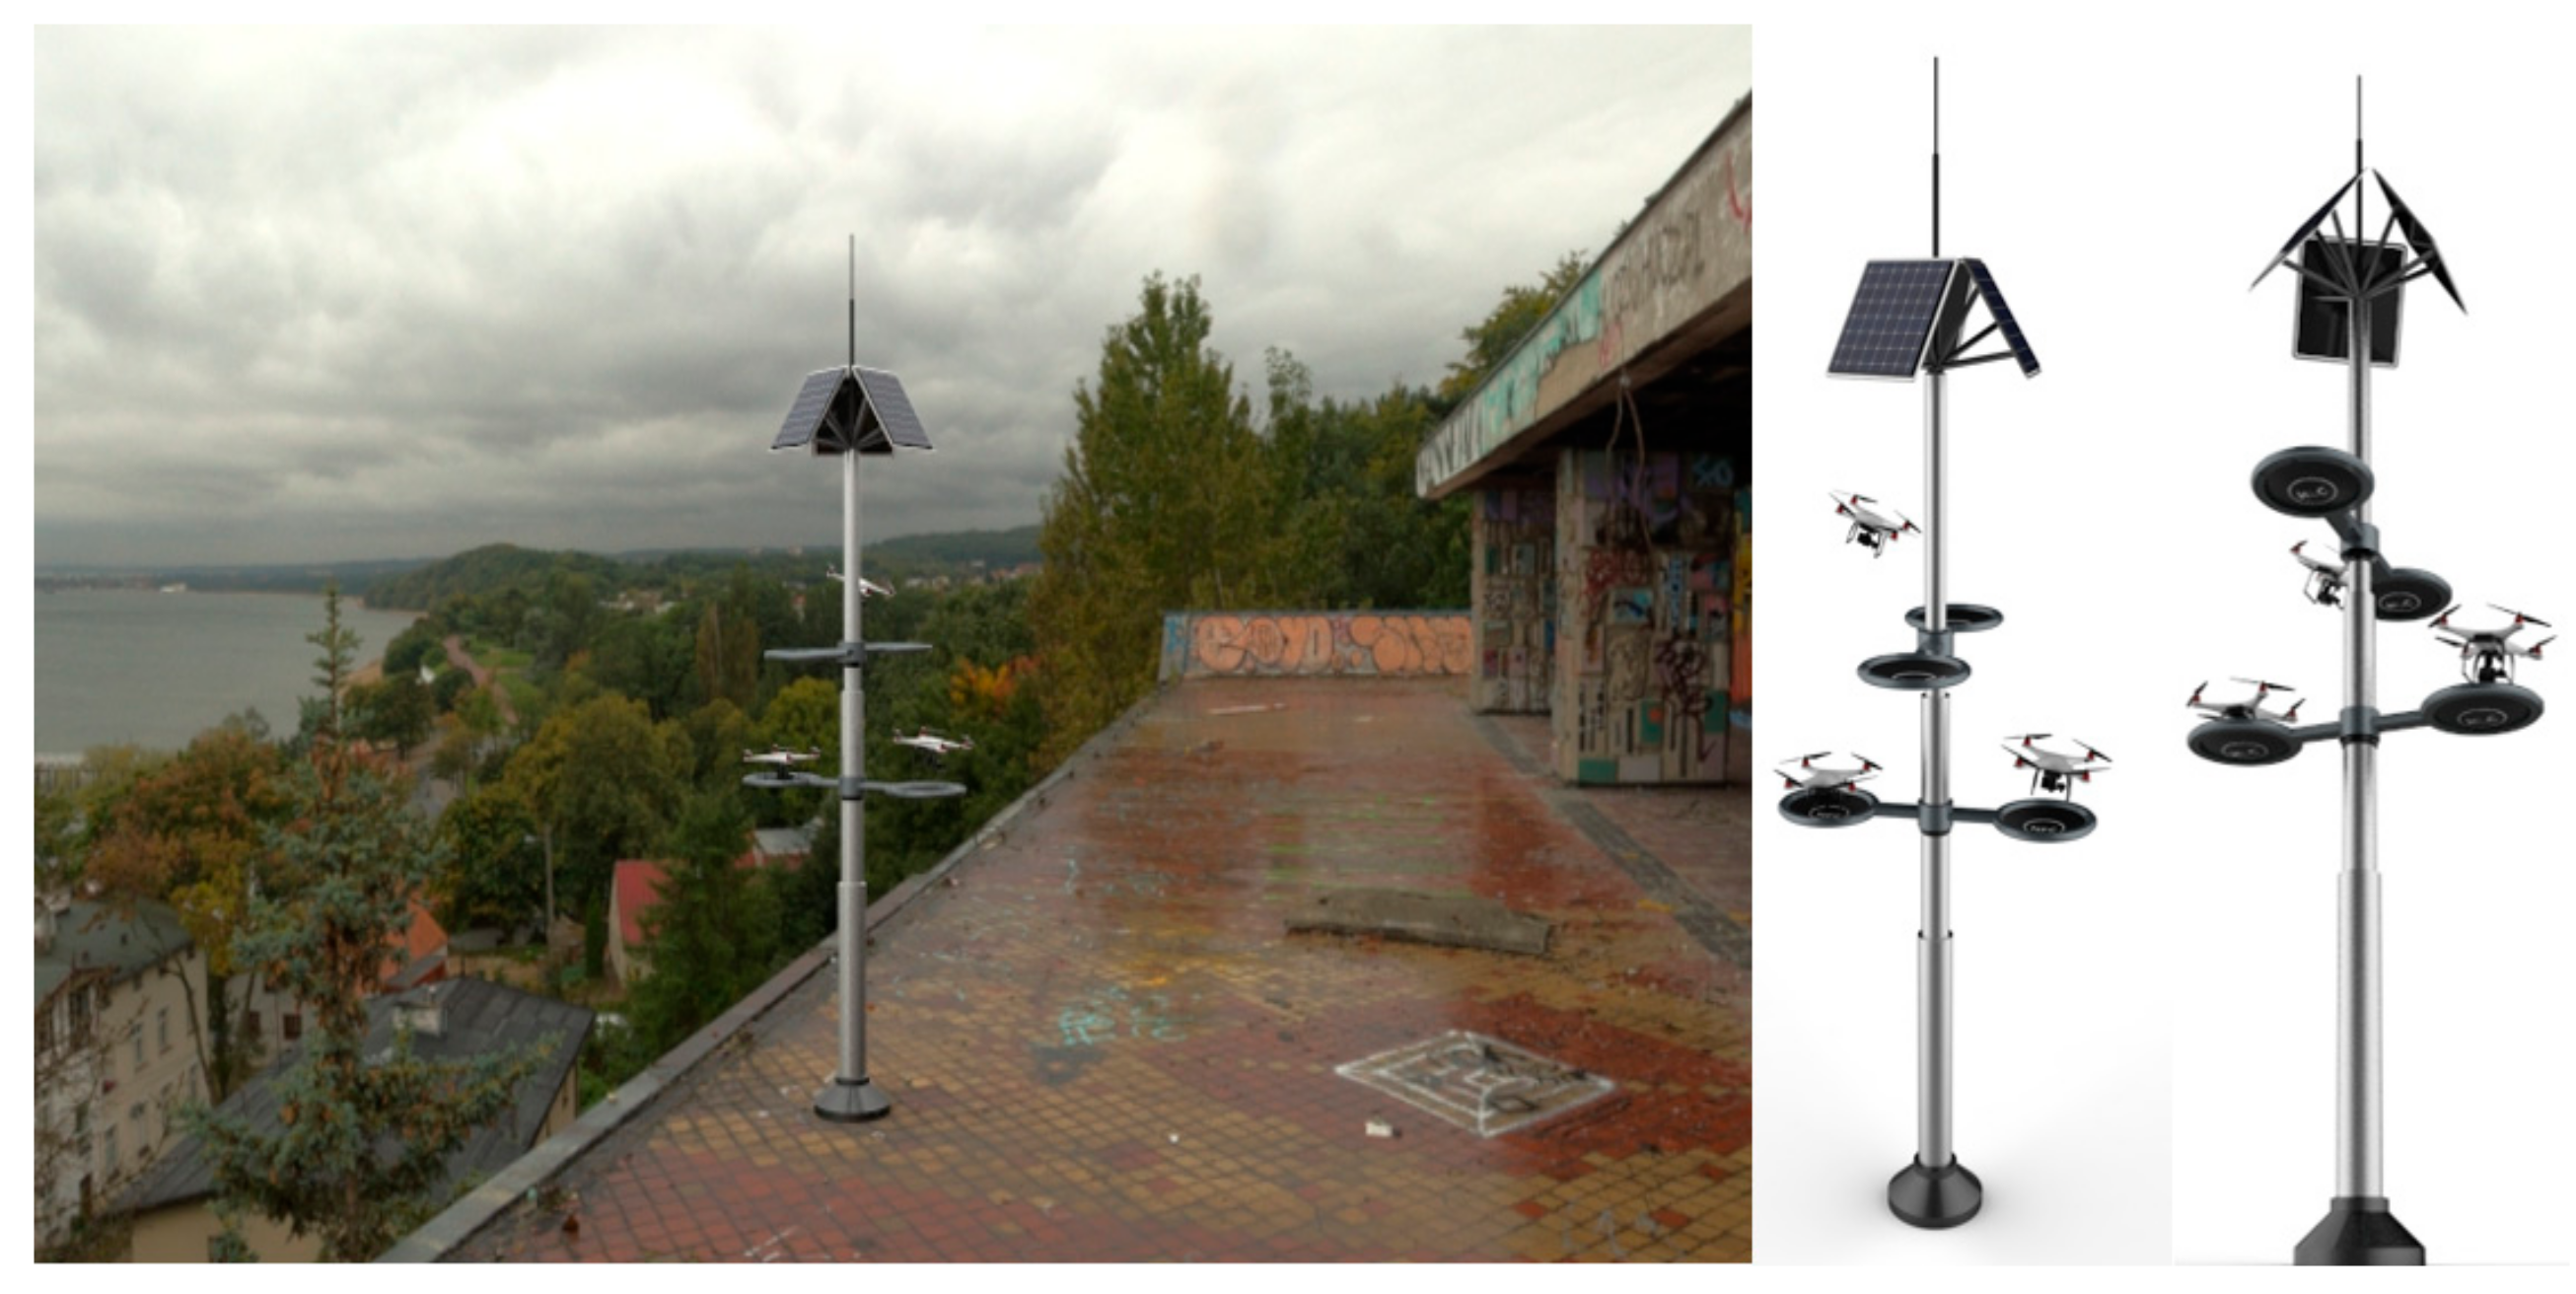
Lighting poles are used as stations for solar panels and traffic control cameras. These lighting poles also can be used as possible places for charging stations of the drones. These lighting poles are mostly available in locations such as parks, beaches, highway interstates, downtown, etc. To this end, different mechanisms/structures can be designed and attached to the lighting poles as drone stations. The drone stations are able to charge the drones and also protect them from rain or other possible dangers. In Figure 3, a view of the proposed concepts and stations for smart cities is given.
4. Drone–Nest Matching
As mentioned before, drones’ nests or charging stations are designed in order to charge and reuse the drone in smart cities. In this design, each drone comes back to its own station and recharges its batteries before flying off to the next mission. One of the challenges in this scenario is to find the nearest drone to the mission. A central processing office can capture all the station-to-mission distance information and analyze it. Station-to-mission distance can be represented by a matrix and this information can be distributed to the drone returning to the station phase. An optimized method is used in this work to assign the best station for a drone in order to save energy.
5. Kuhn–Munkres Algorithm for Power Consumption of Drone–Nest Matchings
To minimize the power required for the drones to land in the defined nests in an urban area, the Kuhn–Munkres algorithm, also called the Hungarian matching algorithm, is used. Maximum- and minimum-weight matchings in bipartite graphs can be found through the Hungarian matching algorithm. Drones and their stations form a bipartite graph that can be easily represented by an adjacency matrix. In the matrix formulation of the Kuhn–Munkres algorithm, a nonnegative n×n matrix is considered, where the elements in the i-th row and j-th column represent the cost of assigning the j-th station to the i-th drone. Through this algorithm, the assignment of the nests to the drones will be done: each station is assigned to one drone and each drone is assigned one station, such that the total energy cost is minimal. Two different cases will be investigated in this study. First, it is assumed that all the drones have a similar level of energy and, second, drones have a different level of energy.
The Kuhn–Munkres algorithm can be described using a bipartite graph. For this study, the bipartite graph is represented as G = (D, S; E) with n drone vertices (D) and n station vertices (S), and each edge (E) has a nonnegative cost c(i, j). The main objective is to find the minimum total required energy. In the Hungarian matching algorithm, a potential function is defined as if for each . The value of potential function y is calculated as the sum of the potential over all vertices (v) as follows [45]:
In this algorithm, the total required energy of the matching is the sum of energy for all edges. The energy of each edge is at least the sum of the potentials of its endpoints. Each vertex is considered as an endpoint of exactly one edge since the matching is perfect and the total required energy is at least the total potential. In drone–nest matching, the Kuhn–Munkres algorithm finds a perfect match and a potential such that the matching required energy equals the potential value. In this study, the Hungarian algorithm finds a perfect match of tight edges. For a potential y, if , an edge ij is called tight. If a subgraph of Gy is considered for a tight edge, the required energy or cost for a perfect match in Gy is equal to the value of y. In the Kuhn–Munkres algorithm, a potential y and an orientation are maintained where has the property that the edges oriented from S (station) to D (drone) form a matching M. At first, the potential y is 0 everywhere and all the edges are oriented from D (drone) to S (station). After that, in each step, y is modified so that its value increases or the orientation is changed to achieve matching with more edges.
In general, it is assumed that and are the vertices not covered by M. In other words, RD and RS consist of the vertices in D and S with no incoming and outgoing edges, respectively. Z is considered as a set of vertices reachable in from RD by a directed path only following edges that are tight. Two different conditions are assessed here, as follows [45]:
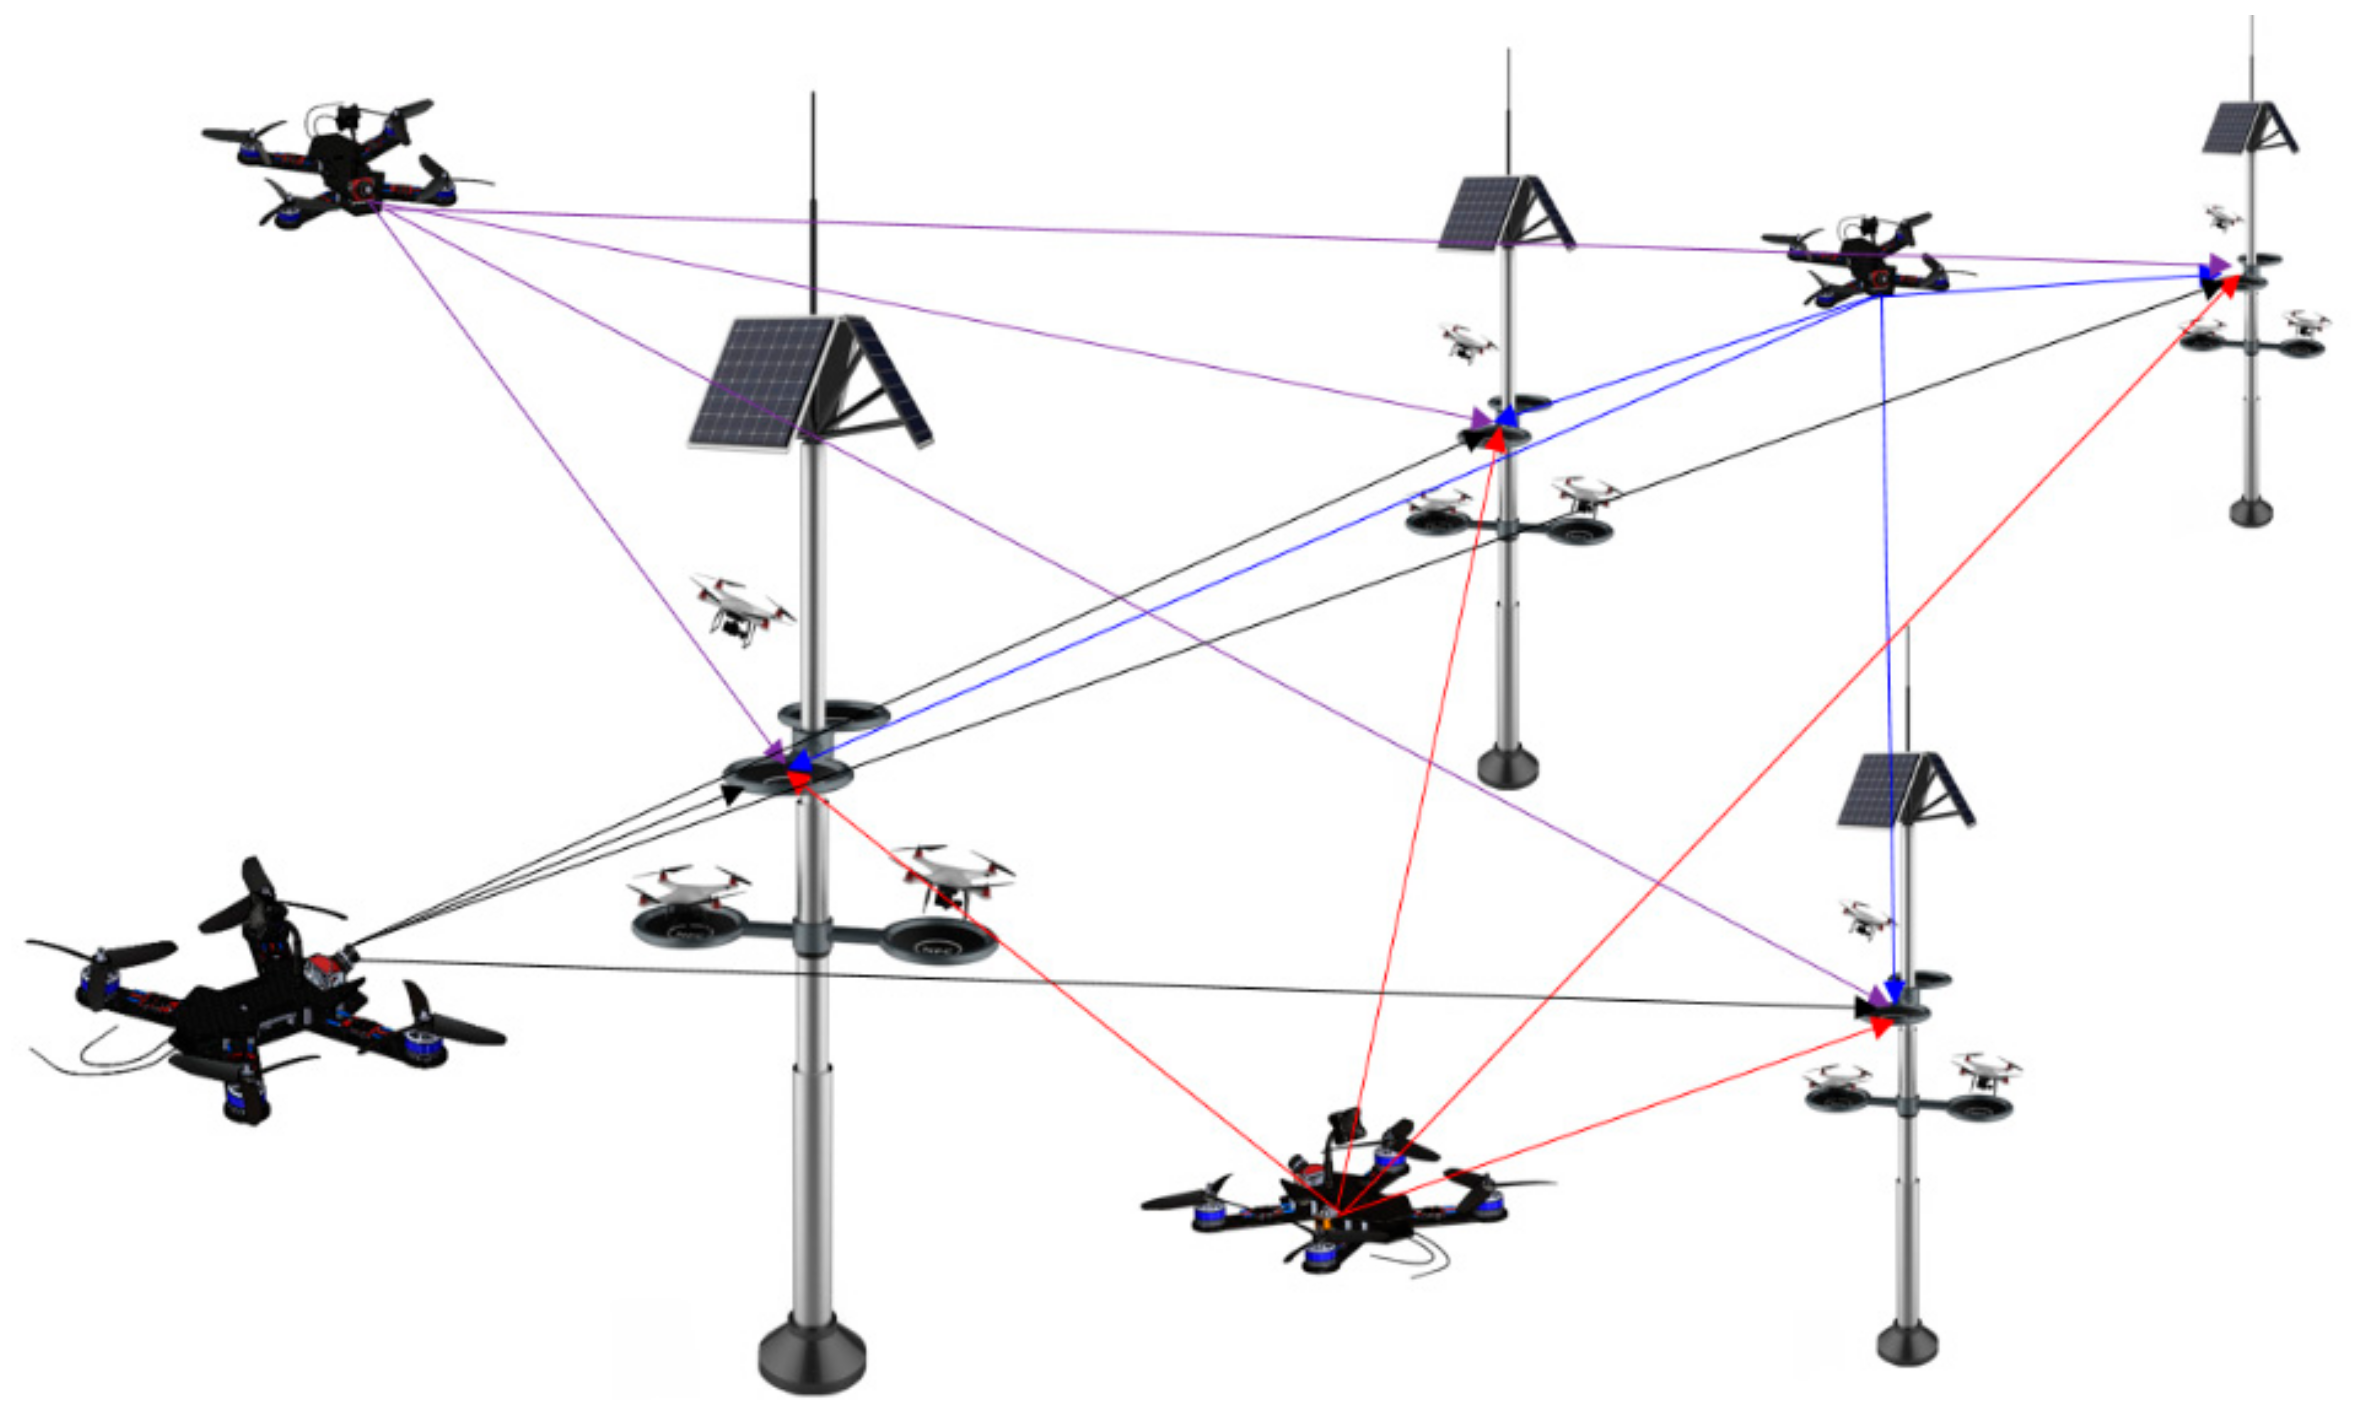
In this case, since there are no tight edges between and . Then, on the vertices of , y is increased by ; on the vertices of , y is decreased by . These steps are repeated until M is a perfect match and provides the minimum energy required for drones to land in the stations. In Figure 4, a schematic view of the bipartite graphs for drones and their stations is shown.
As noted before, the Kuhn–Munkres algorithm can also be represented by an adjacency matrix. In this case, n drones and n stations create an n×n matrix containing the cost (energy level) of assigning each drone to a station. The objective of this matrix is to find the cost-minimizing assignment or, in other words, saving the energy for drones. This problem can be written in the form of a matrix. In Table 2, a view of the matrix interpretation of the Kuhn–Munkres algorithm is shown, where D1, D2, D3, and D4 are the drones that should land on stations S1, S2, S3, and S4; and d, ED, and ES represent the distance between the drones and the stations, the energy remaining for each drone, and the energy of the charging stations, respectively. RED and F represent the remaining energy and aerodynamic drag force of each drone, respectively. The matrix is square so that each drone can land on one station. Various cases are considered in this study, as will be discussed in the following.
In Scenario (1), it is assumed that all the drones have the same level of remaining energy. In Scenario (2), the matching will be carried out for drones with different levels of energy; in Scenario (3), the drones and charging stations have a different level of energy. It should be noted that in all three cases the drones are the same and have different distances to the stations. The remaining energy for Scenarios ((1) and (2)), and (3) are given by the following equations:
where RED&S is the total remaining energy for drones and stations.
The general steps for adjacency matrix representation of the Kuhn–Munkres algorithm for the four drones and stations are discussed below:
Step 1: The remaining energy (RE) is written in the form of a matrix:
Step 2: Row operations are carried out on the above matrix. First, the lowest value of remaining energy of all REi (i, 1–4) is subtracted from each element in that row. This will lead to at least one 0 appearing in that row. Multiple zeros can be obtained once there are equal elements. This procedure is repeated for all rows. Therefore, a matrix with at least one 0 per row is achieved. In the next step, stations are assigned to drones such that each drone is landing only on one station and the penalty incurred in each case is 0. The matrix will be as below. The zeros are the assigned stations.
Step 3: In a case where there is more than one 0 in each column, no assignment can be made. In other words, two drones cannot be assigned to one station. To overcome this, the procedure is repeated for all columns. For example, for the case below:
All zeros in the matrix must be covered by marking as few rows and/or columns as possible. To accomplish this, as many stations as necessary are assigned. For example, as shown in the matrix of Equation (8), the first row has one 0, so it is assigned. The 0 in row 3 is crossed out since it is in the same column. The second row has one 0, so it is also assigned. The third row’s only 0 has been crossed out, hence nothing is assigned. The fourth row has two uncrossed zeros; therefore, one can be assigned and others can be crossed out. The shown matrix in Equation (3) will be converted as follows:
In the next step, the third row that does not have an assignment, the first column that has zeros in a newly marked row, and the first row that has an assignment in the newly marked column are marked. This process is also repeated for all non-assigned rows. Lines are drawn through all marked columns and unmarked rows. For this example, the matrix will be shown as:
![Aerospace 06 00125 i009]()

Step 4: Of the remaining elements, the lowest value is found, subtracted from every unmarked element, and added to every element covered by two lines. Steps 3 and 4 are repeated until an assignment is possible; this is when the minimum number of lines used to cover all the zeros is the maximum. The procedure is repeated until the drones are in stations with the minimum value of expended energy.
As shown in Table 1, there are different scenarios for matching the drones and stations in smart cities. Different scenarios can be analyzed here based on defined assumptions including (1) drones after performing their missions have the same level of energy (in this case it is assumed that the battery of a drone is charged after accomplishing its task); (2) drones after performing their tasks have a different level of energy, but they will go back to the stations with the same level of energy; (3) drones have different levels of energy and will go back to the stations with different levels of charging.
5.1. Matching of Drones with the Same Energy Level to the Stations
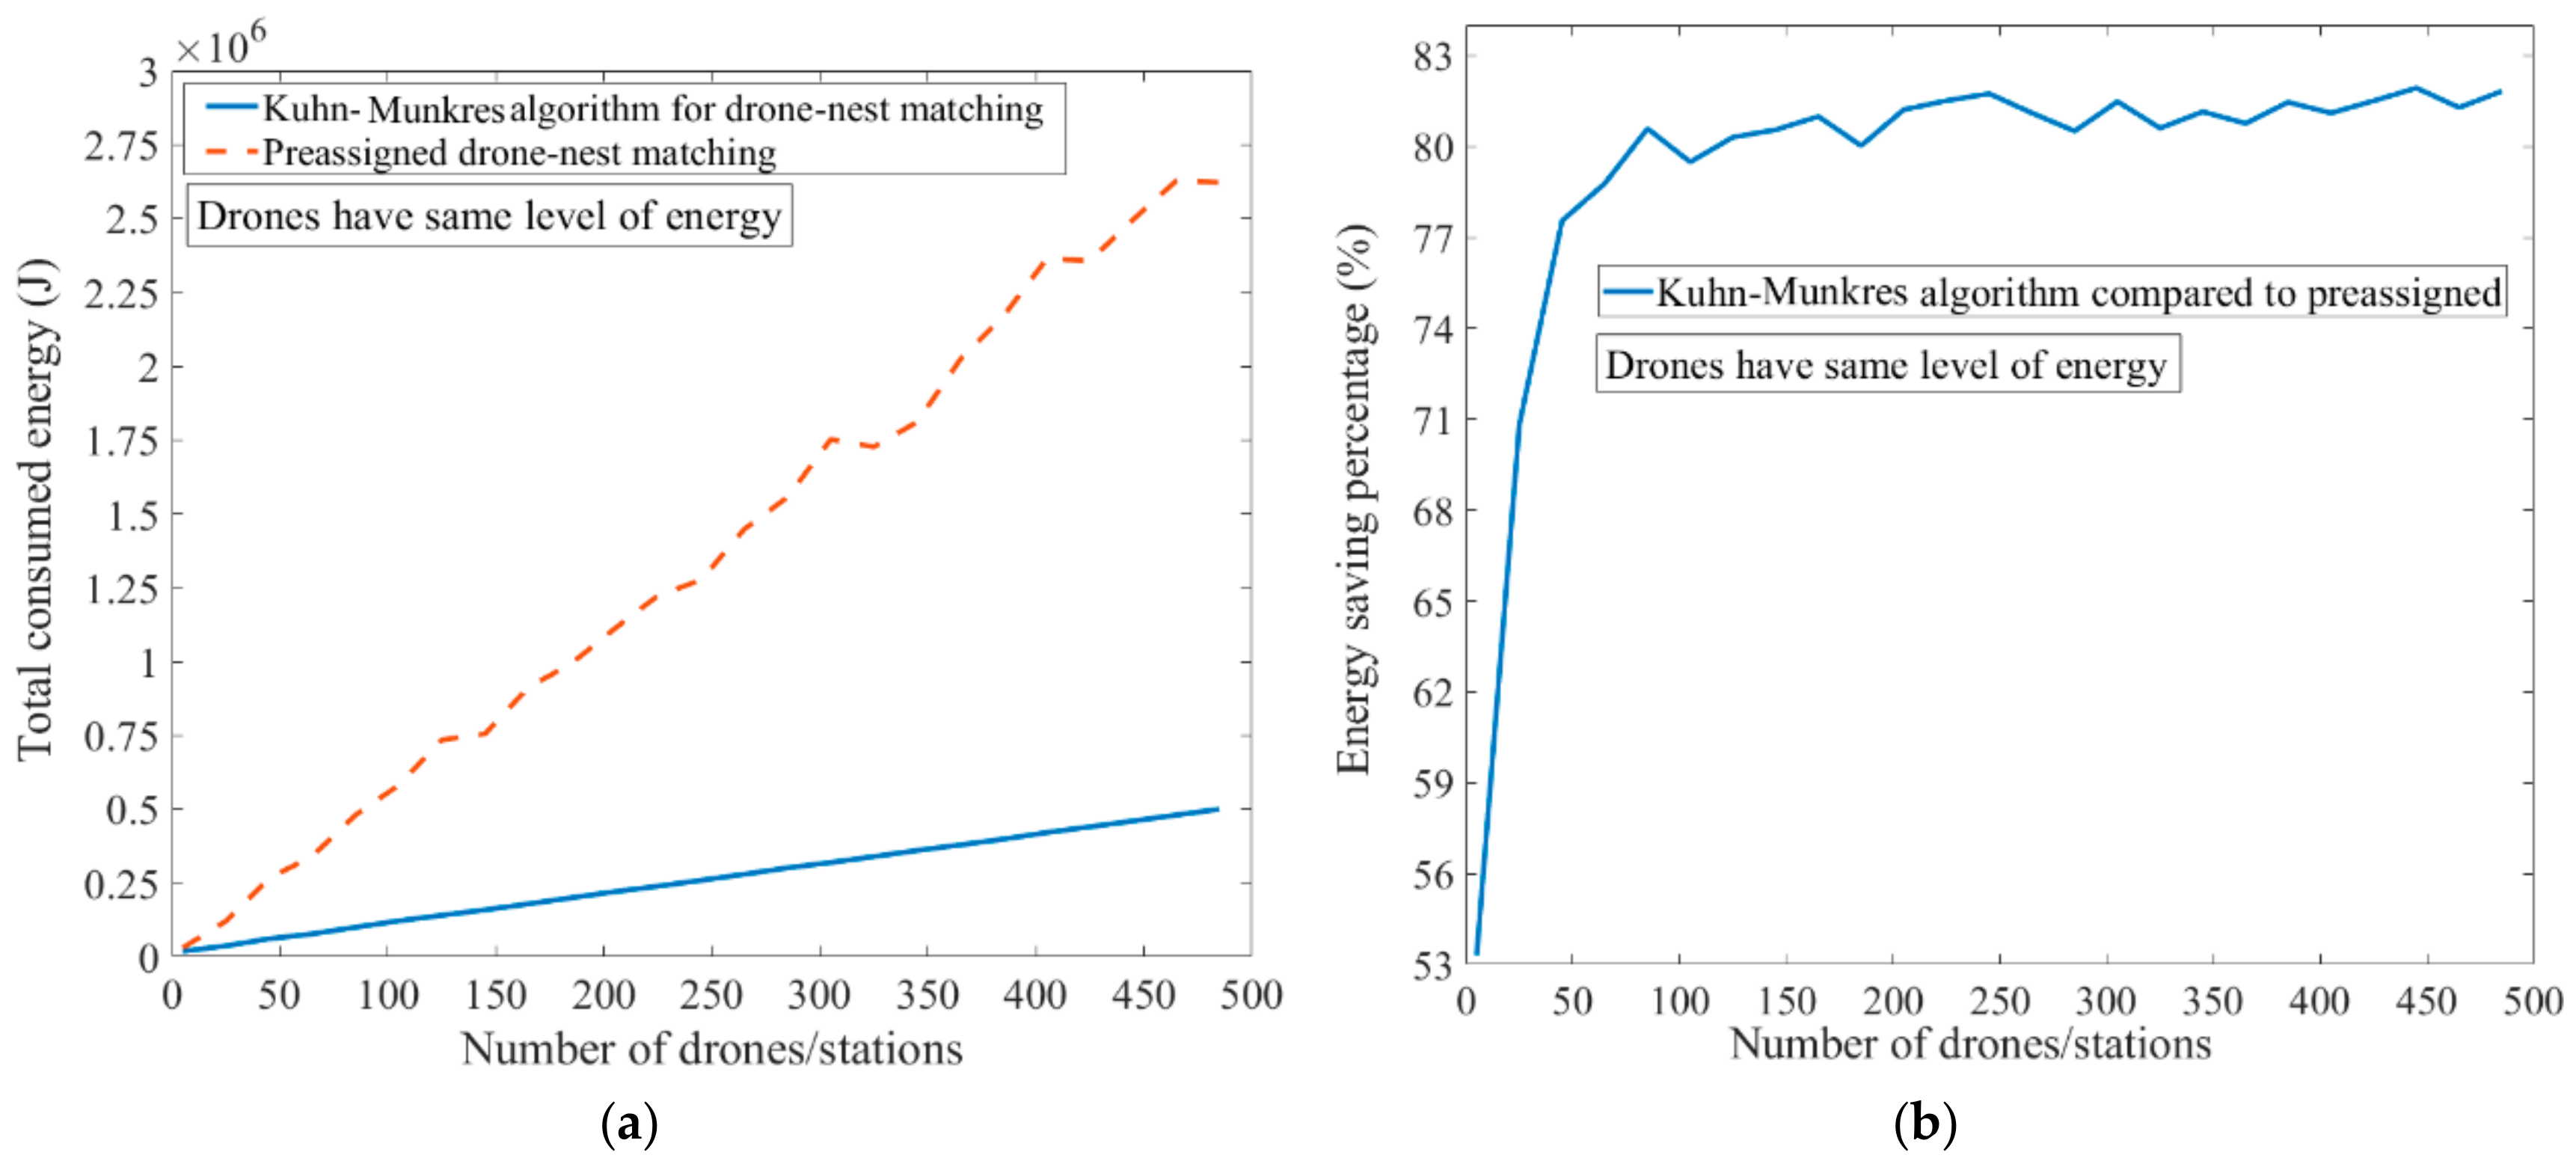
The Kuhn–Munkres algorithm is compared with a preassigned method for deploying drones with the same level of energy towards missions or stations. As an example, for different numbers of missions, stations, and drones with random locations and the same level of energy, the total flight distance or consumed energy can be calculated. In Figure 5a,b, the comparison between two different matchings including the ordered (each drone goes to its assigned mission/station) and Kuhn–Munkres algorithm is shown.
As can be seen in Figure 5a, there is a considerable savings in energy if the drones are assigned to missions/stations based on the Kuhn–Munkres algorithm. Figure 5b indicates that the Kuhn–Munkres algorithm is the best way to save on distance and, consequently, energy for drones. It is clear that for more than 50 drones and missions, there is a more than 80% energy (distance) reduction when the Kuhn–Munkres algorithm is used for matching drones and missions compared to the already assigned ones. The results demonstrate that power and energy can be saved if the Kuhn–Munkres algorithm is applied for assigning stations for different missions in smart cities.
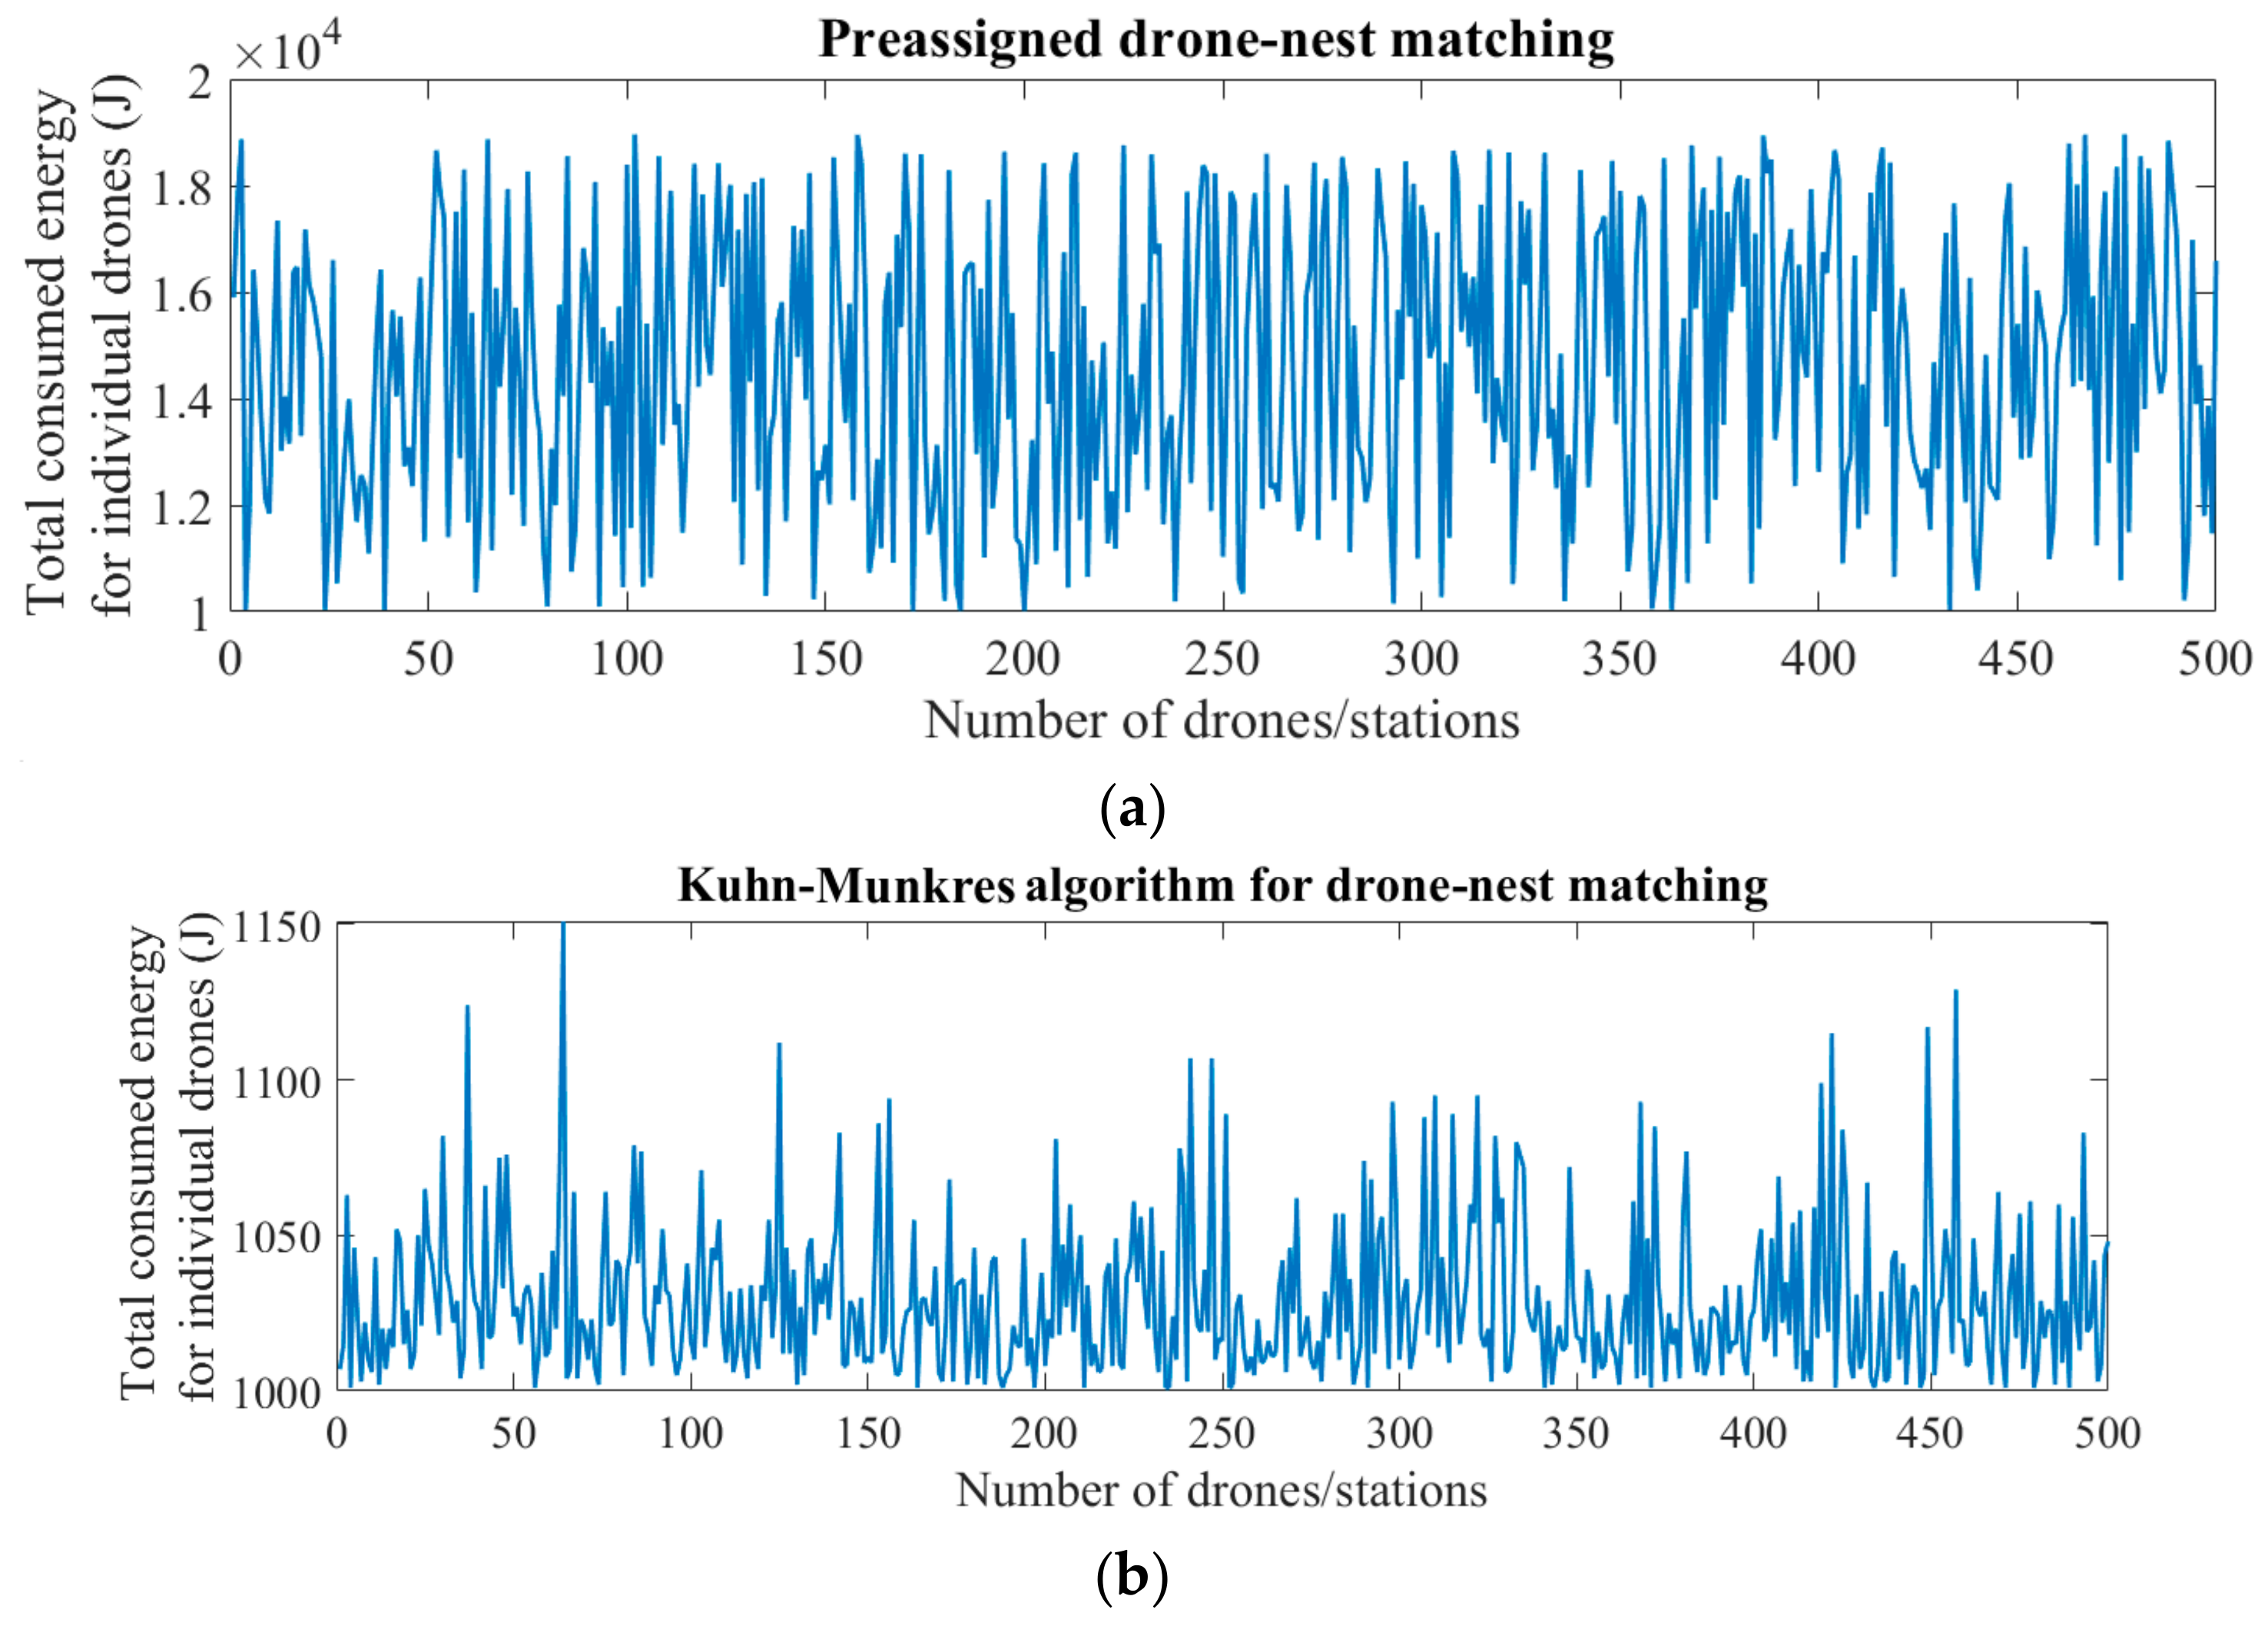
In Figure 6a,b, the total energy consumed by each individual drone of a group of 500 drones/stations is shown, based on preassigned and Kuhn–Munkres drone–nest matching, respectively. The results indicate that the individual drones that are deployed to the nest/mission through the Kuhn–Munkres algorithm are consuming less energy than the preassigned matchings.
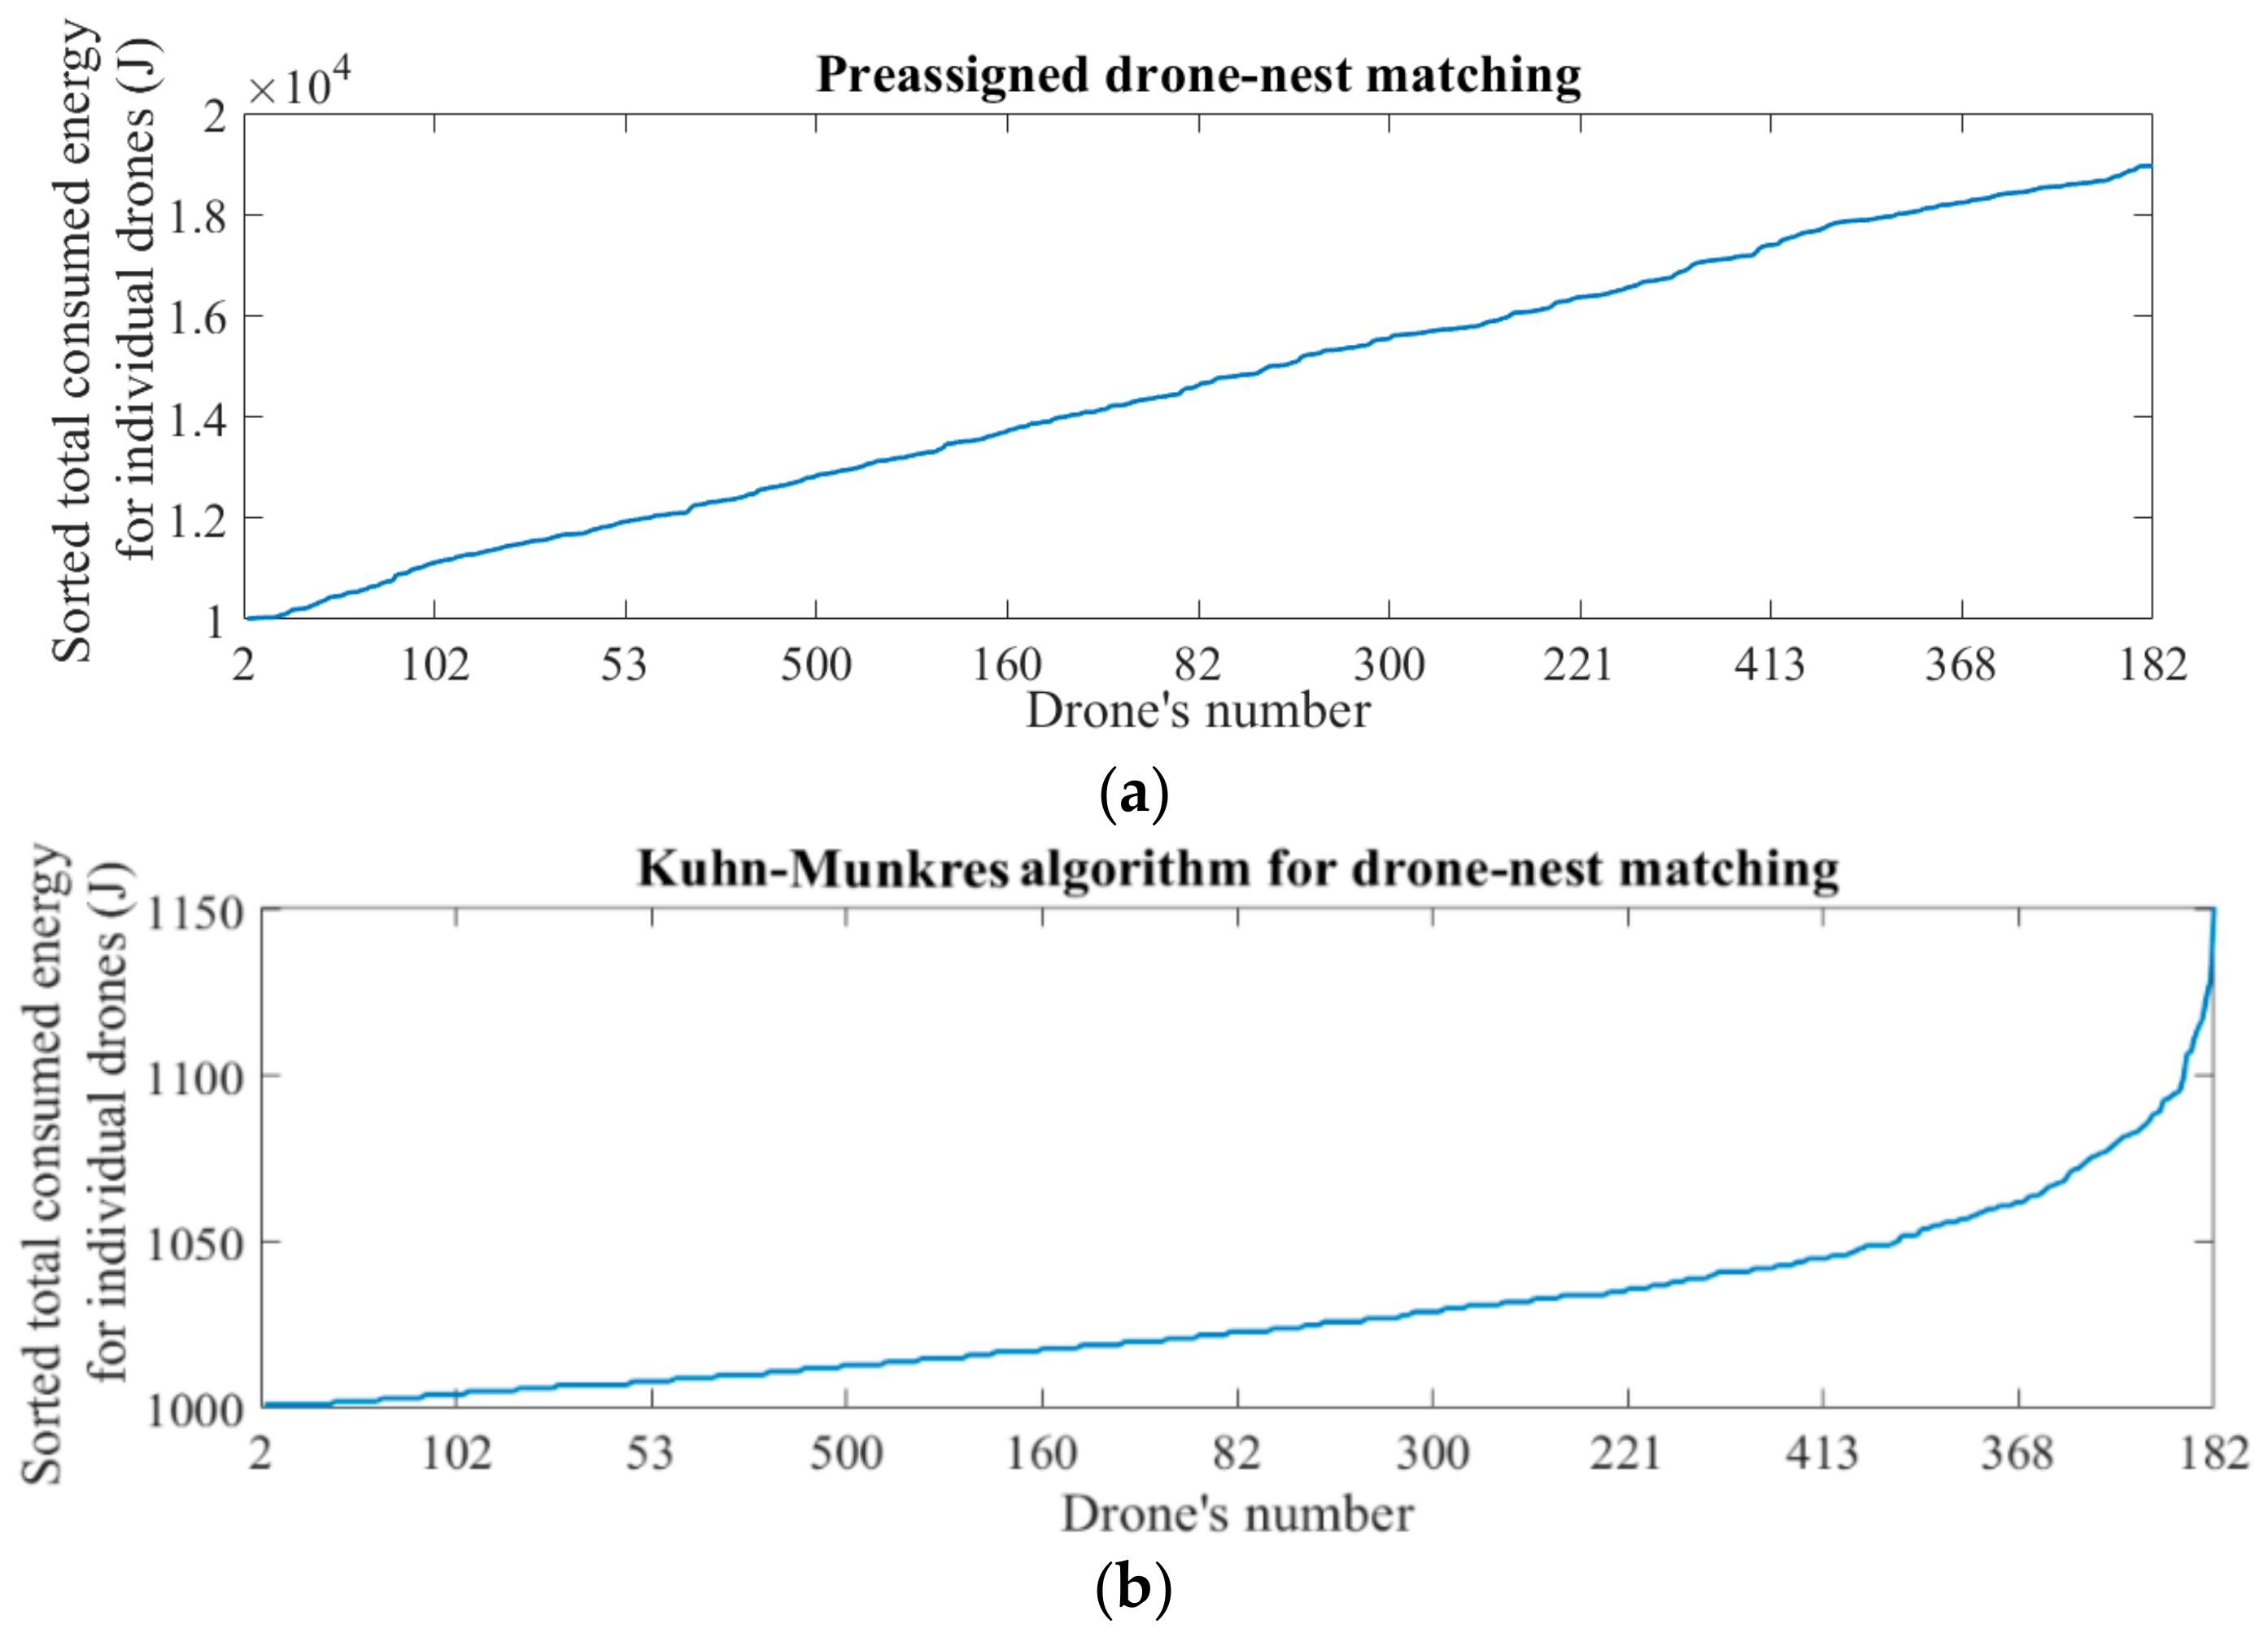
In Figure 7a,b, the sorted total consumed energy for each drone is shown for preassigned and Kuhn–Munkres matching, respectively. It can be seen from Figure 7a–c that the trend of sorted total consumed energy for preassigned drone–mission/nest matching is linear, while for Kuhn–Munkres matching it is not, and the changes of energy are almost constant in this case. As shown in Figure 7a–c, the energy required for each individual drone to be matched with a nest/mission through the preassigned method is more than with the Kuhn–Munkres algorithm.
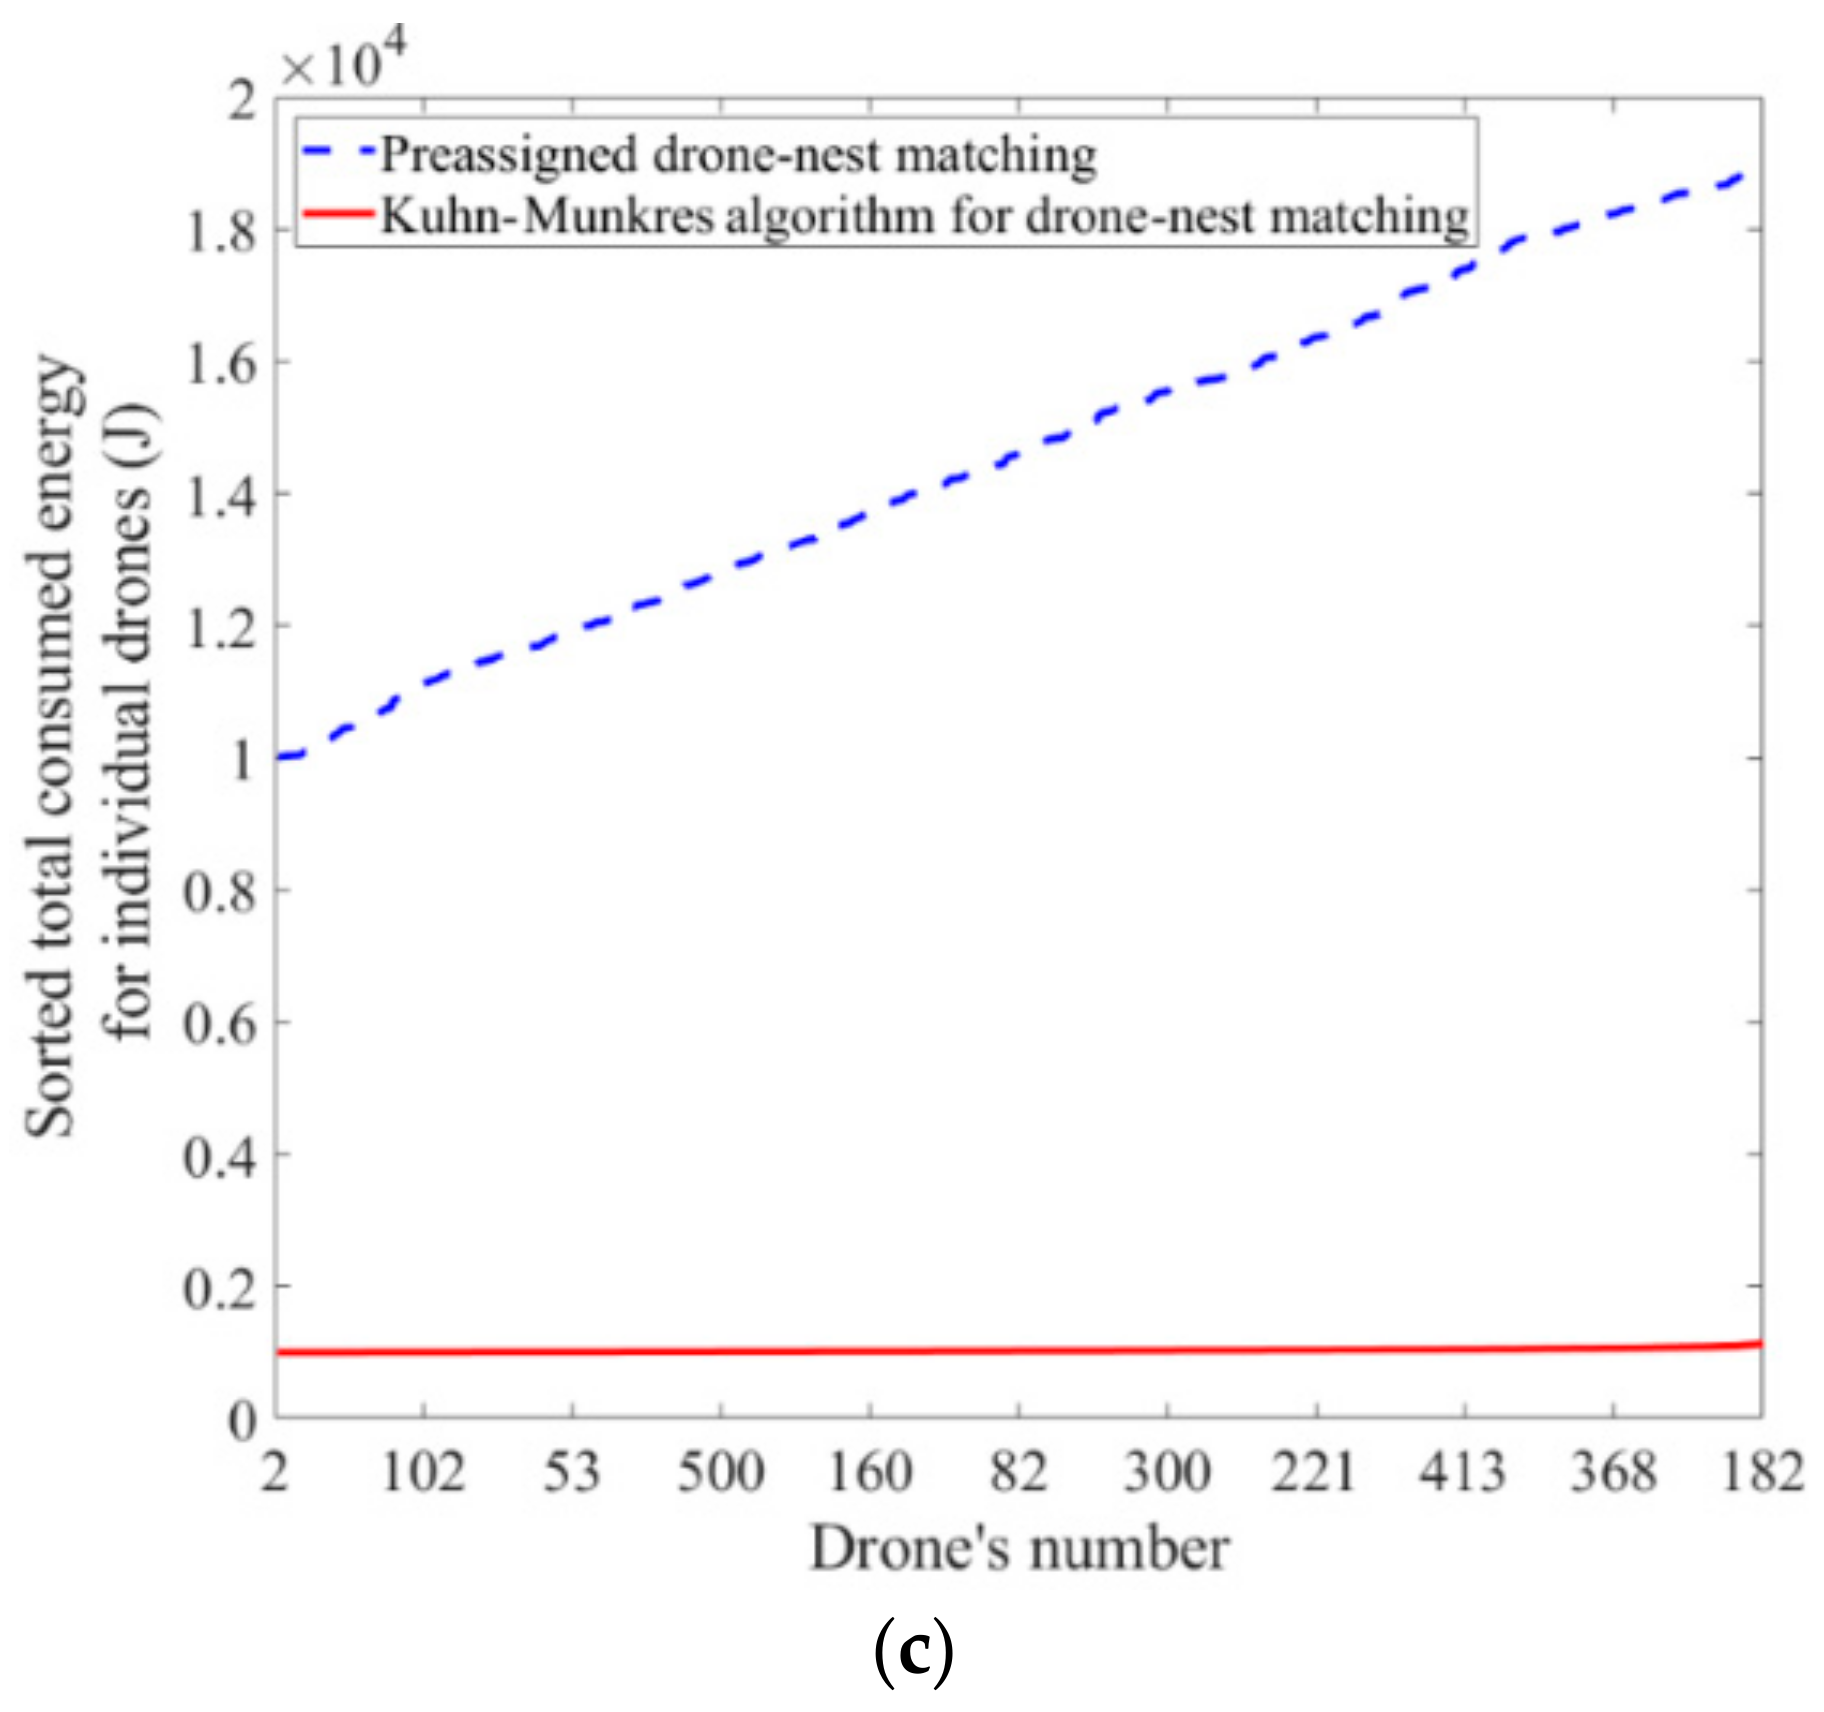
In Figure 8, the energy-saving percentage of matching through the Kuhn–Munkres algorithm compared to the preassigned method for each individual drone with similar initial energy is demonstrated. The bar graph indicates that most of the drones can save almost 90% of their energy.
5.2. Matching of Drones with Different Energy Level to Stations
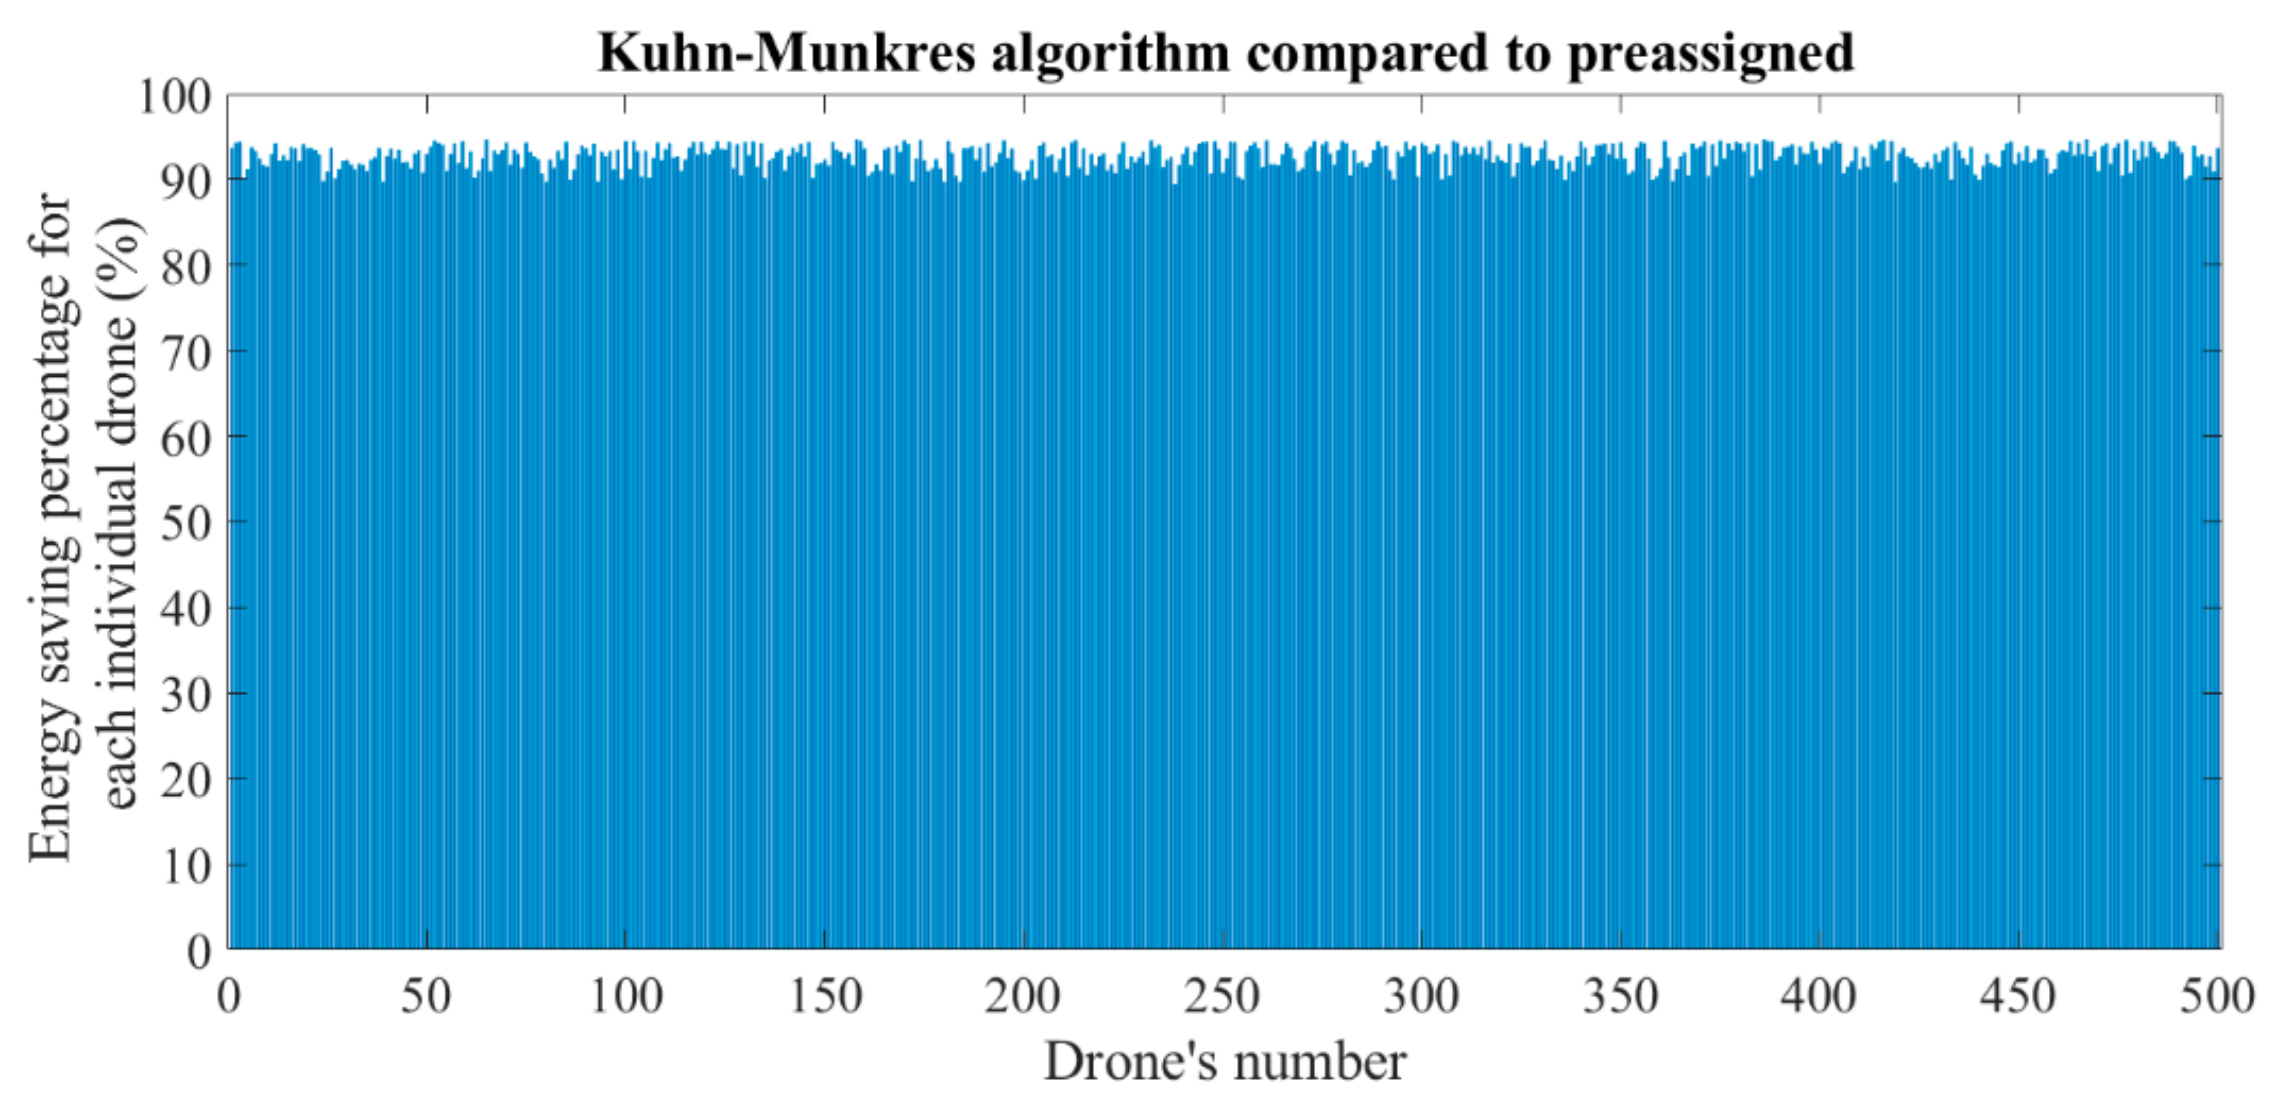
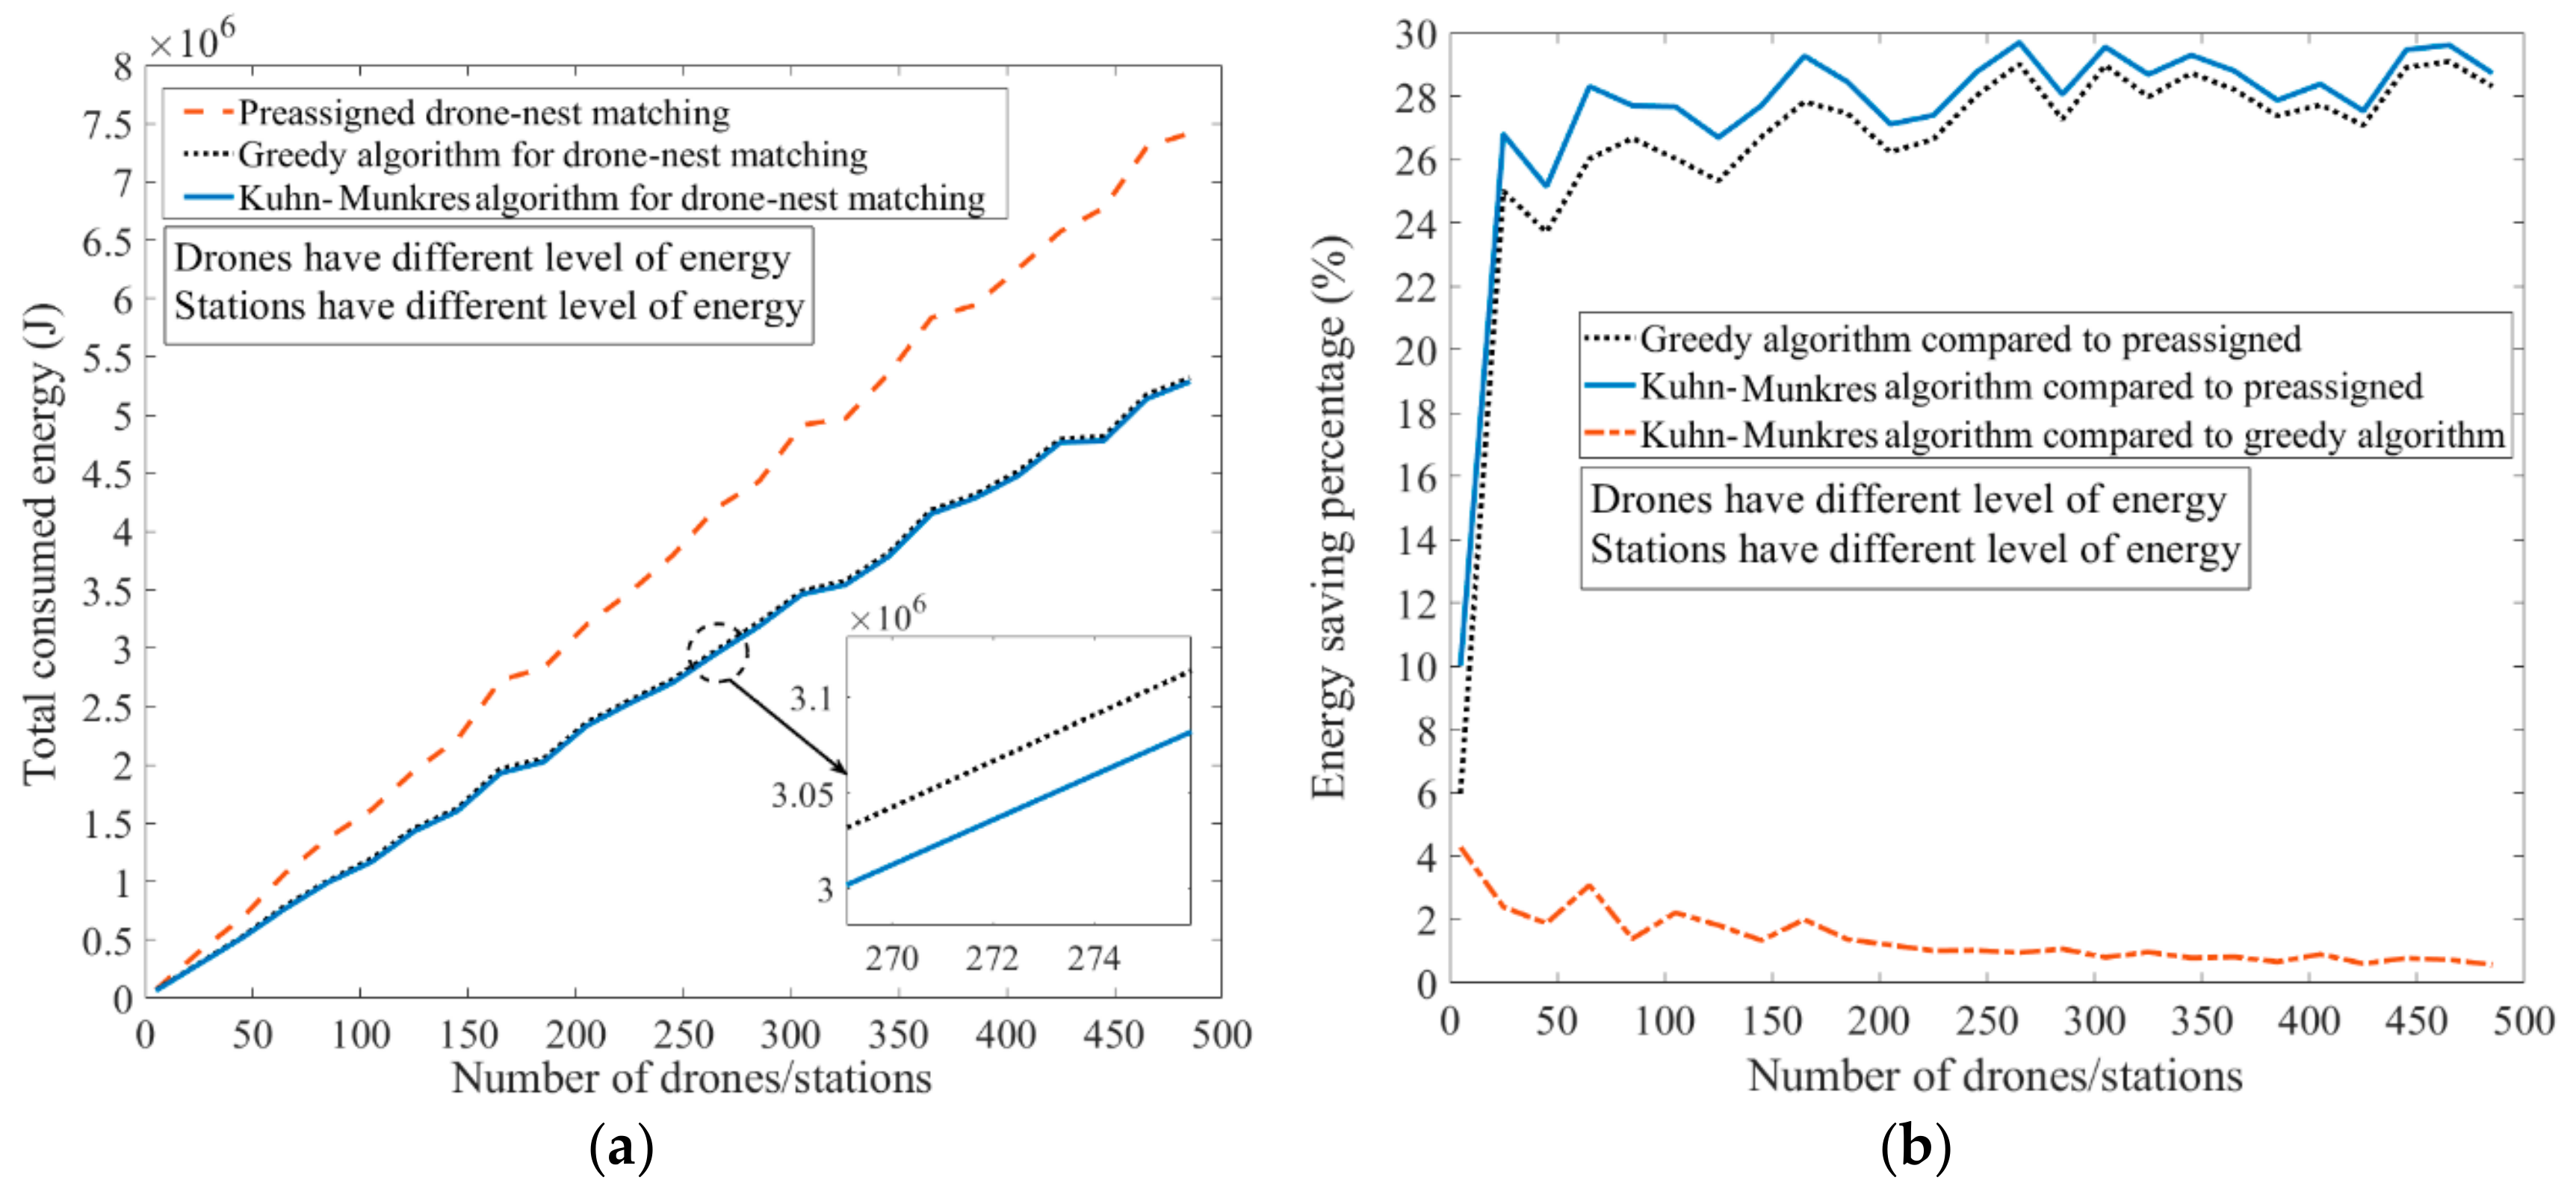
For numbers of missions, stations, and drones with random locations and different levels of energy, the total consumed energy is calculated. In Figure 9a, the comparisons of total consumed energy for drones with different levels of energy through the Kuhn–Munkres algorithm, greedy algorithm, and preassigned matching are shown. In the greedy algorithm, the matching is initiated with a drone with the lowest level of energy, and it goes to its nearest station. Figure 9b indicates the energy-saving percentage of the Kuhn–Munkres and greedy algorithms compared to preassigned matching and Kuhn–Munkres compared to the greedy algorithm. As seen in Figure 9a, preassigned drone–nest matching consumes more energy than the other matching methods. Matching through the Kuhn–Munkres algorithm, in this case, shows a similar trend to the greedy algorithm, but with less energy consumed. Figure 9b presents an average energy savings of more than 40% for the Kuhn–Munkres and greedy algorithms compared to preassigned matching. The energy savings of matching through the Kuhn–Munkres compared to the greedy algorithm has a smaller value once the number of drones increases. For matching more than 200 drones and stations, an energy savings of more than 2% can be achieved for the Kuhn–Munkres algorithm compared to the greedy algorithm. It is visible from Figure 9a,b that the Kuhn–Munkres algorithm is the best method for nest matching of drones with different levels of energy.
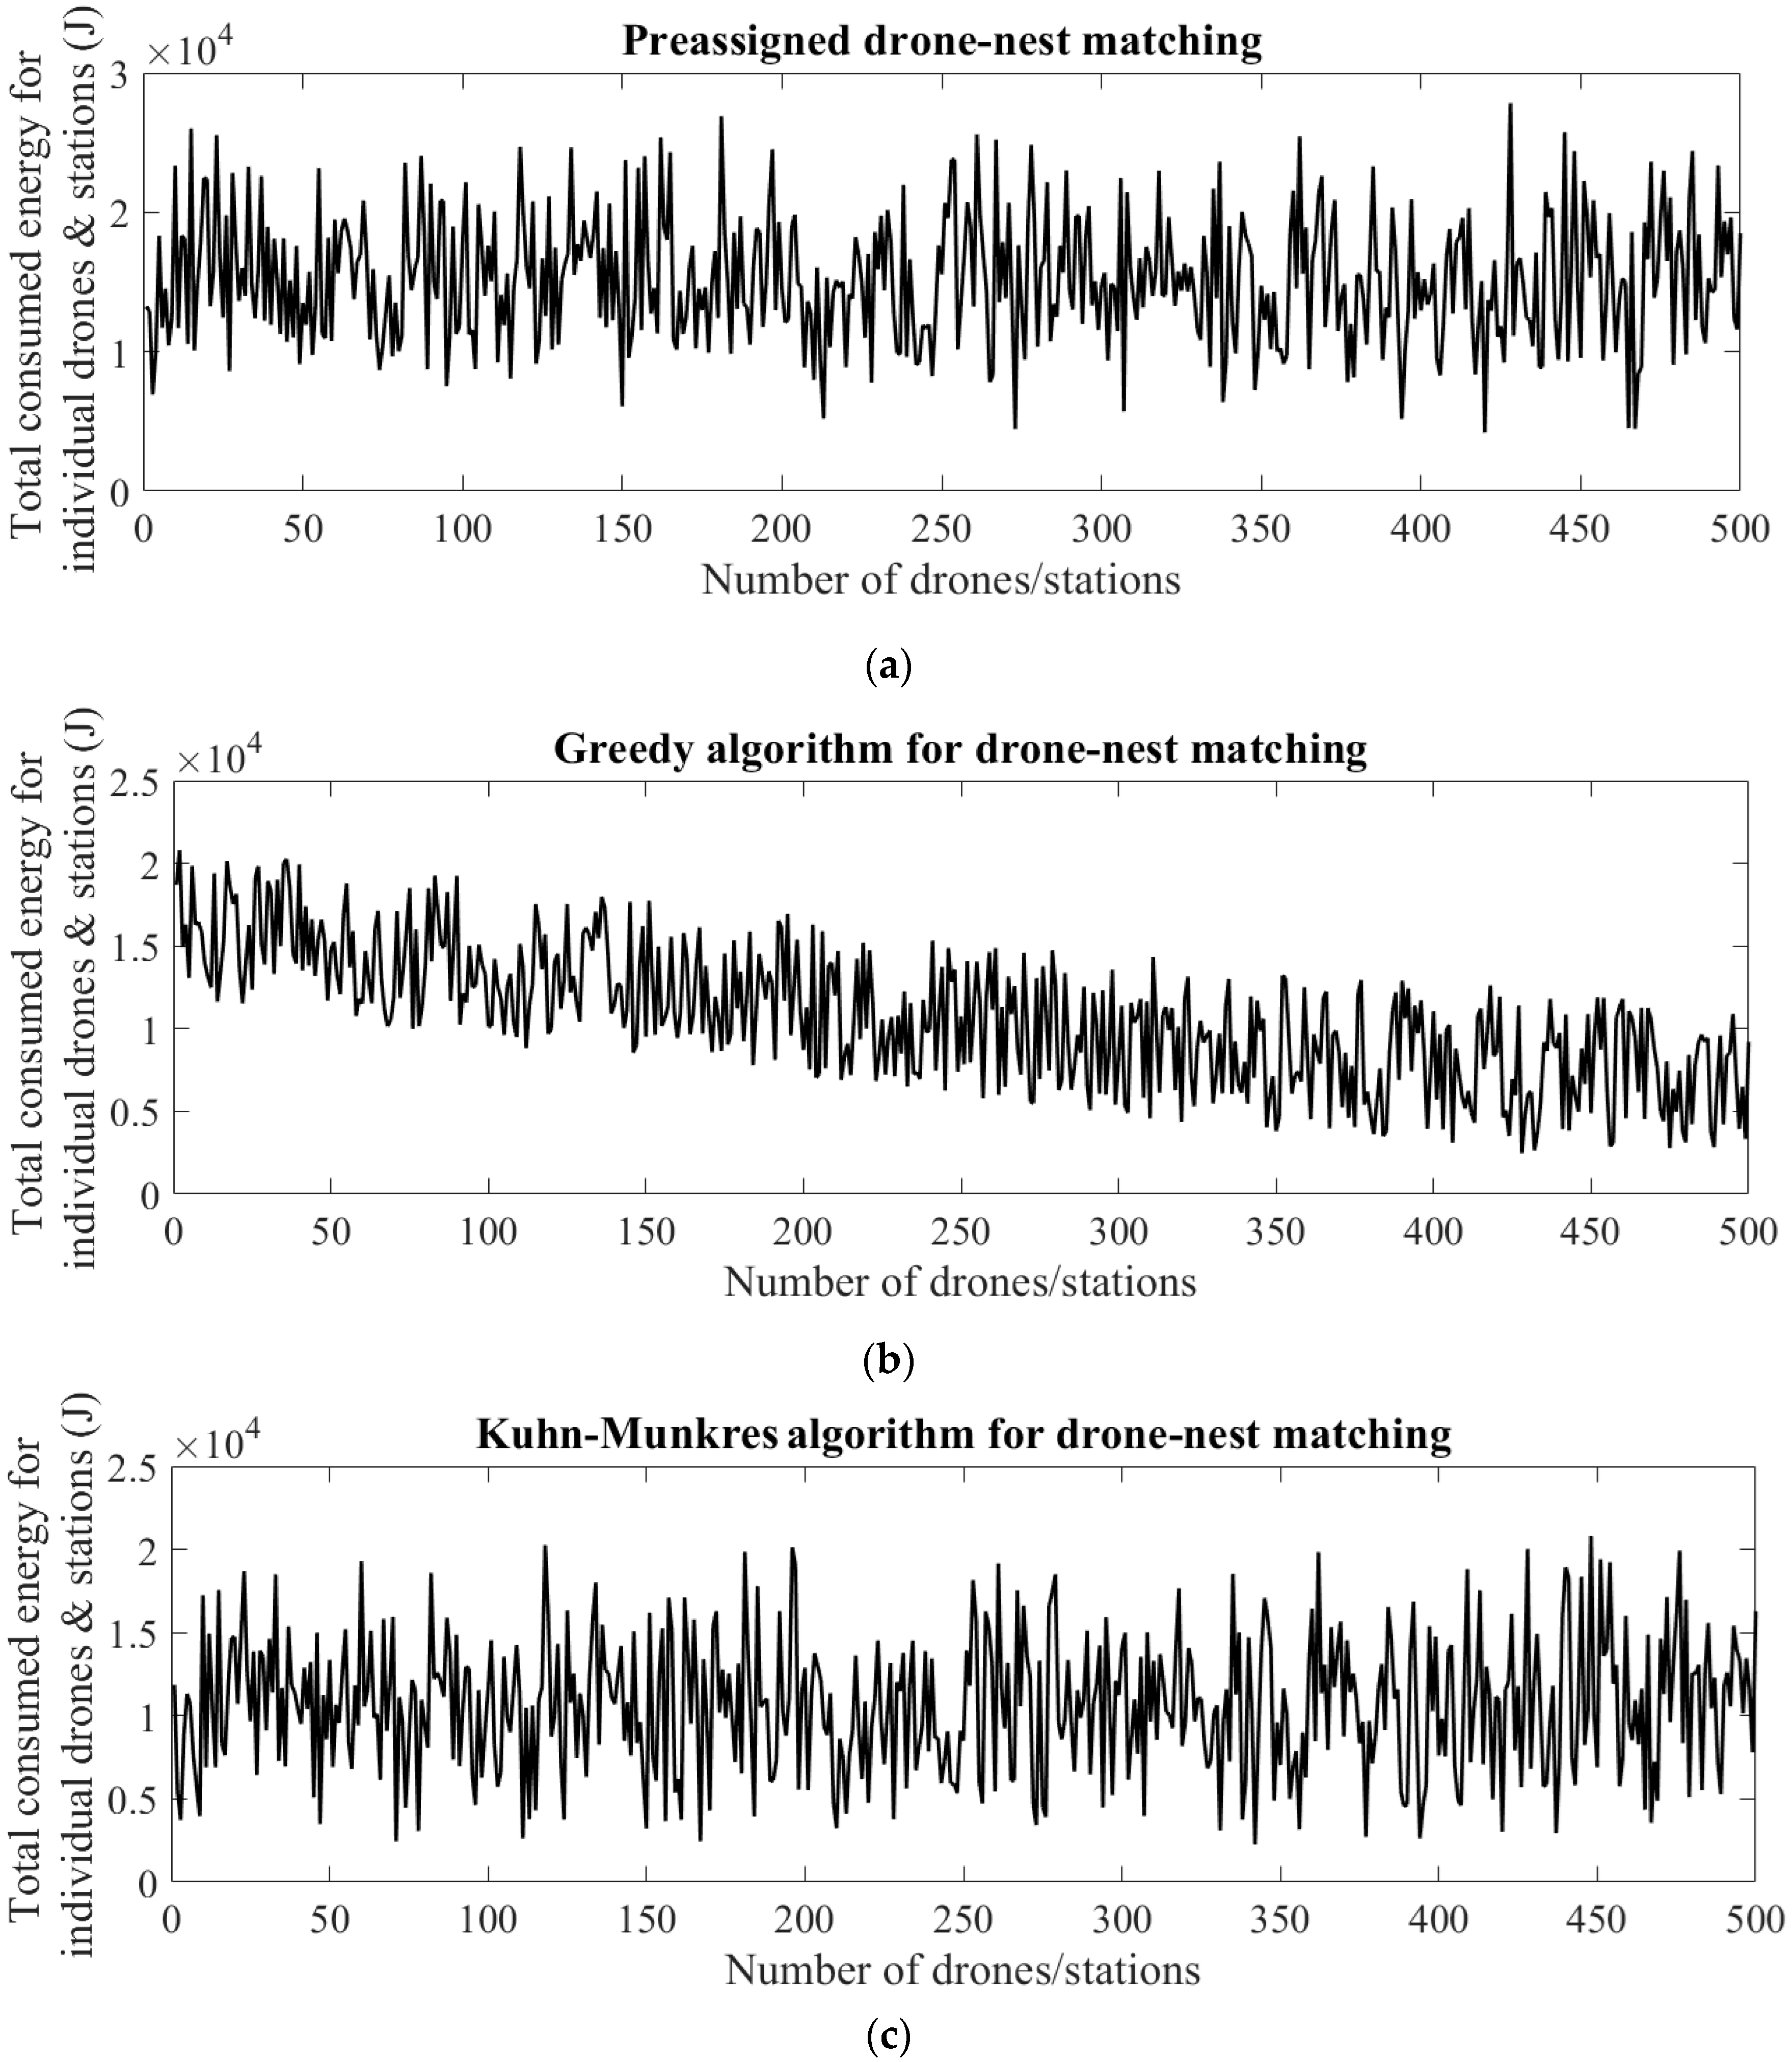
Figure 10a–c show the total energy consumed by each individual drone of a group of 500 drones with different energy levels, based on preassigned, greedy, and Kuhn–Munkres drone–nest matching, respectively. The following graphs demonstrate that the matching of drones and nests in smart cities through Kuhn–Munkres and greedy algorithms is more efficient in terms of the total consumption of energy compared to preassigned matching.
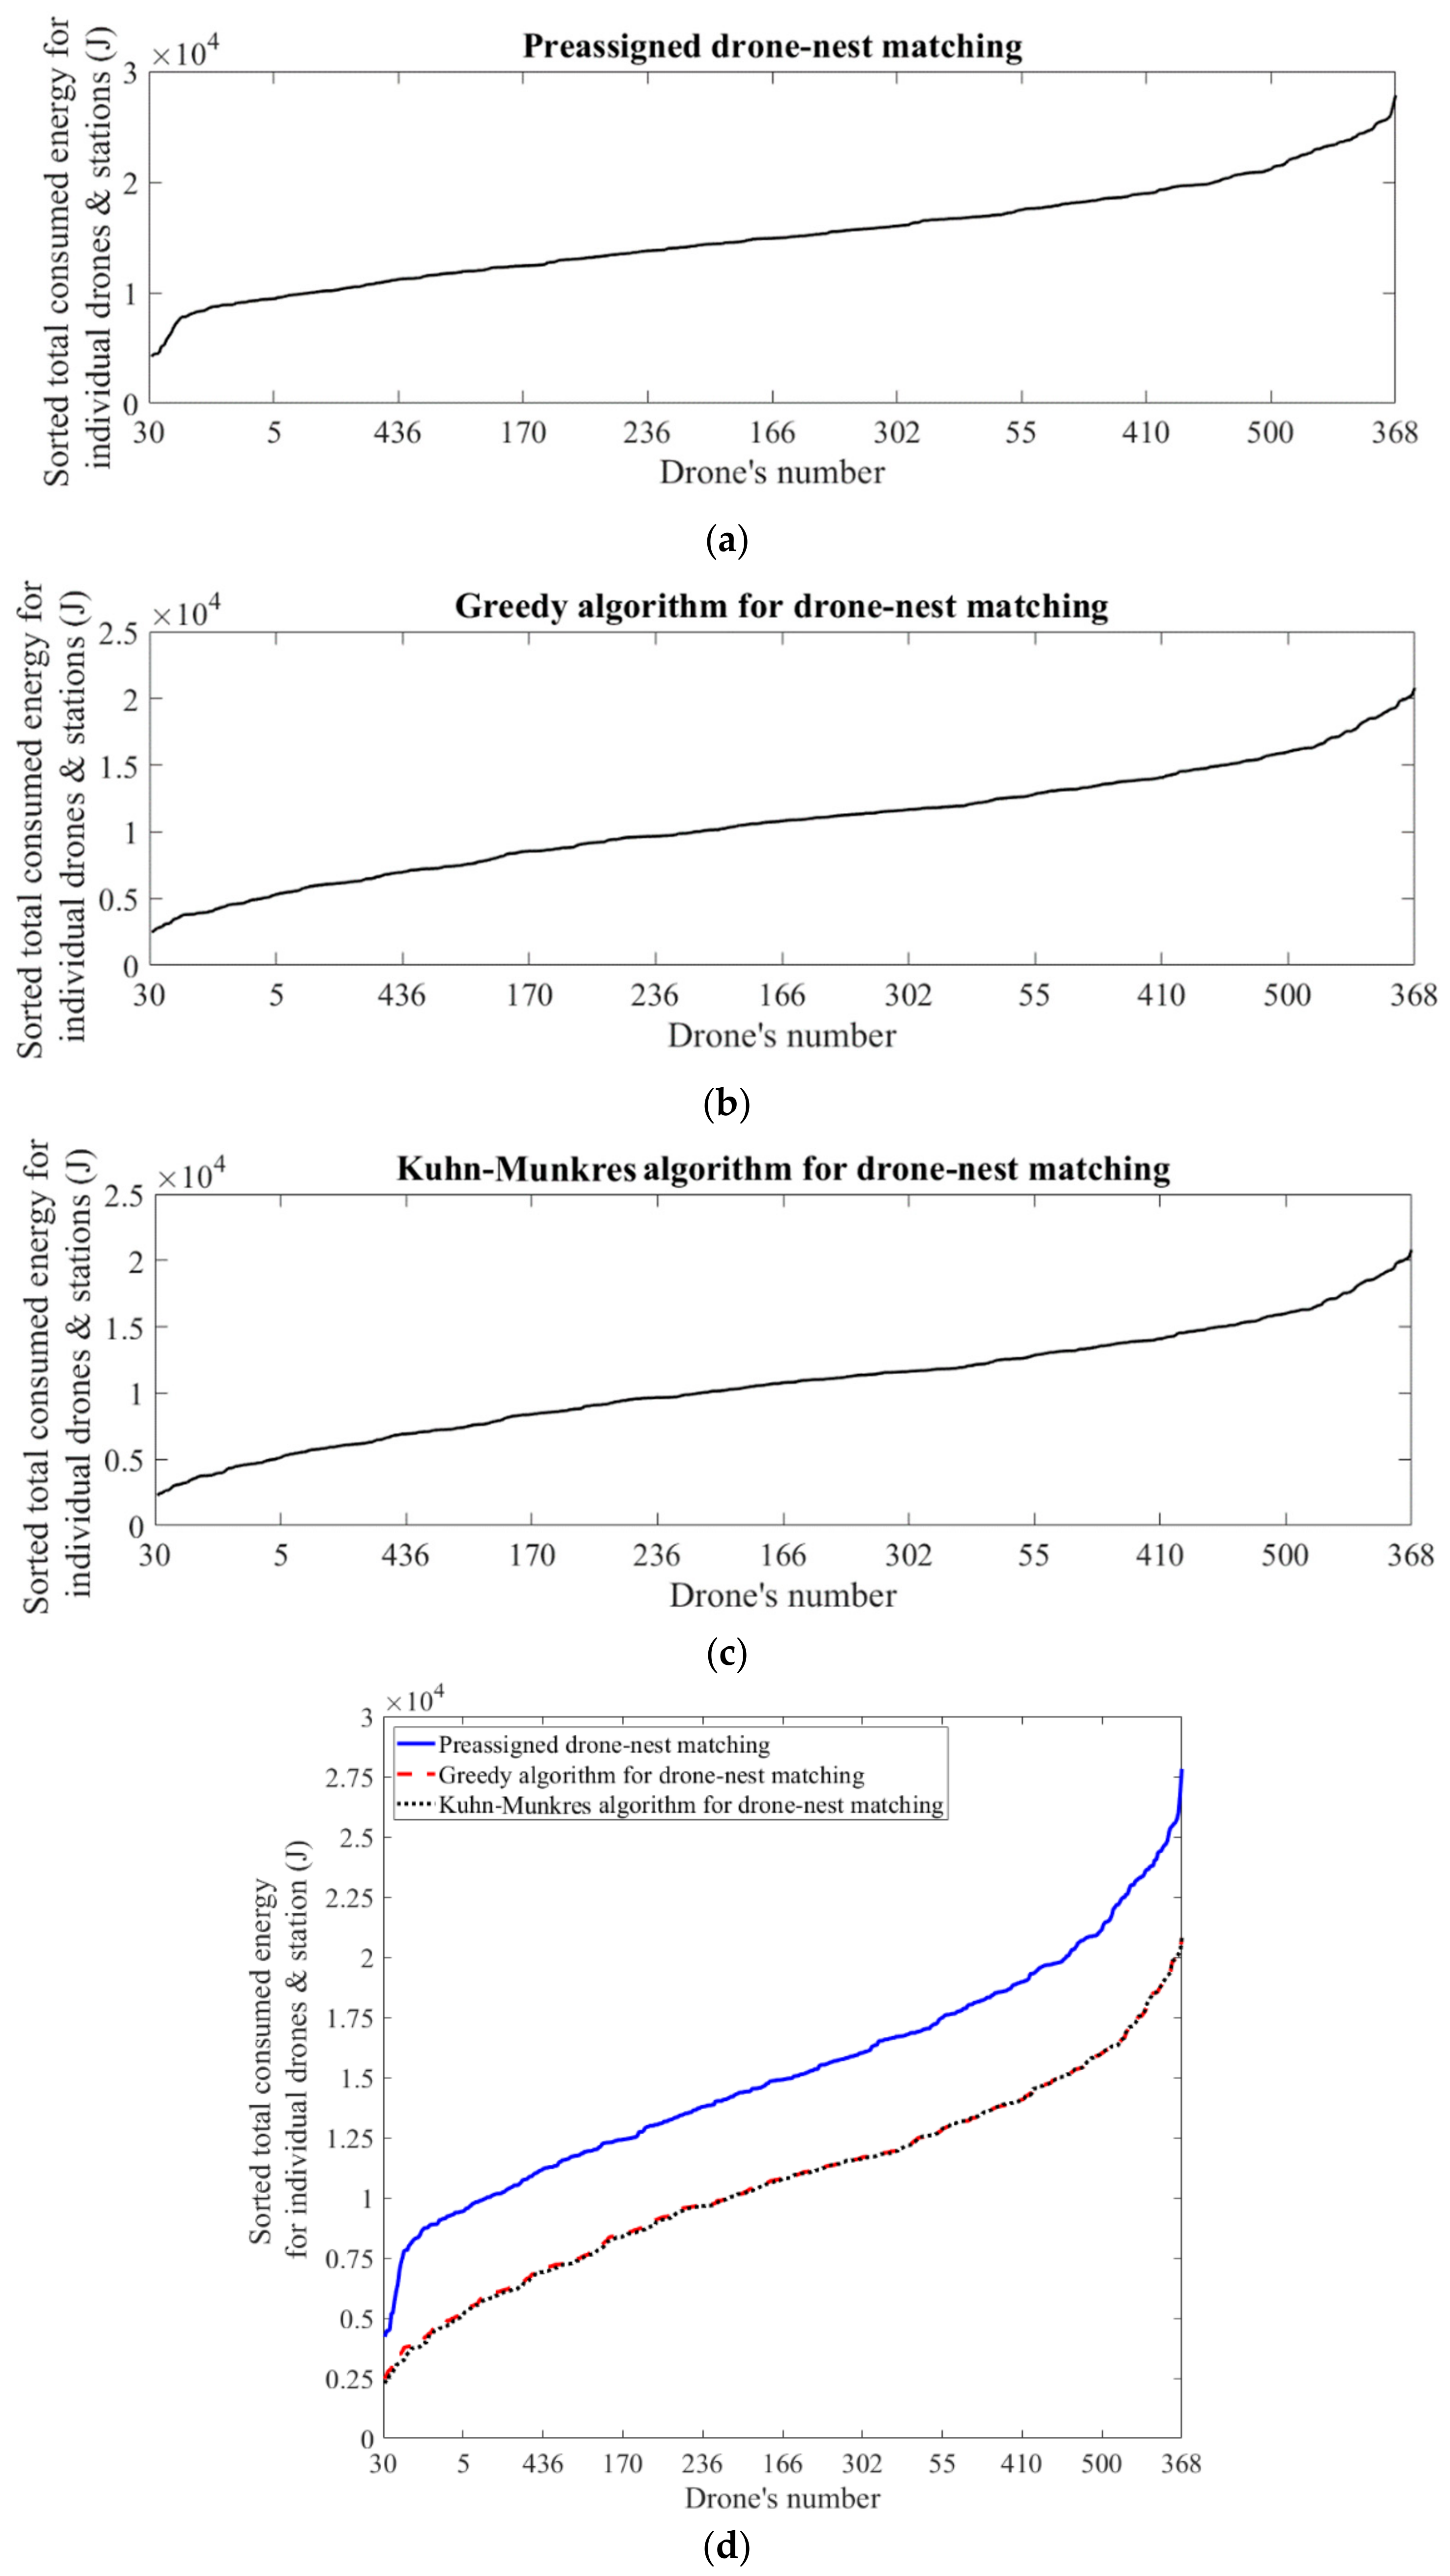
Figure 10b shows that the total energy consumed by individual drones in matching through the greedy algorithm has lower fluctuations than preassigned and Kuhn–Munkres drone–nest matching due to the type of algorithm. The sorted total consumed energy for each individual drone with different levels of energy is indicated in Figure 11a–c for preassigned, greedy, and Kuhn–Munkres matching, respectively. Figure 11a–d shows that the sorted total consumed energy for individual drones through greedy and Kuhn–Munkres matchings is more linear and has lower values than the preassigned matching.
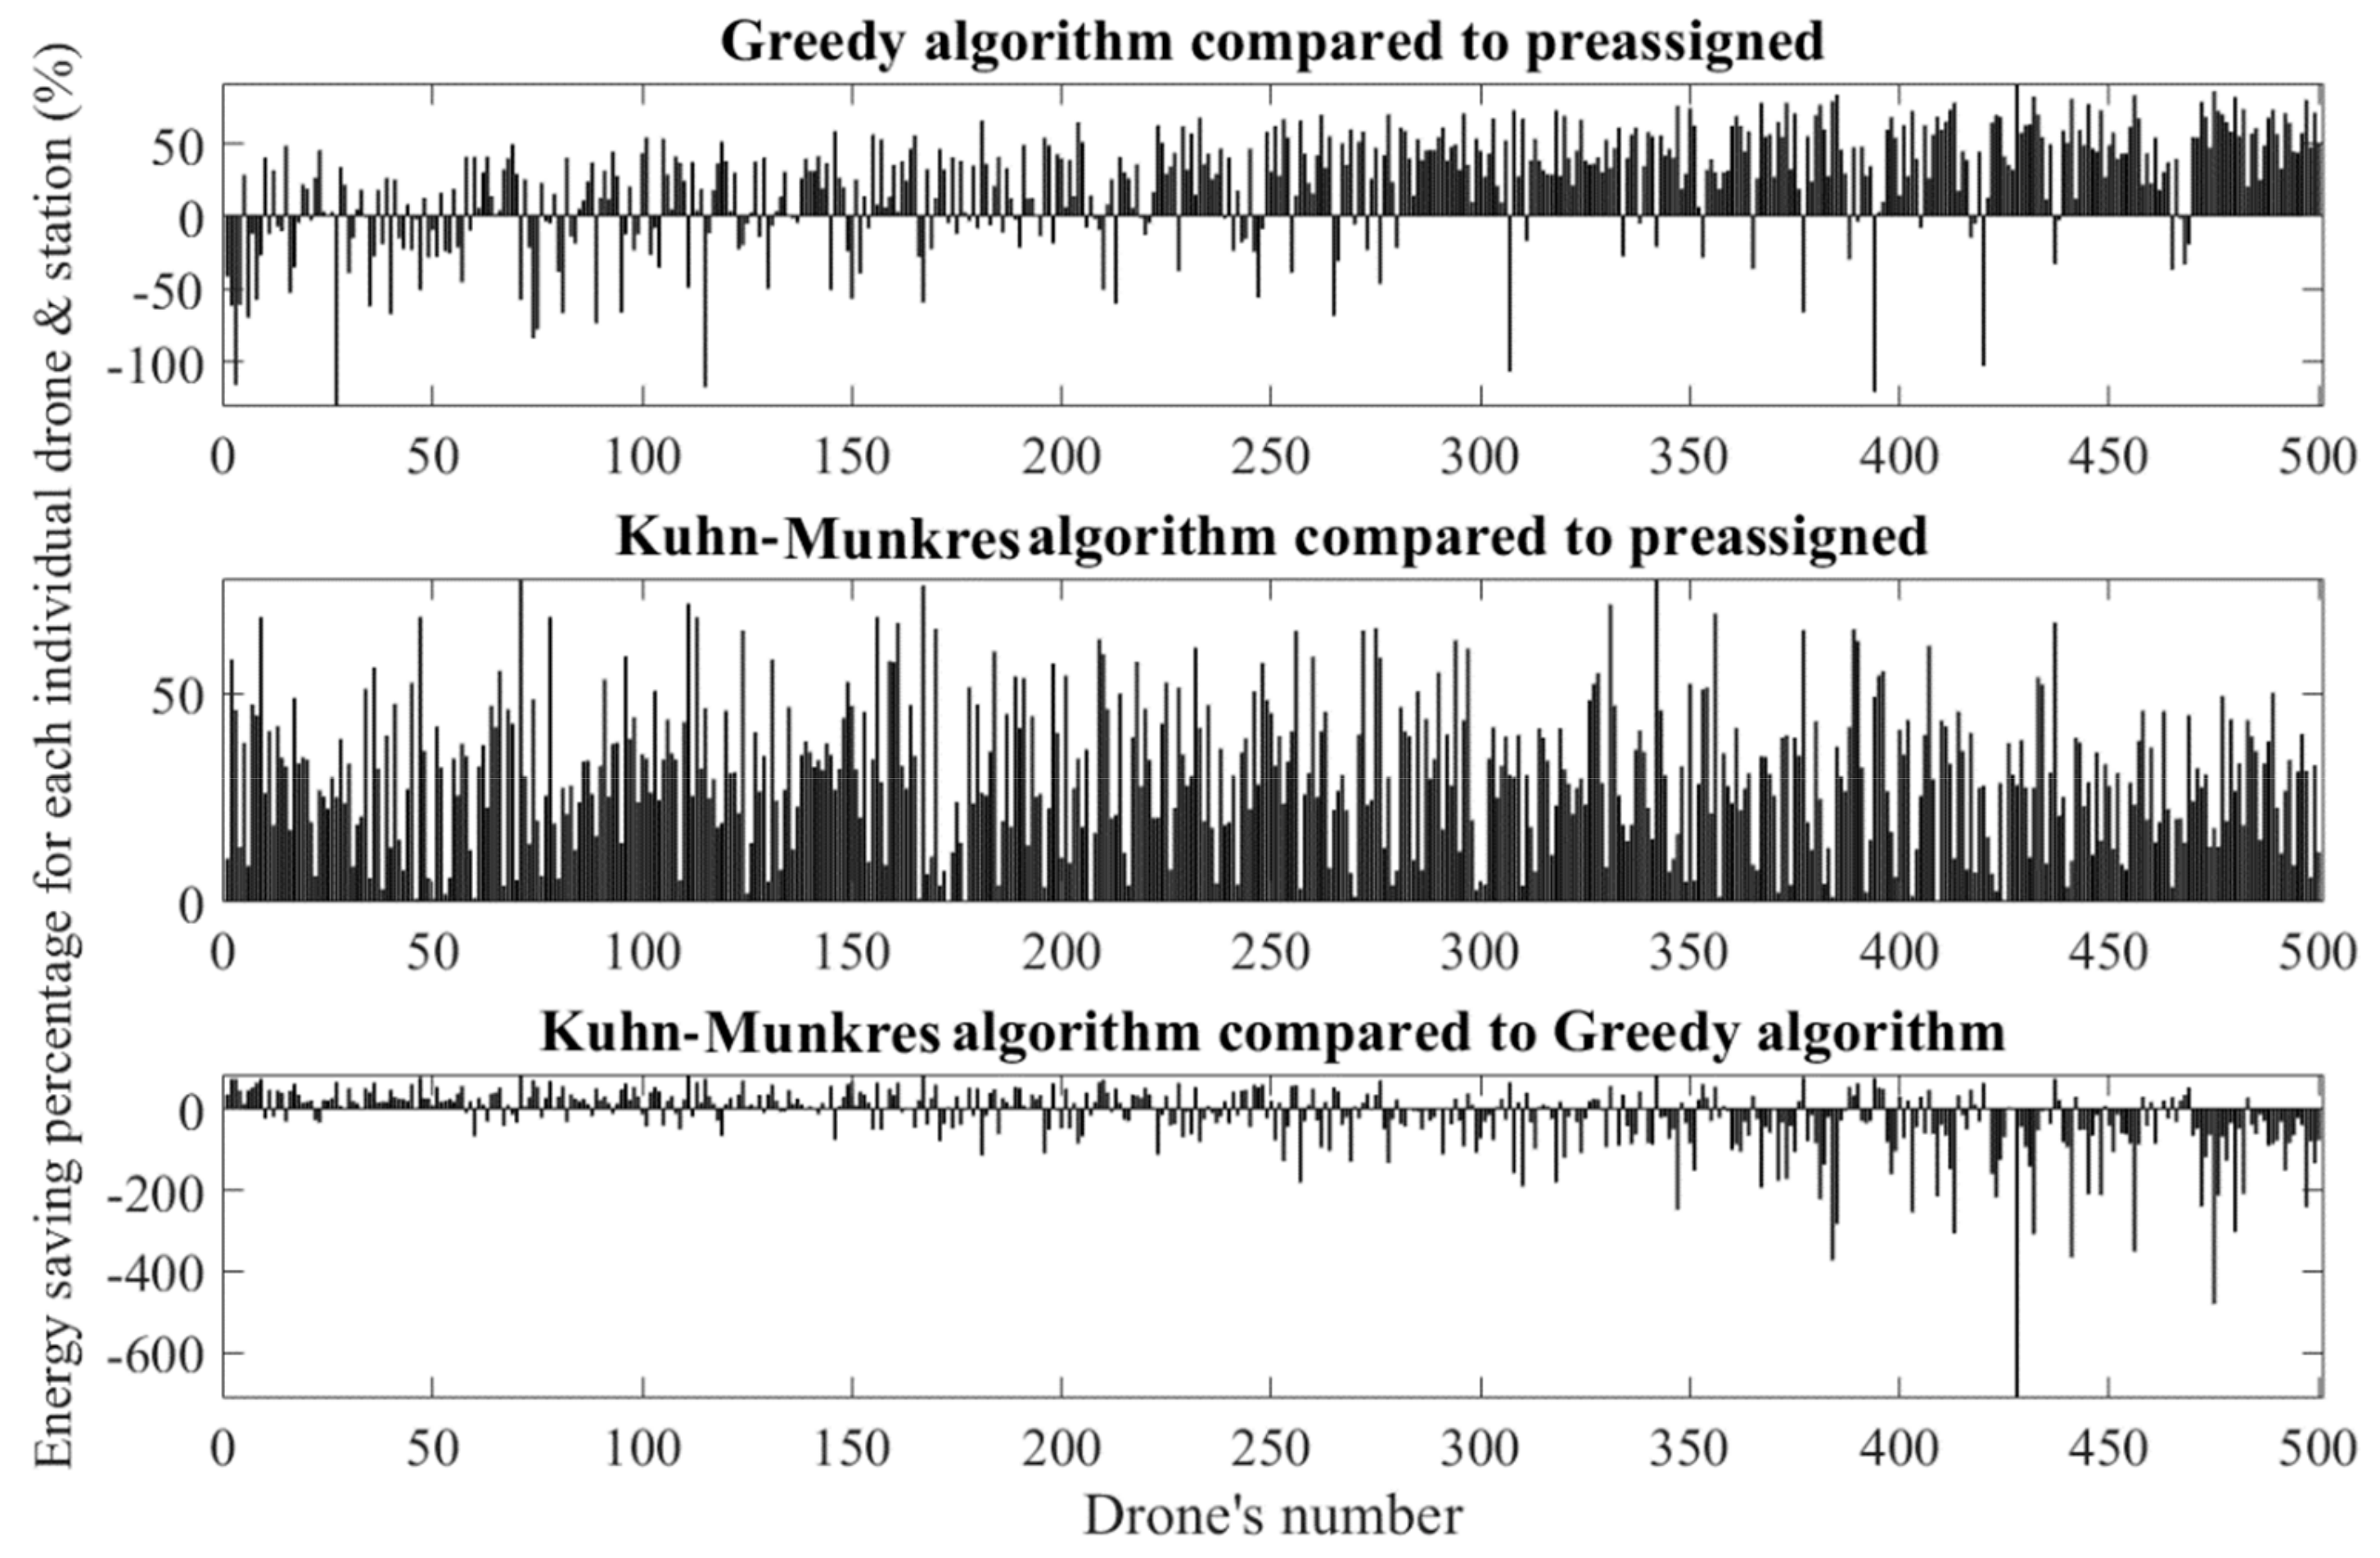
Figure 12 shows the energy-saving percentage of drone–nest matching through the greedy algorithm compared to preassigned, and Kuhn–Munkres algorithm compared to preassigned and the greedy algorithm for each individual drone with a different level of initial energy. The bar graphs in each comparison indicate a mean and median energy savings of 27% and 41% for the greedy algorithm compared to preassigned, 41% and 42% for the Kuhn–Munkres algorithm compared to preassigned, and a median of 4% for Kuhn–Munkres compared to the greedy algorithm. It can be concluded from the results that an energy savings of almost 40% can be achieved for each drone through the Kuhn–Munkres and greedy algorithms compared to preassigned matching.
5.3. Matching of Drones and Stations with Different Energy Levels
In the third scenario, drones with random energy levels will be matched with stations with different levels of energy. As noted before, the drones’ stations can be charged through direct electricity from lighting poles or received solar radiation. In order to save time while performing missions in smart cities, the charging time of drones is important. To this end, drones that have spent most of their energy during the mission should be matched with their nearest stations and a high level of charge. In this case, considering the numbers of drones with random locations and different levels of energy and preassigned stations with different energy levels, the total consumed energy is calculated. Figure 13a compares the total consumed energy for drones and stations through preassigned, greedy, and Kuhn–Munkres algorithm matchings.
In Figure 13a, it is visible that the drones that are employing greedy and Kuhn–Munkres algorithms for nest selection are consuming less energy than the preassigned matching. Moreover, the results show that the Kuhn–Munkres algorithm for matching is slightly more efficient than the greedy matching. Figure 13b is a comparison of different matching mechanisms. It can be seen from the graph that when the number of drones is more than 25, the energy-saving percentage for the whole system (drones and stations) increases. For Kuhn–Munkres and greedy algorithms compared to preassigned matching, the energy savings is 28% and 27%, respectively. In this scenario, the energy efficiency of the whole system can be improved by 1% through the Kuhn–Munkres algorithm compared to greedy algorithm matching.
The total consumed energy for each individual drone and station of a group of 500 drones andstations with different levels of energy, based on preassigned, greedy, and Kuhn–Munkres drone–nest matching, is shown in Figure 14a–c, respectively. The results indicate that drone–nest matching through greedy and Kuhn–Munkres algorithms saves more energy compared to the preassigned mechanism.
The sorted total consumed energy for each individual drone and the corresponding station with different levels of energy are shown in Figure 15a–c for preassigned, greedy, and Kuhn–Munkres matching, respectively. The results demonstrate a similar trend of the sorted energy for different types of drone–nest matching. It is apparent from Figure 15a–d that matchings through greedy and Kuhn–Munkres algorithms are more efficient than the preassigned drone–nest matching.
The energy-saving percentage of each drone matched with a station with different levels of energy for the greedy algorithm compared to preassigned, and Kuhn–Munkres algorithm compared to the preassigned and greedy algorithms, are indicated in Figure 16. The results in each comparison show a mean and median of saving energy of 23% and 31% for the greedy algorithm compared to preassigned, 30% for the Kuhn–Munkres algorithm compared to preassigned, and a median of 2% for Kuhn–Munkres compared to greedy algorithm. An energy efficiency of almost 30% can be obtained for each drone and its corresponding station through the Kuhn–Munkres and greedy algorithms compared to the preassigned matching.
6. Matching Demonstration through Kuhn–Munkres and Greedy Algorithms
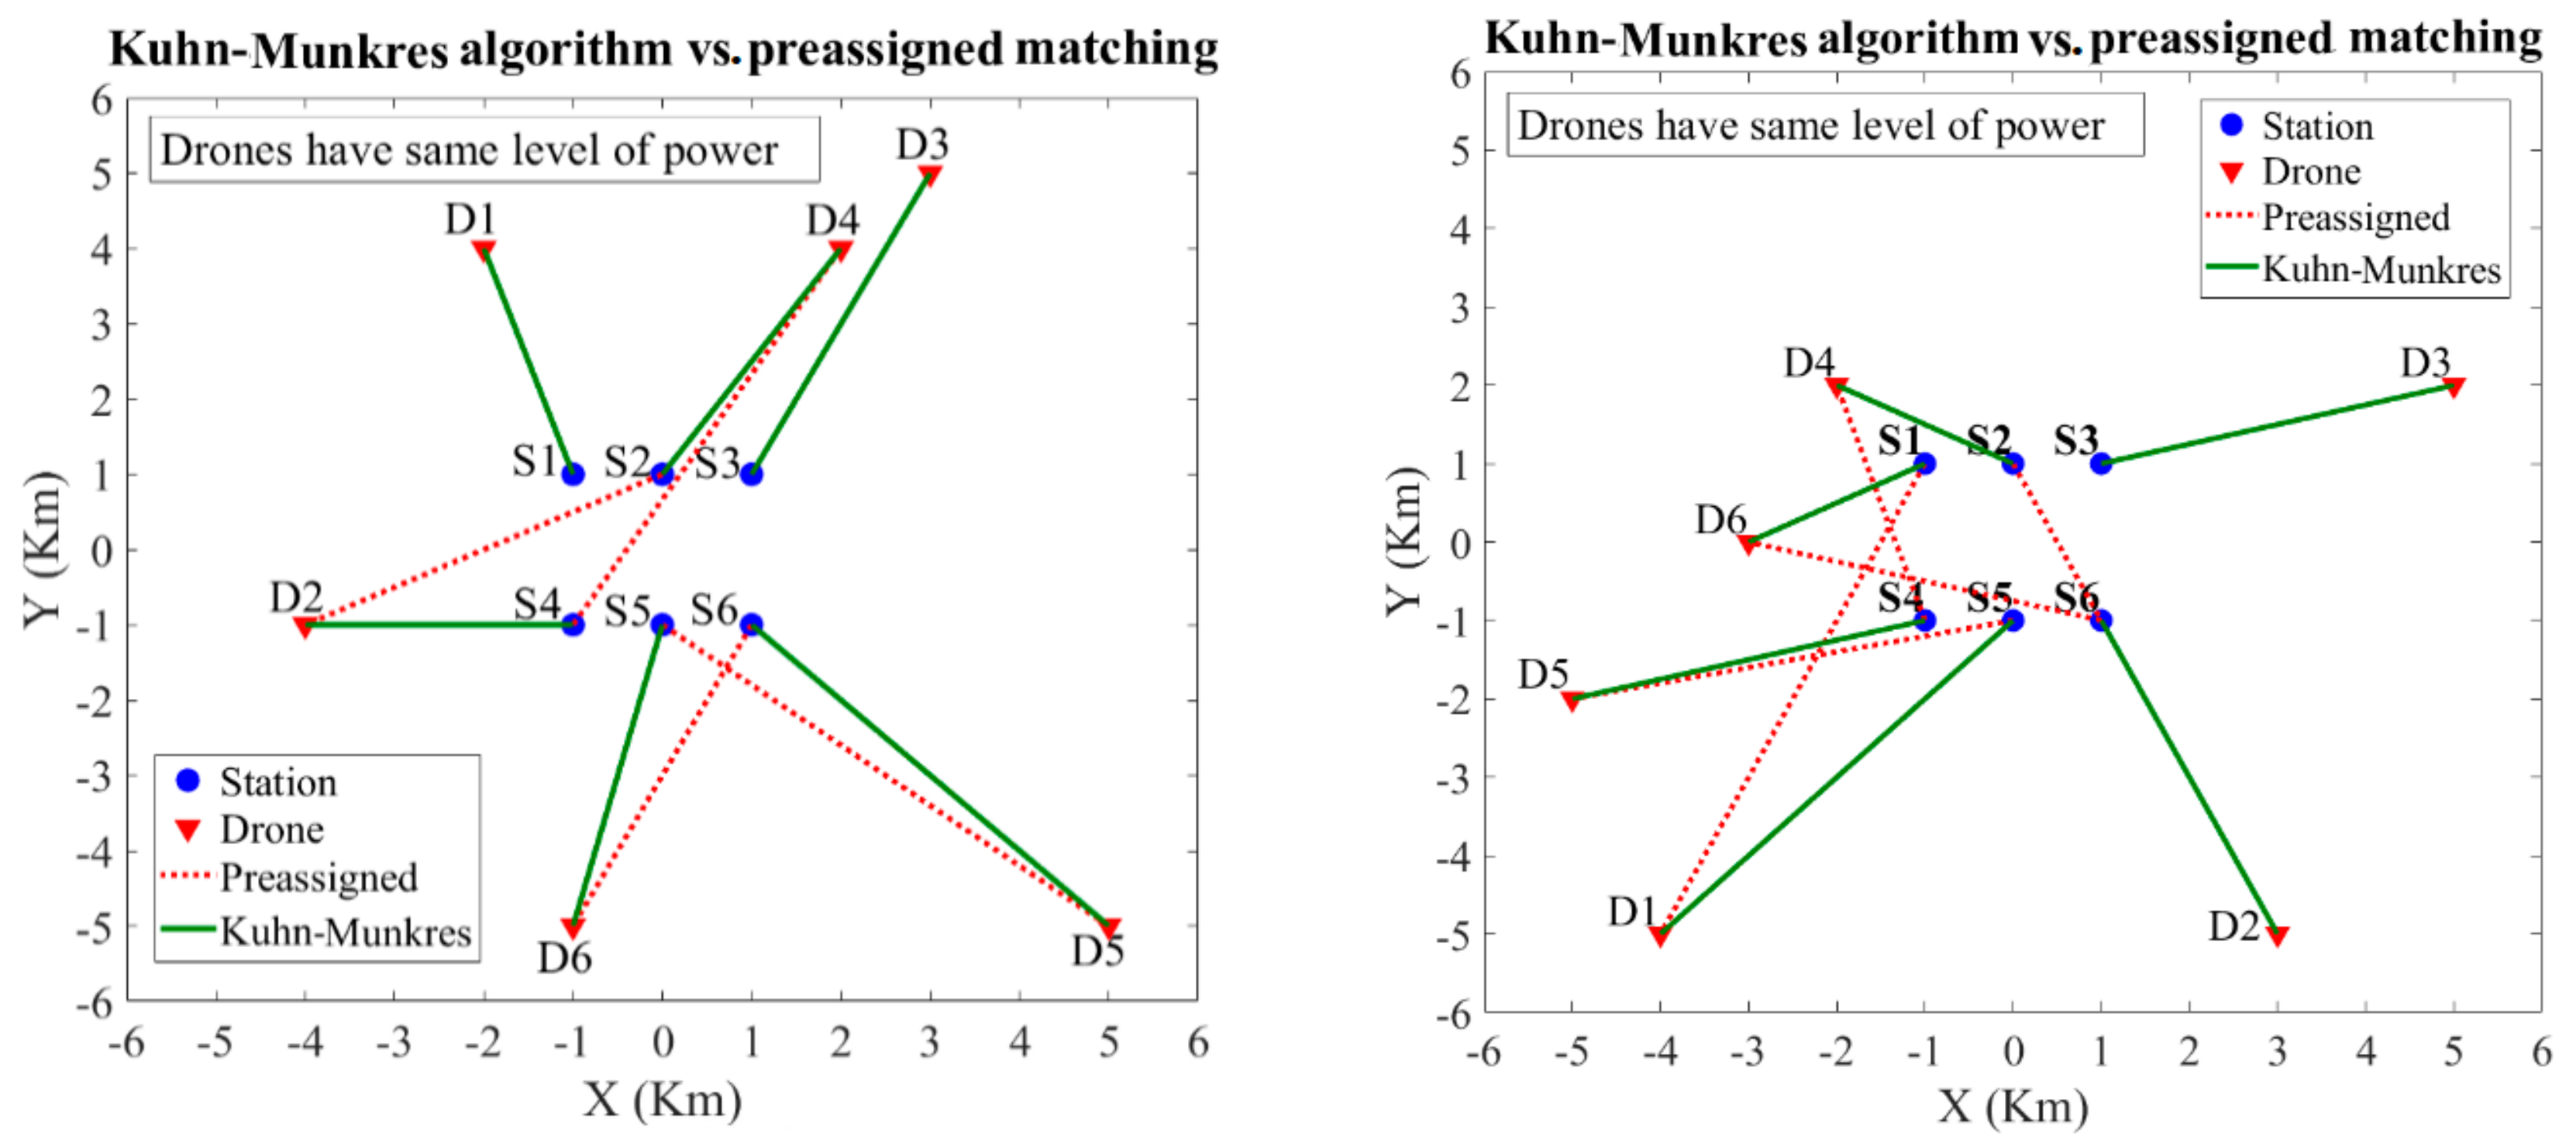
Three different scenarios were discussed above for drone–nest matching in smart cities. It was shown that, depending on the energy level of drones and stations, each matching mechanism has a certain energy-saving percentage compared to each other. In the first scenario, it was assumed that all the drones and stations have a similar level of energy. In this case, if drones have the same configuration and consequently a similar drag force, the remaining energy for each drone is expressed as in Equation (4). In this scenario, the optimization of the nesting of drones is carried out depending on their distances to the stations. As an example, for six predefined stations and randomly distributed drones, the Kuhn–Munkres and preassigned matchings are compared, as shown in Figure 17.
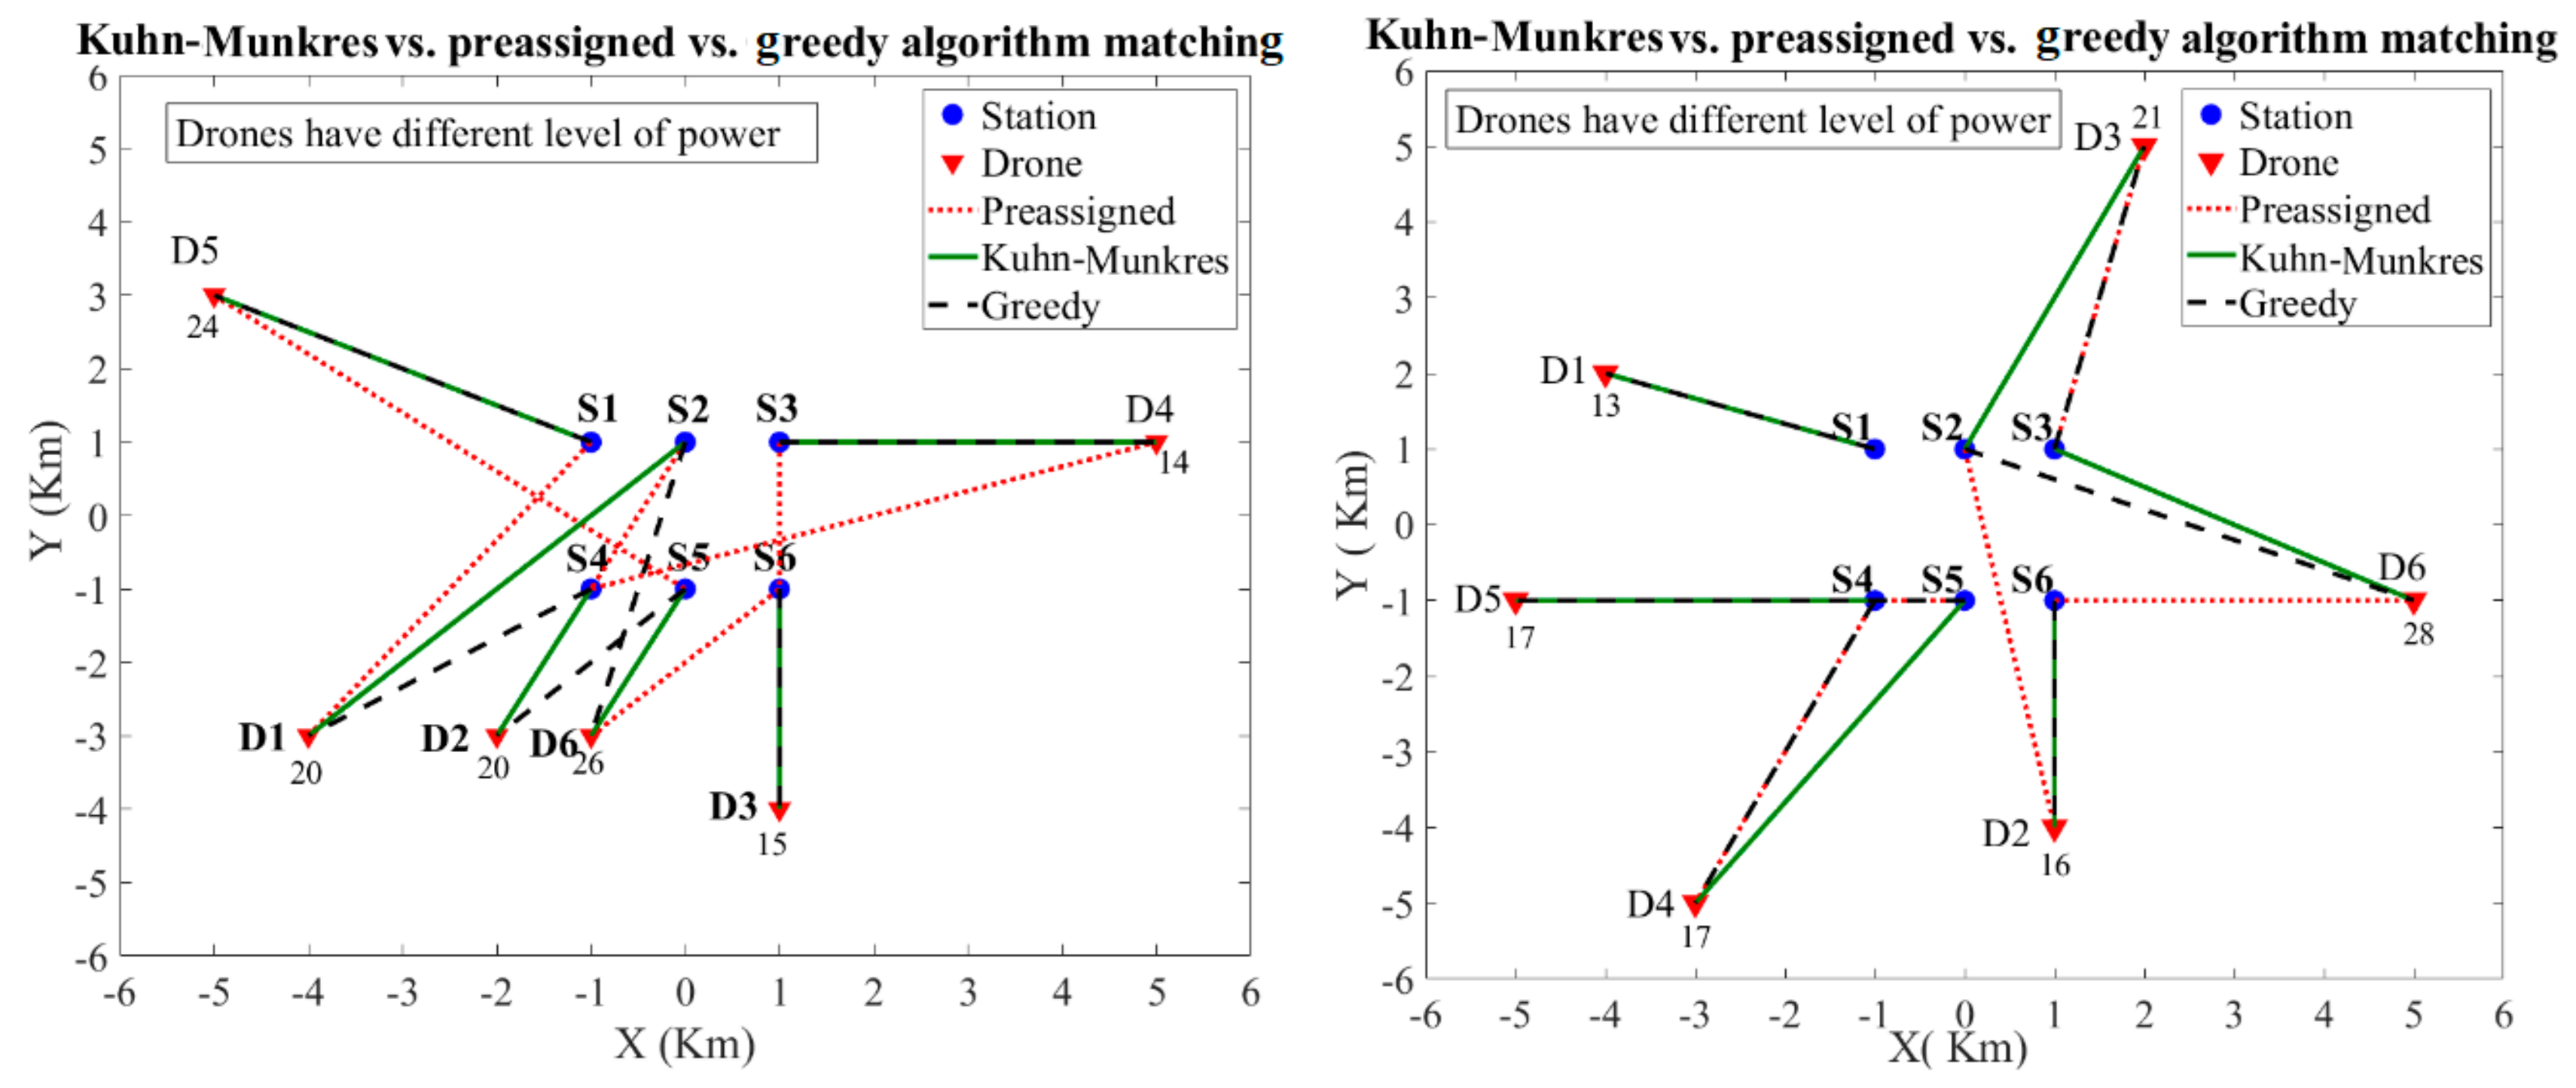
In the second scenario, it was assumed that drones have a different level of energy. Three different approaches, preassigned, the greedy algorithm, and the Kuhn–Munkres algorithm, were applied for drone–nest matching. In this scenario, the drone–nest matching optimization is carried out based on the energy level of the drones and their distances to the stations. For six predefined stations and randomly distributed drones with different levels of energy, the Kuhn–Munkres, greedy, and preassigned matchings are shown in Figure 18.
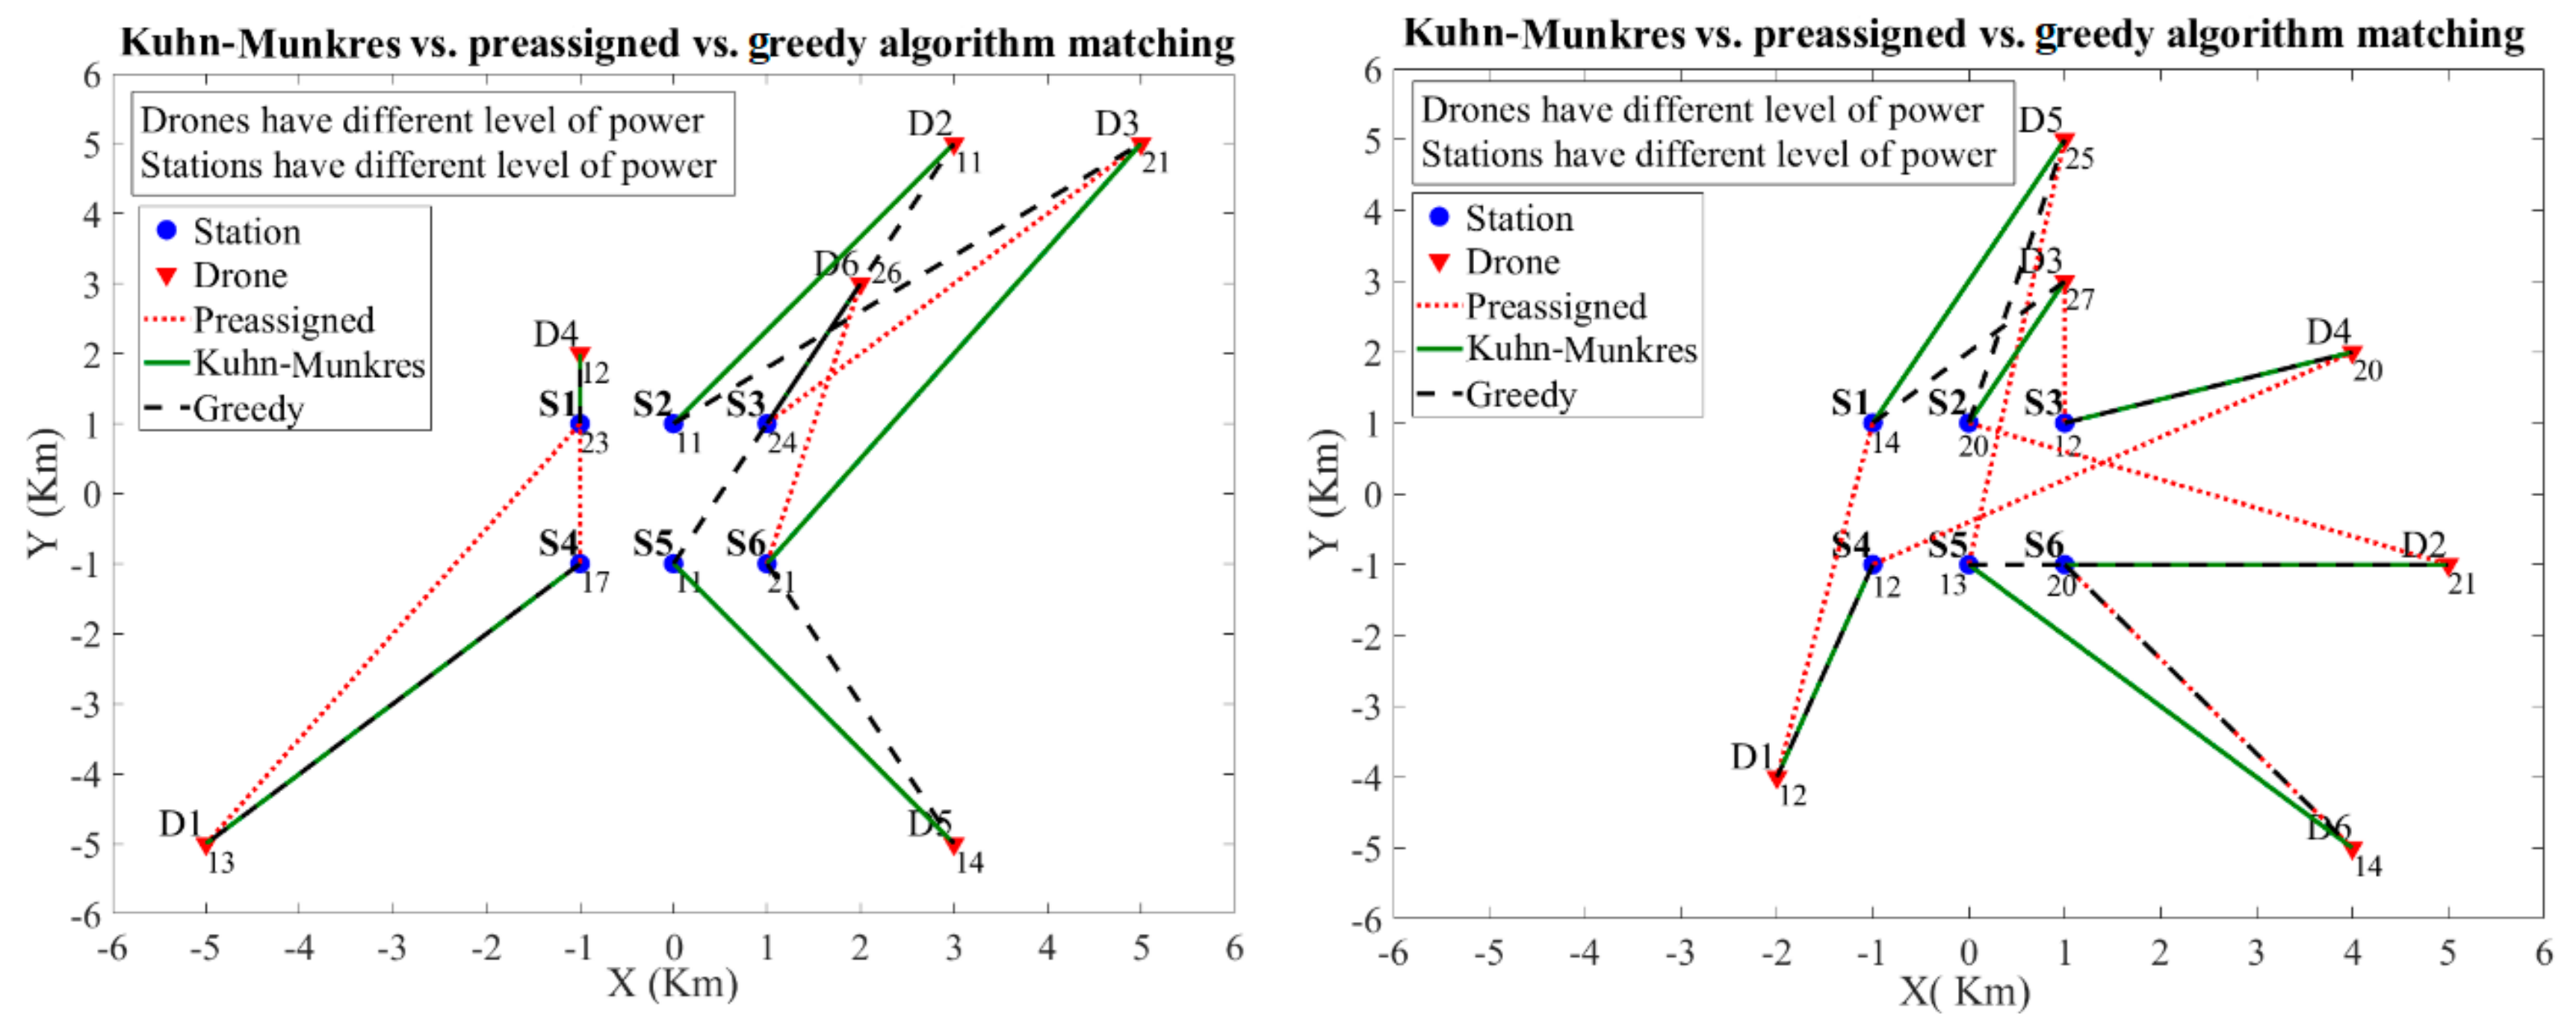
In the third scenario, drones and their stations have different levels of energy. Preassigned, greedy, and Kuhn–Munkres algorithms were compared together for drone–nest matching. The drone–nest matching is conducted based on the energy level of the stations, drones and their distances to the stations. For six predefined stations with different energy levels and randomly distributed drones with different levels of energy, the Kuhn–Munkres, greedy, and preassigned matchings are shown in Figure 19.
7. Conclusions
In this paper, an optimized approach for networking and assigning the best stations for drones was proposed. Taking inspiration from the nests of birds, lighting poles in cities were considered as possible stands for drones’ charging stations. It was shown that, to increase the efficiency of drones in smart cities, there is a need for matching between the drones and stations. Greedy and Kuhn–Munkres (Hungarian matching) algorithms were used to minimize the power required for the drones to land in the defined nests in an urban area. It was demonstrated that drones and stations form a bipartite graph that can easily be represented by an adjacency matrix. Three different scenarios were discussed for assigning stations for the drones. For different numbers of stations and drones with random locations and levels of energy, the total distances were calculated. It was shown that drones that use greedy or Kuhn–Munkres algorithms save more energy compared to preassigned matching.
Author Contributions
Conceptualization, M.H. and A.M.; methodology, A.M.; software, A.M.; validation, M.H. and A.M.; writing original draft preparation, A.M. and M.H.; writing review and editing, M.H.
Funding
This research received no external funding.
Conflicts of Interest
The authors declare no conflict of interest.
References
- Neirotti, P.; De Marco, A.; Cagliano, A.C.; Mangano, G.; Scorrano, F. Current trends in Smart City initiatives: Some stylised facts. Cities 2014, 38, 25–36. [Google Scholar] [CrossRef]
- Albino, V.; Berardi, U.; Dangelico, R.M. Smart cities: Definitions, dimensions, performance, and initiatives. J. Urban Technol. 2015, 22, 3–21. [Google Scholar] [CrossRef]
- Batty, M.; Axhausen, K.W.; Giannotti, F.; Pozdnoukhov, A.; Bazzani, A.; Wachowicz, M.; Ouzounis, G.; Portugali, Y. Smart cities of the future. Eur. Phys. J. Spec. Top. 2012, 214, 481–518. [Google Scholar] [CrossRef]
- Barrionuevo, J.M.; Berrone, P.; Ricart, J.E. Smart cities, sustainable progress. IESE Insight 2012, 14, 50–57. [Google Scholar] [CrossRef]
- van Dijk, M.P. Smart Eco-Cities Are Managing Information Flows in an Integrated Way: The Example of Water, Electricity and Solid Waste. In Smart Futures, Challenges of Urbanisation, and Social Sustainability; Springer: Cham, Switzerland, 2018; pp. 149–168. [Google Scholar]
- Minoli, D.; Occhiogrosso, B. Internet of Things Applications for Smart Cities. In Internet of Things A to Z: Technologies and Applications; Wiley: New York, NY, USA, 2018; p. 319. [Google Scholar]
- Rathore, M.M.; Ahmad, A.; Paul, A.; Rho, S. Urban planning and building smart cities based on the internet of things using big data analytics. Comput. Netw. 2016, 101, 63–80. [Google Scholar] [CrossRef]
- Calvillo, C.F.; Sánchez-Miralles, A.; Villar, J. Energy management and planning in smart cities. Renew. Sustain. Energy Rev. 2016, 55, 273–287. [Google Scholar] [CrossRef]
- Chen, X.Y.; Jin, Z.G. Research on key technology and applications for internet of things. Phys. Procedia 2012, 33, 561–566. [Google Scholar] [CrossRef]
- Mirzaeinia, A.; Hassanalian, M.; Mirzaeinia, M. Cellular Phone Loaded Network Field Test Using Swarming Drones: Replacing Drive Test and Particle Swarm Optimization. In Proceedings of the AIAA Aviation 2019 Forum, Dallas, TX, USA, 17–21 June 2019. [Google Scholar]
- Sappington, R.N.; Acosta, G.A.; Hassanalian, M.; Lee, K.; Morelli, R. Drone Stations in Airports for Runway and Airplane Inspection Using Image Processing Techniques. In Proceedings of the AIAA Aviation 2019 Forum, Dallas, TX, USA, 17–21 June 2019. [Google Scholar]
- Acosta, G.A.; Grow, D.; Hassanalian, M. Design and Analysis of a High Pressure and High Temperature Fixed Wing Space Drone for Venus Exploration. In Proceedings of the AIAA Aviation 2019 Forum, Dallas, TX, USA, 17–21 June 2019. [Google Scholar]
- Mirzaeinia, A.; Hassanalian, M.; Lee, K.; Mirzaeinia, M. Performance Enhancement and Load Balancing of Swarming Drones through Position Reconfiguration. In Proceedings of the AIAA Aviation 2019 Forum, Dallas, TX, USA, 17–21 June 2019. [Google Scholar]
- Hassanalian, M.; Quintana, A.; Abdelkefi, A. Morphing and growing micro unmanned air vehicle: Sizing process and stability. Aerosp. Sci. Technol. 2018, 78, 130–146. [Google Scholar] [CrossRef]
- Hassanalian, M.; Rice, D.; Abdelkefi, A. Evolution of space drones for planetary exploration: A review. Prog. Aerosp. Sci. 2018, 97, 61–105. [Google Scholar] [CrossRef]
- Hassanalian, M.; Abdelkefi, A. Classifications, applications, and design challenges of drones: A review. Prog. Aerosp. Sci. 2017, 91, 99–131. [Google Scholar] [CrossRef]
- Jung, S.; Ariyur, K.B. Robustness for Large Scale UAV Autonomous Operations. In Proceedings of the 2011 IEEE International Systems Conference, Montreal, QC, Canada, 4–7 April 2011; pp. 309–314. [Google Scholar]
- Hassanalian, M.; Abdelkefi, A. Design, manufacturing, and flight testing of a fixed wing micro air vehicle with Zimmerman planform. Meccanica 2017, 52, 1265–1282. [Google Scholar] [CrossRef]
- Mohammed, F.; Idries, A.; Mohamed, N.; Al-Jaroodi, J.; Jawhar, I. UAVs for Smart Cities: Opportunities and Challenges. In Proceedings of the Unmanned Aircraft Systems (ICUAS), Orlando, FL, Canada, 27–30 May 2014. [Google Scholar]
- Yu, H.; Meier, K.; Argyle, M.; Beard, R.W. Cooperative path planning for target tracking in urban environments using unmanned air and ground vehicles. IEEE/ASME Trans. Mechatron. 2014, 20, 541–552. [Google Scholar] [CrossRef]
- Ataei, A.; Paschalidis, I.C. Quadrotor Deployment for Emergency Response in Smart Cities: A Robust MPC Approach. In Proceedings of the 2015 54th IEEE Conference on Decision and Control (CDC), Osaka, Japan, 15–18 December 2015; pp. 5130–5135. [Google Scholar]
- Foina, A.G.; Sengupta, R.; Lerchi, P.; Liu, Z.; Krainer, C. Drones in Smart Cities: Overcoming Barriers through Air Traffic Control Research. In Proceedings of the Education and Development of Unmanned Aerial Systems (RED-UAS), Cancun, Mexico, 23–25 November 2015; pp. 351–359. [Google Scholar]
- Gallacher, D. Drones to manage the urban environment: Risks, rewards, alternatives. J. Unmanned Veh. Syst. 2016, 4, 115–124. [Google Scholar] [CrossRef]
- Vattapparamban, E.; Güvenç, İ.; Yurekli, A.İ.; Akkaya, K.; Uluağaç, S. Drones for smart cities: Issues in cybersecurity, privacy, and public safety. In Proceedings of the 2016 International Wireless Communications and Mobile Computing Conference (IWCMC), Paphos, Cyprus, 5–9 September 2016; pp. 216–221. [Google Scholar]
- Jensen, O.B. Drone city–power, design and aerial mobility in the age of “smart cities”. Geogr. Helv. 2016, 71, 67–75. [Google Scholar] [CrossRef]
- Menouar, H.; Guvenc, I.; Akkaya, K.; Uluagac, A.S.; Kadri, A.; Tuncer, A. UAV-enabled intelligent transportation systems for the smart city: Applications and challenges. IEEE Commun. Mag. 2017, 55, 22–28. [Google Scholar] [CrossRef]
- Khan, M.A.; Alvi, B.A.; Safi, A.; Khan, I.U. Drones for Good in Smart Cities: A Review; IEEE: Islamabad, Pakistan, 2018. [Google Scholar]
- Yang, Q.; Yoo, S.J. Optimal UAV path planning: Sensing data acquisition over IoT sensor networks using multi-objective bio-inspired algorithms. IEEE Access 2018, 6, 13671–13684. [Google Scholar] [CrossRef]
- Bahabry, A.; Wan, X.; Ghazzai, H.; Menouar, H.; Vesonder, G.; Massoud, Y. Low-altitude navigation for multi-rotor drones in urban areas. IEEE Access 2019, 7, 87716–87731. [Google Scholar] [CrossRef]
- Ghazzai, H.; Menouar, H.; Kadri, A.; Massoud, Y. Future UAV-Based ITS: A Comprehensive Scheduling Framework. IEEE Access 2019, 7, 75678–75695. [Google Scholar] [CrossRef]
- Briod, A.; Klaptocz, A.; Zufferey, J.C.; Floreano, D. The AirBurr: A flying robot that can exploit collisions. In Proceedings of the 2012 ICME International Conference on Complex Medical Engineering (CME), Kobe, Japan, 1–4 July 2012; pp. 569–574. [Google Scholar]
- Mulgaonkar, Y.; Kientz, T.; Whitzer, M.; Kumar, V. Design and fabrication of safe, light-weight, flying robots. In Proceedings of the ASME 2015 International Design Engineering Technical Conferences and Computers and Information in Engineering Conference, Boston, MA, USA, 2–5 August 2015. [Google Scholar]
- Sareh, P.; Chermprayong, P.; Emmanuelli, M.; Nadeem, H.; Kovac, M. Rotorigami: A rotary origami protective system for robotic rotorcraft. Sci. Robot. 2018, 3, eaah5228. [Google Scholar] [CrossRef]
- Sareh, P.; Chermprayong, P.; Emmanuelli, M.; Nadeem, H.; Kovac, M. The Spinning Cyclic ‘Miura-oRing’ for Mechanical Collision-Resilience. In Proceedings of the 7th International Meeting on Origami in Science, Mathematics and Education (7OSME), Oxford, UK, 5–7 September 2018; pp. 981–994. [Google Scholar]
- Briod, A.; Kornatowski, P.; Zufferey, J.C.; Floreano, D. A collision-resilient flying robot. J. Field Robot. 2014, 31, 496–509. [Google Scholar] [CrossRef]
- Malandrakis, K.; Dixon, R.; Savvaris, A.; Tsourdos, A. Design and development of a novel spherical UAV. IFAC-PapersOnLine 2016, 49, 320–325. [Google Scholar] [CrossRef]
- Gentry, N.K.; Hsieh, R.; Nguyen, L.K.; Amazon Technologies Inc. Multi-use UAV Docking Station Systems and Methods. U.S. Patent 9,387,928, 12 July 2016. [Google Scholar]
- Techcrunch. Available online: https://techcrunch.com/2017/05/22/kuang-chi-invests-5-million-in-skyx-a-maker-of-drones-to-monitor-oil-and-gas-pipelines/ (accessed on 21 July 2019).
- Riskmatrix. Available online: http://www.riskmatrix.be/yacob (accessed on 21 July 2019).
- Trendhunter. Available online: https://www.trendhunter.com/trends/drone-dock (accessed on 21 July 2019).
- Hassanalian, M.; Abdelmoula, H.; Ayed, S.B.; Abdelkefi, A. Thermal impact of migrating birds’ wing color on their flight performance: Possibility of new generation of biologically inspired drones. J. Therm. Biol. 2017, 66, 27–32. [Google Scholar] [CrossRef] [PubMed]
- Hassanalian, M.; Throneberry, G.; Ali, M.; Ayed, S.B.; Abdelkefi, A. Role of wing color and seasonal changes in ambient temperature and solar irradiation on predicted flight efficiency of the Albatross. J. Therm. Biol. 2018, 71, 112–122. [Google Scholar] [CrossRef]
- Hassanalian, M.; Ayed, S.B.; Ali, M.; Houde, P.; Hocut, C.; Abdelkefi, A. Insights on the thermal impacts of wing colorization of migrating birds on their skin friction drag and the choice of their flight route. J. Therm. Biol. 2018, 72, 81–93. [Google Scholar] [CrossRef] [PubMed]
- Hassanalian, M.; Abdelmoula, H.; Mohammadi, S.; Bakhtiyarov, S.; Goerlich, J.; Javed, U. Aquatic animal colors and skin temperature: Biology’s selection for reducing oceanic dolphin’s skin friction drag. J. Therm. Biol. 2019, 84, 292–310. [Google Scholar] [CrossRef]
- Jonker, R.; Volgenant, T. Improving the Hungarian assignment algorithm. Oper. Res. Lett. 1986, 5, 171–175. [Google Scholar] [CrossRef]
Figure 1.
Schematic view of drones’ applications and their location.

Figure 2.
Views of birds’ nests.

Figure 3.
Views of the drones’ stations for smart city applications.

Figure 4.
Schematic view of the bipartite graphs for drones and their stations.

Figure 5.
(a) Comparison of total consumed energy and (b) energy-saving percentage versus the number of drones/stations for the Kuhn–Munkres algorithm and preassigned matching.
Figure 5.
(a) Comparison of total consumed energy and (b) energy-saving percentage versus the number of drones/stations for the Kuhn–Munkres algorithm and preassigned matching.

Figure 6.
Views of total energy consumed by each individual drone of a group of 500 drones/stations based on (a) preassigned and (b) Kuhn–Munkres drone–nest matching (drones have the same level of energy).
Figure 6.
Views of total energy consumed by each individual drone of a group of 500 drones/stations based on (a) preassigned and (b) Kuhn–Munkres drone–nest matching (drones have the same level of energy).

Figure 7.
Views of sorted total consumed energy of each individual drone for (a) preassigned matching, (b) Kuhn–Munkres matching, and (c) comparison of preassigned and Kuhn–Munkres methods.
Figure 7.
Views of sorted total consumed energy of each individual drone for (a) preassigned matching, (b) Kuhn–Munkres matching, and (c) comparison of preassigned and Kuhn–Munkres methods.


Figure 8.
Energy-saving percentage of matching through the Kuhn–Munkres algorithm compared to the preassigned method for each individual drone.
Figure 8.
Energy-saving percentage of matching through the Kuhn–Munkres algorithm compared to the preassigned method for each individual drone.

Figure 9.
(a) Comparison of total consumed energy and (b) energy-saving percentage versus the number of drones/stations for the Kuhn–Munkres algorithm, greedy algorithm, and preassigned matching for drones with different level of energy.
Figure 9.
(a) Comparison of total consumed energy and (b) energy-saving percentage versus the number of drones/stations for the Kuhn–Munkres algorithm, greedy algorithm, and preassigned matching for drones with different level of energy.

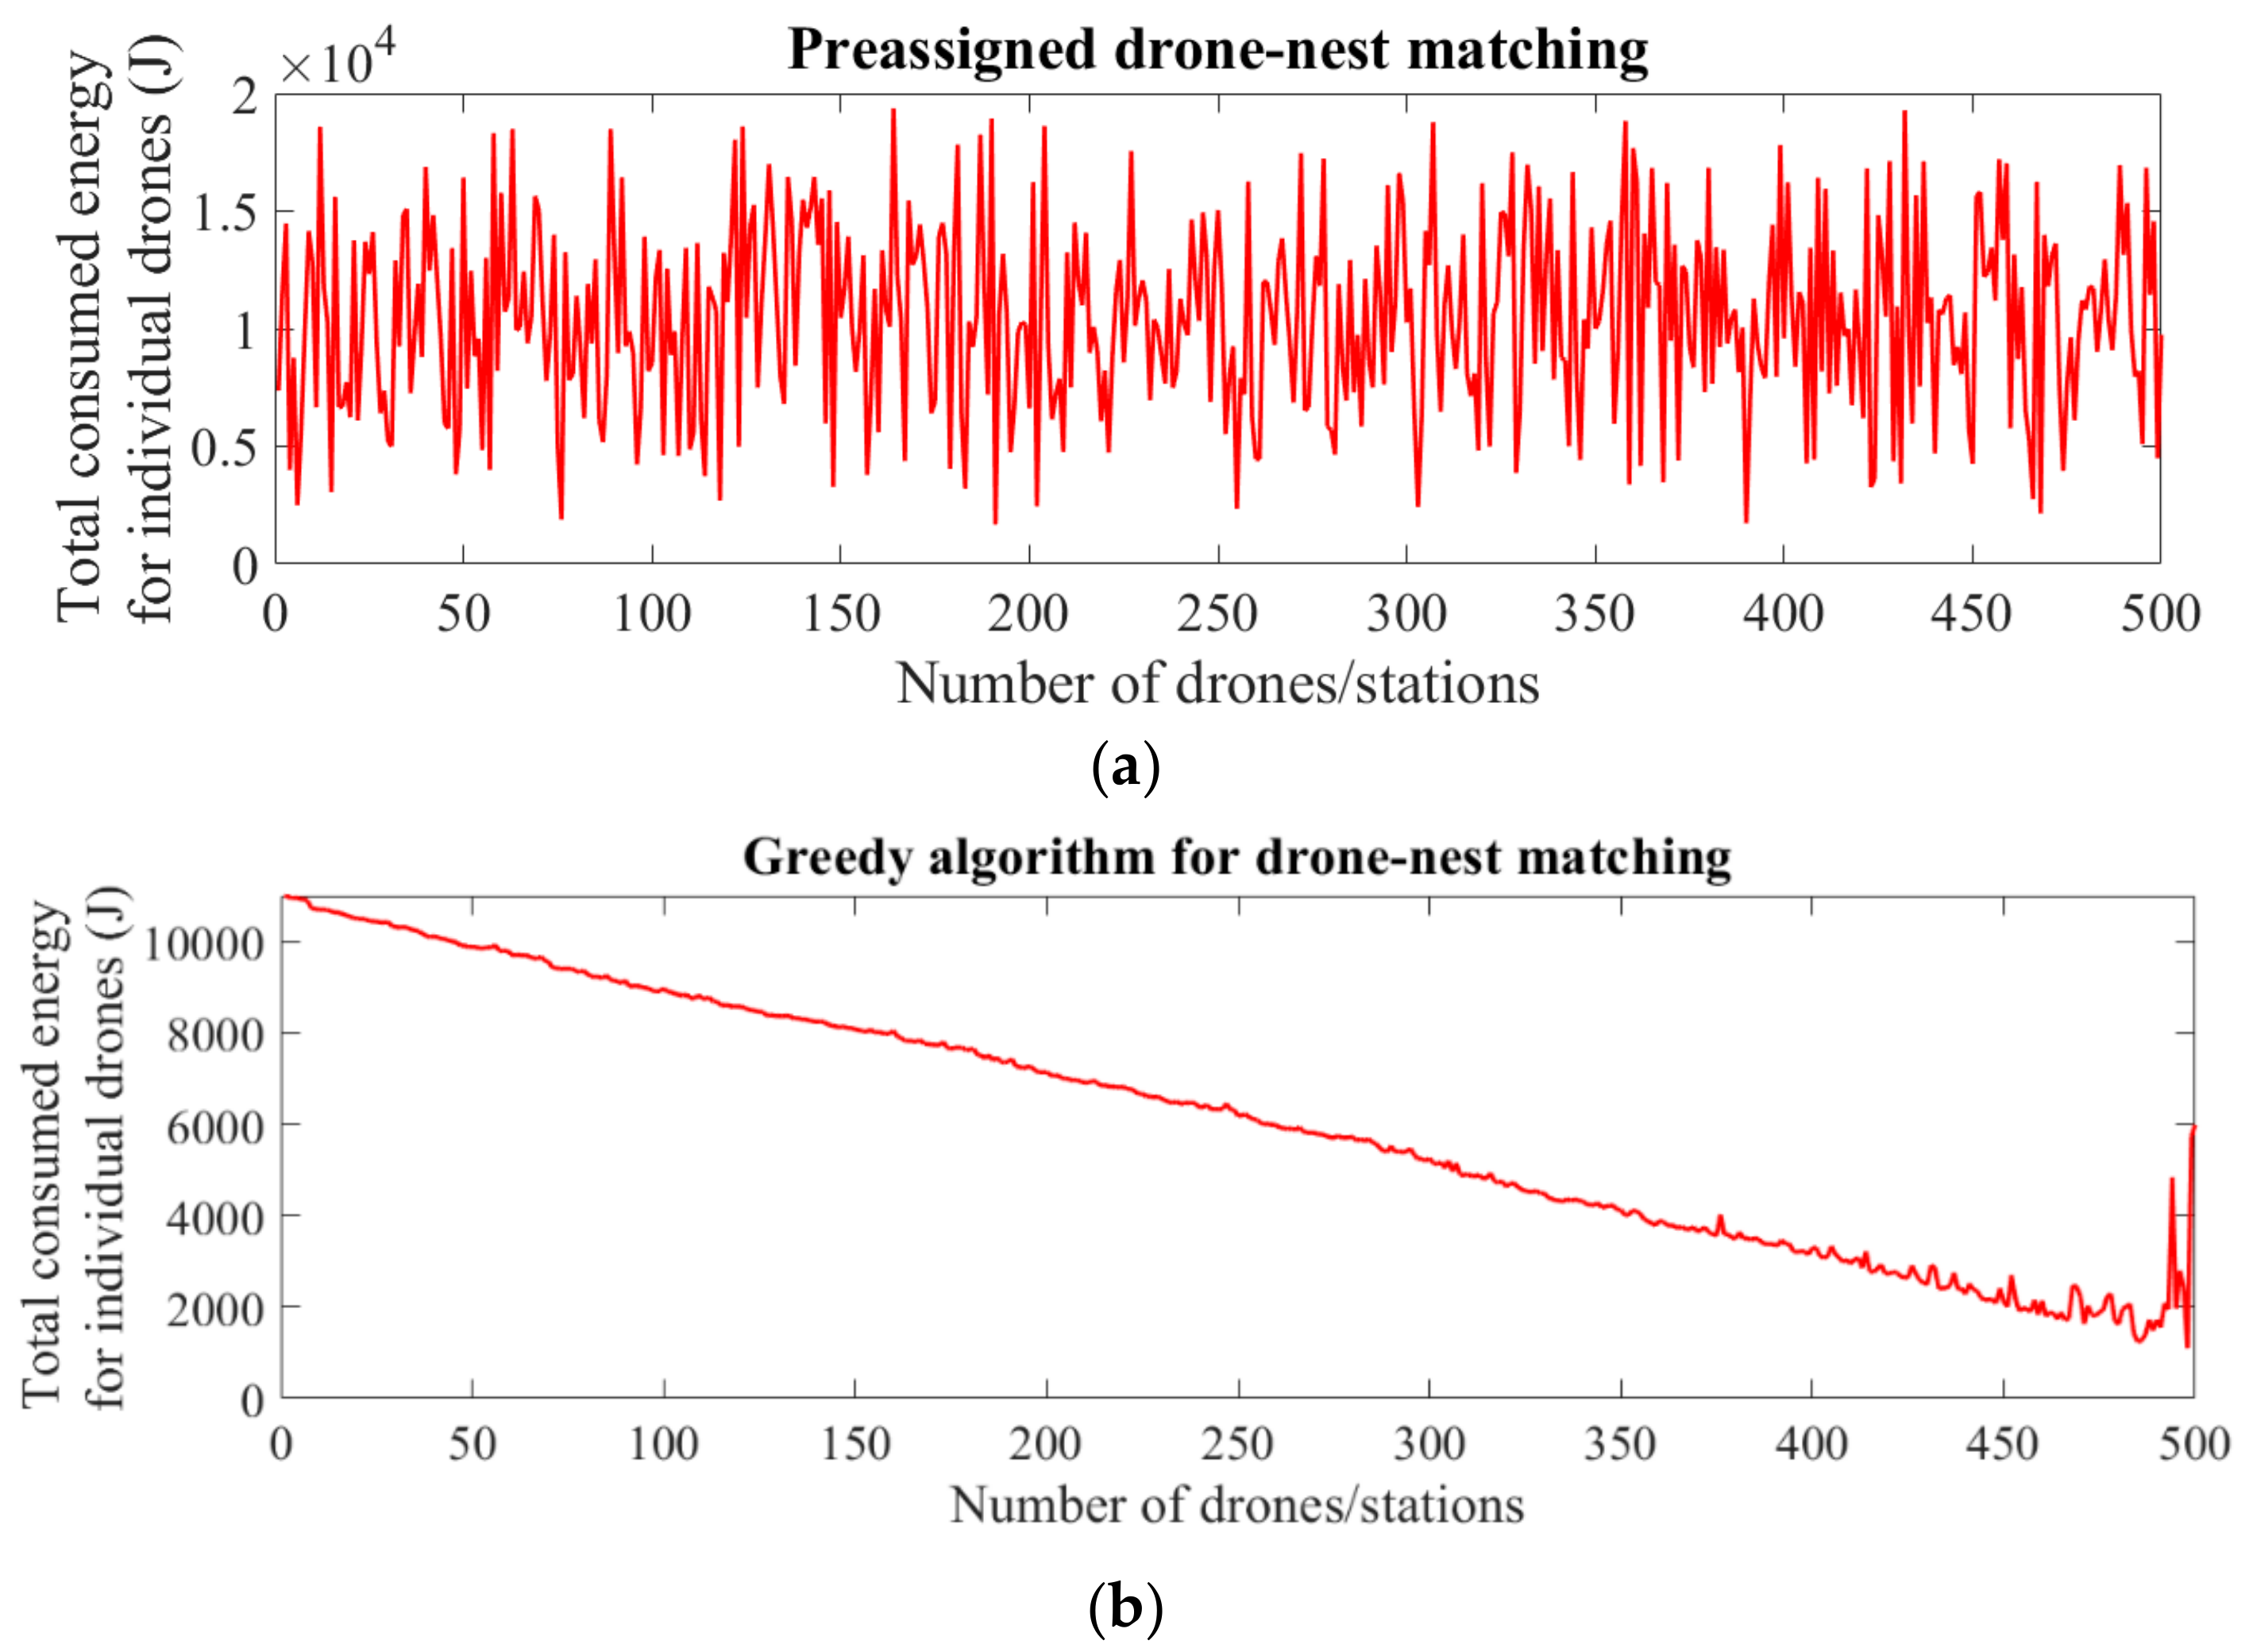
Figure 10.
Total energy consumed by each individual drone of a group of 500 drones/stations based on (a) preassigned, (b) greedy, and (c) Kuhn–Munkres drone–nest matching (the drones have a different level of energy).
Figure 10.
Total energy consumed by each individual drone of a group of 500 drones/stations based on (a) preassigned, (b) greedy, and (c) Kuhn–Munkres drone–nest matching (the drones have a different level of energy).


Figure 11.
Views of sorted total consumed energy of each individual drone for (a) preassigned matching, (b) greedy algorithm, (c) Kuhn–Munkres matching, and (d) comparison of preassigned, greedy, and Kuhn–Munkres methods.
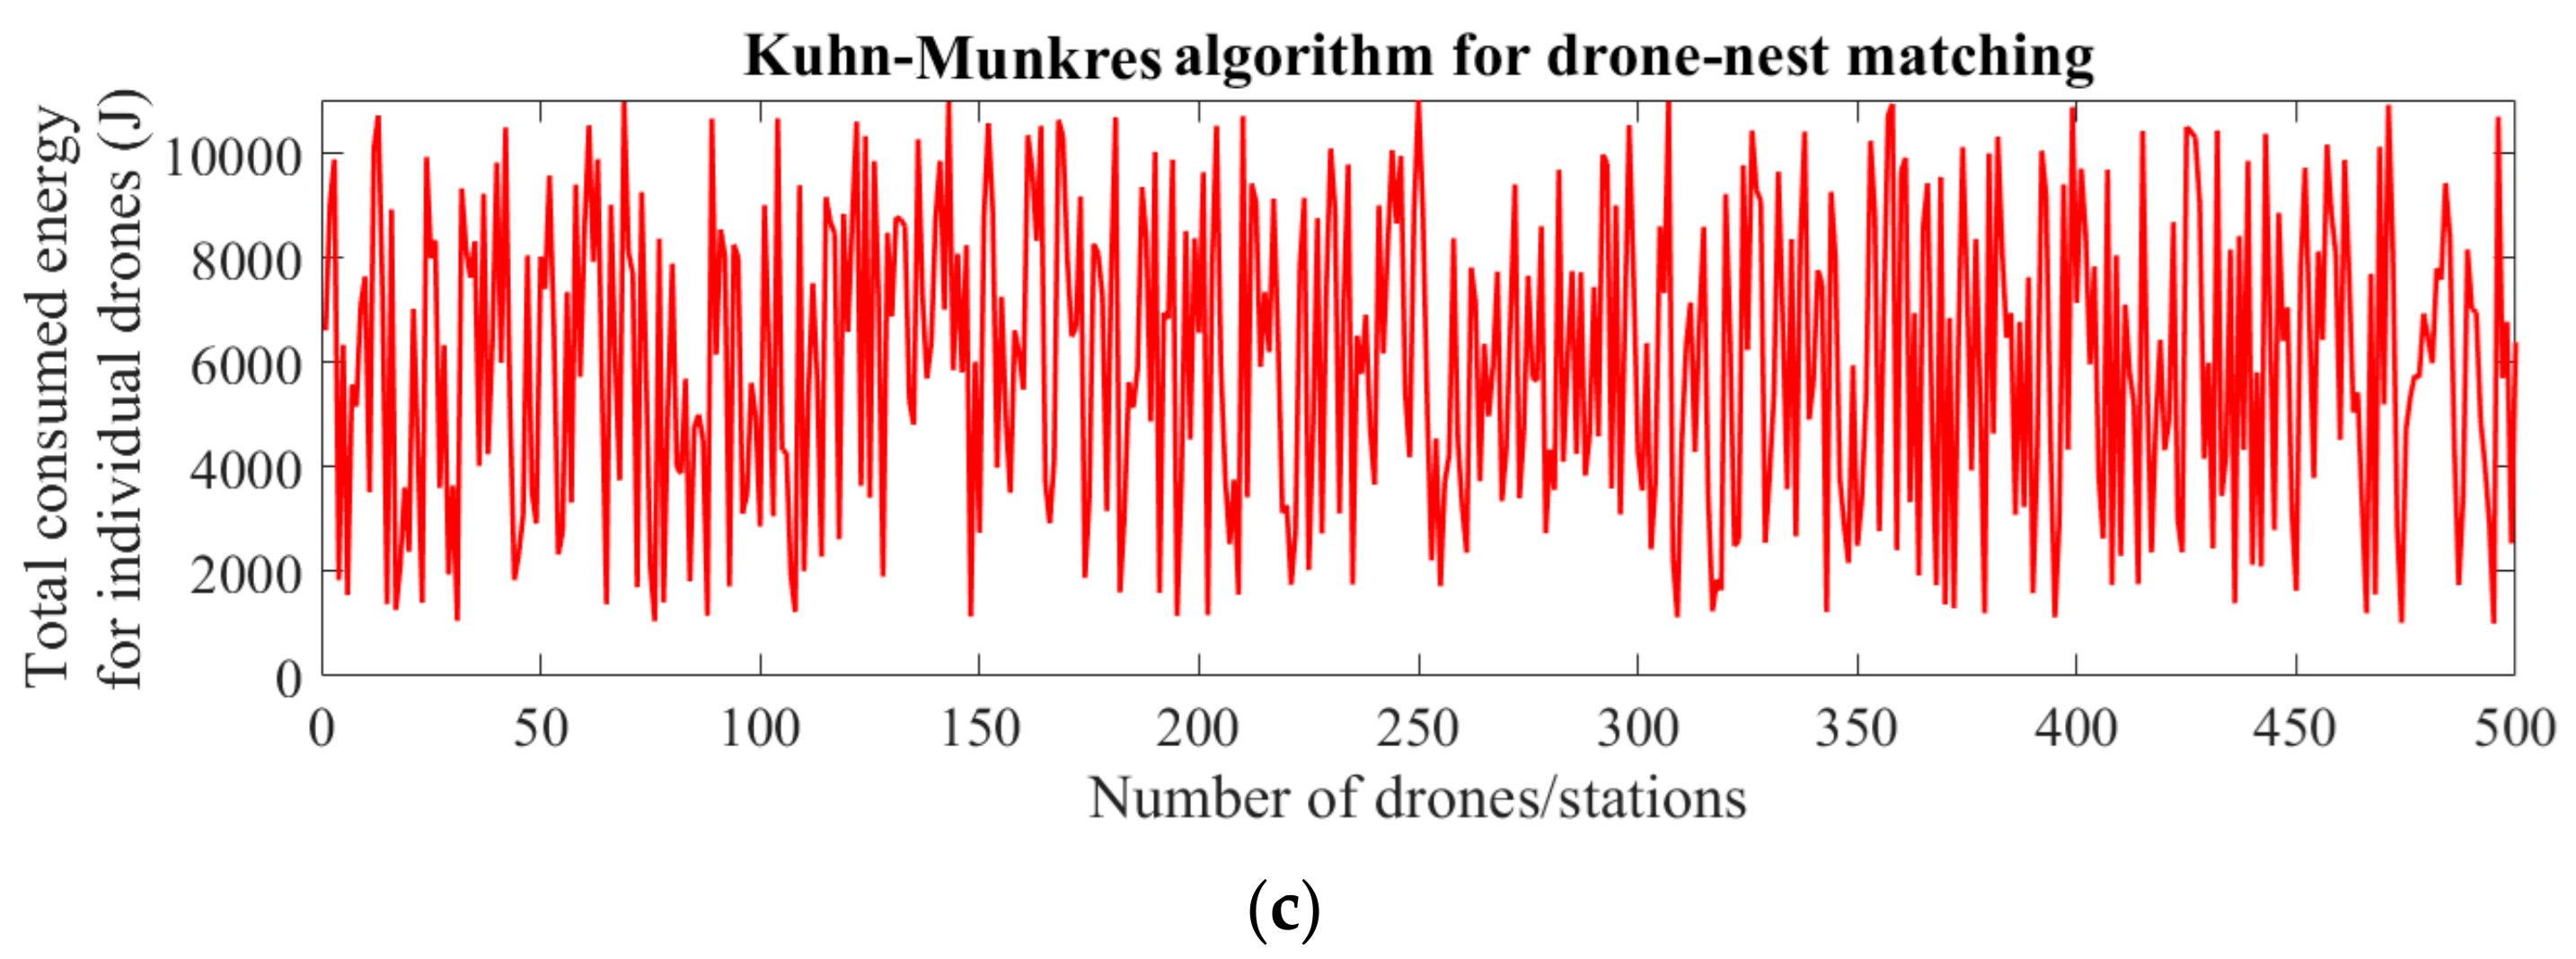
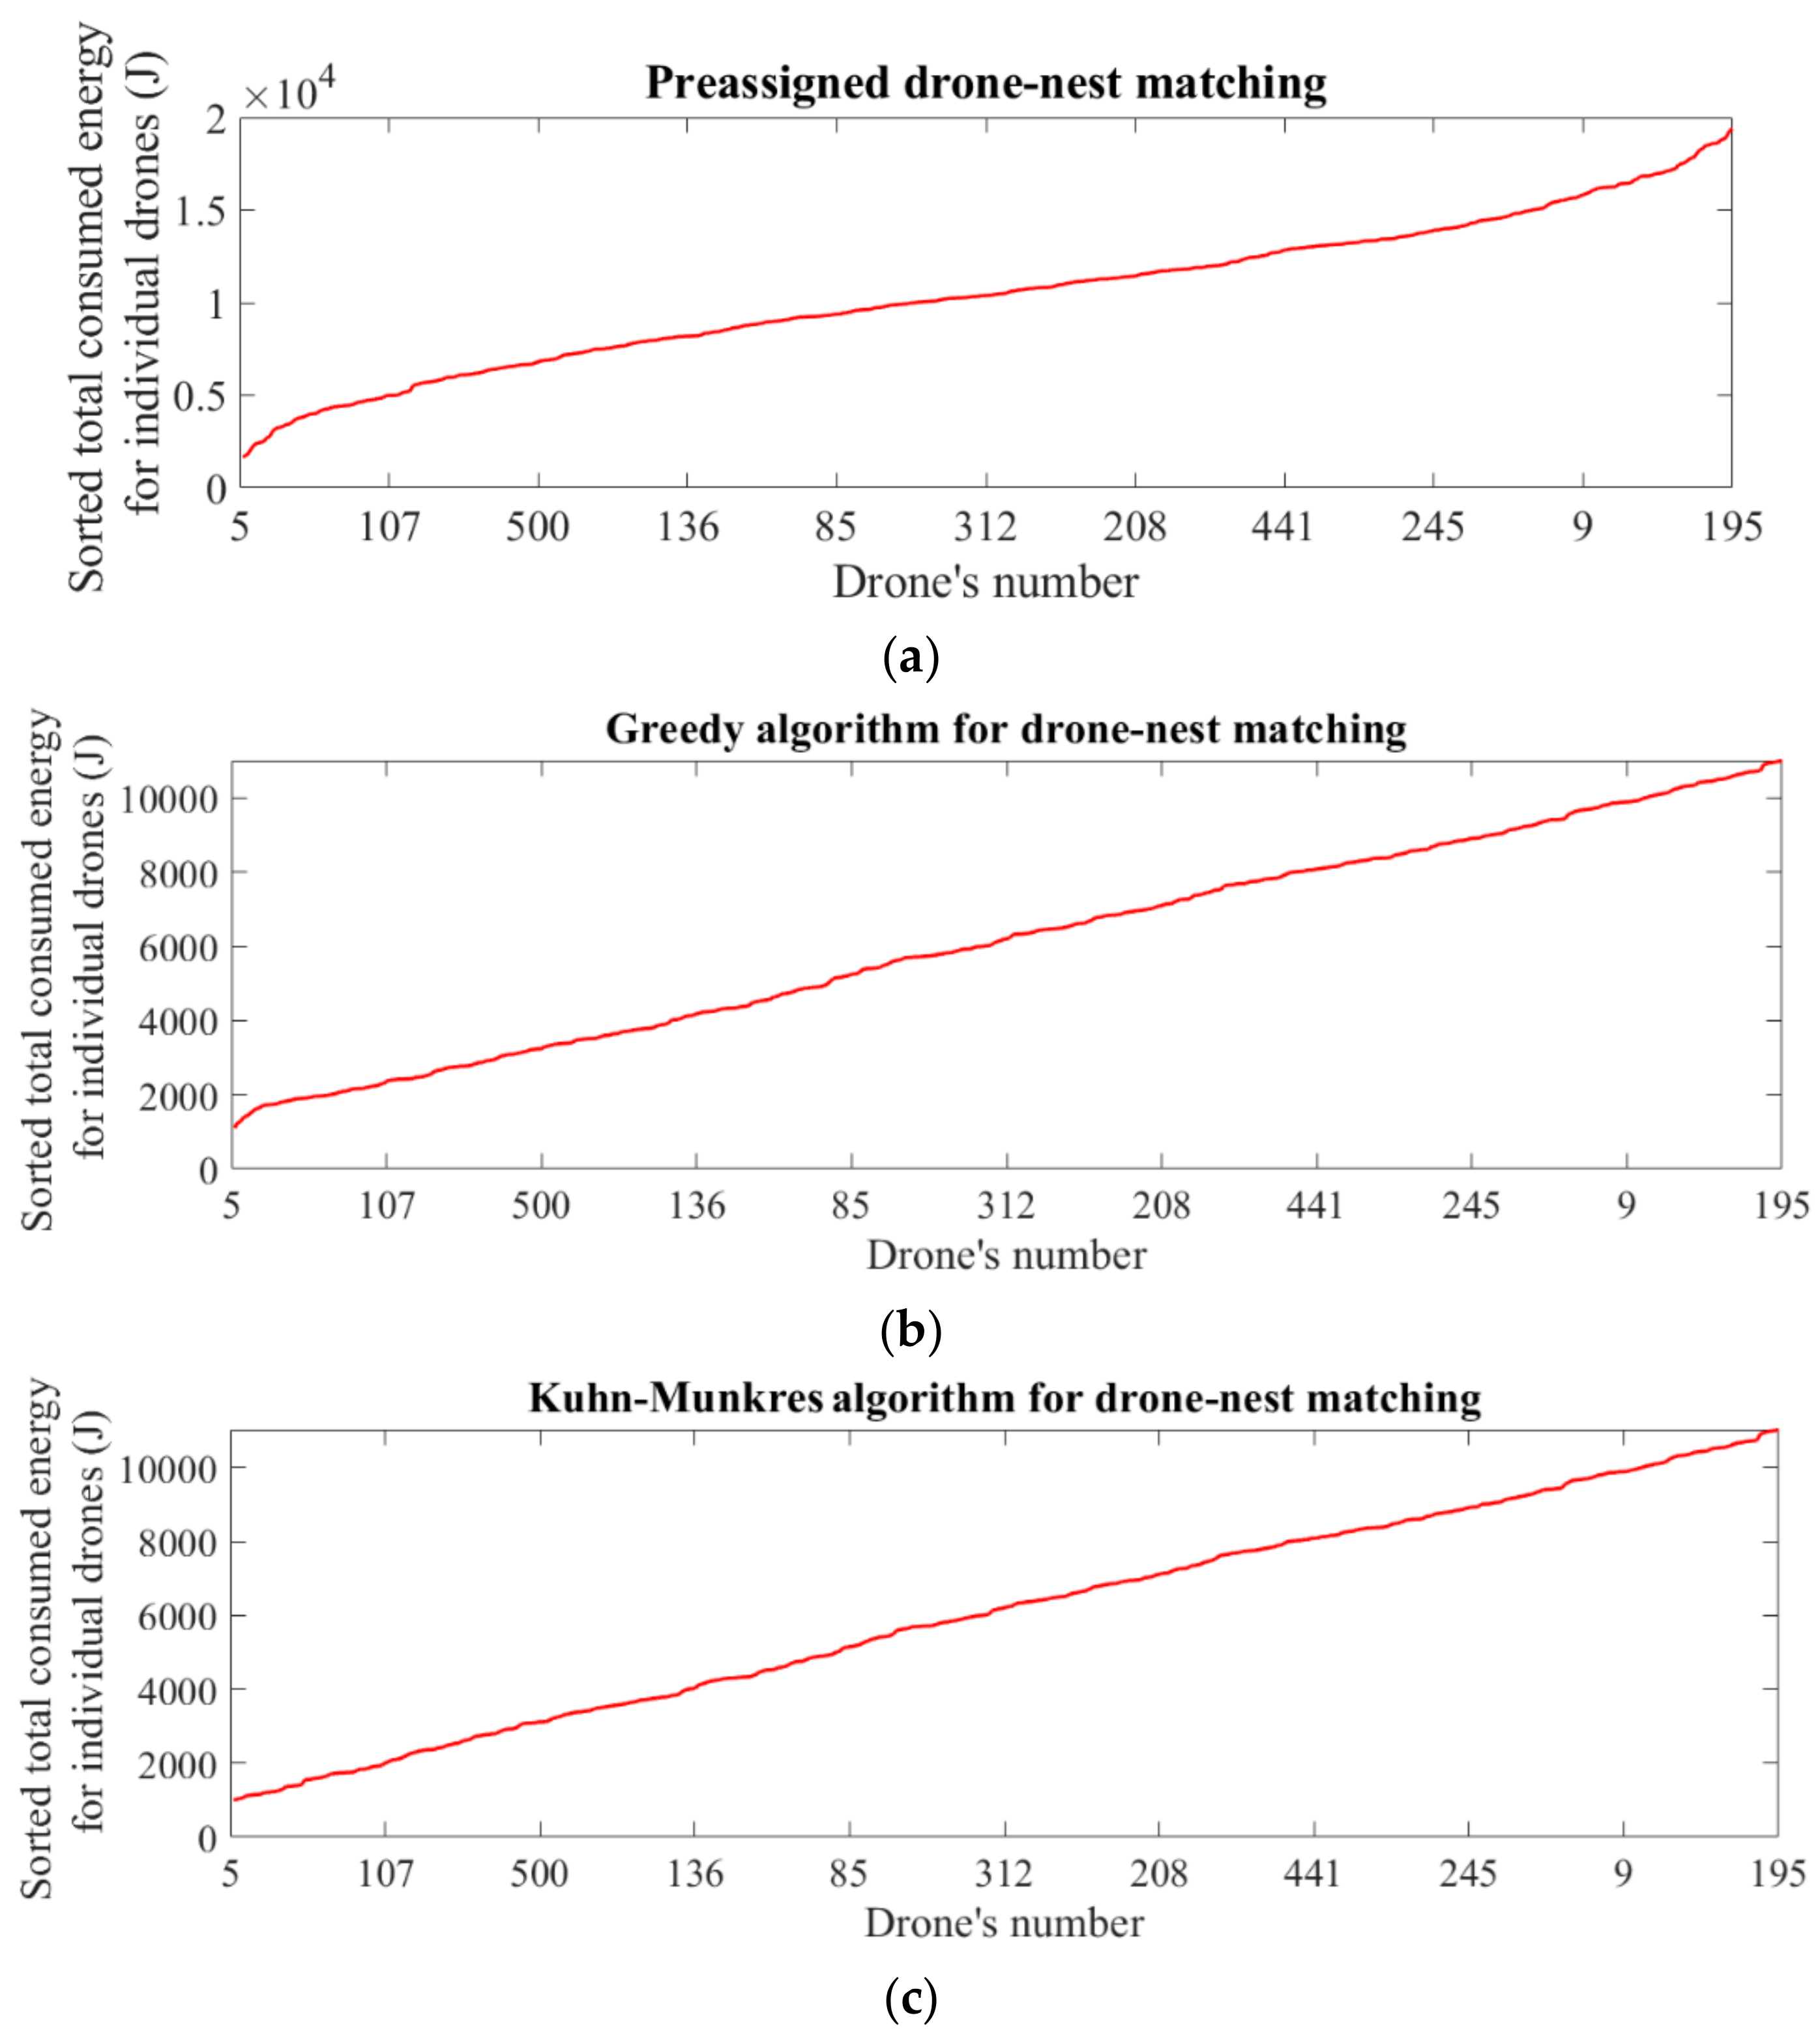
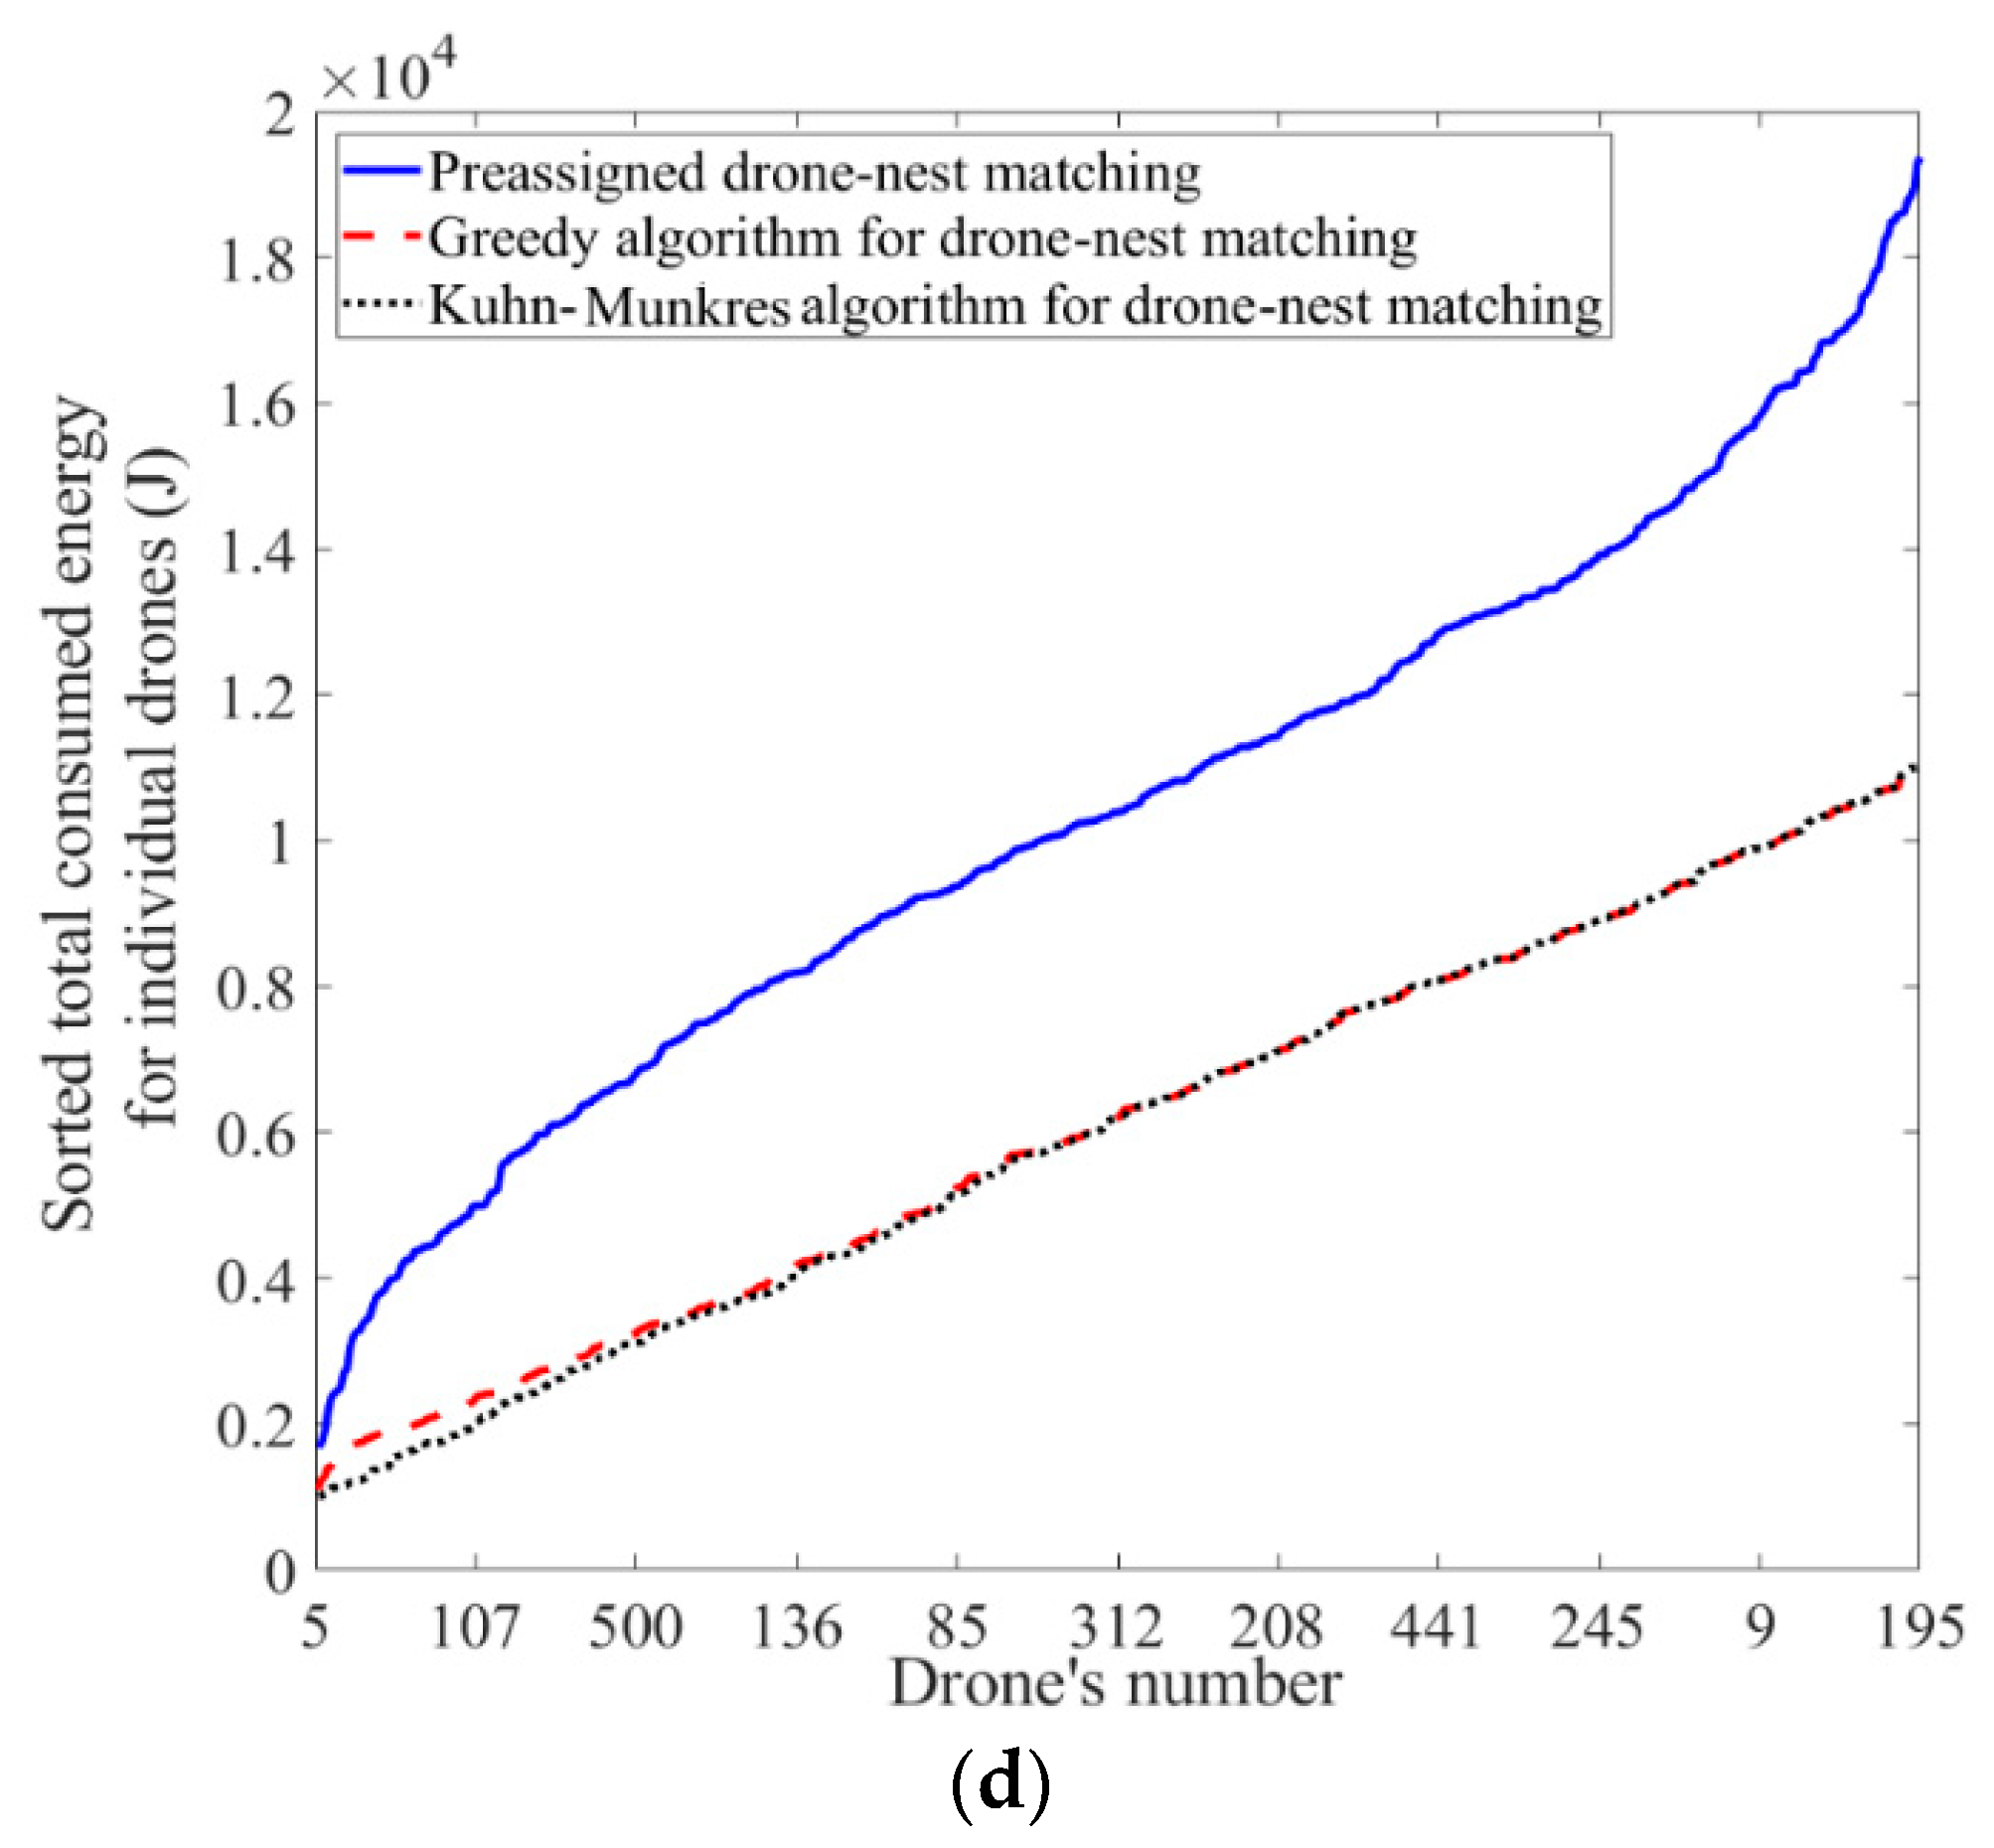
Figure 11.
Views of sorted total consumed energy of each individual drone for (a) preassigned matching, (b) greedy algorithm, (c) Kuhn–Munkres matching, and (d) comparison of preassigned, greedy, and Kuhn–Munkres methods.


Figure 12.
Energy-saving percentage of matching through the greedy algorithm compared to preassigned (top), Kuhn–Munkres algorithm compared to preassigned (middle), and Kuhn–Munkres compared to the greedy algorithm (bottom) for each individual drone.
Figure 12.
Energy-saving percentage of matching through the greedy algorithm compared to preassigned (top), Kuhn–Munkres algorithm compared to preassigned (middle), and Kuhn–Munkres compared to the greedy algorithm (bottom) for each individual drone.

Figure 13.
(a) Comparison of total consumed energy and (b) energy-saving percentage versus the number of drones/stations for Kuhn–Munkres algorithm, greedy algorithm, and preassigned matching for drones and stations with different levels of energy.
Figure 13.
(a) Comparison of total consumed energy and (b) energy-saving percentage versus the number of drones/stations for Kuhn–Munkres algorithm, greedy algorithm, and preassigned matching for drones and stations with different levels of energy.

Figure 14.
Views of total consumed energy for each individual drone of a group of 500 drones/stations based on (a) preassigned, (b) greedy, and (c) Kuhn–Munkres drone–nest matching (the drones and stations have different levels of energy).
Figure 14.
Views of total consumed energy for each individual drone of a group of 500 drones/stations based on (a) preassigned, (b) greedy, and (c) Kuhn–Munkres drone–nest matching (the drones and stations have different levels of energy).

Figure 15.
Views of sorted total consumed energy of each individual drone and corresponding station for (a) preassigned matching, (b) greedy algorithm, (c) Kuhn–Munkres matching, and (d) comparison of preassigned, greedy, and Kuhn–Munkres methods.
Figure 15.
Views of sorted total consumed energy of each individual drone and corresponding station for (a) preassigned matching, (b) greedy algorithm, (c) Kuhn–Munkres matching, and (d) comparison of preassigned, greedy, and Kuhn–Munkres methods.

Figure 16.
Energy-saving percentage of matching through the greedy algorithm compared to a preassigned (top), Kuhn–Munkres algorithm compared to preassigned (middle), and Kuhn–Munkres compared to the greedy algorithm (bottom) for each individual drone and corresponding station.
Figure 16.
Energy-saving percentage of matching through the greedy algorithm compared to a preassigned (top), Kuhn–Munkres algorithm compared to preassigned (middle), and Kuhn–Munkres compared to the greedy algorithm (bottom) for each individual drone and corresponding station.

Figure 17.
Examples of bipartite graphs for drones and their stations based on preassigned and Kuhn–Munkres matchings for drones with the same level of energy.
Figure 17.
Examples of bipartite graphs for drones and their stations based on preassigned and Kuhn–Munkres matchings for drones with the same level of energy.

Figure 18.
Examples of bipartite graphs for drones and their stations based on preassigned, greedy, and Kuhn–Munkres matchings for drones with different levels of energy.
Figure 18.
Examples of bipartite graphs for drones and their stations based on preassigned, greedy, and Kuhn–Munkres matchings for drones with different levels of energy.

Figure 19.
Examples of bipartite graphs for drones and their stations based on preassigned, greedy, and Kuhn–Munkres matchings for the drones and stations with different levels of energy.
Figure 19.
Examples of bipartite graphs for drones and their stations based on preassigned, greedy, and Kuhn–Munkres matchings for the drones and stations with different levels of energy.


Table 1.
Applications of the drones and their location.
| Civil Applications | Location |
| Solar panel cleaner | In cities that receive more solar radiation and have more dust |
| Roof cleaner | Entire city |
| Skyscraper window cleaner | Usually concentrated in downtown regions |
| Cargo delivery | Entire city (depending on the post offices) |
| Food delivery | Entire city (depending on the types of restaurants) |
| Wireless coverage | Areas without wireless coverage (highways, cities, desert, forests) |
| Emergency Applications | Location |
| Search and rescue | Entire city, highways, forests, beaches and seas, avalanche, deserts |
| Ambulance drones | Entire city, downtowns, highways, forests, and deserts |
| Firefighter drones | Entire city, downtowns, Skyscrapers, forests |
| Medicine delivery | Entire city, downtowns, highways |
| Governmental Applications | Location |
| Infrastructure inspection | Bridges, rails, airports, highways, pipelines |
| Police drones | Entire city, downtown, highways |
| Traffic monitoring drones | Downtown, highways |
| Pollution control drone | Entire city, downtown, factories |
| Environmental monitoring drones | National and states parks, wildlife, forests, deserts, seas, mountains |
| Agriculture drones | Farms, parks, greenhouses |
Table 2.
Matric interpretation of the Kuhn–Munkres algorithm.
| Stations |  |  |  |  |
|---|---|---|---|---|
| Drones | ||||
 | D1S1 | D1S2 | D1S3 | D1S4 |
| Distance: (d11) | Distance: (d12) | Distance: (d13) | Distance: (d14) | |
| Energy: (RED1 = ED1 − d11 × F1) | Energy: (RED1 = ED1 − d12 × F1) | Energy: (RED1 = ED1 − d13 × F1) | Energy: (RED1 = ED1 − d14 × F1) | |
 | D2S1 | D2S2 | D2S3 | D2S4 |
| Distance: (d21) | Distance: (d22) | Distance: (d23) | Distance: (d24) | |
| Energy: (RED2 = ED2 − d21 × F2) | Energy: (RED2 = ED2 − d22 × F2) | Energy: (RED2 = ED2 − d23 × F2) | Energy: (RED2 = ED2 − d24 × F2) | |
 | D3S1 | D3S2 | D3S3 | D3S4 |
| Distance: (d31) | Distance: (d32) | Distance: (d33) | Distance: (d34) | |
| Energy: (RED3 = ED3 − d31 × F3) | Energy: (RED3 = ED3 − d32 × F3) | Energy: (RED3 = ED3 − d33 × F3) | Energy: (RED3 = ED3 − d34 × F3) | |
 | D4S1 | D4S2 | D4S3 | D4S4 |
| Distance: (d41) | Distance: (d42) | Distance: (d43) | Distance: (d44) | |
| Energy: (RED4 = ED4 − d41 × F4) | Energy: (RED4 = ED4 − d42 × F4) | Energy: (RED4 = ED4 − d43 × F4) | Energy: (RED4 = ED4 − d44 × F4) |
© 2019 by the authors. Licensee MDPI, Basel, Switzerland. This article is an open access article distributed under the terms and conditions of the Creative Commons Attribution (CC BY) license (http://creativecommons.org/licenses/by/4.0/).
Share and Cite
MDPI and ACS Style
Mirzaeinia, A.; Hassanalian, M. Minimum-Cost Drone–Nest Matching through the Kuhn–Munkres Algorithm in Smart Cities: Energy Management and Efficiency Enhancement. Aerospace 2019, 6, 125. https://doi.org/10.3390/aerospace6110125
AMA Style
Mirzaeinia A, Hassanalian M. Minimum-Cost Drone–Nest Matching through the Kuhn–Munkres Algorithm in Smart Cities: Energy Management and Efficiency Enhancement. Aerospace. 2019; 6(11):125. https://doi.org/10.3390/aerospace6110125
Chicago/Turabian StyleMirzaeinia, Amir, and Mostafa Hassanalian. 2019. "Minimum-Cost Drone–Nest Matching through the Kuhn–Munkres Algorithm in Smart Cities: Energy Management and Efficiency Enhancement" Aerospace 6, no. 11: 125. https://doi.org/10.3390/aerospace6110125
Note that from the first issue of 2016, this journal uses article numbers instead of page numbers. See further details here.