
Untangling Complexity in ASEAN Air Traffic Management through Time-Varying Queuing Models


1
Research Center for Advanced Science and Technology, The University of Tokyo, 4-6-1 Komaba, Meguro-ku, Tokyo 153-8904, Japan
2
Air Traffic Management Research Institute, Nanyang Technological University, Singapore 639798, Singapore
3
Institute of Flight Systems, University of the Bundeswehr Munich, 85577 Neubiberg, Germany
*
Author to whom correspondence should be addressed.
†
These authors contributed equally to this work.
Aerospace 2024, 11(1), 11; https://doi.org/10.3390/aerospace11010011
Submission received: 20 November 2023
/
Revised: 10 December 2023
/
Accepted: 15 December 2023
/
Published: 22 December 2023
(This article belongs to the Collection Air Transportation—Operations and Management)
Abstract
:Free route airspace allows airspace users to freely plan a route in en-route airspaces within certain restrictions. It is anticipated to offer the benefit of fuel saving and operational flexibility. Regarding its efficient implementation into the ASEAN airspace, the key challenge would be reducing hotspots with clusters of potential conflicts. This paper designed a time-varying queuing network model, which contributed to untangle trajectory complexity in the most congested hotspot area. A series of fast-time simulation experiments were conducted to identify hotspots in en-route airspace in Singapore FIR. The application of departure time control using time-varying queuing networks successfully reduced up to 45% of potential conflicts. This was achieved within an average delay of 30 min by controlling time of less than 60% of candidate flights. The original contribution of this paper is to develop a novel modeling and simulation framework for composing ideal air traffic patterns. Lastly, we discussed the extension of this study toward a generalized application of the proposed approach in future air traffic management.
1. Introduction
Free route airspace (FRA) [1,2] allows airspace users to freely plan a route in en-route airspaces within certain restrictions. It is expected that FRA will offer the benefit of fuel saving and operational flexibility. Regarding its deployment in Europe, the air traffic controller (ATCo) workload has not been increased as a result of the introduction of FRA, and safety has not been compromised. Whereas FRA implementation is mandated by the European Commission, there is no FRA application outside of Europe to date. Against this background, our study aims to clarify the benefits and operational feasibility of the FRA concept within the ASEAN region, where a significant increase in air traffic is expected in the future.
Alongside FRA, other air traffic management (ATM) concepts aim to decouple operations from administrative and geographical boundaries. In particular, these efforts are aimed at achieving the flexible provision of air traffic services. The sector-less approach [3] is limited to a maximum number of six flights that an ATCo can monitor (cf. [4]). The validation scenarios show only slight improvements over the current procedures [5]. Especially for more complex traffic scenarios, a higher workload is to be expected despite support functions provided by the advanced design of the controller working position [6]. Approaches for dynamic airspace configuration [7] and sectorization [8] show an appropriate solution to handle a different amount of traffic over the day of operations. However, they still consider the concept of sectors.
As FRA provides airspace users with a new degree of freedom to choose their preferred routes, it may result in a more heterogeneous traffic pattern or greater traffic complexity. This could, in turn, increase ATCo workload using new ATM concepts. Air traffic complexity considers, for example, individual flight characteristics (e.g., changes in altitude, heading, and speed) or interactions between two or more flights [9]. The latter is addressed by determining potential conflicts, which may result from the difference of pre-deployment traffic flows crossing trajectories. The heterogeneity of the post FRA-deployment traffic patterns is driven by, for example, the variability of heading and speed [10]. Optimized, flow-based, aligned structures may reduce the complexity of traffic situations, decrease workload, and increase airspace capacity [11]. In the future, an ATM concept of operations might benefit from the hypothetical ability to bundle user-preferred trajectories and offer dynamic control structures for efficient and safe flights.
In line with this, past works evaluated the operational feasibility of a dynamic, flow-centric concept of operation through human-in-the-loop simulation experiments. These experiments simulated radar control at en-route facilities in the future ASEAN region [12]. The results suggest that ATCo’s ability to deliver safe control might be limited by the number of interactions with surrounding air traffic rather than the number of aircraft flying in their controlling airspace. They also indicated that the total number of ATCos could be minimized by grouping the flights based on their planned trajectories. For example, it was acceptable to control a cluster of a train of flights cruising in the same direction with already safe separation. However, if even one aircraft crossed the cluster, it would significantly increase ATCos’ workload. A series of macroscopic fast-time simulation (FTS) was also run to provide an operational feasibility assessment of the FRA concept applied to ASEAN en-route airspaces [13]. This study evaluated the efficacy of FRA under hypothetical double demand, projected for the late 2030s in the Asia Pacific (APAC) regions, through the simulation. The results identified possible “hotspot areas”, where aircraft trajectories interfere and the air traffic could be congested. When zoomed into a specific FIR, there would be a shift in the location and nature of the conflicts. Regarding the implementation of FRA operation in the region, we are convinced that the key challenge is composing “ideal traffic patterns”, which would reduce these potential hotspots and relieve the air traffic complexity.
Expanding on these findings from previous research, this paper aims to realize ideal traffic patterns. This would be achieved by controlling the time-varying air traffic inflow and outflow of the FRA traffic to avoid conflicts at potential hotspots. In past studies, the time-varying queuing model was developed to estimate and reduce the arrival and departure queues at a single runway [14,15]. As an advanced version of the model, time-varying queuing network models were developed to control the propagation of the air traffic congestion in the arrival air traffic and at an airport [16,17]. These works discussed the proposed model-based framework that was applicable to general air traffic flows, not only for airport operation, but also for air traffic flow control in an airspace. In this paper, under the hypothesis that the application of a time-varying fluid queuing model reduces the potential conflicts, we structured the approaches as follows. (1) We applied the proposed framework to compose better separated and synchronised air traffic patterns/flows, and (2) the reduced number of resulting conflicts untangled air traffic complexity in the potential hotspot area. Firstly, we analyzed the features of the traffic patterns at the potential hotspots in an ASEAN flight information region (FIR) assuming the FRA implementation under current air traffic volume. Secondly, we proposed a systematic approach to update the time-schedules of air traffic, which grouped oncoming flights while avoiding traffic interference in the most congested hotspot area in FIR. Applying time-varying queuing theory enabled us to understand the features of air traffic patterns and to control time-varying air traffic inflow and outflow in the hotspot area.
This paper is organized as follows. Section 2 analyzes air traffic complexity in an FIR in the ASEAN region assuming FRA implementation. A series of the FTS experiments was conducted, and potential hotspots were clarified using the simulation results. Section 3 focuses on the most congested cluster of the potential hotspots and develops air traffic models applying the time-varying fluid queue. Section 4 controls air traffic flow at the hotspot area by applying the time-varying queuing model. Operational benefits and traffic complexity are evaluated by segregating air traffic, which potentially interferes with the surrounding traffic. Section 5 discusses future challenges to implementing the FRA concept into the ASEAN airspace. We also discuss further applications of the proposed model-based approaches in future mobility systems based on the findings in this paper. Lastly, we conclude the paper. The original contribution of this paper is to develop a novel modeling and simulation framework for composing ideal air traffic patterns of time-varying air traffic.
2. En-Route Trajectory Complexity in the FIR
This chapter applies time-varying queuing models to the most complex hotspot serviced by Singapore Area Control Centre (ACC). Here, we define a hotspot as a bounded area or volume of airspace in which a relatively high amount of potential conflicts occur.
2.1. Simulating Air Traffic in FRA
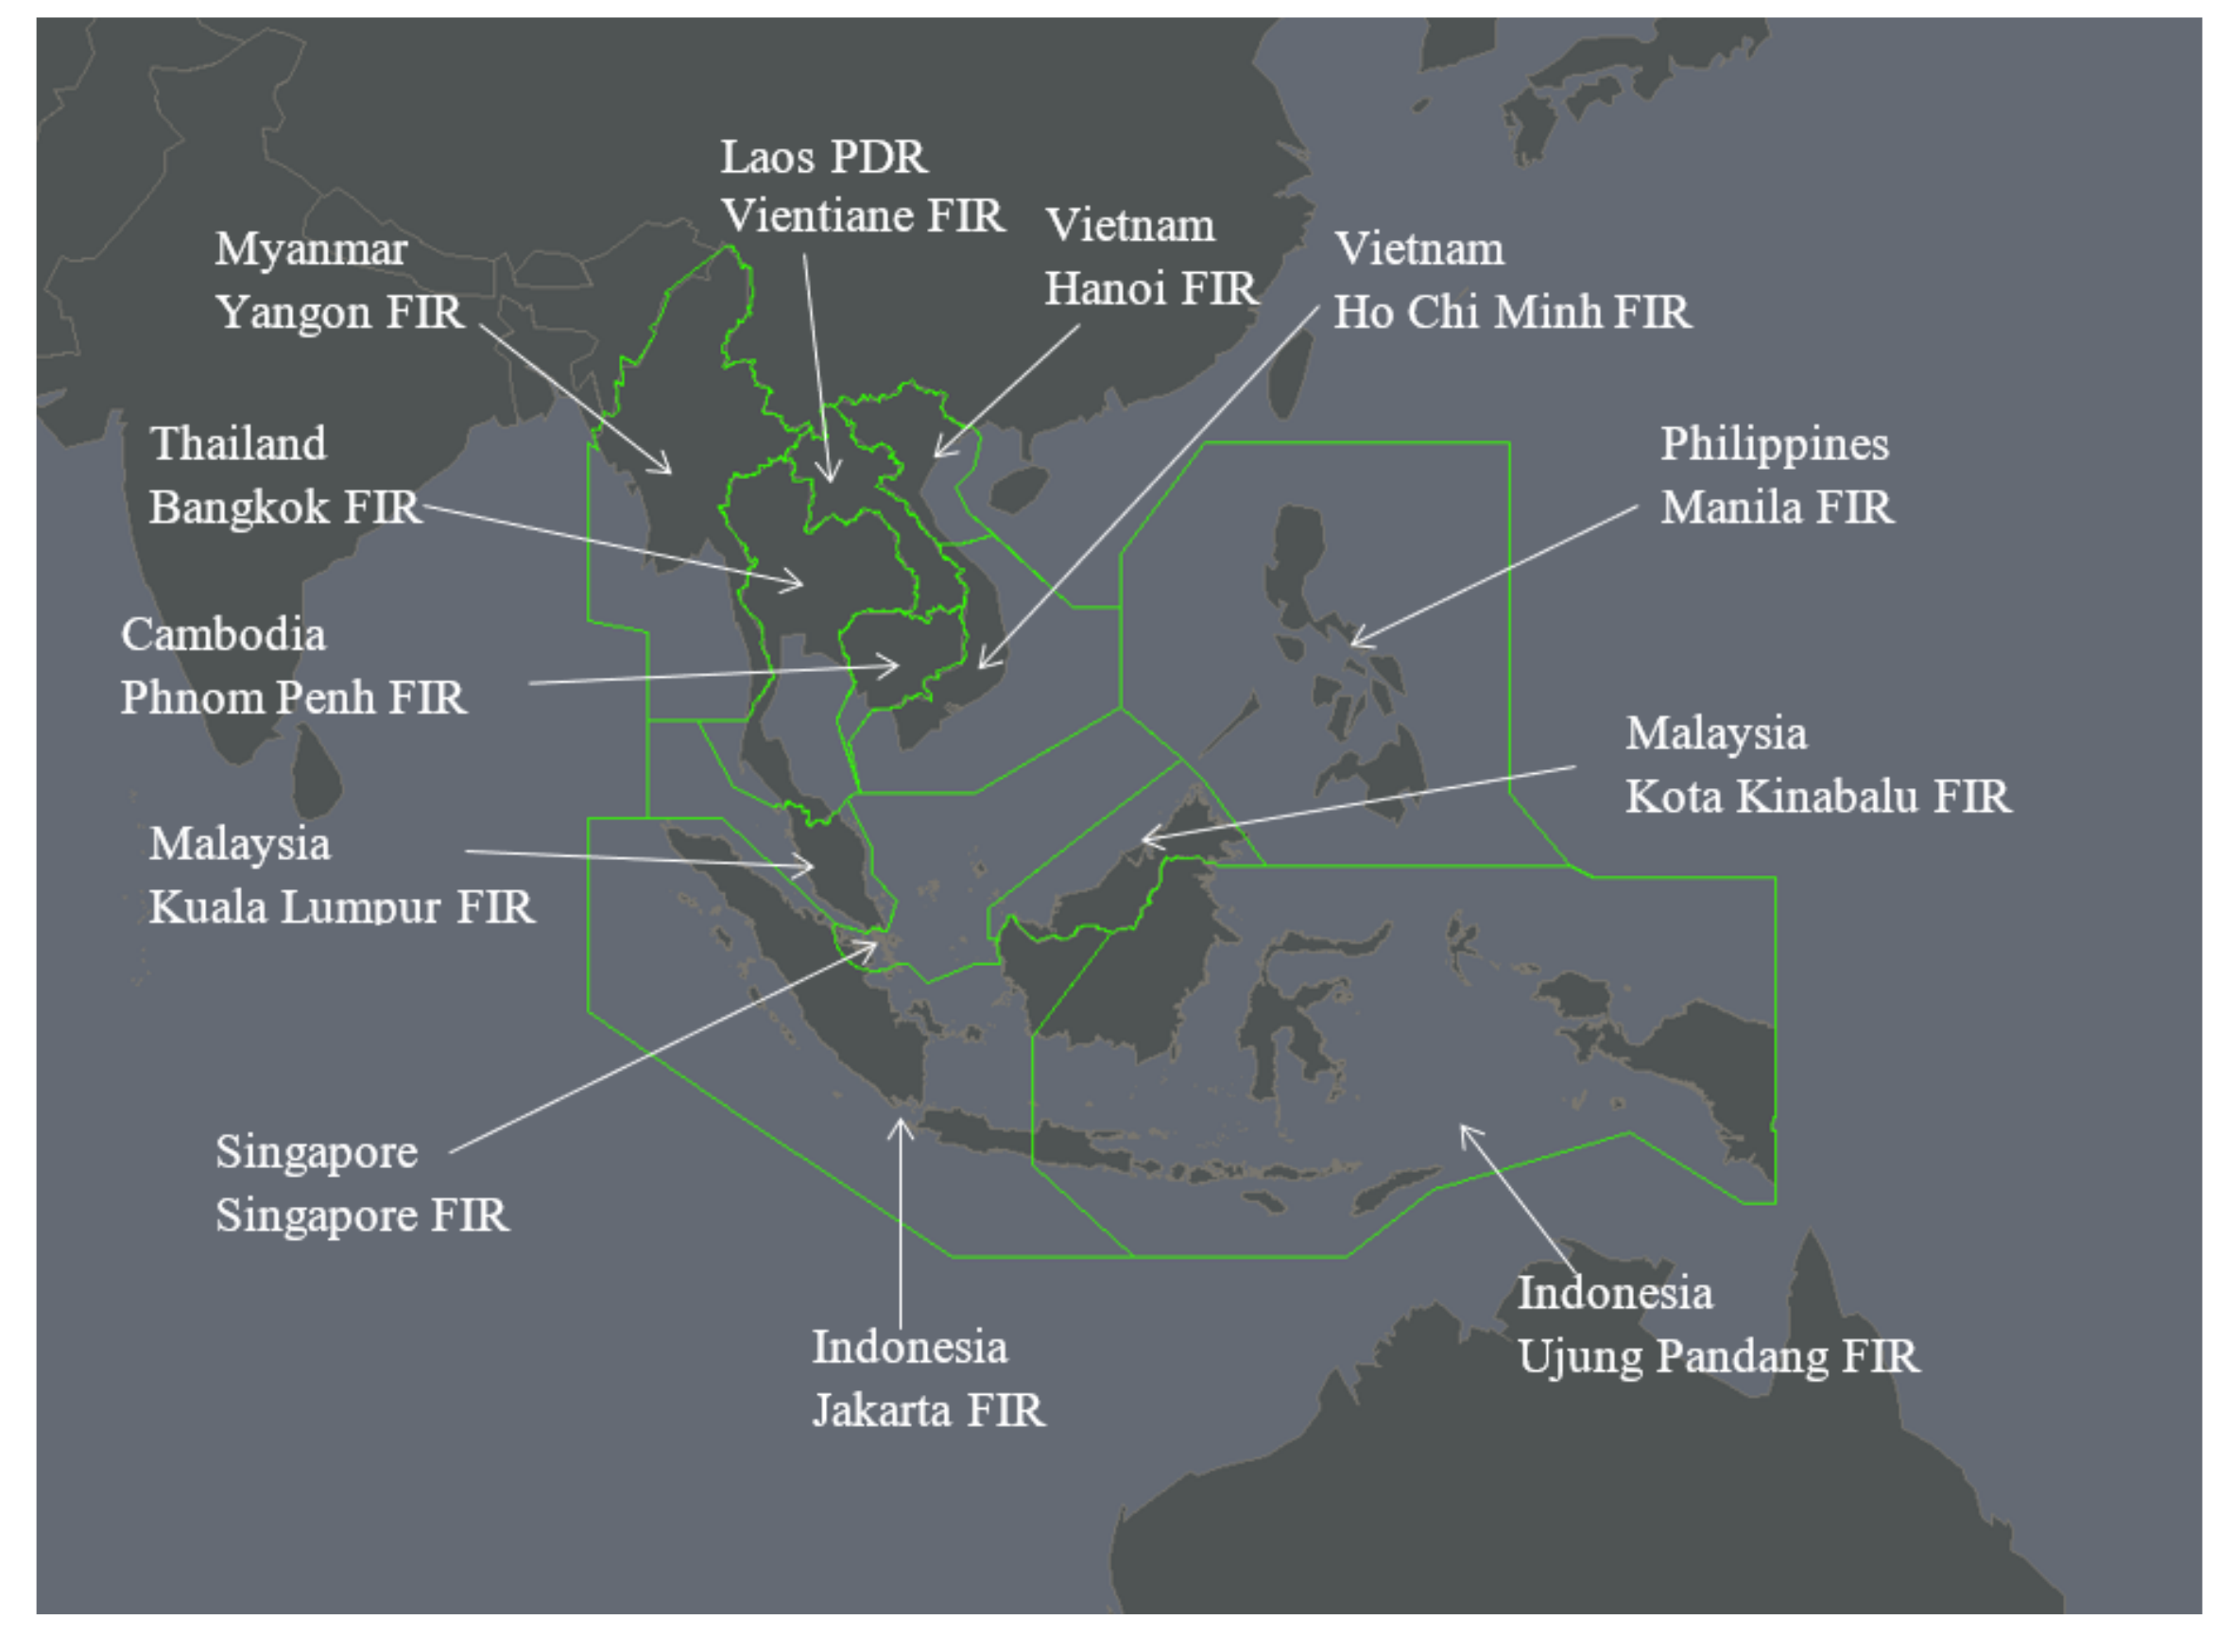
First, we constructed a flow pattern in a simulation environment using commercially available flight schedule data from the Official Airline Guide (OAG) in the ASEAN region. An outline drawing map of the ASEAN airspace is shown in Figure 1. The simulated traffic was largely derived from a regional FRA feasibility assessment study [13], which was modified to account for the anticipated future changes. In the present study, the traffic demand corresponded to a 24-h period that represents 14 December 2019 (UTC 00:00 a.m. to 23:59 p.m.) traffic demand. The lateral routing was assumed to be a free route, in which flights were routed by a system of DCT (direct-to) segments from the entry to the exit using the Dijkstra’s algorithm [18], except for the arrival and departure routes. Although the FRA concept allows the airspace user to freely propose a routing in the en-route phase of the flight, the variation was simplified to DCT routings in this study. This assumption maintained consistency among the airspace users’ strategy for the model traffic case. The level assignment rules were based on today’s reduced vertical separation minimum (RVSM) rules. They include the South China Sea Flight Level Allocation Scheme levels and the easterly–westerly single-alternating Flight Level Orientation Scheme (where even levels, e.g., FL340, FL360, FL380, …, are assigned for westbound traffic). We made amendments by timeshifting the departures from Singapore Changi (WSSS) and Kuala Lumpur International (WMKK). This was because the assumptions in the reference traffic made for region-wide assessment [13] with a focus on identifying complexity in potential conflicts [19] did not adequately reflect the flow patterns at the local granularity. Specifically, additional time spacing was inserted where necessary so that time spacing between consecutive flights at the end of the SID was at least 90 s. This additional condition removed the unrealistic potential conflicts observed in the reference simulation. For example, a pair of consecutive flights within a short interval departing from WSSS may be in conflict when a faster follower catches up to a slower leader in the cruise phase. In real operations, overtaking conflicts such as these are avoided by departure managers or by tactical planners, whether they manifest inside or outside a conflict hotspot. In a simulation study such as the present study, this type of unrealistic potential conflicts would be noise to the essential research question and it would be better to rectify it before using it as a simulation case.
2.2. Hotspot Identification
Second, we identified the most complex hotspot as follows. We defined the geometric boundary of the potential hotspots, based on clustering of the flow intersection points. We then identified the busiest hotspots based on throughput or the number of flights transiting through the identified areas. Operational complexity in the identified hotspot areas was confirmed by ATCos according to their perceived workload, corresponding to the traffic features.
Flow intersections could be searched for in several systematic ways, e.g., based on hierarchical clustering of the trajectory flown [21]. In our case, we referred to the flight plan trajectory simulated without active air traffic control (ATC), and as such, we opted for a simple identification of the geometric intersections of all flows. These were then grouped together into clusters using the k-means method based on Euclidean (only geometric) distance in a 2D plane. As for the number of clusters needed to group the flow intersections, we grouped them into 100 clusters, instead of 10, 20, 50, or 150 clusters, which we attempted separately. This was because the 100 clusters best matched the operational knowledge for the area control tasks and the physical size of the hotspots. In other words, fewer larger clusters encompassed an entire Signapore ACC sector, which was too large for a typical tactical deconflicting traffic scope. On the other hand, too small a cluster may not fully represent all the relevant flows for the chain of potential conflicts.
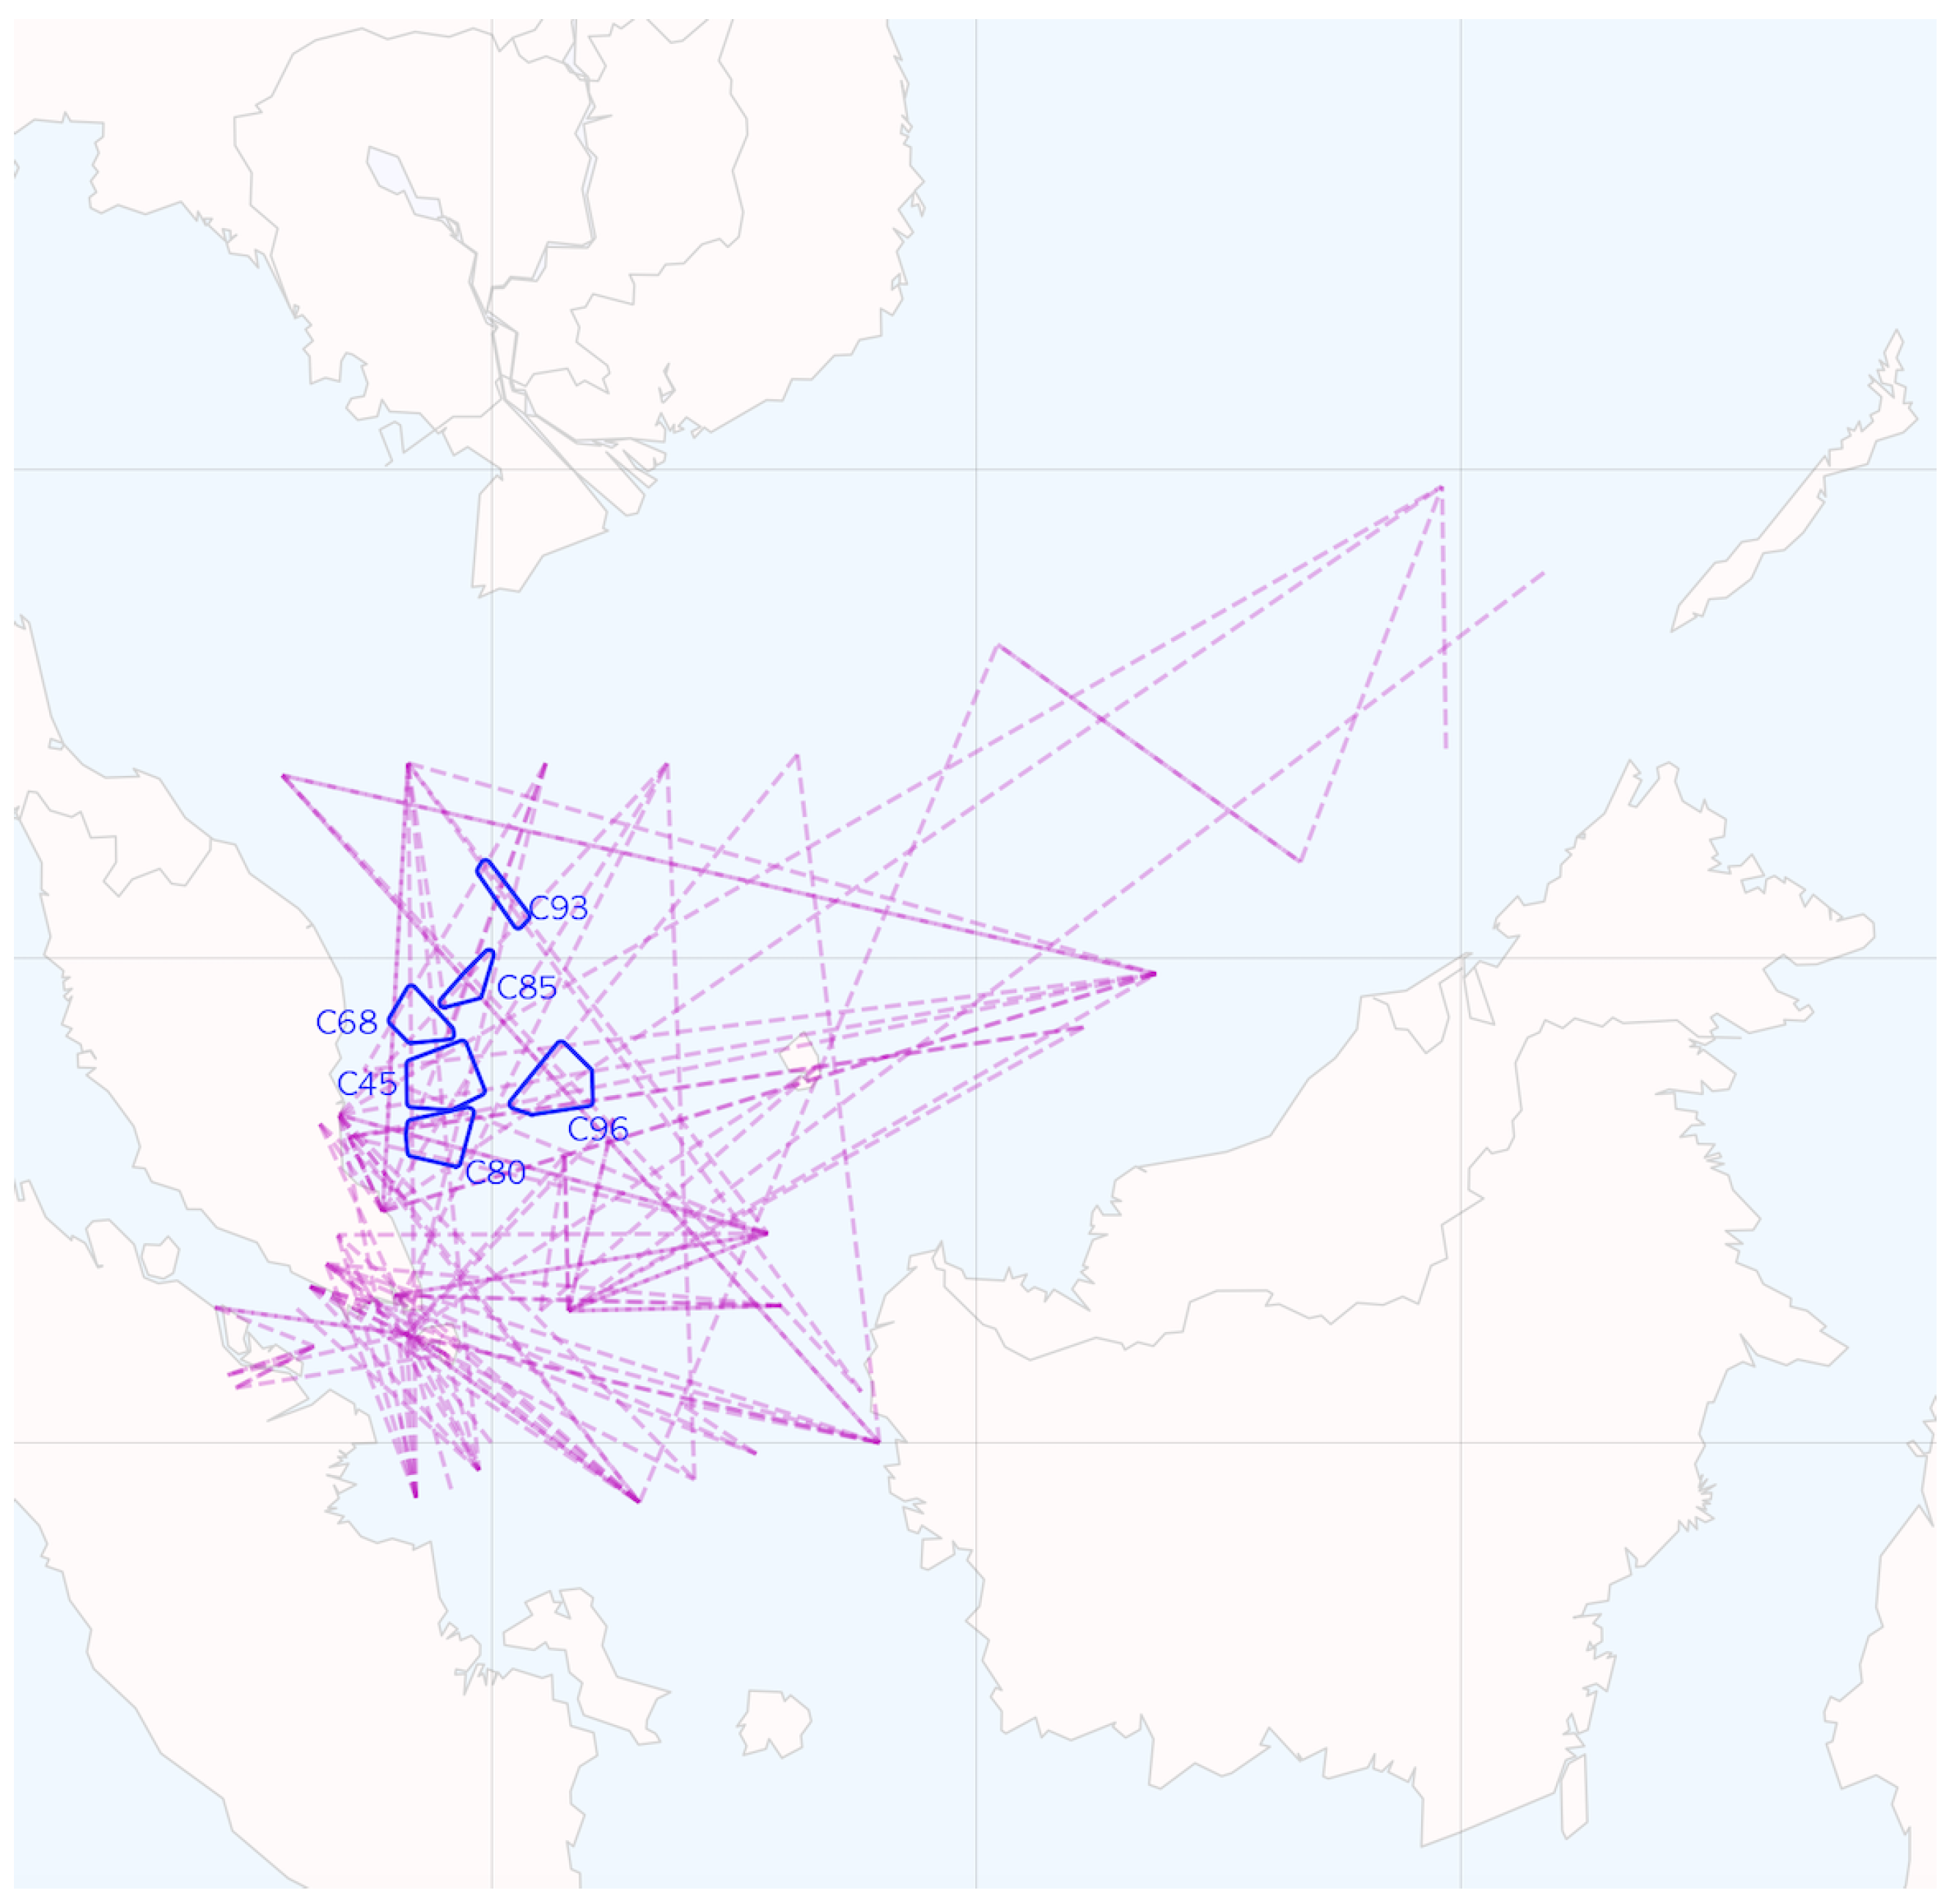
Although this was not the main thesis of this paper, it is nonetheless noteworthy that different combinations of flow groups (WMKK arrivals, WMKK departures, WSSS arrivals, WSSS departures, and others) visited the top six clusters (Figure 2) in terms of total transit flights (Table 1). From this, we concluded that these top six clusters should have had their own unique dynamics with respect to the queuing problem. In this work, we started from the cluster with the highest throughput (C80), which was frequented by all five of the flows grouped above.
As for validation against perceived operational workload in the subject C80 cluster area, it reflected the following typical perceived operational challenges: (1) it experienced a high traffic volume; (2) it experienced four major flows, which were all vertical movements and needed manual maneuvering for safe separation (WKKK departures, WKKK arrivals, WSSS departures, and WSSS arrivals), and (3) it presented similar operational ATC tasks, irrespective of lateral routing rules (conventional routing or free route routing).
3. Interpretation of the Complexity
According to the analytical results of the air traffic features in the previous chapter, this chapter develops a queuing network model. A queuing network model consists of multiple time-varying fluid queues. The fluid queue model represents the time-varying air traffic volume in an assigned area. Using a network structure, the queuing network model represents the air traffic complexity in the area. Therefore, this chapter first explains time-varying fluid queue model. Secondly, we describe queuing network model, which represents air traffic complexity in the C80 (the most critical hotspot area).
3.1. Time-Varying Fluid Queue
In the C80 area, we estimated the time-varying air traffic volume (TV), which represents the amount of aircraft crossing the area at time t, applying time-varying fluid queue [22,23]. Here, we describe TV as , with a corresponding inflow rate (entering rate of the air traffic into the area) of and a corresponding outflow rate (leaving rate of the air traffic from the area) of .
The total number of aircraft entering the area in time interval , , is given as follows when .
Using the cumulative distribution function (CDF) and probability density function (PDF) of flight time in the area, and , and are defined as follows.
Here, is given using Equations (1)–(3) as follows.
is given using Equation (3) as follows.
in Equation (5) is given as follows.
The queuing model above allowed us to model the time-varying inflow rate and flight time , which followed general distributions. Therefore, our study identified these distributions through the simulation results of the air traffic in FRA, as explained in Section 2.1. In our model, the time-varying number of servers, , is equivalent to the defined TV, .
3.2. Modeling Air Traffic Queues in the Hotspot
Here, we estimate the time-varying TV and air traffic complexity in the C80 area. For this purpose, air traffic in the C80 hotspot was modeled as a queuing network model using the time-varying fluid queue described in Section 3.1.
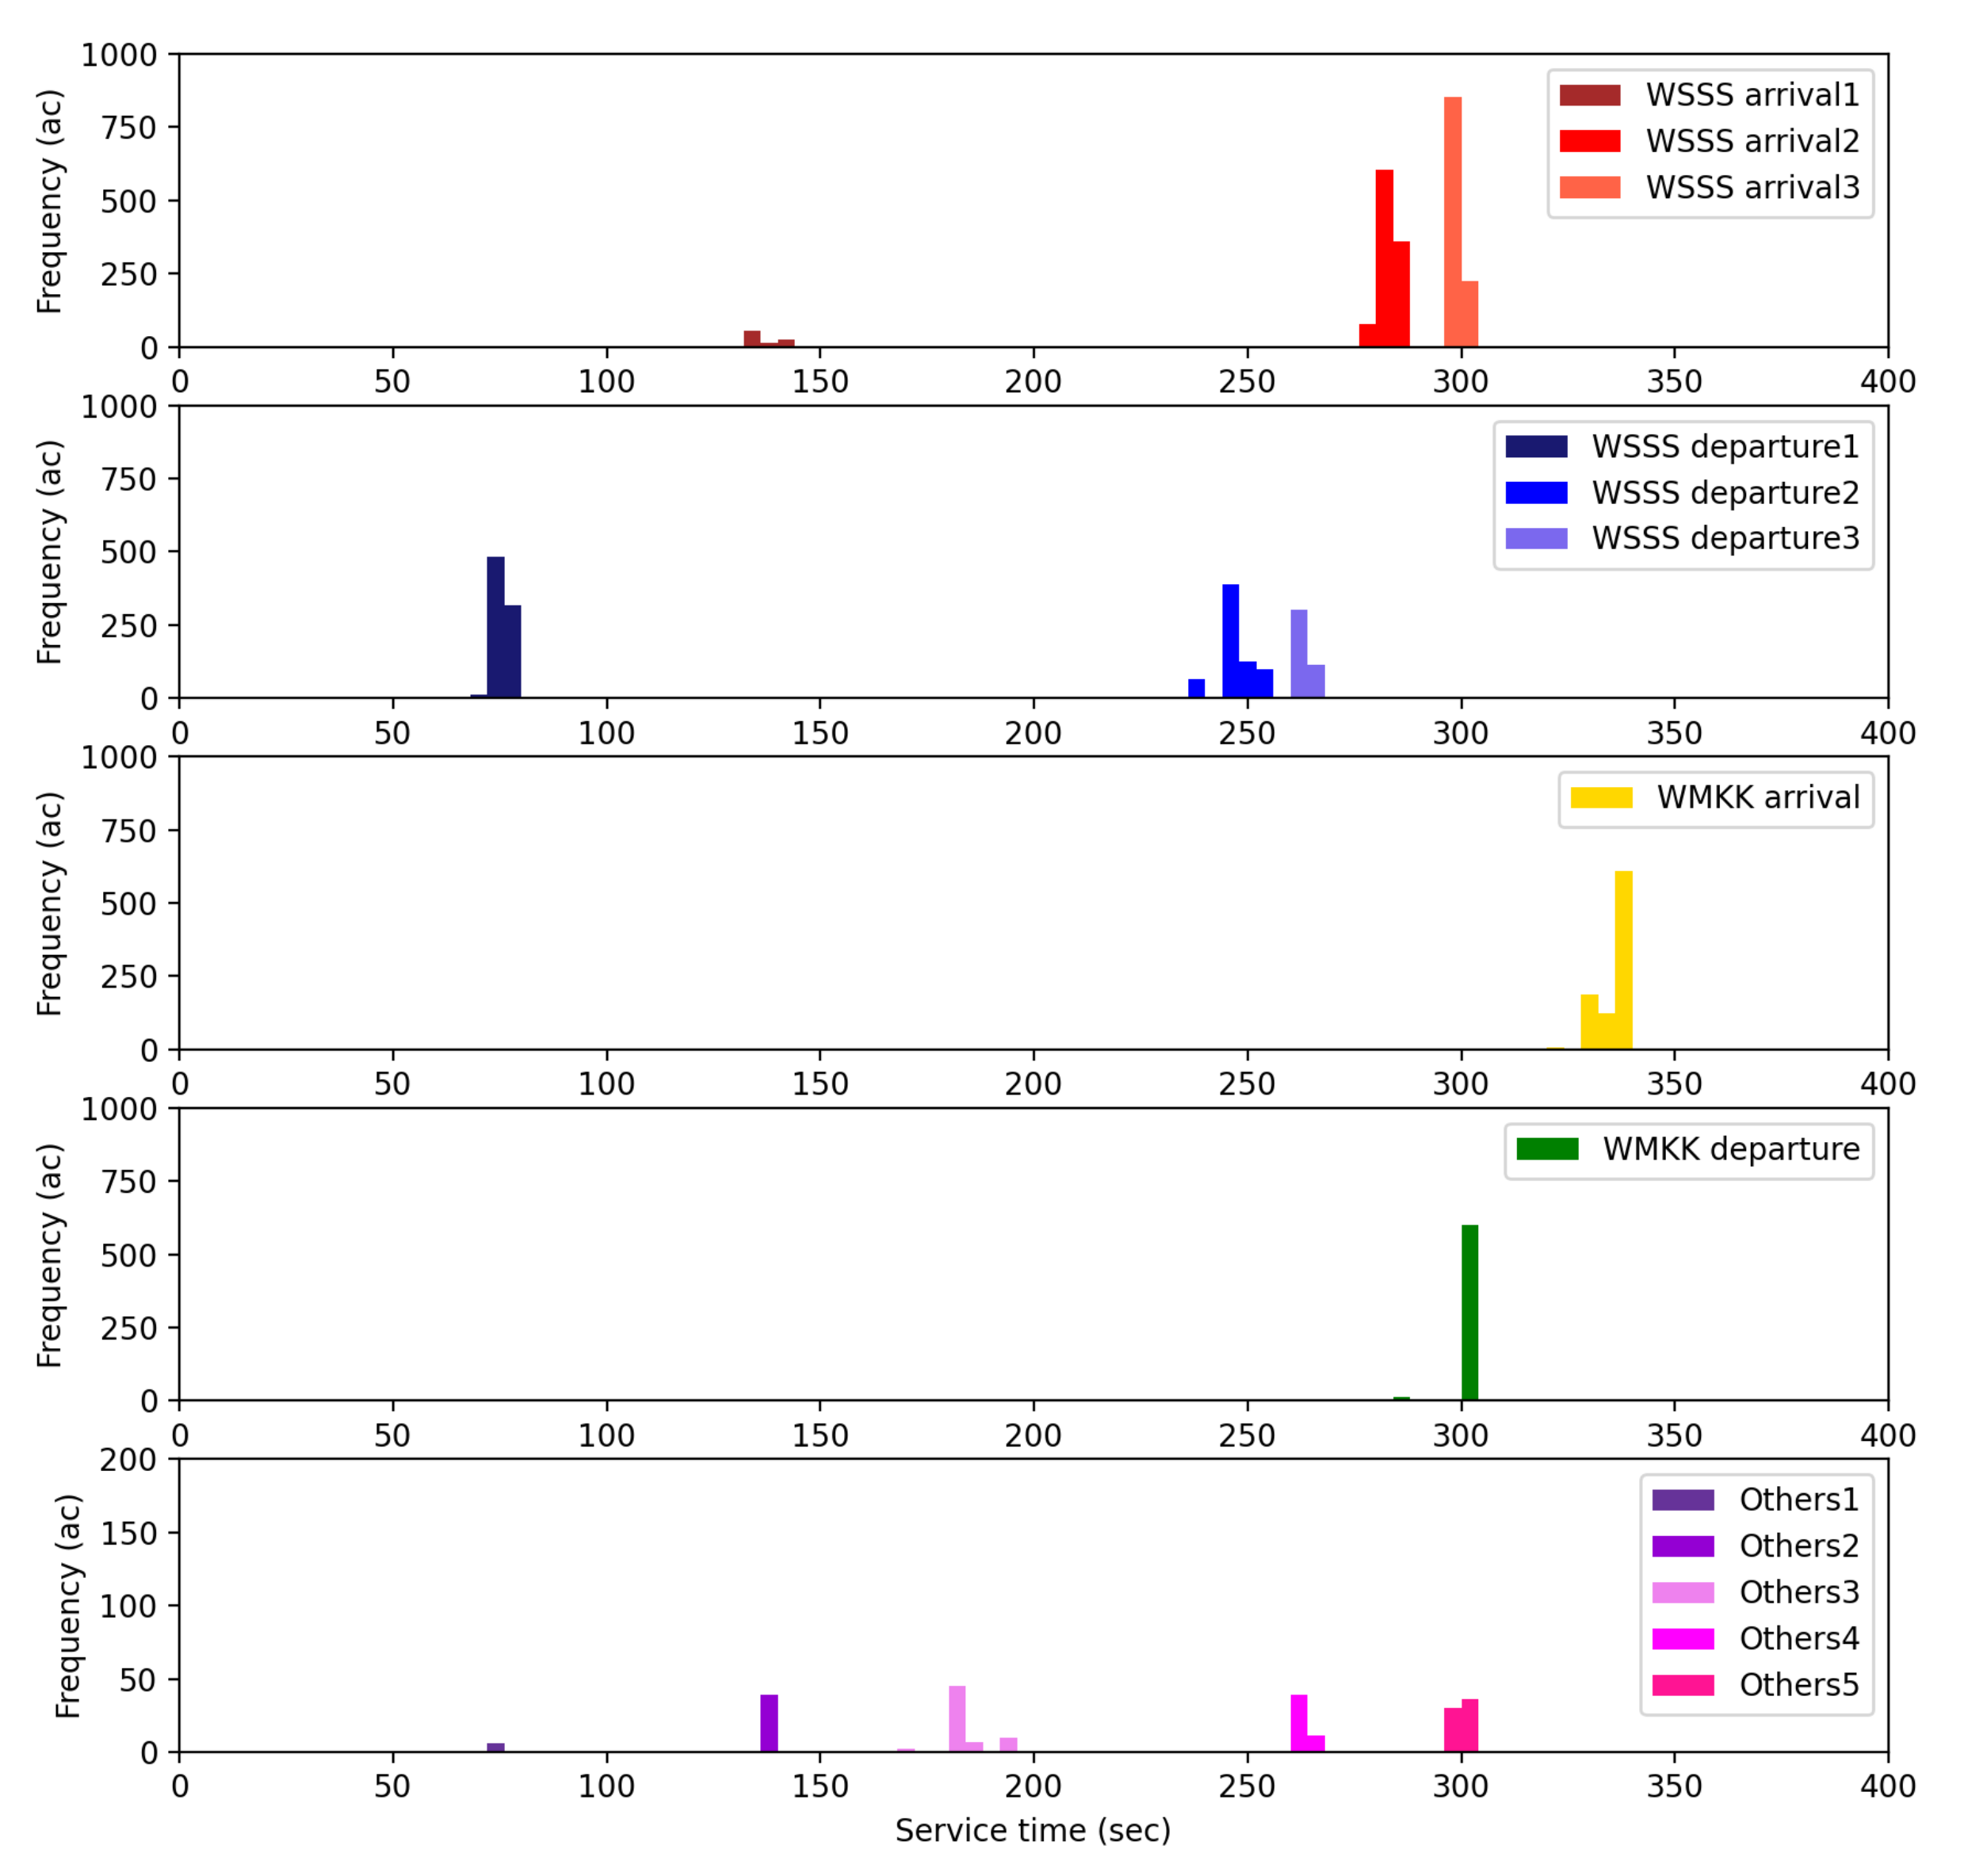
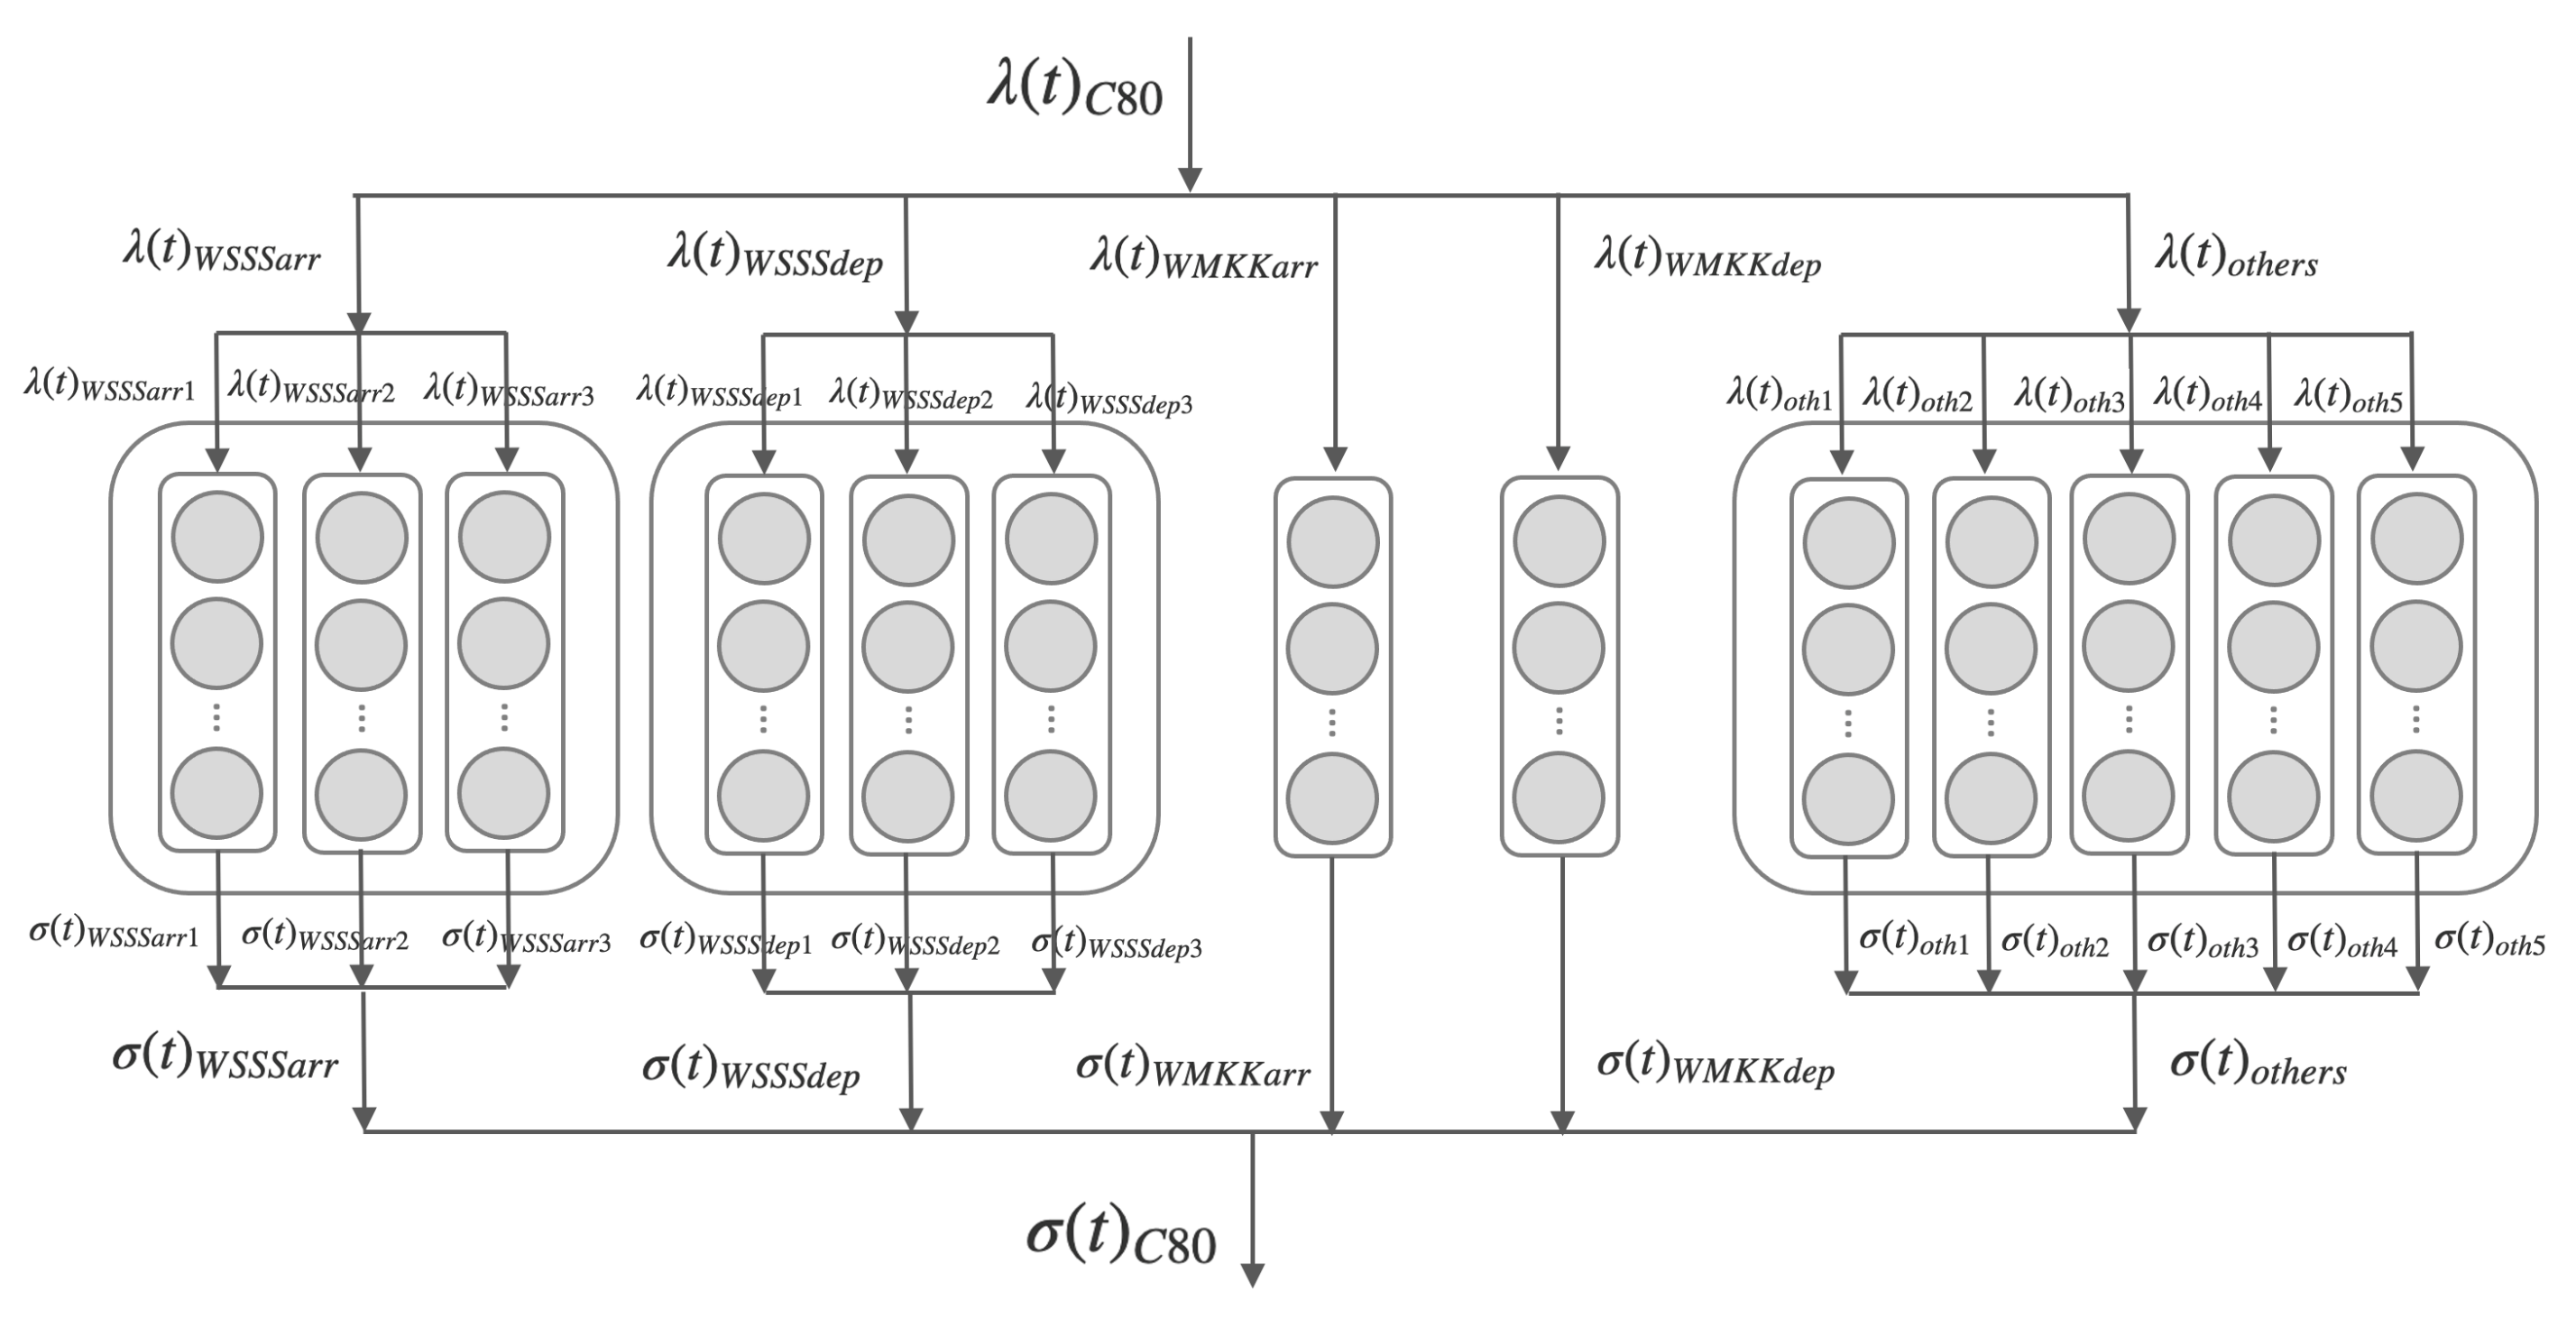
Firstly, we classified the air traffic into five flown groups according to the origin and destination airport, as analyzed in Section 2.2. Secondly, the 5 flown groups were classified into 13 flown groups according to flight time in the C80 area. Figure 3 represents histograms of the flight times corresponding to the WSSS arrivals, WSSS departures, WMKK arrivals, WMKK departures, and the other interfering air traffic (others). As shown in Figure 3, air route structures in the FRA characterized three WSSS arrivals and departures, and five other interfering air traffic by flight times in the area. Therefore, we modeled the air traffic queues in the C80 hotspot as a queuing network model, which consisted of a total 13 time-varying fluid queues, as shown in Figure 4.
In Figure 4, the total inflow rate to the C80 area, , is given as a sum of the inflow rate into each time-varying queuing model, , {}, which corresponds to air traffic of WSSS arrivals, WSSS departures, WMKK arrivals, WMKK departures, and the others. , , , are described as the sum of , { }, {}, {
}, respectively. For each , TV, , is estimated using the corresponding flight time distributions, as explained in Section 3.1. In the same manner, the outflow rate from the C80 area, , is given as a sum of the outflow rates from each queuing model.
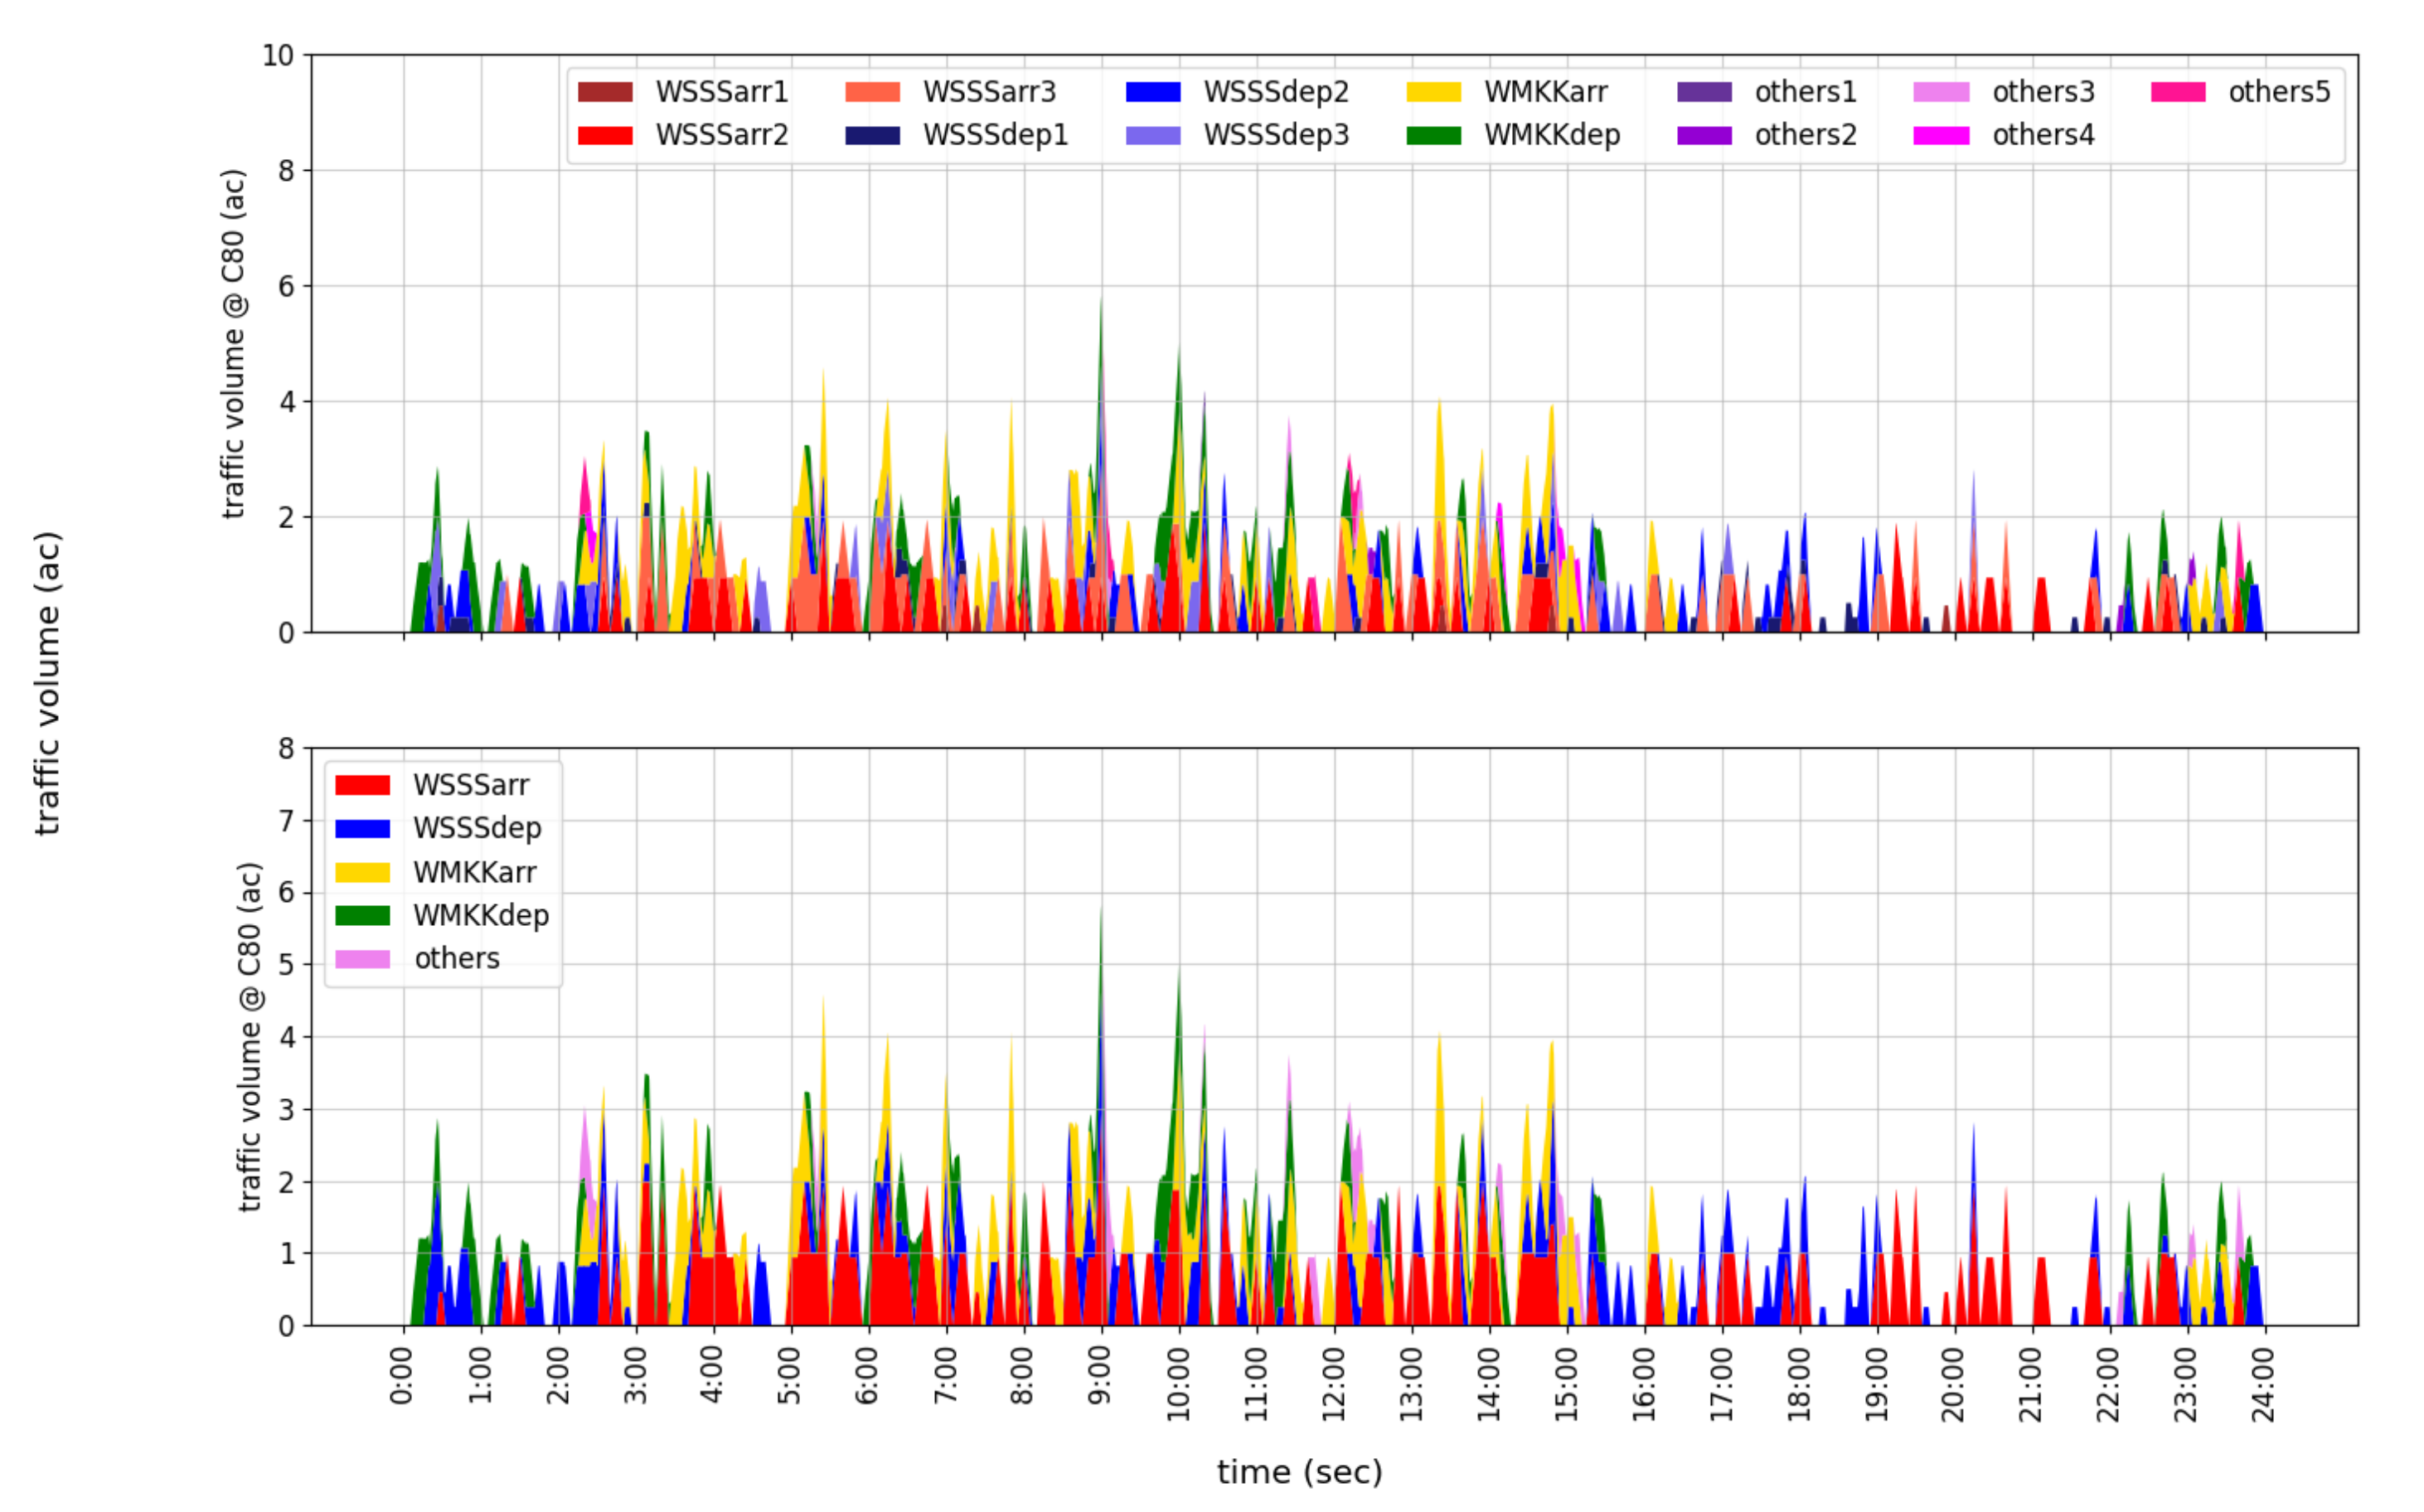
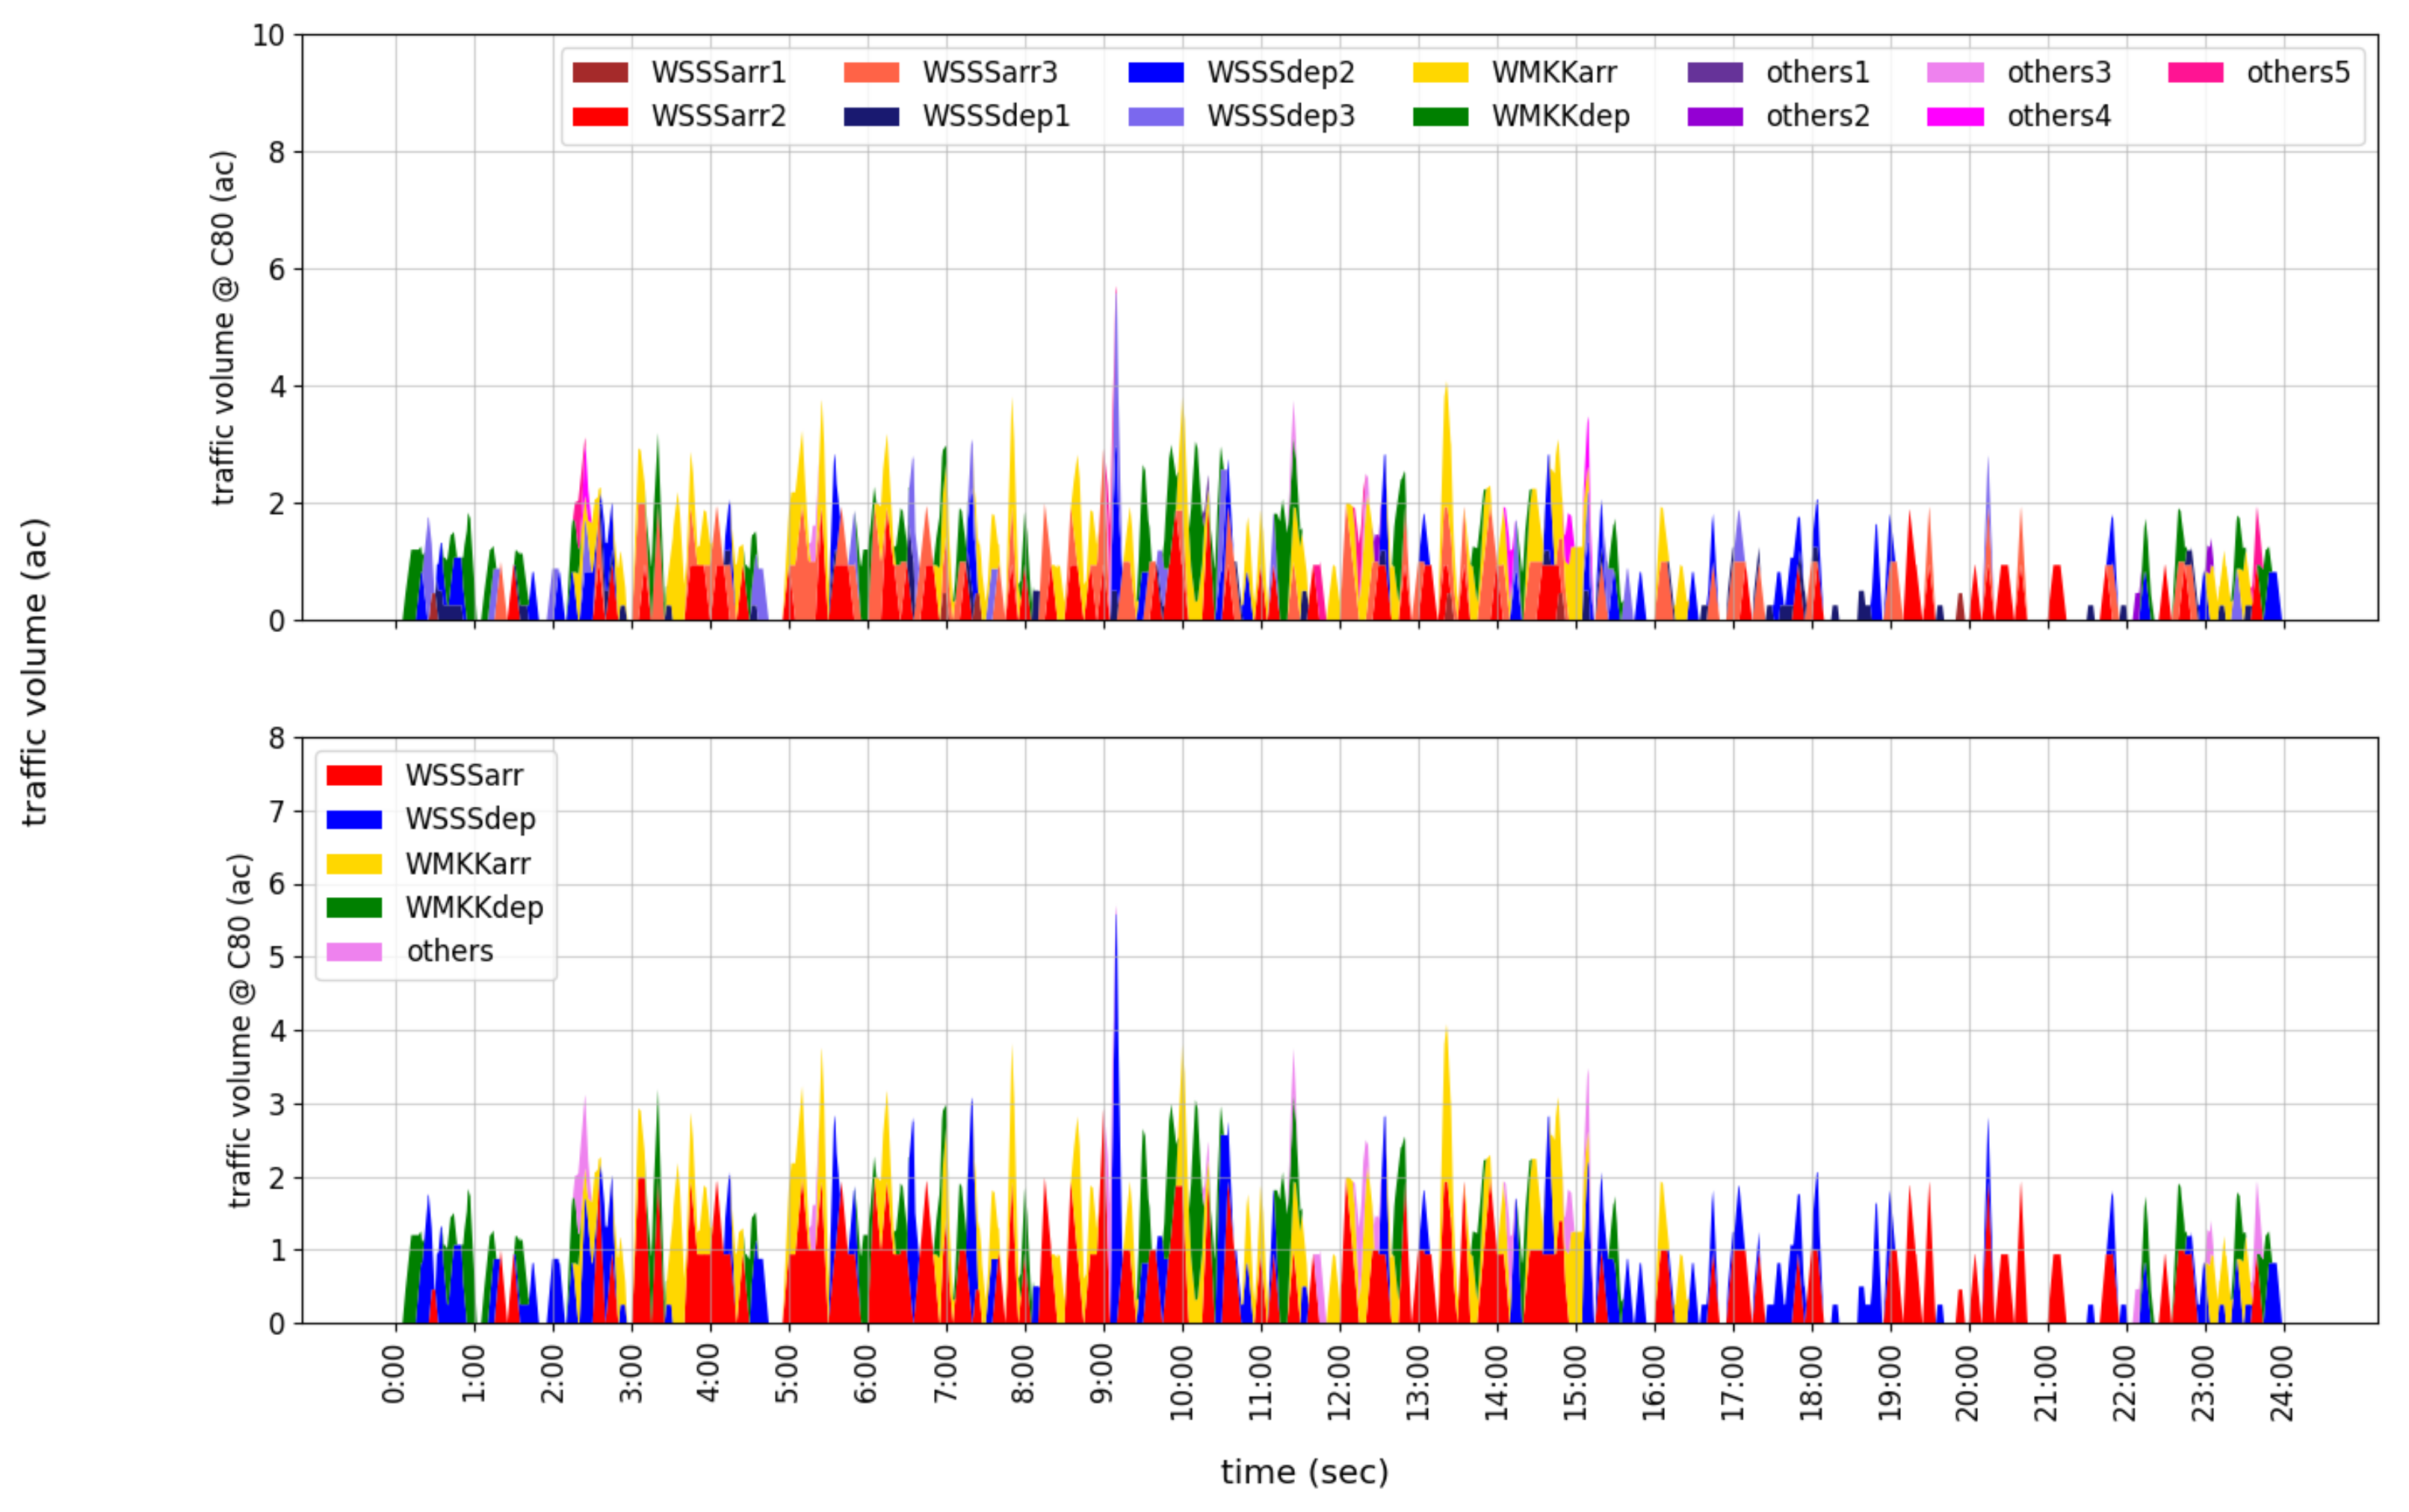
Figure 5 visualizes the time-varying TVs in the C80 area in the sample day under the nominal operation simulated in the previous chapter, , as a cumulative graph of each air traffic, on the top, and on the bottom. As discussed in the introduction, our past research identified that the concurrence of different flow patterns increased air traffic complexity and ATCo workload. So to speak, a greater traffic complexity is anticipated during the time-period when the TVs of different time-varying queuing models coincide. Figure 5 explicitly indicates when the air traffic complexity increases. For example, the ATCo workload increased during the time periods when the TV of WSSS/WMKK departures were mixed in Figure 5. In this paper, the TVs were estimated using aircraft arrival rates measured every 5 min.
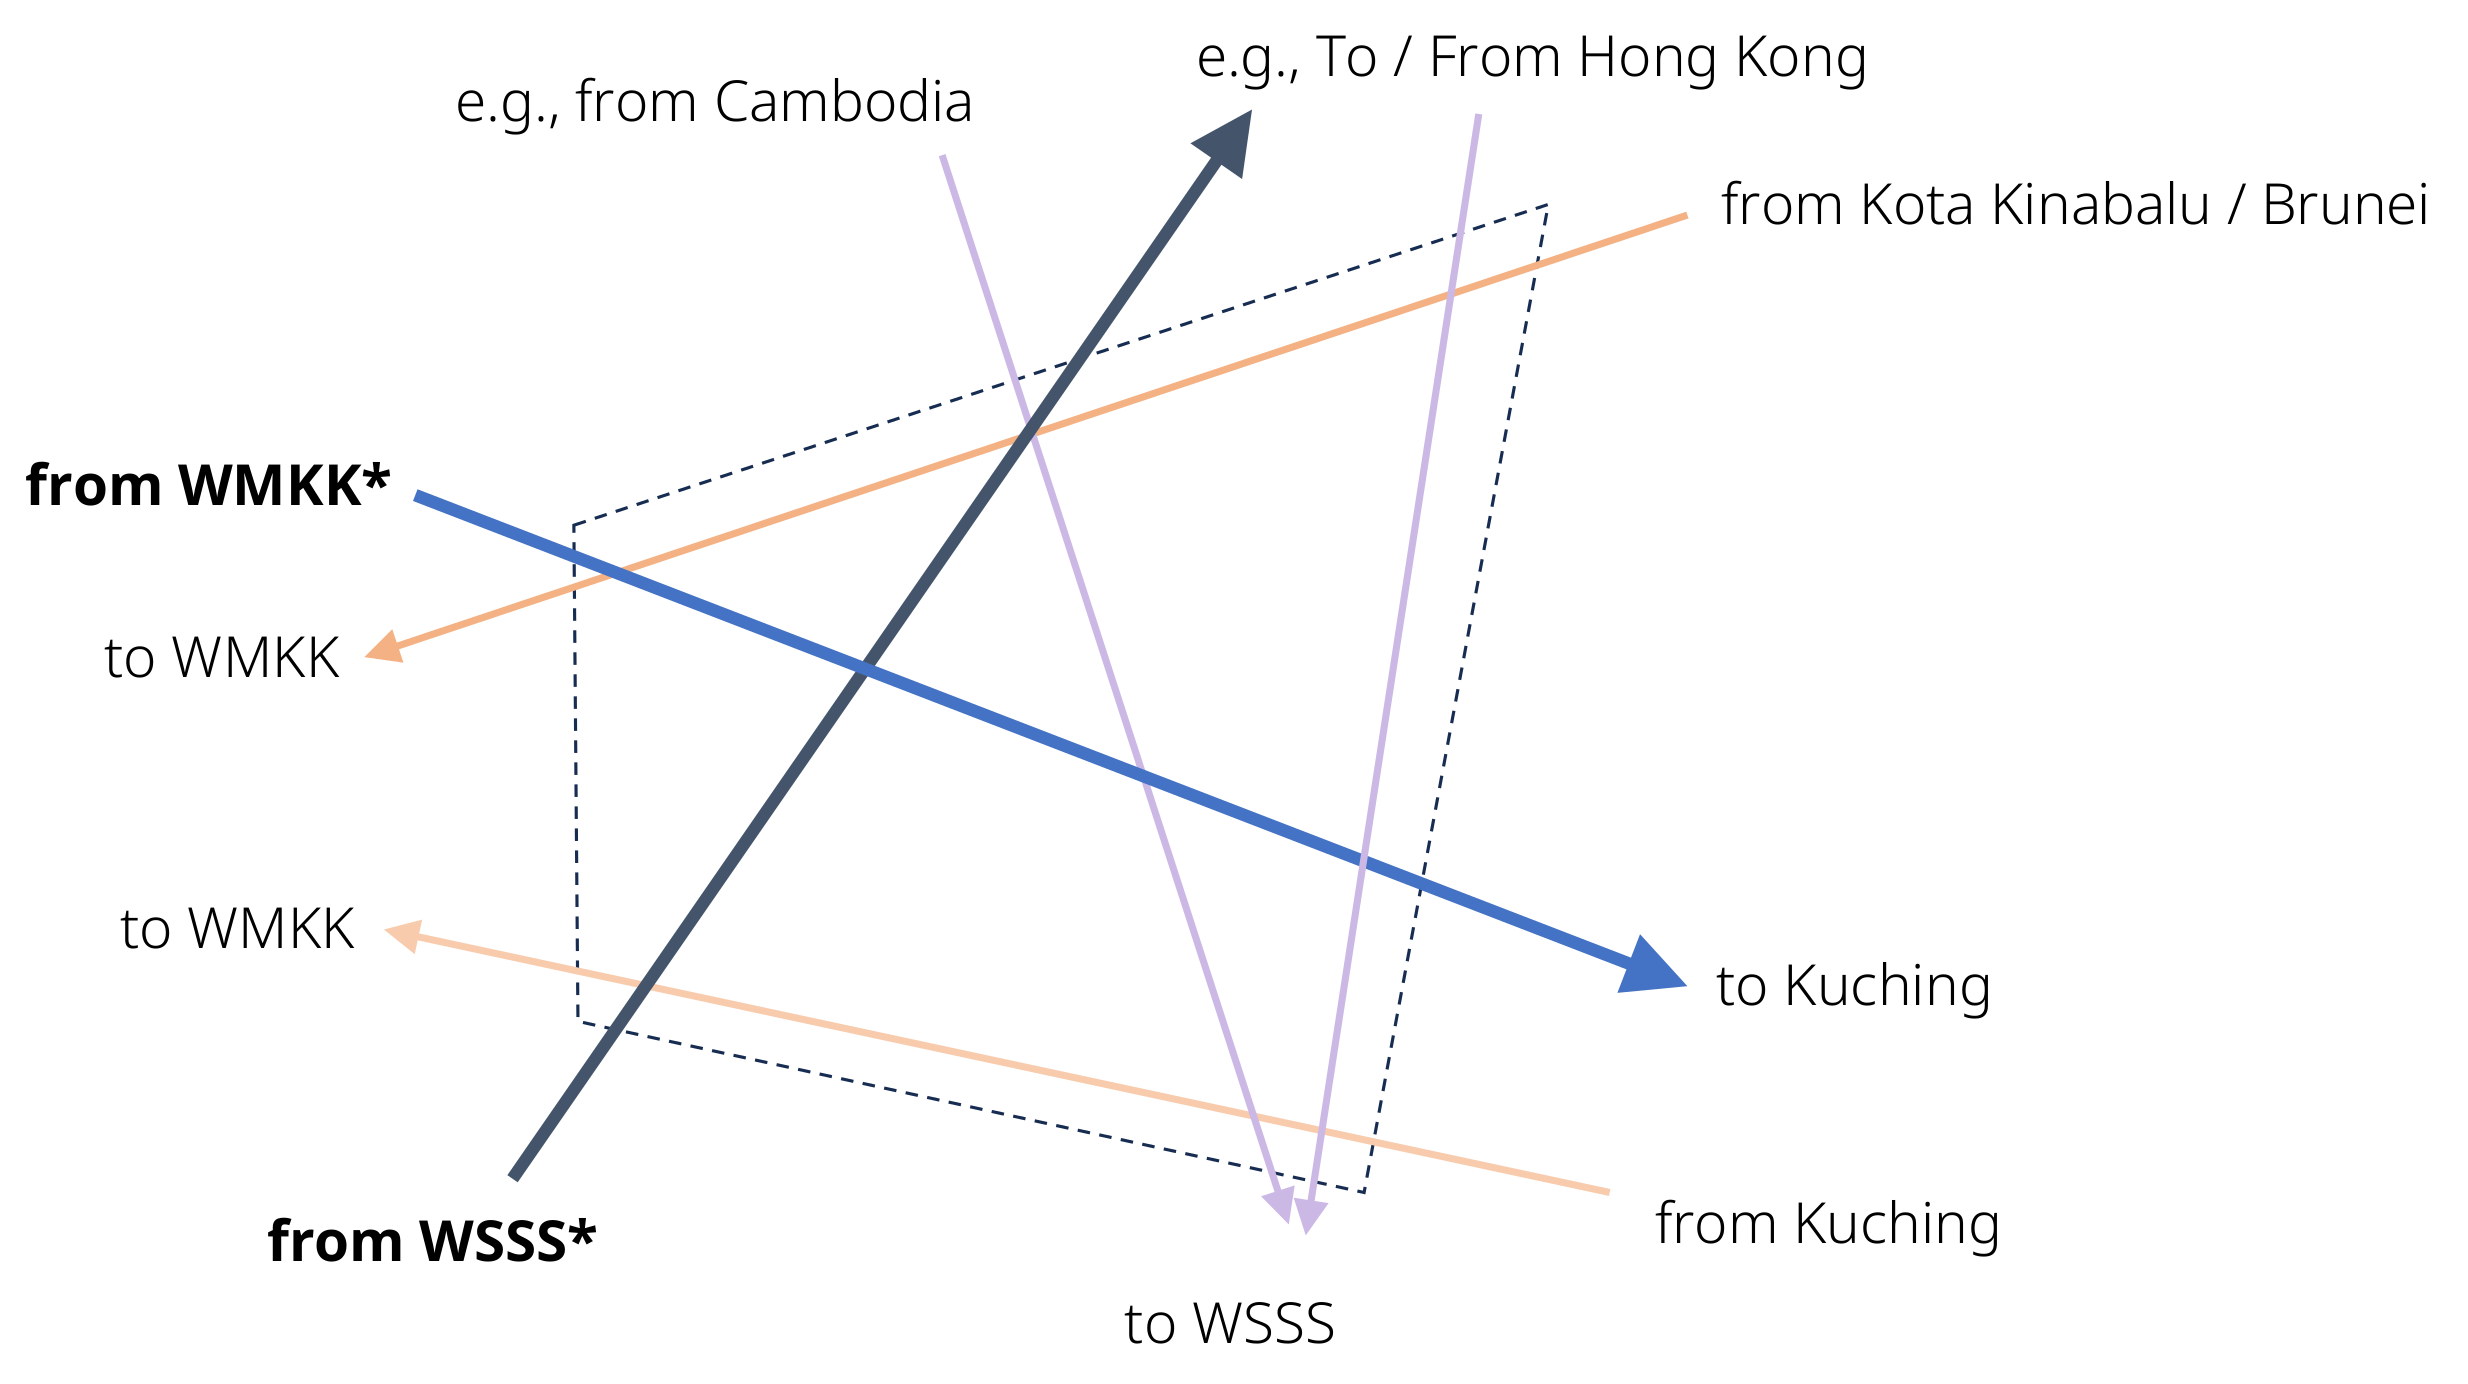
According to ATCos’ comments and operational analysis in the C80 area, some traffic flows, such as WSSS departures, WMKK departures, and other air traffic, potentially intersect with the others, thereby causing potential conflicts in C80. These anticipated conflicts increase the complexity. Figure 6 illustrates the traffic patterns in the C80 area. On the other hand, for operational reasons and because of the geometric arrangement of these flows, some specific combination of flows may coincide without adding to local complexity. For example, WSSS departures and WSSS arrivals from Hong Kong do not cross each other (at least in C80). These pairs were considered not to add complexity to the present study. As shown in Table 1, the total amount of traffic in WSSS/WMKK arrivals and departures was larger than the other traffic. This analysis suggests that segregating WSSS/WMKK arrivals/departures from the other air traffic in the C80 area contributed to composing an ideal traffic pattern that reduced the complexity. For operational relevance and simplicity, this paper considered delaying departures from nearby major airports of WMKK and WSSS, which were located about 150 NM and 100 NM from C80, respectively.
4. Untangling the Complexity in ATM
Here, aimed to achieve a reduction in potential conflicts by applying a time-varying fluid queuing model at the hotspot C80, and to relieve the air traffic complexity in the area. The main stipulated condition for the queuing model was as follows. First, the model computed and monitored the timed entry and exit at the facility for all five flow groups (Table 1). Second, only WMKK departures and WSSS departures could be delayed to segregate this traffic from the other traffic. We hypothetically assumed the calculated take off time (CTOT) with the full compliance rate as the implicit technique for delaying.
4.1. Segregating Aircraft Departure Flows
Here, we updated the CTOTs following three steps, applying the queuing network models developed in Section 2 for segregating the WSSS/WMKK departure traffic flow in the C80 area.
Firstly, we reduced the baseline TV in the C80 area (see Figure 5), , to satisfy and . In this paper, was calculated at a 5-min interval based on the original take-off time in the day’s operation. If and/or , and/or were given during the ith time-interval , when , . By updating the inflow rates, the WSSS/WMKK departure traffic flows were segregated from the other air traffic in the C80 area over the day’s operation.
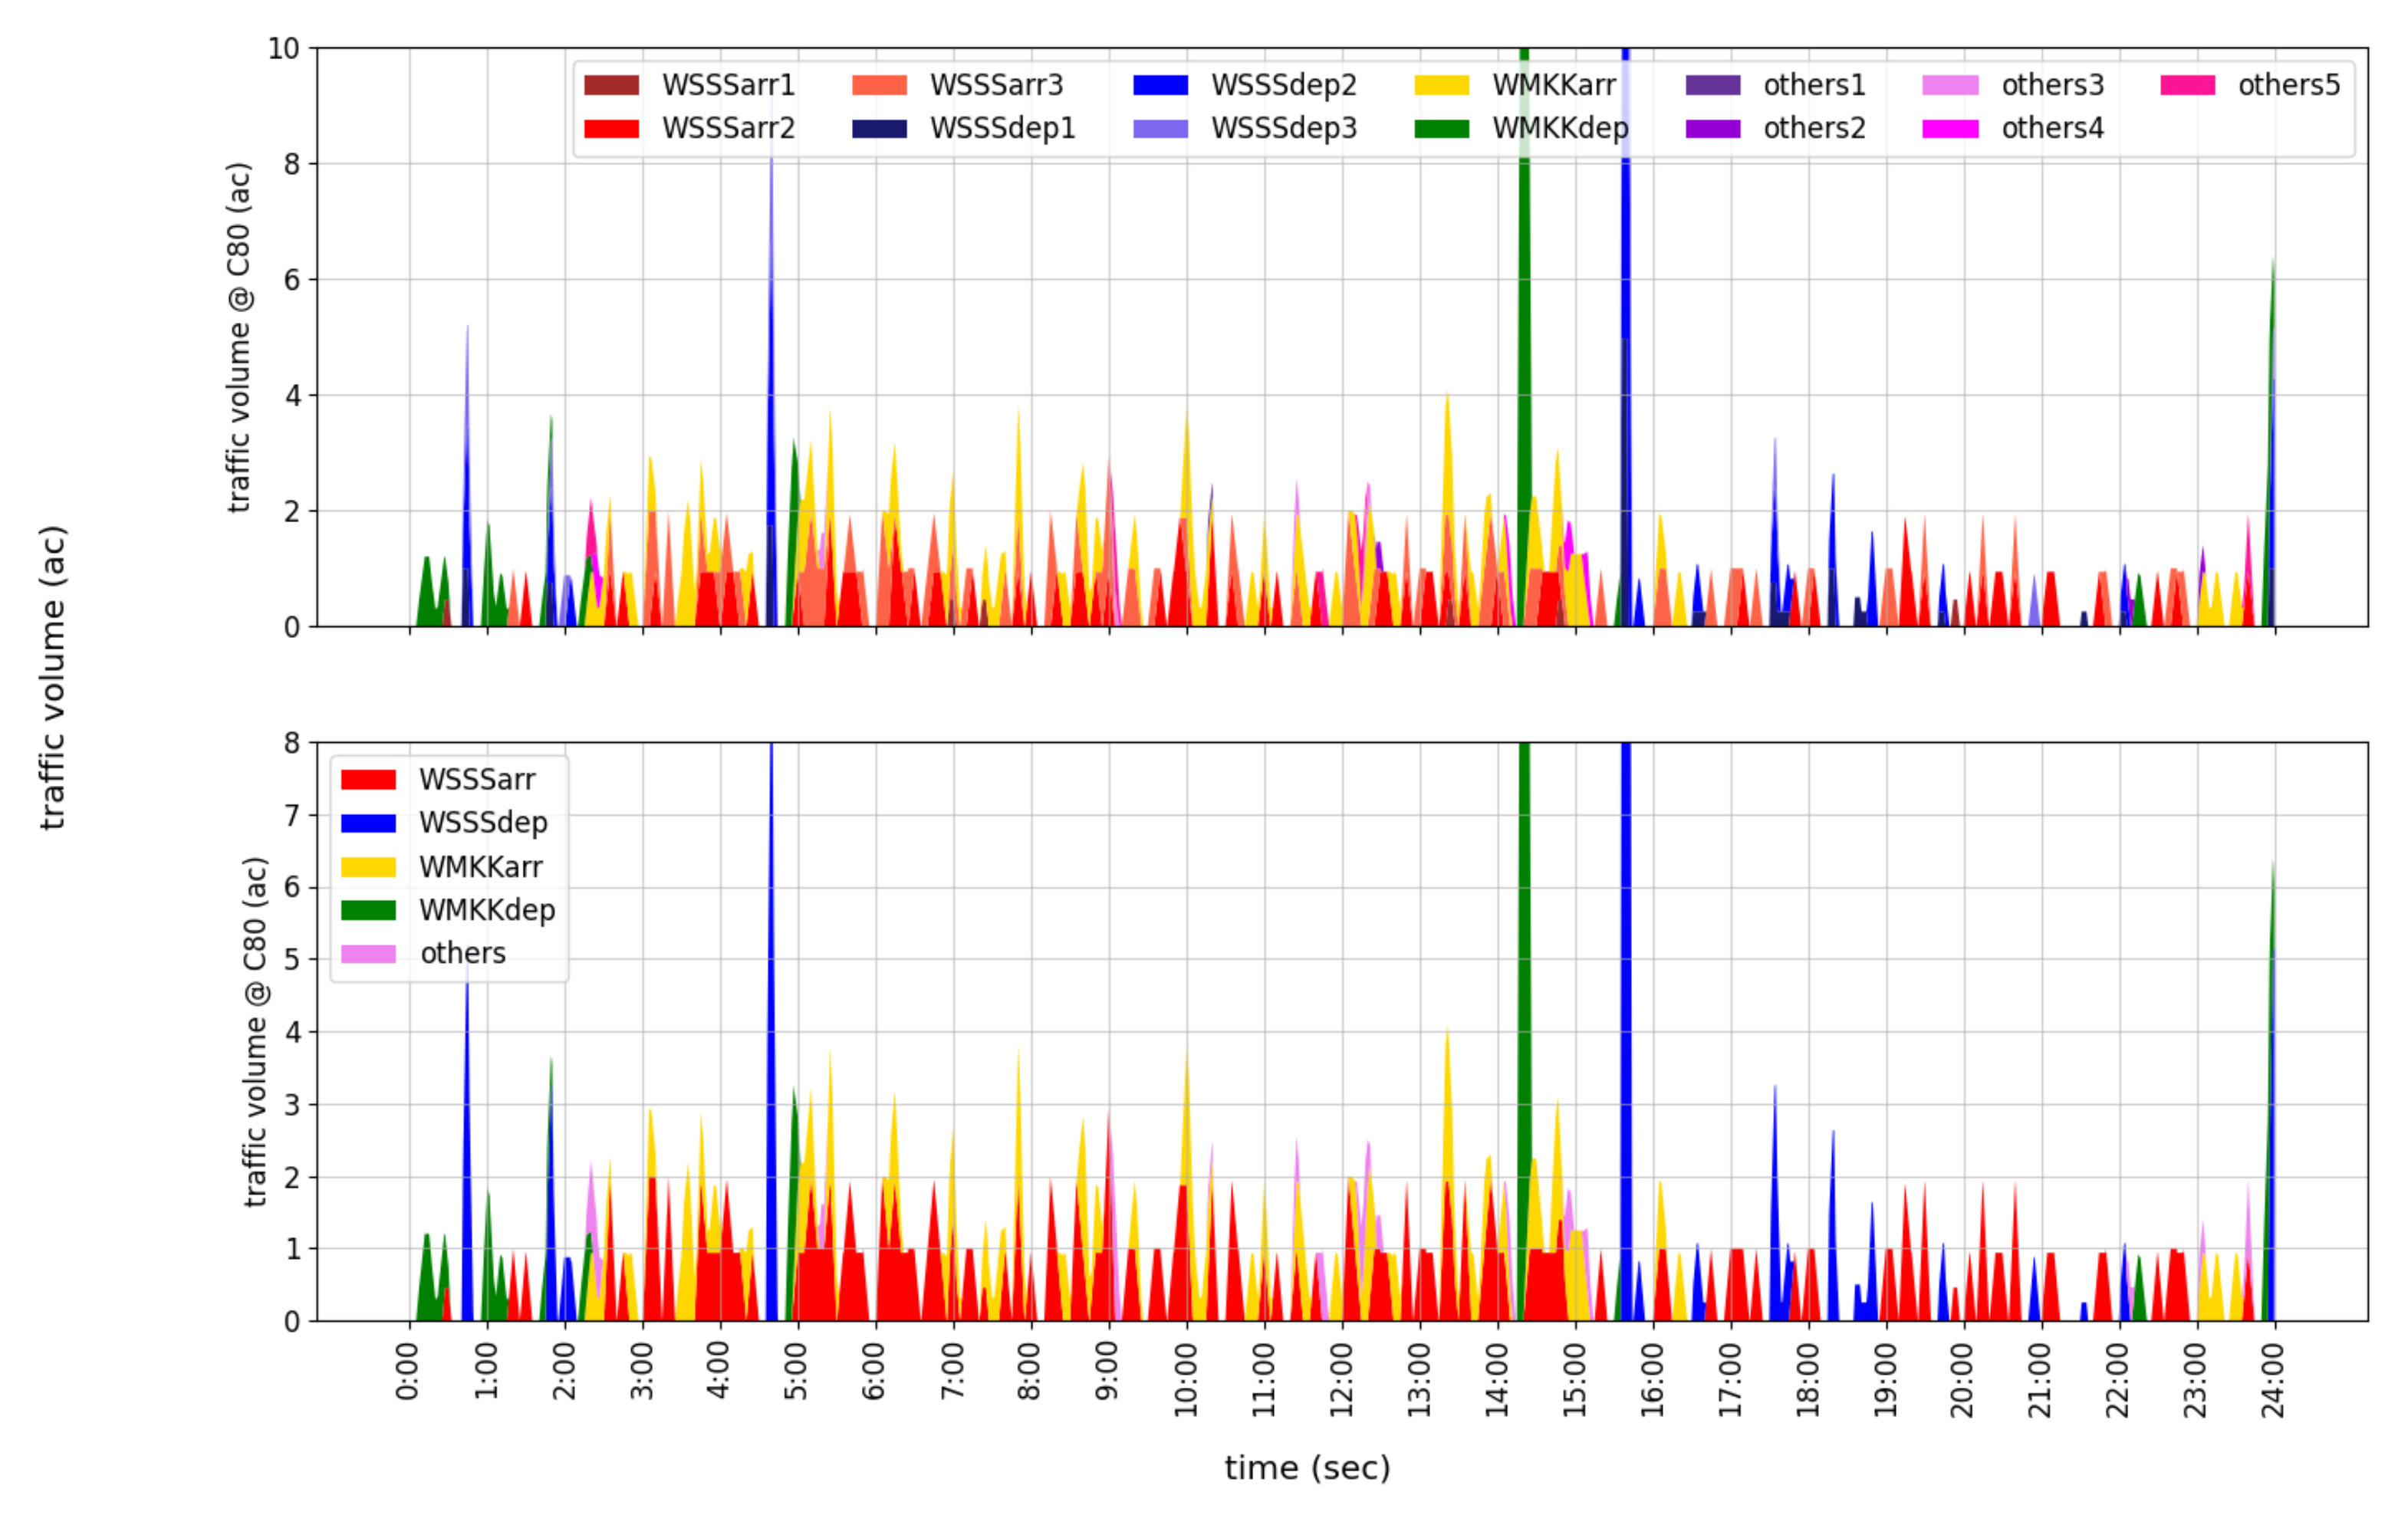
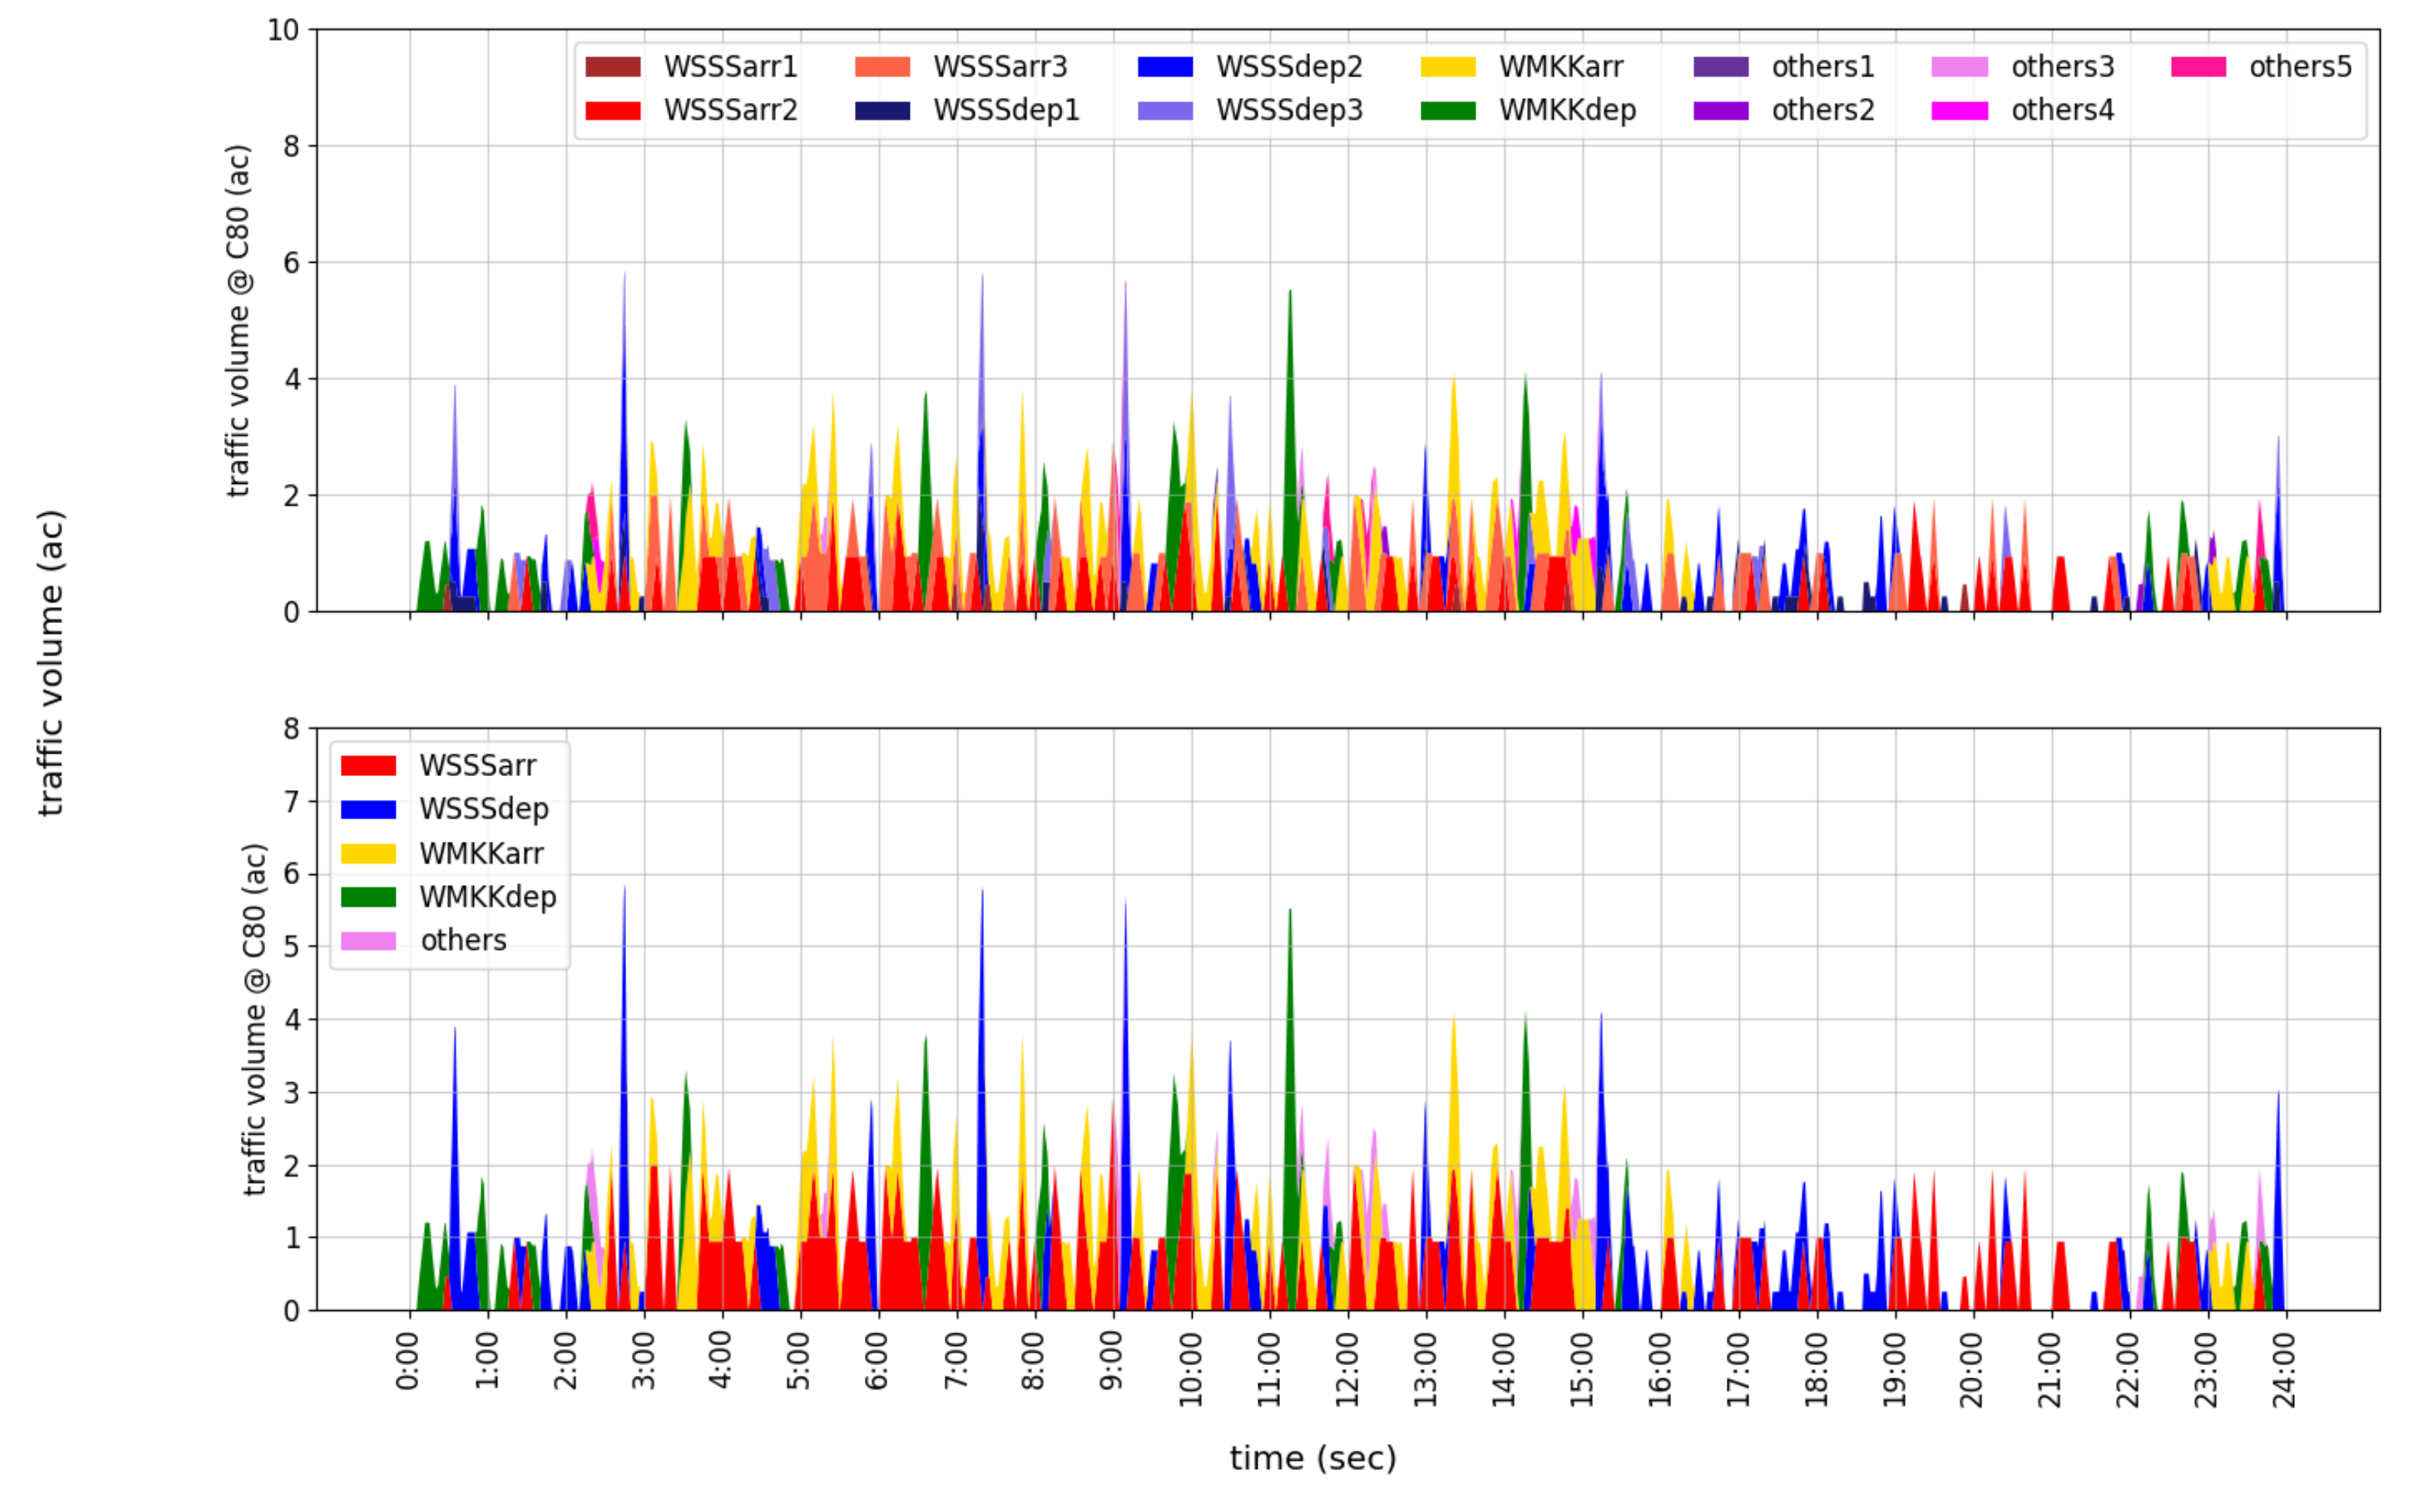
Secondly, following the rules designed above, we updated the TVs of the WSSS/WMKK departure flows using the queuing network models assuming three threshold values, , as Case 1, 2, and 3, respectively. Figure 7, Figure 8 and Figure 9 show the TVs in the C80 corresponding to the three cases. It is obvious that Figure 7 segregates the WSSS/WMKK departure flows completely in the C80 area. However, it resulted in unrealistic flow control, which generated TV peaks in a few time slots. In this paper, the maximum departure rates were not provided so as to limit the inflow rates of the WSSS/WMKK departures, because the purpose of the paper was to analyze the effects of air traffic segregation. At the same time, Figure 8 and Figure 9 indeed showed realistic departure rates, namely less than three departures in 5 min. For example, comparing Figure 5 and Figure 8, the WSSS departures were segregated from the other air traffic in C80 during the time period of around 05:00–06:00 a.m. Then, the WSSS departures entered the C80 area at around 06:00 a.m. In the same way, the TVs of the WSSS/WMKK departures were controlled by departure times based on the queuing networks. Under these assumptions in all three of the cases, we could maintain the same amount of total aircraft crossing the C80 area as the baseline operation within the day.
Thirdly, baseline take-off times were delayed by time-shifting applicable WSSS/WMKK departures as per the requirements in the downstream C80 TV management. This paper kept the same aircraft sequences as the baseline operation at the entering points of the C80 areas. The departure delay duration was snapped to multiples of 5 min. For example, if the departure aircraft was delayed to the next time slot or two slots after, the delay time would be 5 min or 10 min, respectively, but not any other amount in between.
Table 2 summarizes the estimated WSSS/WMKK departure delays according to the TV controls. The results in Case 1 show that it caused extremely large departure delays if the WSSS/WMKK departure times were delayed in order to fully segregate the flows from the other air traffic in the C80 area. Compared with Figure 7, the departure time control delays the WSSS/WMKK departures did not to enter the C80 area during the 05:00 a.m. to 14:00 p.m. time period in order to avoid conflicts at the hotspot. Even though this contributed to composing an ideal traffic pattern, it sacrificed the WSSS/WMKK departure demands. Thus, it was an unrealistic solution to fully segregate the WSSS/WMKK departure flows in C80. While balancing the WSSS/WMKK traffic demands and air traffic complexity in the C80 area, the results in Cases 2 and 3 indicated that the WSSS/WMKK departure flow control achieved significantly smaller departure delays compared with Case 1. CTOTs of approximately 40 to 60% of WSSS/WMKK departures were updated, and the average delay time was less than 30 min in Case 2 and less than 20 min in Case 3, respectively. These results justified that departure time control reduced the complexity below a certain value. In the next section, we conducted a series of FTS experiments and analyzed the effectiveness of the proposed departure flow control through a model-based approach.
4.2. Effectiveness of the Departure Air Traffic Flow Control
For validation of the hypothesis that the application of a time-varying fluid queuing model reduced the potential conflicts, we structured the design of the FTS experiments as follows.
4.2.1. Departure Time-Spacing Constraint
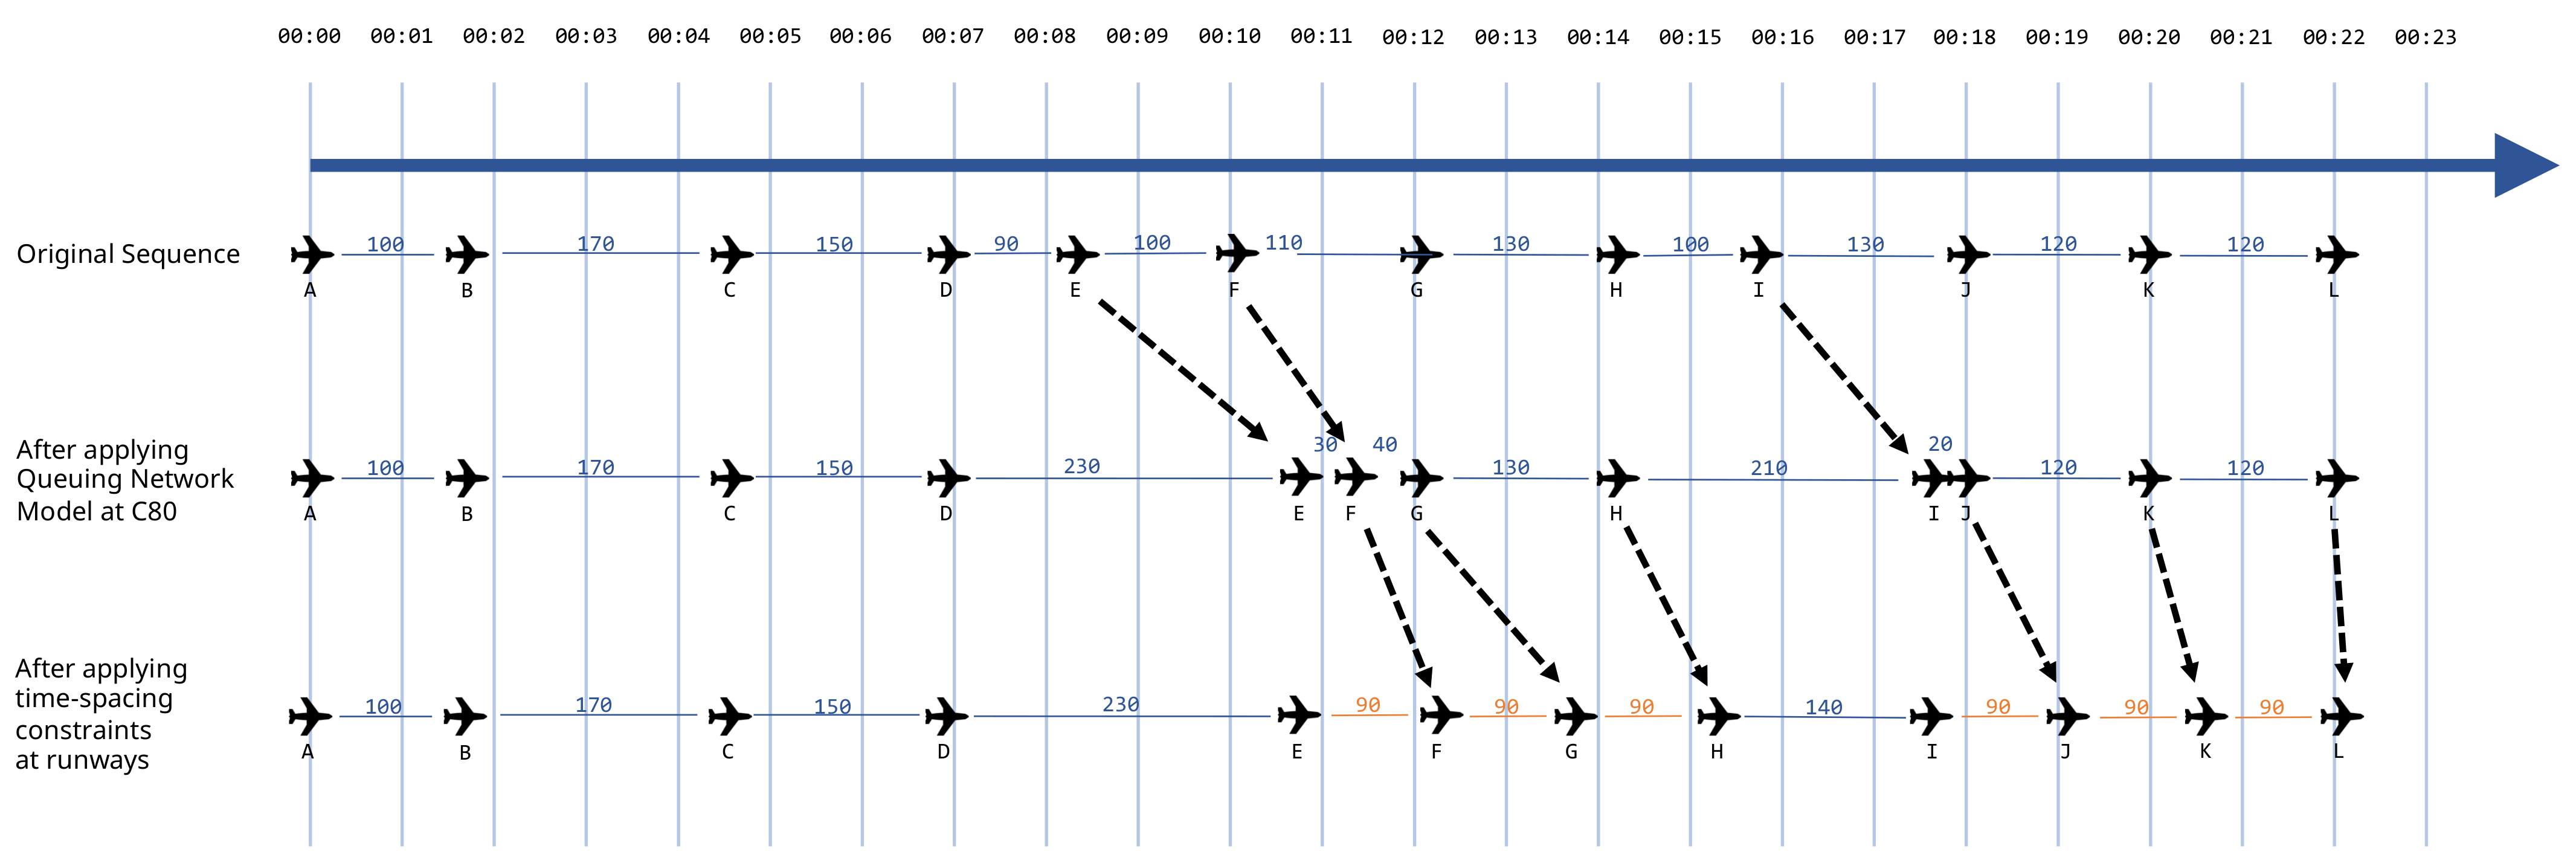
Here, delays aimed to segregate departure flows at C80 were inserted as time-shifting of the entire planned trajectory from the departures to arrival Thus, it ignored other operational requirements in the upstream or downstream legs. In our case, this could particularly impact the WMKK and WSSS departure queues, which were limited, for example, by runway availability. Then, we additionally applied simple rules for departure time-spacing for mitigation purposes. This rule allowed departure aircraft to take off, ensuring the minimum 90 s time separation with the preceding departure aircraft at a runway. These rules are illustrated in Figure 10.
4.2.2. Measurement
We used a fast-time simulator AirTOp [24] for computing potential conflicts (defined as infringement in both separation minima: 1000 feet vertical and 5 NM lateral), given a time-controlled scenario provided by the queuing model. Potential conflicts weer counted both inside and outside the C80 area within a volume of airspace, which was approximately north of the N circle of latitude and west of the E meridian, within the Singapore FIR (see Figure 1). In real operations today, the area presented ATC services for WMKK east arrivals and departures, WSSS north arrivals and departures, and a few other main flows. These are considered more demanding areas for ATC provision because of the frequency of potential conflicts (as evidenced in Figure 2) due to specific operational constraints.
4.2.3. Experiment Structure
As a consequence of Section 4.1, we organized the design of the experiment based on the three cases applied in the queuing network model (Table 3).
Based on the hypothesis, we anticipated a greater improvement (reduction) in potential conflicts within C80, as increasing the strictness of the queuing model depending on the percentage of segregated WSSS/WMKK departure flows. On the flip side of the story, we would also naturally anticipate a greater number of potential conflicts outside of C80 as the queuing model deliberately ignored what happened elsewhere.
4.2.4. Results
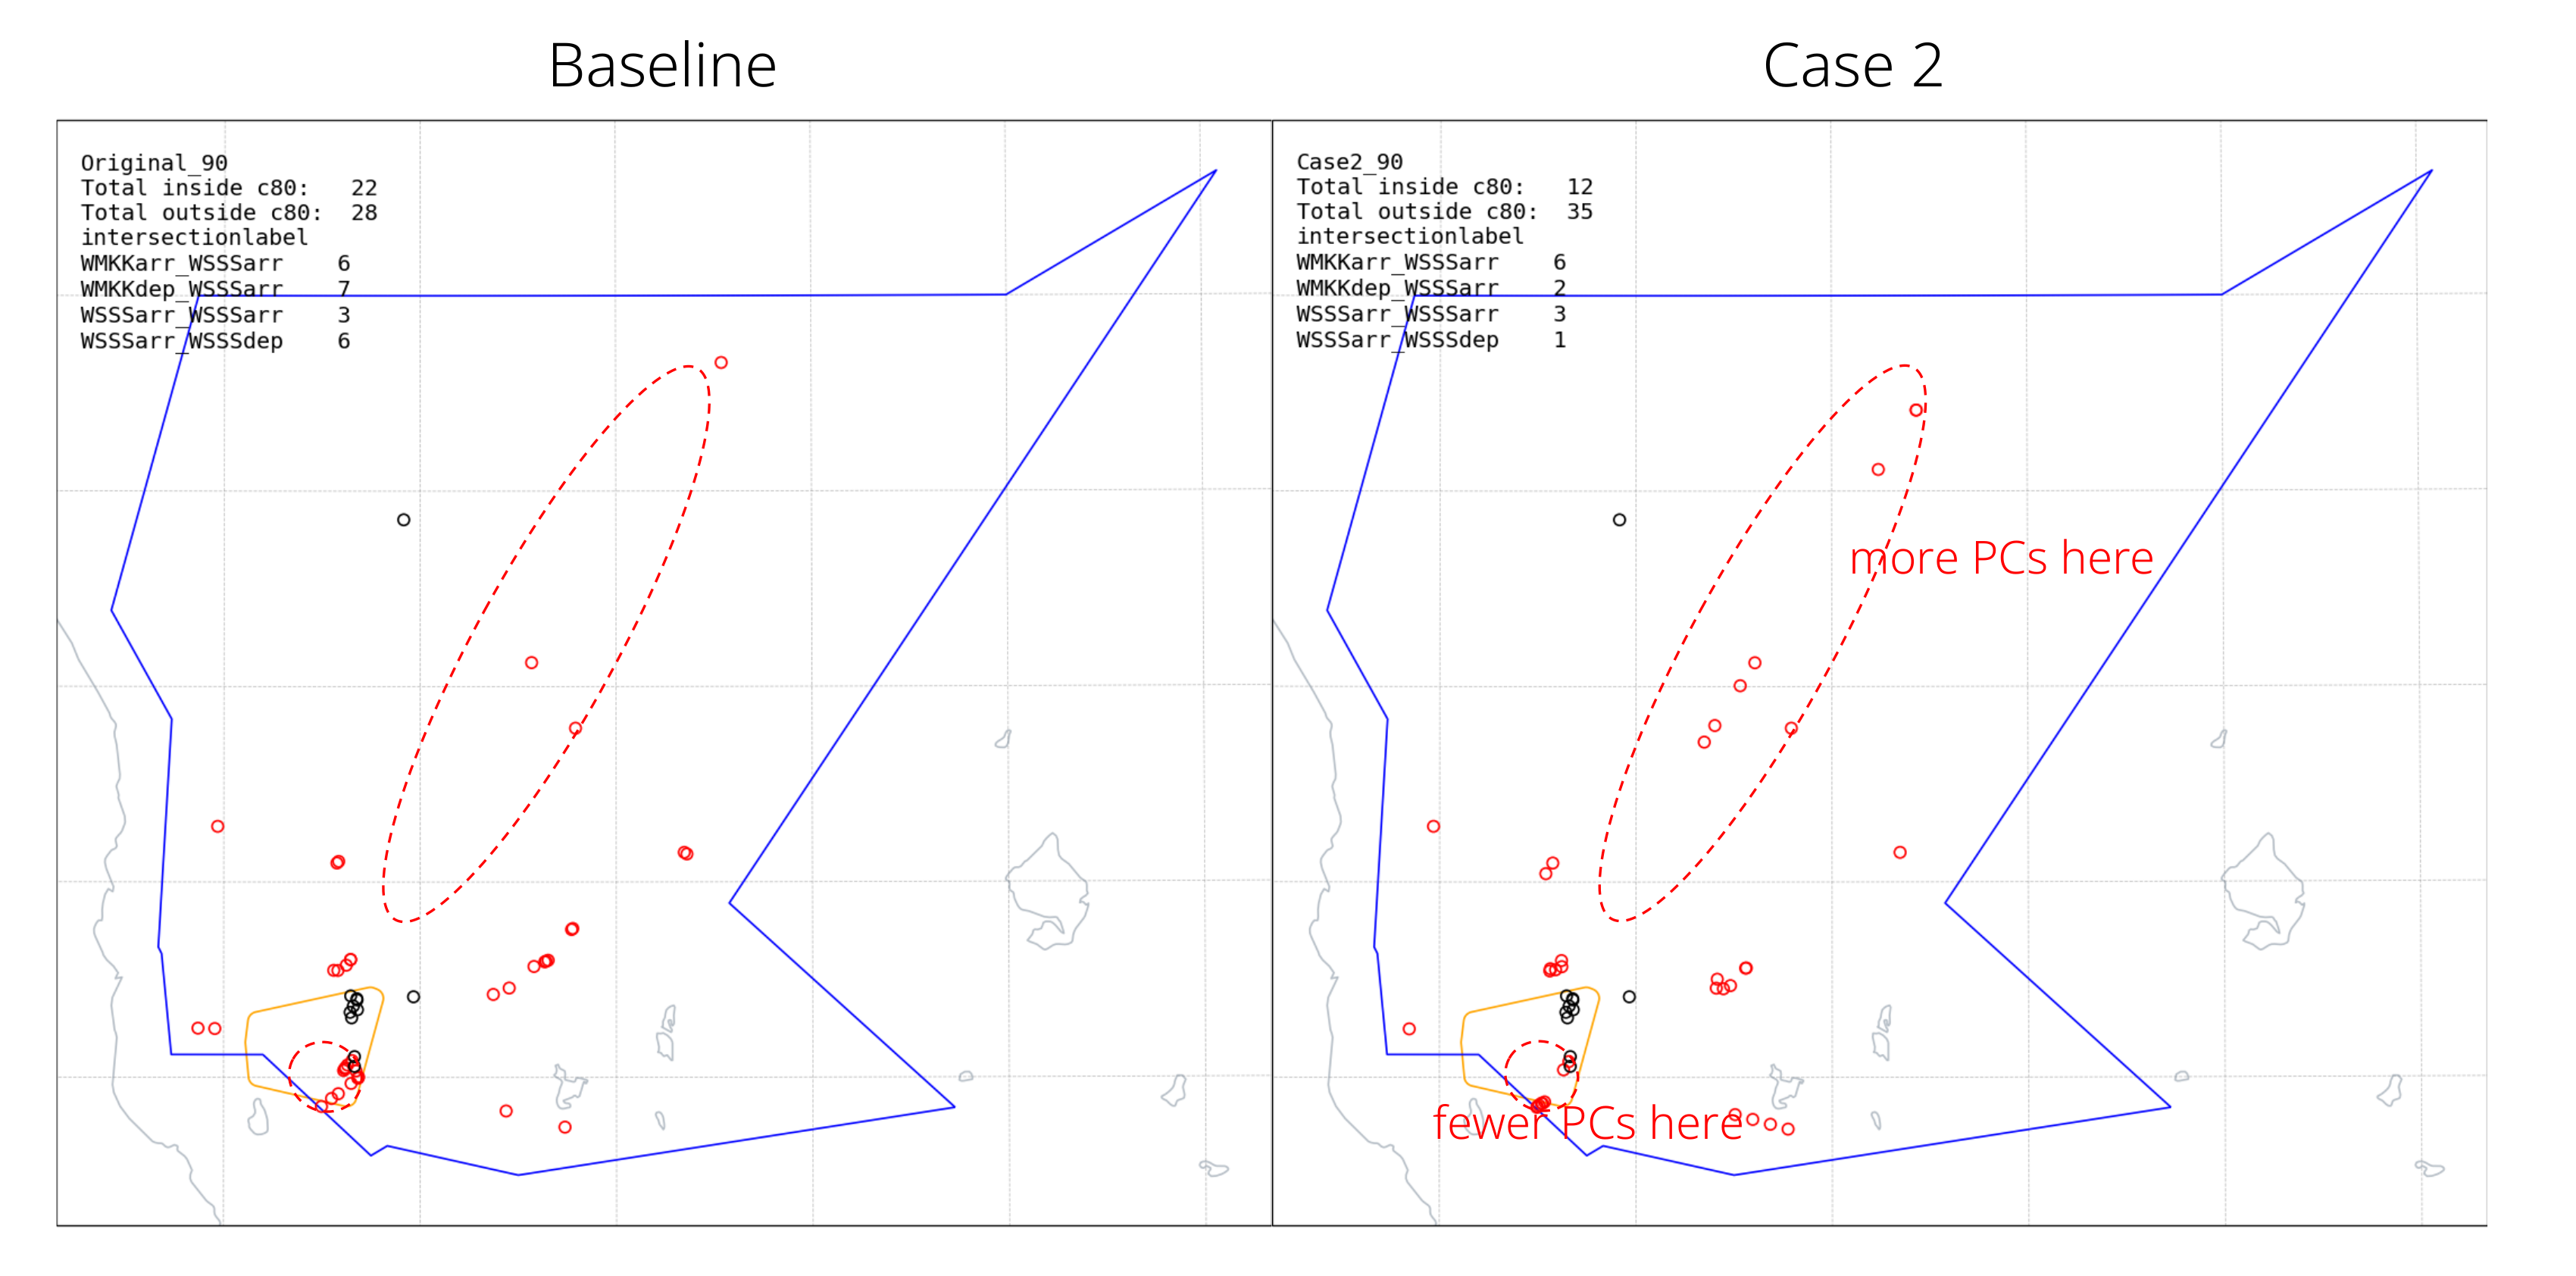
As for the potential conflicts, the application of the queuing model reduced the potential conflicts within area C80, compared with the baseline (Table 4). For example for Case 2, there was a 45% reduction in potential conflict count within C80 (22 reduced to 12). However, there were cases in which the potential conflicts outside of C80 increased (Case 2 and Case 3). For example for Case 2, there was a 25% increase in potential conflict outside of C80 (28 increased to 35). This brought mixed results for the total potential conflicts (sum of potential conflicts inside and outside C80). Specifically, there was a reduction in total potential conflicts for Case 1 and Case 2, but there was an increase in total potential conflicts for Case 3. These could be understood as a result of an application of a queuing network model that intentionally ignored the impact of time-shifting in upstream and downstream airspaces. A geographical analysis of potential conflict locations further confirmed the perturbation impact of the queuing network model on the areas outside of its principal application scope of C80 (Figure 11).
To further study the dynamism between the various flows that were controlled in this study, potential conflicts were counted according to the major flows of the two aircraft that went into potential conflicts during the simulation (Table 5). For WSSS departures, potential conflicts were reduced in many flow group pairs (Others_WSSSdep, WMKKarr_WSSSdep, and WSSSarr_WSSSdep). This was the anticipated benefit of the application of a queuing network model. However, potential conflicts were increased among themselves (WSSSdep_WSSSdep). This could be due to the additional flow that joined WSSS departure flows (notably those from WMKJ Johor Senai) before transiting through Singapore FIR, including C80. For WMKK departures, potential conflicts were reduced among the WMKKdep_WSSSarr flow group pair, but the results were mixed or minor in two other combinations (Others_WMKKdep and WMKKarr_WMKKdep). There were no potential conflicts among WMKK departures themselves for all scenarios (WMKKdep_WMKKdep, not shown in the table). For the potential conflicts between the two departure flow groups (WMKKdep_WSSSdep), the potential conflicts were completely eliminated in Case 1. Finally, it is worth noting that the potential conflicts that did not involve either WMKK departures or WSSS departures (Others_WMKKarr, WMKKarr_WMKKarr, WMKKarr_WSSSarr, WSSSarr_WSSSarr) did exist in the simulation. Their validly was not affected by the application of the queuing network model, as anticipated.
The above observation led to the following accounting of the potential conflict situation simulated in this study. In the baseline scenario, there were 50 potential conflicts within the studied airspace, of which 22 were inside C80. Of these 22 potential conflicts in C80, 11 involved a WMKK departure and/or a WSSS departure. The 11 potential conflicts were the indirect study subject for improvement, which theoretically should be reduced by segregating the WMKK departures and WSSS departures from each other or from other flows (WMKK arrivals, WSSS arrivals, or other major flows). Consequentially, the queuing network model reduced the value 11 to 2, 1, and 7 for Cases 1, 2, and 3, respectively. It was not possible to entirely eliminate the 11 potential conflicts due to the additional departure time-spacing constraints we considered (Section 4.2.1). In the baseline scenario, 28 potential conflicts were observed outside of C80. These were increased in two of the three cases (to 35 and 35 for Case 2 and Case 3, respectively) This is because of the deliberate design specification for the queuing network model, ignoring the delay impact in the upstream or downstream airspaces.
5. Discussion
This paper developed a queuing network model via a time-varying fluid queue, and controlled aircraft departure flow in the ASEAN airspace assuming the FRA operation. Our conceptual approach designed the interplay of functions that ASEAN partners would have to consider when introducing FRA. The results clarified that air traffic flow management (ATFM) function could be addressed to realize better air traffic service (ATS) provision. Here, we discussed future works based on the evaluation results through a series of FTS experiments in the previous chapter.
5.1. Balancing Local Effects in the Wider Regional Network
As shown in the simulation results, although the number of conflicts in the C80 area was reduced by a maximum of 45% (see Case 2 in Table 4), it increased conflicts outside of the C80 area compared with the baseline operation. This indicated that the air traffic interfered outside of the C80 hotspot as a result of departure time controls, which untangled air traffic complexity focusing on the C80 area. To realize the ideal traffic patterns in the entire airspace, as the next step, this study developed a series of queuing networks to model the potential propagation of hotspots from the C80 area. Accordingly, we untangled the air traffic complexity in the wider airspace by breaking the chain of propagation by applying the model-based air traffic flow control. To achieve the goal, it was required to analyze the detailed features of the air traffic flows and operational constraints in the target ASEAN airspace for modeling them into the networks.
5.2. Collaboration with Long Range Air Traffic Flow Management
This paper applied aircraft departure time controls because WSSS/WMKK departures mostly impacted the C80 hotspot. For balancing the local hotspot deconfliction in the wider regional network, the other potential solution could be strategic arrival traffic flow management. The authors’ past research indicated that aircraft arrival time control led to a less severe phase of excessive traffic demands when applying the concept of long range air traffic flow management (LR-ATFM) [25]. The LR-ATFM concept aimed to control the entry time of long-haul flights into the approach sector, assuming the opportunities for aircraft to control speed and/or to change tracks. A shift of min per remaining flight hour resulted in a reduction of 14% of the integral of over demand in the sector; shifting flights by and min reduced this value by 20% and 80% in comparison with the original scenario, respectively. The min shift was comparable to moderate speed control for arriving fights, which has already been shown to be operationally feasible during flight tests [26]. For future studies, there is the potential to control aircraft arrival flow at hotspots to reduce conflicts among the surrounding air traffic. Collaborating with the enhanced LR-ATFM concept, which targets shifting the entry time of long-haul flights at hotspot areas, provides the possibility to compose ideal traffic patterns with less control of aircraft departure times.
5.3. Expansion to General Methods and Their Applications
This paper focused on FRA operation in the ASEAN airspace; however, the proposed model-based method is generally applicable to controlling time-varying air traffic. Although the number of flights is expected to increase in the future, the available airspace/airports are limited and traffic demands must be balanced with available capacity. The requirements for efficient ATM are increasing and it is expected that the flights are not only carried out punctually and safely, but that they are also environmentally friendly and economically affordable. Furthermore, the number of ATCos need to be minimized according to the increasing air traffic. This extensive catalog of criteria limits the options for efficient management and requires a holistic, integrative approach. Accordingly, our study proposed a model-based framework that enables time-varying control while balancing air traffic flows. In a concurrent project, we have been designing time-varying queuing network models to propose integrated departure and surface operations as part of a holistic framework [17]. In this way, future works extend the proposed model-based methods and their general applications in ATM, and could have an even wider range in future mobility systems.
6. Conclusions
This paper proposed a novel modeling and simulation framework for composing ideal patterns of time-varying air traffic. Assuming FRA operation in the ASEAN airspace, a series of FTS experiments were conducted to identify clusters of potential hotspot areas. Features of air traffic were also analyzed to understand the characteristics of air traffic complexity in an FIR of ASEAN airspace. Based on the analysis through the simulation results, we designed a queuing network model that consisted of multiple time-varying fluid queues. It enabled us to segregate interfered air traffic at the hot spot area towards composing ideal traffic patterns. To evaluate the effectiveness of untangling the air traffic complexity through the proposed queuing network approach, another series of FTS simulation experiments were conducted. As a result, it successfully reduced the maximum 45% of air traffic conflicts in the target hotspot clusters by controlling the aircraft departure time in two major traffic flows. These results justified that ATFM functions could be addressed to realize better ATS provision in ASEAN FRA operation. Our conceptual approach contributed to designing the interplay of functions that ASEAN partners would have to consider when introducing FRA operation. Lastly, we discussed the future extension of our proposed model-based approach. Towards realization of ASEAN FRA operation, further efforts would be aimed at balancing local effects of hotspot reduction in the wider regional network in the ASEAN airspace. Not only departure controls, but also strategic arrival traffic flow control would be one of the other options. This paper focused on the FRA operation in the ASEAN airspace; however, the proposed model-based method is generally applicable to controlling time-varying air traffic. The proposed modeling framework will be generally applied to designing future air traffic management and mobility systems.
Author Contributions
Conceptualization, E.I., K.T., M.S. and V.N.D.; methodology, E.I. and K.T.; software, E.I. and K.T.; validation, E.I. and K.T.; formal analysis, K.T. and E.I.; investigation, K.T., M.S. and E.I.; resources, K.T.; data curation, K.T.; writing—original draft preparation, E.I. and K.T.; writing—review and editing, E.I., K.T. and M.S.; visualization, E.I. and K.T.; supervision, M.S. and V.N.D.; project administration, K.T. and V.N.D.; funding acquisition, V.N.D. All authors have read and agreed to the published version of the manuscript.
Funding
This research is supported by the National Research Foundation, Singapore, and the Civil Aviation Authority of Singapore, under the Aviation Transformation Programme. Any opinions, findings and conclusions or recommendations expressed in this material are those of the author(s) and do not reflect the views of National Research Foundation, Singapore and the Civil Aviation Authority of Singapore.
Data Availability Statement
The data presented in this study are available upon request from the corresponding author. The data are not publicly available because the source data are commercially available by a data vendor.
Acknowledgments
The authors wish to thank Athota Srinivas at Air Traffic Management Research Institute, Nanyang Technological University Singapore for his technical support in the Fast-Time Simulation.
Conflicts of Interest
The authors declare no conflicts of interest. The funder had no role in the design of the study; in the collection, analyses, or interpretation of data; in the writing of the manuscript; or in the decision to publish the results.
References
- Kraus, J. Free Route Airspace (FRA) in Europe. Perner’s Contacts 2011, 6, 129–135. [Google Scholar]
- Renner, P.; Rohacs, D.; Papp, G.; Kling, F. The effects of the introduction of Free Route (HUFRA, Hungarian Free Route Airspace) in the Hungarian Airspace. In Proceedings of the 8th SESAR Innovation Days, Salzburg, Austria, 3–7 December 2018; pp. 1–8. [Google Scholar]
- Duong, V.; Gawinowski, G.; Nicolaon, J.P.; Nguyen, H.H. Sector-less air traffic management: Initial investigations. Air Traffic Control Q. 2002, 10, 379–393. [Google Scholar] [CrossRef]
- Birkmeier, B. Feasibility Analysis of Sectorless and Partially Automated Air Traffic Management. Ph.D. Thesis, Technische Universität Braunschweig, Braunschweig, Germany, 2015. [Google Scholar]
- Korn, B.; Mollwitz, V.; Finck, T.; Edinger, C. Validating sectorless ATM in the Hungarian airspace: Results of human in the loop simulations. In Proceedings of the 2020 Integrated Communications Navigation and Surveillance Conference (ICNS), Herndon, VA, USA, 8–10 September 2020. [Google Scholar]
- Martins, A.P.G.; Finck, T.; Mollwitz, V.; Kling, F.; Rohács, D. Feasibility study of flight centric mode of operations—A human performance approach. In Proceedings of the 9th SESAR Innovation Days, Athens, Greece, 3–5 December 2019. [Google Scholar]
- Sergeeva, M.; Delahaye, D.; Mancel, C.; Vidosavljevic, A. Dynamic airspace configuration by genetic algorithm. J. Traffic Transp. Eng. 2017, 4, 300–314. [Google Scholar] [CrossRef]
- Gerdes, I.; Temme, A.; Schultz, M. Dynamic airspace sectorisation for flight-centric operations. Transp. Res. Part C Emerg. Technol. 2018, 95, 460–480. [Google Scholar] [CrossRef]
- Djokic, J.; Lorenz, B.; Fricke, H. Air traffic control complexity as workload driver. Transp. Res. Part C Emerg. Technol. 2010, 18, 930–936. [Google Scholar] [CrossRef]
- Mogford, R.; Guttman, J.; Morrow, S.L.; Kopardekar, P. The Complexity Construct in Air Traffic Control: A Review and Synthesis of the Literature; DOT/FAA/CT-TN-95/22; FAA Technical Center: Atlantic City, NJ, USA, 1995. [Google Scholar]
- Gerdes, I.; Temme, A.; Schultz, M. From free-route air traffic to an adapted dynamic main-flow system. Transp. Res. Part C Emerg. Technol. 2020, 115, 102633. [Google Scholar] [CrossRef]
- Bin Jumad, A.S.; Tominaga, K.; Chua, X.Y.; Itoh, E.; Schultz, M.; Duong, V.N. Flow-Centric Air Traffic Control: Human in the Loop Simulation Experiment. In Proceedings of the 42nd Digital Avionics Systems Conference (DASC), Barcelona, Spain, 1–5 October 2023. [Google Scholar]
- Tominaga, K.; Wen Chen, A.K.; Sultana, J.; Schultz, M.; Itoh, E.; Duong, V. Operational Feasibility Assessment of the Free Route Airspace Concept in ASEAN Reasion. In Proceedings of the 26th Air Transport Research Society (ATRS) World Conference, Kobe, Japan, 1–4 July 2023. [Google Scholar]
- Higasa, K.; Itoh, E. Controlling Aircraft Inter-Arrival Time to Reduce Arrival Traffic Delay via a Queue-Based Integer Programming Approach. Aerospace 2022, 9, 663. [Google Scholar] [CrossRef]
- Itoh, E.; Mitici, M.; Schultz, M. Modeling Aircraft Departure at a Runway Using a Time-Varying Fluid Queue. Aerospace 2022, 9, 119. [Google Scholar] [CrossRef]
- Higasa, K.; Sekine, K.; Itoh, E. Effectiveness of Aircraft Inter-Arrival Control in Upstream Traffic Flow via a Combined Tandem Fluid Queue Model and Integer Programming Approach. IEEE Access 2023, 11, 15252–15270. [Google Scholar] [CrossRef]
- Itoh, E.; Schultz, M. Designing a Framework of Integrated Aircraft Departure and Surface Traffic Operation via Queuing Network Models. In Proceedings of the Fifteenth USA/Europe Air Traffic Management Research and Development Seminar (ATM2023), Savannah, GA, USA, 5–9 June 2023. [Google Scholar]
- Dijkstra, E.W. A note on two problems in connexion with graphs. Numer. Mat. 1959, 1, 269–271. [Google Scholar] [CrossRef]
- Granger, G.; Durand, N. A traffic complexity approach through cluster analysis. In Proceedings of the 5th ATM R&D Seminar, Budapest, Hungary, 23–27 June 2003; pp. 1–10. [Google Scholar]
- Schultz, M.; Lubig, D.; Rosenow, J.; Itoh, E.; Athota, S.; Duong, V.N. Concept of a Long-Range Air Traffic Flow Management. In Proceedings of the SESAR Innovation Days, Virtual, 7–10 December 2020. [Google Scholar]
- Ma, C.; Alam, S.; Qing, C.; Delahaye, D. Dynamic air traffic flow coordination for flow-centric airspace management. In Proceedings of the Fifteenth USA/Europe Air Traffic Management Research and Development Seminar (ATM2023), Savannah, GA, USA, 5–9 June 2023. [Google Scholar]
- Liu, Y.; Whitt, W. The Gt/GI/st+GI many-server fluid queue. Queueing Syst. 2012, 71, 405–444. [Google Scholar] [CrossRef]
- Whitt, W. Time-Varying Queues. Queueing Model. Serv. Manag. 2018, 1, 79–164. [Google Scholar]
- AirtopSoft: AirTOp Software. Available online: https://airtopsoft.com/ (accessed on 22 February 2020).
- Schultz, M.; Lubig, D.; Asadi, E.; Rosenow, J.; Itoh, E.; Athota, S.; Duong, V.N. Implementation of a Long-Range Air Traffic Flow Management for the Asia-Pacific Region. IEEE Access 2021, 9, 124640–124659. [Google Scholar] [CrossRef]
- ICAO. Long range ATFM concept trials. In Proceedings of the 8th Meeting of the Asia/Pacific ATFM Steering Group (ATFM/SG/8), New Delhi, India, 14–18 May 2018. [Google Scholar]
Figure 1.
Outline drawing of airspace configuration in the ASEAN region [20].
Figure 1.
Outline drawing of airspace configuration in the ASEAN region [20].

Figure 2.
The six most frequently visited clusters of air traffic flow with hypothetical free routes in the airspace approximately where the Singapore ACC covers. The dotted line indicates the free route within the Singapore FIR, while the solid line represents the hotspot area.
Figure 2.
The six most frequently visited clusters of air traffic flow with hypothetical free routes in the airspace approximately where the Singapore ACC covers. The dotted line indicates the free route within the Singapore FIR, while the solid line represents the hotspot area.

Figure 3.
Histogram of flight times in the C80 area corresponding to each air traffic flow.

Figure 4.
Queuing network model representing air traffic in the C80 hotspot.

Figure 5.
Time-varying traffic volumes corresponding to each air traffic flow in the C80 hotspot.

Figure 6.
Schematic diagram for major flows that transit through C80. The dotted line represents the C80 area, while the arrows indicate the direction of air traffic. The departures from WMKK and WSSS that were controlled for their departure time are indicated by an asterisk (*).
Figure 6.
Schematic diagram for major flows that transit through C80. The dotted line represents the C80 area, while the arrows indicate the direction of air traffic. The departures from WMKK and WSSS that were controlled for their departure time are indicated by an asterisk (*).

Figure 7.
Time-varying TV in Case 1.

Figure 8.
Time-varying TV in Case 2.

Figure 9.
Time-varying TV in Case 3.

Figure 10.
Schematic description of departure time-spacing constraints considered at WMKK or WSSS, in which we indicate the longitudinal time spacing in seconds. The dashed line represents the adjustment of departure times for selected aircraft. Departure time-spacing requirements (minimum interval of 90 s) considered are signified in orange.

Figure 11.
Geographical location of the observed potential conflicts for the baseline scenario and the Case 2 scenario. Red symbols indicate the potential conflict locations involving WMKK or WSSS departures, while the black symbols indicate the potential conflict locations involving neither WMKK nor WSSS departures. The polygon represents a portion of the airspace within the Singapore FIR, while the red dashed lines emphasize areas where new conflicts have arisen.


Table 1.
Composition of flights participating in the six most frequently visited clusters of flow intersections in the areas controlled by the Singapore ACC. Values are the mean daily throughput based on a 15-day period (13–27 December 2019). The present study uses one simulation day (H24), 14 December 2019, 0000-2359 UTC, instead of all 15 days, due to computational constraints in the application of the system of fluid queues. The flow composition is most varied hour-to-hour, rather than day-to-day, so H24 is considered to maintain the representability of the temporary heterogeneity of the traffic.
| Flow Group | C68 | C45 | C80 | C85 | C93 | C96 | Total in Singapore ACC (For Reference) |
|---|---|---|---|---|---|---|---|
| WMKK arrivals | 45 | 0 | 61 | 0 | 45 | 61 | 293 |
| WMKK departures | 6 | 70 | 40 | 6 | 6 | 62 | 236 |
| WSSS arrivals | 141 | 141 | 147 | 141 | 100 | 6 | 496 |
| WSSS departures | 54 | 73 | 127 | 0 | 0 | 54 | 496 |
| Others | 9 | 15 | 15 | 14 | 8 | 18 | 333 |
| Sum | 255 | 299 | 390 | 161 | 159 | 201 | 1854 |
Table 2.
Estimating WSSS/WMKK departure delays.
| Case 1 | Case 2 | Case 3 | ||||
|---|---|---|---|---|---|---|
| WSSS Dep | WMKK Dep | WSSS Dep | WMKK Dep | WSSS Dep | WMKK Dep | |
| Number of delayed aircraft (ac) | 109 | 32 | 78 | 22 | 45 | 19 |
| Rate of delayed aircraft (%) | 85 | 84 | 61 | 58 | 35 | 50 |
| Max. delay time (min) | 625 | 545 | 80 | 125 | 35 | 40 |
| Average delay time (min) | 190 | 201 | 23 | 43 | 19 | 16 |
| Total delay time (min) | 20,695 | 6440 | 1780 | 955 | 655 | 305 |
Table 3.
Design of experiment.
| Designation | Segregation Threshold | Remarks |
|---|---|---|
| Case 1 | Strict model application | |
| Case 2 | Medium strictness model application | |
| Case 3 | Weak model application | |
| Baseline | n/a | No queuing network model |
Table 4.
Potential conflicts observed in fast-time simulation, with various strictness levels for the queuing network model application. Here, a potential conflict is considered controllable with the breakdown shown in italics if at least one of the two aircraft forming the potential conflict is either a WMKK departure or a WSSS departure.
| Area | Case 1 | Case 2 | Case 3 | Baseline |
|---|---|---|---|---|
| inside C80 | 13 | 12 | 18 | 22 |
| controllable | 2 | 1 | 7 | 11 |
| not controllable | 11 | 11 | 11 | 11 |
| outside C80 | 25 | 35 | 35 | 28 |
| sum | 38 | 47 | 53 | 50 |
Table 5.
Composition of potential conflicts with the bold face indicating the classification of flow group pairs based on presence of WMKKdep and/or WSSSdep.
Table 5.
Composition of potential conflicts with the bold face indicating the classification of flow group pairs based on presence of WMKKdep and/or WSSSdep.
| Flow Group Pair | Case 1 | Case 2 | Case 3 | Baseline | Remarks |
|---|---|---|---|---|---|
| Involves WMKKdep | |||||
| Others_WMKKdep | 1 | 5 | 3 | 3 | Mixed |
| WMKKarr_WMKKdep | 2 | 1 | 2 | 2 | Mixed |
| WMKKdep_WSSSarr | 6 | 4 | 6 | 9 | Improvement |
| Involves WSSSdep | |||||
| Others_WSSSdep | 0 | 2 | 5 | 4 | Improvement |
| WMKKarr_WSSSdep | 5 | 6 | 6 | 7 | Improvement |
| WSSSarr_WSSSdep | 0 | 6 | 8 | 7 | Improvement |
| WSSSdep_WSSSdep | 13 | 7 | 7 | 0 | Deterioration |
| Involves both WMKKdep and WSSSdep | |||||
| WMKKdep_WSSSdep | 0 | 5 | 5 | 7 | Improvement |
| Involves neither WMKKdep nor WSSSdep | |||||
| Others_WMKKarr | 1 | 1 | 1 | 1 | No change |
| WMKKarr_WMKKarr | 1 | 1 | 1 | 1 | No change |
| WMKKarr_WSSSarr | 6 | 6 | 6 | 6 | No change |
| WSSSarr_WSSSarr | 3 | 3 | 3 | 3 | No change |
Disclaimer/Publisher’s Note: The statements, opinions and data contained in all publications are solely those of the individual author(s) and contributor(s) and not of MDPI and/or the editor(s). MDPI and/or the editor(s) disclaim responsibility for any injury to people or property resulting from any ideas, methods, instructions or products referred to in the content. |
© 2023 by the authors. Licensee MDPI, Basel, Switzerland. This article is an open access article distributed under the terms and conditions of the Creative Commons Attribution (CC BY) license (https://creativecommons.org/licenses/by/4.0/).
Share and Cite
MDPI and ACS Style
Itoh, E.; Tominaga, K.; Schultz, M.; Duong, V.N. Untangling Complexity in ASEAN Air Traffic Management through Time-Varying Queuing Models. Aerospace 2024, 11, 11. https://doi.org/10.3390/aerospace11010011
AMA Style
Itoh E, Tominaga K, Schultz M, Duong VN. Untangling Complexity in ASEAN Air Traffic Management through Time-Varying Queuing Models. Aerospace. 2024; 11(1):11. https://doi.org/10.3390/aerospace11010011
Chicago/Turabian StyleItoh, Eri, Koji Tominaga, Michael Schultz, and Vu N. Duong. 2024. "Untangling Complexity in ASEAN Air Traffic Management through Time-Varying Queuing Models" Aerospace 11, no. 1: 11. https://doi.org/10.3390/aerospace11010011
Note that from the first issue of 2016, this journal uses article numbers instead of page numbers. See further details here.