Working Capital: Development of the Field through Scientific Mapping: An Updated Review


1
Department of Finance and Accounting, Faculty of Business, Finance and Tourism, Universidad de Extremadura, Avda. de la Universidad, 10071 Cáceres, Spain
2
Department of Economics, Universidad de Extremadura, Avda. Adolfo Suárez, s/n, 06007 Badajoz, Spain
*
Author to whom correspondence should be addressed.
Adm. Sci. 2024, 14(4), 67; https://doi.org/10.3390/admsci14040067
Submission received: 10 February 2024
/
Revised: 23 March 2024
/
Accepted: 25 March 2024
/
Published: 1 April 2024
Abstract
:Throughout history, the analysis of companies’ financial structure has been approached from different angles, with different areas of the overall financial situation being separated and studied independently in order to improve understanding. Within the framework of short-cycle analysis and, more specifically, of the cash flow statement, it is of vital importance for a company to manage an adequate proportion of working capital, and this is where the focus of the present work is centred. This study was carried out to offer support to the theoretical framework for future research on working capital, given its importance for the analysis of the operational cycle of companies. This study uses bibliometric techniques to gain a better understanding of the current situation and trends in this area of research. The results are framed in all of the periods in which work on working capital has been documented, which are divided into two periods: up to 2019, and from 2020 to 2024. The results show the current evolution of the topics, with supplier credit dominating, and indicate potential topics for further research to address in this area.
1. Introduction
Working capital (Zimon and Tarighi 2021) is a concept used to analyse the liquidity position of companies. It is also referred to in the literature as net working capital (NWC). It is calculated by simply subtracting current liabilities from current assets and is, therefore, a routine part of day-to-day business. Its management includes cash, accounts receivable (AR), accounts payable (AP), and inventories (INV). Table 1 shows some common definitions of working capital in different areas.
While working capital can mitigate the impact of cash flow shortages (Zimon and Tarighi 2021), poor management can lead to bankruptcy. Therefore, proper capital management is critical to a company’s performance and survival, particularly in uncertain or difficult economic times and situations. The starting point for effective working capital management is a key part of a company’s overall strategy to increase profitability (Nazir et al. 2007). This can result in increased profitability (Azhar et al. 2010; Ren et al. 2019), which, in turn, means more opportunities for business growth and higher returns for shareholders. These indicators also increase investor confidence and make investment more attractive. Investors’ willingness to invest increases the company’s share price and ultimately increases its market value (Sudiyatno et al. 2017). Therefore, working capital management strategies and working capital management indicators may have a causal relationship that influences performance, including profitability and market value. In many works, the positive effects of working capital for companies are pointed out; this is the case for the work of Ponsian (2014), who established working capital as a determining factor of profitability, just as is the case for non-financial companies (Mwangi et al. 2014). Other authors emphasise the benefits of working capital as a beneficial element for companies (Charitou 2016; Gorondutse et al. 2017; Knauer and Wöhrmann 2013).
Working capital management indicators capture the liquidity of a firm from two perspectives (Maleki Nia et al. 2005). Firstly, static working capital management indicators, understood as traditional liquidity ratios such as working capital ratio, are used to measure the liquidity of a company at a given point in time. Secondly, Moss and Stine (1993) show that dynamic indicators of working capital management, such as the cash conversion cycle, are used to assess the liquidity of SMEs, i.e., small and medium-sized enterprises.
Determining working capital management in the success or failure of a company plays a vital role due to its liquidity and risk, and it can be stated (Martín-De Castro and Delgado-Verde 2012) that the optimal management of working capital provides a margin of safety when a company has the ability to self-generate cash to finance its operations, and, in turn, contributes to the generation of value, mitigating the risks of falling into financial problems and, consequently, avoiding the need for external financing. The same applies to the regulation of costs (Mirón-Sanguino et al. 2021; Mirón-Sanguino et al. 2023). Working capital is necessary within a company because of the considerable number of activities carried out that generate a large number of cash movements, both in hand and in terms of banks, merchandise, inventories, and other resources used in investments, accounts receivable, and current assets (Mirón-Sanguino and Díaz-Caro 2022).
Similarly, an excess of current assets over what is necessarily efficient reduces the profitability of the investment in question in two complementary ways (Pérez-Méndez and García-Cornejo 2009): on the one hand, it can bear higher operating costs (resulting in a lower return), and on the other hand, a disproportionately higher volume of investment is being handled. In addition, it is argued that an excess of current assets can, in many cases, lead to an increased need for costly short-term borrowing, which also has a negative impact on the profit and loss account, while at the same time reducing the value of short-term liquidity ratios.
1.1. The Importance of Working Capital to Avoid Business Failure
Gitman (n.d.) argues that it is not surprising that working capital management is one of the most important and time-consuming financial activities for managers. Some experts, such as Victoria and Jiménez (2003), Almodóvar González et al. (2020), Ece and Sayılgan (2020), and Fernández-Portillo et al. (2017), reduce business failure to the simple inability to pay its stakeholders, i.e., shareholders, suppliers, or creditors. This type of business failure as a result of poor working capital management is often a key consequence of a country’s economic crisis, which can be reflected in high national unemployment, falling gross domestic product (GDP), declining foreign capital investment, and the misallocation of public revenues. In addition, business closures are seen as a major social problem, so it is important to analyse the factors associated with business failure.
During the financial crisis of 2007 and 2008, liquidity shortages highlighted the importance of short-term financial policies such as working capital management. In a related line, some researchers (Abuzayed 2012; Kaddumi and Ramadan 2012) argue that more attention should be paid to the level of working capital during periods of recession and crisis. On the other hand, US financial executives became more cautious in managing the working capital of companies after the global recession of 2008.
It is important to note (Baños-Caballero et al. 2012) that working capital affects shareholder wealth, firm value, competitiveness, liquidity, and profitability, and, therefore, companies generally seek to have well-managed working capital as any change in the level of working capital can be critical. On the other hand, various studies confirm that lower liquidity management can lead to higher positive profitability. According to Enqvist et al. (2014) and Ramiah et al. (2014), tests have shown that the current ratio ability to pay short-term debts has a negative effect on return on assets (ROA). In addition, Azhar et al. (2010) and Vahid et al. (2012) found that the current ratio has a negative impact on the market capitalisation of some companies. The researchers made measurements using Tobin’s Q, a basic profitability indicator that refers to the ratio of a company’s market capitalisation to its stock market capitalisation, tangible assets, and their replacement value, but the results were not statistically significant.
Sudiyatno et al. (2017) and Raheman et al. (2010) found that working capital investment policies have a positive effect on ROA, while working capital financing policies have a negative effect on ROA. From this study, it can be concluded that a conservative or moderate working capital investment policy and working capital financing policy will have an impact on increasing profitability. These findings are consistent with the previous empirical studies carried out by Nazir et al. (2007) and Raheman et al. (2010), which were conducted in Pakistan, and the study of Azhar et al. (2010), which focused on Malaysia.
Regarding working capital management, Kiyosaki (2011) emphasises the importance of working capital in maintaining a steady cash flow, how proper working capital management leads to the improved long-term profitability of companies, and that working capital is an important measure of a company’s financial health and its ability to meet future economic challenges. In elaborating on this proper management, Williamson (2002) addresses and discusses the issue of working capital and its influence on day-to-day business management, highlighting how working capital management can be a good way to control suppliers and customers. Furthermore, he highlights how working capital is often used as a tool to increase the negotiating position in the market, and concludes that working capital is a source of power for the company and proper working capital management is key to maintaining and increasing this power.
1.2. Influence of COVID-19 on Working Capital Policies
There is a large body of literature on working capital management and its impact on a company’s profitability during periods of normal economic conditions. However, there are very few studies on the relationship between working capital management and profitability during periods of economic crisis in general (e.g., Ramiah et al. 2014; Chambers and Cifter 2022) and during the COVID-19 pandemic in particular (e.g., Zimon and Tarighi 2021; Ghahtarani et al. 2020). This is remarkable, since the current COVID-19 crisis has had a direct impact not only on the entire international business fabric and stock markets, but also on the working capital of companies and their way of acting and managing their capital, as considered by Jalil et al. (2023) and Zheng et al. (2022), who carried out studies on possible strategies to cope with the effects of the pandemic and a possible theoretical approach to the impact of COVID-19 on working capital management.
In the aftermath of the pandemic, the business and economic sector has been severely disrupted by emergency health restrictions, and it would be worth investigating how working capital management practices have helped businesses to cope with the crisis. This issue raised in the aftermath of the 2020 pandemic has generated several studies and critical views on how the working capital of businesses can be affected and how businesses can manage it. Rogoff (2020) points out that working capital is crucial to the functioning of businesses and argues that government policies should help businesses to maintain sufficient working capital in times of pandemic, such as the one experienced a few years ago. In this sense, those companies that managed their working capital better suffered less from the effects of the pandemic, and the impact of the pandemic on working capital and profitability varied depending on the economic sector in which it operates. Some researchers Baños-Caballero et al. (2012) reported that companies in the construction sector and firms in the financial services and insurance sector experienced a fall in working capital and profitability, while firms in the technology sector were less affected by COVID-19.
In understanding the importance of the study of working capital, however, we did not find other bibliometric studies that could address the following issues:
- -
- Offer suggestions regarding concepts, theory, and methodology for future research.
- -
- Contribute to enhancing knowledge about the management of working capital, thus being able to propose new future research.
- -
- Offer practical implications related to the management of companies with regard to their operational cycle and the management of important cash items.
It is for all of these reasons that it was considered appropriate to carry out a bibliometric review of the topic in order to determine the current situation.
2. Materials and Methods
Bibliometric indicators and science mapping are fundamental techniques of bibliometric analysis that help to assess both the scientific activity and the impact of scientific research and its sources (Zambrano Farías et al. 2022). There are many works that address this part of the systematic literature review in different scientific areas (Almeida et al. 2022; Arik and Arik 2017; Dardas et al. 2023; Kirby 2023; Miguel et al. 2016; Senarathne and Malawana 2019; Vaccaro et al. 2022). These analytical metrics can be divided into two main groups: activity metrics and impact indicators. Activity metrics visualise the current state of science, including the number of publications, productivity, distribution of publications, collaborations, and average number of citations or connections between authors, among others. According to Camps, impact metrics include the assessment of highly cited articles (so-called “hot papers”) and the impact factor of a journal, the latter being the best-known indicator (“Enero-Marzo” 2008; González-Alcaide et al. 2024).
Science mapping connects networks between countries, institutions, journals, authors, and keywords. It also allows us to identify emerging research trends and topics. Both techniques can be complementary and enable us to understand how documents, authors, keywords, or disciplines are related to each other (Small 1999).
The SciMAT software was used to analyse the importance of the working capital topic, as has already been achieved in other scientific mapping works (García-López and Pérez-Hernández 2024). This software has been used and compared to others such as VosViewer to analyse all of the scientific material hosted on the Web of Science because this database is the one with the greatest impact at an international level compared to other databases such as Scopus or EBSCO. This analysis confirms the importance of the proposed subject. Bibliometrics are generally used to evaluate quantitative research on scientific production, as mentioned in the previous points (Callon et al. 1991). There are two main methods in bibliometrics: performance analysis and science mapping (Van Raan 2005). Performance analysis aims to evaluate groups of scientific actors, countries, universities, departments, researchers, and the impact of their activity from the results of the bibliographic database. According to Börner et al. (2003), science mapping aims to show the structural and dynamic aspects of scientific research, and they point out that a science map can be used to represent the cognitive structure of a research field. According to De Moya-Anegón et al. (2010), several techniques have been developed to construct a science map, with the most commonly used being document co-citation and co-word analysis.
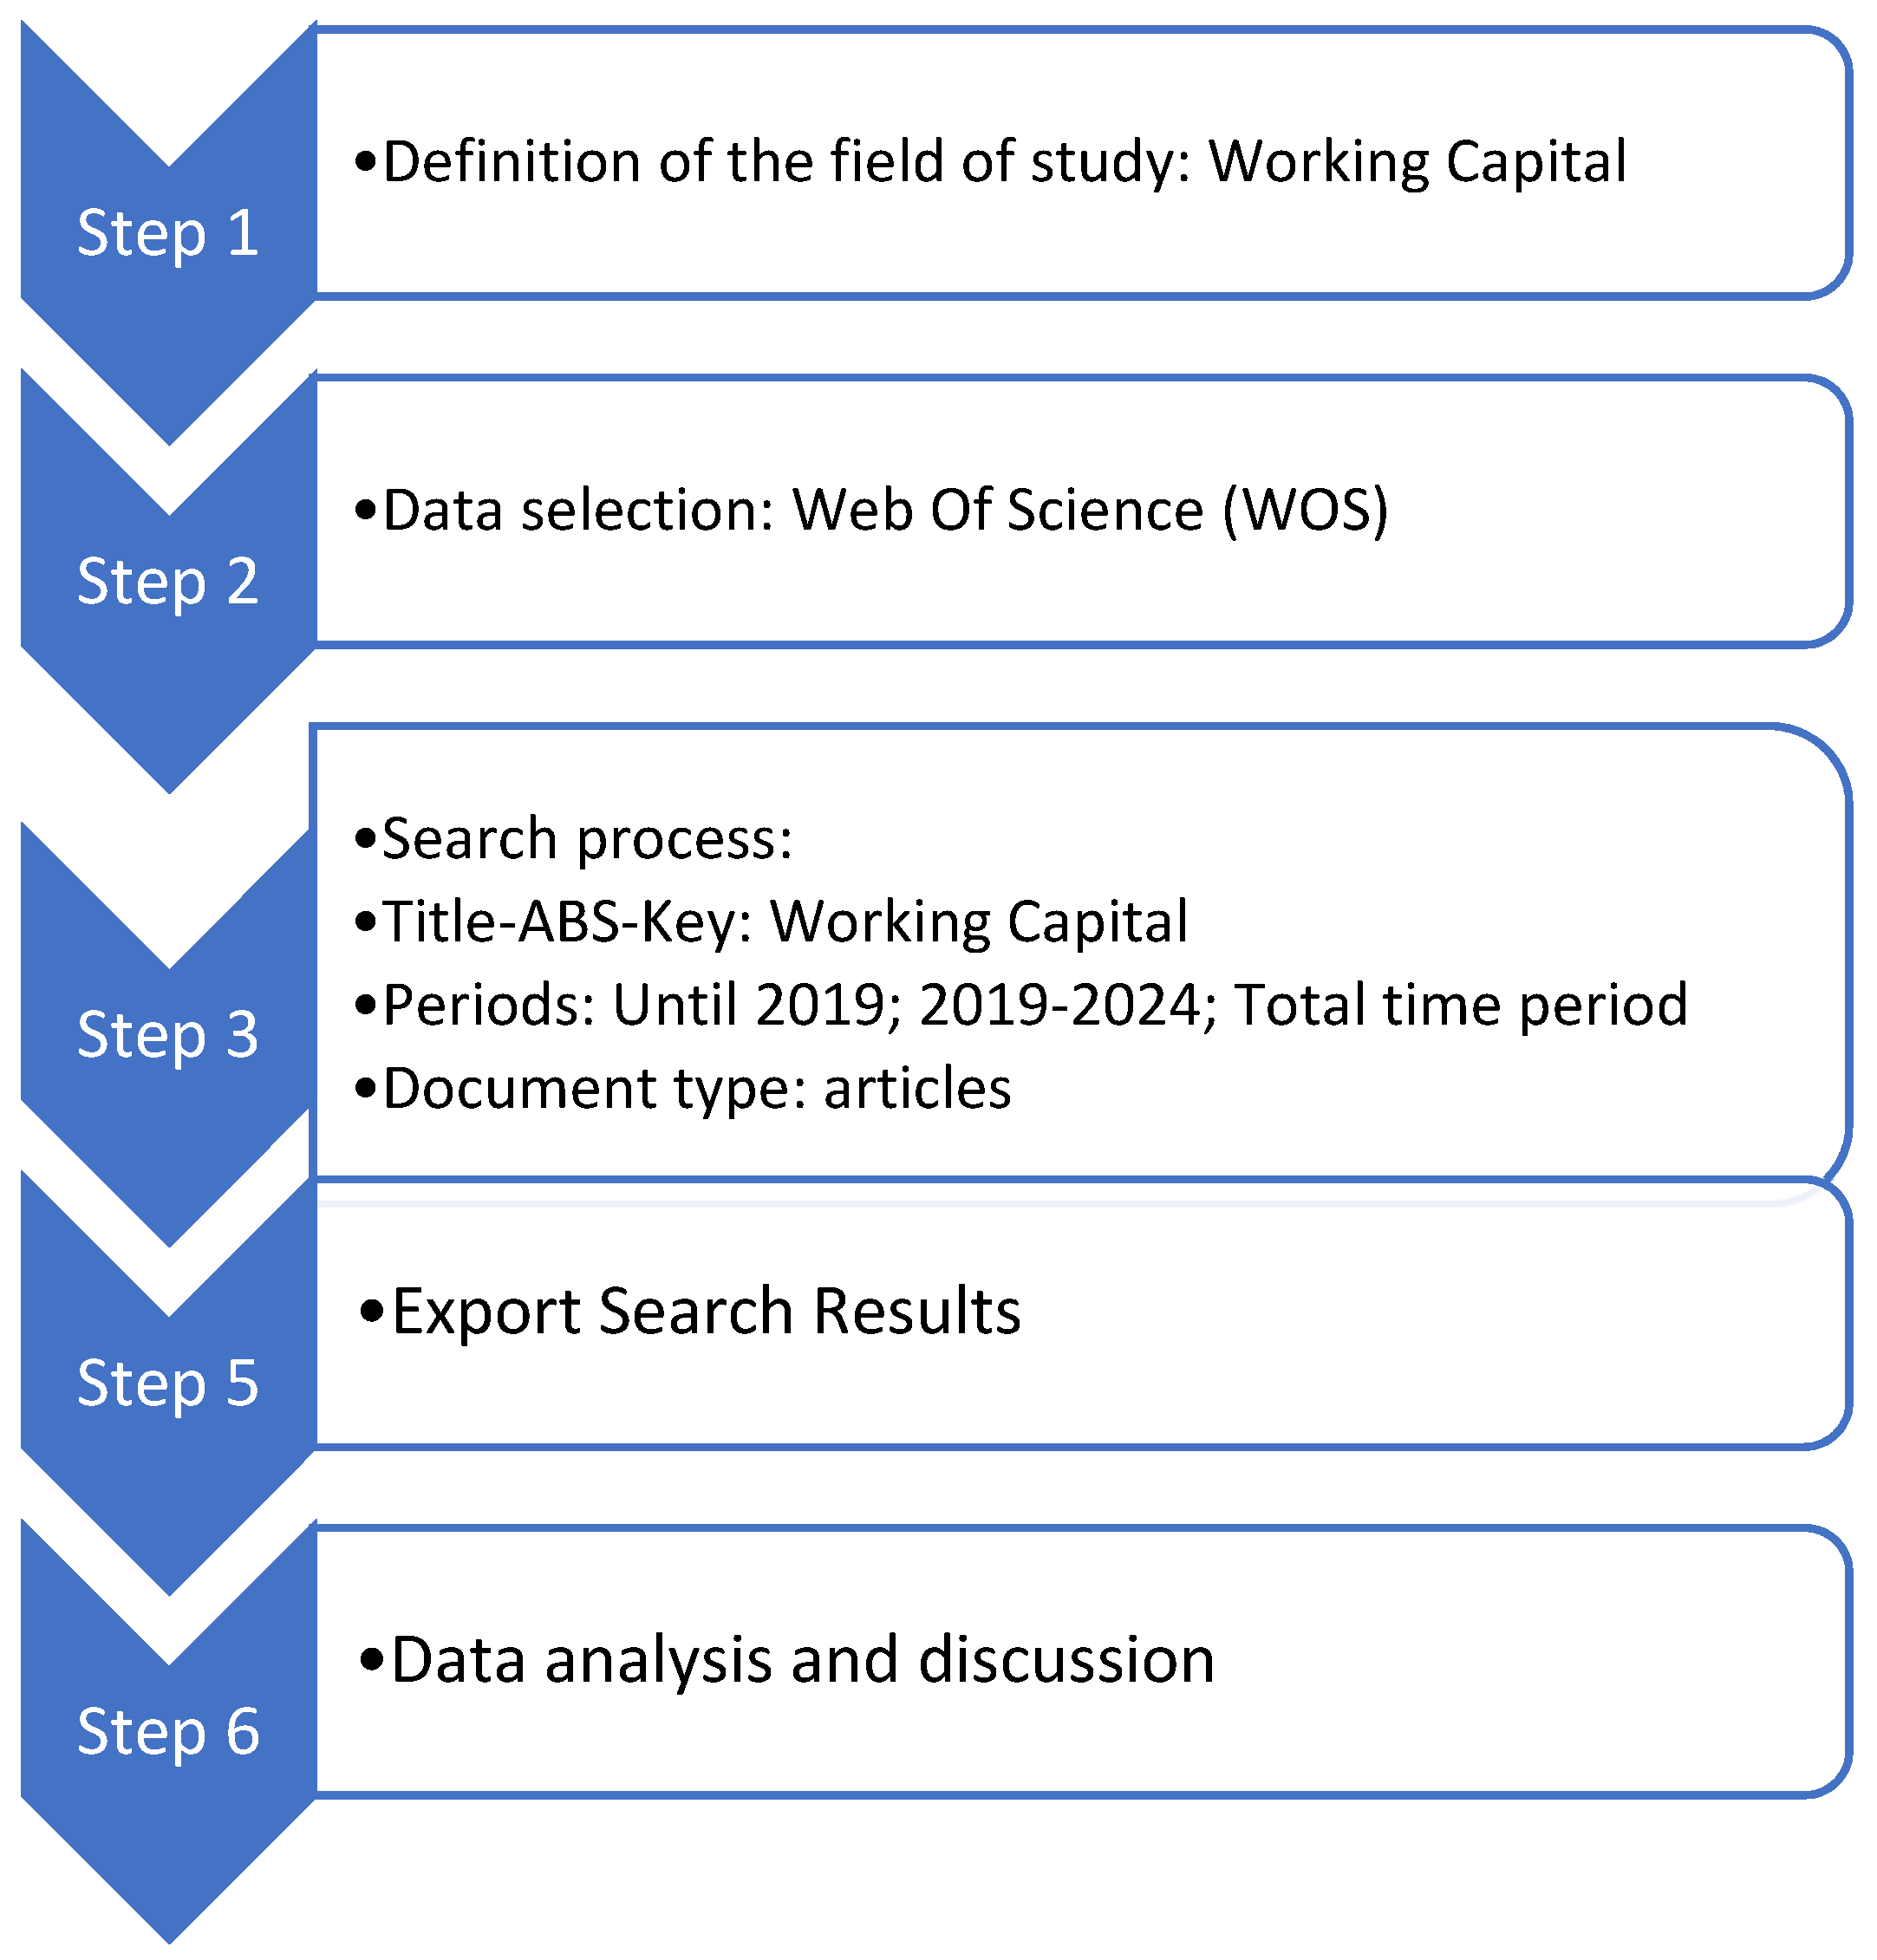
The paper shows the dynamics of the general research on the main topics and trends in working capital. For this purpose, as in the bibliometric analyses of other authors (Bach et al. 2019; López Núñez et al. 2020; Zambrano Farías et al. 2022; Cobo et al. 2012), this analysis follows the procedure shown in Figure 1.
3. Results and Discussion
The results were derived from a keyword search in Web of Science (WOS). The initial WOS search was then refined in several steps.
In a first search, the keywords “working capital”, “circulating capital”, or “rotation fund” were used. These criteria yielded a total of 3198 results, of which 1850 belonged to the main WOS collection and could be processed with SciMAT.
Subsequently, based on the previous results, a screening was carried out in the search in order to select only peer-reviewed articles, yielding a total of 1472 articles.
Next, in order to select the papers with the most similar subject to our topic of study, the term “financ*” (with the conjunction “AND”) was included in the query, from which 1273 documents were extracted. Finally, the decision was made not to filter by field. After this screening, the search produced 1273 results, which was the final sample we worked with.
The data for the bibliometric analysis were downloaded in RIS and TXT format from the WOS database and processed with SciMAT (v1.1.04) in RIS format. These sources included the complete dataset exported from WOS. The extraction was performed in two stages: a file of 1000 records and a file of 273 records, which were merged in Mendeley, resulting in the export of a single file of 1244 documents.
3.1. Themes and Thematic Network Visualisation
By using co-word analysis for mapping, clusters of keywords and their connections to each other were obtained; we will call these clusters themes. Each theme obtained in the process is characterised by the parameter’s density and centrality, both the median and the mean values of density and centrality. According to Cahlik (2007) and Callon et al. (1991), four types of themes can be found. Motor themes are themes that are well developed and important for the structure of the research field; they have a high density and a strong centrality. They are themes that are strongly related to each other. Highly developed themes have well-developed internal links but unimportant external links. They are of marginal importance for the field and do not feed into the other external themes. They are specialised and peripheral. Emerging or disappearing themes are weakly developed themes without many internal links. They may be marginal, but should still be considered. Finally, basic and cross-cutting themes are themes that are important for a field of research but not very well developed.
Cobo et al. (2012) state that the keywords in a theme and their interrelationships form a network graph, called a thematic network. Each thematic network is labelled with the name of the most significant keyword in the associated topic, usually identified by the most central keyword in the topic. We will now describe the topic analysis.
3.2. Thematic Analysis
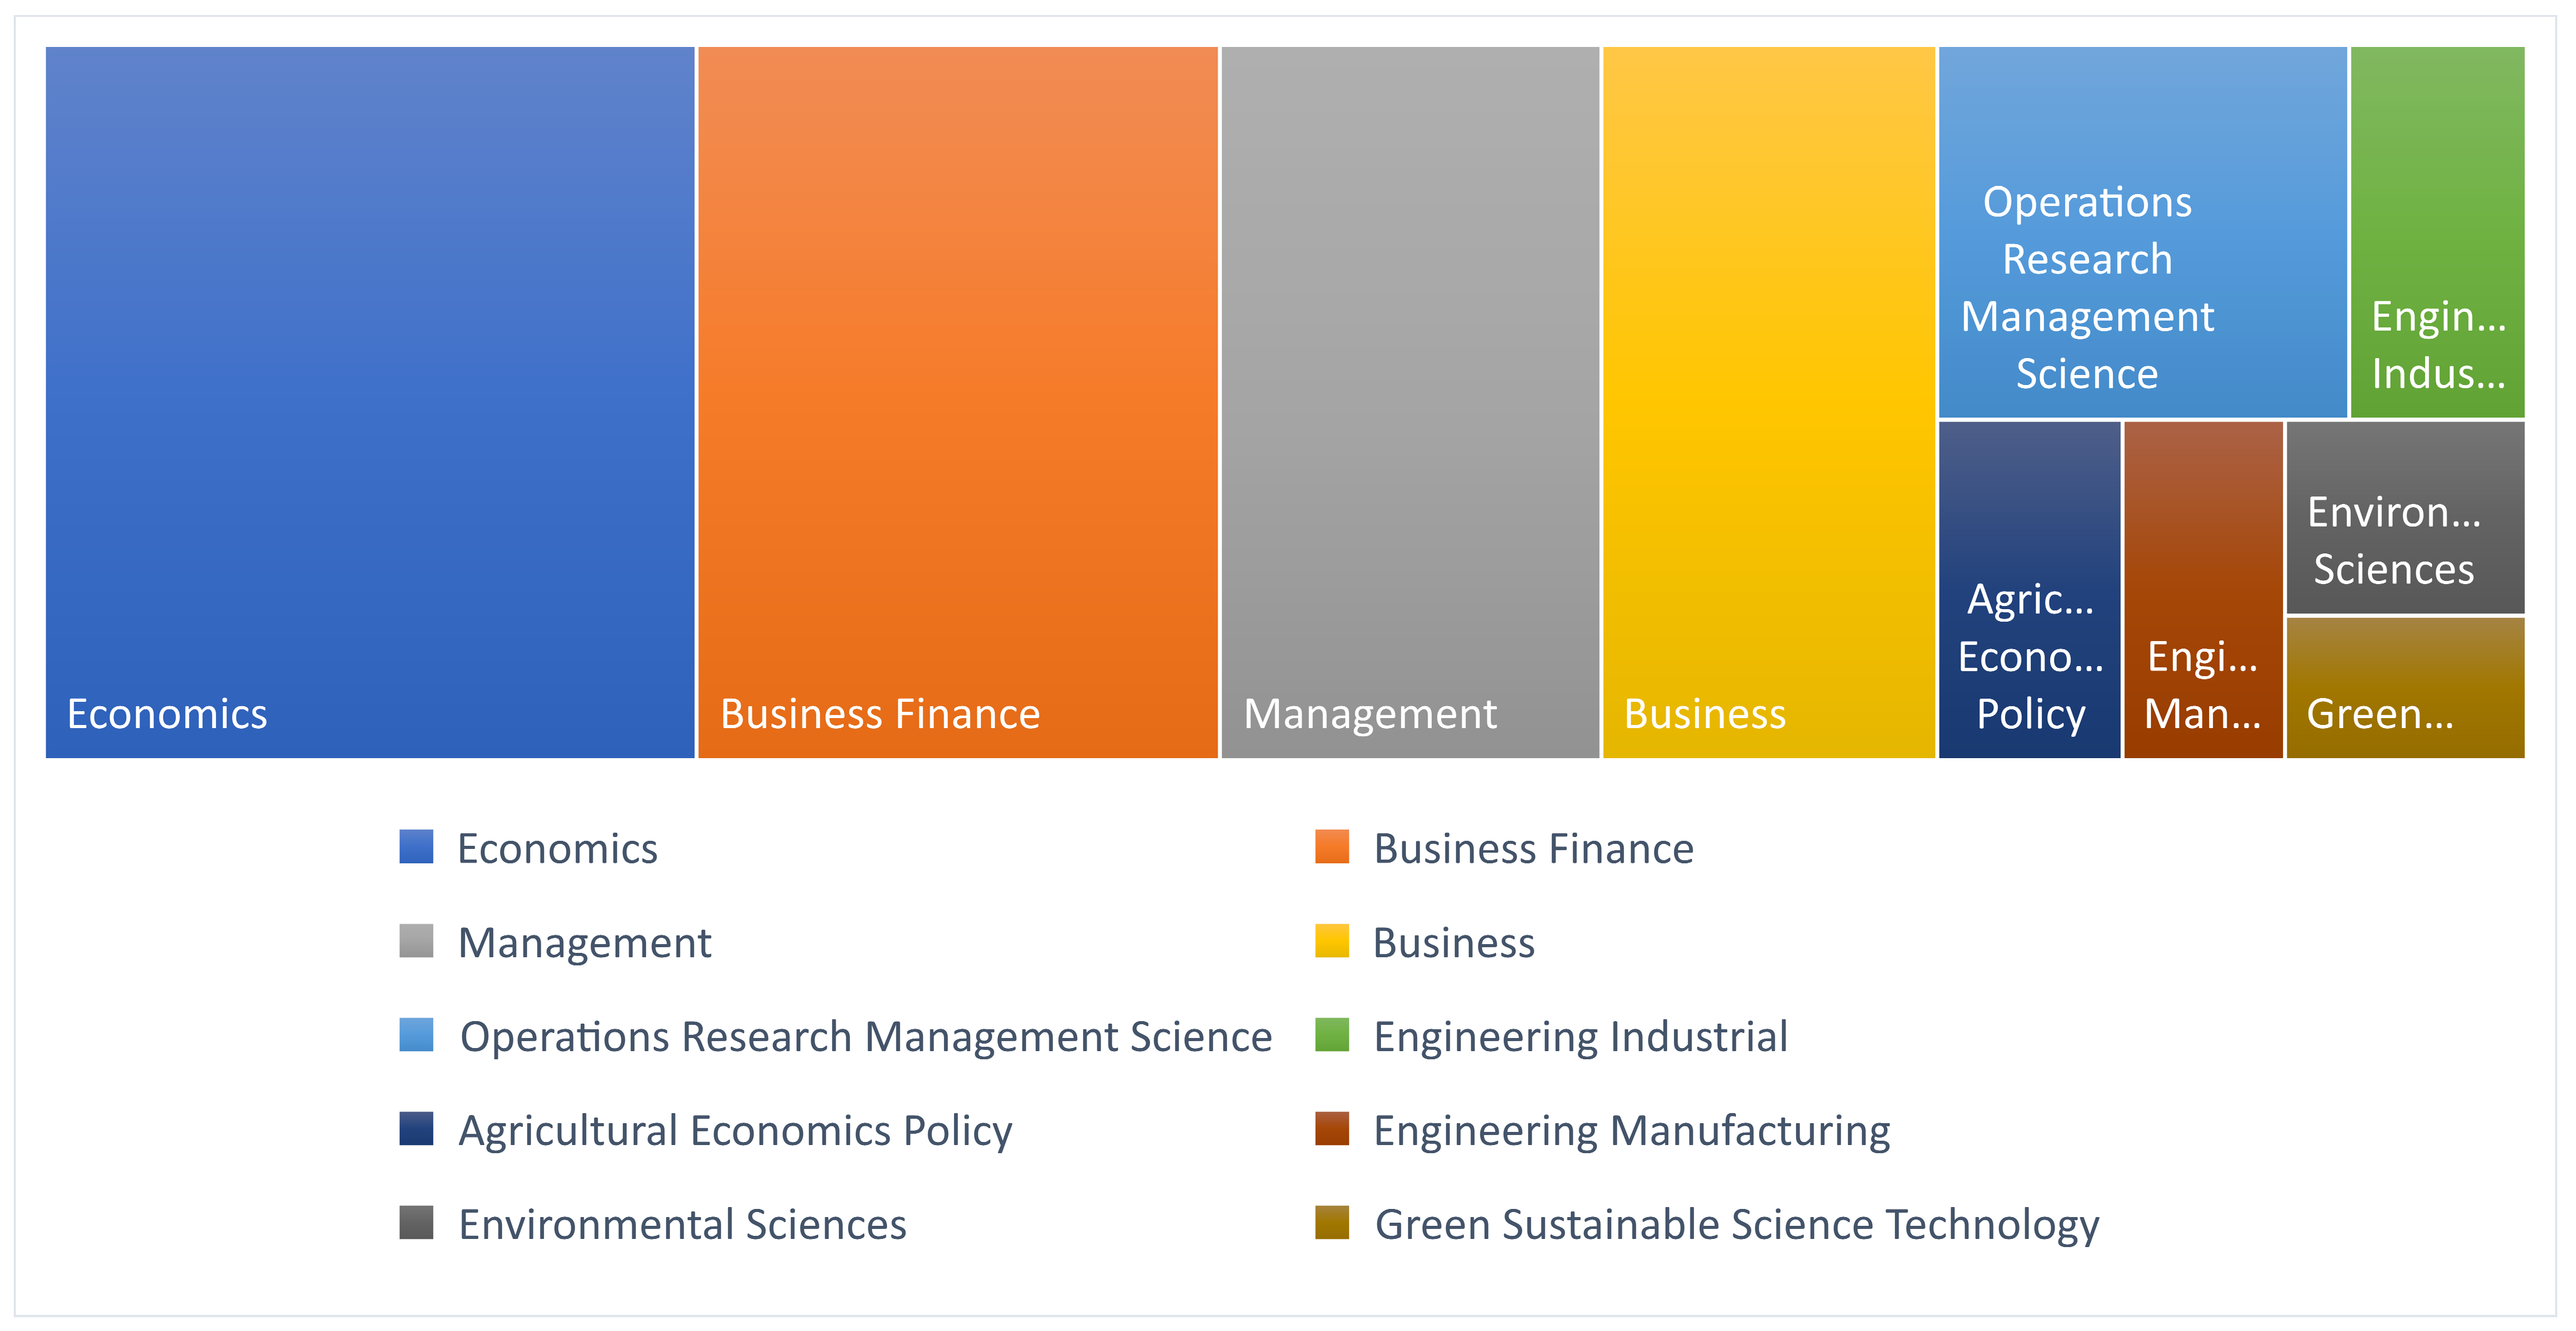
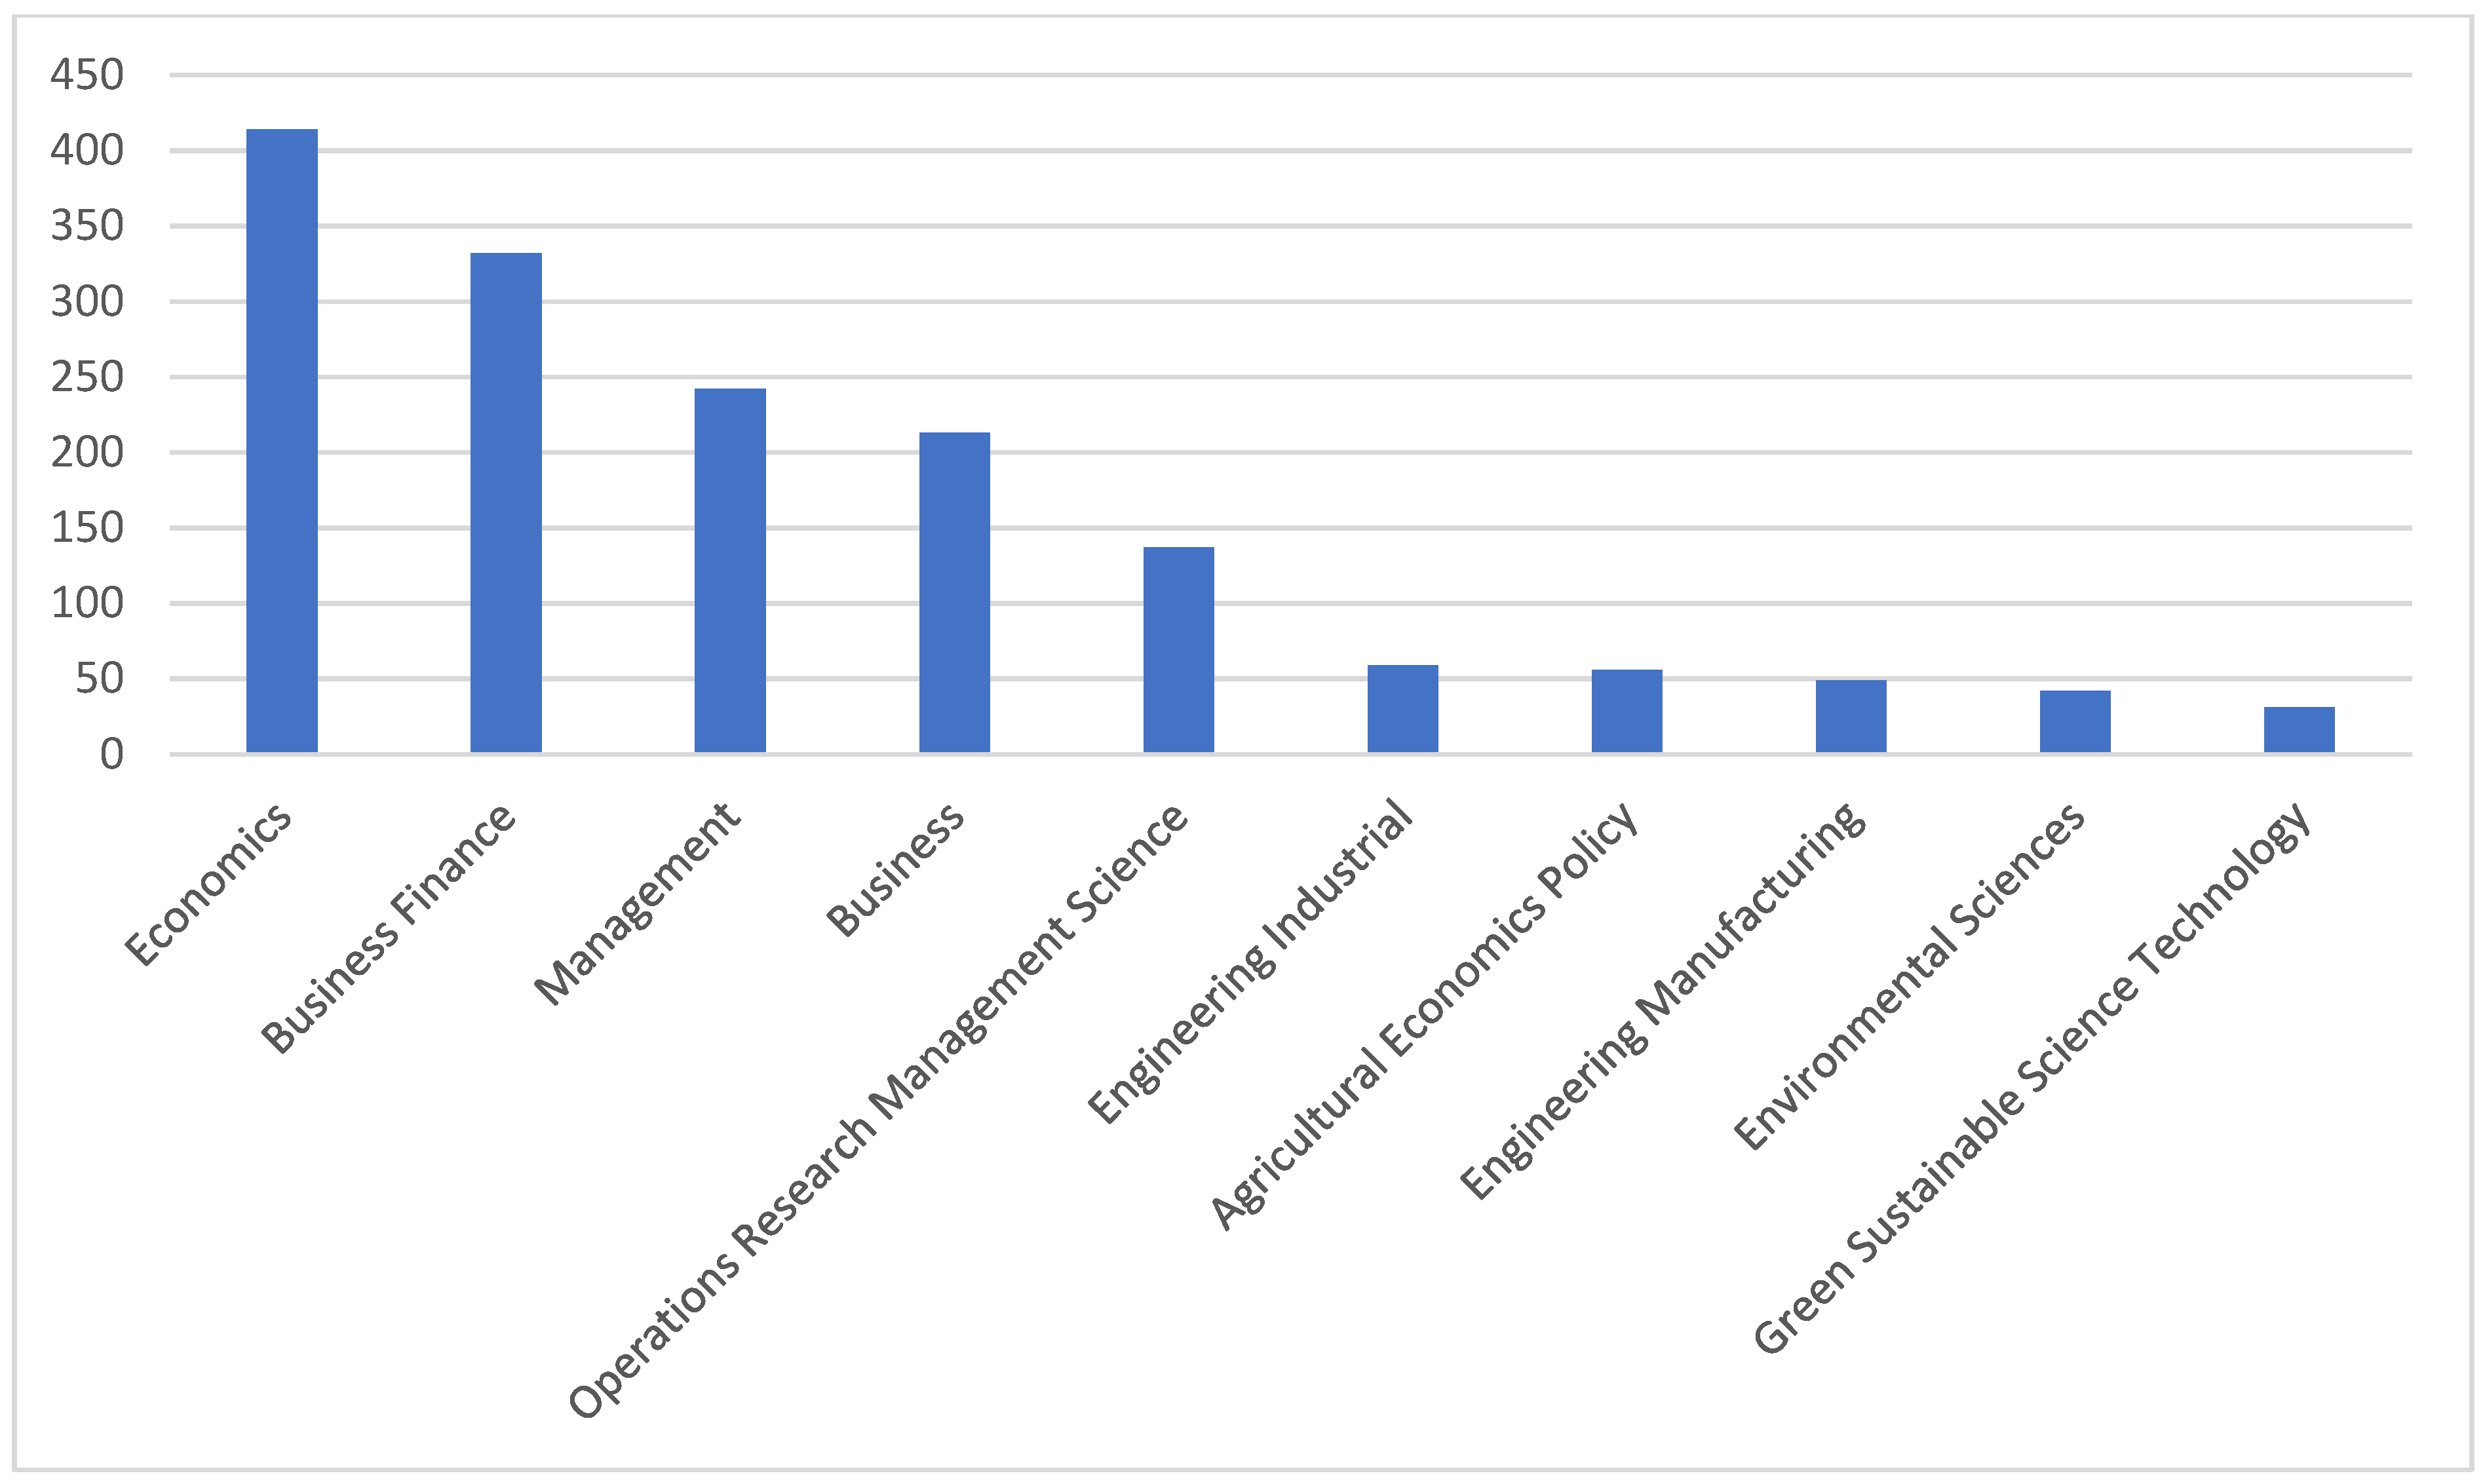
Figure 2 shows a tree map of the WOS categories. The areas are proportional to the number of papers in each field, also shown as a bar chart in Figure 3. Economics and Business Finance are the largest fields with 414 and 322 papers, respectively, followed by Management with 233 and Business with 213.
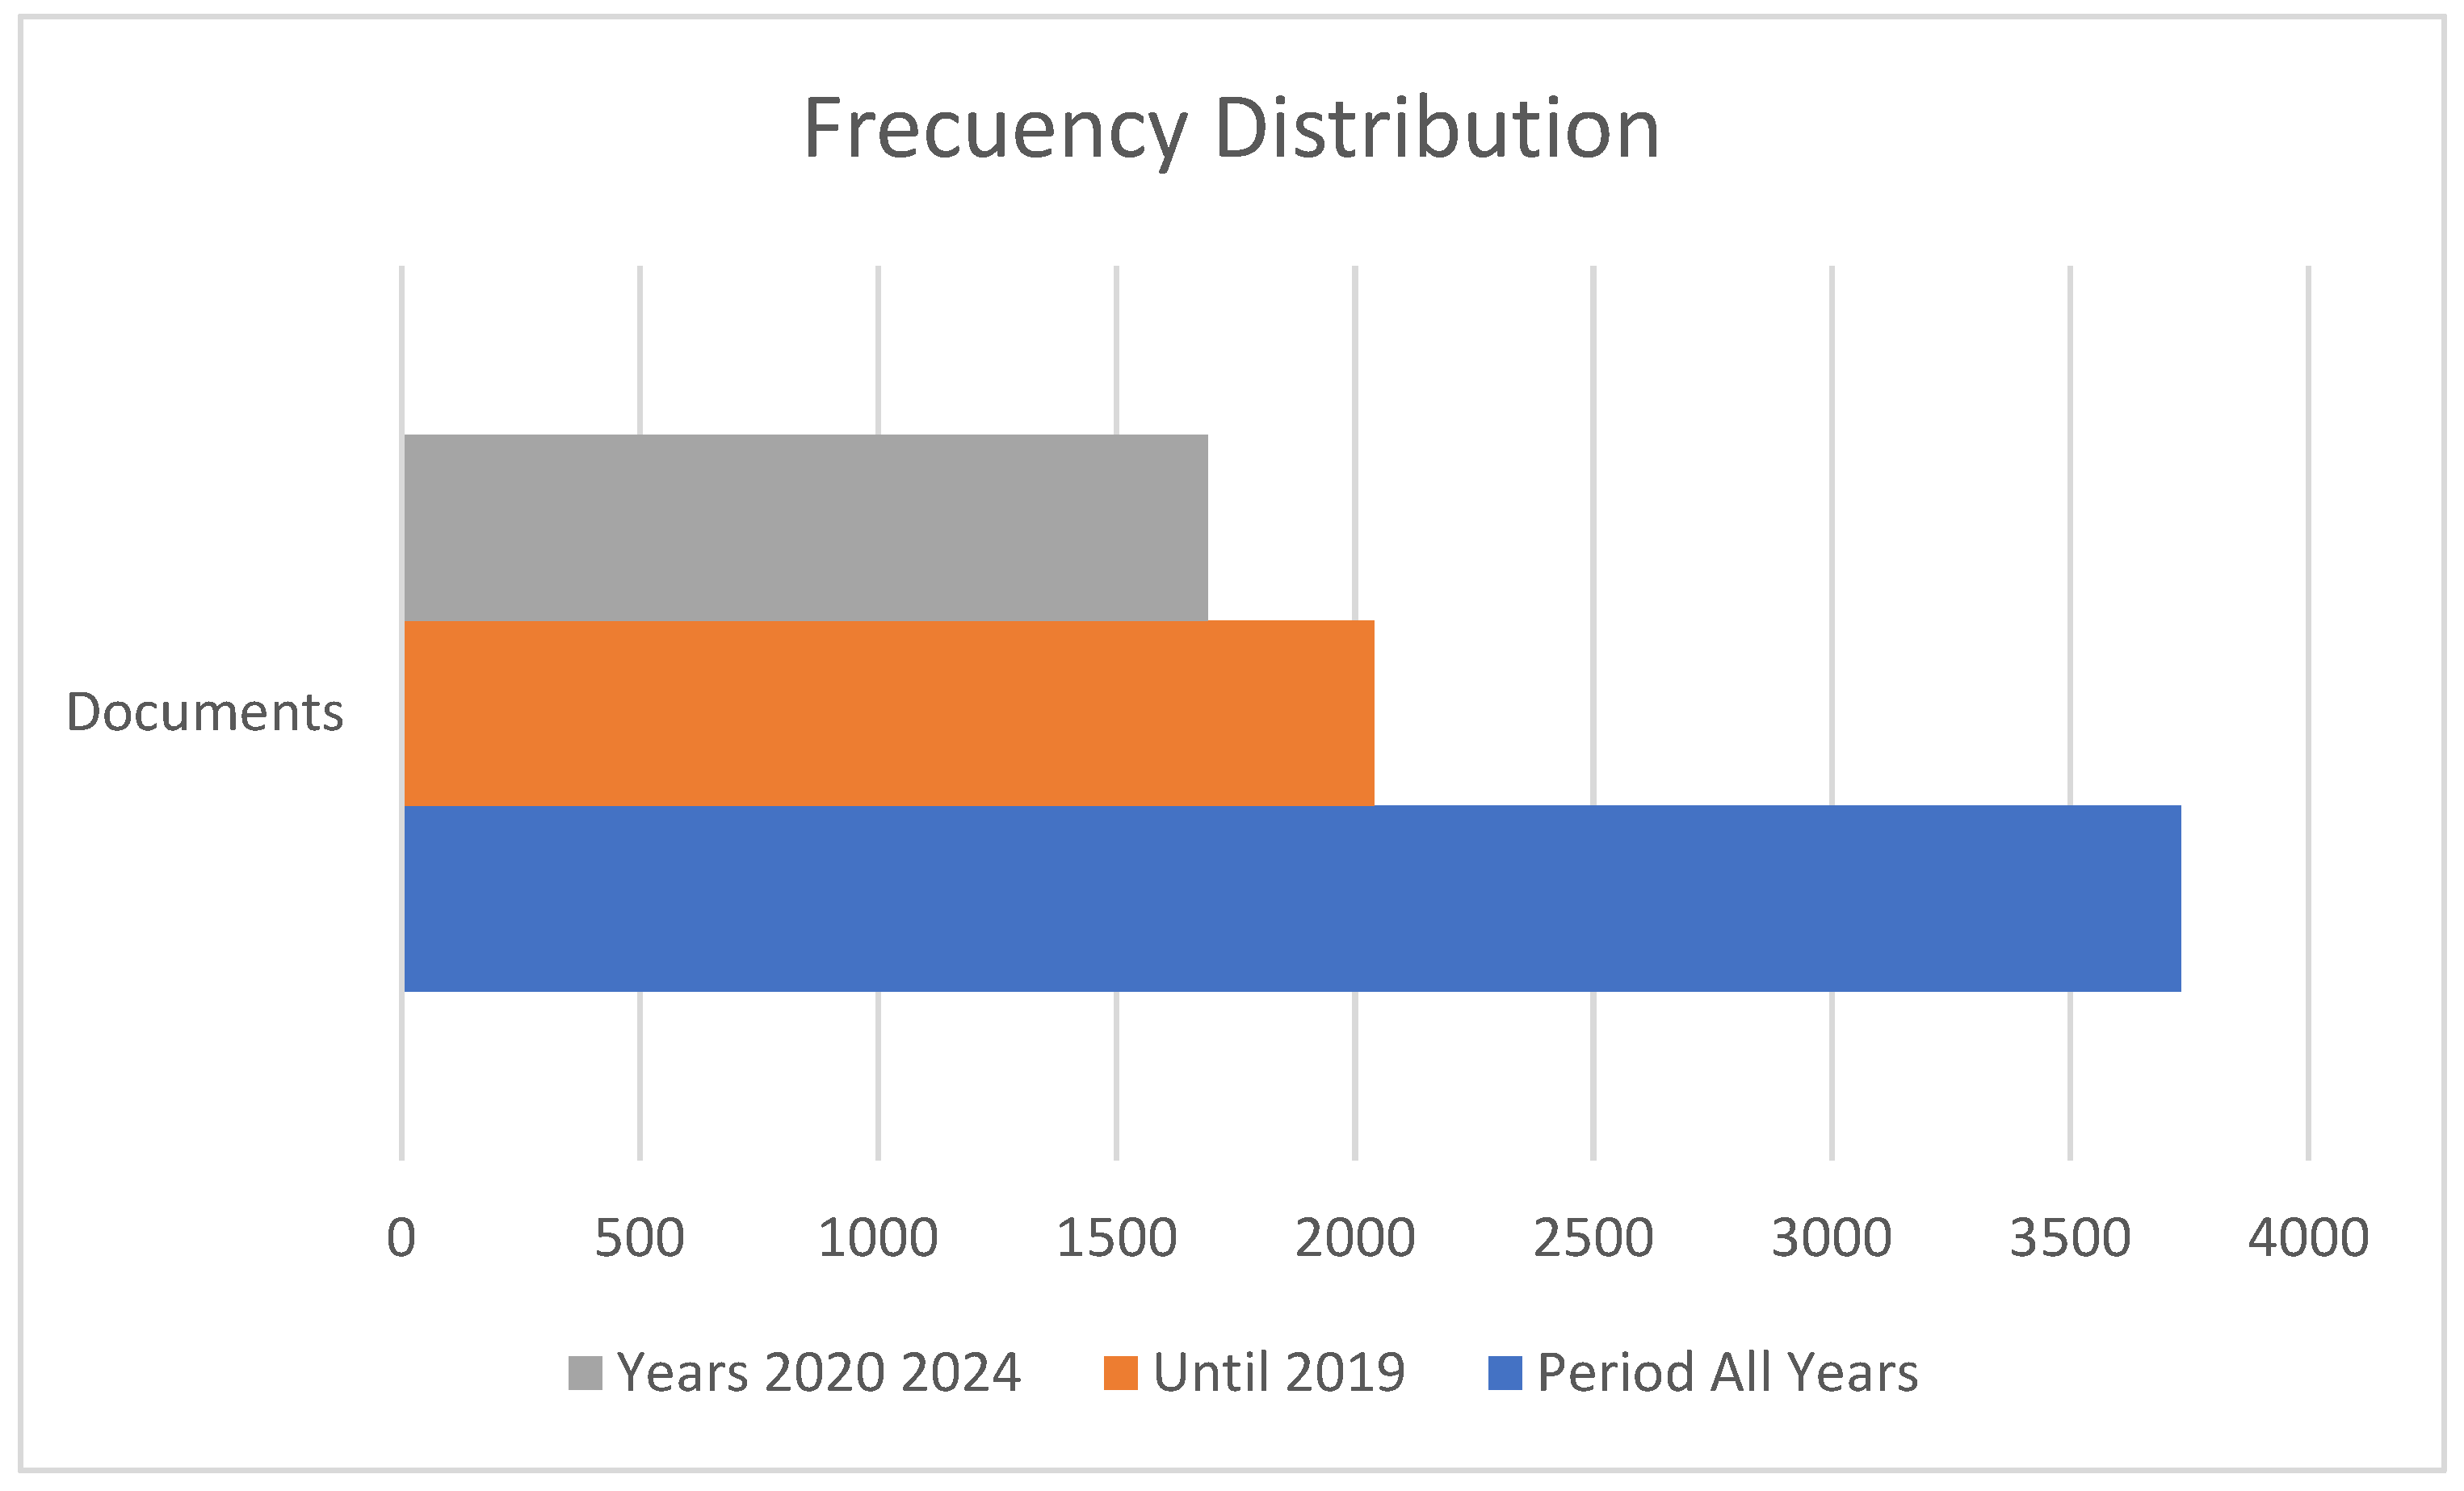
For a better analysis of the strategic programs, the research output is divided into two subperiods (Table 2), while a third subperiod is considered that includes all years with publications in WOS. The first subperiod covers all years up to 2019 and the second subperiod from 2020 to 2024. Considering the sample analysed, the first subperiod includes 2040 articles, while the second subperiod consists of 1692 articles, so the total number of periods includes 3732 articles with 3870 keywords, after cleaning the corpus of the sample with SciMAT.
3.3. Evolution of the Themes
Cobo et al. (2012) point out that a thematic area is defined as a group of themes developed over different subperiods. It is important to note that, depending on how they are interrelated, a given theme may belong to another thematic area or not belong to any of them. Figure 4 shows the evolution of the themes analysed.
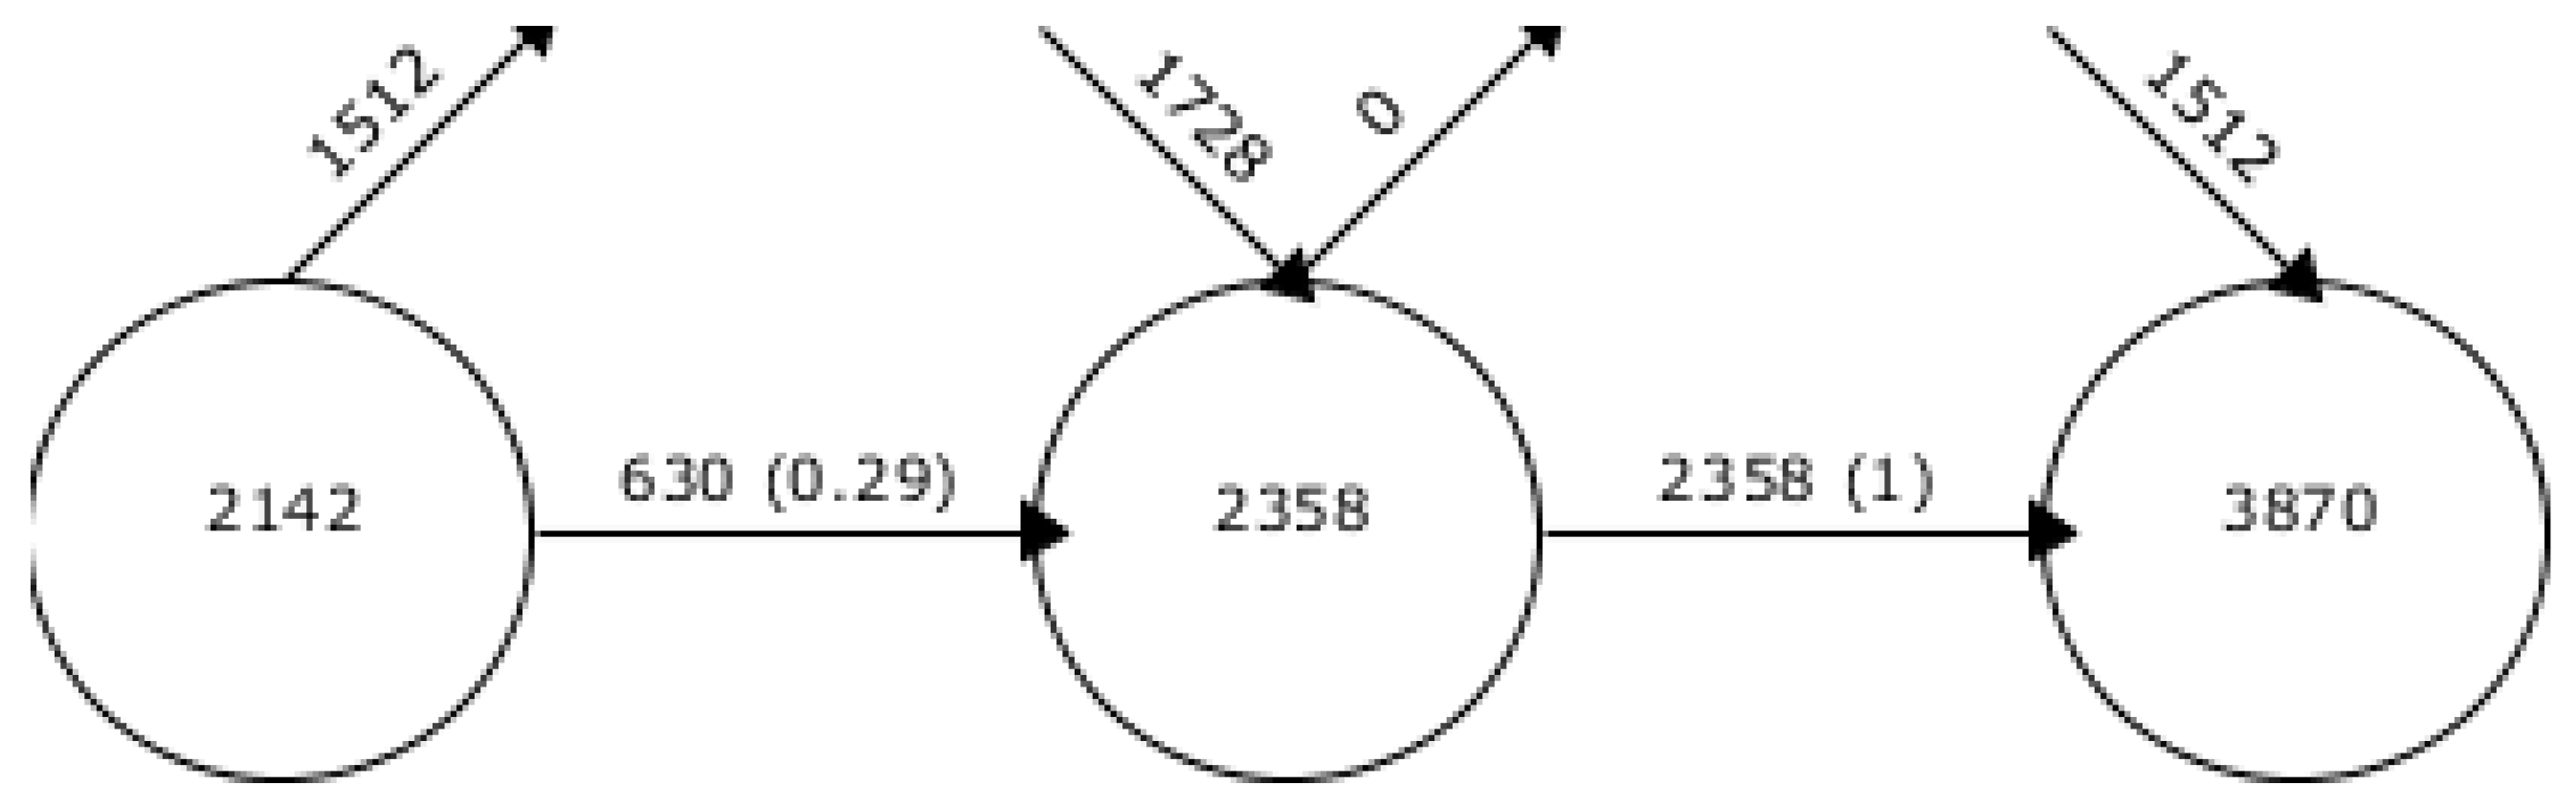
As we can see in Figure 5, within the longitudinal view shown in the SciMAT analyses, we find the overlapping map, where we can see how the keywords have evolved across the groups: those that are included, those that are excluded, and those that are newly added. As described below, it represents a group of all years of the study sample and two further subgroups divided by year intervals (Stage 1: until 2019 subgroup; Stage 2: 2020–2024 subgroup; Stage 3: all years subgroup).
Figure 5 shows that of the 2142 keywords for the period up to 2019, 1512 were excluded and 630 were integrated into the next stage, resulting in 2358 keywords for the period 2020–2024, giving a total of 3870 words for all periods.
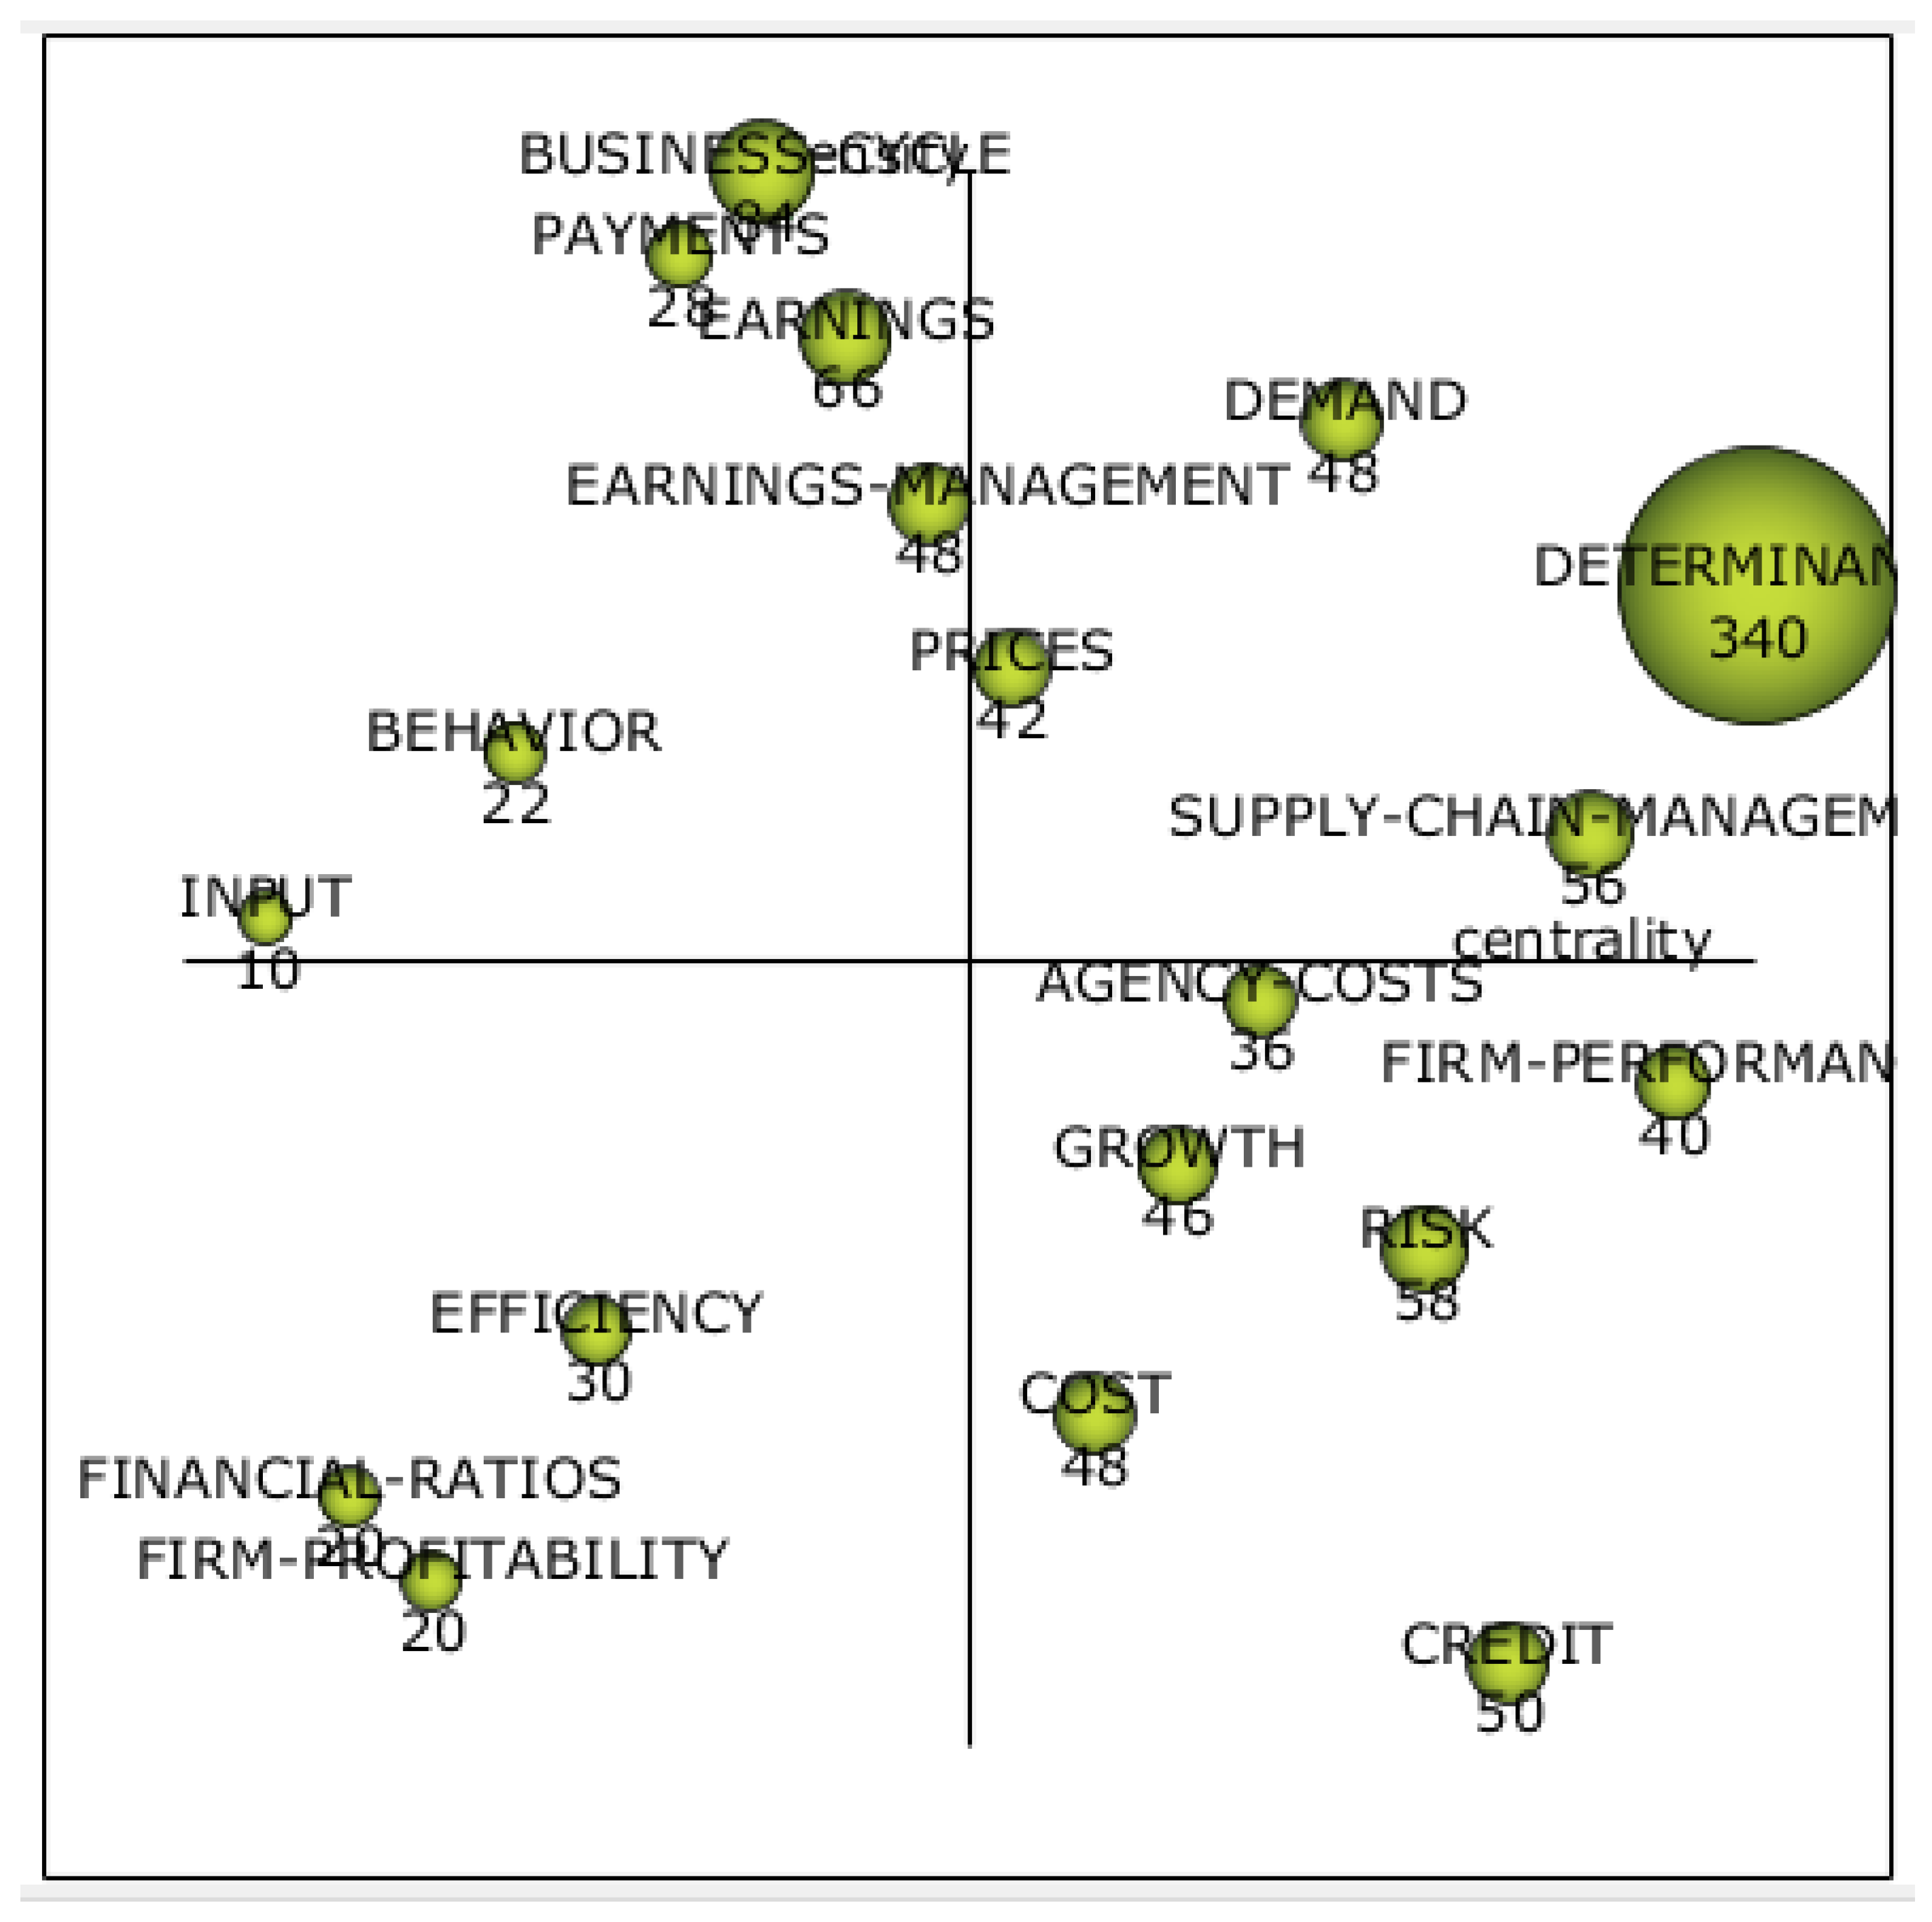
Using the data from the first subperiod, until 2019 (Table 3), we obtained the first strategy diagram (Figure 6). The strategy diagram shown in the next figure, therefore, represents only the first subperiod, which covers all years up to 2019.
Figure 6 depicts four motor themes, six highly developed themes, three emerging or disappearing themes, and six basic themes, also known as cross-cutting themes. The size of the circles is proportional to the h-index of each theme.
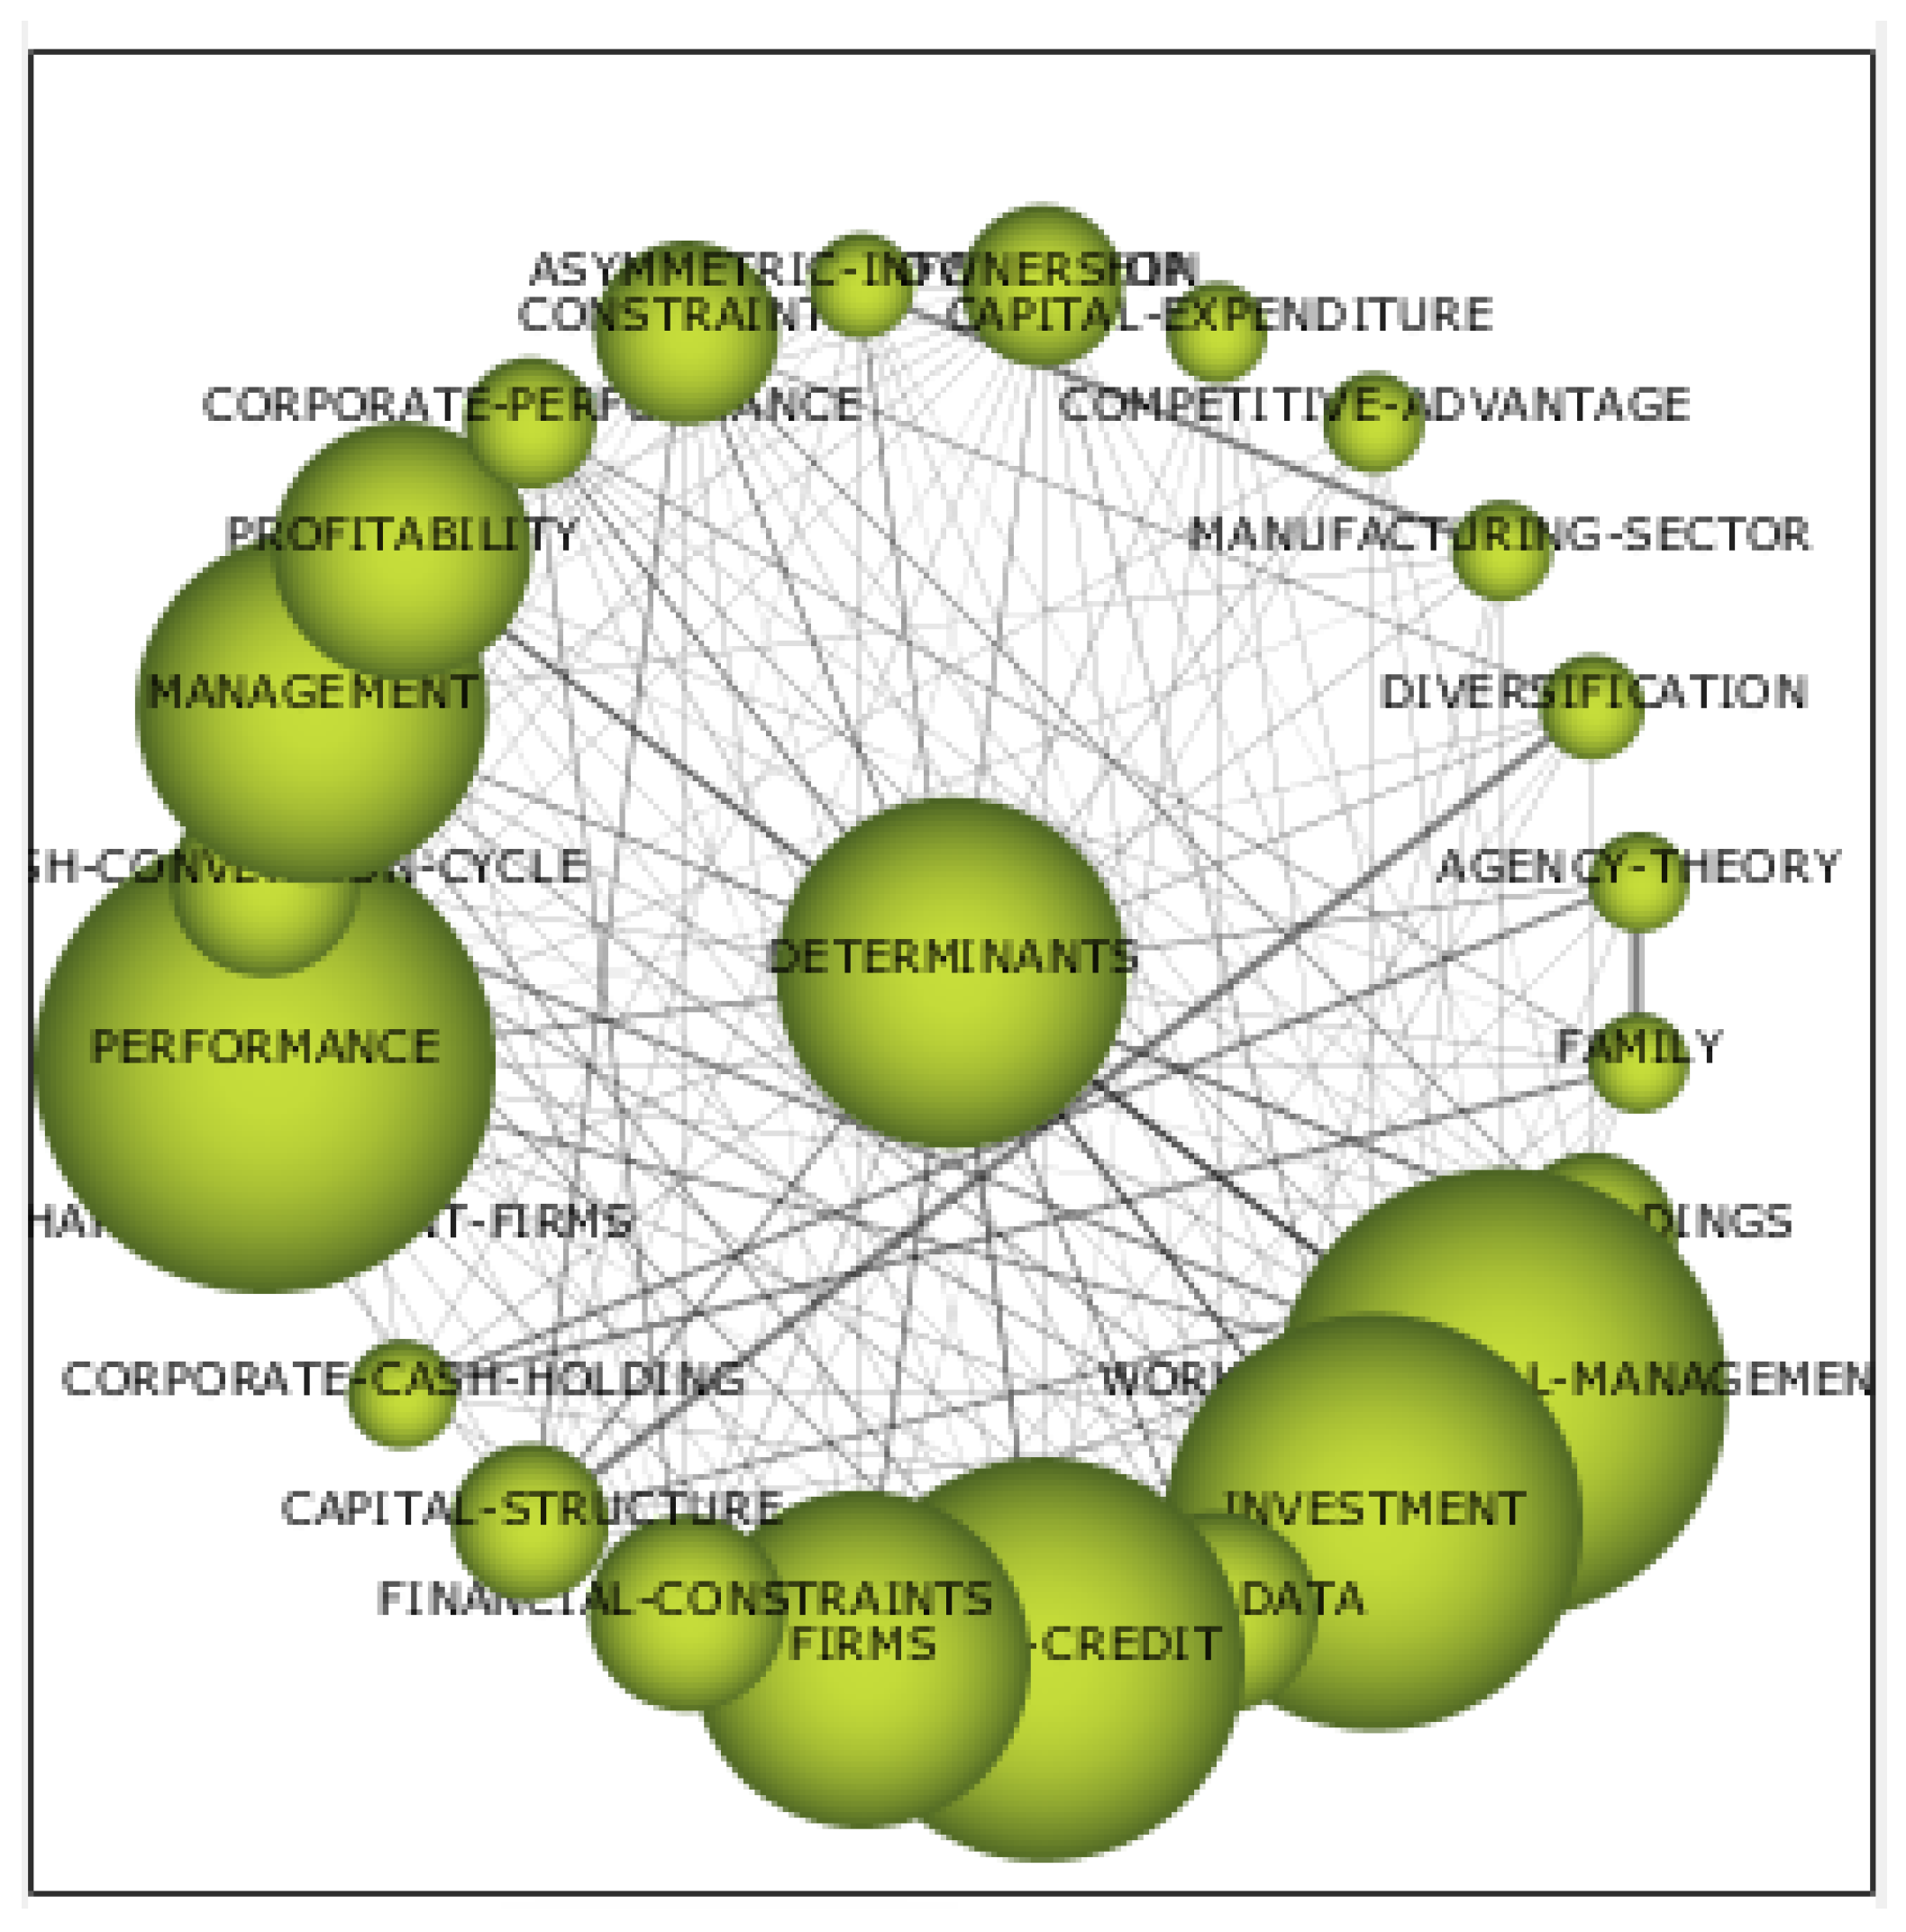
Cobo et al. (2012) argue that the motor themes, which are in the upper right quadrant of the diagram, are the themes that are considered well developed and important for the construction of the scientific field. In this first subperiod, Business Cycle, Payments, Earnings, Demand, Earnings Management, and Determinants have a high density and the latter has a strong centrality (Table 3), so they have a high number of citations and are closely related to the rest of the themes. In Figure 7 we can see this relationship: we have a theme that is very well related to the rest, with Determinants being the most centred theme and with the highest value, representing the theme that is most related to all of the others. Business Cycle is the densest theme, i.e., the theme that has the strongest relationship within its node with the aforementioned themes. In terms of the basic themes, i.e., those found in the lower right quadrant of the diagram (Figure 6), there are six themes.
Figure 6 also shows emerging or disappearing themes. When analysing the next period, we will clarify whether the themes remain or disappear, although we will show that they are declining themes and will disappear in the next period.
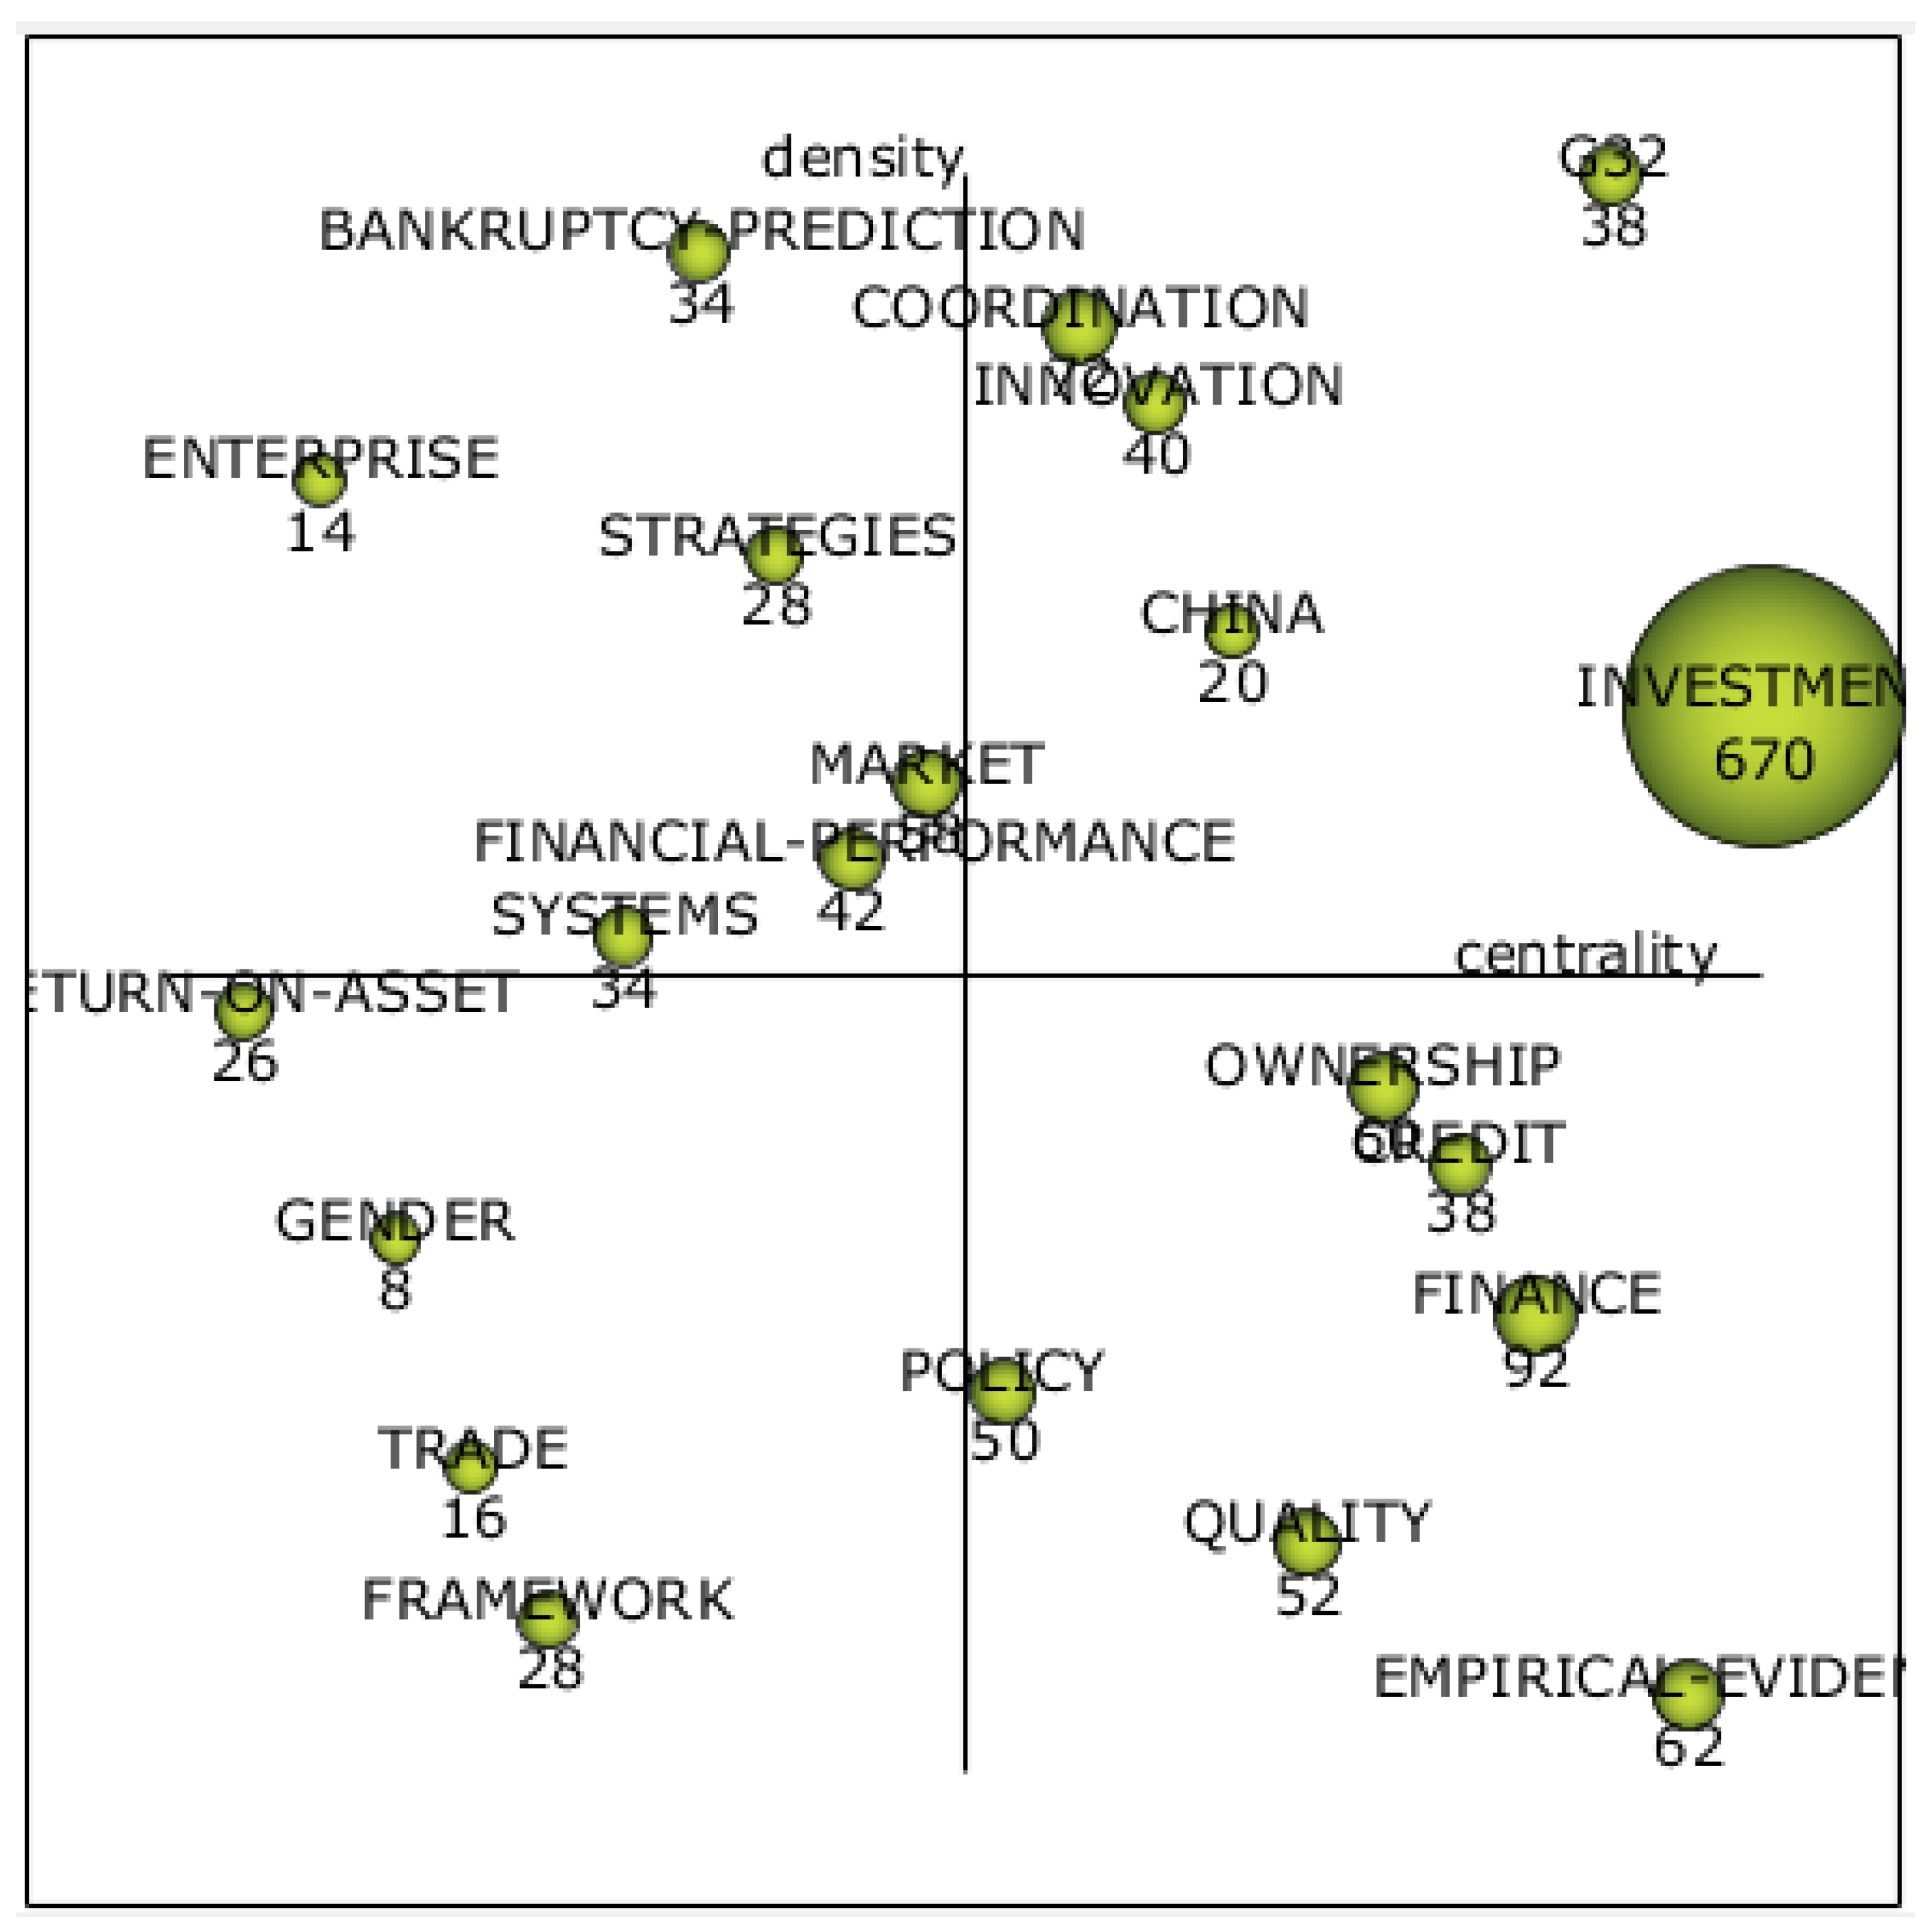
The second subperiod from 2020 to 2024 (Figure 8 and Table 4) shows three motor themes, two basic themes, two emerging themes, and two peripheral or developed themes.
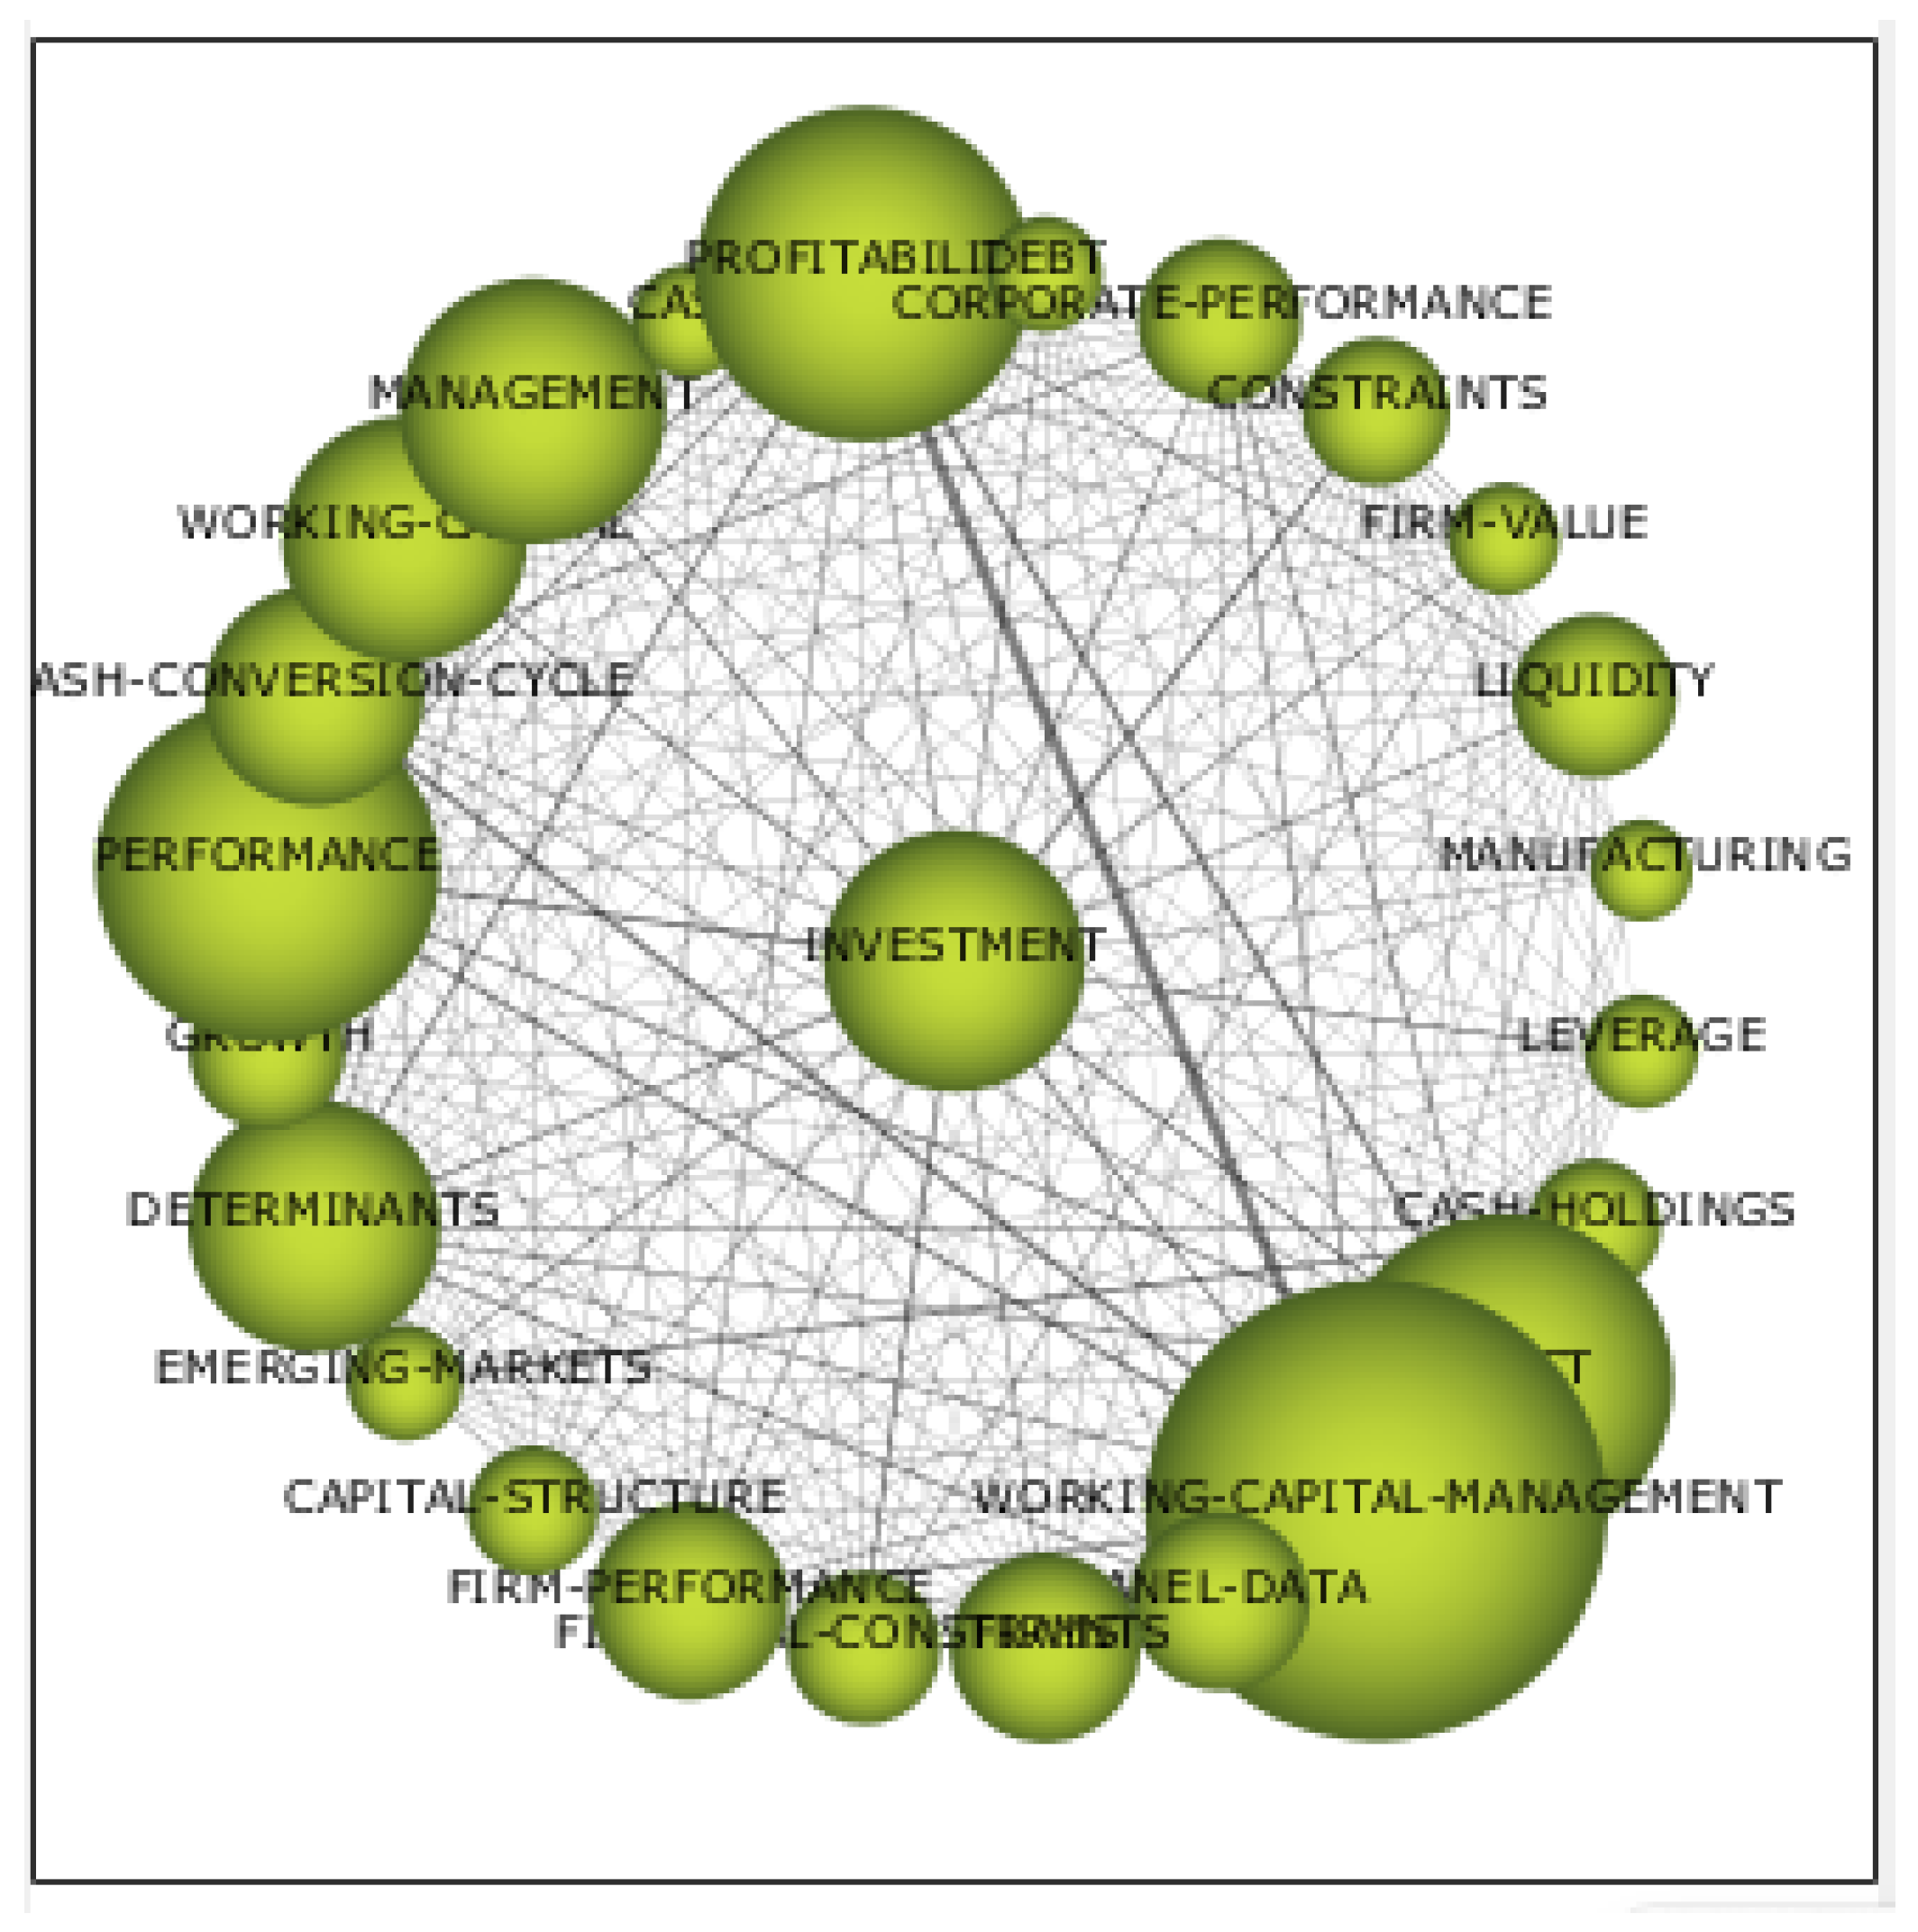
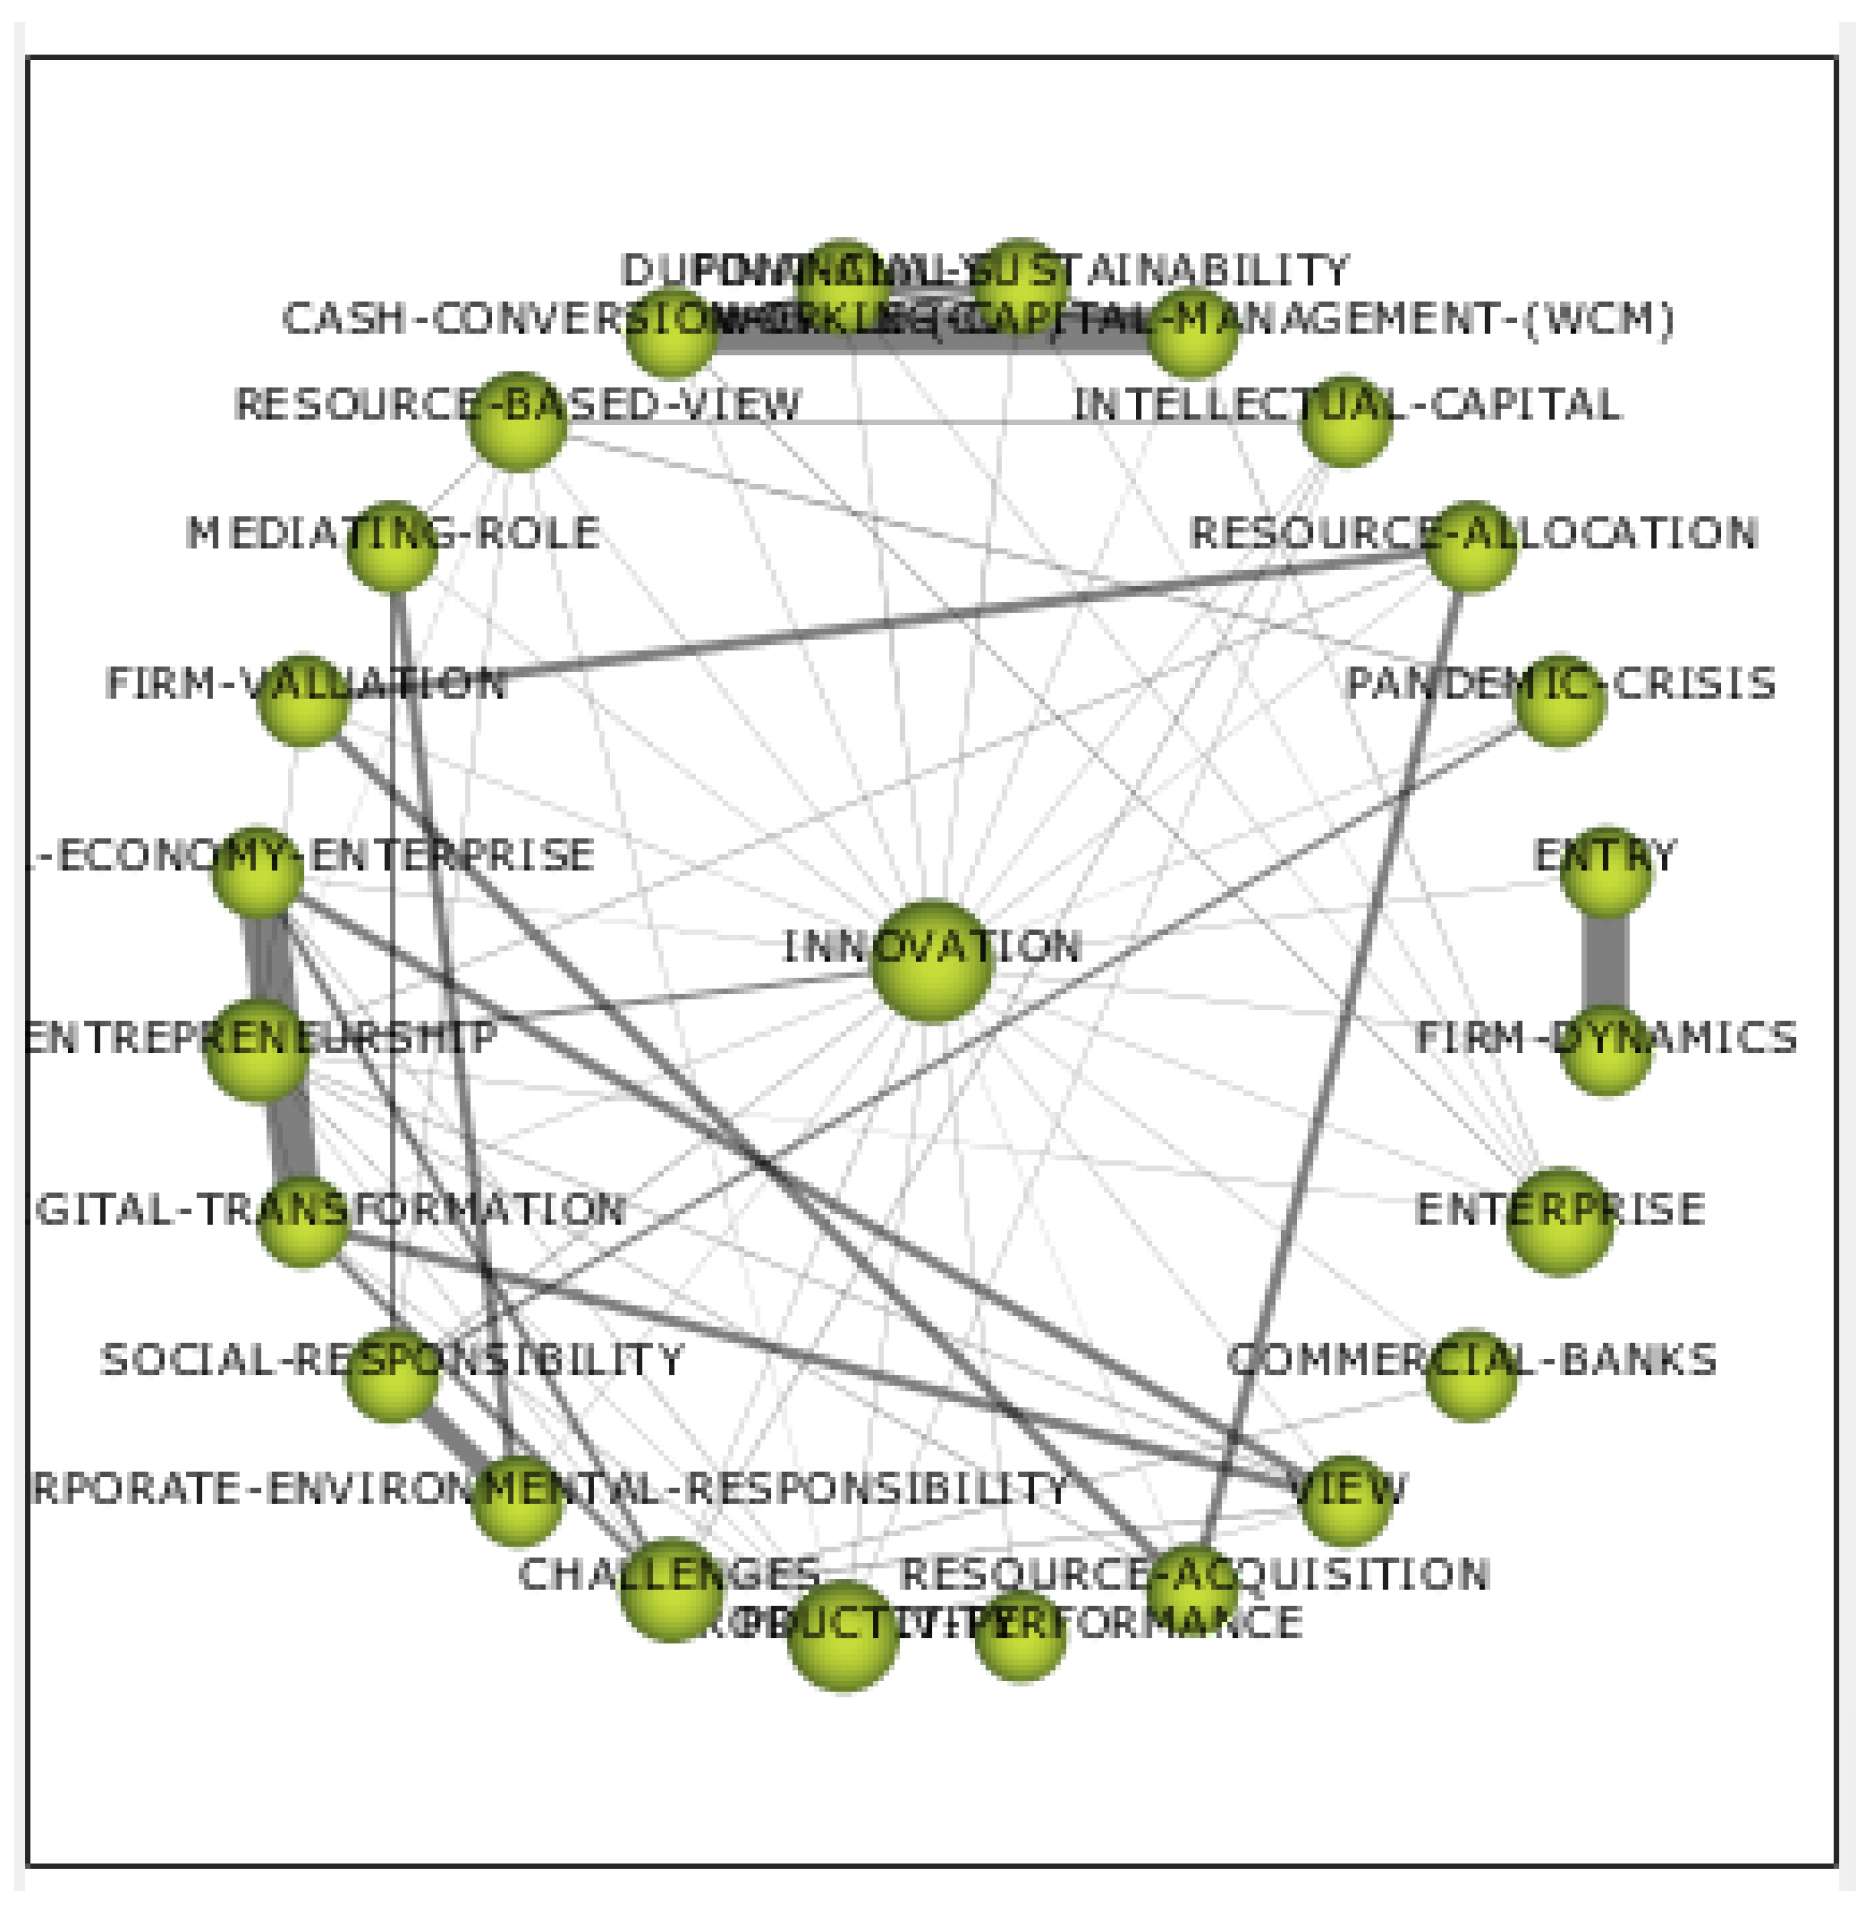
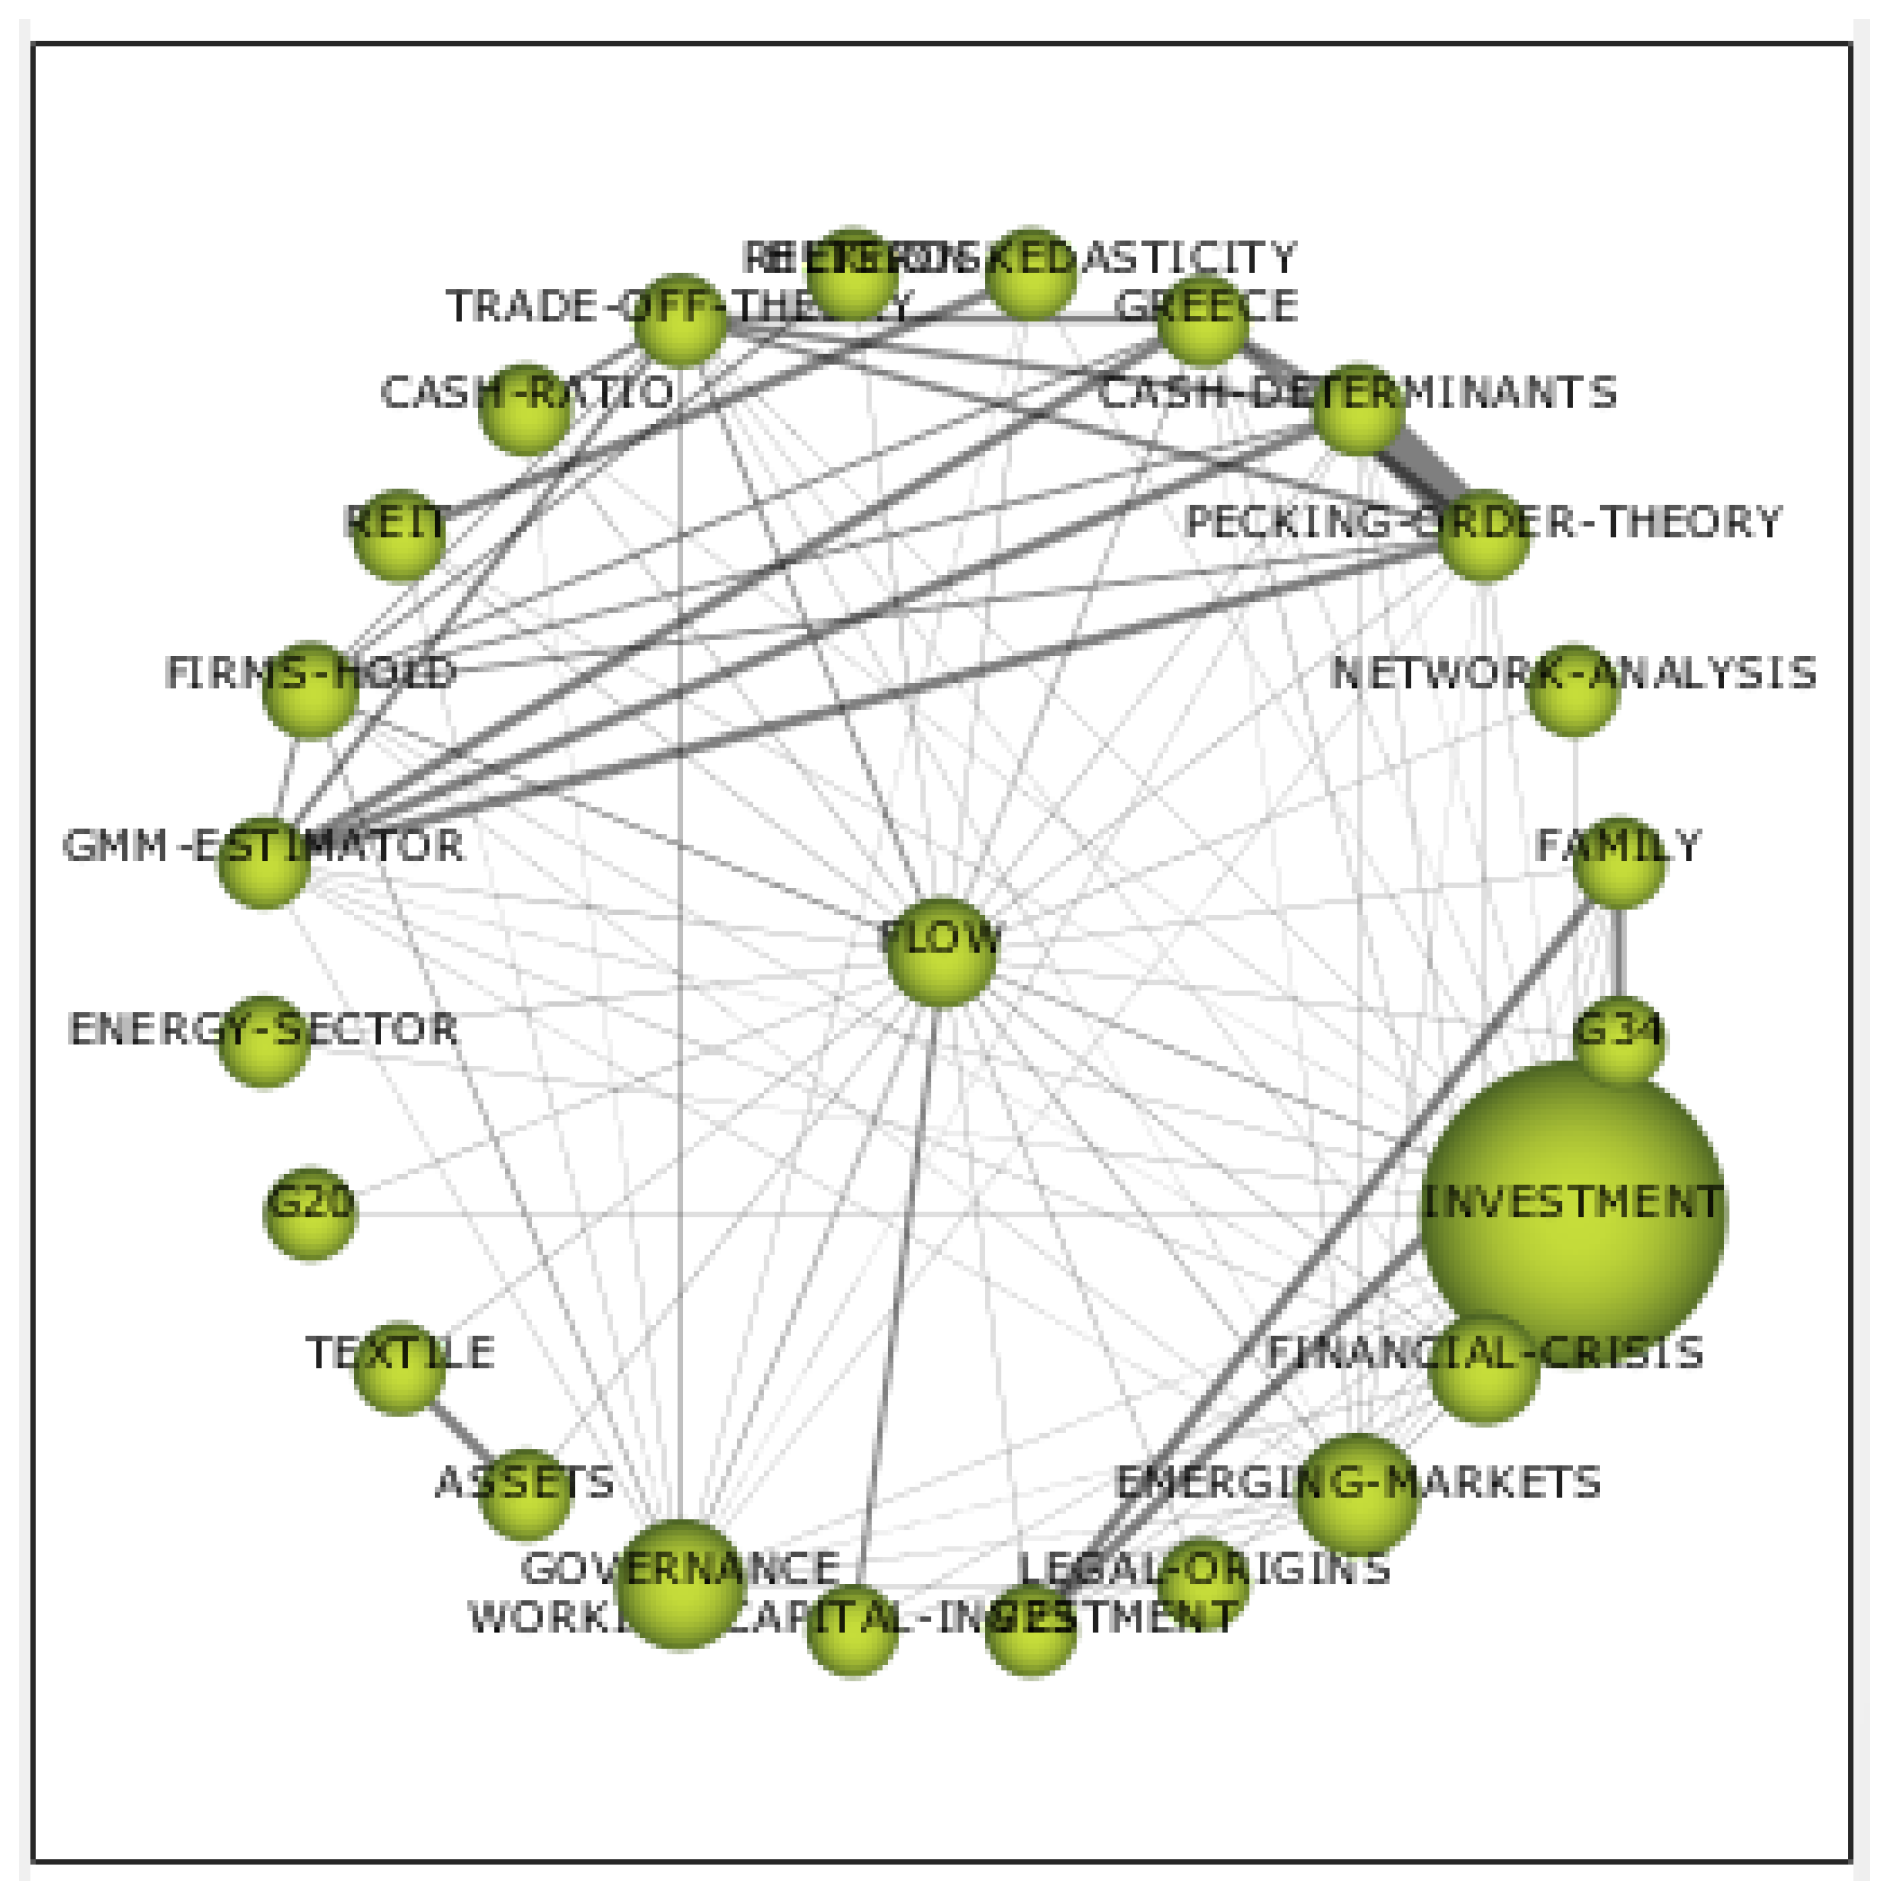
In this second period, it can be seen that the main motor theme is Investment, which appears in 670 papers. This is the most central theme of all, and, therefore, the one most related to all of the others, as can be seen in Figure 9. At the same level is G32, which is also a very dense topic. Innovation, Enterprise, and Bankruptcy Prediction are also placed in this rank, presenting a high density, therefore they have a high number of citations and are in a similar range of centrality and also of higher density, so it is the theme best related to all of the others in its node.
One of the motor themes is “China”, which is a notable theme as it is at the top of all working capital research.
In terms of basic themes, i.e., those in the bottom right quadrant of the graph, Finance is a more central than a dense theme. Figure 8 also shows the emerging themes of Return on Assets, Gender, Trade, and Framework. It is also worth noting the most developing themes over this four-year period: Financial Performance, Market, Enterprise, and Bankruptcy Prediction. Note the basic and cross-cutting themes in the bottom right quadrant of Figure 8, such as Empirical Evidence, Finance, and Credit.
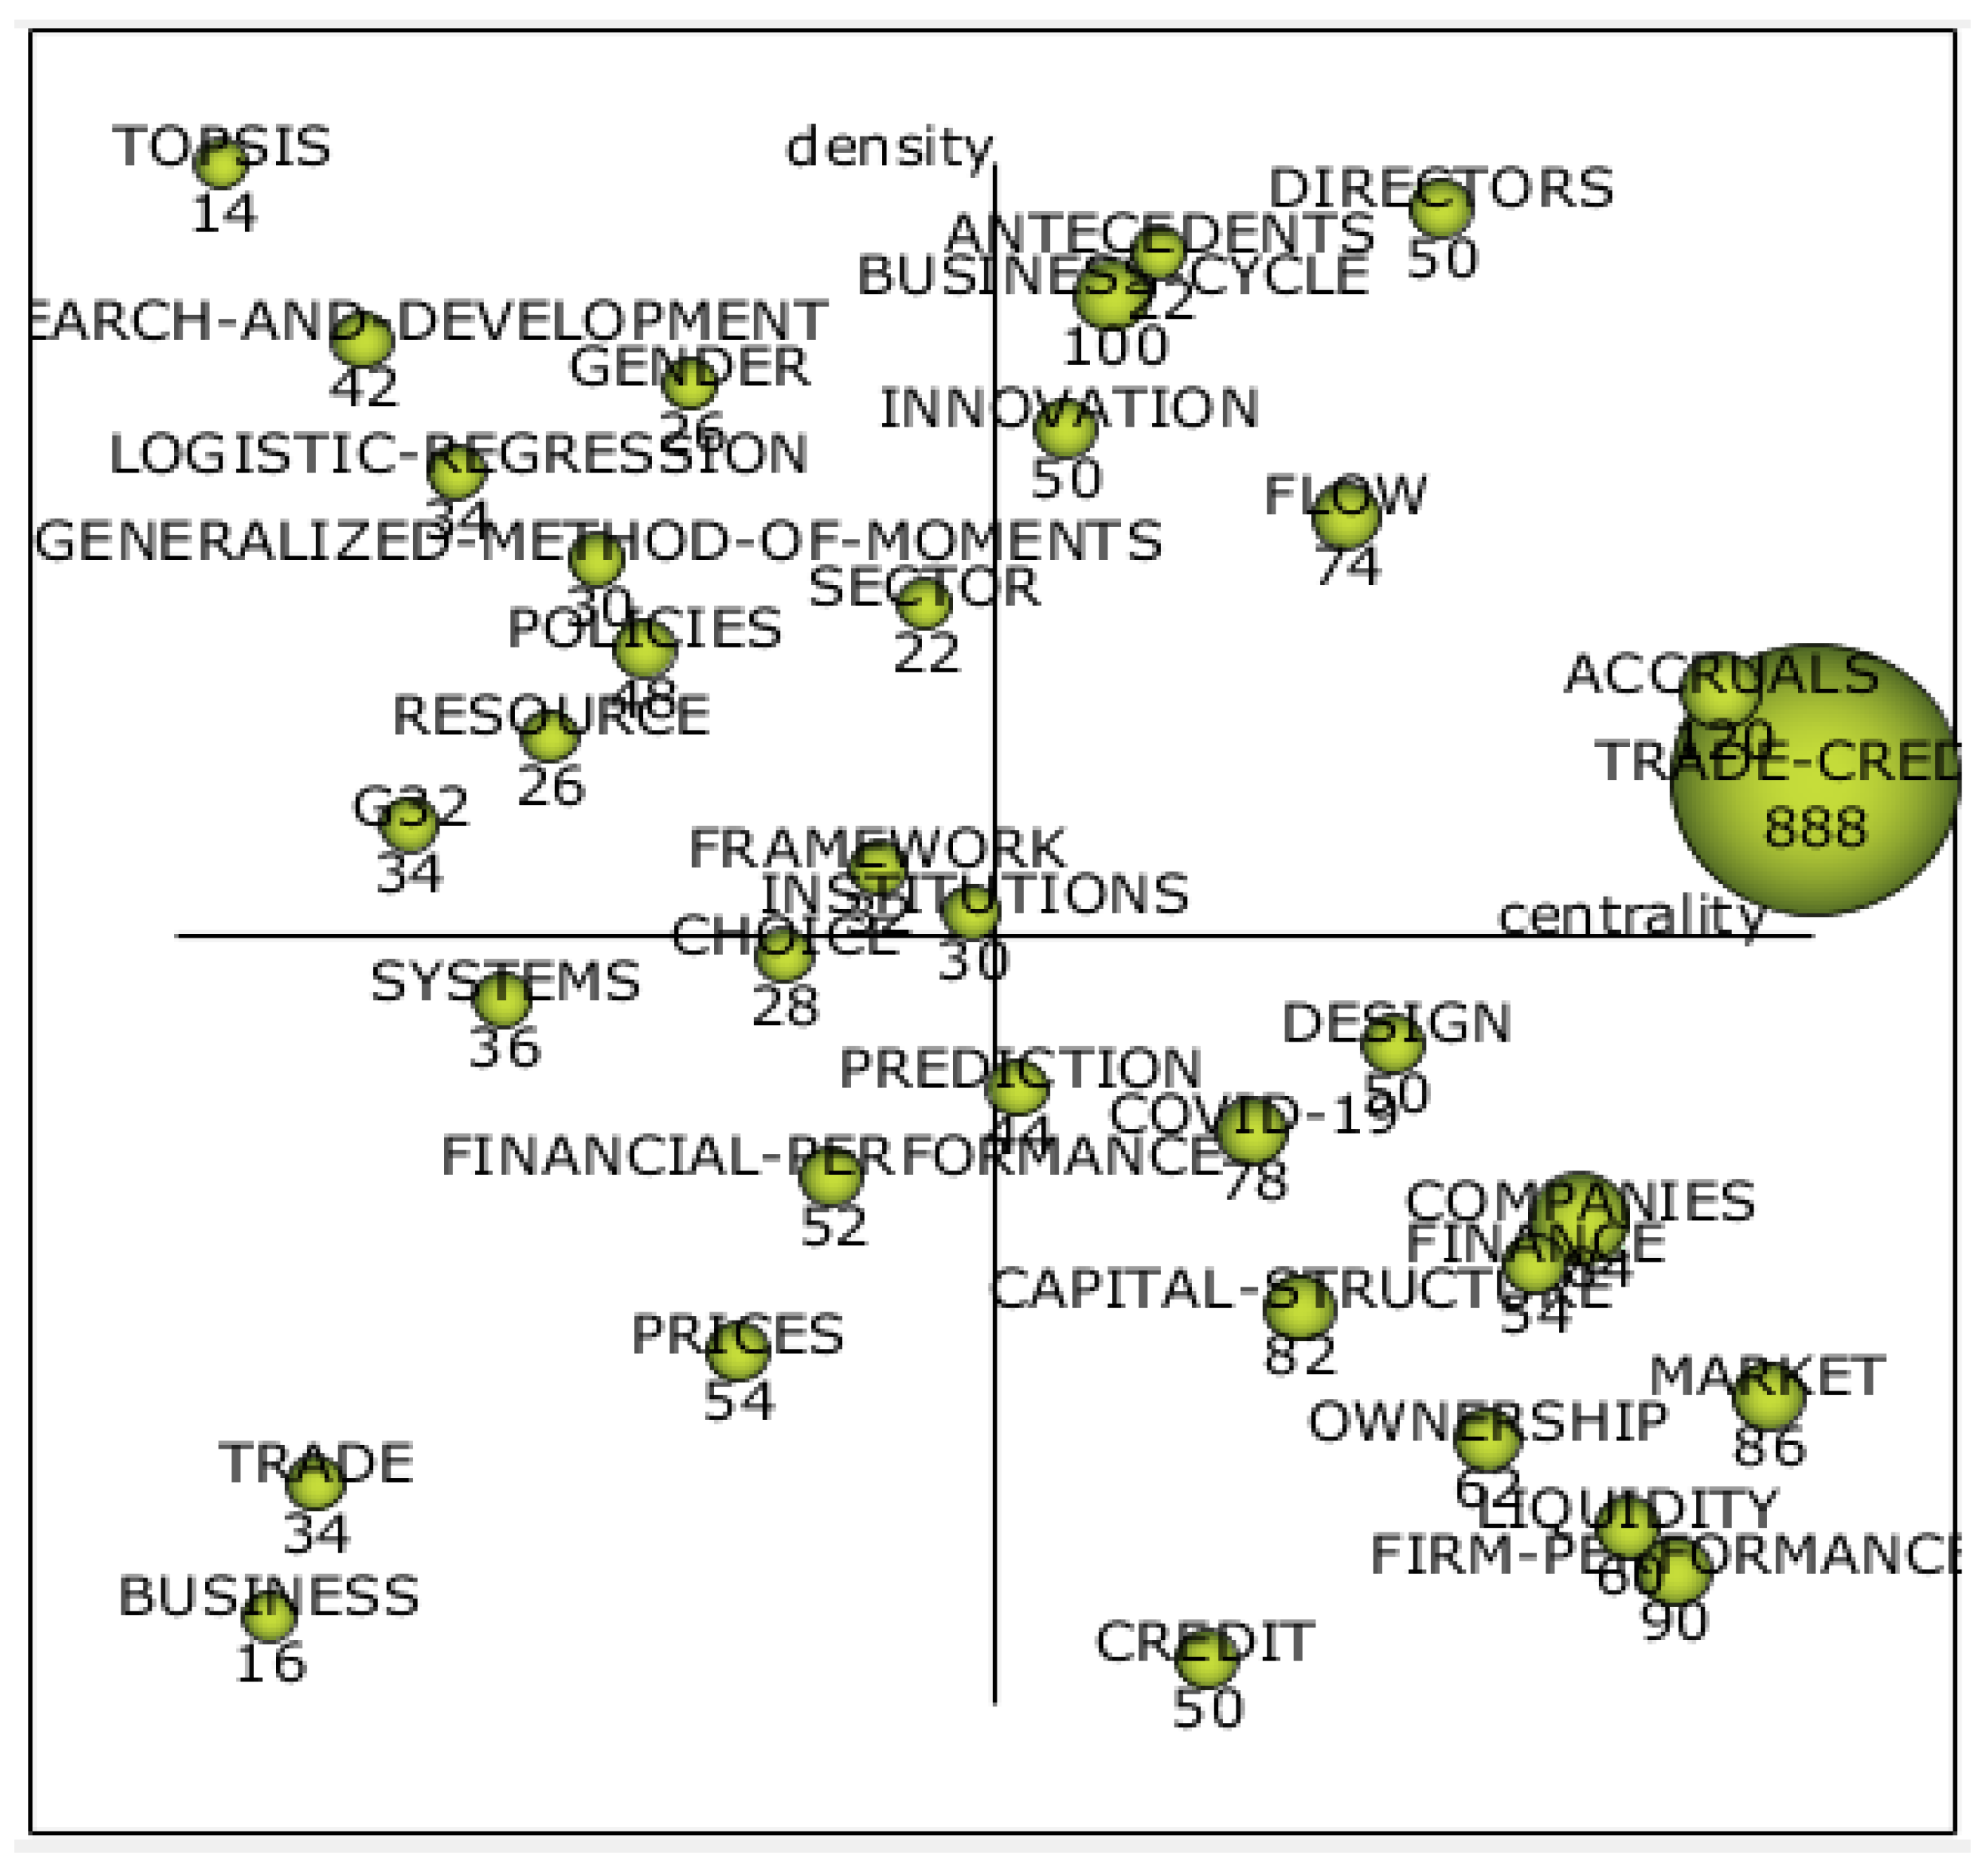
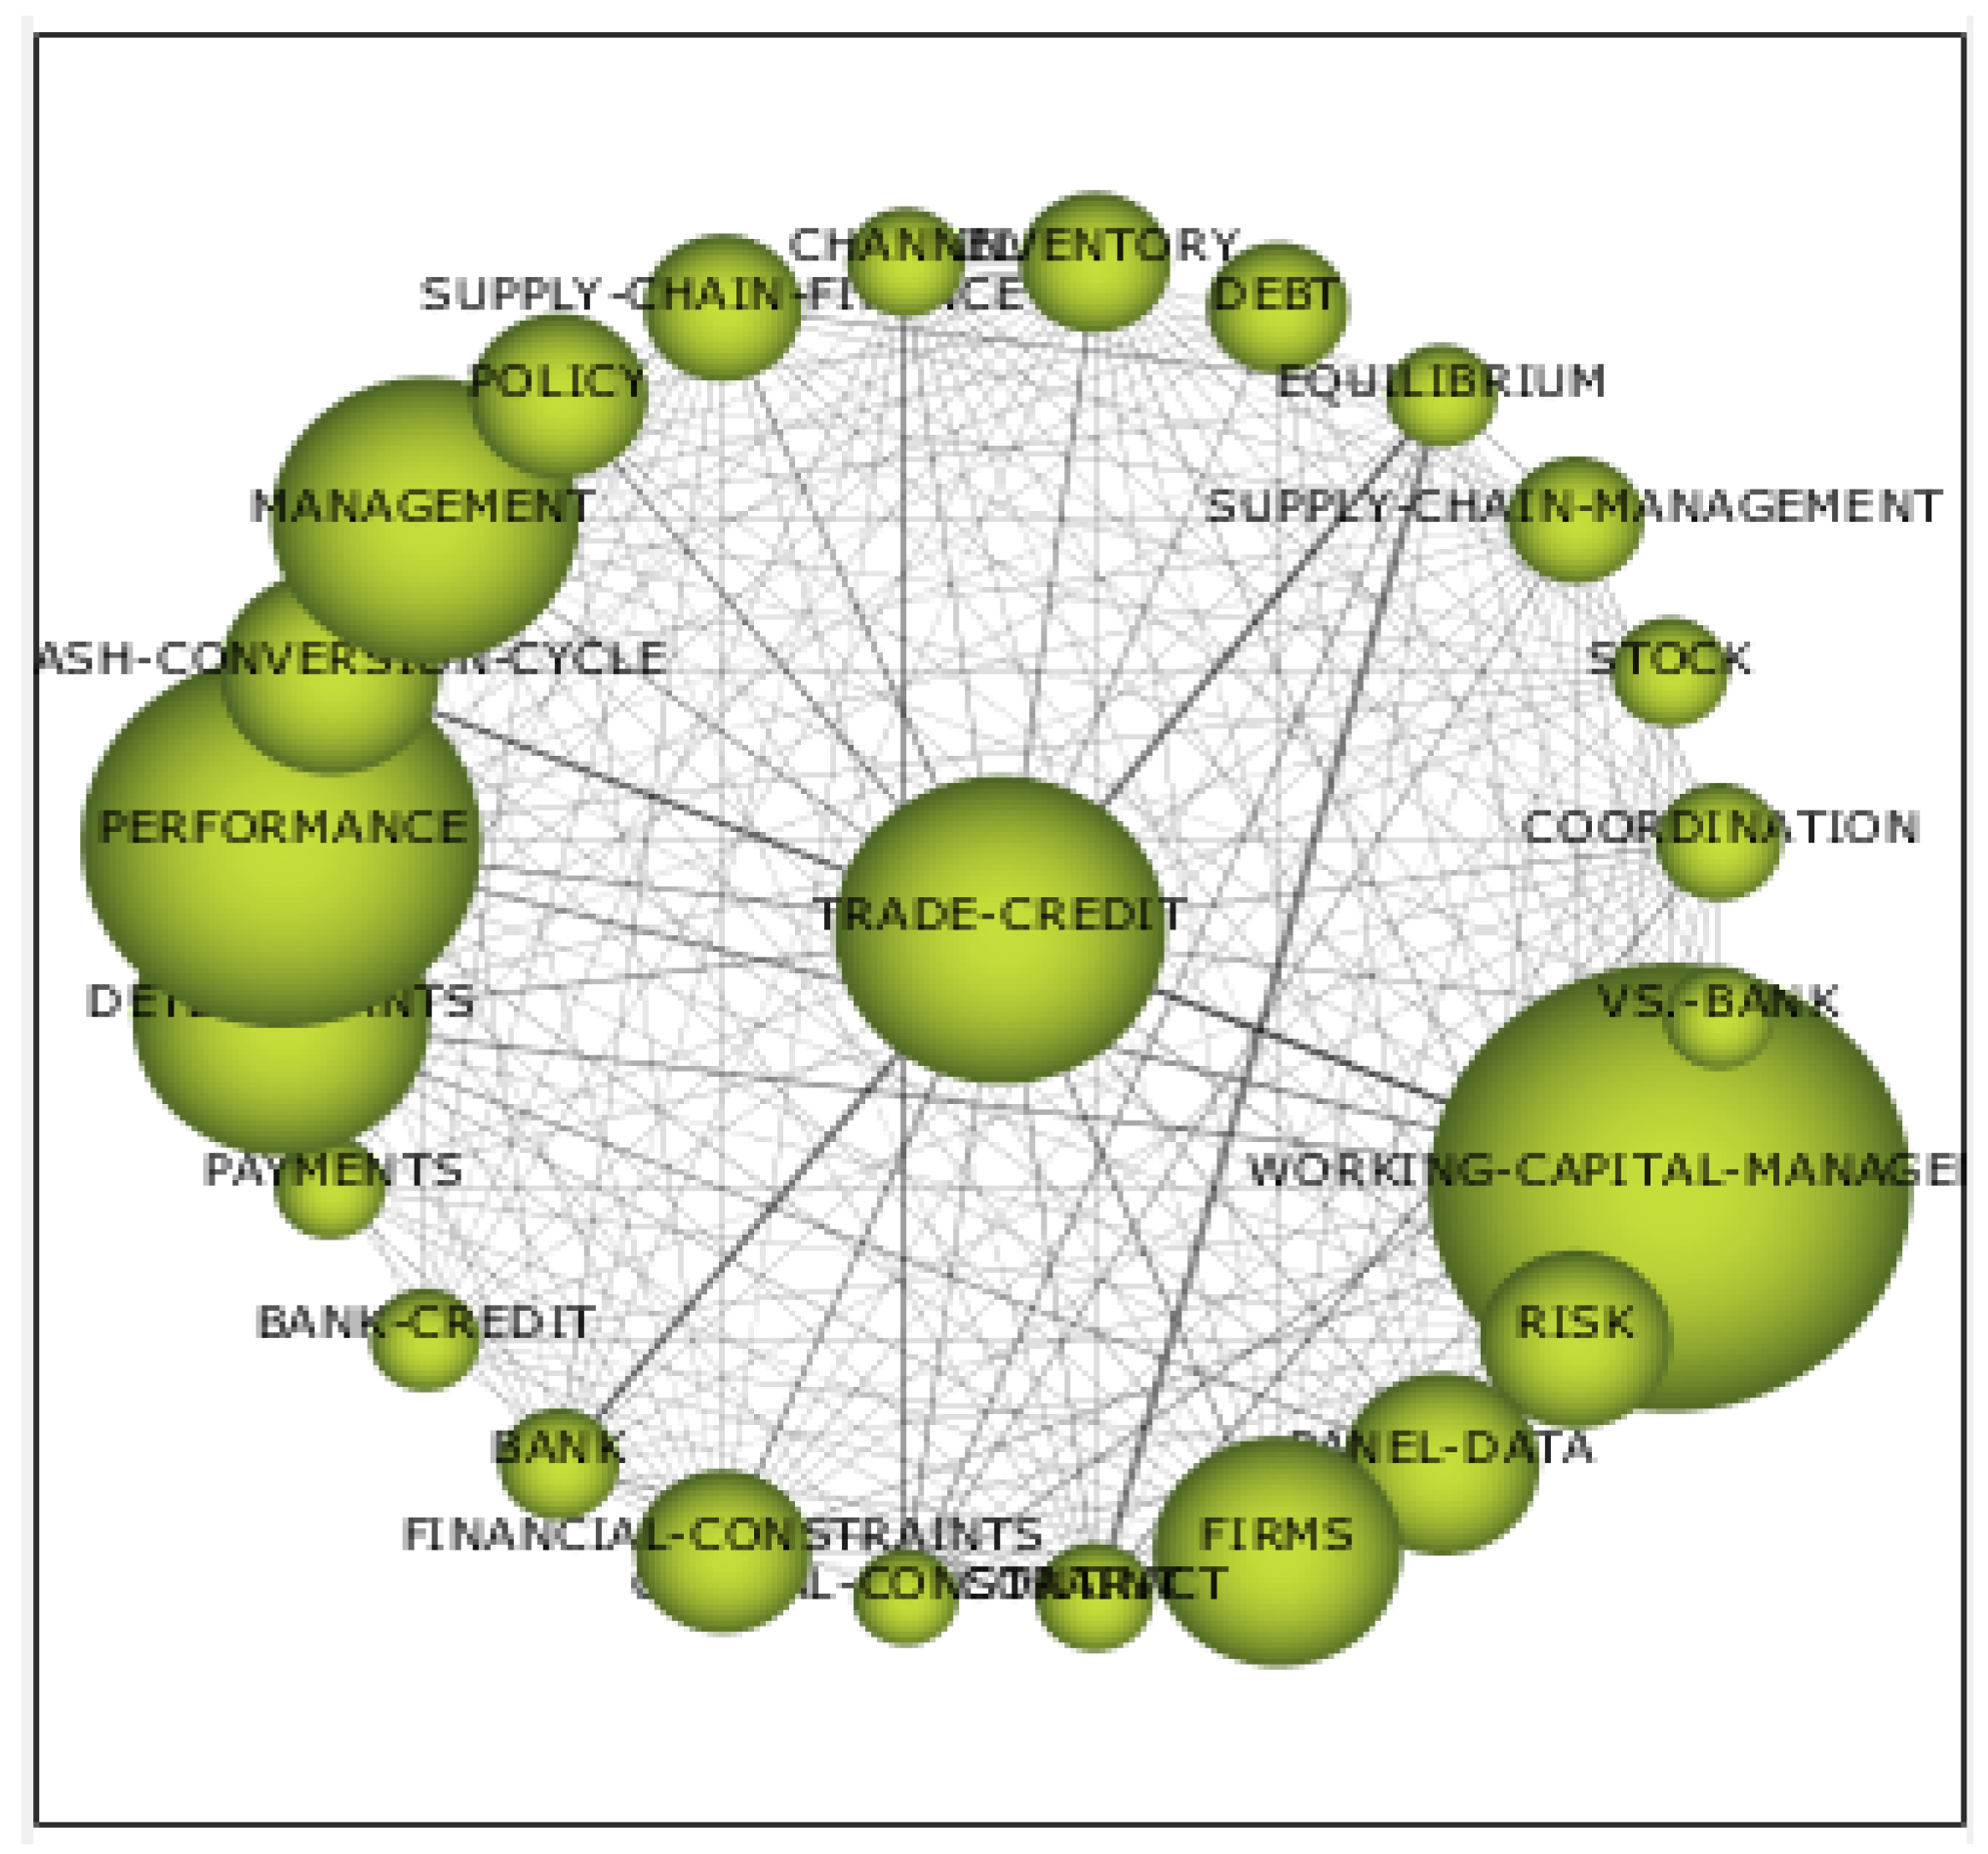
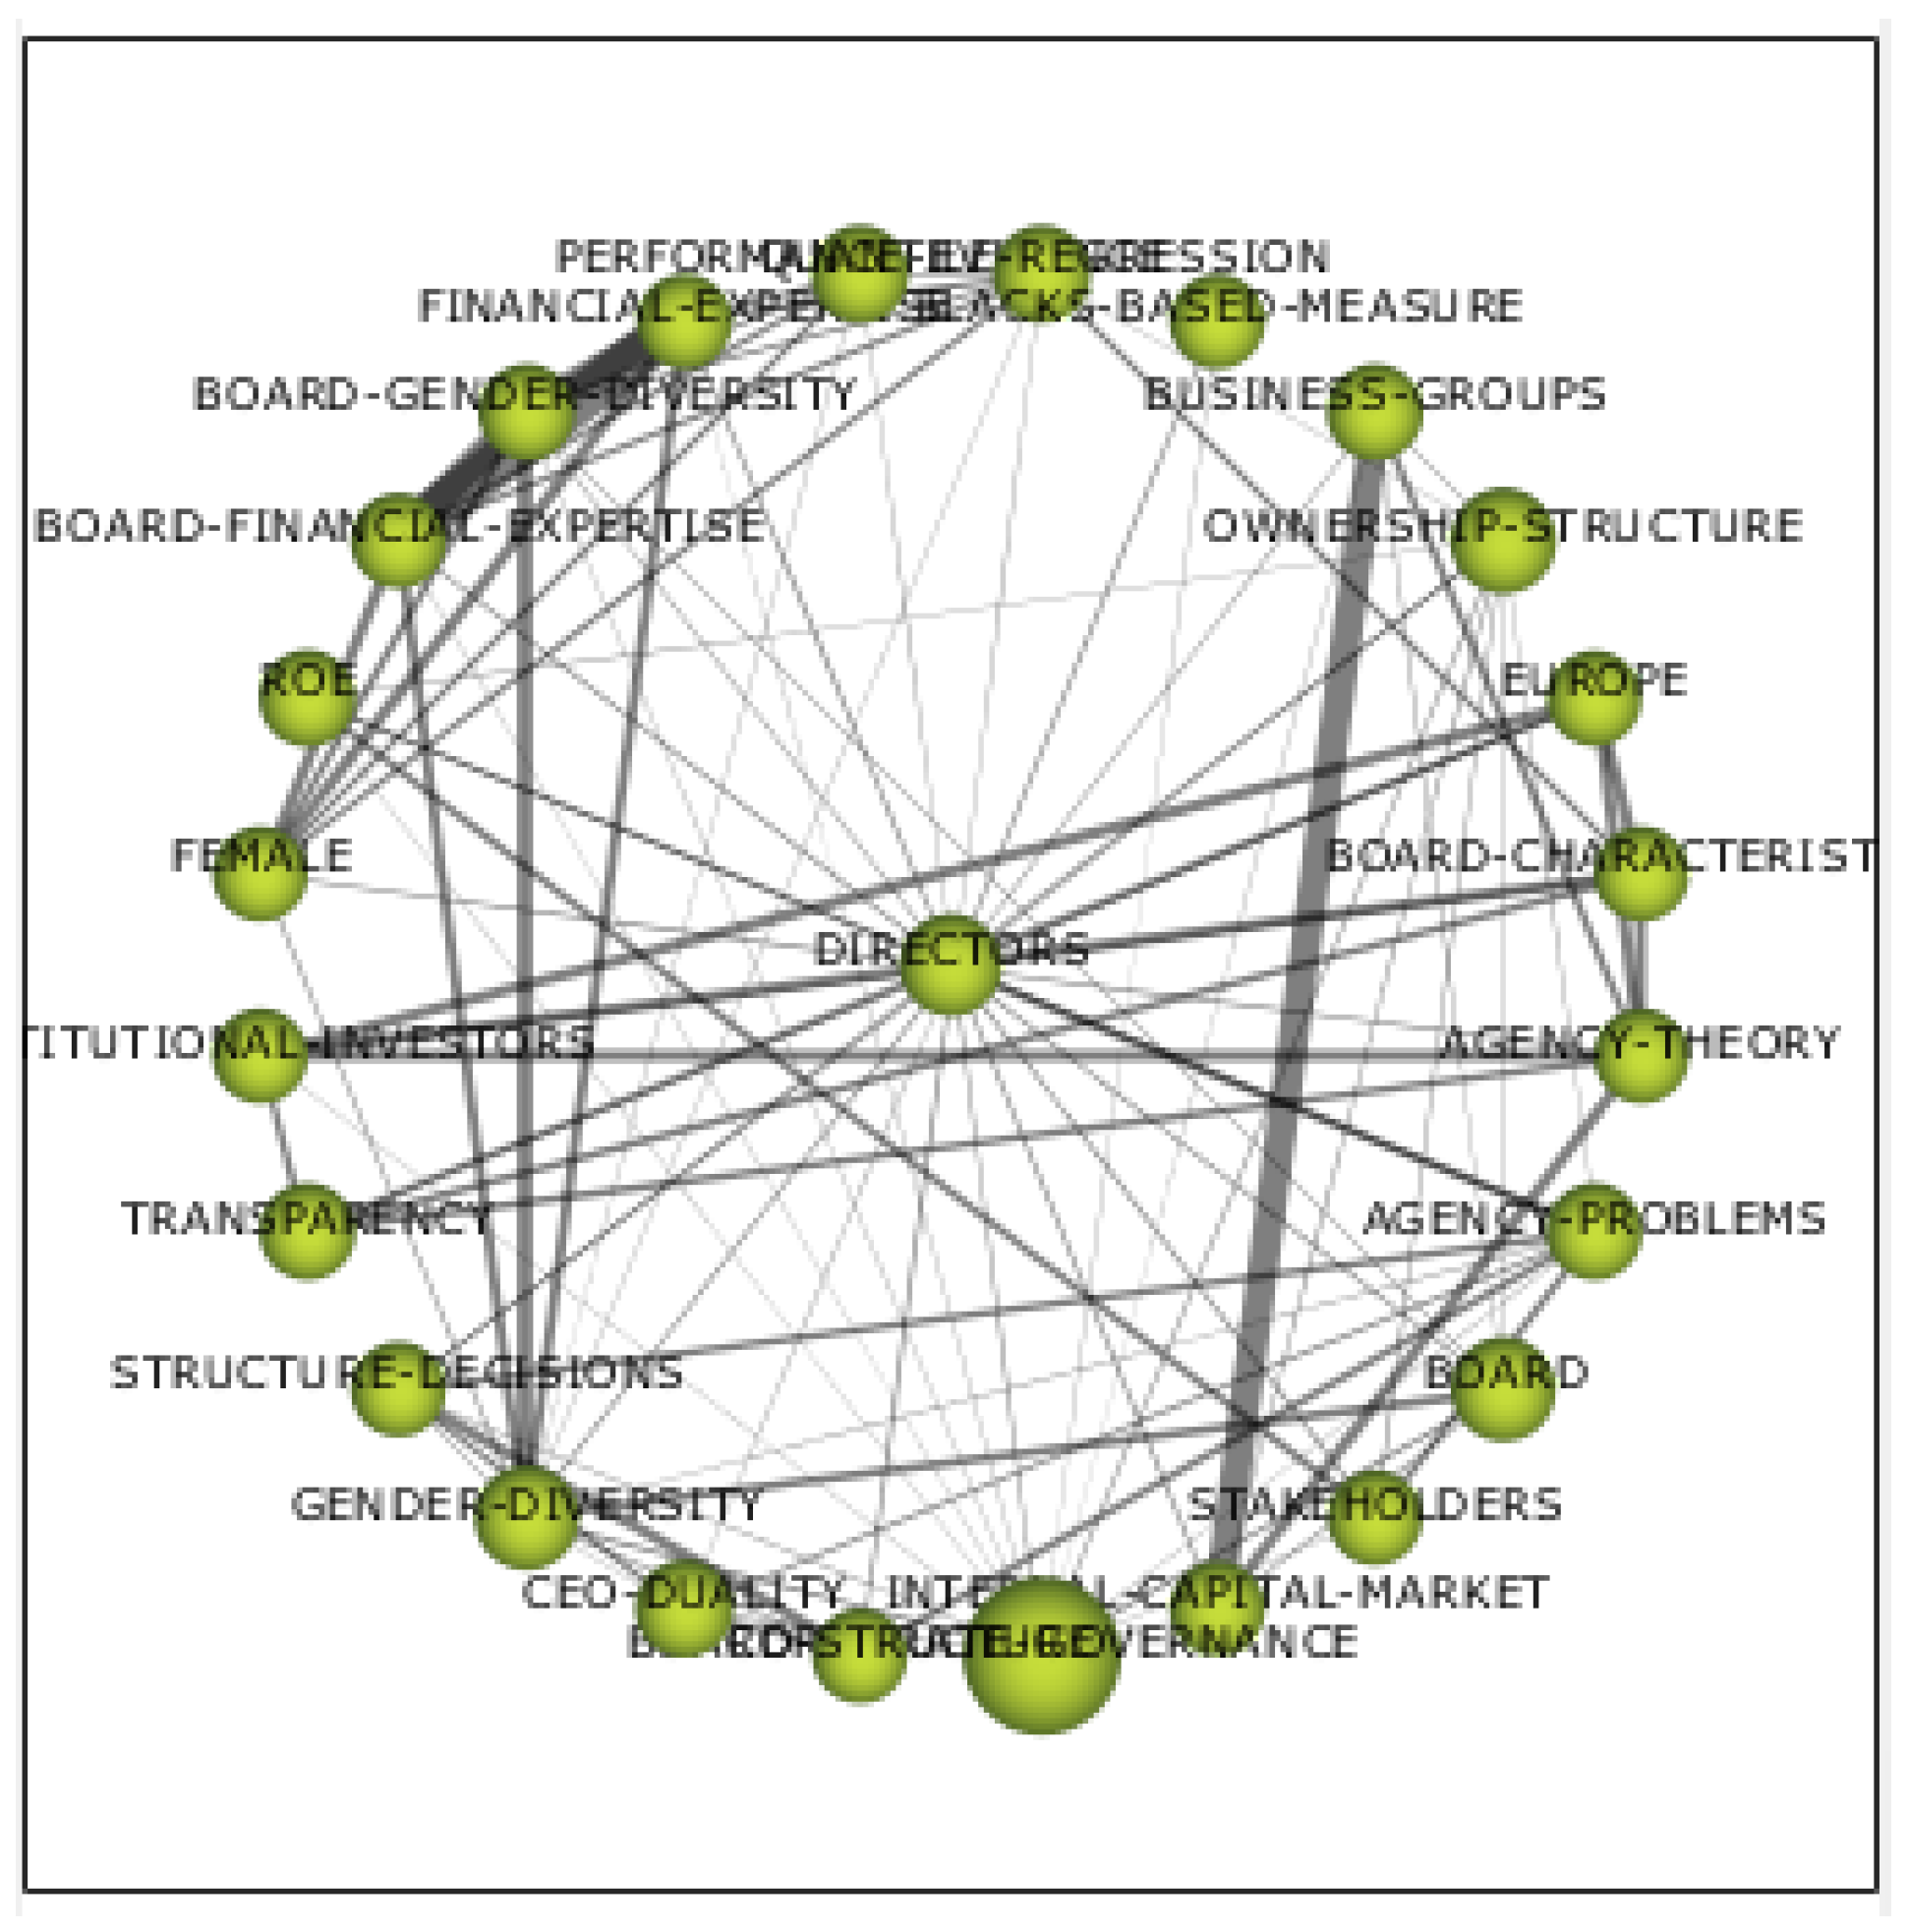
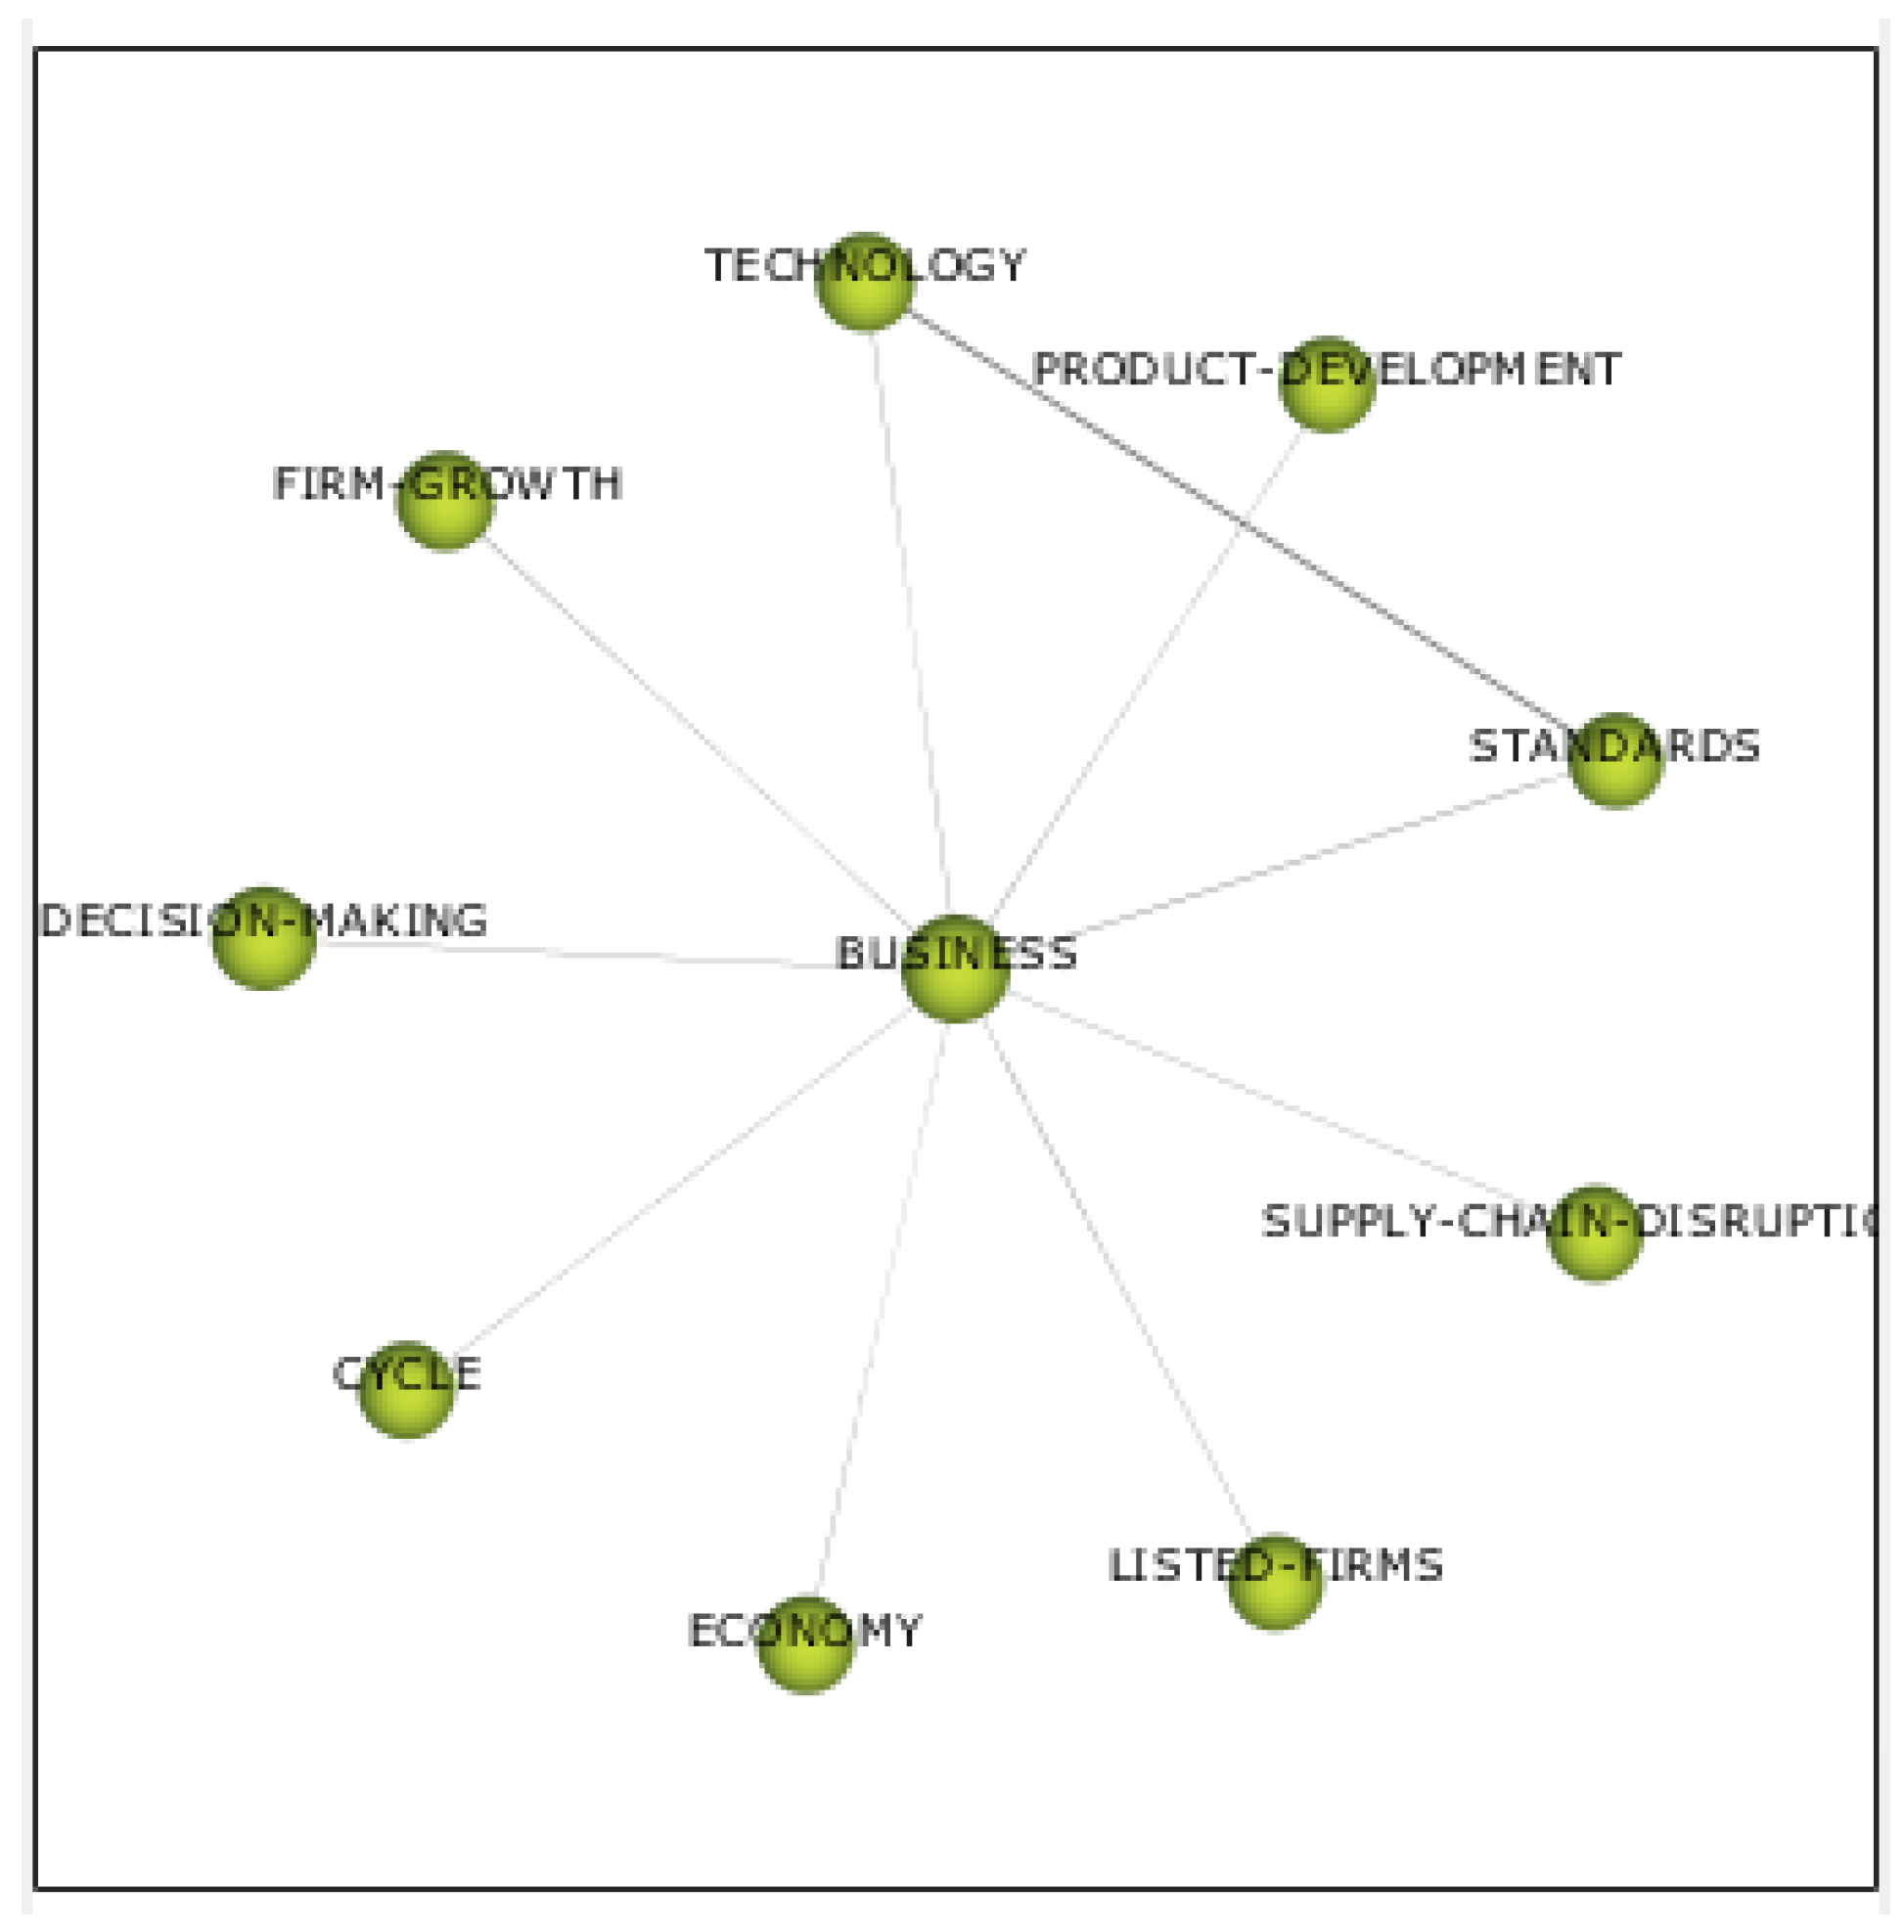
Looking at the period covering all years (Table 5 and Figure 10), we find that Trade Credit is the main motor theme of the research in working capital, appearing in 888 papers. It makes a lot of sense to talk about Trade Credit and Working Capital, as the former is a major component of the latter. It is also the most focused-upon topic, i.e., the one that is most closely related to the other topics (Figure 11). Slightly lower are Business with 100 articles and Directors and Innovation with 50 articles.
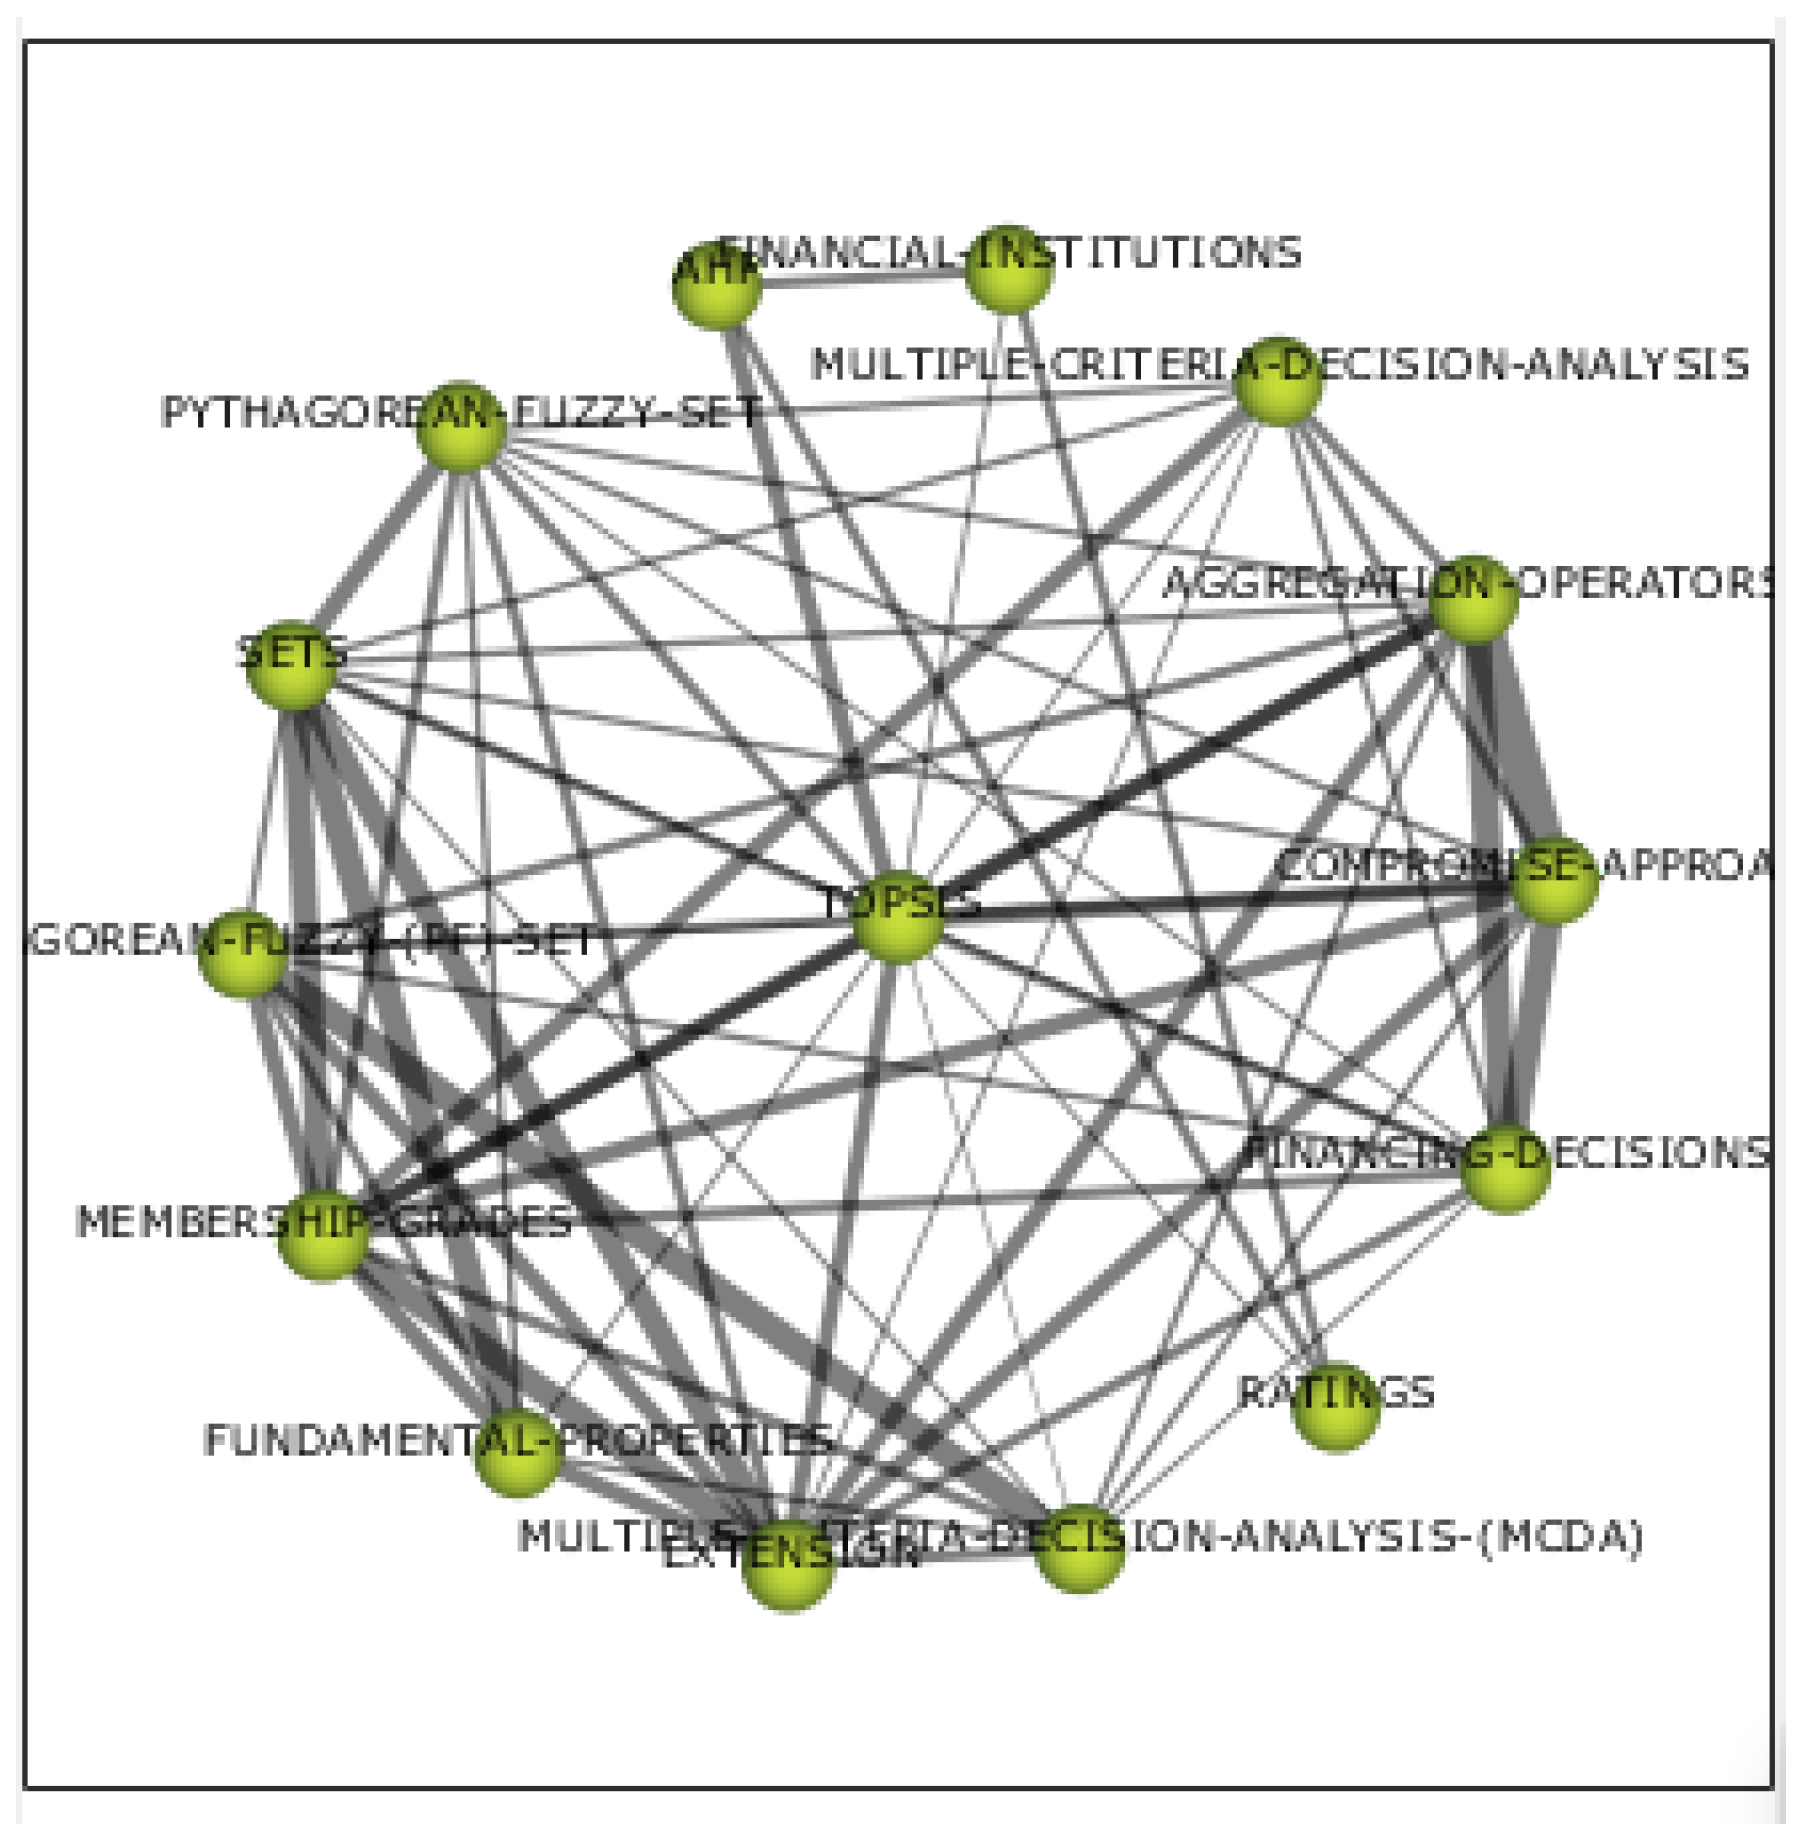
The emerging themes for all periods include Financial, Systems, and Prices, which appear in all periods, and Trade, which remains an emerging theme. Within the basic and cross-cutting themes, we find 11 different themes ranging from Capital Structure to Firm Performance and Credit. Finally, Topsis (Technique for Order of Preference by Similarity to Ideal Solution) is the most developed theme. Although it appears as the most dense theme, it seems to be related to themes that are not related to the economy, as can be seen in Figure 12.
It is worth noting the large number of Motor themes whose relationships are shown in Figure 13, Figure 14, Figure 15, Figure 16 and Figure 17, all of which are dense and interrelated, but not very focused, i.e., not very closely related to each other. Only the centrality of the Trade Credit theme, shown in Figure 11, is noteworthy.
Thus, with this work, it has been possible to confirm the existence of a wide range of existing themes in relation to the central theme of working capital throughout the entire analysis section.
When analysing the most productive and most cited authors in this field, we find that Hofmann, Erik has more than 2500 citations. The article “A Supply Chain-Oriented Approach To Working Capital Management” is his second most cited article with 174 citations. In terms of journals in which working capital research has been published, Sustainability stands out as the journal that has published the most articles, with 54. The second most published journal is Management Science with 36 papers.
Additionally, we would like to point out that we found no work dedicated to a pure bibliometric review of working capital.
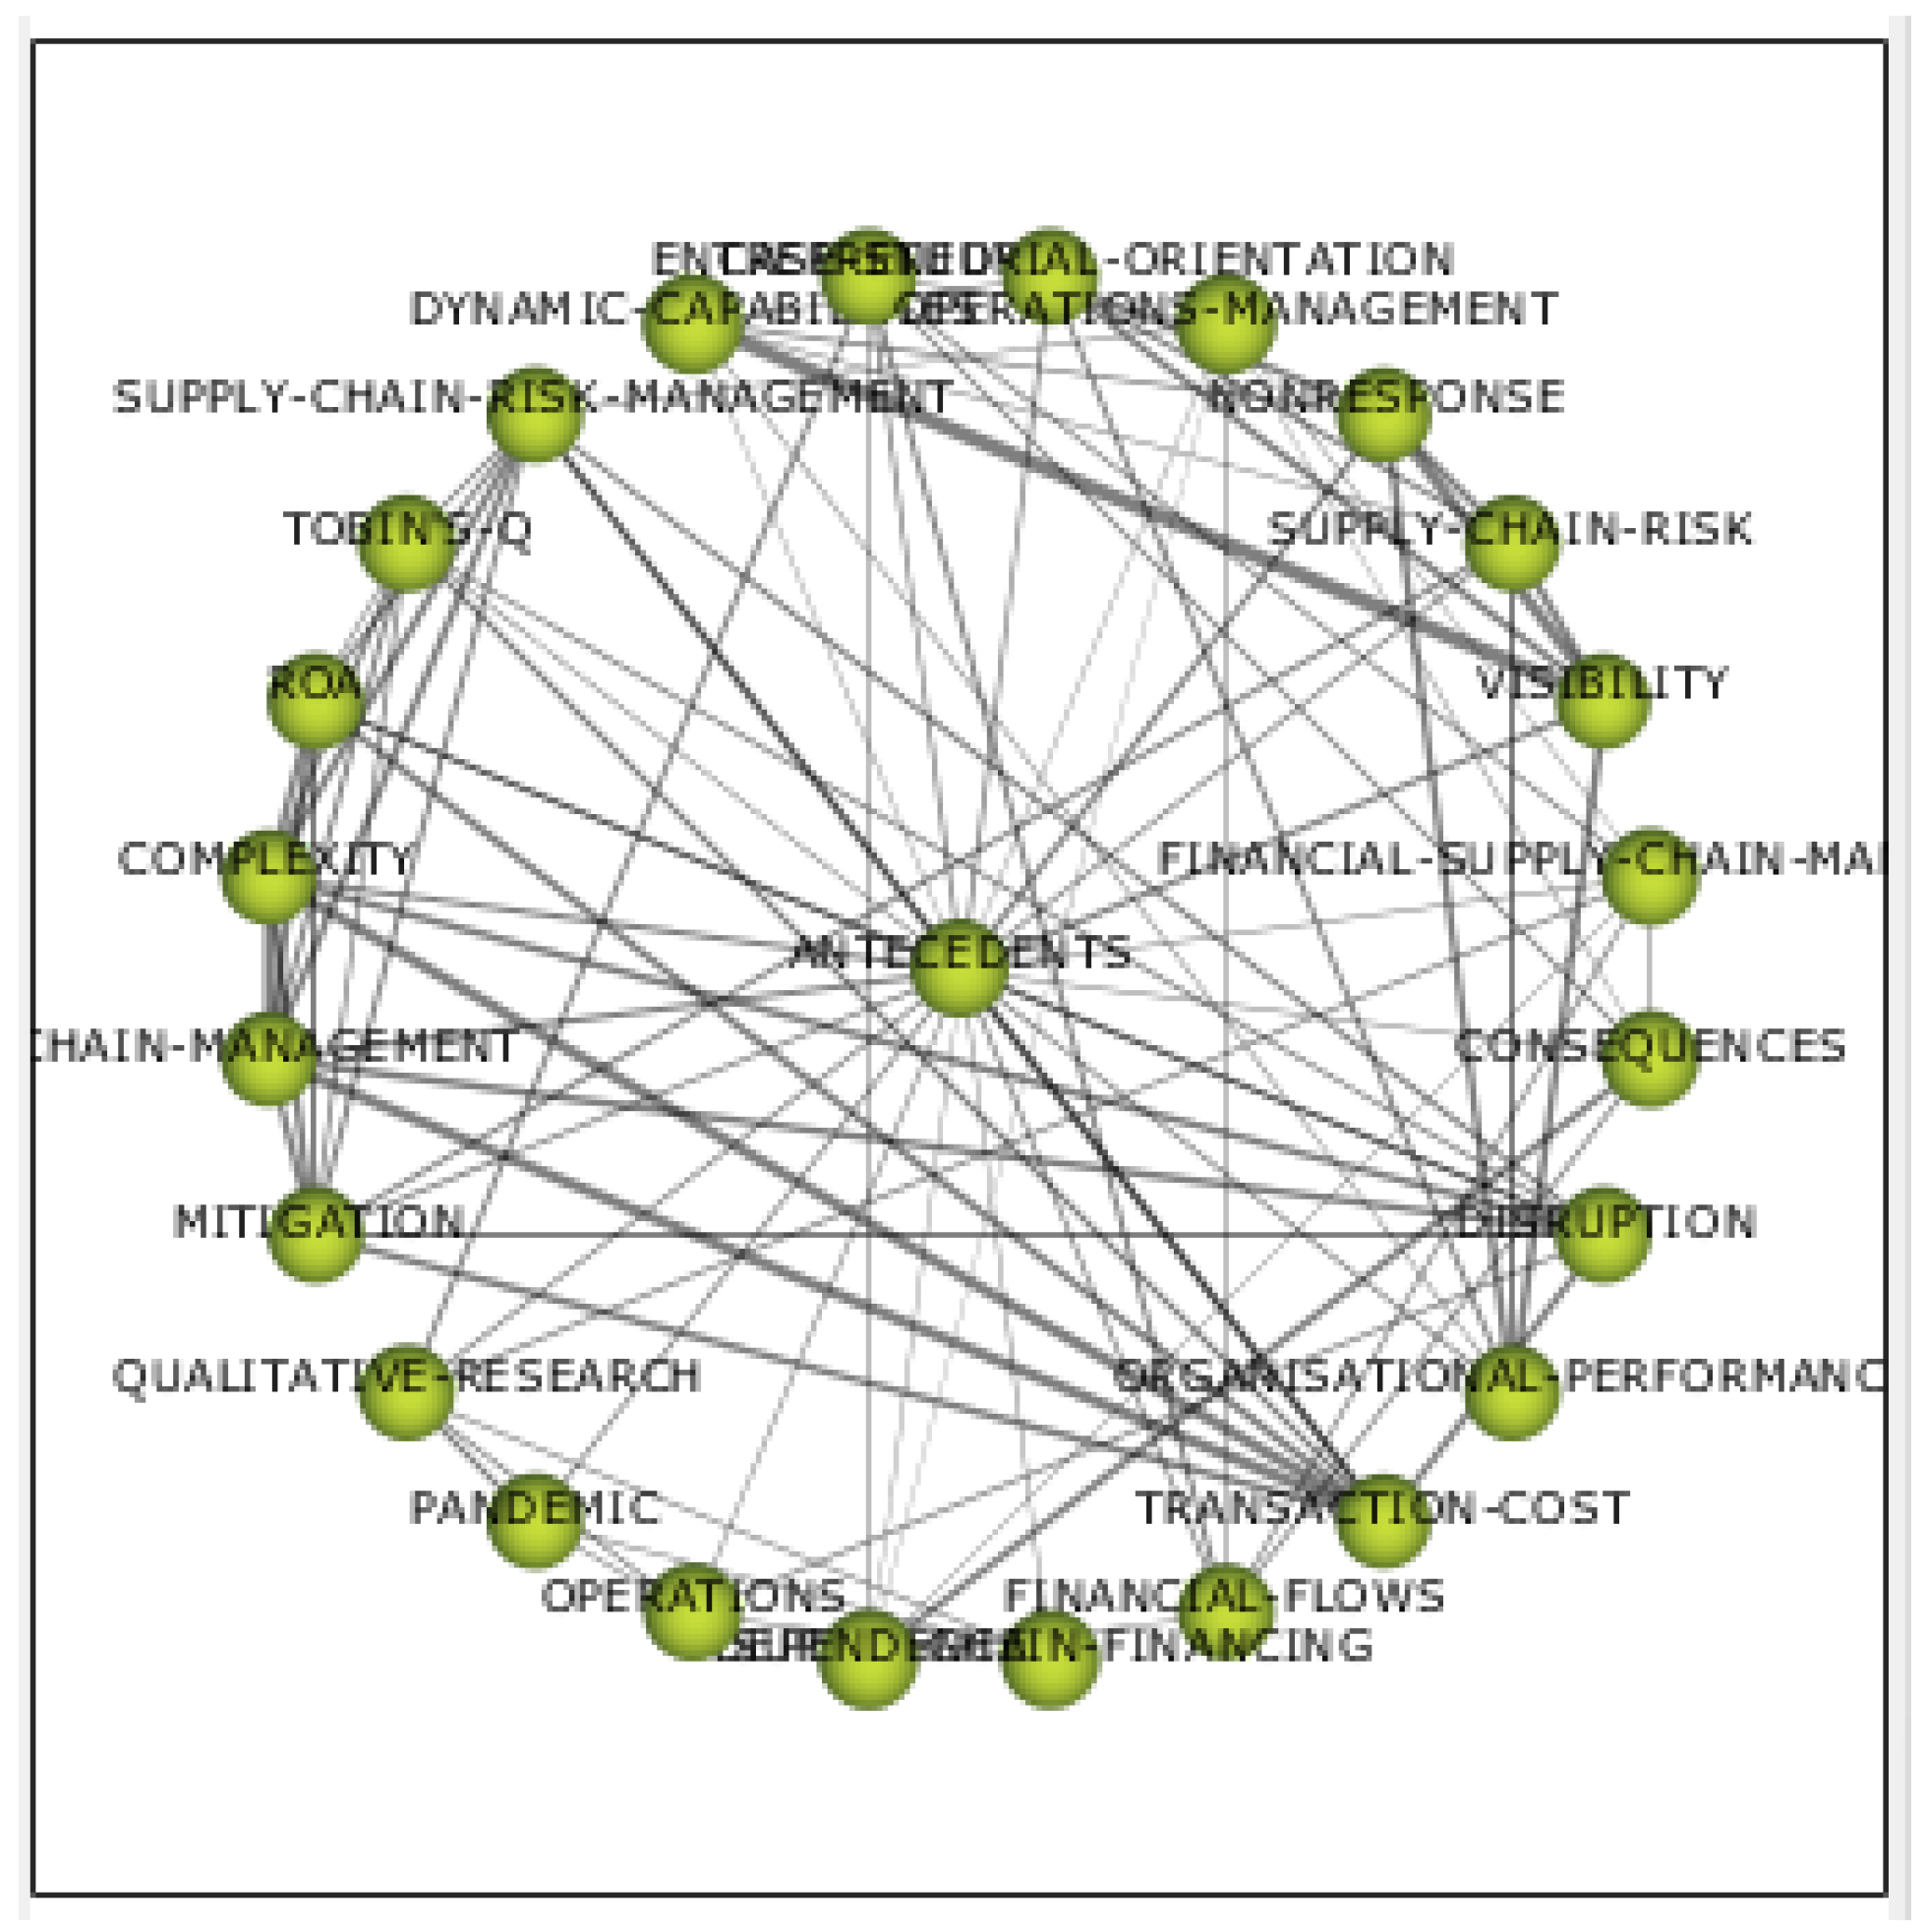
One of the milestones of this work is the identification of the main motor themes into which this area of research can be divided. To address this issue, a keyword co-occurrence analysis was carried out using the SciMAT software (Cobo et al. 2012; Paule-Vianez et al. 2020), from which we obtained eight motor themes in working capital research, which are Trade Credit with 888 references, Directors, Antecedents, Business Cycle, Innovation, Flow, China, and G32.
Finally, it is worth mentioning the possible emerging themes in the topics related to the study of working capital as an essential component in an optimal financial structure of the company, and these are Trade, Gender, Return on Assets, Framework, Financial Performance, and Choice.
4. Conclusions and Limitations
To highlight the importance of working capital analysis in the field of corporate finance, a bibliometric analysis was conducted. This analysis assesses the scholarly output of the field and its constituent themes through a co-occurrence analysis of keywords. The results shed light on the research direction of the analysed field, taking into account the emerging themes identified through the SciMAT software analysis.
Working capital analysis was found to be a mature area of research. The main contribution of this study is the identification of themes that underpin current research in the area, resulting in a total of eight themes. These eight motor themes in working capital research include Trade Credit, which stands out with 888 references, Directors, Antecedents, Business Cycle, Innovation, Flow, China, and G32. Trade Credit, particularly the aspect of commercial creditors as a historical source of business finance, is of particular importance within the analysis.
In light of these findings, we confidently assert that the study of working capital is a recurring and particularly important topic in the financial sector, and is significantly influenced by other areas ranging from agriculture to mathematics. Trade credit emerges as the most critical issue, although the importance of the other issues should not be undermined.
A limitation that we encountered when conducting this work is the non-existence of bibliometric reviews on working capital in the scientific literature, preventing a good discussion of the results. The use of the WOS database may also have limited the field of study, although it is true that it is the database with the highest impact indexes for the publications that are hosted there.
Author Contributions
Conceptualization, Á.-S.M.S., E.C.-C. and E.M.M.; Methodo ogy, Á.-S.M.S., C.D.C., E.C.-C. and E.M.M.; Resources, Á.-S.M.S. and E.C.-C.; Writing—Á.-S.M.S. and E.M.M.; Writing—review and editing, all authors. All authors have read and agreed to the published version of the manuscript.
Funding
This study was carried out without funding.
Institutional Review Board Statement
Not applicable.
Informed Consent Statement
Not applicable.
Data Availability Statement
Data are contained within the article.
Acknowledgments
We acknowledge the use of AI tools in the translation process of this work.
Conflicts of Interest
The research was conducted in the absence of any commercial or financial relationships that could be construed as a potential conflict of interest by all authors.
References
- Abuzayed, Bana. 2012. Working capital management and firms’ performance in emerging markets: The case of Jordan. International Journal of Managerial Finance 8: 155–79. [Google Scholar] [CrossRef]
- Aktas, Nihat, Ettore Croci, and Dimitris Petmezas. 2015. Is working capital management value-enhancing? Evidence from firm performance and investments. Journal of Corporate Finance 30: 98–113. [Google Scholar] [CrossRef]
- Almeida, Fernando, José Morais, and José Duarte Santos. 2022. A Bibliometric Analysis of the Scientific Outcomes of European Projects on the Digital Transformation of SMEs. Publications 10: 34. [Google Scholar] [CrossRef]
- Almodóvar González, Manuel, Antonio Fernández Portillo, and Ángel Sabino Mirón. 2020. Cálculo de costes en la programación agregada de la producción. Available online: http://dehesa.unex.es/handle/10662/10678 (accessed on 15 November 2023).
- Arik, Beril T., and Engin Arik. 2017. “Second language writing” publications in web of science: A bibliometric analysis. Publications 5: 4. [Google Scholar] [CrossRef]
- Azhar, Nor Edi, Binti Mohamad, Noriza Binti, and Mohd Saad. 2010. Working Capital Management: The Effect of Market Valuation and Profitability in Malaysia. International Journal of Business and Management 5: 140. [Google Scholar] [CrossRef]
- Bach, Mirjana Pejic, Živko Krstič, Saj Seljan, and Lejla Turulja. 2019. Text mining for big data analysis in financial sector: A literature review. Sustainability 11: 1277. [Google Scholar] [CrossRef]
- Baños-Caballero, Solano, Pedro Juan García-Teruel, and Pedro Martínez-Solano. 2012. How does working capital management affect the profitability of Spanish SMEs? Small Business Economics 39: 517–29. [Google Scholar] [CrossRef]
- Börner, Katy, Chaomei Chen, and Kevin Weis Boyack. 2003. Visualizing Knowledge Domains. Available online: http://www.asis.org/Publications/ARIST/Vol37/BornerFigures.html (accessed on 11 November 2003).
- Cahlik, Tomas. 2007. Comparison of the Maps of Science. Available online: http://tucnak.fsv.cuni.cz/~cahlik/ (accessed on 12 November 2003).
- Callon, Michel, Jean Pierre Courtial, and Francoise Laville. 1991. Co-word analysis as a tool for describing the network of interactions between basic and technological research: The case of polymer chemistry. Scientometrics 22: 155–205. [Google Scholar] [CrossRef]
- Chambers, Nurgul, and Atilla Cifter. 2022. Working capital management and firm performance in the hospitality and tourism industry. International Journal of Hospitality Management 102: 103144. [Google Scholar] [CrossRef]
- Charitou, Melita Stephanou. 2016. The Effect of Working Capital Management on Firm’s Profitability: Empirical Evidence From an Emerging Market. Journal of Business & Economics Research-Third Quarter 14: 111–17. [Google Scholar]
- Cobo, Manuel Jesús, Aantonio Gabriel Lõpez-Herrera, Enrique Herrera-Viedma, and Francisco Herrera. 2012. SciMAT: A new science mapping analysis software tool. Journal of the American Society for Information Science and Technology 63: 1609–30. [Google Scholar] [CrossRef]
- Dardas, Lafeta Ali, Ahmad Malkawi, Sami Sweis, Nadia Sweis, Amjad Al-Khayat, and Faleh Sawair. 2023. Mapping Two Decades of Research Productivity in the Middle Eastern and Arab Countries: A Comprehensive Bibliometric Analysis. Publications 11: 48. [Google Scholar] [CrossRef]
- De Moya-Anegón, Felix, Zaida Chinchilla-Rodríguez, Ester Corera-Álvarez, Antonio González-Molina, Carmen López-Illescas, and Benjamín Vargas-Quesada. 2010. Fundación Española para la Ciencia y la Tecnología, FECYT, 2013 Dirección del Equipo de Investigación: Equipo de investigación. Available online: https://www.fecyt.es/es/publicacion/analisis-de-la-presencia-de-las-revistas-cientificas-espanolas-en-el-jcr-de-2010 (accessed on 18 November 2003).
- Ece, Arslan, and Güven Sayılgan. 2020. Macroeconomic Determinants of Financial Distress in Turkey: An Econometric Analysis. Australasian Accounting, Business and Finance Journal 14: 86–107. [Google Scholar] [CrossRef]
- Enqvist, Julius, Michael Graham, and Jussi Nikkinen. 2014. The impact of working capital management on firm profitability in different business cycles: Evidence from Finland. Research in International Business and Finance 32: 36–49. [Google Scholar] [CrossRef]
- Fernández-Portillo, Antonio, Juan C. Díaz-Casero, María C. Sánchez-Escobedo, and Ricardo Y. Hernández-Mogollón. 2017. Certified knowledge of business failure: A bibliometric analysis of the period 1965–2012 Contenido. Revista Espacios 40: 18. [Google Scholar]
- García-López, Maria.-José, and Francisco Pérez-Hernández. 2024. Mapping Research on Natural Capital Accounting: A Strategic Challenge for Multinational Firms. Administrative Sciences 14: 28. [Google Scholar] [CrossRef]
- Ghahtarani, Alireza, Majid Sheikhmohammady, and Mahdieh Rostami. 2020. The impact of social capital and social interaction on customers’ purchase intention, considering knowledge sharing in social commerce context. Journal of Innovation & Knowledge 5: 191–99. [Google Scholar] [CrossRef]
- Gitman, Lawrence J. n.d. Principles of Managerial Finance Brief. Pearson. Available online: http://elivresz-ir.ezyro.com/05-verda-jast-jr-8/principles-of-managerial-finance-brief-3rd-editi-ebook.pdf (accessed on 13 January 2024).
- González-Alcaide, Gregorio, Máxima Bolaños-Pizarro, José Manuel Ramos-Rincón, and Feix Gutiérrez-Rodero. 2024. Análisis bibliométrico de la producción científica española en Enfermedades Infecciosas y en Microbiología (2014–2021). Enfermedades Infecciosas y Microbiología Clínica 42: 42–50. [Google Scholar] [CrossRef] [PubMed]
- Gorondutse, Abdullahi Hassan, Raja Affendi Ali, Ahmed Abubakar, and Muhammad Nura Ibrahim Naalah. 2017. Wpływ zarządzania kapitałem pracy na rentowność mśp w malezji. Polish Journal of Management Studies 16: 99–109. [Google Scholar] [CrossRef]
- Jalil, Muhammad Farhan, Bilal Tariq, Muhammad Asif Zaheer, and Zeeshan Ahmed. 2023. Responses to COVID-19, small and medium enterprises’ corporate social responsibility and psychological capital of employees: From the mediating perspective of affective commitment. Heliyon 9: e15004. [Google Scholar] [CrossRef]
- Kaddumi, Thair, and Imad Z. Ramadan. 2012. Profitability and Working Capital Management: The Jordanian Case. International Journal of Economics and Finance 4: 217–26. [Google Scholar] [CrossRef]
- Kirby, Andrew. 2023. Exploratory Bibliometrics: Using VOSviewer as a Preliminary Research Tool. Publications 11: 10. [Google Scholar] [CrossRef]
- Kiyosaki, Robert. 2011. Rich Dad’s Cashflow Quadrant: Guide to Financial Freedom. Scottsdale: Plata Publishing. [Google Scholar]
- Knauer, Thorsten, and Arnt Wöhrmann. 2013. Working capital management and firm profitability. Journal of Management Control 24: 77–87. [Google Scholar] [CrossRef]
- López Núñez, Juan Antonio, Jesús López-Belmonte, Antonio José Moreno-Guerrero, Magdalena Ramos Navas-Parejo, and Francisco Javier Hinojo-Lucena. 2020. Education and diet in the scientific literature: A study of the productive, structural, and dynamic development in web of science. Sustainability 12: 4838. [Google Scholar] [CrossRef]
- Maleki Nia, Nahid, Hosein Asgari Alouj, Azam Gezelbash, and Seyed Masoud Sajjadian Amiri. 2005. Iran Address: Municipal No.8-2-603/11, Flat No. 201, Second Floor Zehra Nagar. American Journal of Scientific Research. Available online: http://www.eurojournals.com/ajsr.htm (accessed on 21 November 2023).
- Martín-De Castro, Gregorio, and Miriam Delgado-Verde. 2012. Assessing Knowledge Assets in Technology-Intensive Firms: Proposing a Model of Intellectual Capital. Journal of CENTRUM Cathedra (JCC) The Business and Economics Research Journal 5: 43–59. [Google Scholar] [CrossRef]
- Miguel, Sandra, Ely Francina Tannuri de Oliveira, and Maria Claudia Cabrini Grácio. 2016. Scientific production on open access: A worldwide bibliometric analysis in the academic and scientific context. Publications 4: 1. [Google Scholar] [CrossRef]
- Mirón-Sanguino, Ángel Sabino, and Carlos Díaz-Caro. 2022. The Agricultural Cooperative as an Instrument for Economic Development: An Approach from Spanish Investors’ Preferences through a Choice Experiment. Agronomy 12: 560. [Google Scholar] [CrossRef]
- Mirón-Sanguino, Ángel Sabino, Eva Crespo-Cebada, and Carlos Díaz-Caro. 2021. Do sticky costs influence corporate profit?: An approach based on Spanish agricultural companies | ¿Influyen los costes pegajosos en el beneficio empresarial? una aproximación a partir de empresas agrarias españolas. Custos e Agronegocio 17: 216–38. [Google Scholar]
- Mirón-Sanguino, Angel Sabino, Eva Crespo-Cebada, and Carlos Díaz-Caro. 2023. Does the type of company influence sticky costs? An assessment of Spanish agricultural companies | ¿Influye el tipo de empresa en los costes pegajosos? Una valoración en las empresas agrarias españolas. ITEA Informacion Tecnica Economica Agraria 119: 158–71. [Google Scholar] [CrossRef]
- Moss, Jimmy, and Bert Stine. 1993. Cash conversion cycle and firm size: A study of retail firms. Managerial Finance 19: 25. [Google Scholar] [CrossRef]
- Mwangi, Lucy Wamugo, Muathe Stephen Makau, and George Kosimbei. 2014. Effects of Working Capital Management on Performance of Non-Financial Companies Listed In NSE, Kenya. European Journal of Business and Management 6: 195–205. [Google Scholar]
- Nanda, Swagatika, and Ajaya Kumar Panda. 2018. The determinants of corporate profitability: An investigation of Indian manufacturing firms. International Journal of Emerging Markets 13: 66–86. [Google Scholar] [CrossRef]
- Nazir, Mian Sajid, Talat Afza, and Mian Sajid Nazir. 2007. Is it Better to be Aggressive or Conservative in Managing Working Capital? Journal of Quality and Technology Management. Available online: https://www.researchgate.net/publication/259828572 (accessed on 14 November 2023).
- Paule-Vianez, Jessica, Raul Gómez-Martínez, and Camilo Prado-Román. 2020. A bibliometric analysis of behavioural finance with mapping analysis tools. European Research on Management and Business Economics 26: 71–77. [Google Scholar] [CrossRef]
- Pérez-Méndez, José Antonio, and Beatriz García-Cornejo. 2009. Gestión del Capital Circulante y Rentabilidad en Pymes. Available online: https://www.researchgate.net/publication/306079968 (accessed on 15 November 2023).
- Ponsian, Ntui. 2014. The Effect of Working Capital Management on Profitability. International Journal of Economics, Finance and Management Sciences 2: 347. [Google Scholar] [CrossRef]
- Raheman, Abdul, Talat Afza, Abdul Qayyum, and Mahmood Ahmed Bodla. 2010. Working Capital Management and Corporate Performance of Manufacturing Sector in Pakistan. International Research Journal of Finance and Economics-Issue 47: 156–69. Available online: http://www.eurojournals.com/finance.htm (accessed on 14 November 2023).
- Ramiah, Vikadh, Yilang Zhao, and Imad Moosa. 2014. Working capital management during the global financial crisis: The Australian experience. Qualitative Research in Financial Markets 6: 332–51. [Google Scholar] [CrossRef]
- Ren, Ting, Nan Liu, Hongyan Yang, Youzhi Xiao, and Yijun Hu. 2019. Working capital management and firm performance in China. Asian Review of Accounting 27: 546–62. [Google Scholar] [CrossRef]
- Rogoff, Kenneth. 2020. Falling Real Interest Rates, Rising Debt: A Free Lunch? Journal of Policy Modeling 42: 778–90. [Google Scholar] [CrossRef]
- Senarathne, Chamil Wansaja, and Viraj Malawana. 2019. Capital structure, working capital management and potential growth of a business: The case of the sri lankan stockbroking industry. Asia-Pacific Management Accounting Journal 14: 19–40. [Google Scholar] [CrossRef]
- Small, Henry. 1999. Visualizing Science by Citation Mapping. Journal of the American Society for Information Science 50: 799–813. [Google Scholar] [CrossRef]
- Sudiyatno, Bambang, Elen Puspitasari, and Sri Sudarsi. 2017. Working Capital, Firm Performance, and Firm Value: An Empirical Study in Manufacturing Industry on Indonesia Stock Exchange. Economics World 5: 444–50. [Google Scholar] [CrossRef]
- Vaccaro, Gustavo, Pablo Sánchez-Núñez, and Patricia Witt-Rodríguez. 2022. Bibliometrics Evaluation of Scientific Journals and Country Research Output of Dental Research in Latin America Using Scimago Journal and Country Rank. Publications 10: 26. [Google Scholar] [CrossRef]
- Vahid, Taghizadeh Khanqah, Ghanavati Elham, Akbari Khosroshahi Mohsen, and Ebrati Mohammadreza. 2012. Working Capital Management and Corporate Performance: Evidence from Iranian Companies. Procedia—Social and Behavioral Sciences 62: 1313–18. [Google Scholar] [CrossRef]
- Van Raan, Anthony Ton F. J. 2005. For Your Citations Only? Hot Topics in Bibliometric Analysis. Measurement: Interdisciplinary Research and Perspectives 3: 50–62. [Google Scholar] [CrossRef]
- Victoria, María, and Postigo Jiménez. 2003. Aproximación Bibliométrica. Available online: www.sitkis.org (accessed on 26 November 2023).
- Williamson, Oliver E. 2002. The Lens of Contract: Private Ordering. The American Economic Review 92: 438–43. [Google Scholar] [CrossRef]
- Wilson, Nicholas, Barbara Summers, and Robert Hope. 2000. Using payment behaviour data for credit risk modelling. International Journal of the Economics of Business 7: 333–46. [Google Scholar] [CrossRef]
- Zambrano Farías, Fernando José, María Del Carmen Valls Martínez, and Pedro Antonio Martín-Cervantes. 2022. Profitability determinants of the natural stone industry: Evidence from Spain and Italy. PLoS ONE 17: e0276885. [Google Scholar] [CrossRef]
- Zheng, Xiaotian, Youcheng Zhou, and Sajid Iqbal. 2022. Working capital management of SMEs in COVID-19: Role of managerial personality traits and overconfidence behavior. Economic Analysis and Policy 76: 439–51. [Google Scholar] [CrossRef]
- Zimon, Grzegorz, and Hossein Tarighi. 2021. Effects of the COVID-19 Global Crisis on the Working Capital Management Policy: Evidence from Poland. Journal of Risk and Financial Management 14: 169. [Google Scholar] [CrossRef]
Figure 1.
Flow chart of methodology. Source: Authors’ own elaboration.

Figure 2.
Tree map of the main WOS categories. Source: Authors’ own elaboration from WOS data.

Figure 3.
Number of articles in each research area. Source: Authors’ own elaboration from WOS data.

Figure 4.
Documents per keyword: Evolution over time. Source: Authors’ own elaboration.

Figure 5.
Documents per keyword. Distribution over time. Source: Authors’ own elaboration.

Figure 6.
Strategic diagram of keywords from publications in the period until 2019. Source: Authors’ own elaboration.
Figure 6.
Strategic diagram of keywords from publications in the period until 2019. Source: Authors’ own elaboration.

Figure 7.
Cluster network for the Determinants theme. Source: Authors’ own elaboration.

Figure 8.
Strategic diagram of the keywords from publications in the period 2020–2024. Source: Authors’ own elaboration.
Figure 8.
Strategic diagram of the keywords from publications in the period 2020–2024. Source: Authors’ own elaboration.

Figure 9.
Cluster network for the Investment theme. Source: Authors’ own elaboration.

Figure 10.
Strategic diagram of the keywords from publications in the period of all years. Source: Authors’ own elaboration.
Figure 10.
Strategic diagram of the keywords from publications in the period of all years. Source: Authors’ own elaboration.

Figure 11.
Cluster network for the Trade Credit theme. Source: Authors’ own elaboration.

Figure 12.
Cluster network for the Topsis theme. Source: Authors’ own elaboration.

Figure 13.
Cluster network for the Antecedents theme. Source: Authors’ own elaboration.

Figure 14.
Cluster network for the Directors theme. Source: Authors’ own elaboration.

Figure 15.
Cluster network for the Business theme. Source: Authors’ own elaboration.

Figure 16.
Cluster network for the Innovation theme. Source: Authors’ own elaboration.

Figure 17.
Cluster network for the Flow theme. Source: Authors’ own elaboration.


Table 1.
Working capital definitions.
| AUTHOR | TERM | DEFINITION |
|---|---|---|
| Wilson et al. (2000) | Working capital | Managing day-to-day operations in the short-term |
| Vahid et al. (2012) | Working capital management | Management plays a critical role in the success or failure of a business through its liquidity and risk |
| Aktas et al. (2015) | Working capital | Internal funding resource that provides liquidity to fund short-term obligations |
| Nanda and Panda (2018) | Working capital and liquidity | More working capital could lead to high liquidity costs |
Source: Authors’ own elaboration.
Table 2.
Document and keyword distribution per year.
| Statistic Information | ||
|---|---|---|
| Periods | Documents | Keywords |
| All Years | 3.732 | 3.870 |
| Years 2020–2024 | 1.692 | 2.538 |
| Until 2019 | 2.040 | 2.142 |
Source: Authors’ own elaboration.
Table 3.
Characteristics of the strategic diagram of the period until 2019.
| Theme | Centrality | Centrality Range | Density | Density Range |
|---|---|---|---|---|
| BUSINESS CYCLE | 192.94 | 0.37 | 39.24 | 1 |
| DETERMINANTS | 392.12 | 1 | 24.8 | 0.74 |
| SUPPLY CHAIN MANAGEMENT | 240.28 | 0.89 | 23.4 | 0.58 |
| AGENCY COSTS | 226.39 | 0.68 | 21.2 | 0.47 |
| PAYMENTS | 183.15 | 0.32 | 35.71 | 0.95 |
| EARNINGS | 195.42 | 0.42 | 28.38 | 0.89 |
| PRICES | 206.95 | 0.53 | 24.14 | 0.68 |
| RISKS | 235.93 | 0.79 | 16.43 | 0.32 |
| GROWTH | 225.2 | 0.63 | 18.11 | 0.37 |
| FIRM PERFORMANCE | 240.41 | 0.95 | 18.96 | 0.42 |
| DEMAND | 233.21 | 0.74 | 27.24 | 0.84 |
| EARNINGS MANAGEMENT | 206.88 | 0.47 | 25.16 | 0.79 |
| COST | 213.13 | 0.58 | 12.19 | 0.21 |
| CREDIT | 240.15 | 0.84 | 6.27 | 0.05 |
| EFFICIENCY | 140.01 | 0.26 | 13.4 | 0.26 |
| FIRM PROFITABILITY | 130.35 | 0.16 | 10.25 | 0.11 |
| BEHAVIOUR | 132.78 | 0.21 | 23.94 | 0.63 |
| INPUT | 81.8 | 0.05 | 23.3 | 0.53 |
| FINANCIAL RATIOS | 89.43 | 0.11 | 10.51 | 0.16 |
Source: Authors’ own elaboration.
Table 4.
Characteristics of the strategic diagram of the period 2020–2024.
| Theme | Centrality | Centrality Range | Density | Density Range |
|---|---|---|---|---|
| COORDINATION | 232.87 | 0.57 | 34.72 | 0.9 |
| G32 | 265.74 | 0.9 | 47.37 | 1 |
| CHINA | 236.3 | 0.67 | 31.27 | 0.71 |
| BANKRUPTCY PREDICTION | 204.99 | 0.33 | 37.71 | 0.95 |
| STRATEGIES | 213.17 | 0.38 | 31.41 | 0.76 |
| INVESTMENT | 408.31 | 1 | 26.92 | 0.67 |
| SYSTEMS | 194.72 | 0.29 | 16.69 | 0.52 |
| INNOVATION | 235.96 | 0.62 | 32.86 | 0.86 |
| OWNERSHIP | 239.73 | 0.76 | 15.06 | 0.43 |
| MARKET | 222.93 | 0.48 | 24.72 | 0.62 |
| CREDIT | 260.98 | 0.81 | 13.96 | 0.38 |
| FINANCE | 265.02 | 0.86 | 13.29 | 0.29 |
| QUALITY | 236.32 | 0.71 | 12.45 | 0.14 |
| FINANCIAL PERFORMANCE | 214.09 | 0.43 | 17.1 | 0.57 |
| POLICY | 223.05 | 0.52 | 12.72 | 0.24 |
| EMPIRICAL EVIDENCE | 295.09 | 0.95 | 9.99 | 0.05 |
| FRAMEWORK | 187.97 | 0.24 | 12.44 | 0.1 |
| TRADE | 126.8 | 0.19 | 12.49 | 0.19 |
| ENTERPRISE | 104.93 | 0.1 | 32.85 | 0.81 |
| RETURN-ON-ASSET | 71.92 | 0.05 | 15.9 | 0.48 |
| GENDER | 115.41 | 0.14 | 13.76 | 0.33 |
Source: Authors’ own elaboration.
Table 5.
Characteristics of the strategic diagram of the period all years.
| Theme | Centrality | Centrality Range | Density | Density Range |
|---|---|---|---|---|
| BUSINESS CYCLE | 206.57 | 0.57 | 38.68 | 0.91 |
| LOGISTIC REGRESSION | 174.25 | 0.17 | 28.76 | 0.8 |
| ANTECEDENTS | 210.3 | 0.6 | 40.85 | 0.94 |
| DIRECTORS | 247.7 | 0.77 | 49.85 | 0.97 |
| FLOW | 232.06 | 0.71 | 27.2 | 0.77 |
| RESEARCH AND DEVELOPMENT | 148.96 | 0.11 | 36.04 | 0.89 |
| ACCRUALS | 268.62 | 0.94 | 21.83 | 0.66 |
| GENDER | 185.14 | 0.31 | 35.16 | 0.86 |
| TRADE CREDIT | 373.32 | 1 | 17.99 | 0.6 |
| FRAMEWORK | 193.93 | 0.43 | 17.43 | 0.54 |
| INSTITUTIONS | 200.69 | 0.49 | 16.75 | 0.51 |
| RESOURCE | 177.67 | 0.23 | 20.61 | 0.63 |
| COVID-19 | 224.26 | 0.66 | 12.01 | 0.37 |
| GENERALISED METHOD OF MOMENTS | 179.32 | 0.26 | 25.61 | 0.74 |
| INNOVATION | 206.1 | 0.54 | 31.2 | 0.83 |
| POLICIES | 182.42 | 0.29 | 23.54 | 0.69 |
| COMPANIES | 258.71 | 0.86 | 10.9 | 0.31 |
| DESING | 241.13 | 0.74 | 14.03 | 0.43 |
| CAPITAL STRUCTURE | 229.97 | 0.69 | 10.34 | 0.26 |
| CHOICE | 191.75 | 0.37 | 15.16 | 0.49 |
| SYSTEMS | 174.35 | 0.2 | 14.26 | 0.46 |
| SECTOR | 196.09 | 0.46 | 25.17 | 0.71 |
| OWNERSHIP | 249.57 | 0.8 | 8.57 | 0.17 |
| FINANCIAL PERFORMANCE | 193.42 | 0.4 | 11.5 | 0.34 |
| PREDICTION | 204, 27 | 0.51 | 12.09 | 0.4 |
| MARKET | 274.53 | 0.97 | 9.14 | 0.2 |
| PRICES | 189.72 | 0.34 | 9.41 | 0.23 |
| FIRM PERFORMANCE | 267.07 | 0.91 | 4.93 | 0.09 |
| FINANCE | 249.99 | 0.83 | 10.43 | 0.29 |
| LIQUIDITY | 264.18 | 0.89 | 7.55 | 0.11 |
| CREDIT | 217.46 | 0.63 | 2.72 | 0.03 |
| TOPSIS | 44.43 | 0.03 | 127.66 | 1 |
| TRADE | 109.63 | 0.09 | 7.55 | 0.14 |
| G32 | 158.29 | 0.14 | 17.72 | 0.57 |
| BUSINESS | 96.84 | 0.06 | 3.09 | 0.06 |
Source: Authors’ own elaboration.
Disclaimer/Publisher’s Note: The statements, opinions and data contained in all publications are solely those of the individual author(s) and contributor(s) and not of MDPI and/or the editor(s). MDPI and/or the editor(s) disclaim responsibility for any injury to people or property resulting from any ideas, methods, instructions or products referred to in the content. |
© 2024 by the authors. Licensee MDPI, Basel, Switzerland. This article is an open access article distributed under the terms and conditions of the Creative Commons Attribution (CC BY) license (https://creativecommons.org/licenses/by/4.0/).
Share and Cite
MDPI and ACS Style
Mirón Sanguino, Á.-S.; Crespo-Cebada, E.; Muñoz, E.M.; Caro, C.D. Working Capital: Development of the Field through Scientific Mapping: An Updated Review. Adm. Sci. 2024, 14, 67. https://doi.org/10.3390/admsci14040067
AMA Style
Mirón Sanguino Á-S, Crespo-Cebada E, Muñoz EM, Caro CD. Working Capital: Development of the Field through Scientific Mapping: An Updated Review. Administrative Sciences. 2024; 14(4):67. https://doi.org/10.3390/admsci14040067
Chicago/Turabian StyleMirón Sanguino, Ángel-Sabino, Eva Crespo-Cebada, Elena Muñoz Muñoz, and Carlos Diaz Caro. 2024. "Working Capital: Development of the Field through Scientific Mapping: An Updated Review" Administrative Sciences 14, no. 4: 67. https://doi.org/10.3390/admsci14040067
Note that from the first issue of 2016, this journal uses article numbers instead of page numbers. See further details here.