Customer Connections: A Cross-Cultural Investigation of Brand Experience and Brand Love in the Retail Landscape


1
Centre for Philosophical and Humanistic Studies, Universidade Católica Portuguesa, Rua de Camões, 4710-362 Braga, Portugal
2
Faculty of Philosophy and Social Sciences, Centre for Philosophical and Humanistic Studies, Universidade Católica Portuguesa, Rua de Camões, 4710-362 Braga, Portugal
3
CICPSI, Faculdade de Psicologia, Universidade de Lisboa, Alameda da Universidade, 1649-013 Lisboa, Portugal
*
Author to whom correspondence should be addressed.
Adm. Sci. 2024, 14(1), 11; https://doi.org/10.3390/admsci14010011
Submission received: 27 November 2023
/
Revised: 22 December 2023
/
Accepted: 24 December 2023
/
Published: 2 January 2024
Abstract
:Brand experience, brand love, and brand behavior outcomes hold significant importance in management research. Their relevance extends to shaping strategic decision-making, fostering a customer-centric approach, and providing insights into the competitive landscape. These concepts are pivotal in understanding the complex dynamics of consumer-brand relationships, enabling organizations to make informed decisions, prioritize customer satisfaction, and stay competitive in the market. The present study aims to authenticate and assess the consistency of the Brand Experience (BE) scale and Brand Love (BL) scale in relation to the LIDL brand, comparing Portugal and the Czech Republic. Additionally, it delves into the connections between Brand Experience, Brand Love, and Brand Behaviour Outcomes (BBO): Positive Word of Mouth (+WOM), Brand Loyalty (BLYT), (Re)purchase Intention (RI), Affective Commitment (AC), Active Engagement (AE), and Perceptions of Attitudes Towards a Brand (PATB). The results demonstrated that the measurement tools used to gauge the variables under scrutiny are dependable and valid. Achieving measurement invariance across countries, convergence, and discriminant validity further validated the study. Positive correlations were identified among all the variables explored. The conceptual model tested exhibited a good fit and remained consistent across both countries. These findings hold significant implications for both academics and practitioners in the field of brand management.
1. Introduction
In the contemporary and fiercely competitive retail environment, businesses are actively working towards attracting customers and establishing enduring connections with them. Central to achieving this objective are the concepts of Brand Experience (BE) and Brand Love (BL).
As retail brands grapple with the escalating challenge of setting themselves apart and fostering strong emotional bonds with consumers, the examination of the potency of these constructs and their interconnections has become imperative. Furthermore, the impact of Brand Experience (BE) and Brand Love (BL) extends to consequential Brand Behaviour Outcomes (BBO), including Positive Word of Mouth (+WOM), as demonstrated in previous research (Rodrigues and Brandão 2021).
The landscape of retail brands has undergone a transformation, shifting from an emphasis on the functional aspects of products to prioritizing the creation of a memorable and valuable Brand Experience (BE) for customers (Brakus et al. 2009). This evolution has given rise to a new retail paradigm where brands can establish emotional connections through positive customer experiences. Consequently, there is a growing interest in exploring how brands can leverage a robust identity and a strong client-brand bond to drive profitability (Sohaib et al. 2023). Nonetheless, there are limited validated tools available in Portuguese or Czech for evaluating these dimensions. Furthermore, there is a scarcity of comparative studies across diverse contexts that explore this subject. The objective of this study is to fill these existing gaps. Thus, this study aims to achieve the following objectives: (1) to validate and measure the invariance of the Brand Experience Scale and Brand Love (BL) Scale towards the LIDL brand across two countries, Portugal and the Czech Republic. Additionally, the study aims to establish convergent and discriminant validity for these scales; (2) to evaluate the relationships between Brand Experience, Brand Love (BL), and various Brand Behaviour Outcomes (BBO), including Positive Word of Mouth (+WOM), Brand Loyalty (BLYT), (Re)purchase Intention (RI), Affective Commitment (AC), Active Engagement (AE), and Perception of Attitudes Towards a Brand (PATB) LIDL; (3) to test a conceptual framework positing that Brand Experience (BE) leads to Brand Love (BL), which, in turn, results in Brand Behaviour Outcomes (BBO). Furthermore, we aim to measure the invariance of this conceptual framework across the two countries; (4) to identify the variables that contribute to explaining Positive Word of Mouth (+WOM).
Research questions include “What are the scale properties for measuring Brand Experience (BE) and Brand Love (BL) towards the LIDL brand in Portugal and the Czech Republic, and how do they compare across these two countries?”; “To what extent do the measures of Brand Experience (BE) and Brand Love (BL) demonstrate convergent validity, indicating their ability to measure similar constructs consistently?”; “How do the measures of Brand Experience (BE) and Brand Love (BL) exhibit discriminant validity, ensuring that they are distinct constructs and not measuring the same aspects?”; and “What insights can be gained from the empirical evidence regarding the scales’ properties and validity measures for Brand Experience (BE) and Brand Love (BL) in the context of the LIDL brand in Portugal and the Czech Republic?”.
This current research stands out in several ways. Firstly, it is innovative in its approach, being the first to offer empirical evidence on a conceptual model examining the relationships between Brand Experience (BE), Brand Love (BL), and several Brand Behaviour Outcomes (BBO). These outcomes encompass Positive Word of Mouth (+WOM), Brand Loyalty (BLYT), (Re)purchase Intention (RI), Affective Commitment (AC), Active Engagement (AE), and Perceptions of Attitudes Towards a Brand (PATB) LIDL. Thirdly, the research tests a conceptual framework positing that Brand Experience (BE) leads to Brand Love (BL), subsequently influencing Brand Behaviour Outcomes (BBO). The invariance of this conceptual framework will be scrutinized across the two countries. Lastly, the study results will contribute evidence regarding the variables that elucidate Positive Word of Mouth (+WOM).
The structure of this paper unfolds as follows. First, it provides a comprehensive theoretical background concerning the variables under examination and the relationships among them. Second, the methodology and results are presented. The paper concludes with a discussion section, highlighting limitations and suggesting avenues for future research.
2. Theoretical Background
2.1. Constructs Conceptualization
The concept of Brand Experience (BE) is not a recent development, with initial studies introducing this concept emerging in the late 1990s (Gilmore and Pine 1999; Schmitt 1999). Contemporary researchers often embrace the definition put forth by Brakus et al. (2009). They conceptualize Brand Experience (BE) as a subjective and internal consumer response encompassing emotions, sensations, thoughts, and behavioral reactions generated by stimuli associated with a brand. These stimuli can include elements like brand identity, design, communication, and environments. The resulting responses vary in strength and intensity, leading to positive or negative effects that endure over time and shape consumer behavior (Brakus et al. 2009). Despite alternative proposals (e.g., Schmitt and Rogers 2008), these researchers identify four types of Brand Experience (BE): sensory, affective, intellectual, and behavioral.
A memorable Brand Experience (BE) has the potential to cultivate deep Brand Love (BL). According to Carroll and Ahuvia (2006), Brand Love (BL) is defined as the intense emotional connection a satisfied customer develops towards a brand. Brand Love (BL), characterized by an affective focus arising from a customer’s enduring bond with a brand, involves a disposition to declare love and includes integrating the brand into the customer’s identity (Rather et al. 2021).
Although Brand Love (BE) is significant in the marketing realm, its definition lacks consensus among scholars (Batra et al. 2012). Recent research acknowledges that consumers may develop emotions akin to love toward brands (Gumparthi and Patra 2020). The construct of Brand Love (BL) was introduced by Carroll and Ahuvia (2006) to provide a comprehensive and quantitative perspective on contented consumers while enhancing the understanding of post-consumption behaviors, such as Positive Word of Mouth (+WOM) recommendations (the extent to which customers express their admiration for the brand to others) and Brand Loyalty (BLYT) (the level of consumer commitment to repurchasing the brand) (Han et al. 2018). Alshreef et al. (2023) discovered that the importance of customer value lies in its pivotal role in enhancing various aspects of brand affection, namely intimacy, passion, and commitment. Their findings indicate that utilitarian value has a greater impact than hedonic value on the sub-dimensions of brand love. Moreover, these sub-dimensions significantly contribute to influencing customer loyalty. Han and Choi (2019) highlighted the significance of the self-expressive function of brands by confirming the relationship between self-congruity and brand love. Consumer loyalty is crucial, as it is associated with various business benefits (Yi and La 2004), including reduced marketing costs, increased per-client profit, a steady stream of profit, decreased operational costs, higher price premiums, and increased recommendations (Reichheld and Teal 1996). Loyal customers are less susceptible to competitors’ promotional efforts, further underscoring the importance of client loyalty in today’s highly competitive business landscape (Bae and Kim 2023; Na et al. 2023; Yi and Jeon 2003).
Oliver (1999) proposed a framework with four phases leading to customer loyalty. The cognitive phase involves customers relying on previous experience and knowledge when a brand comes to mind. The affective phase is driven by positive feelings and attitudes toward a brand developed through satisfying occasions. Cognitive loyalty involves the customer’s intention to continue purchasing in the future, making it more resilient than affective loyalty. The final stage, action loyalty, translates the customer’s motivated intention into a readiness to take action (Oliver 1999). Loyal customers are likely to exhibit Positive Word of Mouth (+WOM) and purchase intention (Ahmad and Akbar 2023; Yi and La 2004; Wang and Omar 2023).
Word of mouth involves interpersonal and informal communication about services and goods (Godes and Mayzlin 2004). As consumers engage with brands, they gather crucial information influencing their decision to endorse or not endorse a specific service or product (Zeithaml et al. 1993). An extended and favorable Brand Experience (BE), measured in terms of the product usage duration, has been shown to enhance Positive Word of Mouth (+WOM) (Karjaluoto et al. 2016). Studies demonstrate that Positive Word of Mouth (+WOM) is strongly predicted by Brand Love (BL) (Batra et al. 2012; Carroll and Ahuvia 2006). Furthermore, Alshreef et al. (2023) observed that the impact of the two forms of customer value on brand love sub-dimensions was influenced by electronic word of mouth (eWOM). In a separate study, Anastasiei et al. (2023) discovered that negative electronic word-of-mouth intent is affected by centrality and density, with a more pronounced effect at elevated levels of network usage. Consequently, individuals with greater influence in the network are more likely to generate unfavorable electronic word of mouth.
Purchase intention is a crucial variable explaining consumer behavior (Peña-García 2020). It signifies an intention to purchase or consume a service or product (Gupta et al. 2014). During the formation of purchase intention, customers assess claims regarding BL and brand engagement, which influences their decision-making (Verma 2021). Cognitive appraisals of performance over time can produce affective attachment, leading to Affective Commitment (AC). Affective Commitment (AC), a psychological disposition where individuals show an emotional relationship toward the brand, is positively related to brand attachment, shared values, identification, and trust (Albert and Merunka 2013; Fullerton 2005). Higher Affective Commitment (AC) correlates with lower switching intentions and higher advocacy of brand intentions (Fullerton 2005).
Albert and Merunka (2013) highlight the substantial impact of Brand Love (BL) on Affective Commitment (AC). Their research underscores the significance of Brand Love (BL) for brand management, indicating its profound influence on long-term brand relationships. Active Engagement (AE), another critical outcome of Brand Love (BL) and Brand Loyalty (BLYT) (Bairrada et al. 2019; Bergkvist and Bech-Larsen 2010), encompasses a range of consumer behaviors, from purchasing brand merchandise to following brand news, talking about the brand, or visiting brand websites. Active Engagement (AE) occurs independently of the product’s relevance to individuals (Bairrada et al. 2019; Bergkvist and Bech-Larsen 2010).
Perception of Attitudes Towards (PAT) a brand, such as LIDL, is also a crucial Brand Behaviour Outcome (BBO). This construct represents an individual’s perception of the balance between what the brand offers and what individuals receive. For example, it reflects an individual’s general belief regarding the brand’s pricing practices for the quality of its products (Sweeney and Soutar 2001).
2.2. Brand Experience (BE) and Brand Love (BL): Their Relationship with Other Variables
Brand Experience (BE) and Brand Love (BL) have emerged as essential concepts explaining several consumer outcomes, including Brand Loyalty (BLYT), Positive Word of Mouth (+WOM), (Re)purchase Intention (RI), Affective Commitment (AC), Active Engagement (AE), and Perception of Attitudes Towards a Brand (PATB). Previous studies (Anggara et al. 2023; Bairrada et al. 2019; Bıçakcıoğlu et al. 2018) indicate that Brand Love (BL) has a positive influence on Brand Loyalty (BLYT). Higher Brand Love (BL) levels correlate with a higher tendency among consumers to exhibit Brand Loyalty (BLYT). Maduretno and Junaedi’s (2022) study suggests an indirect effect of Brand Experience (BL) on Brand Loyalty (BLYT) via Brand Love (BL). Thus, Brand Experience (BL) relates to Brand Love (BL) first, and Brand Love (BL), in turn, relates to Brand Loyalty (BLYT).
Recent studies (e.g., Bairrada et al. 2019; Bıçakcıoğlu et al. 2018; Dam 2020) also show that Brand Love (BL) positively correlates with Positive Word of Mouth (+WOM). This relationship can be explained by Brand Love (BL) stimulating behaviors that involve spreading positive information about the brand. In essence, when consumers love their brands, they are inclined to express positive sentiments and recommend the brand to others (Bıçakcıoğlu et al. 2018). Furthermore, Active Engagement (AE) is more likely when consumers have a strong affection for their brands, as found in previous research by Bairrada et al. (2019).
Purchase intention is another direct and indirect effect of Brand Love (BL) supported by several previous studies (e.g., Aureliano-Silva et al. 2022; Garg et al. 2015). These studies demonstrate that emotionally involved consumers (i.e., with higher Brand Love) are more likely to purchase and continue purchasing the same brand.
Regarding Affective Commitment (AC), the findings of studies by Albert and Merunka (2013) and Garg et al. (2015) suggest that customers with a deep love for a brand are more likely to exhibit a higher Affective Commitment (AC). There is, therefore, a positive relationship between Brand Love (BL) and Affective Commitment (AC). Furthermore, consumers become part of the brand, creating an emotional connection between them; this connection can result in positive purchase decisions (Vrtana and Krizanova 2023).
Beyond the previously mentioned outcomes, the stimulus provided by the brand from the client’s experience can generate positive memories, leading clients to form a positive Perception of Attitudes Towards a Brand (PATB) (Nayeem et al. 2019). Consequently, a positive relationship can be expected between Brand Experience (BE) and the Perception of Attitudes Towards a Brand (PATB), such as LIDL. In conclusion, previous studies provide insights into the indirect effect of Brand Experience (BE) on several outcomes through the mediating role of Brand Love (BL).
The hypotheses guiding this study are as follows: H1: Models adjusted to the total sample, as well as each country, will demonstrate invariance across countries, and convergent and discriminant validity; H2: Positive and significant associations will be observed between Brand Experience (BE), Brand Love (BL) (BL), and various Brand Behaviour Outcomes (BBO), including Positive Word of Mouth (+WOM), Brand Loyalty (BLYT), (Re)purchase Intention (RI), Affective Commitment (AC), Active Engagement (AE), and Perceptions of Attitudes Towards a Brand (PATB), LIDL; H3: The conceptual framework linking Brand Experience (BE) to Brand Love (BL) and subsequent Brand Behaviour Outcomes (BBO) will be adjusted to the total sample and remain invariant across countries; H4: Brand Loyalty (BLYT), (Re)purchase Intention (RI), Affective Commitment (AC), Active Engagement (AE), and Perceptions of Attitudes Towards a Brand (PATB) LIDL will contribute to explaining the variance of Positive Word of Mouth (+WOM).
3. Materials and Methods
3.1. Procedures
All procedures adhered to the principles outlined in the Helsinki Declaration. Approval for this study was granted by the institutional review board of the Universidade Católica Portuguesa, with reference number UCP/20/2022. The research protocol, inclusive of an informed consent form ensuring data anonymity and confidentiality, was approved. Prior to participation, all individuals provided informed consent. The protocol was disseminated through social networks. Inclusion criteria encompassed individuals aged 18 and above, residing in Portugal or the Czech Republic, and holding a client relationship with LIDL. Given that the protocol was made available online via a dedicated page on a social network (Facebook), the collected sample is non-random. The sample size corresponds to the totality of complete responses (that is, all items were answered). As it was not possible to continue responding to the protocol without answering the previous questions, the response rate was 100%. Also, respondents were not rewarded for their answers. Data collection took place between January and May 2023.
The research protocol comprised an informed consent form, a sociodemographic questionnaire, the Brand Experience (BE) Scale, the Brand Love (BL) Scale, and various Brand Behaviour Outcomes (BBO) instruments (Positive Word of Mouth [+WOM], Brand Loyalty [BLYT, (Re)purchase Intention [RI], Affective Commitment [AC], Active Engagement [AE], and Perceptions of Attitudes Towards a Brand [PATB] LIDL).
All instruments were translated from the original language (English) into Portuguese and Czech to ensure linguistic equivalence. Two bilingual translators conducted the initial translations, which were subsequently compared by two psychologists. Any disparities were resolved through consensus. Two additional translators performed back-translations, and the psychologists compared the versions. Discrepancies were discussed and revised until a consensus was reached.
3.2. Instruments
3.2.1. Sociodemographic Questionnaire
The sociodemographic questionnaire covered several variables, including country (Portugal or the Czech Republic), gender (0: male; 1: female), age, education (0: without university studies, 1: with university studies), professional status (0: inactive; 1: active), and income perception (1: insufficient; 2: sufficient; 3: satisfactory; 4: high). Additionally, participants were asked about their visits to their regular supermarket with the prompt: “Please recall your supermarket shopping over the last six weeks. How many times have you visited LIDL (PT/CZ)?”
3.2.2. Retail Experience (BE) Scale
Khan and Rahman (2016) devised the Retail Brand Experience (BE) Scale, drawing from Brakus et al.’s BE definition (Brakus et al. 2009) as “sensations, feelings, cognitions, and behavioral responses evoked by brand-related stimuli that are part of a brand’s design and identity, packaging, communications, and environments” (p. 53). The initial scale items were crafted based on the literature pertinent to retail BE. Respondents were asked to express their level of agreement with the statements, rated on a 7-point Likert-type scale (from 1 = strongly disagree to 7 = strongly agree). The study identified that 22 items, distributed across seven dimensions, constituted retail BE: brand name influence, mass media impression, customer billing, order and application forms, emotional event experience, recommendation by a salesperson, point-of-sales assistance, and brand story connectedness. The original study reported Cronbach’s alpha values ranging from 0.830 to 0.920, composite reliability from 0.790 to 0.960, and average variance extracted from 0.610 to 0.860. For this study, only five dimensions (15 items) were utilized: brand name influence, mass media impression, point-of-sales assistance, customer billing, order and application forms, and recommendation by a salesperson.
3.2.3. Brand Love (BL) Scale
The Brand Love (BL) scale evaluates the level of emotional connection and enthusiasm a satisfied consumer holds for a specific brand. It encompasses attachment to the brand, passion for the brand, positive emotional responses to the brand, positive evaluations of the brand, and declarations of love for the brand (Carroll and Ahuvia 2006). The Brand Love (BL) scale consists of ten items and is treated as a unidimensional construct. Respondents are required to rate the statements on a 7-point Likert-type scale, ranging from “strongly disagree” (1) to “strongly agree” (7), with the exception of items 4 and 7, which are reversed (Carroll and Ahuvia 2006). The authors reported a Cronbach’s alpha coefficient of 0.91 for the scale.
3.2.4. Brand Behaviour Outcomes (BBO)
- Positive Word of Mouth (+WOM). Positive Word of Mouth (+WOM) refers to the extent to which a consumer expresses admiration for a brand to others (Carroll and Ahuvia 2006). To assess +WOM, four items from Carroll and Ahuvia (2006) were employed, querying participants about their actions regarding recommending LIDL to others, talking positively about LIDL to friends, actively promoting LIDL, and providing Positive Word of Mouth (+WOM) advertising for LIDL. Respondents were required to indicate their level of agreement or disagreement with each statement on a 7-point Likert scale (1: strongly disagree to 7: strongly agree). In Carroll and Ahuvia’s (2006) original study, Cronbach’s alpha values for Positive Word of Mouth (+WOM) were reported to be 0.920.
- Brand Loyalty (BLYT). Brand Loyalty (BLYT) encompasses a steadfast and enduring preference for a specific brand, coupled with a positive and favorable attitude toward it (Quester and Lim 2003). To evaluate Brand Loyalty (BLYT), four items were adapted from Quester and Lim’s (2003) work, focusing on participants’ level of interest, attention, importance, and consistent purchasing behavior related to LIDL compared to other retail brands. These items were drawn from the behavioral dimension of the Brand Loyalty (BLYT) measure developed by the authors, consisting of a 16-item scale with affective, cognitive, and behavioral dimensions. Respondents were asked to indicate their agreement or disagreement with each statement on a 7-point Likert scale (1: strongly disagree to 7: strongly agree). While Quester and Lim (2003) reported good reliability for this scale, their study did not provide the exact Cronbach’s alpha value.
- (Re)purchase Intention (RI). Purchase intention reflects the inclination to acquire a specific service or product, influenced by various internal and external factors. It represents an individual’s attitude toward the prospect of using a service or making a purchase. On the other hand, repurchase intention signifies an attitude geared toward engaging in repetitive purchases (Yi and La 2004). To assess (Re)purchase Intention (RI), three items from Fullerton (2005) were adapted (The next time I need to shop, I’ll choose LIDL; LIDL is my preferred shopping destination; I plan to remain a loyal customer of LIDL), along with one item from Fetscherin (2014) (I intend to make purchases at LIDL). Participants were asked to express their level of agreement or disagreement with each statement using a 7-point Likert scale (1—strongly disagree to 7—strongly agree). Fullerton (2005) reported a Cronbach’s alpha value of 0.940 for the three items adapted from their work.
- Affective Commitment (AC). According to Fullerton (2005), Affective Commitment (AC) forms the foundation of relationships. Clients who are affectively committed stick with a brand due to their emotional attachment, which is often cultivated through positive past experiences. To gauge the Affective Commitment (AC), three items were adapted from Fullerton’s work (2005) (LIDL holds significant personal meaning for me; I feel emotionally connected to LIDL; I have a strong sense of identification with LIDL), and one item from Albert and Merunka (2013) (I feel like part of a family as a customer of LIDL). Participants were tasked with indicating their level of agreement or disagreement with each statement on a 7-point Likert scale (1: strongly disagree to 7: strongly agree). The three items from Fullerton (2005) exhibited high internal consistency with a Cronbach’s alpha of 0.96.
- Active Engagement (AE). Active Engagement (AE) refers to the customer’s willingness to invest their time, energy, money, and other resources into the brand, going beyond the initial purchase or consumption stage (Keller et al. 2011). The assessment of Active Engagement (AE) involved three items from Bergkvist and Bech-Larsen (2010) (To what extent do you follow news about LIDL?; How often do you visit the LIDL website?; How often do you talk about LIDL to others?). Participants were asked to rate the first item using a 4-point Likert scale (1: not at all to 4: extremely) and items 2 and 3 using a 4-point Likert scale (1: never to 4: always). The authors did not provide values for Cronbach’s alpha, composite reliability, and average variance extracted.
- Perception of Attitudes Towards a Brand (PATB) LIDL. Attitudes toward brands reflect a predisposition to respond positively or negatively, influenced by purchase experiences, product evaluations, and self-perceptions associated with the products offered by the endorsed brand (Liu and Wang 2008). Drawing from Sweeney and Soutar (2001), Perception of Attitudes Towards a Brand (PATB) LIDL was assessed using five items (I consider LIDL a reliable place for shopping; LIDL provides very good prices for the products it is selling; LIDL’s products have consistent quality; I am very satisfied with my shopping experience in LIDL; LIDL strives to keep improving the shopping experience for its customers). Participants were asked to indicate their level of agreement or disagreement with each statement using a 7-point Likert scale (1: strongly disagree to 7: strongly agree). The authors reported a Cronbach’s alpha of 0.96 for the total scale comprising 19 items.
3.3. Data Analysis
Descriptive analysis indicators were utilized to characterize the sample, items, and overall scales and subscales. The normal distribution of variables was assessed using kurtosis (<10) and skewness (<2) values. Sample differences were evaluated through the chi-squared test and Student’s t-test.
In Exploratory Factor Analysis (EFA), there are several commonly used indices to assess the quality of the factor analysis results: Kaiser–Meyer–Olkin (KMO) (measure of sampling adequacy, this index assesses the adequacy of your sample for factor analysis. A KMO value close to 1.0 indicates that the data are suitable for factor analysis); Bartlett’s test of sphericity (tests the null hypothesis that the correlation matrix is an identity matrix, suggesting that the variables are unrelated. A significant result indicates that there are correlations between variables, supporting the suitability of factor analysis); eigenvalues (indicate the amount of variance explained by each factor); factor loadings (these coefficients represent the strength and direction of the relationship between each variable and each factor. loadings closer to 1 or −1 are considered strong); communality (this is the proportion of each variable’s variance that is accounted for by the factors (higher communality values indicate that a variable is well-represented by the factors); factor rotation information (in this case, varimax); percentage of variance explained (this indicates the proportion of total variance in the observed variables that is explained by the retained factors); and factor correlations.
Confirmatory Factor Analysis (CFA) with robust maximum likelihood estimation was conducted using AMOS 28 (Arbuckle 2020). The Satorra and Bentler (2001) corrected chi-square (χ2 < 2) was employed. The goodness of the overall model fit was evaluated using the Comparative Fit Index (CFI), Tucker–Lewis Index (TLI), and the root mean square error of approximation (RMSEA). According to the literature, the CFI and TLI should be equal to or higher than 0.90, and the RMSEA should be equal to or lower than 0.08 for adequate model fit. Values of the CFI and TLI equal to or higher than 0.95 and RMSEA equal to or lower than 0.06 indicate well-fitting models (Hu and Bentler 1999). Browne and Cudeck (1992) introduced the term “close fit,” where PCLOSE was used as a test of close fit (≥0.05). The Standardized Root Mean Square (SRMR) served as an absolute measure of fit criterion, with a good fit indicated by an SRMR of less than 0.08 (Kline 2015).
Measurement invariance across countries was assessed through three tests: (1) Configural model, allowing factor loadings and item intercepts to vary across subsamples [configural invariance]; (2) factor-loading-constrained model, where factor loadings were constrained equally while item intercepts varied [metric invariance]; and (3) factor-loading and item-intercept-constrained model, with both factor loadings and item intercepts constrained equally [scalar invariance]. The CFI and RMSEA were used to determine configural model support. The ∆CFI and ∆RMSEA were employed to assess the equivalence between more and less-constrained models. If the ∆CFI and ∆RMSEA are less than 0.01, the two nested models are considered equivalent, supporting measurement invariance across the two subsamples (Vandenberg and Lance 2000).
The reliability of the instruments was gauged using Cronbach’s alpha. Convergent validity was assessed using composite reliability (CR) and average variance extracted (AVE) values (>0.50). Discriminant validity involved comparing the square roots of AVE values with correlations between scale dimensions (Pearson correlation); the square root of AVE should be higher than the correlations between subscales. The significance level was set at p < 0.05.
4. Results
4.1. Sample Characteristics
The overall sample (N = 3103) consists of two sub-samples: Portuguese participants (43.9%) and participants from the Czech Republic (56.1%). With the exception of gender, there are statistically significant differences across most sociodemographic variables between the two samples (Table 1). Specifically, the Portuguese sample comprises older participants, a higher number of participants with university studies, more inactive participants, and a greater percentage of individuals dissatisfied with their income compared to the Czech Republic sample (Table 1).
4.2. Testing Hypothesis 1
4.2.1. Hypothesis 1 (H1)
Hypothesis 1 (H1).
The models, when adjusted for both the entire sample and individual countries, will demonstrate invariance across these countries. Additionally, we expect to observe evidence supporting convergent and discriminant validity.
4.2.2. Retail Brand Experience (BE) Scale
Descriptives. Table 2 provides the descriptive statistics for the items comprising the Brand Experience (BE) scale in the overall sample. The skewness and kurtosis values indicate a normal distribution for these items. Among them, item 5 from the “Customer billing, order & application forms” dimension (“I don’t have reasons to complain about LIDL’s billing”) shows the highest value, while item 3 from the “Brand name influence” dimension (“When I think of excellence, I think of LIDL”) exhibits the lowest. Notably, the exclusion of item 5 from the “Customer billing, order & application forms” dimension enhances the Cronbach’s alpha value. All items maintain correlations with the total above the recommended threshold of 0.300. Item correlations range from r = 0.220 (p < 0.010) to r = 0.837 (p < 0.001). The “Customer billing, order & application forms” subscale has the highest mean and the lowest Cronbach’s alpha, while the “Mass media impression” subscale has the lowest mean, and the “Point-of-sales assistance” subscale records the highest Cronbach’s alpha.
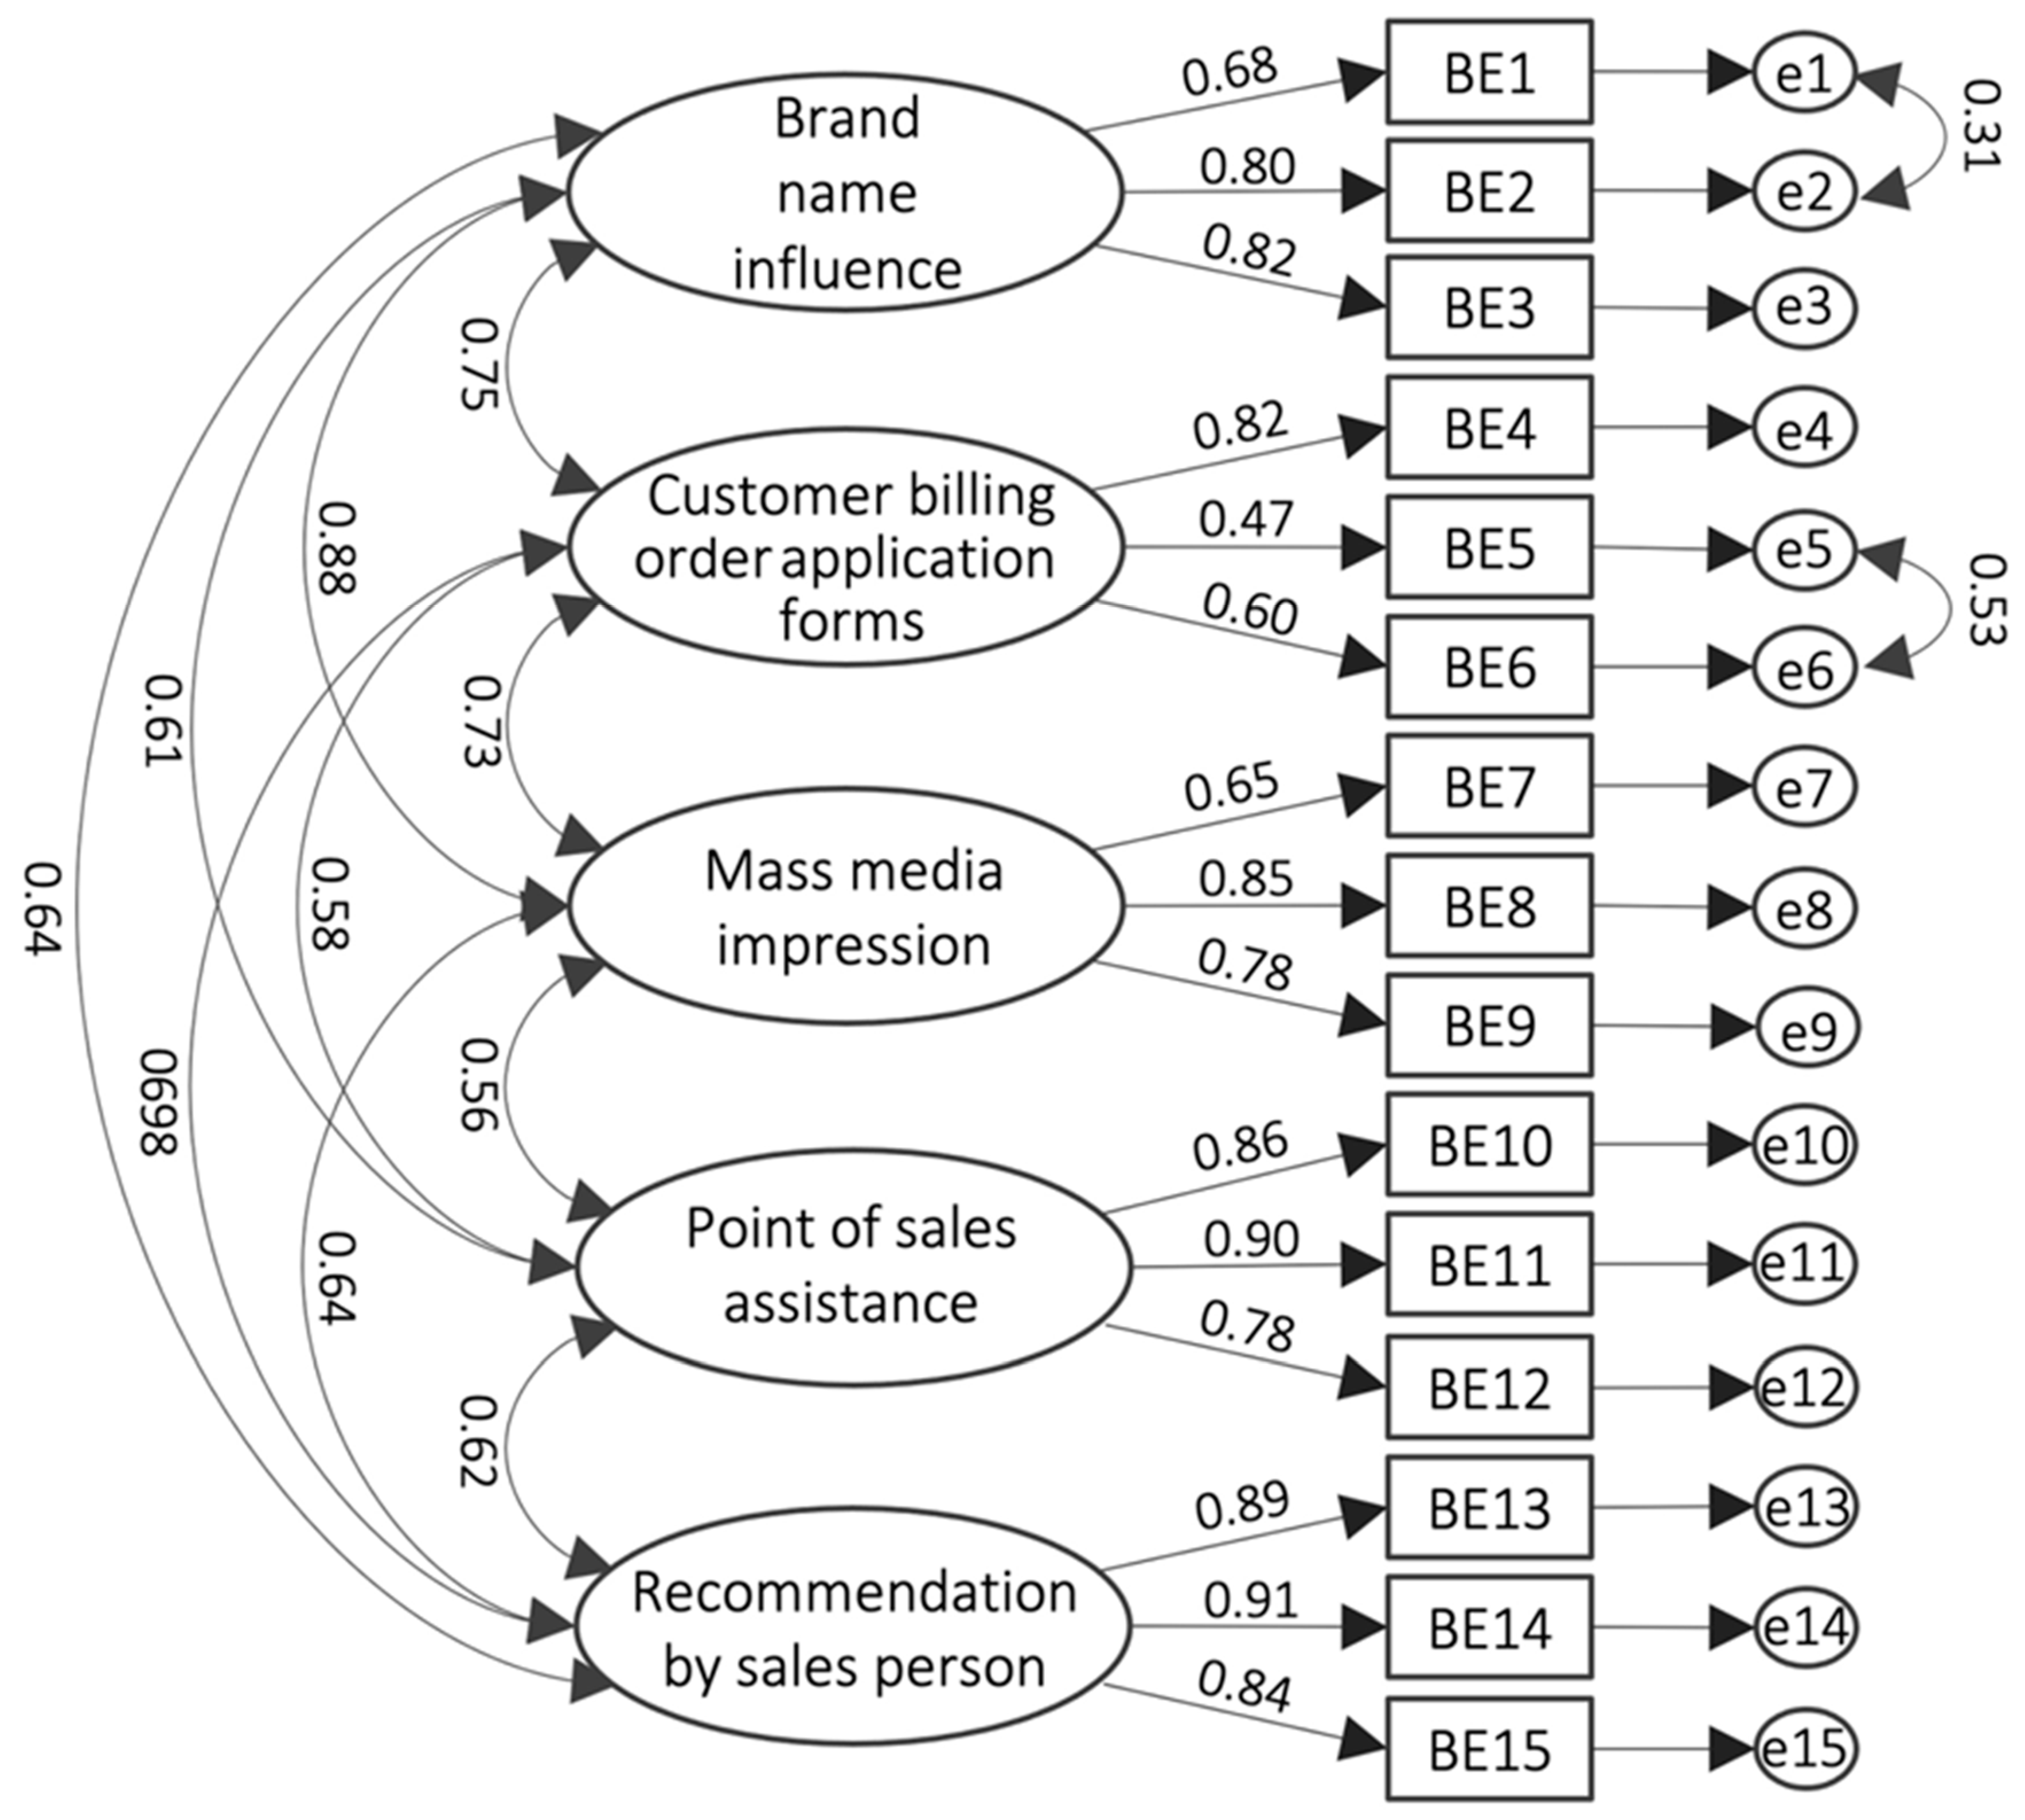
Factorial validity. Table 3 displays the fit indices for the overall model and individual country models, with residual correlations among four items taken into account (Figure 1). While the chi-square divided by degrees of freedom value exceeds the recommended threshold (<2) for all three models, the overall sample demonstrates satisfactory adjustment indicators.
Measurement invariance. Table 4 presents the outcomes of the measurement invariance assessment for the Brand Experience (BE) scale across different countries. The stepwise examination of country invariance indicated a favorable model fit for the configural invariance model. The metric invariance test, involving equal factor loadings across countries, also demonstrated a well-fitting model. Moreover, the marginal changes in the CFI and RMSEA between the configural and metric invariance tests fell below the 0.01 threshold, supporting metric invariance across countries. Nevertheless, the scalar invariance test uncovered non-invariance in intercepts among the indicators across countries, as the alterations in CFI and RMSEA between the scalar and metric invariance tests exceeded 0.01.
Convergent and discriminant validity. To validate the convergent validity of the Brand Experience (BE) scale, we computed Composite Reliability (CR) values, which surpassed the predefined thresholds, and Average Variance Extracted (AVE) values, all of which were equal to or exceeded 0.500. Discriminant validity was scrutinized by comparing the square roots of the AVE values with the correlation values between the total and subscales of the Brand Experience (BE) construct (Table 5). All correlations between the total and the subscales were statistically significant, varying from r = 0.472 (p < 0.001) to r = 0.833 (p < 0.001).
4.2.3. Brand Love (BL) Scale
Descriptives. Table 6 showcases the descriptive statistics for the Brand Love (BL) scale items in the entire sample. The skewness and kurtosis values affirm a normal distribution. Among the items, “LIDL is a wonderful brand” has the highest value, while items 4 and 7 (“I have neutral feelings about LIDL” and “I have no particular feelings about LIDL”) have the lowest. Removing items 4 and 7 increases Cronbach’s alpha value. The correlations among the ten items span from r = 0.224 (p < 0.010) to r = 0.782 (p > 0.001).
Convergent and discriminant validity. The convergent validity of the Brand Love (BL) scale was assessed using Composite Reliability (CR) and Average Variance Extracted (AVE) values. Discriminant validity was evaluated based on the square roots of the AVE values. Cronbach’s alpha, CR, AVE, and AVE square root values are above recommended (Table 6).
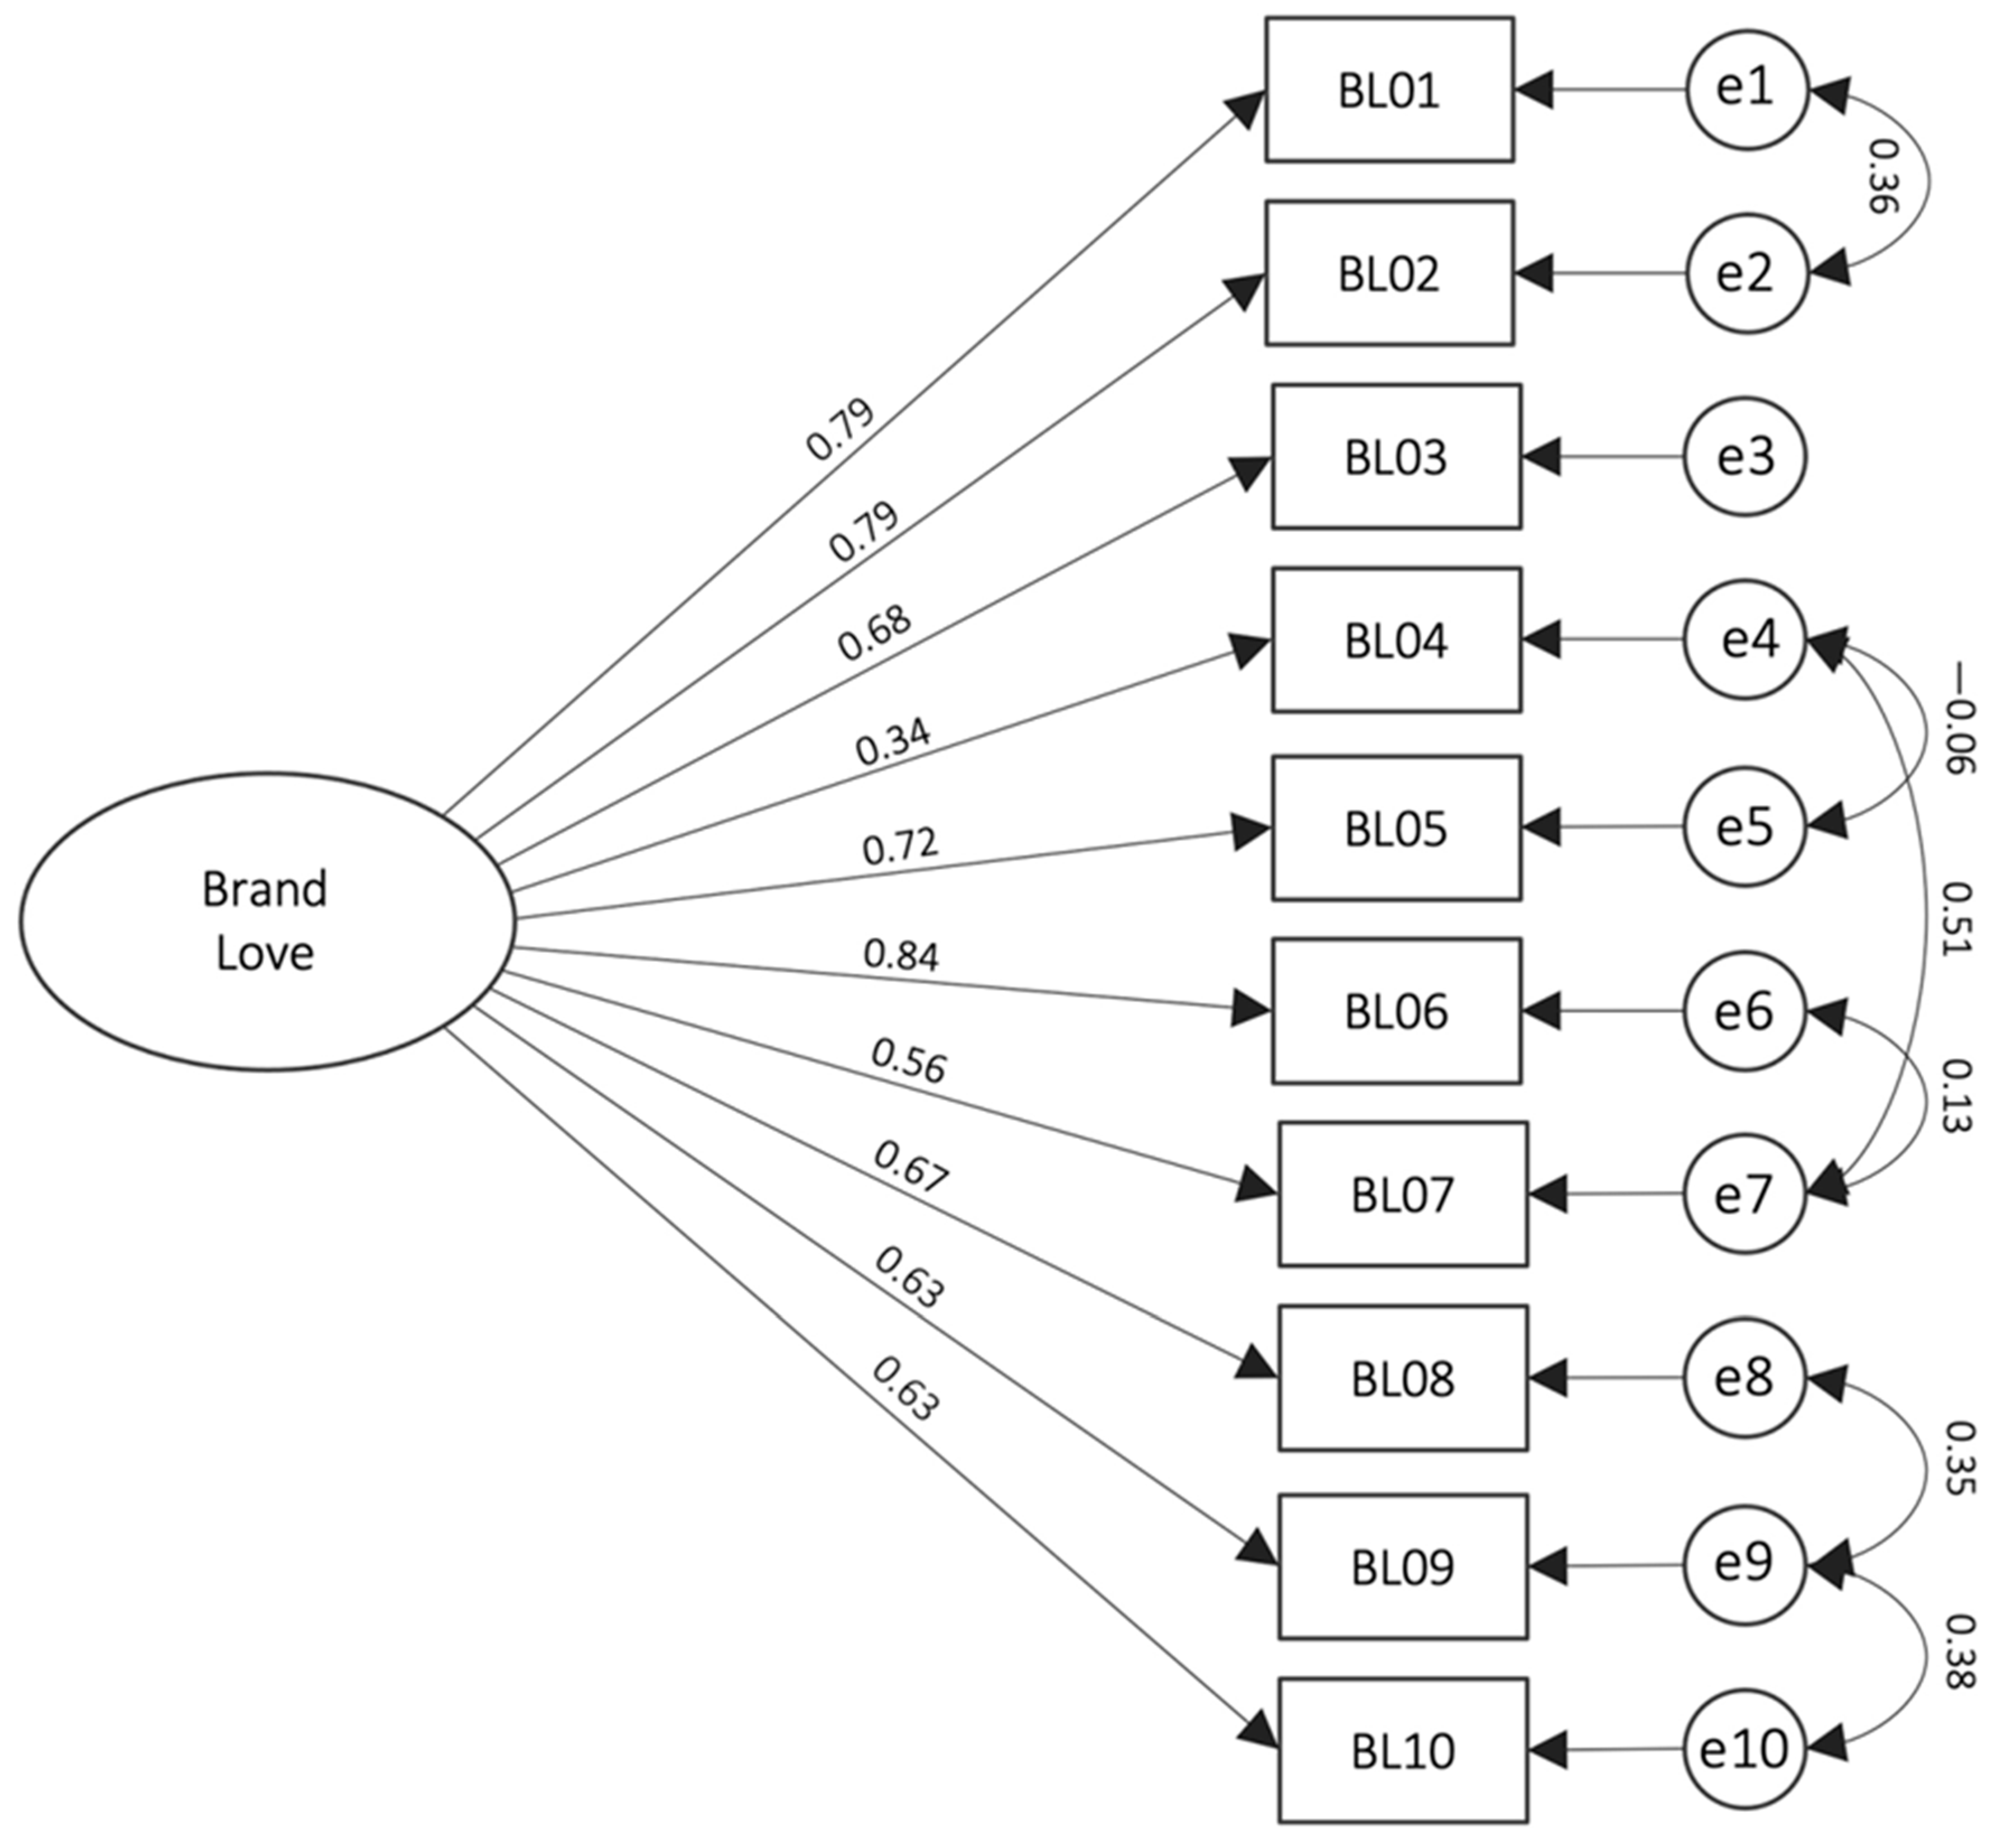
Factorial validity. Table 7 displays the fit indices for the total sample and the two countries’ models, incorporating residual correlations between six items (Figure 2). Despite all three models having a χ2 divided by degrees of freedom value surpassing the suggested threshold (<2), the total sample exhibits satisfactory adjustment indicators.
Measurement invariance. The outcomes regarding the measurement invariance of the Brand Love (BL) scale across countries are presented in Table 8. The incremental country invariance examination reveals that the configural invariance model, which assumes the same structure across countries, fits the data well. The metric invariance test, where factor loadings are constrained to be equal across countries, demonstrates a satisfactory model fit. Moreover, the marginal changes in the CFI and RMSEA between the configural and metric invariance tests are below the 0.01 threshold, supporting the idea of metric invariance across countries. Finally, the scalar invariance test suggests that the intercepts of the indicators are not consistent across countries, as the changes in the CFI and RMSEA between the scalar and metric invariance tests exceed 0.01.
4.2.4. Positive Word of Mouth (+WOM)
Descriptives. Table 9 provides the statistical summary of the overall Positive Word of Mouth (+WOM) dimension and its individual items for the entire sample. The skewness and kurtosis values affirm the normal distribution of the data. Specifically, Item 2 (“I ‘talk up’ LIDL to my friends”) exhibits the highest score, while Item 3 (“I try to spread the good word about LIDL”) records the lowest. Inter-item correlations across the four items vary from r = 0.650 (p < 0.001) to r = 0.818 (p > 0.001). This dimension demonstrates a satisfactory level of reliability, as indicated by the Cronbach’s alpha value.
Factorial validity. Table 10 presents the fit indices for the total and each country’s models. Concerning Positive Word of Mouth (+WOM), although one model (Portuguese sample) presents a value of χ2 divided by degrees of freedom above what is recommended (<2), the remaining indicators present a good fit.
Measurement invariance. The outcomes of the measurement invariance assessment for the Positive Word of Mouth (+WOM) dimension across countries are outlined in Table 11. The progressive evaluation indicates that the configural invariance model holds well across countries. Furthermore, the changes in the CFI and RMSEA between the configural and metric invariance tests fall within the recommended threshold of 0.01, providing support for metric invariance across countries. However, the scalar invariance test reveals that the intercepts of the indicators are not consistent across countries, as evidenced by changes in CFI and RMSEA exceeding 0.01.
4.2.5. Brand Loyalty (BLYT)
Descriptives. Table 9 exhibits the descriptive statistics for the total Brand Loyalty (BLYT) dimension and its individual items in the overall sample. The skewness and kurtosis values support the conclusion of a normal distribution. Notably, item 1 (“It is very important for me to buy in LIDL rather than another retailer”) has the highest value, while item 3 (“I pay more attention to LIDL than to other retailers”) has the lowest. Correlations among the four items vary from r = 0.741 (p < 0.001) to r = 0.898 (p > 0.001). The reliability of this dimension is indicated by a satisfactory Cronbach’s alpha value.
Factorial validity. The indicators for all models, including the total sample and each country’s models, demonstrate a satisfactory level of fit, as shown in Table 10.
Measurement invariance. Table 11 displays the results for measurement invariances of Brand Loyalty (BLYT) across countries. Configural, metric, and scalar invariance were found.
4.2.6. Re(purchase) Intention (RI)
Descriptives. Table 9 showcases the descriptive statistics of the Re(purchase) Intention (RI) dimension items and the overall score for the total sample. The skewness and kurtosis values verify a normal distribution. Notably, item 1 (“I intend to buy in LIDL”) has the highest score, while item 2 (“LIDL is my first choice for shopping”) has the lowest. Correlations between the four items vary from r = 0.579 (p < 0.001) to r = 0.859 (p > 0.001). While this dimension demonstrates a satisfactory Cronbach’s alpha value, it is worth noting that excluding item 1 leads to an improvement in the overall Cronbach’s alpha.
Factorial validity. Fit indices for the total and each country’s models can be found (Table 10). All indicators present a good adjustment.
Measurement invariance. Table 11 exhibits the outcomes regarding the measurement invariance of Re(purchase) Intention (RI) across countries, revealing support for configural, metric, and scalar invariance.
4.2.7. Affective Commitment (AC)
Descriptives. Table 9 illustrates the statistical summary of the entire Affective Commitment (AC) dimension along with its constituent items for the complete sample. The skewness and kurtosis values affirm a normal distribution. Notably, item 1 (“I feel like part of a family as a customer of LIDL”) records the highest score, while item 3 (“LIDL has a great deal of personal meaning for me”) registers the lowest. Correlations among the four items span from r = 0.805 (p < 0.001) to r = 0.899 (p > 0.001). This dimension demonstrates an excellent Cronbach’s alpha value.
Factorial validity. Fit indices for all models, including the total sample and each country’s model, are provided in Table 10. While one model (total sample) exhibits a χ2 divided by degrees of freedom value exceeding the recommended threshold (< 2), the other indicators suggest a satisfactory fit.
Measurement invariance. Table 11 provides the outcomes of the measurement invariance analysis for Affective Commitment (AC) across countries. The configural invariance model across countries exhibited a good fit. Additionally, the changes in the CFI and RMSEA between the configural and metric invariance tests were within the 0.01 threshold, supporting metric invariance across countries. However, the scalar invariance test revealed that the intercepts of the indicators were not consistent across countries, given that the changes in the CFI and RMSEA between the scalar and metric invariance tests exceeded 0.01.
4.2.8. Active Engagement (AE)
Descriptives. Table 9 displays the descriptive statistics for the overall Active Engagement (AE) dimension and its constituent items across the entire sample. The skewness and kurtosis values verify a normal distribution. Among the items, Item 1 (“To what extent do you follow news about LIDL?”) has the highest score, while Item 3 (“How often do you visit the LIDL website?”) has the lowest. The correlations between these three items vary from r = 0.566 (p < 0.001) to r = 0.604 (p > 0.001). This dimension presents a very good value of Cronbach’s alpha.
Factorial validity. Table 10 presents the fit indices for the overall sample and each country’s models. While one model (Portuguese sample) exhibits a chi-square divided by degrees of freedom value above the recommended threshold (<2), the remaining indicators demonstrate a satisfactory level of adjustment.
Measurement invariance. Table 11 illustrates the outcomes regarding the measurement invariance of Active Engagement (AE) across different countries. The stepwise examination for country invariance revealed that the configural invariance model across countries demonstrated a satisfactory fit. However, both metric and scalar invariances were not established.
4.2.9. Perception of Attitudes towards a Brand (PATB) LIDL
Descriptives. Table 9 displays the descriptive statistics for the overall Perception of Attitudes Towards a Brand (PATB)and its constituent items across the entire sample. The skewness and kurtosis values affirm that the distribution of responses follows a normal pattern. Item 2, assessing the perception of LIDL’s pricing, has the highest value, while item 5, gauging LIDL’s efforts to enhance the shopping experience, records the lowest. Correlations among the five items vary from r = 0.564 (p < 0.001) to r = 0.748 (p > 0.001). This dimension demonstrates a very good Cronbach’s alpha value.
Factorial validity. Table 10 displays the fit indices for the overall sample and individual country models. While the chi-square divided by degrees of freedom values for all three models exceed the recommended threshold (<2), the other indicators indicate a satisfactory fit.
Measurement invariance. Table 11 presents the outcomes regarding the measurement invariance of the perception of attitudes towards LIDL across countries. The sequential country invariance assessment revealed that the configural invariance model exhibited a satisfactory fit across countries. Additionally, the alterations in the CFI and RMSEA between the configural and metric invariance tests fell within the accepted threshold of 0.01. Consequently, there is support for metric invariance across countries. However, the scalar invariance test indicated that the intercepts of the indicators were not consistent across countries, as the changes in the CFI and RMSEA between the scalar and metric invariance tests exceeded 0.01.
4.3. Testing Hypothesis 2
4.3.1. Hypothesis 2 (H2)
Hypothesis 2 (H2).
There is a positive and significant association between Brand Experience (BE), Brand Love (BL), and Brand Behaviour Outcomes (BBO) (Positive Word of Mouth [+WOM], Brand Loyalty [BLYT], (Re)purchase Intention [RI], Affective Commitment [AC], Active Engagement [AE], and Perception of Attitudes Towards a Brand [PATB] LIDL).
4.3.2. Associations between Variables
As indicated in Table 12, there exists a positive and statistically significant correlation among all variables examined in this study, including Brand Experience (BE), Brand Love (BL), and various Brand Behaviour Outcomes (BBO) such as Positive Word of Mouth (+WOM), Brand Loyalty (BLYT), (Re)purchase Intention (RI), Affective Commitment (AC), Active Engagement (AE), and Perception of Attitudes Towards a Brand (PATB) LIDL (from r = 0.345 to r = 0.844).
4.4. Testing Hypothesis 3
4.4.1. Hypothesis 3 (H3)
Hypothesis 3 (H3).
The conceptual framework will be adjusted to the total sample and will be invariant across countries.
4.4.2. Path Analysis
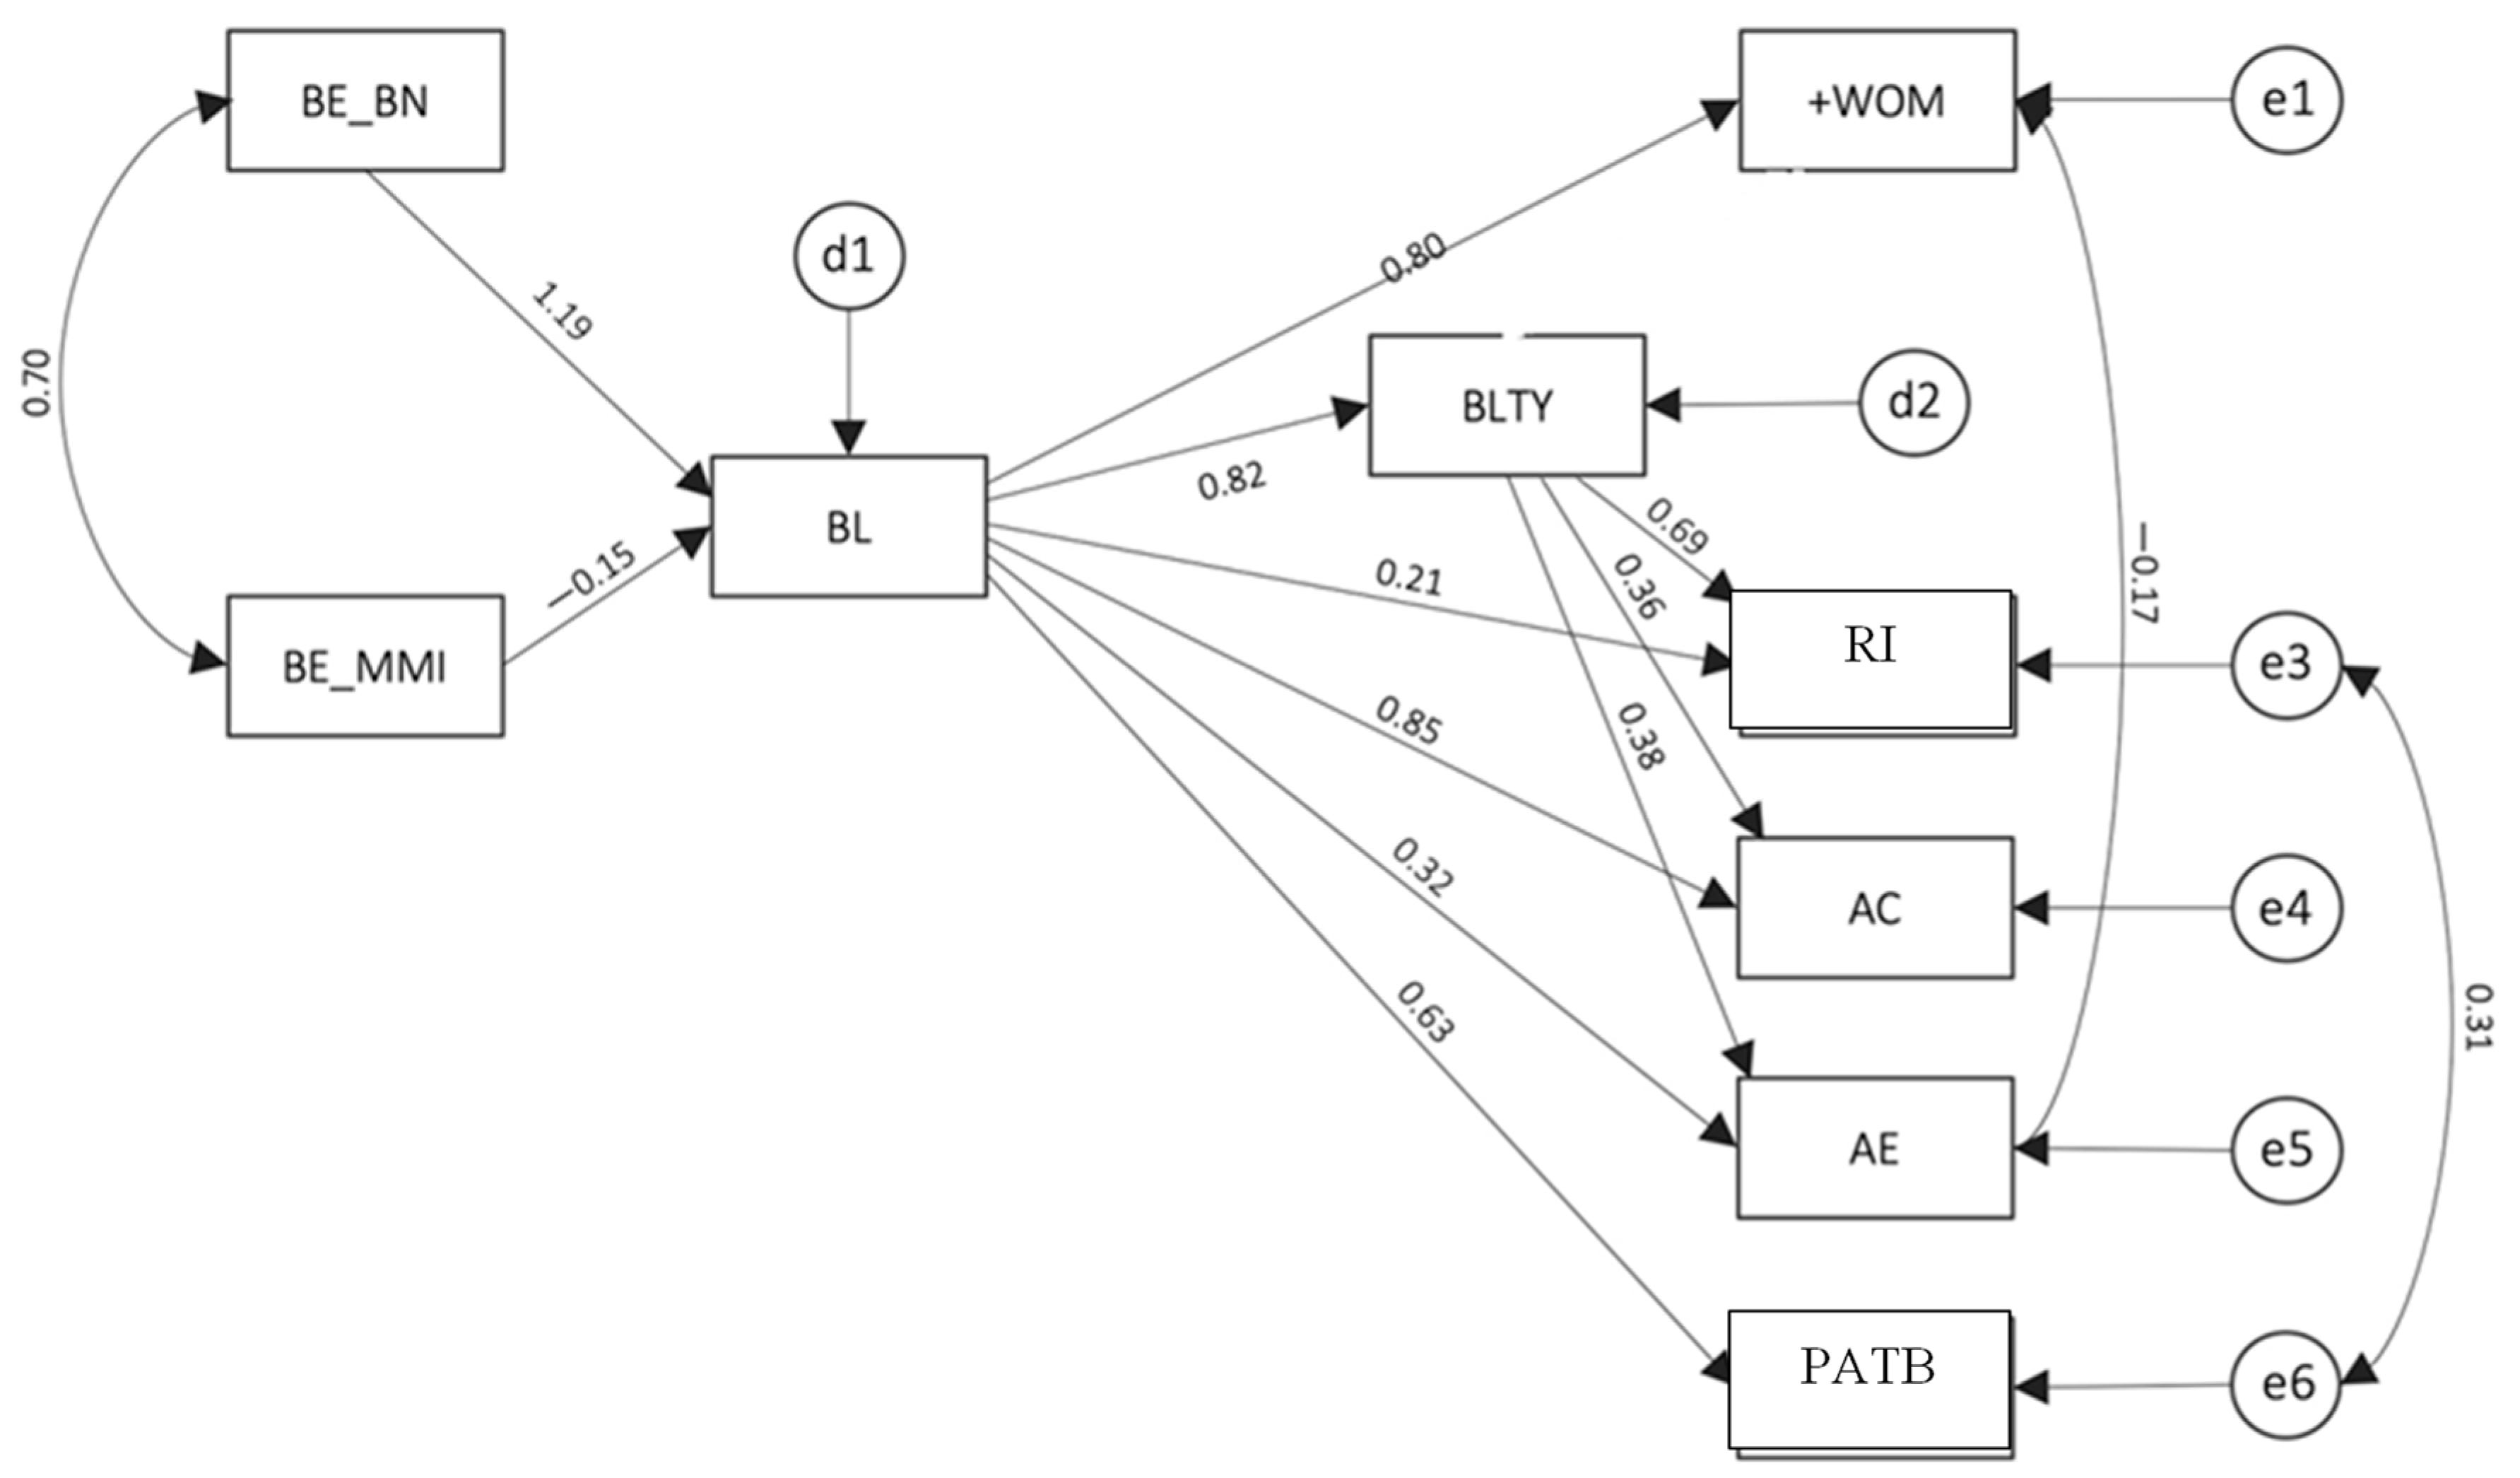
The conceptual framework suggests that the progression from Brand Experience (BE) to Brand Love (BL) shapes various Brand Behaviour Outcomes (BBO). Furthermore, both Brand Love (BL) and Affective Engagement (AE) contribute to the formation of Positive Word of Mouth (+WOM). To scrutinize this framework, a structural model was employed using the maximum likelihood estimation method, and the findings indicated a satisfactory fit [χ2(8) = 9.741; CFI = 0.997; TLI = 0.986; RMSEA = 0.53 (0.43–0.63); PCLOSE = 0.289; SRMS = 0.013] (Figure 3).
While the χ2/df value exceeds the recommended threshold (≤2), it is important to note that this statistic is sensitive to sample size. Therefore, additional indices, including the RMSEA, CFI, and SRMSR, were considered for a more comprehensive evaluation of model adequacy, as proposed by Kline (2015). The results of our model showed that brand name influence [BE_BNI] (γ = 1.195; CR = 86.760; p < 0.001) and mass media impression [BE_MMI] (γ = −0.151; CR = −10.963; p < 0.001) impact BL. BL impacts all brand behavior outcomes (+WOM [γ = 0.795; CR = −57.719; p < 0.001], BLTY [γ = 0.821; CR = 53.451; p < 0.001], PI [γ = 0.211; CR = 15.379; p < 0.001], AC [γ = 0.846; CR = 53.794; p < 0.001], AE [γ = 0.202; CR = 15.528; p < 0.001], and PATL [γ = 0.632; CR = 29.101; p < 0.001]). Also, concerning the relationship between Brand Loyalty (BLYT) and the other brand behavior outcomes, Brand Loyalty (BLYT) increases (Re)purchase Intention (RI) (β = 0.591; t = 50.254; p < 0.001), Active Engagement (AE) (β = 0.257; t = 17.271; p < 0.001) and Perception of Attitudes Towards a Brand (PATB) LIDL (β = 0.169; t = 8.350; p < 0.001); at last, Active Engagement (AE) also increases Positive Word of Mouth (+WOM) (β = 0.382; t = 17.563; p < 0.001).
4.4.3. Measurement Invariance
Measurement invariance assessments were conducted to evaluate the consistency of this conceptual framework across different countries. The progressive country invariance test indicated that the configural invariance model across countries exhibited a satisfactory model fit [χ2(18) = 8.102; CFI = 0.994; TLI = 0.978; RMSEA = 0.48 (0.41–0.55); PCLOSE = 0.673]. The change in the CFI between configural and metric invariance [χ2(28) = 6.541; CFI = 0.993; TLI = 0.983; RMSEA = 0.42 (0.37–0.48); PCLOSE = 0.985] tests is lower than the threshold of 0.01 (ΔCFI = 0.001). Thus, metric invariance across countries is supported. Furthermore, in the scalar invariance test [χ2(31) = 7.699; CFI = 0.991; TLI = 0.979; RMSEA = 0.99 (0.53–0.64); PCLOSE = 0.004], it was observed that the intercepts of the indicators were consistent across countries, as the change in the CFI between the scalar and metric invariance tests was less than 0.01 (ΔCFI = 0.002).
4.5. Testing Hypothesis 4
4.5.1. Hypothesis 4 (H4)
Hypothesis 4 (H4).
Brand Loyalty (BLYT), (Re)purchase Intention (RI), Affective Commitment (AC), Active Engagement (AE), and Perception of Attitudes Towards a Brand (PATB) LIDL will contribute to explaining the variance of Positive Word of Mouth (+WOM).
4.5.2. Regression
Gender, age, income, Brand Loyalty (BLYT), (Re)purchase Intention (RI), Affective Commitment (AC), Active Engagement (AE), and Perception of Attitudes Towards a Brand (PATB) LIDL collectively account for 69.9% of the variance in the outcome variable Positive Word of Mouth (+WOM) (Table 13). Among these variables, Perception of Attitudes Towards a Brand (PATB) LIDL is the most significant contributor to explaining Positive Word of Mouth (+WOM).
5. Discussion
Although there is a growing interest among practitioners and academics in the domain of BE and BL, understanding the relationship between these two constructs and their contribution to explaining brand behavior outcomes is still limited, particularly in the retail sector (Ferreira et al. 2022). Also, to the best of our knowledge, reliable and valid measurement tools for the Portuguese and Czech population have been absent from measuring Brand Behaviour Outcomes (BBO) such as Brand Loyalty (BLYT), Positive Worth of Mouth, (Re)purchase Intention (RI), Affective Commitment (AC), Active Engagement (AE), and Perception of Attitudes Towards a Brand (PATB). As such, the current research aims to fill these gaps.
The primary purpose of this study was to investigate the psychometric properties of all the studied variables. The data analysis reveals that all the scales used are reliable and valid to measure the intended constructs. The descriptive analysis for each measure revealed no multicollinearity problems—i.e., predictors were not strongly correlated (r below 0.90; Mason and Perreault 1991). In addition, Cronbach alpha score was always acceptable since it was above the cutoff value of 0.70 for each measure (Nunnally and Bernstein 1994).
In terms of factorial validity, the fit indices for the measurement model were deemed satisfactory for both the overall sample and the two individual countries, Portugal and the Czech Republic (Marôco 2021). Moving on to measurement invariance, it was established that configural invariance held true across the two countries for all the utilized scales, as per Vandenberg and Lance (2000). Furthermore, both metric and scalar invariance were observed for all the scales except for the one assessing Active Engagement (AE), where only configural invariance was identified. This divergence may be attributed to cultural, social, and economic distinctions between the two countries. It is suggested that future research extends these investigations to nations with more cultural similarities to validate if similar patterns emerge. Lastly, concerning the convergent and discriminant validity of the measures, the employed estimates, namely Composite Reliability (CR) and Average Variance Extracted (AVE), fell within the recommended thresholds outlined by Fornell and Larcker (1981).
Based on our results, we identified positive and statistically significant correlations among the variables under examination. These results are consistent with outcomes reported in earlier research endeavors. Specifically, we observed a positive association between Brand Experience (BE) and Brand Love (BL), aligning with findings in studies such as Maduretno and Junaedi (2022). Furthermore, Brand Love (BL) exhibited positive correlations with various Brand Behaviour Outcomes (BBO), including Positive Word of Mouth (+WOM), Brand Loyalty (BLYT), (Re)purchase Intention (RI), Affective Commitment (AC), Active Engagement (AE), and Perception of Attitudes Towards a Brand (PATB), corroborating insights from studies by Albert and Merunka (2013), Anggara et al. (2023), Aureliano-Silva et al. (2022), Dam (2020), and Nayeem et al. (2019).
From the acquired findings, the proposed conceptual framework demonstrates a robust fit to the data across the total sample and individual country samples (Portugal and the Czech Republic). Furthermore, the analysis of measurement invariance reveals consistent findings of configural, metric, and scalar invariance across the two countries. These results contribute robust empirical support for the observed relationships among the variables in the model. Essentially, the outcomes imply that the positive associations among the variables persist regardless of the country, reinforcing the generalizability of the proposed relationships.
Notably, previous research has delved into integrated models involving some of the variables examined in this study. For example, Bae and Kim (2023) explored the connection between Brand Experience (BE) and Brand Loyalty (BLYT), investigating the mediating role of Brand Love (BL) and the moderating impact of brand trust on the mediated relationship. Wong and Haque (2022) delved into the mediating role of Brand Love (BL) in the relationship between brand innovativeness and word of mouth and between brand innovativeness and purchase intention. Ferreira et al. (2022) examined the mediating role of Brand Love (BL) in elucidating the relationship between Brand Experience (BE) and brand equity. Additionally, Aureliano-Silva et al. (2022) investigated the mediating impact of service recovery between Brand Love (BL), brand trust, and purchase intention.
Additionally, concerning the contribution of Brand Loyalty (BLYT), (Re)purchase Intention (RI), Affective Commitment (AC), Active Engagement (AE), and Perception of Attitudes Towards a Brand (PATB) to explaining the variance of Positive Word of Mouth (+WOM), the findings indicated that altogether these variables contribute to explain 69.9% of the variance of Positive Word of Mouth (+WOM). In fact, previous studies already found significant relationships between (1) Brand Loyalty (BLYT) and Positive Word of Mouth (+WOM) (e.g., Bairrada et al. 2019); (2) (Re)purchase Intention (RI) and Positive Word of Mouth (+WOM) (e.g., Langga et al. 2021); (3) Affective Commitment (AC) and Positive Word of Mouth (+WOM) (e.g., Dam 2020); (4) Active Engagement (AE) and Positive Word of Mouth (+WOM) (+WOM) (e.g., Bairrada et al. 2019); and (5) Perception of Attitudes Towards a Brand (PATB) and Positive Word of Mouth (+WOM) (e.g., Na et al. 2023).
5.1. Practical Implications for Organizations and Managers
The practical implications for organizations and managers lie in recognizing that the transition from Brand Experience (BE) to Brand Love (BL) plays a pivotal role in influencing diverse Brand Behavior Outcomes (BBO). Additionally, the study underscores the significance of both Brand Love (BL) and Affective Engagement (AE) in shaping Positive Word of Mouth (+WOM). To capitalize on these findings, organizations and managers should focus on enhancing and nurturing positive brand experiences, fostering brand love among consumers, and fostering emotional engagement. This approach is likely to yield favorable brand behavior outcomes and contribute to positive word-of-mouth marketing, ultimately strengthening the brand’s position in the market.
Also, the practical implications for organizations and managers stemming from the correlations between Brand Behavior Outcomes (BBO), encompassing Positive Word of Mouth (+WOM), Brand Loyalty (BLYT), (Re)purchase Intention (RI), Affective Commitment (AC), Active Engagement (AE), and Perception of Attitudes Towards a Brand (PATB), are multifaceted including an (1) holistic strategy development (a comprehensive approach that considers the interconnected nature of these variables can be more effective); (2) enhancing customer loyalty (fostering brand loyalty may have positive spillover effects on other dimensions; organizations can tailor loyalty programs, personalized experiences, and effective communication strategies to strengthen overall brand perception); (3) word-of-mouth marketing (organizations should aim to create remarkable brand experiences that prompt customers to share their positive experiences, thereby leveraging word-of-mouth marketing); (4) tailored communication strategies (organizations can tailor their communication strategies to evoke emotional connections, building affective commitment and shaping positive perceptions that contribute to various desired brand outcomes); (5) active customer engagement (highlighting the importance of engaging customers beyond the point of purchase; managers can focus on creating opportunities for customers to actively participate, provide feedback, and be part of the brand community); (6) integrated marketing efforts (organizations can align marketing campaigns, customer engagement initiatives, and product/service development to create a cohesive brand narrative that resonates across various dimensions); and (7) continuous monitoring and adaptation (organizations should stay attuned to shifts in customer perceptions and behaviors, adapting strategies accordingly to maintain a positive brand trajectory).
The transition from Brand Experience (BE) to Brand Love (BL) and its impact on diverse Brand Behavior Outcomes (BBO) have significant managerial implications for businesses. When a brand goes beyond merely offering a product or service experience and instead fosters a sense of love or emotional connection with consumers, it can result in various positive outcomes. Establishing brand love often leads to increased brand loyalty, as consumers who are emotionally connected to a brand are more inclined to stay loyal, make repeat purchases, and advocate for the brand. Favorable customer experiences are shared, contributing to positive word-of-mouth marketing that can significantly influence brand reputation and attract new customers. Brand-loving consumers may exhibit lower price sensitivity, expressing a willingness to pay a premium for products or services due to their perceived value and emotional attachment to the brand. Moreover, brand love can improve customer retention rates by creating a strong emotional bond that deters customers from switching to competitors, even when faced with appealing alternatives. The transition to brand love contributes to the establishment of robust brand equity, where loved brands are perceived as more valuable, trustworthy, and memorable, providing a sustained market presence and a competitive advantage. Brands with a loyal and loving customer base find it easier to introduce innovations and adapt to changing market conditions, as loyal customers are often more forgiving and supportive during transitions, allowing the brand to evolve without losing its core customer base. Brand love extends beyond customers to employees, fostering a sense of pride and commitment that positively impacts employee engagement and overall productivity. The cumulative impact of brand love on various behavioral outcomes contributes to long-term growth, as brands consistently prioritizing positive emotional connections are more likely to achieve sustained success in the market.
5.2. Limitations and Future Research
Despite its valuable contributions, this study comes with certain limitations that should be acknowledged. Firstly, the research is confined to the retail sector, specifically focusing on consumers of a particular brand (LIDL). Consequently, the generalizability of these findings to other sectors may be restricted. Future investigations should aim to explore diverse sectors and brands to enhance the applicability of the study’s insights.
Secondly, the research is geographically limited to two European countries—Portugal and the Czech Republic. This regional focus could constrain the broader applicability of the conclusions. To address this limitation, it is imperative to extend the testing of the conceptual framework to non-European countries, allowing for a more comprehensive understanding of cross-cultural variations.
Furthermore, beyond the examined variables of Brand Experience (BE) and Brand Loyalty (BLYT), various factors such as consumer characteristics (e.g., personality, age, gender) and relationship characteristics (e.g., relationship duration and quality) could influence Brand Behaviour Outcomes (BBO). Therefore, future research endeavors should explore these additional dimensions to provide a more nuanced and comprehensive perspective.
6. Conclusions
In this study, our objectives were fourfold: (1) to validate and assess the invariance of the Brand Experience (BE) and Brand Love (BL) scales related to the LIDL brand across Portugal and the Czech Republic, while also evaluating their convergent and discriminant validity; (2) to investigate the relationships between Brand Experience (BE), Brand Love (BL), and various Brand Behaviour Outcomes (BBO), including Positive Word of Mouth (+WOM), Brand Loyalty (BLYT), (Re)purchase Intention (RI), Affective Commitment (AC), Active Engagement (AE), and Perception of Attitudes Towards a Brand (PATB) ; (3) to examine a conceptual model positing that Brand Experience (BE) influences Brand Love (BL), which subsequently impacts Brand Behaviour Outcomes (BBO), while also assessing the invariance of the model across the two countries; and (4) to identify the key variables contributing to the explanation of Positive Word of Mouth (+WOM).
Our findings affirmed the reliability and validity of the scales employed to measure the intended constructs. We successfully established measurement invariance, convergent validity, and discriminant validity across samples from Portugal and the Czech Republic. Furthermore, positive and significant correlations were identified among the variables under investigation. The conceptual, integrative model demonstrated a good fit and remained invariant across the two countries. Lastly, the results obtained showed that Positive Word of Mouth (+WOM) was explained by Brand Behaviour Outcomes (BBO), including Brand Loyalty (BLYT), (Re)purchase Intention (RI), Affective Commitment (AC), Active Engagement (AE), and Perception of Attitudes Towards a Brand (PATB).
It is worth noting that this study is the first to test an integrative model that incorporates all these variables within the same conceptual framework. As such, future research endeavors are encouraged to replicate and extend the present study to further validate and expand upon these findings.
Author Contributions
Conceptualization, Â.L. and A.R.; methodology, S.L.; software, A.R.; validation, Â.L., and S.L.; formal analysis, Â.L.; investigation, A.R.; resources, S.L.; data curation, A.R.; writing—original draft preparation, Â.L.; writing—review and editing, Â.L.; visualization, S.L.; supervision, Â.L.; project administration, A.R.; funding acquisition, S.L. All authors have read and agreed to the published version of the manuscript.
Funding
This research received no external funding.
Institutional Review Board Statement
The study was conducted in accordance with the Declaration of Helsinki and approved by the Institutional Review Board (or Ethics Committee).
Informed Consent Statement
Informed consent was obtained from all subjects involved in the study.
Data Availability Statement
Data will be made available upon reasonable request.
Conflicts of Interest
The authors declare no conflict of interest.
References
- Ahmad, Bilal, and Muhammad Imad ud Din Akbar. 2023. Validating a multidimensional perspective of relationship marketing on brand attachment, customer loyalty and purchase intentions: A serial mediation model. Journal of Strategic Marketing 31: 669–92. [Google Scholar] [CrossRef]
- Albert, Noel, and Dwight Merunka. 2013. The role of Brand Love (BL) in consumer-brand relationships. Journal of Consumer Marketing 30: 258–66. [Google Scholar] [CrossRef]
- Alshreef, Mohamed A., Thowayeb H. Hassan, Mohamed Y. Helal, Mahmoud I. Saleh, Palei Tatiana, Wael M. Alrefae, Nabila N. Elshawarbi, Hassan N. Al-Saify, Amany E. Salem, and Mohamed AS Elsayed. 2023. Analyzing the Influence of eWOM on Customer Perception of Value and Brand Love in Hospitality Enterprise. Sustainability 15: 7286. [Google Scholar] [CrossRef]
- Anastasiei, Bogdan, Nicoleta Dospinescu, and Octavian Dospinescu. 2023. Word-of-mouth engagement in online social networks: Influence of network centrality and density. Electronics 12: 2857. [Google Scholar] [CrossRef]
- Anggara, Ahmad Khabib Dwi, Ririn Tri Ratnasari, and Ismah Osman. 2023. How store attribute affects customer experience, Brand Love (BL) and Brand Loyalty (BLYT). Journal of Islamic Marketing 14: 2980–3006. [Google Scholar] [CrossRef]
- Arbuckle, James. 2020. Amos. Version 28.0. Chicago: IBM SPSS. [Google Scholar]
- Aureliano-Silva, Leonardo, Eduardo Eugênio Spers, Rab Nawaz Lodhi, and Monalisa Pattanayak. 2022. Who loves to forgive? The mediator mechanism of service recovery between Brand Love (BL), brand trust and purchase intention in the context of food-delivery apps. British Food Journal 124: 4686–700. [Google Scholar] [CrossRef]
- Bae, Byung Ryul, and Sung-Eun Kim. 2023. Effect of Brand Experience (BE) on Brand Loyalty (BLYT) mediated by Brand Love (BL): The moderated mediation role of brand trust. Asia Pacific Journal of Marketing and Logistics 35: 2412–30. [Google Scholar] [CrossRef]
- Bairrada, Cristela Maia, Arnaldo Coelho, and Viktoriya Lizanets. 2019. The impact of brand personality on consumer behaviour: The role of Brand Love (BL). Journal of Fashion Marketing and Management: An International Journal 23: 30–47. [Google Scholar] [CrossRef]
- Batra, Rajeev, Aaron Ahuvia, and Richard P. Bagozzi. 2012. Brand Love (BL). Journal of Marketing 76: 1–16. [Google Scholar] [CrossRef]
- Bergkvist, Lars, and Tino Bech-Larsen. 2010. Two studies of consequences and actionable antecedents of Brand Love (BL). Journal of Brand Management 17: 504–18. [Google Scholar] [CrossRef]
- Bıçakcıoğlu, Nilay, İlayda İpek, and Gül Bayraktaroğlu. 2018. Antecedents and outcomes of Brand Love (BL): The mediating role of Brand Loyalty (BLYT). Journal of Marketing Communications 24: 863–77. [Google Scholar] [CrossRef]
- Brakus, J. Joško, Bernd H. Schmitt, and Lia Zarantonello. 2009. Brand Experience (BE): What is it? how is it measured? does it affect loyalty? Journal of Marketing 73: 52–68. [Google Scholar] [CrossRef]
- Browne, Michael, and Robert Cudeck. 1992. Alternative ways of assessing model fit. Sociological Methods & Research 21: 230–58. [Google Scholar] [CrossRef]
- Carroll, Barbara A., and Aaron C. Ahuvia. 2006. Some antecedents and outcomes of Brand Love (BL). Marketing Letters 17: 79–89. [Google Scholar] [CrossRef]
- Dam, Tri Cuong. 2020. The effect of brand image, Brand Love (BL) on brand commitment and Positive Word of Mouth (+WOM). The Journal of Asian Finance, Economics and Business (JAFEB) 7: 449–57. [Google Scholar] [CrossRef]
- Ferreira, Pedro, Sílvia Faria, and Carla Gabriel. 2022. The influence of Brand Experience (BE) on brand equity: The mediating role of Brand Love (BL) in a retail fashion brand. Management & Marketing. Challenges for the Knowledge Society 17: 1–14. [Google Scholar] [CrossRef]
- Fetscherin, Marc. 2014. What type of relationship do we have with loved brands? Journal of Consumer Marketing 31: 430–40. [Google Scholar] [CrossRef]
- Fornell, Claes, and David F. Larcker. 1981. Structural Equation Models with Unobservable Variables and Measurement Error: Algebra and Statistics. Journal of Marketing Research 18: 382–88. [Google Scholar] [CrossRef]
- Fullerton, Gordon. 2005. How commitment both enables and undermines marketing relationships. European Journal of Marketing 39: 1372–88. [Google Scholar] [CrossRef]
- Garg, Ruchi, Jaydeep Mukherjee, Soumendu Biswas, and Aarti Kataria. 2015. An investigation of antecedents and consequences of Brand Love (BL) in India. Asia-Pacific Journal of Business Administration 7: 174–96. [Google Scholar] [CrossRef]
- Gilmore, James, and Joseph Pine. 1999. The Experience Economy: Work is Theatre and Every Business a Stage. Boston: Harvard Business Publishing. [Google Scholar]
- Godes, David, and Dina Mayzlin. 2004. Using online conversations to study word-of-mouth communication. Marketing Science 23: 545–60. [Google Scholar] [CrossRef]
- Gumparthi, Vivek Pani, and Sabyasachi Patra. 2020. The phenomenon of Brand Love (BL): A systematic literature review. Journal of Relationship Marketing 19: 93–132. [Google Scholar] [CrossRef]
- Gupta, Vineet, Devesh Varshney, Harsh Jhamtani, Deepam Kedia, and Shweta Karwa. 2014. Identifying purchase intent from social posts. Proceedings of the International AAAI Conference on Web and Social Media 8: 180–86. [Google Scholar] [CrossRef]
- Han, Heesup, Hong Ngoc Nguyen, Hakjun Song, Bee-Lia Chua, Sanghyeop Lee, and Wansoo Kim. 2018. Drivers of Brand Loyalty (BLYT) in the chain coffee shop industry. International Journal of Hospitality Management 72: 86–97. [Google Scholar] [CrossRef]
- Han, Tae-Im, and Dooyoung Choi. 2019. Fashion brand love: Application of a cognition–affect–conation model. Social Sciences 8: 256. [Google Scholar] [CrossRef]
- Hu, Li-tze, and Peter M. Bentler. 1999. Cutoff criteria for fit indexes in covariance structure analysis: Conventional criteria versus new alternatives. Structural Equation Modeling: A Multidisciplinary Journal 6: 1–55. [Google Scholar] [CrossRef]
- Karjaluoto, Heikki, Juha Munnukka, and Katrine Kiuru. 2016. Brand Love (BL) and Positive Word of Mouth (+WOM): The moderating effects of experience and price. Journal of Product & Brand Management 25: 527–37. [Google Scholar] [CrossRef]
- Keller, Kevin Lane, M. G. Parameswaran, and Isaac Jacob. 2011. Strategic Brand Management: Building, Measuring, and Managing Brand Equity. Bangalore: Pearson Education India. [Google Scholar]
- Khan, Imran, and Zillur Rahman. 2016. Retail Brand Experience (BE): Scale development and validation. Journal of Product & Brand Management 25: 435–51. [Google Scholar] [CrossRef]
- Kline, Rex B. 2015. Principles and Practice of Structural Equation Modeling. New York: Guilford Publications. [Google Scholar] [CrossRef]
- Langga, Ande, Andriani Kusumawati, and Taher Alhabsji. 2021. Intensive distribution and sales promotion for improving customer-based brand equity (CBBE), repurchase intention and word-of-mouth (WOM). Journal of Economic and Administrative Sciences 37: 577–95. [Google Scholar] [CrossRef]
- Liu, Tsung-Chi, and Chung-Yu Wang. 2008. Factors affecting attitudes toward private labels and promoted brands. Journal of Marketing Management 24: 283–98. [Google Scholar] [CrossRef]
- Maduretno, Raden Bernard Eka Hutomo Putra, and MF Sheellyana Junaedi. 2022. Exploring the effects of coffee shop Brand Experience (BE) on loyalty: The roles of Brand Love (BL) and brand trust. Gadjah Mada International Journal of Business 24: 289–309. Available online: https://search.informit.org/doi/10.3316/informit.699848732894310 (accessed on 23 December 2023). [CrossRef]
- Marôco, João. 2021. Análise de equações estruturais: Fundamentos teóricos, software & aplicações [Analysis of Structural Equations: Theoretical Foundations, Software & Applications], 3rd ed. Lisboa: ReportNumber. [Google Scholar]
- Mason, Charlotte, and William Perreault. 1991. Collinearity, power, and interpretation of multiple regression analysis. Journal of Marketing Research 28: 268–80. [Google Scholar] [CrossRef]
- Na, Meng, Li Rong, Mohd Helmi Ali, Syed Shah Alam, Mohammad Masukujjaman, and Khairul Anuar Mohd Ali. 2023. The mediating role of brand trust and Brand Love (BL) between Brand Experience (BE) and loyalty: A study on smartphones in China. Behavioural Sciences 13: 502. [Google Scholar] [CrossRef]
- Nayeem, Tahmid, Feisal Murshed, and Abhishek Dwivedi. 2019. Brand Experience (BE) and brand attitude: Examining a credibility-based mechanism. Marketing Intelligence & Planning 37: 821–36. [Google Scholar] [CrossRef]
- Nunnally, Jum, and Ira Bernstein. 1994. Psychometric Theory, 3rd ed. New York: McGrawHill. [Google Scholar]
- Oliver, Richard L. 1999. Whence consumer loyalty? Journal of Marketing 63: 33–44. [Google Scholar] [CrossRef]
- Peña-García, Nathalie. 2020. Purchase intention and purchase behaviour online: A cross-cultural approach. Heliyon 6: e04284. [Google Scholar] [CrossRef]
- Quester, Pascale, and Ai Lin Lim. 2003. Product involvement/Brand Loyalty (BLYT): Is there a link? Journal of Product & Brand Management 12: 22–38. [Google Scholar] [CrossRef]
- Rather, Raouf Ahmad, Shehnaz Tehseen, Murtaza Hassan Itoo, and Shakir Hussain Parrey. 2021. Customer brand identification, Affective Commitment (AC), customer satisfaction, and brand trust as antecedents of customer behavioural intention of loyalty: An empirical study in the hospitality sector. In Consumer Behaviour in Hospitality and Tourism. Oxfordshire: Routledge, pp. 44–65. [Google Scholar]
- Reichheld, Frederick, and Thomas Teal. 1996. The Loyalty Effect. Boston: Harvard Business School Press. [Google Scholar]
- Rodrigues, Clarinda, and Amélia Brandão. 2021. Measuring the effects of retail Brand Experience (BE)s and Brand Love (BL) on word of mouth: A cross-country study of IKEA brand. The International Review of Retail, Distribution and Consumer Research 31: 78–105. [Google Scholar] [CrossRef]
- Satorra, Albert, and Peter M. Bentler. 2001. A scaled difference chi-square test statistic for moment structure analysis. Psychometrika 66: 507–14. [Google Scholar] [CrossRef]
- Schmitt, Bernd, and David Rogers. 2008. Handbook on Brand and Experience Management. Cheltenham: Edward Elgar Publishing. [Google Scholar]
- Schmitt, Bernd. 1999. Experiential marketing. Journal of Marketing Management 15: 53–67. [Google Scholar] [CrossRef]
- Sohaib, Muhammad, Jacob Mlynarski, and Rui Wu. 2023. Building Brand Equity: The Impact of Brand Experience (BE), Brand Love (BL), and Brand Engagement: A case study of customers’ perception of the Apple brand in China. Sustainability 15: 746. [Google Scholar] [CrossRef]
- Sweeney, Jillian, and Geoffrey Soutar. 2001. Consumer perceived value: The development of a multiple item scale. Journal of Retailing 77: 203–20. [Google Scholar] [CrossRef]
- Vandenberg, Robert, and Charles Lance. 2000. A review and synthesis of the measurement invariance literature: Suggestions, practices, and recommendations for organizational research. Organizational Research Methods 3: 4–70. [Google Scholar] [CrossRef]
- Verma, Pranay. 2021. The effect of brand engagement and Brand Love (BL) upon overall brand equity and purchase intention: A moderated–mediated model. Journal of Promotion Management 27: 103–32. [Google Scholar] [CrossRef]
- Vrtana, David, and Anna Krizanova. 2023. The Power of Emotional Advertising Appeals: Examining Their Influence on Consumer Purchasing Behavior and Brand–Customer Relationship. Sustainability 15: 13337. [Google Scholar] [CrossRef]
- Wang, Xinyue, and Nor Asiah Binti Omar. 2023. Nexus between Brand Love (BL), Loyalty, Affective Commitment (AC) and Positive Word of Mouth (+WOM): In the Context of Social Identity Theory. Sustainability 15: 3813. [Google Scholar] [CrossRef]
- Wong, Amy, and Mehruba Haque. 2022. Understanding the brand and website effects of online loyalty: A mediation perspective. Journal of Marketing Management 38: 333–68. [Google Scholar] [CrossRef]
- Yi, Youjae, and Hoseong Jeon. 2003. Effects of loyalty programs on value perception, program loyalty, and Brand Loyalty (BLYT). Journal of the Academy of Marketing Science 31: 229–40. [Google Scholar] [CrossRef]
- Yi, Youjae, and Suna La. 2004. What influences the relationship between customer satisfaction and repurchase intention? Investigating the effects of adjusted expectations and customer loyalty. Psychology & Marketing 21: 351–73. [Google Scholar] [CrossRef]
- Zeithaml, Valarie, Leonard Berry, and Arantharanthan Parasuraman. 1993. The nature and determinants of customer expectations of service. Journal of the Academy of Marketing Science 21: 1–12. [Google Scholar] [CrossRef]
Figure 1.
BE’ standardized factor loading for the total sample.

Figure 2.
BL’ standardized factor loading for the total sample.

Figure 3.
Confirmation of the authors’ conceptual framework.


Table 1.
Sample sociodemographic characteristics.
| Sociodemographic Variables | N (%) | N (%) | χ2 | p | Φ | |
|---|---|---|---|---|---|---|
| Country | Portugal | Czech Republic | ||||
| Sample | 1362 (43.9) | 1741 (56.1) | ||||
| Gender | Female | 890 (65.3) | 1108 (63.6) | 0.97 | 0.325 | −0.02 |
| Male | 472 (34.7) | 633 (36.4) | ||||
| Education | Without university studies | 690 (50.7) | 1310 (75.2) | 201.57 | <0.001 | −0.26 |
| With university studies | 672 (49.3) | 471 (24.8) | ||||
| Professional status | Inactive | 210 (15.4) | 131 (7.5) | 48.68 | <0.001 | 0.13 |
| Active | 1152 (84.6) | 1610 (92.5) | ||||
| Income | Insufficient | 189 (13.9) | 83 (4.8) | 184.10 | <0.001 | 0.24 |
| Sufficient | 476 (34.9) | 382 (21.9) | ||||
| Satisfactory | 626 (46.0) | 1094 (62.8) | ||||
| High | 71 (5.2) | 182 (10.5) | ||||
| t | p | d | ||||
| Age | M ± SD; Min–Max | 36.28 ± 15.70; 18–99 | 31.53 ± 14.37; 18–100 | 8.78 | <0.001 | 0.32 |
Note: N = frequencies; % = percentage; χ2 = Qui-squared; p = p-value; Φ = phi; t = t-test; d = Cohen’s d effect size.
Table 2.
BE Scale items, subscales and total frequencies and Cronbach’s alpha.
| M (1–7) | SD | Sk (SD = 0.04) | Kr (SD = 0.09) | α if Item Deleted | Corrected total Item Correlation | ||
|---|---|---|---|---|---|---|---|
| Brand name influence α = 0.833 | 4.44 | 1.33 | −0.29 | −0.35 | |||
| 1 | The LIDL brand name stimulates my senses | 4.84 | 1.43 | −0.71 | 0.17 | 0.921 | 0.51 |
| 2 | I feel excited whenever I find LIDL brand name | 4.62 | 1.48 | −0.46 | −0.31 | 0.919 | 0.63 |
| 3 | When I think of excellence. I think of LIDL | 3.85 | 1.69 | −0.05 | −0.94 | 0.919 | 0.57 |
| Customer billing, order and application forms α = 0.746 | 5.19 | 1.08 | −0.61 | 0.59 | |||
| 4 | I feel good with LIDL because of their simple invoices/receipts | 4.49 | 1.50 | −0.44 | −0.28 | 0.920 | 0.47 |
| 5 | I don’t have reasons to complain about LIDL’s billing | 5.61 | 1.26 | −1.17 | 1.41 | 0.926 | 0.45 |
| 6 | The receipts of LIDL are easy to understand | 5.47 | 1.21 | −0.86 | 0.69 | 0.923 | 0.52 |
| Mass media impression α = 0.796 | 4.40 | 1.28 | −0.33 | −0.02 | |||
| 7 | I find it interesting to connect with LIDL through the Internet (Facebook. Instagram…) | 4.22 | 1.50 | −0.21 | −0.22 | 0.923 | 0.39 |
| 8 | I feel good when I get any message or news about LIDL | 4.30 | 1.47 | −0.32 | −0.25 | 0.919 | 0.59 |
| 9 | Any ads about LIDL grab my attention | 4.68 | 1.58 | −0.61 | −0.31 | 0.920 | 0.52 |
| Point-of-sales assistance α = 0.923 | 4.75 | 1.40 | −0.63 | −0.11 | |||
| 10 | The way LIDL organizes their shelves is attractive | 4.66 | 1.51 | −0.57 | −0.29 | 0.919 | 0.68 |
| 11 | Product display arrangement makes product search easier | 4.79 | 1.52 | −0.69 | −0.18 | 0.920 | 0.75 |
| 12 | Proper arrangement of shelves at this retail brand makes me feel good | 4.78 | 1.48 | −0.63 | −0.17 | 0.918 | 0.76 |
| Recommendation by a salesperson α = 0.910 | 4.91 | 1.29 | −0.46 | 0.06 | |||
| 13 | I enjoy shopping with LIDL because salespersons make it easy for me | 4.89 | 1.46 | −0.54 | −0.16 | 0.918 | 0.71 |
| 14 | I feel good in dealing with LIDL because their staff have the required knowledge | 4.93 | 1.38 | −0.53 | 0.06 | 0.918 | 0.73 |
| 15 | Helping nature of staff at LIDL has contributed to a better shopping experience | 4.90 | 1.37 | −0.45 | −0.01 | 0.919 | 0.64 |
| BE Total α = 0.925 | 4.74 | 1.02 | −0.25 | −0.04 |
Note: M = mean; SD = standard deviation; Sk = skewness; Kr = kurtosis; α = Cronbach’s alpha.
Table 3.
BE Scale fit indices for the total sample and different countries’ samples.
| Fit indices of models 1 | |||||||||||
|---|---|---|---|---|---|---|---|---|---|---|---|
| Sample | χ2 | df | χ2/df | p | CFI | GFI | AGFI | TLI | RMSEA (90%CI) | PCLOSE | SRMR |
| Total | 529.561 | 79 | 6.789 | 0.000 | 0.985 | 0.985 | 0.977 | 0.980 | 0.043 (0.040–0.047) | 0.999 | 0.028 |
| Portugal | 266.491 | 78 | 3.417 | 0.000 | 0.986 | 0.986 | 0.974 | 0.981 | 0.042 (0.037–0.048) | 0.990 | 0.028 |
| Czech Republic | 471.826 | 78 | 6.049 | 0.000 | 0.975 | 0.975 | 0.960 | 0.966 | 0.054 (0.049–0.059) | 0.084 | 0.037 |
Note: 1 Fit indices were adjusted after residuals correlations of 4 items; p < 0.001 for all indicators; χ2 = chi-square; df = degrees of freedom; CFI = comparative fit index; GFI = goodness of fit index; AGFI = adjusted goodness of fit index; TLI = Tuck–Lewis index; RMSEA = root mean square error of approximation; CI = confidence interval; SRMR = standardized root mean square residual.
Table 4.
Measurement invariance tests of the BE Scale across countries.
| χ2 | df | χ2/df | p | CFI | RMSEA (90%CI) | ΔCFI | ΔRMSEA | |
|---|---|---|---|---|---|---|---|---|
| Country | ||||||||
| Configural invariance | 738.308 | 156 | 4.733 | 0.000 | 0.980 | 0.035 (0.032–0.037) | ||
| Metric invariance | 783.828 | 166 | 4.722 | 0.000 | 0.979 | 0.035 (0.032–0.037) | 0.001 | 0.000 |
| Scalar invariance | 1701.480 | 181 | 9.400 | 0.000 | 0.948 | 0.052 (0.050–0.054) | 0.031 | 0.017 |
Note: p < 0.001 for all indicators; χ2 = chi-square; df = degrees of freedom; CFI = comparative fit index; RMSEA = root mean square error of approximation; CI = confidence interval; ΔCFI = adjusted comparative fit index; ΔRMSEA = adjusted root mean square error of approximation.
Table 5.
Correlations between BE Scale total and subscales, AVE, AVE square root, and CR.
| 1 | 2 | 3 | 4 | 5 | 6 | AVE | CR | |
|---|---|---|---|---|---|---|---|---|
| 1 BE Total | 0.707 | 0.500 | 0.935 | |||||
| 2 BE Brand Name Influence | 0.833 ** | 0.869 | 0.755 | 0.902 | ||||
| 3 BE Customer Billing Order Application Forms | 0.742 ** | 0.520 ** | 0.823 | 0.677 | 0.862 | |||
| 4 BE Mass Media Impression | 0.822 ** | 0.704 ** | 0.510 ** | 0.844 | 0.712 | 0.881 | ||
| 5 BE Point Sales Assistance | 0.782 ** | 0.530 ** | 0.472 ** | 0.498 ** | 0.931 | 0.866 | 0.951 | |
| 6 BE Recommendation Salesperson | 0.809 ** | 0.551 ** | 0.538 ** | 0.565 ** | 0.570 ** | 0.921 | 0.848 | 0.944 |
Note: ** p < 0.001; AVE = average variance extracted; CR = composite reliability; bold = AVE square root.
Table 6.
BL scale items and total frequencies and Cronbach’s alpha, composite reliability, average variance extracted, and its square root.
Table 6.
BL scale items and total frequencies and Cronbach’s alpha, composite reliability, average variance extracted, and its square root.
| M (1–7) | SD | Sk (SD = 0.04) | Kr (SD = 0.09) | α if Item Deleted | Corrected Total Item Correlation | ||
|---|---|---|---|---|---|---|---|
| 1 | LIDL is a wonderful brand. | 5.25 | 1.21 | −0.78 | 1.01 | 0.903 | 0.656 |
| 2 | LIDL makes me feel good. | 5.16 | 1.24 | −0.80 | 0.86 | 0.903 | 0.673 |
| 3 | LIDL is totally awesome. | 4.71 | 1.43 | −0.47 | −0.10 | 0.896 | 0.774 |
| 4 | I have neutral feeling about LIDL | 3.62 | 1.72 | 0.18 | −0.97 | 0.925 | 0.343 |
| 5 | LIDL makes me very happy. | 4.59 | 1.36 | −0.36 | 0.09 | 0.899 | 0.703 |
| 6 | I love the LIDL brand. | 4.62 | 1.59 | −0.51 | −0.37 | 0.901 | 0.671 |
| 7 | I have no particular feelings about LIDL. | 3.62 | 1.75 | 0.23 | −0.94 | 0.921 | 0.385 |
| 8 | LIDL is a pure delight. | 4.22 | 1.48 | −0.22 | −0.23 | 0.899 | 0.712 |
| 9 | I am passionate about LIDL. | 4.34 | 1.57 | −0.39 | −0.35 | 0.900 | 0.702 |
| 10 | I am very attached to LIDL. | 4.48 | 1.56 | −0.43 | −0.33 | 0.901 | 0.663 |
| BL Total α = 0.914; CR = 0.936; AVE = 0.606; AVE square root = 0.778 | 4.46 | 1.13 | −0.17 | −0.21 |
Note: M = mean; SD = standard deviation; Sk = skewness; Kr = kurtosis; α = Cronbach’s alpha; CR = composite reliability; AVE = average variance extracted.
Table 7.
BL scale fit indices for the total sample and different countries’ samples.
| Fit Indices of Models 1 | |||||||||||
|---|---|---|---|---|---|---|---|---|---|---|---|
| Sample | χ2 | df | χ2/df | p | CFI | GFI | AGFI | TLI | RMSEA (90%CI) | PCLOSE | SRMR |
| Total | 232.477 | 23 | 10.108 | 0.000 | 0.991 | 0.991 | 0.980 | 0.982 | 0.054 (0.048–0.061) | 0.131 | 0.025 |
| Portugal | 170.051 | 31 | 5.486 | 0.000 | 0.987 | 0.987 | 0.977 | 0.981 | 0.057 (0.049–0.066) | 0.070 | 0.035 |
| Czech Republic | 193.718 | 29 | 6.680 | 0.000 | 0.988 | 0.988 | 0.979 | 0.982 | 0.057 (0.050–0.065) | 0.058 | 0.022 |
Note: 1 Fit indices were adjusted after residuals correlations of 9 items; p < 0.001 for all indicators; χ2 = chi-square; df = degrees of freedom; CFI = comparative fit index; GFI = goodness of fit index; AGFI = adjusted goodness of fit index; TLI = Tuck–Lewis index; RMSEA = root mean square error of approximation; CI = confidence interval; SRMR = standardized root mean square residual.
Table 8.
Measurement invariance tests of the BL scale across countries.
| χ2 | df | χ2/df | p | CFI | RMSEA (90%CI) | ΔCFI | ΔRMSEA | |
|---|---|---|---|---|---|---|---|---|
| Country | ||||||||
| Configural invariance | 321.861 | 42 | 7.663 | 0.000 | 0.989 | 0.046 (0.042–0.051) | ||
| Metric invariance | 367.249 | 44 | 8.347 | 0.000 | 0.987 | 0.049 (0.044–0.053) | 0.002 | 0.003 |
| Scalar invariance | 1929.298 | 54 | 35.728 | 0.000 | 0.824 | 0.106 (0.102–0.110) | 0.063 | 0.057 |
Note: p < 0.001 for all indicators; χ2 = chi-square; df = degrees of freedom; CFI = comparative fit index; RMSEA = root mean square error of approximation; CI = confidence interval; ΔCFI = adjusted comparative fit index; ΔRMSEA = adjusted root mean square error of approximation.
Table 9.
Positive Word of Mouth (+WOM), Brand Loyalty (BLYT), (Re)purchase Intention (RI), Affective Commitment (AC), Active Engagement (AE), and Perception of Attitudes Towards a Brand (PATB) LIDL items and total frequencies and Cronbach’s alpha, composite reliability, average variance extracted and its square root.
| M (1–7) | SD | Sk (SD = 0.04) | Kr (SD = 0.08) | α if Item Deleted | Corrected Total Item Correlation | ||
|---|---|---|---|---|---|---|---|
| Positive Word of Mouth (+WOM) α = 0.914; CR = 0.940; AVE = 0.795; AVE square root = 0.892 | |||||||
| 1 | I have recommended LIDL to lots of people. | 4.81 | 1.60 | −0.67 | −0.27 | 0.875 | 0.841 |
| 2 | I ‘talk up’ LIDL to my friends. | 4.85 | 1.58 | −0.76 | −0.12 | 0.873 | 0.847 |
| 3 | I try to spread the good word about LIDL. | 4.51 | 1.61 | −0.43 | −0.47 | 0.902 | 0.767 |
| 4 | I give LIDL tons of Positive Word of Mouth (+WOM) advertising. | 4.78 | 1.55 | −0.65 | −0.21 | 0.903 | 0.762 |
| Brand Loyalty (BLYT) α = 0.946; CR = 0.961; AVE = 0.862; AVE square root = 0.928 | |||||||
| 1 | I pay more attention to LIDL than to other retailers | 4.34 | 1.74 | −0.26 | −0.88 | 0.926 | 0.882 |
| 2 | I am more interested in LIDL than in other retail brands | 4.26 | 1.74 | −0.22 | −0.91 | 0.920 | 0.901 |
| 3 | It is very important for me to buy in LIDL rather than another retailer | 4.03 | 1.72 | −0.06 | −0.89 | 0.923 | 0.894 |
| 4 | I always buy in LIDL because I really like it | 4.10 | 1.72 | −0.14 | −0.92 | ||
| (Re)purchase Intention (RI) α = 0.898; CR = 0.931; AVE = 0.771; AVE square root = 0.878 | |||||||
| 1 | I intend to buy in LIDL | 5.37 | 1.31 | −1.02 | 1.22 | 0.901 | 0.686 |
| 2 | LIDL is my first choice for shopping | 4.17 | 1.80 | −0.14 | −0.99 | 0.860 | 0.808 |
| 3 | The next time I need shopping, I’ll go to LIDL | 4.39 | 1.64 | −0.25 | −0.66 | 0.842 | 0.842 |
| 4 | I will continue to be a loyal customer of LIDL | 5.01 | 1.49 | −0.73 | 0.18 | 0.864 | 0.789 |
| Affective Commitment (AC) α = 0.955; CR = 0.967; AVE = 0.881; AVE square root = 0.939 | |||||||
| 1 | I feel like part of a family as a customer of LIDL | 3.75 | 1.73 | 0.03 | −0.81 | 0.933 | 0.854 |
| 2 | I feel emotionally attached to LIDL | 3.53 | 1.80 | 0.17 | −0.95 | 0.935 | 0.915 |
| 3 | LIDL has a great deal of personal meaning for me | 3.51 | 1.80 | 0.21 | −0.92 | 0.943 | 0.908 |
| 4 | I feel a strong sense of identification with LIDL | 3.65 | 1.80 | 0.04 | −1.01 | ||
| Active Engagement (AE) α = 0.807; CR = 0.888; AVE = 0.725; AVE square roots = 0.851 | |||||||
| 1 | To what extent do you follow news about LIDL? | 2.31 | 0.83 | 0.31 | −0.26 | 0.714 | 0.676 |
| 2 | How often do you talk about LIDL to others? | 2.21 | 0.74 | 0.66 | 0.89 | 0.744 | 0.654 |
| 3 | How often do you visit the LIDL web site? | 1.98 | 0.90 | 0.65 | −0.14 | 0.750 | 0.649 |
| Perception of Attitudes Towards Brand LIDL α = 0.901; CR = 0.928; AVE = 0.720; AVE square roots = 0.849 | |||||||
| 1 | I consider LIDL as a reliable place for shopping. | 5.42 | 1.13 | −1.00 | 1.70 | 0.882 | 0.745 |
| 2 | LIDL provides very good prices for the products it is selling. | 5.52 | 1.08 | −0.89 | 1.46 | 0.883 | 0.739 |
| 3 | LIDL’s products have consistent quality. | 5.45 | 1.14 | −0.96 | 1.44 | 0.874 | 0.780 |
| 4 | I am very satisfied with my shopping experience in LIDL. | 5.48 | 1.12 | −1.01 | 1.74 | 0.867 | 0.815 |
| 5 | LIDL tries its best to keep improving shopping (experience) for its customers. | 5.12 | 1.24 | −0.62 | 0.54 | 0.893 | 0.703 |
Note: M = mean; SD = standard deviation; Sk = skewness; Kr = kurtosis; α = Cronbach’s alpha; CR = composite reliability; AVE = average variance extracted.
Table 10.
Positive Word of Mouth (+WOM) (+WOM), Brand Loyalty (BLYT) (BLo), (Re)purchase Intention (RI) (PI), Affective Commitment (AC) (AC), Active Engagement (AE) (AE), and Perception of Attitudes towards LIDL (PATL) fit indices for the total sample and each country’s samples.
Table 10.
Positive Word of Mouth (+WOM) (+WOM), Brand Loyalty (BLYT) (BLo), (Re)purchase Intention (RI) (PI), Affective Commitment (AC) (AC), Active Engagement (AE) (AE), and Perception of Attitudes towards LIDL (PATL) fit indices for the total sample and each country’s samples.
| Fit Indices of Models 1 | |||||||||||
|---|---|---|---|---|---|---|---|---|---|---|---|
| χ2 | df | χ2/df | p | CFI | GFI | AGFI | TLI | RMSEA (90%CI) | PCLOSE | SRMR | |
| Positive Word of Mouth (+WOM) (+WOM) | |||||||||||
| Total | 1.276 | 2 | 0.638 | 0.258 | 1.000 | 1.000 | 0.999 | 1.000 | 0.000 (0.000–0.031) | 0.999 | 0.002 |
| Portugal | 5.788 | 2 | 2.894 | 0.055 | 0.999 | 0.999 | 0.995 | 0.997 | 0.037 (0.000–0.074) | 0.658 | 0.024 |
| Czech Republic | 1.276 | 1 | 1.276 | 0.259 | 1.000 | 1.000 | 0.999 | 1.00 | 0.013 (0.000–0.067) | 0.831 | 0.002 |
| Brand Loyalty (BLYT) (BLo) | |||||||||||
| Total | 2.813 | 2 | 1.406 | 0.245 | 1.000 | 1.000 | 0.999 | 1.000 | 0.011 (0.000–0.039) | 0.993 | 0.001 |
| Portugal | 2.592 | 1 | 2.592 | 0.107 | 1.000 | 1.000 | 0.997 | 0.998 | 0.034 (0.000–0.088) | 0.593 | 0.002 |
| Czech Republic | 0.221 | 1 | 0.221 | 0.638 | 1.000 | 1.000 | 1.000 | 1.000 | 0.000 (0.000–0.049) | 0.952 | 0.001 |
| (Re)purchase Intention (RI) (PI) | |||||||||||
| Total | 2.188 | 1 | 2.188 | 0.139 | 1.000 | 1.000 | 0.999 | 0.999 | 0.020 (0.000–0.056) | 0.904 | 0.002 |
| Portugal | 1.510 | 1 | 1.510 | 0.219 | 1.000 | 1.000 | 0.998 | 0.999 | 0.019 (0.000–0.078) | 0.732 | 0.003 |
| Czech Republic | 0.219 | 1 | 0.219 | 0.640 | 1.000 | 1.000 | 1.000 | 1.001 | 0.000 (0.000–0.049) | 0.952 | 0.001 |
| Affective Commitment (AC) (AC) | |||||||||||
| Total | 5.493 | 1 | 5.493 | 0.019 | 1.000 | 1.000 | 0.998 | 0.998 | 0.038 (0.012–0.072) | 0.670 | 0.003 |
| Portugal | 0.812 | 2 | 0.406 | 0.667 | 1.000 | 1.000 | 1.000 | 1.001 | 0.000 (0.000–0.041) | 0.980 | 0.002 |
| Czech Republic | 0.391 | 1 | 0.391 | 0.532 | 1.000 | 1.000 | 1.000 | 1.000 | 0.000 (0.000–0.054) | 0.931 | 0.001 |
| Active Engagement (AE) (AE) | |||||||||||
| Total | 0.206 | 1 | 0.206 | 0.650 | 1.000 | 1.000 | 1.000 | 1.001 | 0.000 (0.000–0.037) | 0.991 | 0.001 |
| Portugal | 6.457 | 1 | 6.457 | 0.011 | 0.996 | 0.996 | 0.987 | 0.989 | 0.063 (0.024–0.113) | 0.243 | 0.009 |
| Czech Republic | 0.216 | 1 | 0.216 | 0.642 | 1.000 | 1.000 | 1.001 | 1.001 | 0.000 (0.000–0.049) | 0.953 | 0.002 |
| Perception of Attitudes Towards Brand (PATB) LIDL | |||||||||||
| Total | 28.840 | 8 | 7.210 | 0.000 | 0.997 | 0.997 | 0.992 | 0.993 | 0.045 (0.030–0.061) | 0.683 | 0.010 |
| Portugal | 22.269 | 4 | 5.567 | 0.000 | 0.996 | 0.996 | 0.988 | 0.990 | 0.058 (0.036–0.082) | 0.252 | 0.010 |
| Czech Republic | 17.027 | 4 | 4.257 | 0.002 | 0.997 | 0.997 | 0.991 | 0.993 | 0.043 (0.023–0.065) | 0.659 | 0.010 |
Note: 1 Fit indices were adjusted after residuals correlations of 8 items; p < 0.001 for all indicators; χ2 = chi-square; df = degrees of freedom; CFI = comparative fit index; GFI = goodness of fit index; AGFI = adjusted goodness of fit index; TLI = Tuck–Lewis index; RMSEA = root mean square error of approximation; CI = confidence interval; SRMR = standardized root mean square residual.
Table 11.
Measurement invariance tests of Positive Word of Mouth (+WOM), Brand Loyalty (BLYT), (Re)purchase Intention (RI), Affective Commitment (AC), Active Engagement (AE), and Perception of Attitudes Towards Brand (PATB) LIDL across countries.
Table 11.
Measurement invariance tests of Positive Word of Mouth (+WOM), Brand Loyalty (BLYT), (Re)purchase Intention (RI), Affective Commitment (AC), Active Engagement (AE), and Perception of Attitudes Towards Brand (PATB) LIDL across countries.
| χ2 | df | χ2/df | p | CFI | RMSEA (90%CI) | ΔCFI | ΔRMSEA | |
|---|---|---|---|---|---|---|---|---|
| Positive Word of Mouth (+WOM) | ||||||||
| Configural invariance | 1.276 | 2 | 0.638 | 0.528 | 1.000 | 0.000 (0.000–0.031) | ||
| Metric invariance | 56.459 | 6 | 9.610 | 0.000 | 0.995 | 0.052 (0.040–0.065) | 0.005 | 0.052 |
| Scalar invariance | 907.474 | 10 | 90.747 | 0.000 | 0.906 | 0.170 (0.160–0.180) | 0.089 | 0.128 |
| Brand Loyalty (BLYT) | ||||||||
| Configural invariance | 2.813 | 2 | 1.406 | 0.245 | 1.000 | 0.011 (0.000–0.039) | ||
| Metric invariance | 11.032 | 5 | 2.206 | 0.051 | 1.000 | 0.020 (0.000–0.030) | 0.000 | 0.009 |
| Scalar invariance | 144.720 | 9 | 16.080 | 0.000 | 0.990 | 0.070 (0.060–0.080) | 0.010 | 0.050 |
| (Re)purchase Intention (RI) | ||||||||
| Configural invariance | 0.439 | 2 | 0.219 | 0.803 | 1.000 | 0.000 (0.000–0.021) | ||
| Metric invariance | 0.439 | 5 | 0.088 | 0.944 | 1.000 | 0.000 (0.000–0.000) | 0.000 | 0.000 |
| Scalar invariance | 0.439 | 9 | 0.049 | 1.000 | 1.000 | 0.000 (0.000–0.000) | 0.000 | 0.000 |
| Affective Commitment (AC) | ||||||||
| Configural invariance | 0.361 | 2 | 0.198 | 0.820 | 1.000 | 0.000 (0.000–0.021) | ||
| Metric invariance | 16.523 | 4 | 4.131 | 0.002 | 0.999 | 0.032 (0.017–0.048) | 0.001 | 0.032 |
| Scalar invariance | 409.138 | 8 | 51.142 | 0.000 | 0.971 | 0.127 (0.117–0.138) | 0.028 | 0.095 |
| Active Engagement (AE) | ||||||||
| Configural invariance | 6.674 | 2 | 3.337 | 0.036 | 0.998 | 0.027 (0.006–0.052) | ||
| Metric invariance | 61.543 | 4 | 15.386 | 0.000 | 0.981 | 0.068 (0.054–0.084) | 0.017 | 0.041 |
| Scalar invariance | 150.932 | 6 | 25.155 | 0.000 | 0.953 | 0.088 (0.076–0.101) | 0.028 | 0.020 |
| Perception of Attitudes Towards Brand (PATB) LIDL | ||||||||
| Configural invariance | 39.297 | 8 | 4.912 | 0.000 | 0.997 | 0.036 (0.025–0.047) | ||
| Metric invariance | 50.606 | 12 | 4.207 | 0.000 | 0.996 | 0.032 (0.023–0.042) | 0.001 | 0.004 |
| Scalar invariance | 300.950 | 17 | 17.703 | 0.000 | 0.970 | 0.073 (0.066–0.081) | 0.026 | 0.041 |
Note: p < 0.001 for all indicators; χ2 = chi-square; df = degrees of freedom; CFI = comparative fit index; RMSEA = root mean square error of approximation; CI = confidence interval; ΔCFI = adjusted comparative fit index; ΔRMSEA = adjusted root mean square error of approximation.
Table 12.
Correlations between variables.
| 1 | 2 | 3 | 4 | 5 | 6 | 7 | 8 | 9 | 10 | 11 | 12 | 13 | |
|---|---|---|---|---|---|---|---|---|---|---|---|---|---|
| 1 BE Total | 1 | ||||||||||||
| 2 BE Brand Name Influence | 0.833 ** | 1 | |||||||||||
| 3 BE Customer Billing Order | 0.742 ** | 0.520 ** | 1 | ||||||||||
| 4 BE Mass Media Impression | 0.822 ** | 0.704 ** | 0.510 ** | 1 | |||||||||
| 5 BE Point-of-sales Assistance | 0.782 ** | 0.530 ** | 0.472 ** | 0.498 ** | 1 | ||||||||
| 6 BE Recommendation Salesperson | 0.809 ** | 0.551 ** | 0.538 ** | 0.565 ** | 0.570 ** | 1 | |||||||
| 7 BL Total | 0.771 ** | 0.749 ** | 0.495 ** | 0.678 ** | 0.563 ** | 0.579 ** | 1 | ||||||
| 8 +WOM Total | 0.720 ** | 0.683 ** | 0.471 ** | 0.658 ** | 0.488 ** | 0.567 ** | 0.773 ** | 1 | |||||
| 9 BLYTTotal | 0.632 ** | 0.609 ** | 0.404 ** | 0.568 ** | 0.454 ** | 0.477 ** | 0.737 ** | 0.749 ** | 1 | ||||
| 10 RI Total | 0.635 ** | 0.590 ** | 0.449 ** | 0.530 ** | 0.461 ** | 0.498 ** | 0.718 ** | 0.724 ** | 0.844 ** | 1 | |||
| 11 AC Total | 0.683 ** | 0.641 ** | 0.406 ** | 0.639 ** | 0.486 ** | 0.539 ** | 0.744 ** | 0.699 ** | 0.748 ** | 0.678 ** | 1 | ||
| 12 AE Total | 0.559 ** | 0.525 ** | 0.371 ** | 0.567 ** | 0.345 ** | 0.420 ** | 0.569 ** | 0.637 ** | 0.584 ** | 0.555 ** | 0.612 ** | 1 | |
| 13 PATB LIDL Total | 0.686 ** | 0.581 ** | 0.522 ** | 0.524 ** | 0.524 ** | 0.587 ** | 0.661 ** | 0.646 ** | 0.555 ** | 0.642 ** | 0.499 ** | 0.429 ** | 1 |
Note: ** p < 0.001.
Table 13.
Variables that contribute to Positive Word of Mouth (+WOM).
| Model 1 | Model 2 | |||||
|---|---|---|---|---|---|---|
| B | EP B | β | B | EP B | β | |
| +WOM | ||||||
| Gender | 0.591 | 0.051 | 0.200 | 0.164 | 0.030 | 0.056 |
| Age | 0.011 | 0.002 | 0.115 | 0.004 | 0.001 | 0.046 |
| Income | −0.132 | 0.033 | −0.070 | −0.062 | 0.019 | −0.033 |
| Brand Loyalty (BLYT) Total | 0.250 | 0.018 | 0.283 | |||
| (Re)purchase Intention (RI) Total | 0.090 | 0.021 | 0.088 | |||
| Affective Commitment (AC)Total | 0.147 | 0.013 | 0.174 | |||
| Active Engagement (AE) Total | 0.378 | 0.027 | 0.187 | |||
| Perception Attitudes Towards Brand (PATB) LIDL Total | 0.371 | 0.019 | 0.254 | |||
| R2 (R2 Adj.) | 0.060 (0.059) | 0.700 (0.699) | ||||
| F for change in R2 | 65.659 ** | 1319.288 ** | ||||
Note: R2 = R squared; R2 Adj. = R squared adjusted; B = unstandardized regression coefficients; EP B = unstandardized error of B; β = standardized regression coefficients; ** p < 0.001.
Disclaimer/Publisher’s Note: The statements, opinions and data contained in all publications are solely those of the individual author(s) and contributor(s) and not of MDPI and/or the editor(s). MDPI and/or the editor(s) disclaim responsibility for any injury to people or property resulting from any ideas, methods, instructions or products referred to in the content. |
© 2024 by the authors. Licensee MDPI, Basel, Switzerland. This article is an open access article distributed under the terms and conditions of the Creative Commons Attribution (CC BY) license (https://creativecommons.org/licenses/by/4.0/).
Share and Cite
MDPI and ACS Style
Leite, Â.; Rodrigues, A.; Lopes, S. Customer Connections: A Cross-Cultural Investigation of Brand Experience and Brand Love in the Retail Landscape. Adm. Sci. 2024, 14, 11. https://doi.org/10.3390/admsci14010011
AMA Style
Leite Â, Rodrigues A, Lopes S. Customer Connections: A Cross-Cultural Investigation of Brand Experience and Brand Love in the Retail Landscape. Administrative Sciences. 2024; 14(1):11. https://doi.org/10.3390/admsci14010011
Chicago/Turabian StyleLeite, Ângela, Anabela Rodrigues, and Sílvia Lopes. 2024. "Customer Connections: A Cross-Cultural Investigation of Brand Experience and Brand Love in the Retail Landscape" Administrative Sciences 14, no. 1: 11. https://doi.org/10.3390/admsci14010011
Note that from the first issue of 2016, this journal uses article numbers instead of page numbers. See further details here.