
A Microchannel Device for Droplet Classification by Manipulation Using Piezoelectric Vibrator

Graduate School of Natural Science and Technology, Okayama University, 3-1-1, Tsushima-naka, Kita-ku, Okayama 700-8530, Japan
*
Author to whom correspondence should be addressed.
Actuators 2024, 13(3), 95; https://doi.org/10.3390/act13030095
Submission received: 15 January 2024
/
Revised: 17 February 2024
/
Accepted: 22 February 2024
/
Published: 28 February 2024
(This article belongs to the Special Issue Piezoelectric Actuators and Transducers: Materials, Design, Control and Applications—2nd Edition)
Abstract
:Emulsion formulations should be monodispersed in terms of their stability. Therefore, there is a need for a device that can classify droplets of the desired size from polydispersed emulsions in a fluidized bed manufacturing system. In the previous study, we evaluated the fabrication of a droplet manipulation device using acoustic radiation forces through simulation using the finite element method. In this study, particle manipulation experiments using 1, 6, and 10 µm polystyrene particles were first estimated and evaluated in comparison with their theoretical particle behavior. Based on the results we obtained, the driving conditions and droplet behavior were derived, and the droplet manipulation device using ultrasonic waves to shrink monodisperse emulsions was evaluated. As a result, the droplet classification effect in the microchannel was confirmed to be consistent with the droplet behavior prediction, and the microchannel structure with a constriction component improved its classification effect.
1. Introduction
Emulsions have been reported for applications in pharmaceuticals, foods, cosmetics, and chemicals [1,2,3,4,5,6,7,8,9,10,11,12,13,14]. Among the emulsion generation techniques available, mechanical methods, microfluidic methods, and ultrasonic methods have been described. Among these, the emulsion generation technology that combines microfluidic channels and ultrasonic vibration is considered to have advantages in that it does not generate noise, is easy to assemble and clean due to its simple structure, and can be adapted to continuous flow systems to ensure sterility. However, the emulsions used in these fields require monodispersed emulsion droplet sizes to maintain their high concentration and functional stability [15,16]. In the emulsion generation described above, the problem is that the droplet diameter of the emulsion generated is an unstable, resulting in a loss of uniformity, although this can be solved by increasing the amount of dispersed phase to generate highly concentrated emulsions. These classification techniques include vortex trapping using microfluidic channels, classification using centrifugal forces, sorting by droplet size using filtration, and classification using magnetic or electric fields [17,18,19,20,21,22,23,24]. However, fluid flow-based classification techniques that do not use external forces generally have their limitations of large volume and poor time efficiency, while classification techniques that use external forces, such as magnetophoresis, require labeling, such as making the droplets magnetic. To solve these problems, a method for classifying and concentrating microparticles using ultrasonic vibration has been proposed [25]. It is known that when ultrasonic vibration is applied to a closed channel, standing waves are generated, and the force caused by these waves acts on the particles in the channel. This acoustic force is not limited by transparency, refractive index, electromagnetic properties, etc., so there is no need for labeling of particles, and the device is simple and can be easily miniaturized. However, in the reported method, the transducer that generates ultrasonic vibrations and the microfluidic channel are integrated, and the device cannot be disassembled, making it difficult to clean the inside of the channel. Therefore, impurities and drugs are likely to remain in the channel, making it unsuitable for applications in the fields of drug formulation and chemistry. Therefore, a classification technique in which the transducer that generates ultrasonic vibrations and the microchannel are independent of each other has been reported [26]. The use of acoustic radiation forces enables the manipulation of particles at will, and the manipulation of micro-sized particles was also reported. Prior to this report, an effective classification and concentration method was proposed using ultrasonic vibration to manipulate droplets in emulsions [27,28,29]. In addition, in this study, particle manipulation experiments were conducted using polystyrene particles to evaluate the range of particle sizes that can be manipulated. In addition, in order to realize a monodispersed emulsion generation system, we simulated manipulable droplet diameters in microemulsions, fabricated microchannels capable of droplet classification, and evaluated the results.
2. Overview of Droplet Manipulation
2.1. Principle of Droplet Manipulation
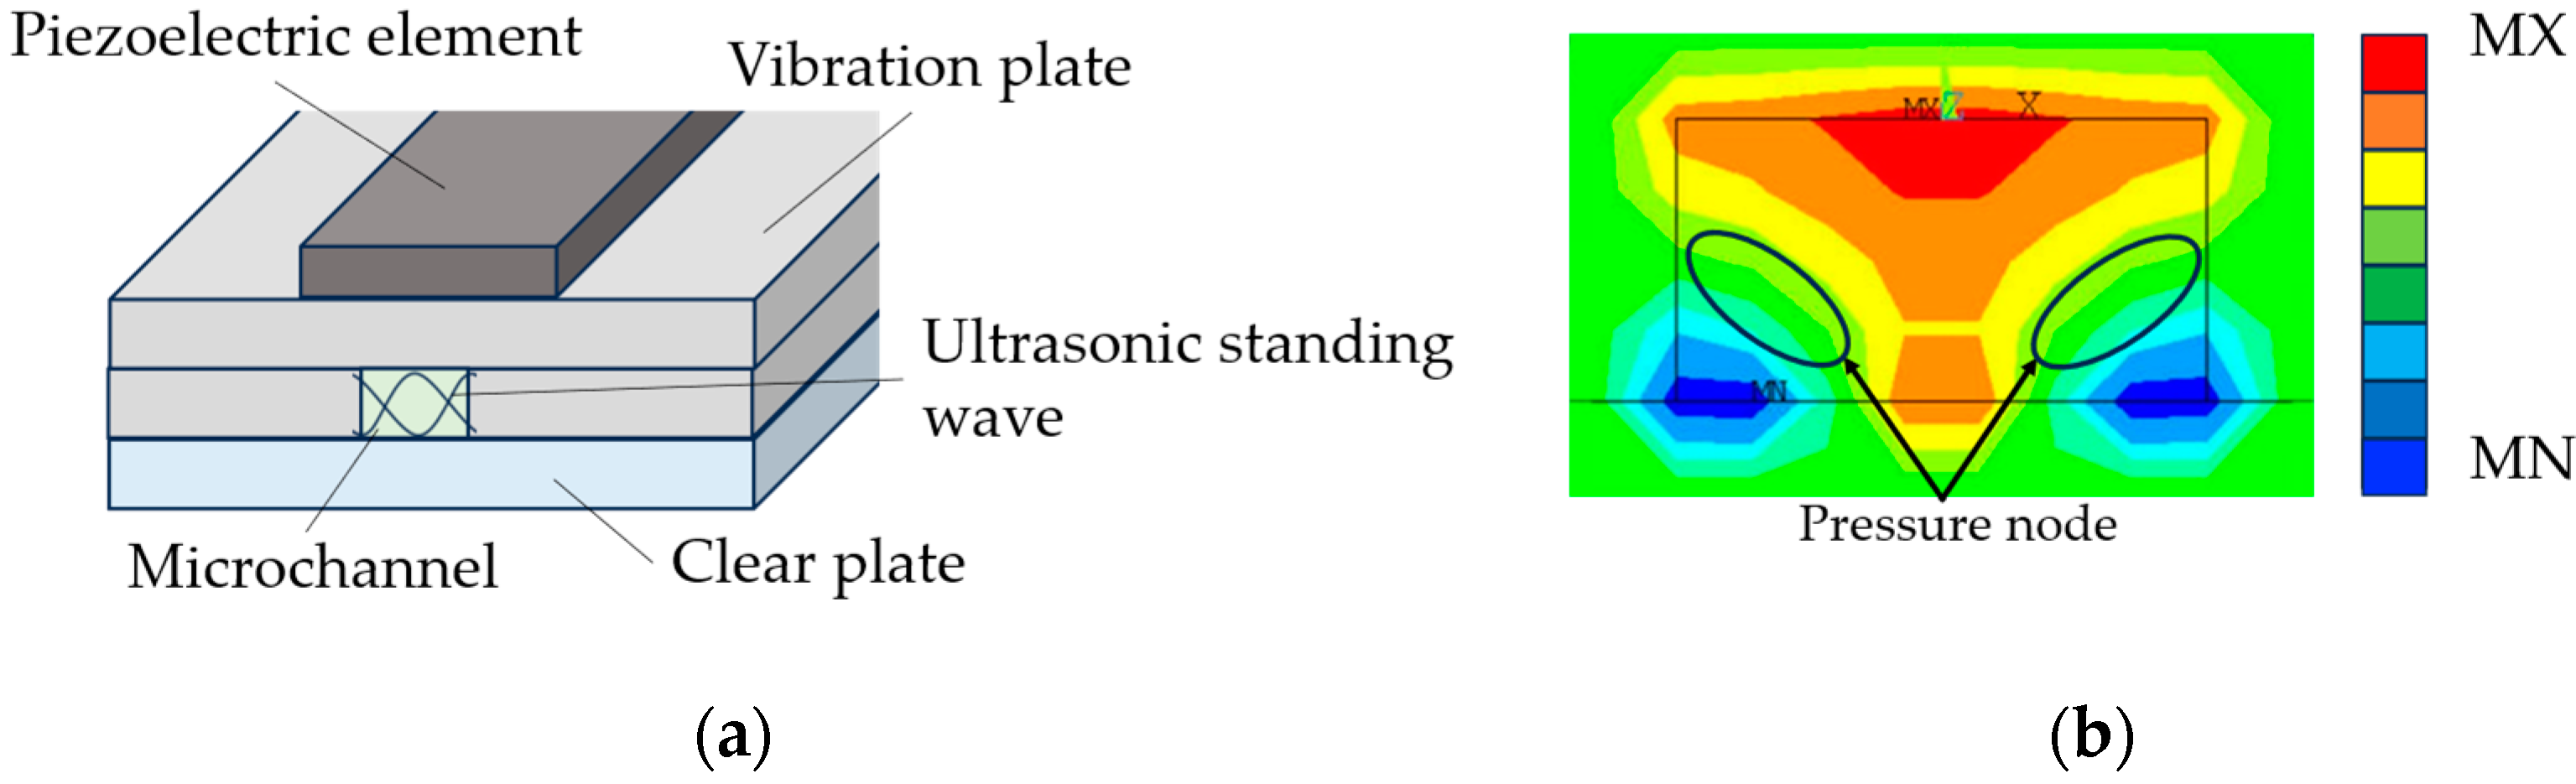
Figure 1a displays the straightforward configuration of the device. Within the microchannel, a standing wave acoustic field is generated, resulting in the formation of pressure nodes. Figure 1b illustrates the results of the finite element method analysis, depicting the pressure distribution across the cross-section of the flow channel within the droplet manipulation device used in this study. This figure specifically zooms in on the cross-sectional view of the channel, as analyzed by the two-dimensional model; the red areas in the diagram show the positive maximum pressure, and the blue areas show the negative maximum pressure. Droplets accumulate at the nodes highlighted in green in this figure, driven by the acoustic radiation force [27,28,29]. The magnitude of the acoustic radiation force acting on each droplet is contingent on its size. Consequently, larger droplets cover longer distances, while smaller ones tend to remain relatively stationary. This disparity facilitates the manipulation and separation of the droplets based on their sizes.
2.2. Relationship between Sound Pressure and Droplet Diameter Required for Droplet Manipulation
The behavior of a droplet in a closed space can be analyzed using from the combined horizontal forces, the acoustic radiation force, and the viscous force; to determine the amount of displacement and the velocity of movement [30]. When the pressure is ; the volume of the particle is ; the wavenumber is ; the distance from the pressure node is ; the sound velocity in the continuous phase is ; the sound velocity in the dispersed phase is ; the density in the continuous phase is ; and the density in the dispersed phase is ; the acoustic radiation force can be obtained using Equations (1) and (2) as follows:
σ is the ratio of the sound velocities of the continuous and dispersed phases, expressed in Equation (3), and δ is the ratio of the densities of the continuous and dispersed phases, expressed in Equation (4) as follows:
Furthermore, Equation (1) can be rewritten as Equation (6) using ε in Equation (5) as follows:
The viscous force, , acting on the particles is expressed in Equation (7) as follows:
From Equations (1)–(6) for the acoustic radiation force, , and Equation (7) for the viscous force, , the sound pressure values required to manipulate the droplet, which encompasses each droplet’s diameter, can be calculated. The relationship between the sound pressure value required to focus the polystyrene particles and the radius of the particles is shown in Figure 2, and the parameters and physical properties used in the estimation are shown in Table 1. This indicates that particles that encompass a diameter larger than 10 µm can be manipulated by applying a pressure higher than 99.8 kPa in the channel.
2.3. Polystyrene Particle Manipulation Experiment
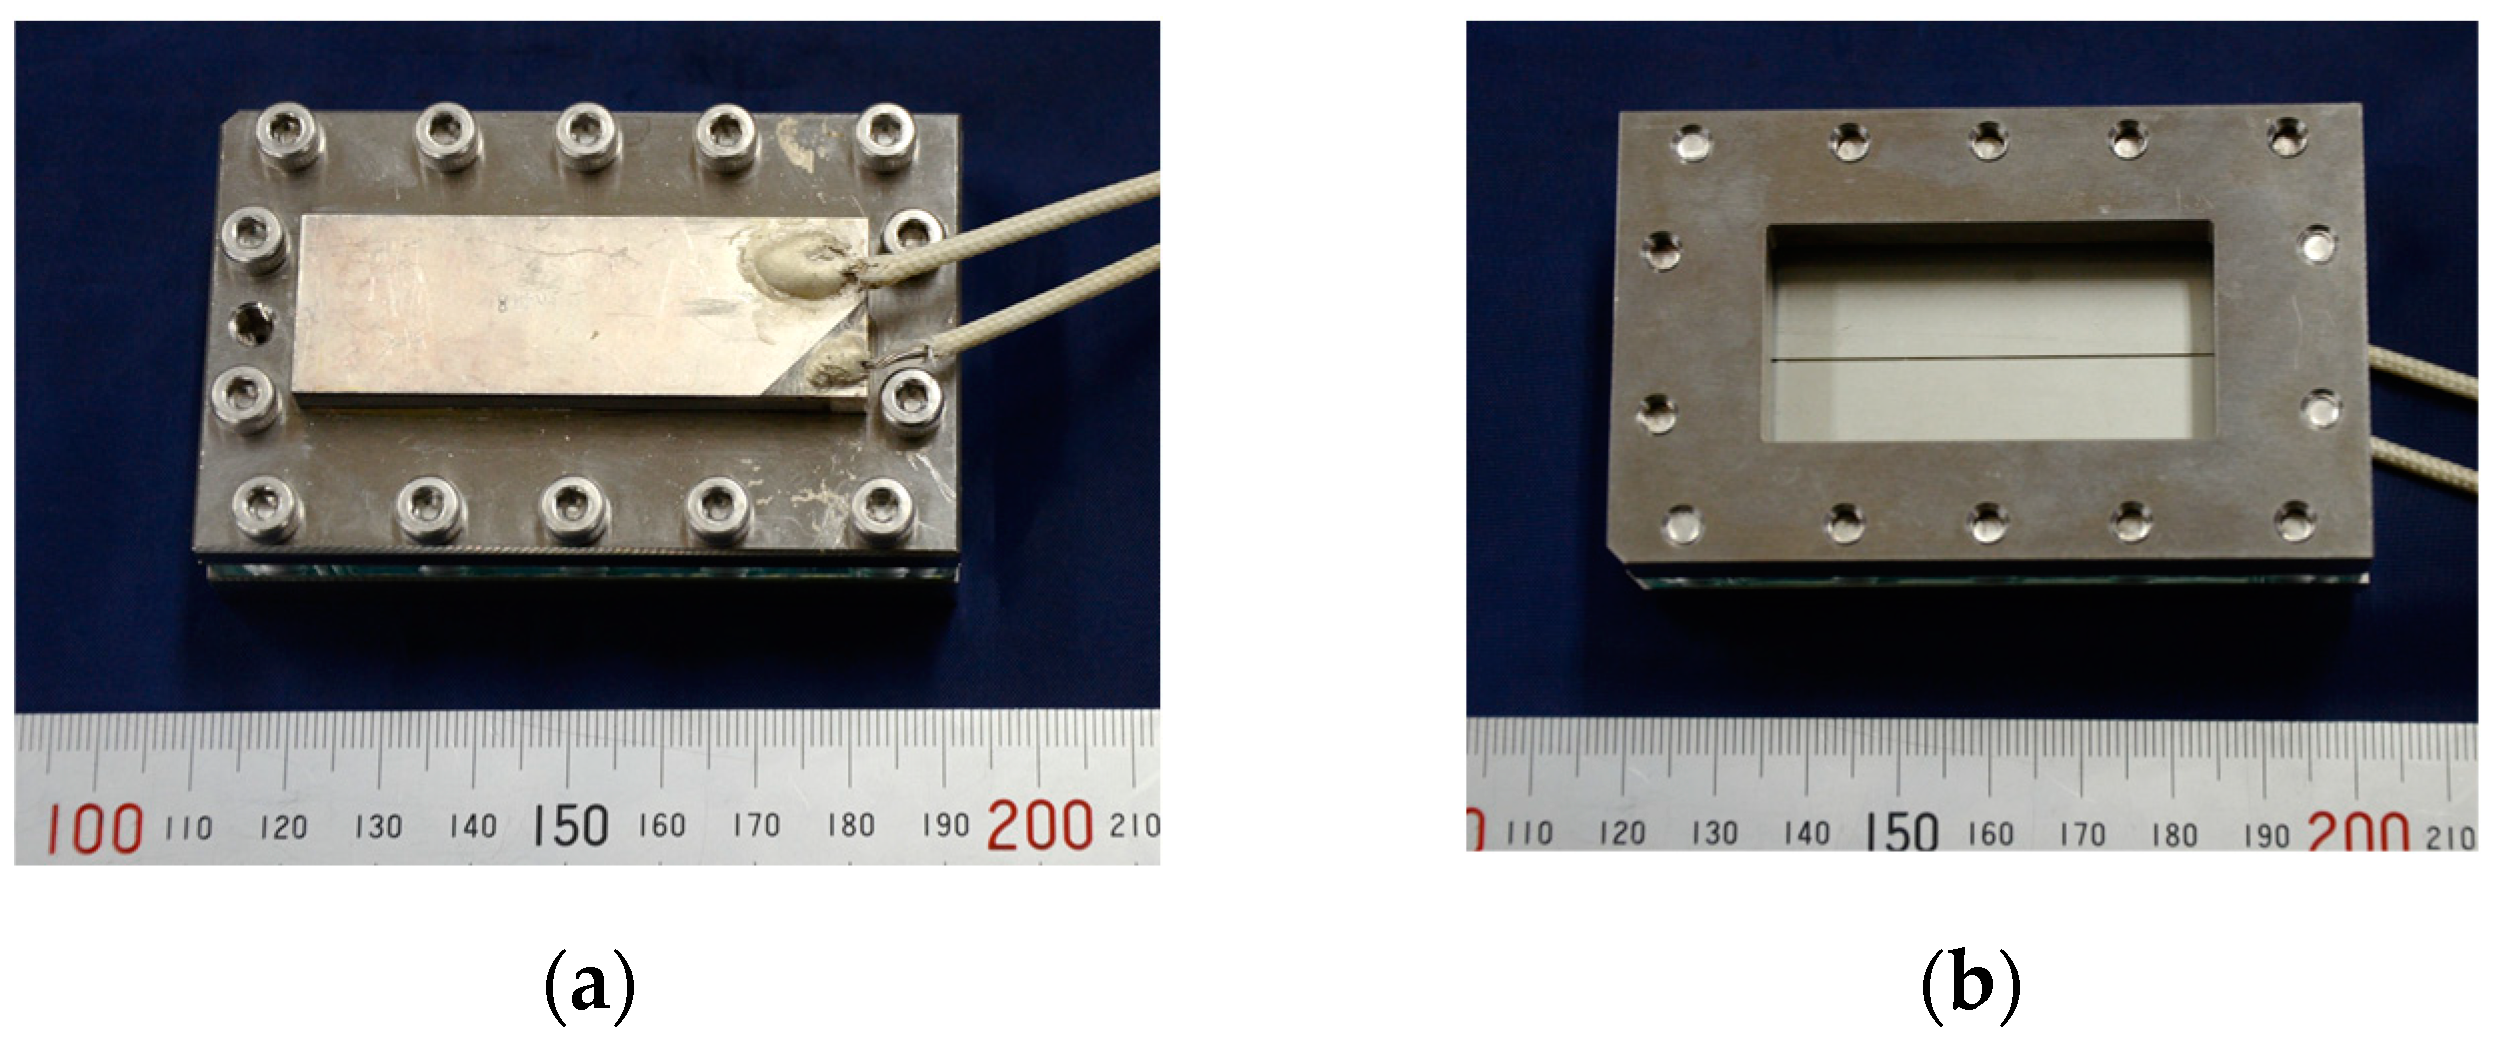
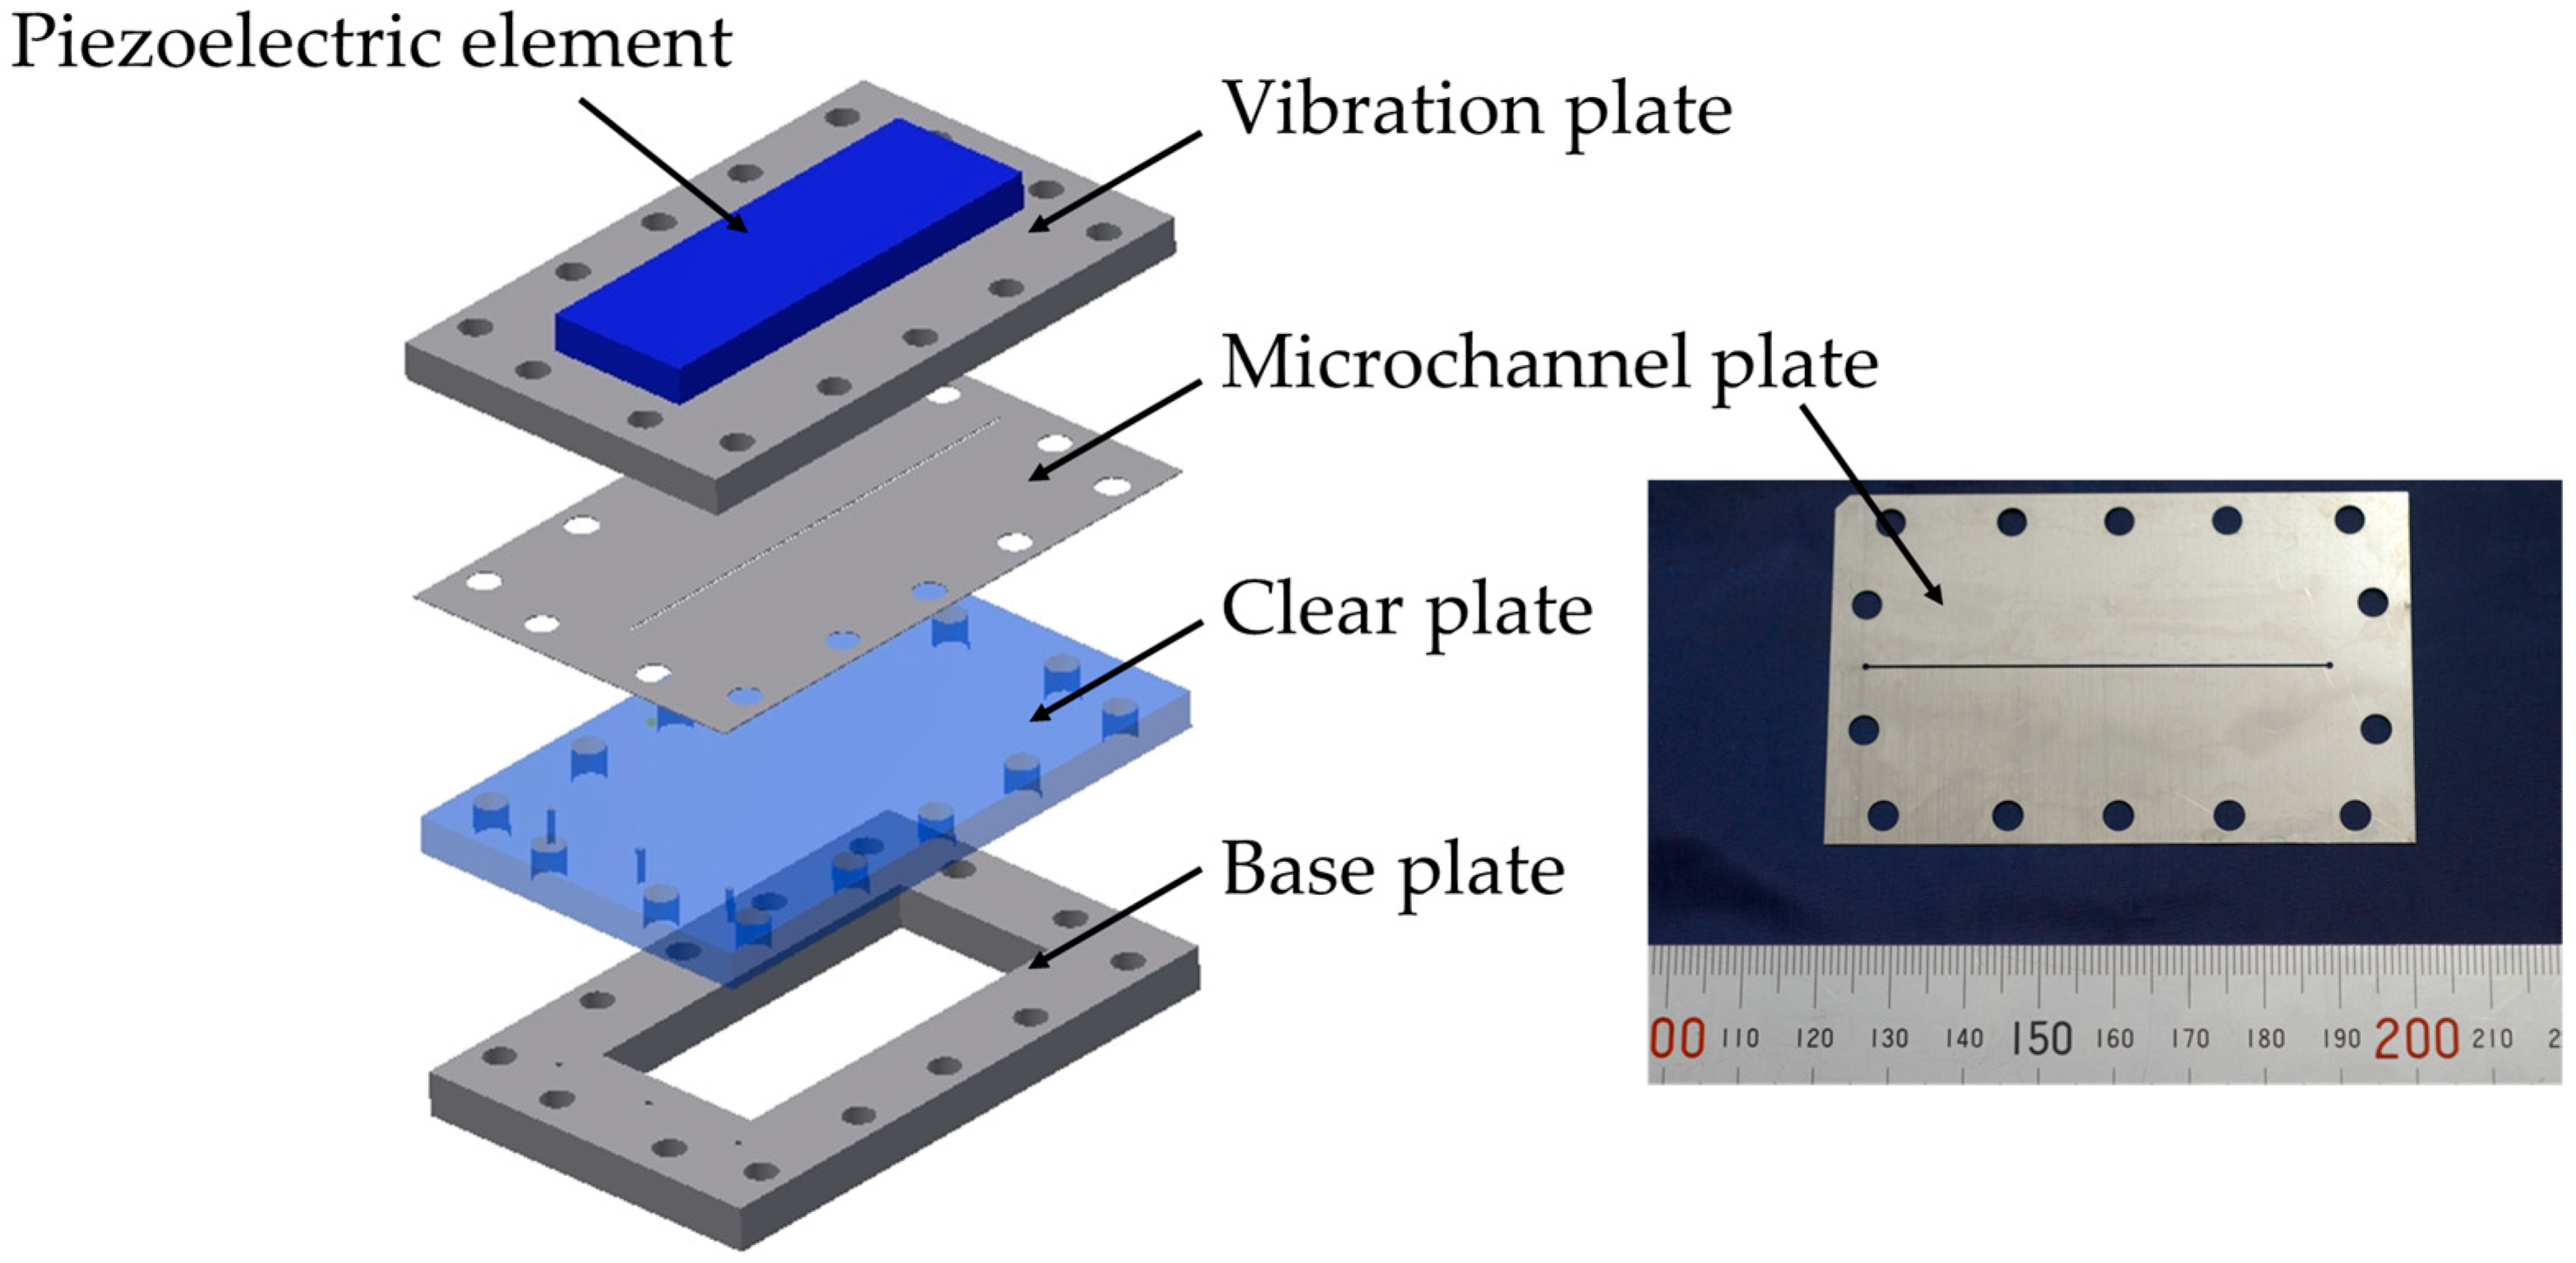
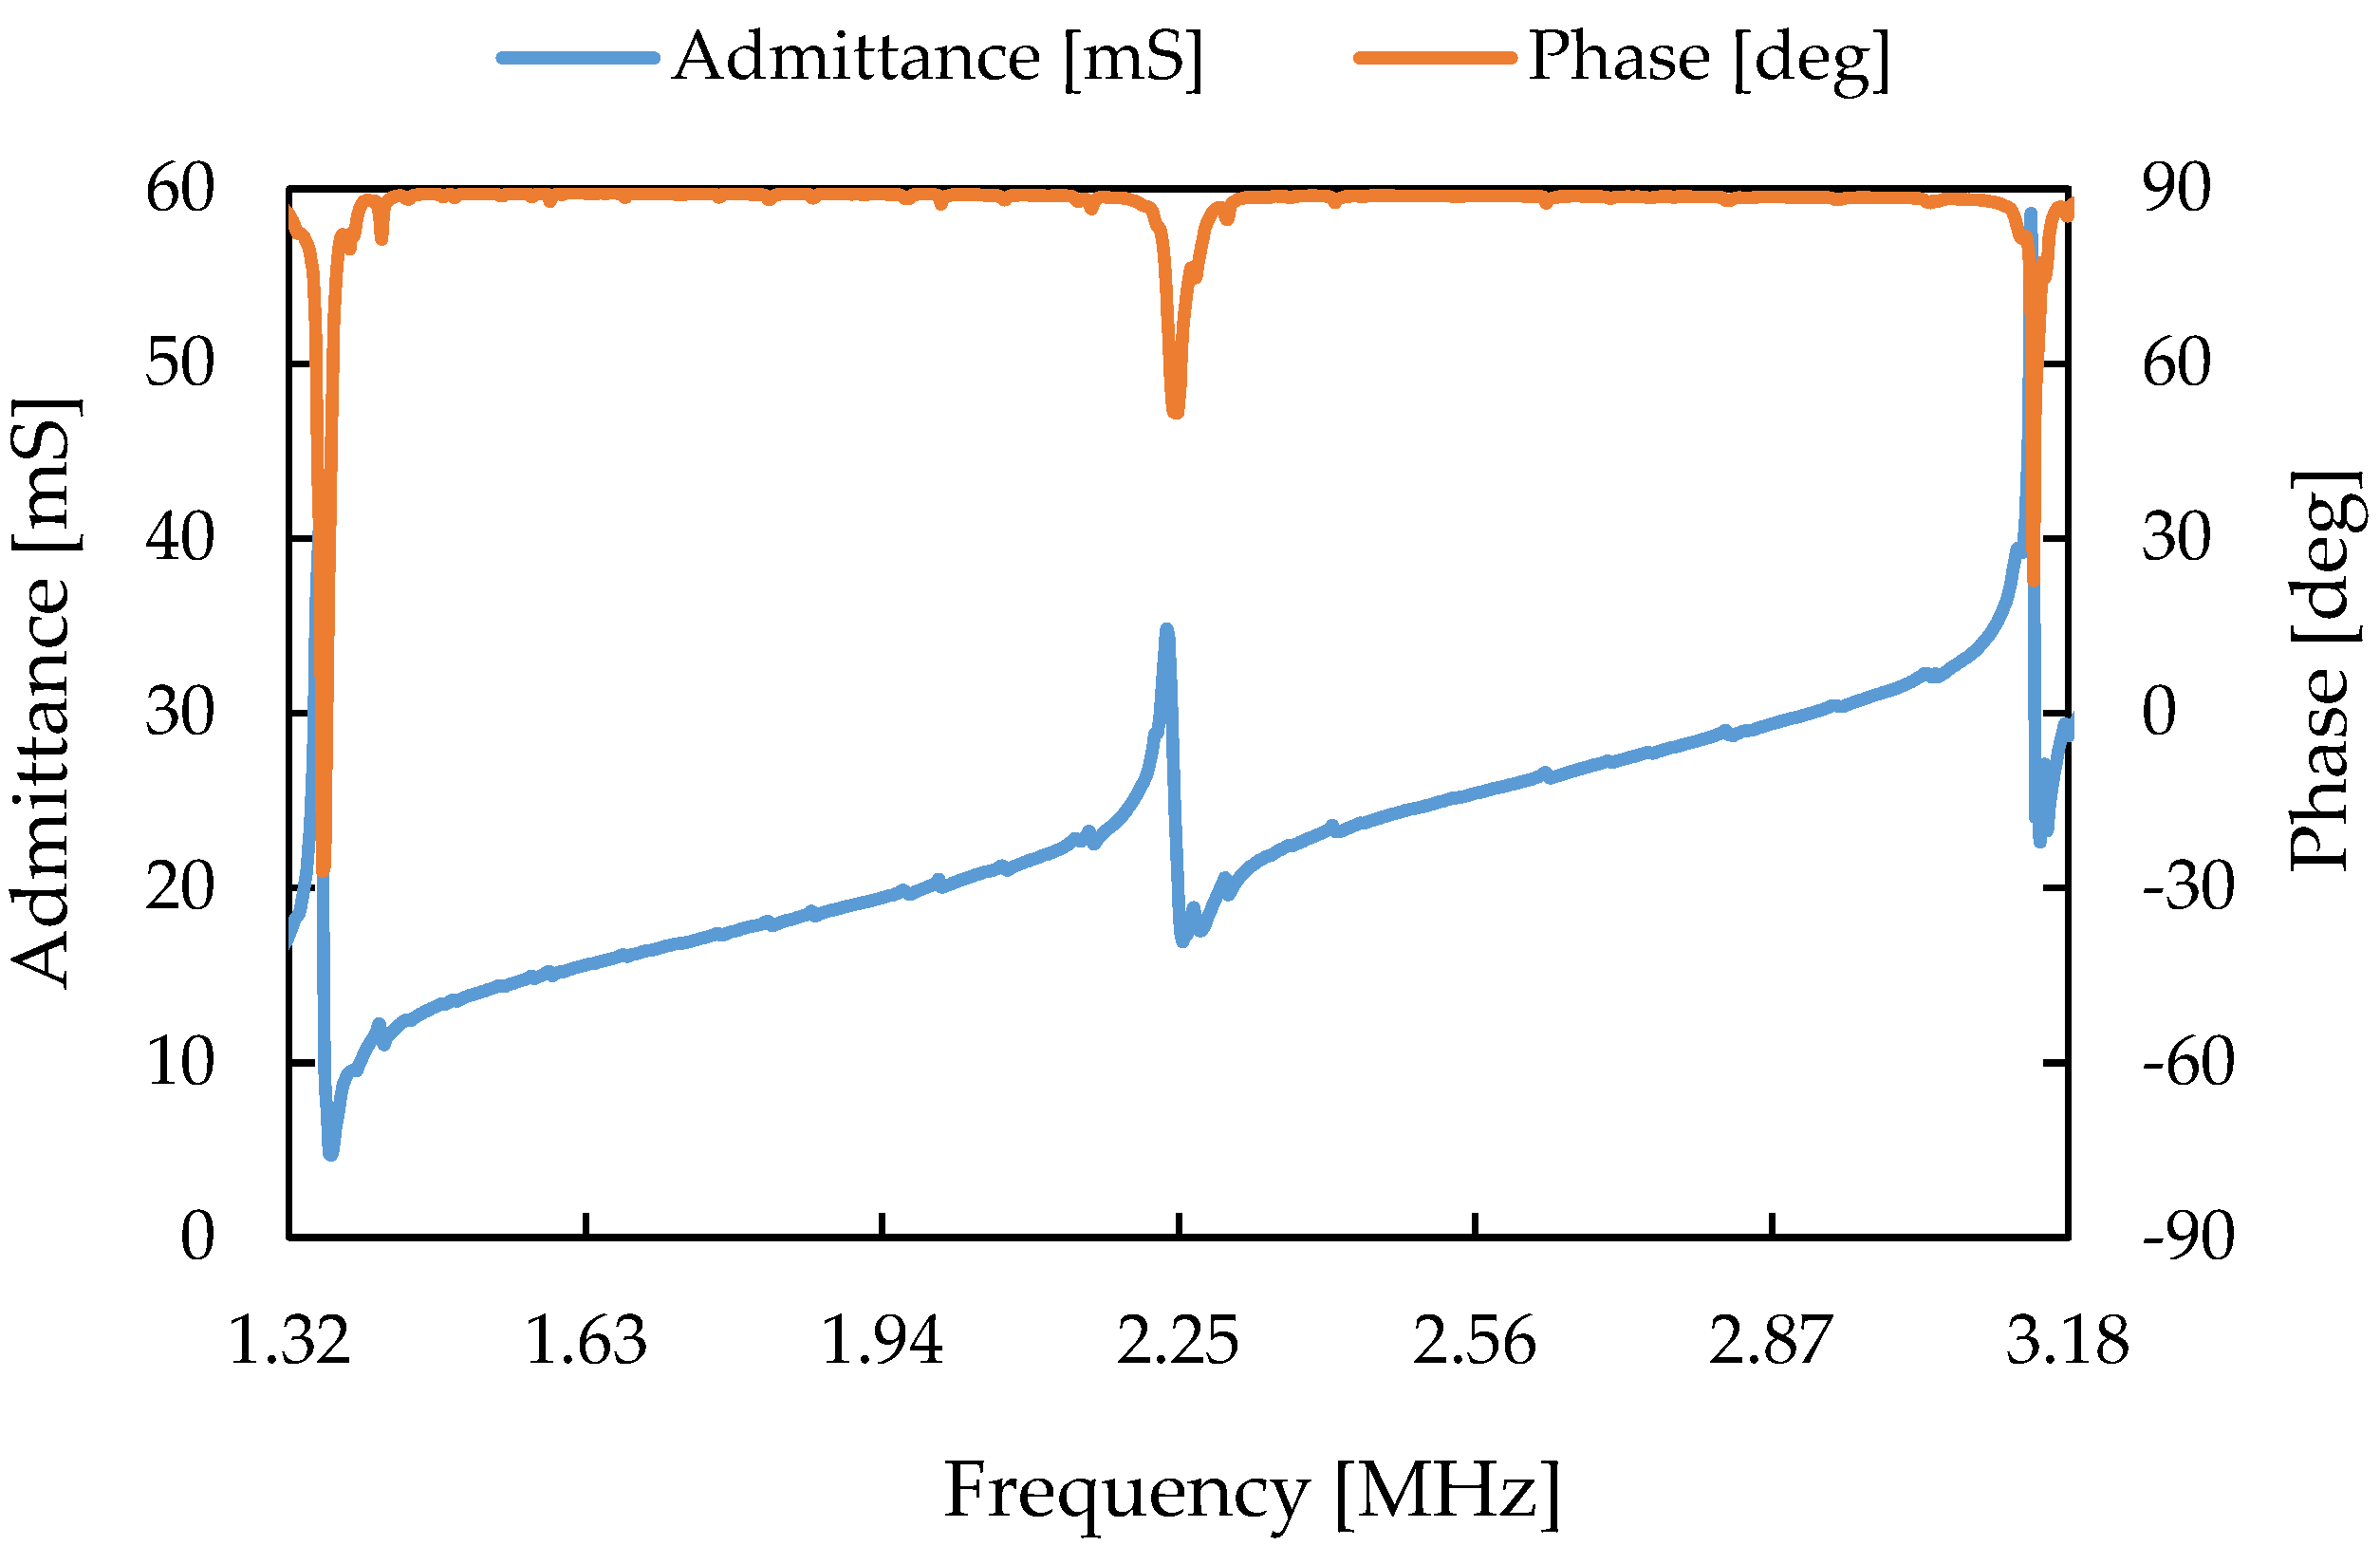
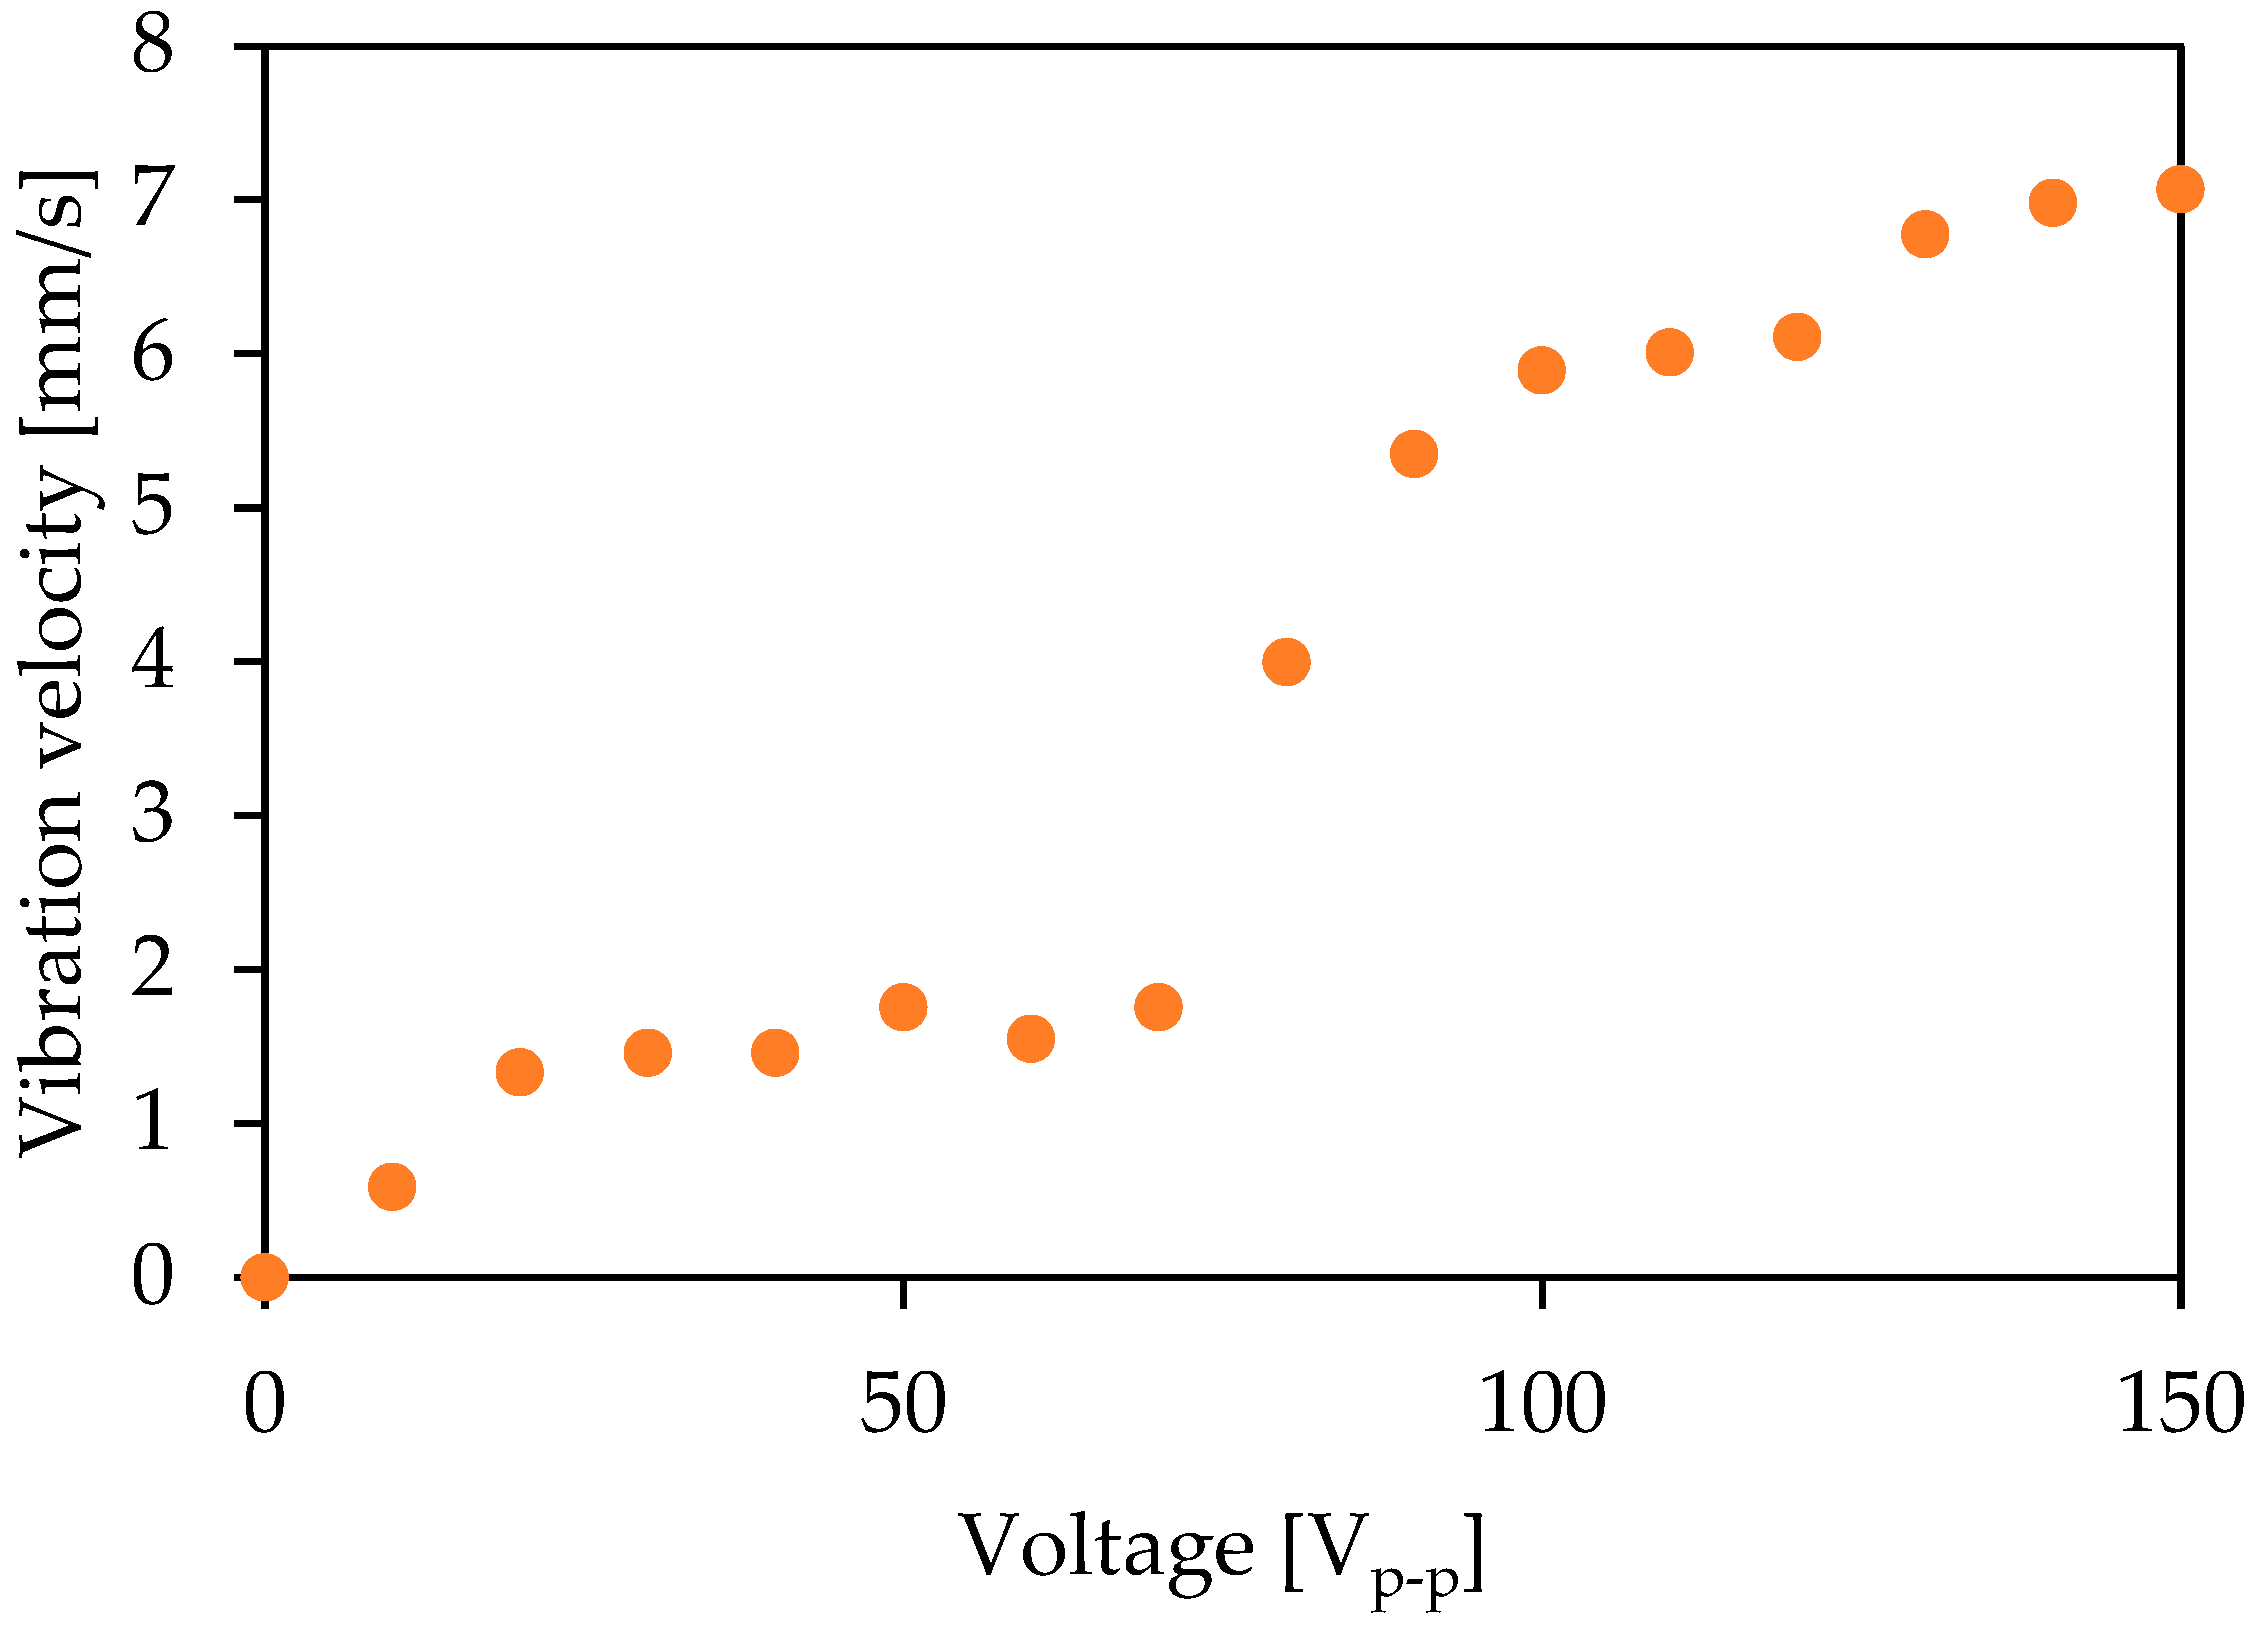
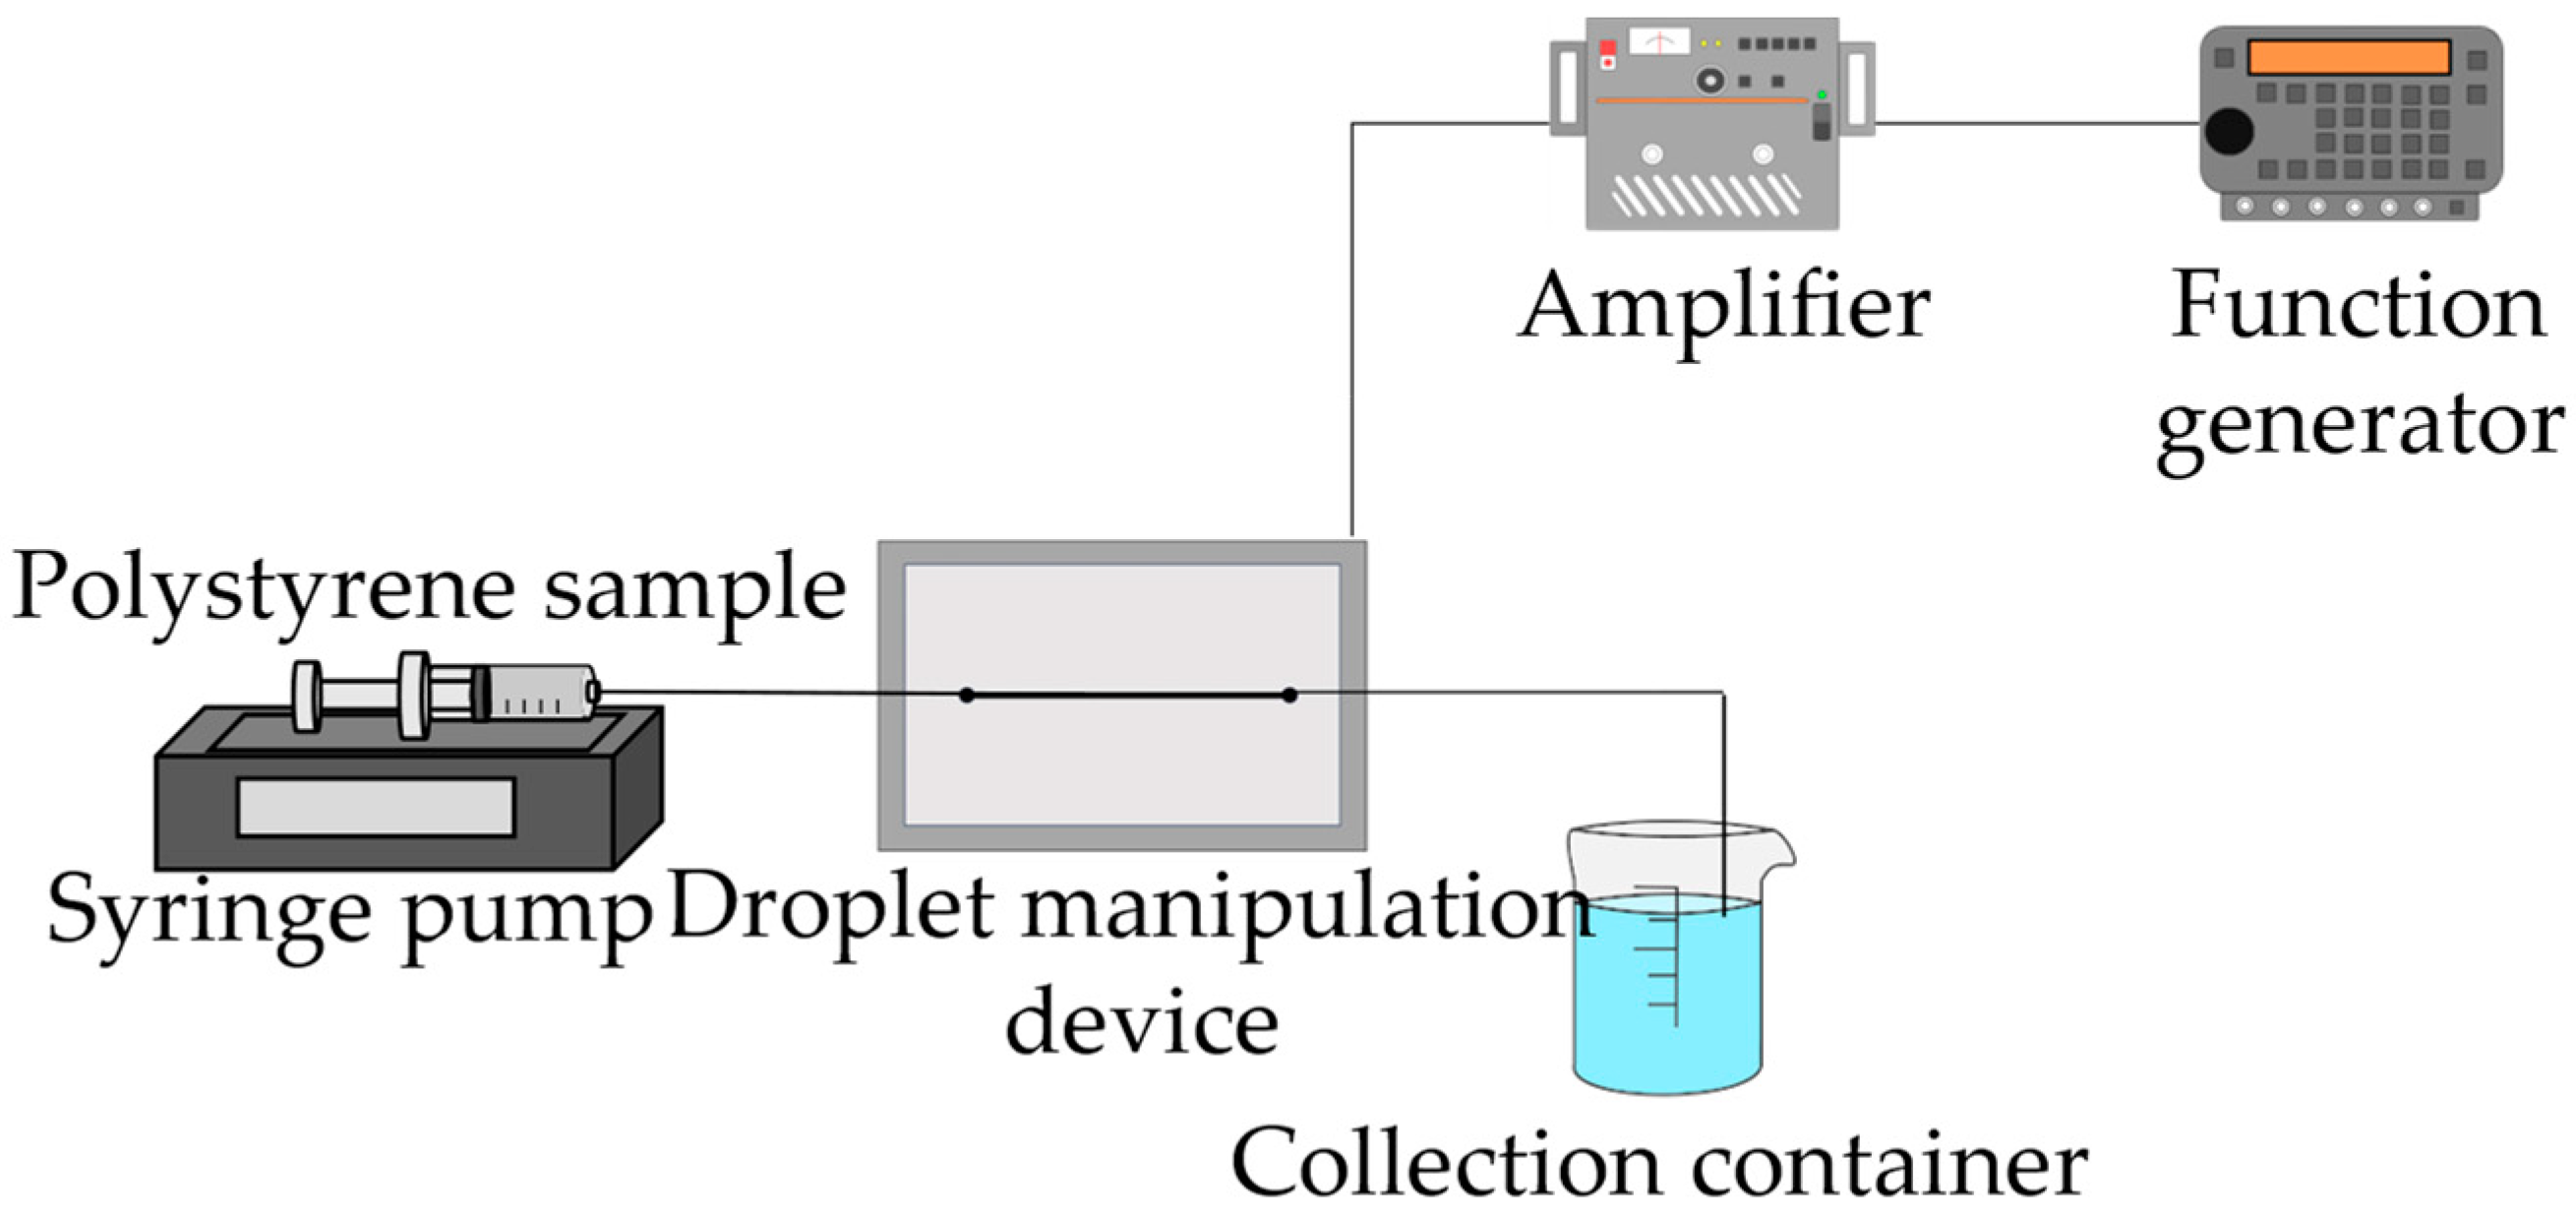
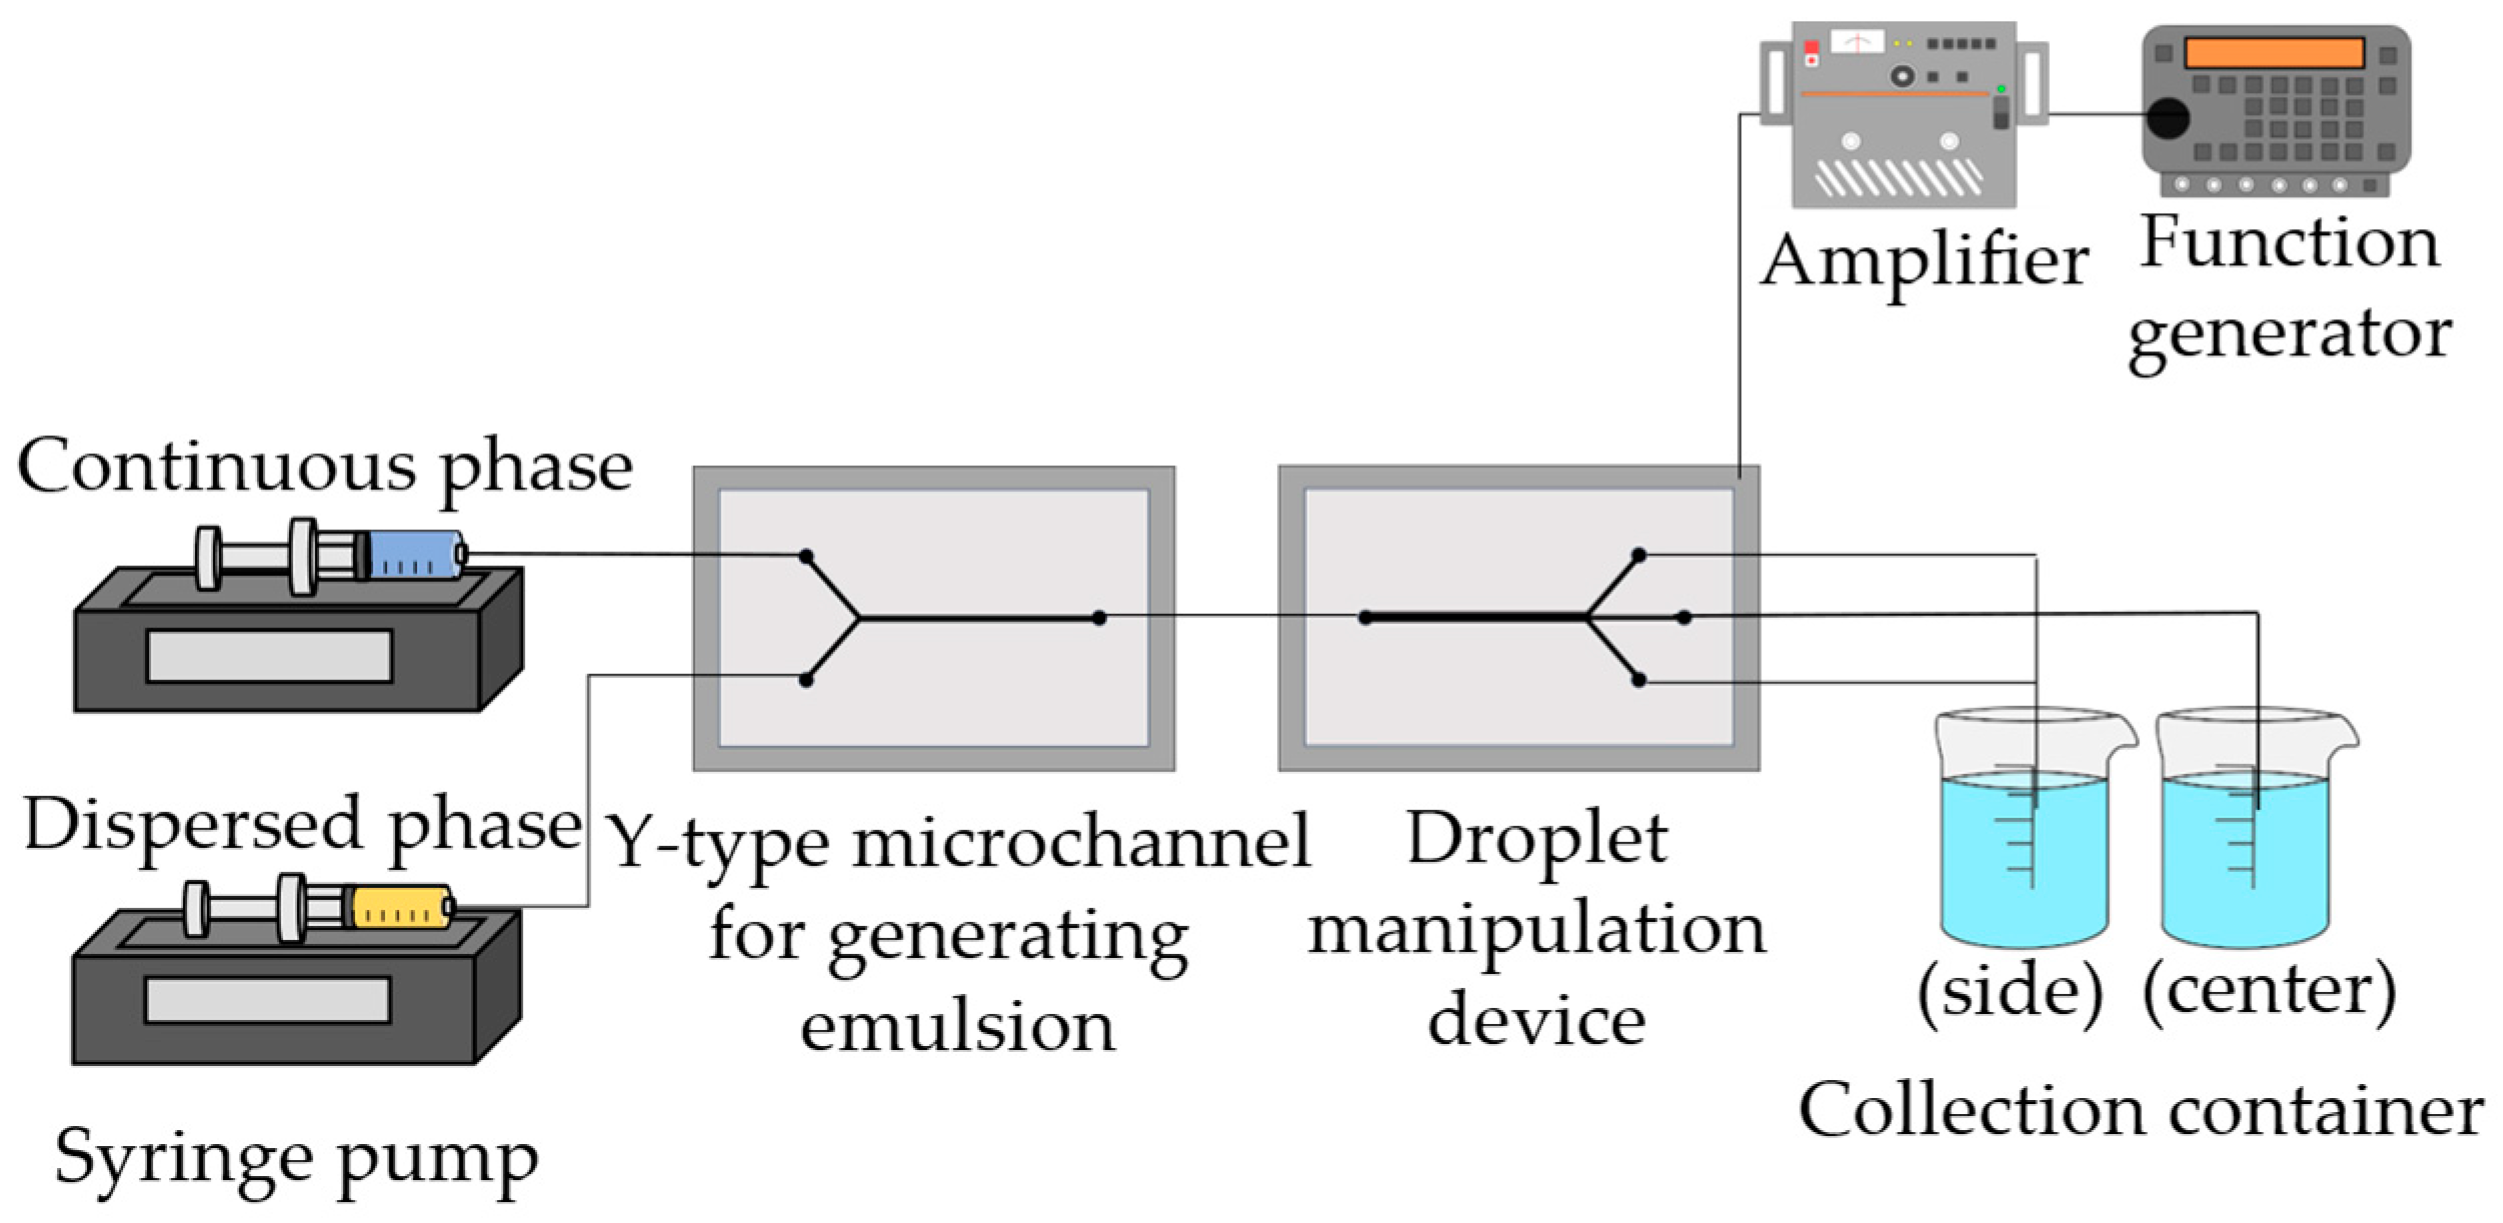
As detailed in this section, the pressure on the channel is calculated from the experimental data using polystyrene particles of uniform diameter. Based on these results, the behavior of emulsion droplets was predicted. In this experiment, a solution of polystyrene particles suspended in 95% ethanol was used. Figure 3 also shows a photograph of the ultrasonic vibration device used in these experiments. This device has dimensions of mm and, as shown in Figure 4, is assembled by bolting together four plates: a vibration plate with a piezoelectric PZT attached, a microfluidic plate with a 400 µm wide and 200 µm thick microchannel, a transparent plate, and a base plate. Figure 5 shows the results of the admittance measurements performed to identify the resonance frequency of the device. Measurements of 1.32 to 3.18 MHz were retrieved, and resonance points were identified near 1.35 MHz, 2.24 MHz, and 3.14 MHz. Therefore, the experiments described below are based on the pressure distribution calculated from the frequency response analysis of the finite element method in the vicinity of these resonance frequencies and predicted frequencies. Figure 6 shows the vibration velocity measured when this device was driven at 1.35 MHz, which is predicted to represent the resonance frequency of this device. The measurement point of the vibration velocity is the center of the glass plate on the backside of the device, as shown in Figure 3b. When the device was driven at 100 , a value of 6.9 mm/s was obtained. We conducted our manipulation experiments using polystyrene particles to calculate the sound pressure applied to the channels in the device. The experimental setup is shown in Figure 7.
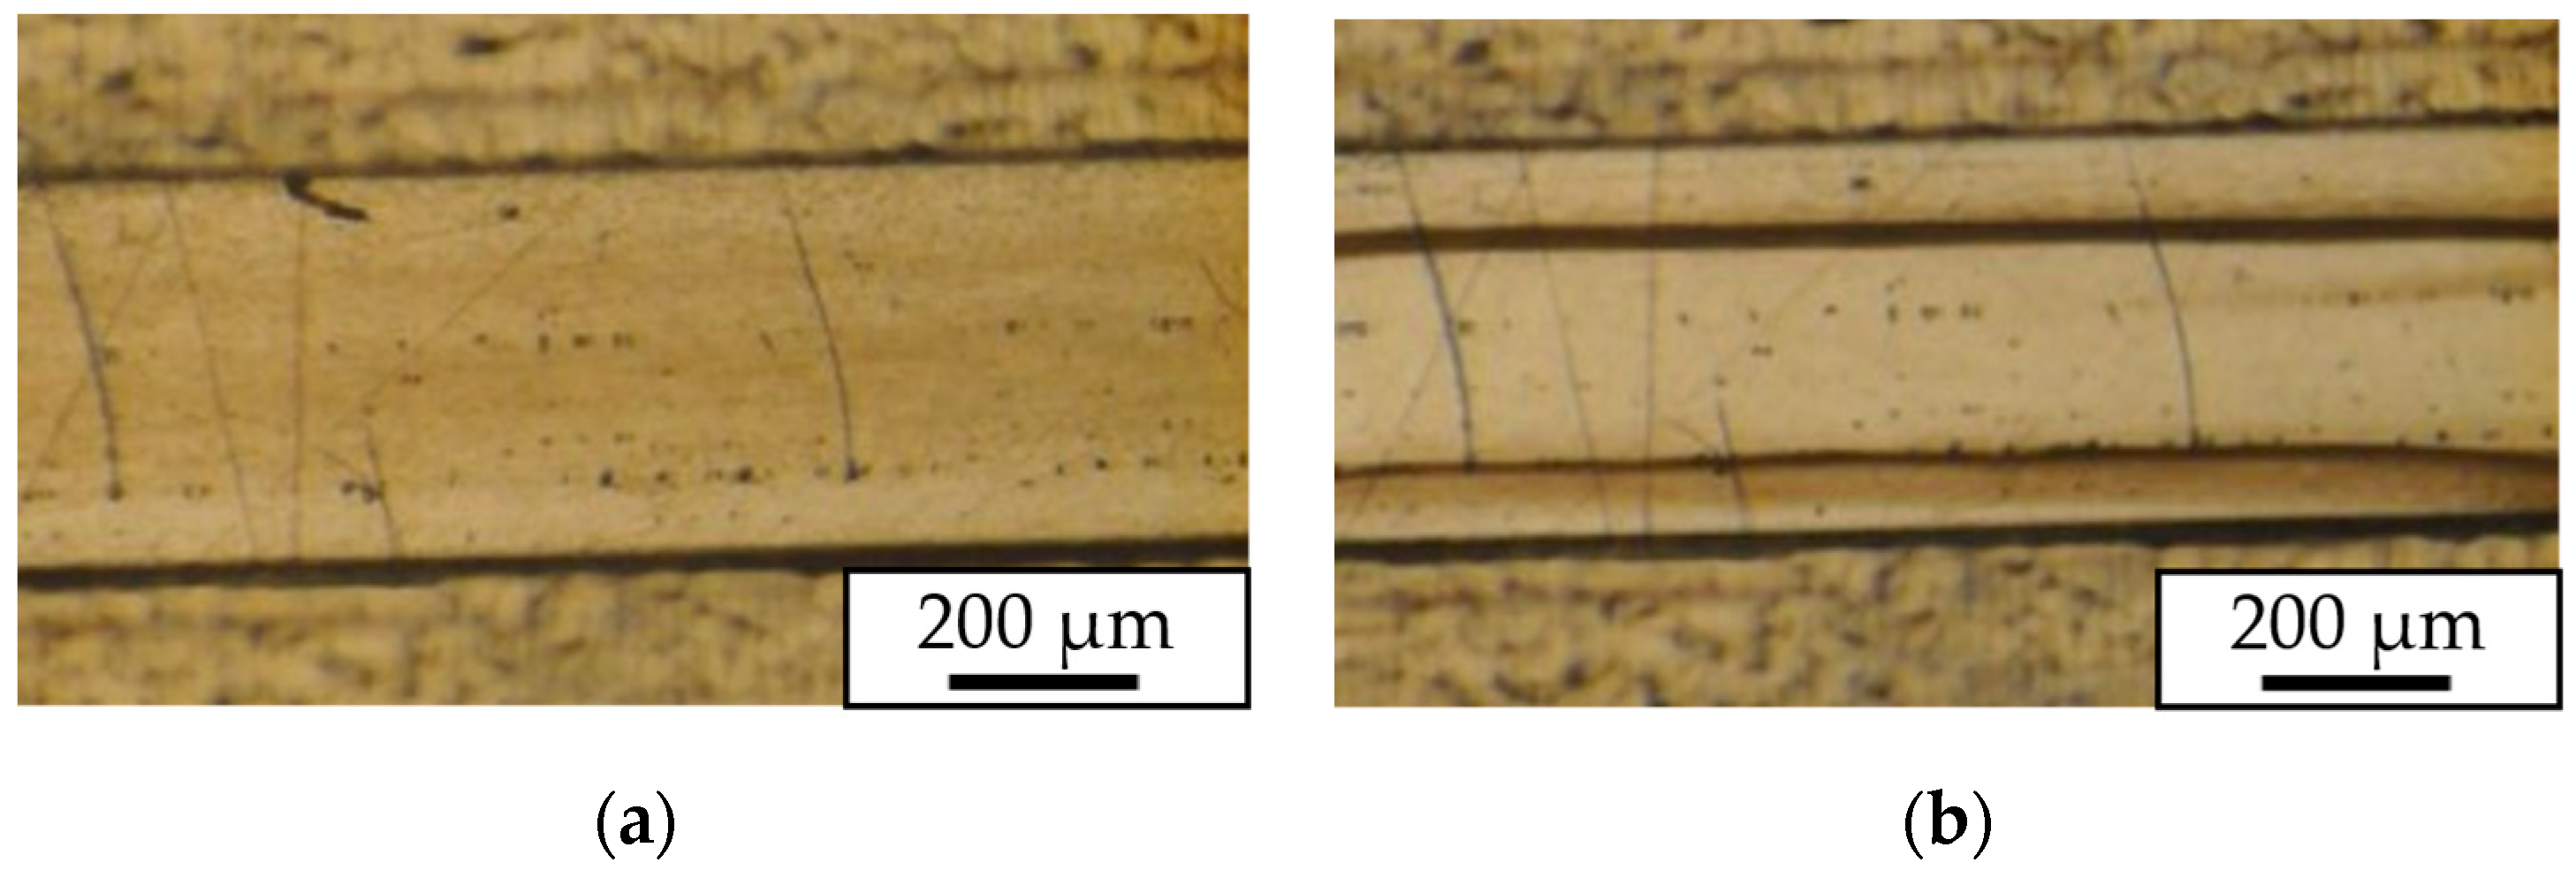
Polystyrene particles of 10 µm were used in these experiments. Manipulation experiments with polystyrene particles were carried out using 95% ethanol as the solvent. The flow rate of the syringe pump was set at 100 µL/min; the driving frequency of the device was set to 3.14 MHz; and the applied voltage to the piezoelectric element was 100. Figure 8 shows the appearance of the flow path during the experiment. The polystyrene particles were focused on the flow path, forming two lines. The time from the start of the voltage application to the device until the polystyrene particles converged was measured. The result we obtained was 0.602 s, and the pressure value in the channel was calculated backwards from the balancing relationship between Equations (6) and (7) to be 131 kPa. As mentioned earlier, the pressure required to focus the polystyrene particles at 10 µm was 99.8 kPa, and the estimated sound pressure in the channel was larger, suggesting that it was possible to focus the polystyrene particles in the microchannel. The comparison of the estimated sound pressure values with the graph in Figure 2 revealed that polystyrene particles larger than 8 µm in diameter can be manipulated in this experiment.
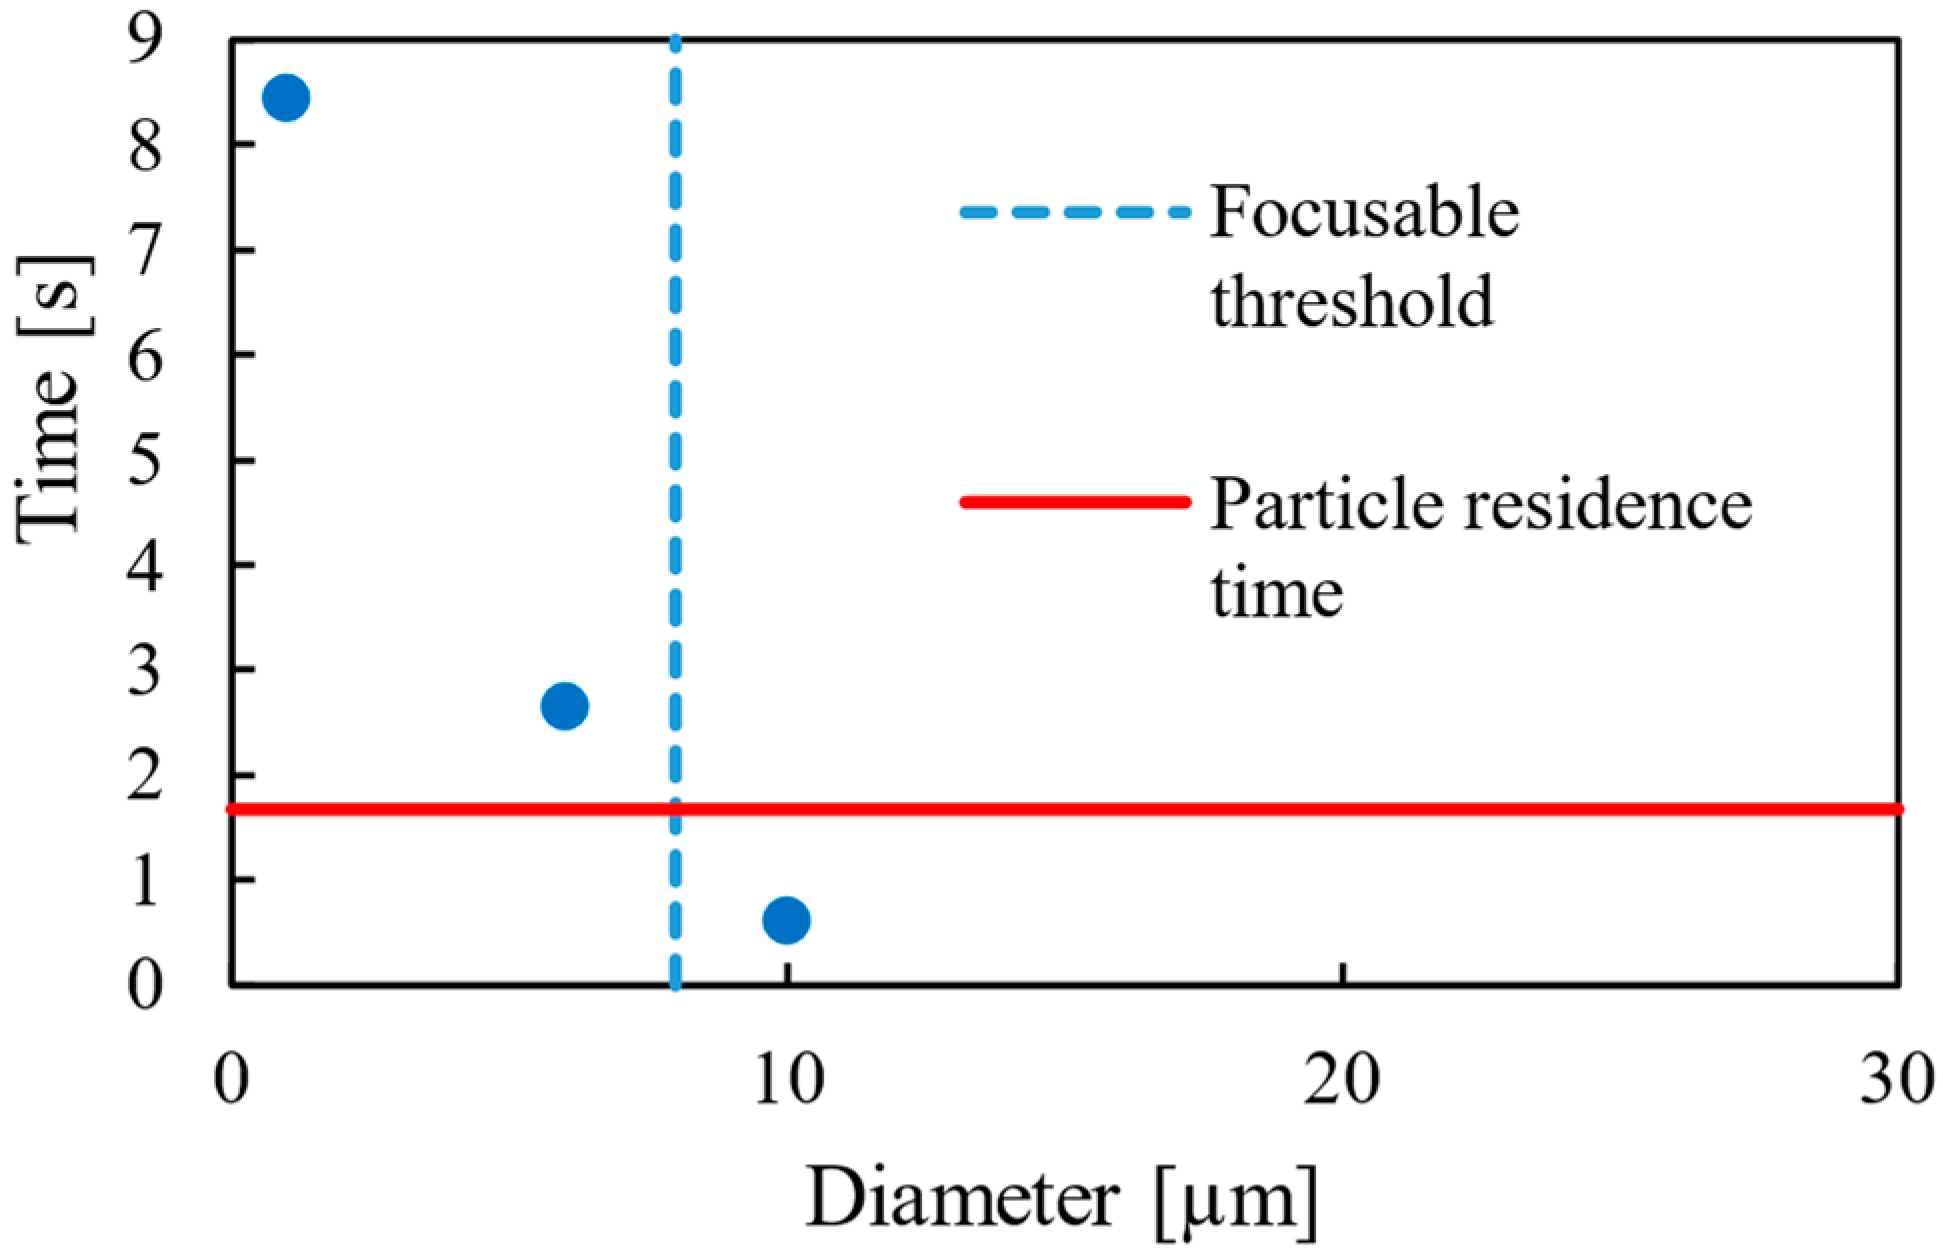
The device was also driven under similar conditions using 1 µm and 6 µm polystyrene particles. As shown in Figure 9a, the 1 µm polystyrene particles hardly moved. As shown in Figure 2, this is because the pressure in the channel did not meet the pressure required for focusing 1 µm polystyrene particles. On the other hand, the 6 µm polystyrene particles shown in Figure 9b were observed to converge to the pressure nodes when the voltage was applied. However, the focusing width of the particles was larger than when the 10 µm polystyrene particles shown in Figure 9 were manipulated. Therefore, the sound pressure required to move the 1 µm and 6 µm polystyrene particles to the pressure node was considered insufficient. The syringe pump was stopped, and the device was driven to observe the 1 µm and 6 µm polystyrene particles. The appearance of the channel is shown in Figure 10. The time for the polystyrene particles to converge was measured immediately after the voltage was applied to the device. As shown in Figure 11, the 1 µm polystyrene particles focused in 8.44 s, and the 6 µm polystyrene particles focused on to the pressure nodes in 2.64 s. The results for each of the two sizes of polystyrene particles are shown in Figure 11. These results indicate that stopping the flow enabled acoustic focusing of the 1 µm and 6 µm particles, but the particles stayed in the channel for 1.64 s when they were pumped at 100 µL/min, suggesting that the pressure was insufficient to manipulate the particles under the device driving conditions in this experiment. Based on these experimental results, sufficient pressure must be applied to the channel for the desired diameter range to classify the particles, and the distance traveled by the particles should be considered when designing the device.
2.4. Travel Distance and Calculation of Droplets in Emulsions
In this section, the behavior of emulsion droplets is predicted with the aim of classifying these droplets according to their diameter. The emulsions used were the 1 wt% SDS solution for the continuous phase and n-dodecane for the dispersed phase. To realize droplet manipulation using a bifurcated channel, the droplet must travel at least 224 µm, the distance from the center of the channel to the pressure node, during the time that the acoustic radiation force acts on the droplet. The time during which the acoustic radiation force acts on the droplet is the time between the droplet’s entry into the channel and its arrival at the branching channel. As the distance in this range is 35.8 mm, the time for the acoustic radiation force to act on the droplet was calculated to be 1.64 s. Figure 12 shows the relationship between the droplet size and distance traveled, and Table 2 and Table 3 show the parameters and physical properties used in our estimations. The vertical blue dashed line in the diagram shows the time for the acoustic radiation force to act on the droplet, while the horizontal yellow dashed line indicates the travel distance required for droplet manipulation. From these graphs, droplets with diameters larger than 5 µm can obtain the required travel distance.
3. Experiments and Results
3.1. Overview of the Droplet Manipulation Experiment
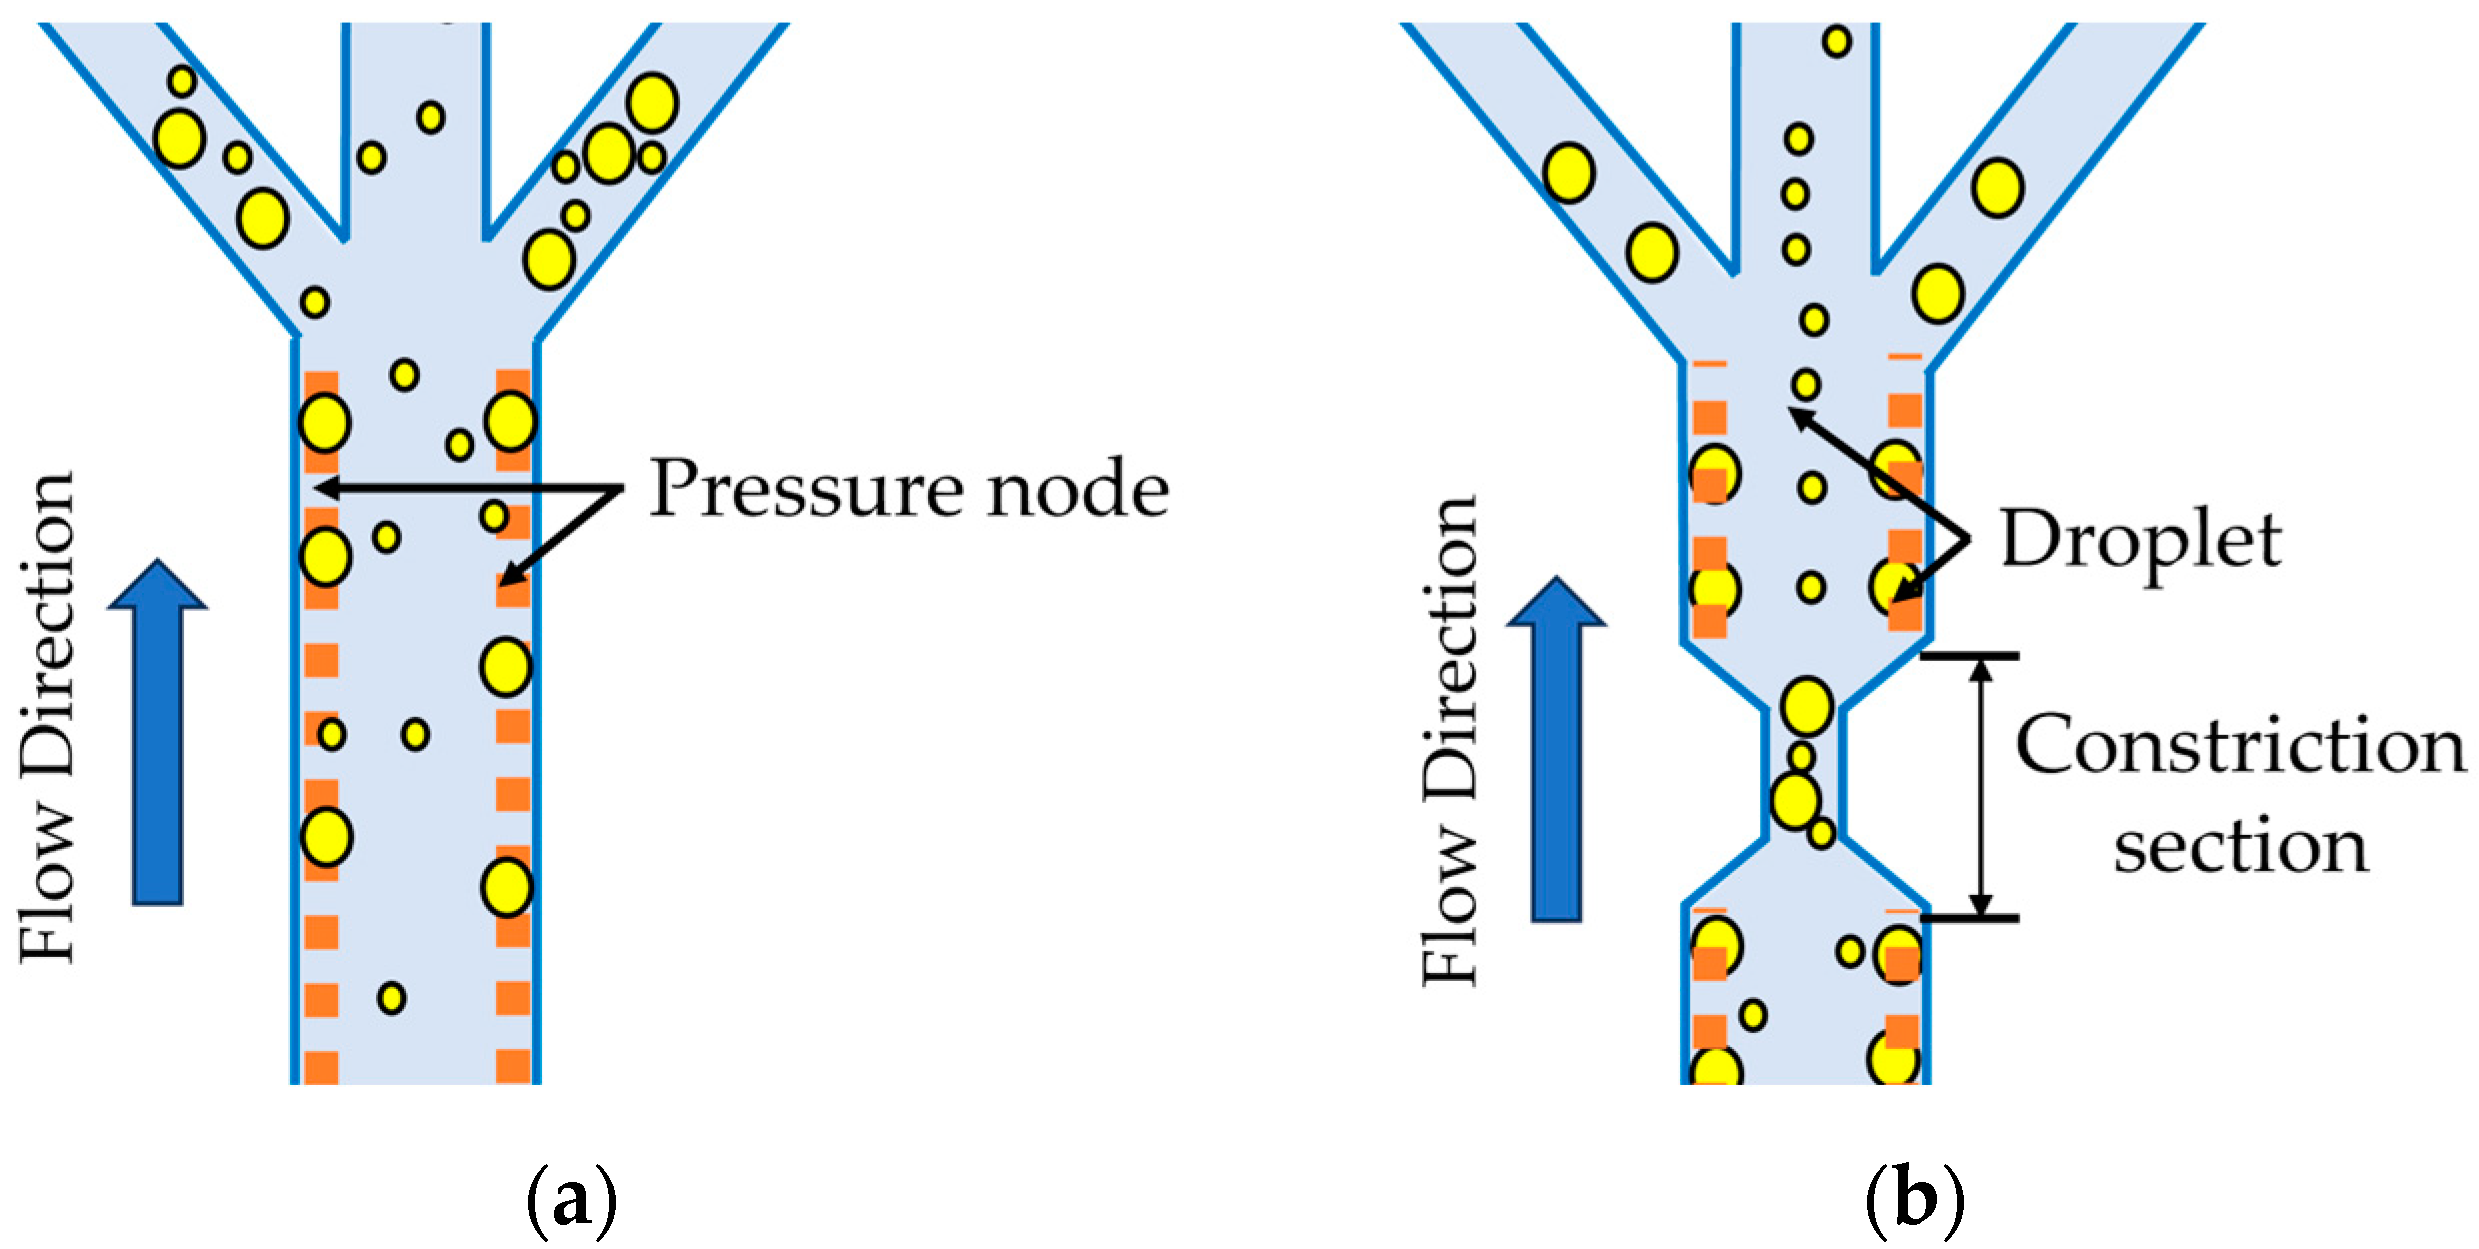
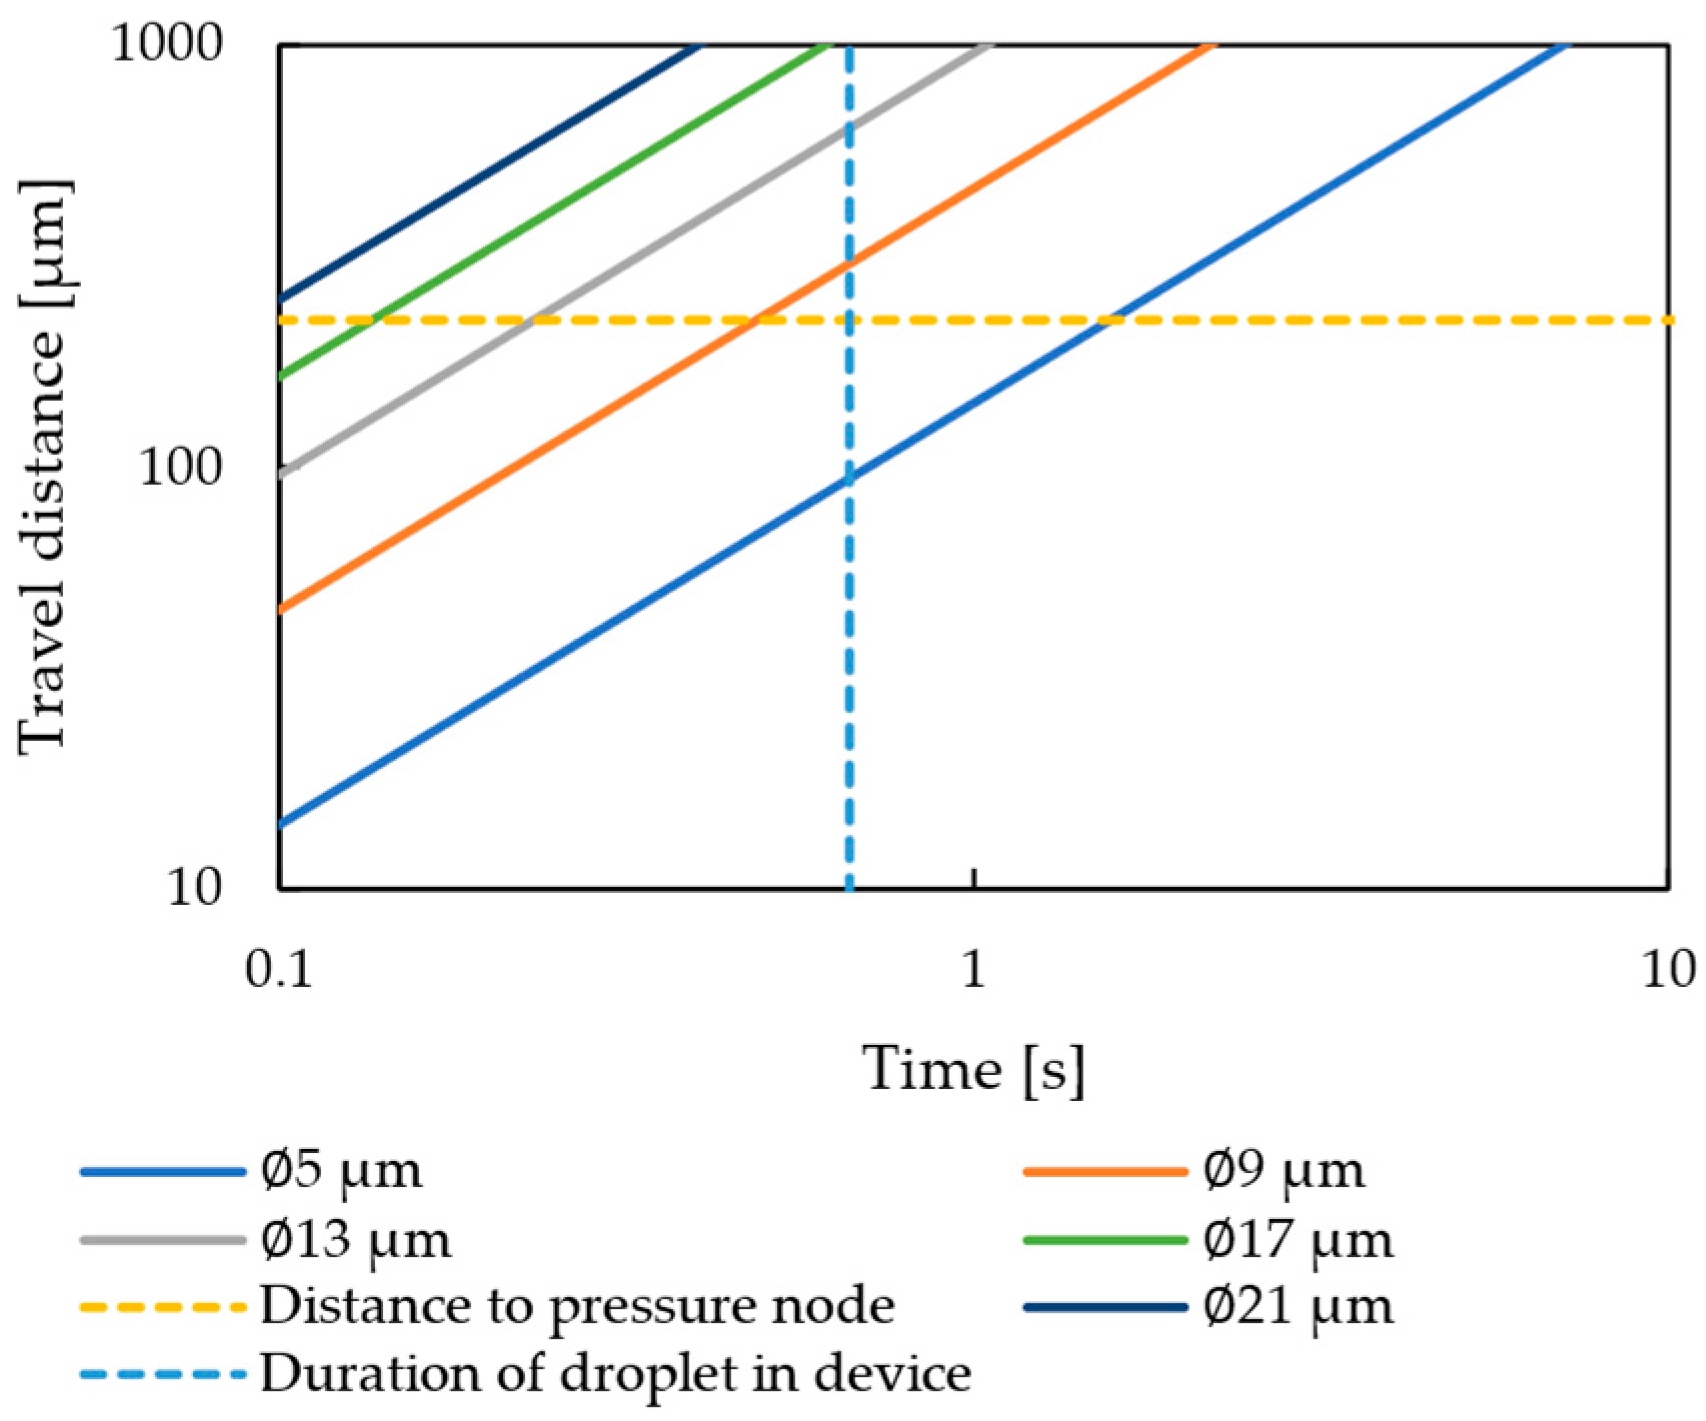
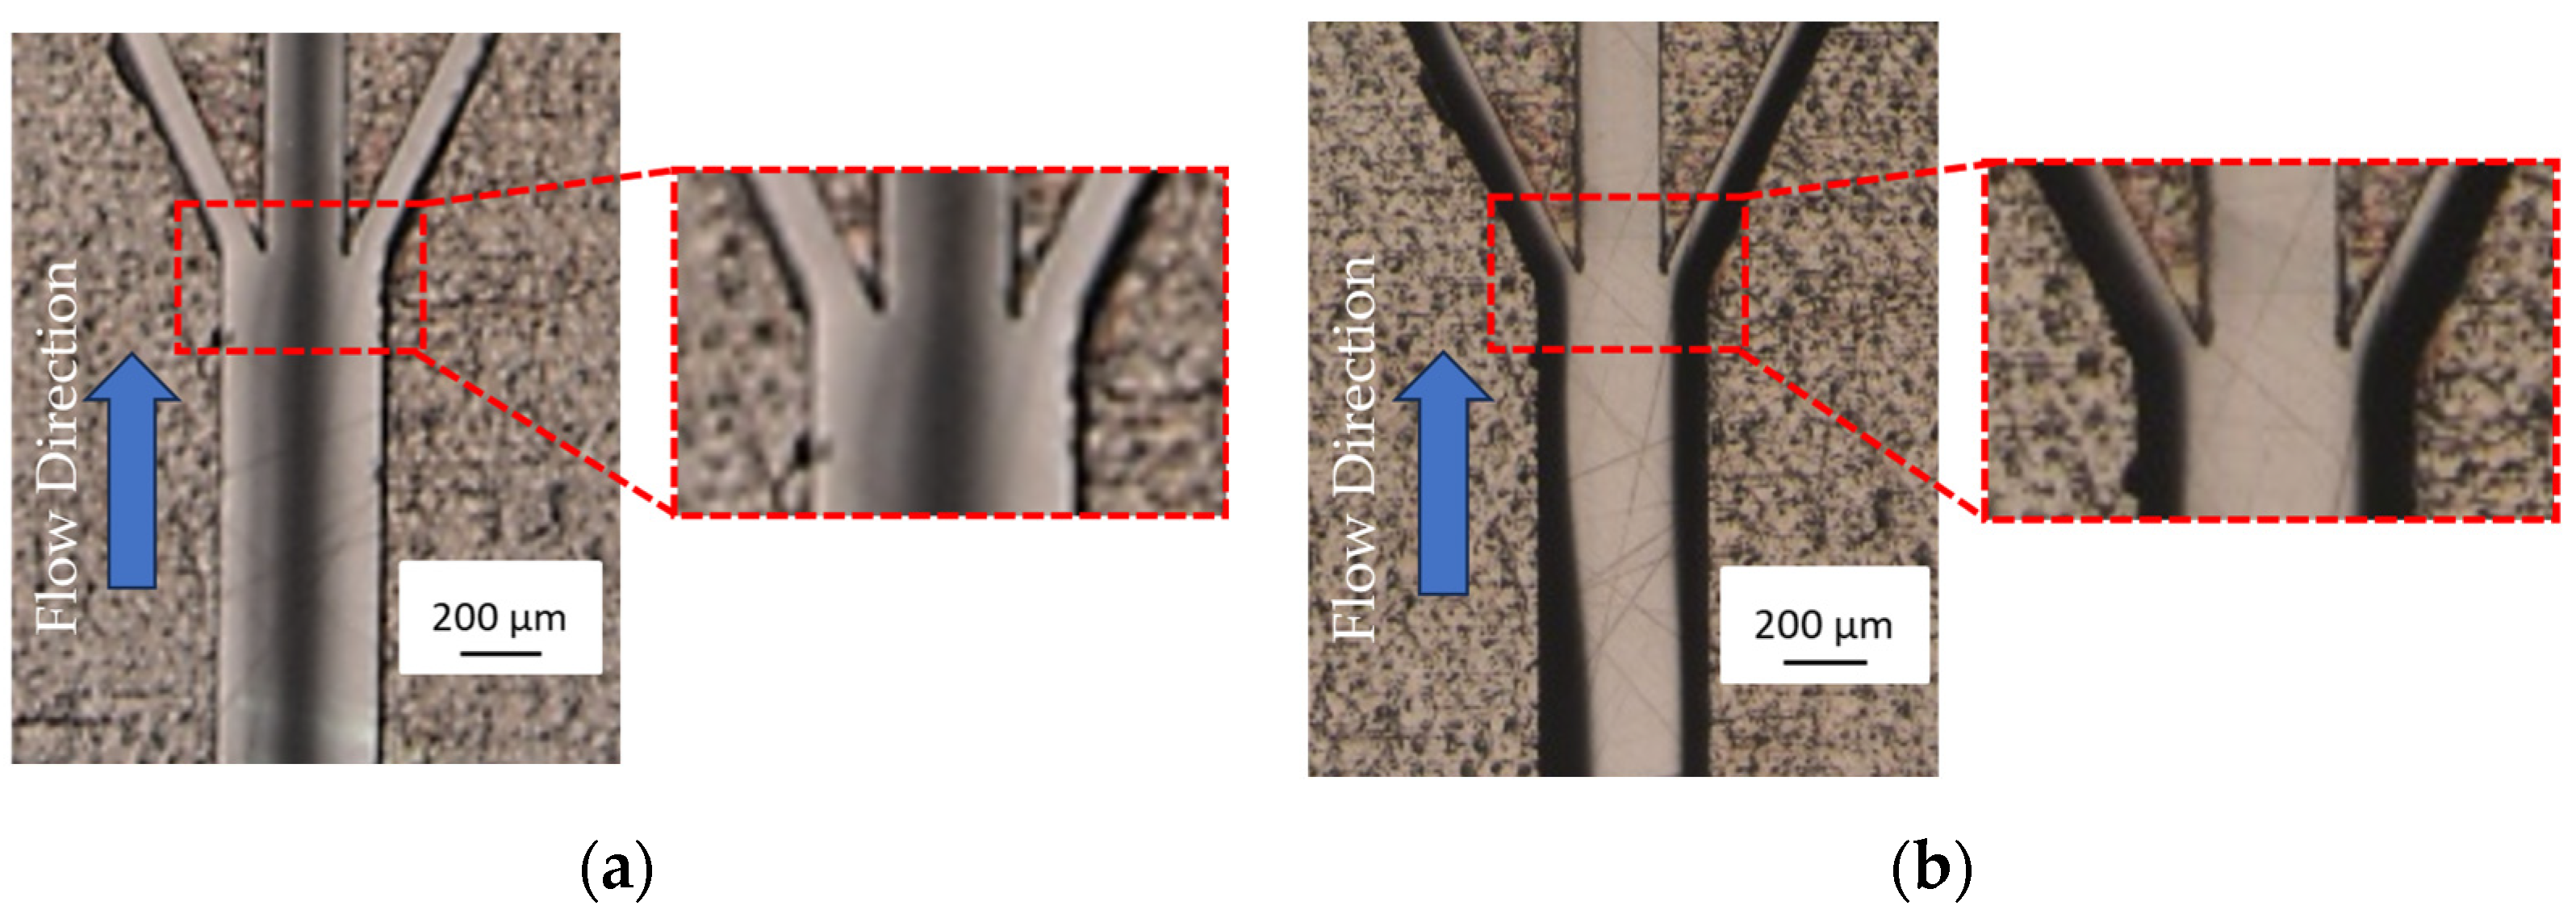
In the present study, a new narrowing section is added to the microchannels of a droplet manipulation device irradiated with ultrasonic vibrations to achieve the effect of classification. A comparison between a three-branch microchannel without a constriction and a three-branch microchannel with a constriction is shown in Figure 13. In the channel without a constriction, large droplets in the emulsion are collected at the pressure nodes of the channel and are collected from both end channels, while smaller droplets, which are less affected by the acoustic radiation force, are distributed in all branching channels. In contrast, when a channel with a constriction part is used, the droplets in the emulsion are first collected in the center using the constriction section, and then the larger droplets are manipulated by the acoustic radiation force and collected in the channels on both sides. As a result, smaller droplets are collected in the central channel compared to the channels on both sides, thus achieving a classification effect. When microchannels with a constriction section are used, the acoustic radiation force acts on the droplets after they pass through the constriction. The time required for the irradiation of the acoustic force was reduced to 0.66 s because the flow path before the bifurcation was shortened to 14.4 mm compared to the case of a normal flow path. Figure 14 shows the relationship between the droplet size and travel distance when microchannels with a constriction are used. The parameters and physical properties used are the same as those shown in Table 1 and Table 2. The vertical blue dashed line in the figure indicates the time at which the acoustic radiation force acts on the droplet, which was found to be 0.66 s. The horizontal yellow dashed line indicates the travel distance, 224 µm, required for droplet manipulation. The graph indicates that droplets with diameters larger than 9 µm can achieve the required travel distance when microfluidic channels with a constriction section are used.
3.2. Experiments on Droplet Manipulation Using Flow Channels with Narrowed Sections
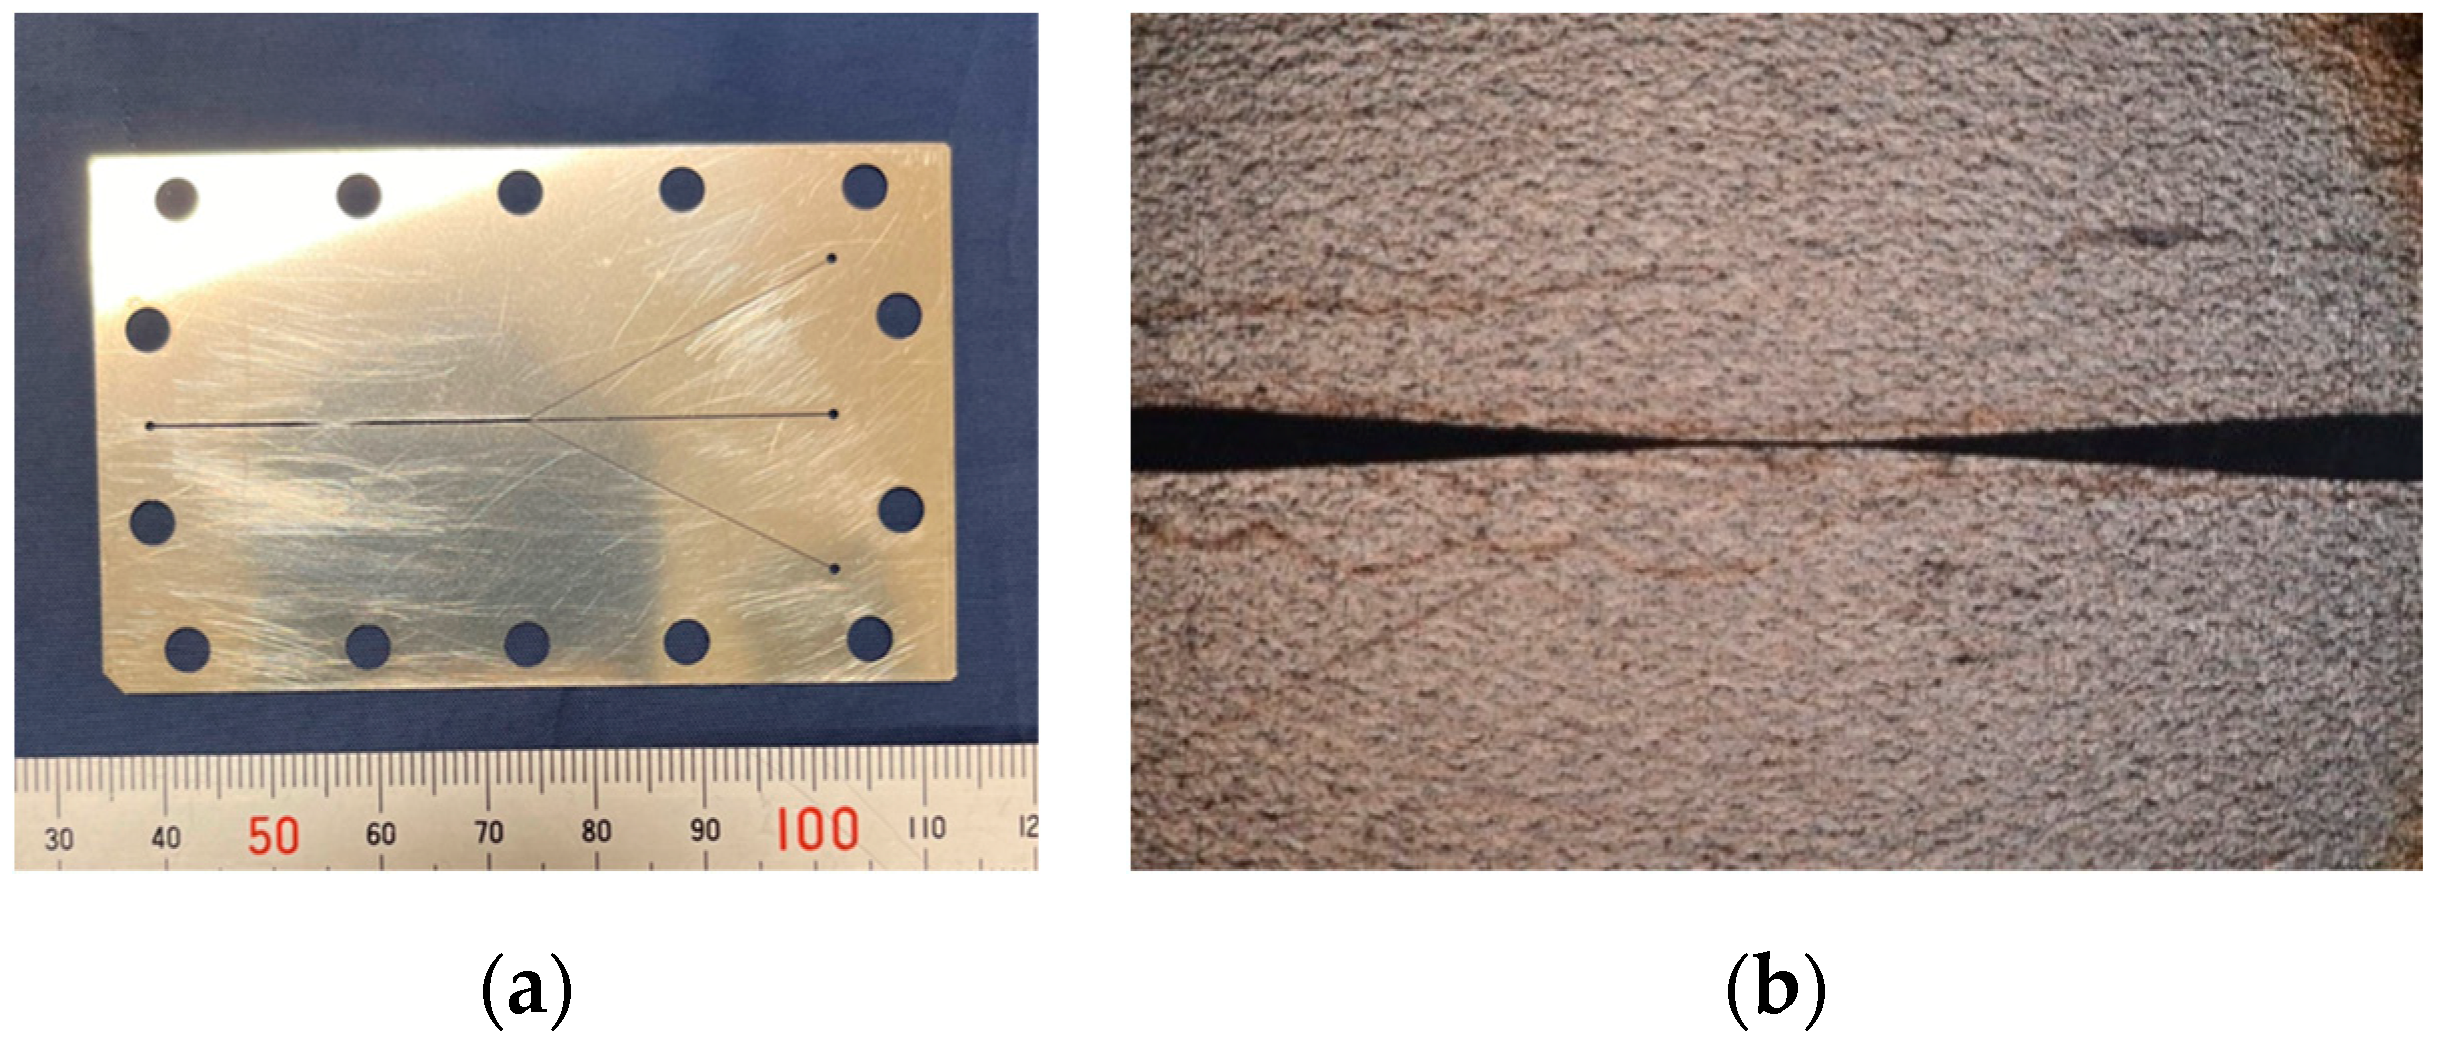
As shown in Figure 15a,b, a microfluidic plate was fabricated, and experiments were conducted using devices stacked in the same configuration as in Figure 4. The channel width of this channel plate is 400 µm, and the channel constriction section is 30 µm. The experimental setup of these experiments is shown in Figure 16. First, emulsion is generated by the shear force of the continuous phase using microchannels with Y-shaped channels. The emulsion is then pumped into a droplet manipulation device, and the droplet manipulation is observed under an optical microscope.
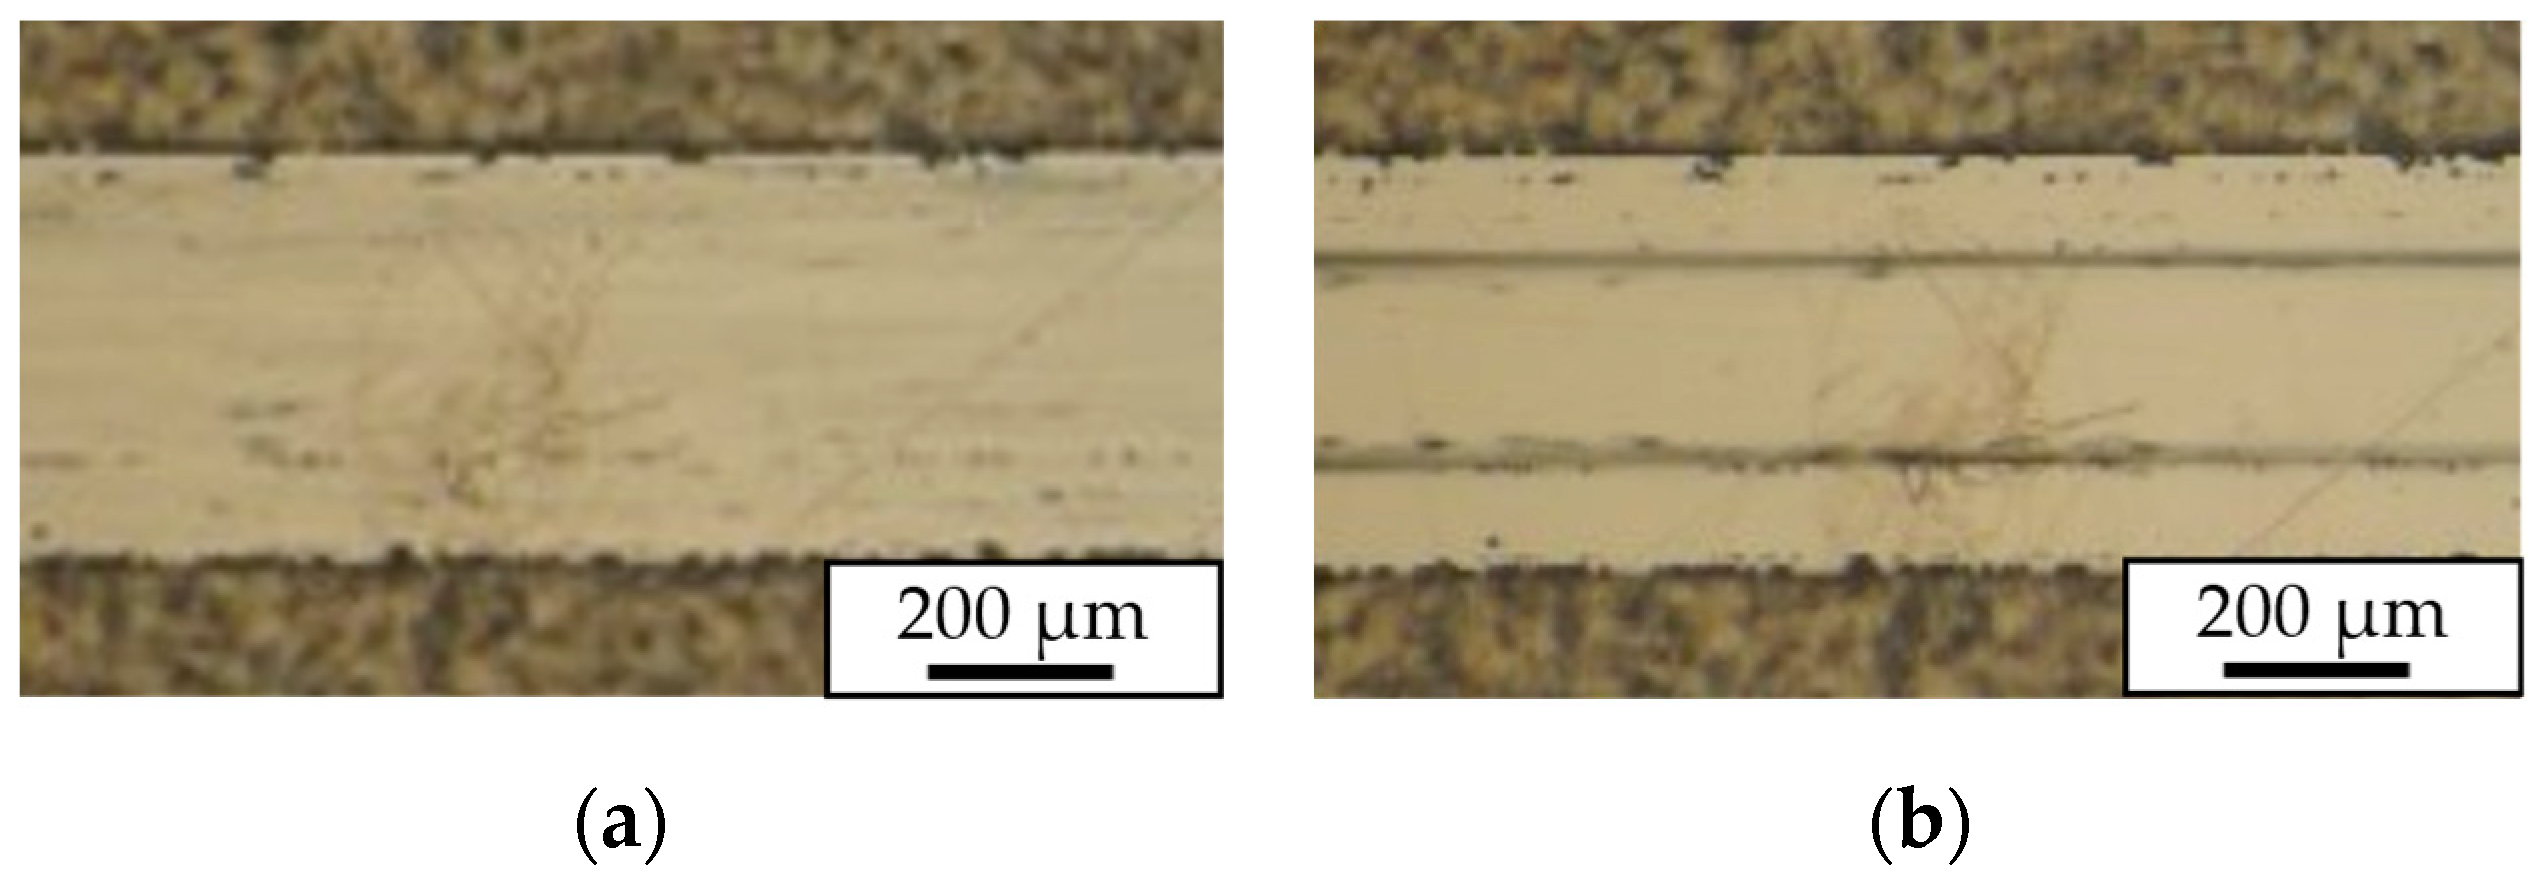
Figure 17 shows the effect of the ultrasound application on droplet manipulation. Prior to applying the ultrasound application, relatively large droplets, shown in black in Figure 17, are concentrated in the center of the channel by the constriction. Small droplets are difficult to examine but are concentrated in the center of the channel as well as the large droplets. In contrast, when ultrasound is applied, as shown in Figure 1, a node of sound pressure is formed, and the droplets are subjected to the acoustic radiation force, resulting in the observed large droplets being collected in the bifurcated channels on both sides.
3.3. Comparison of the Droplet Manipulation Results with and without a Constriction
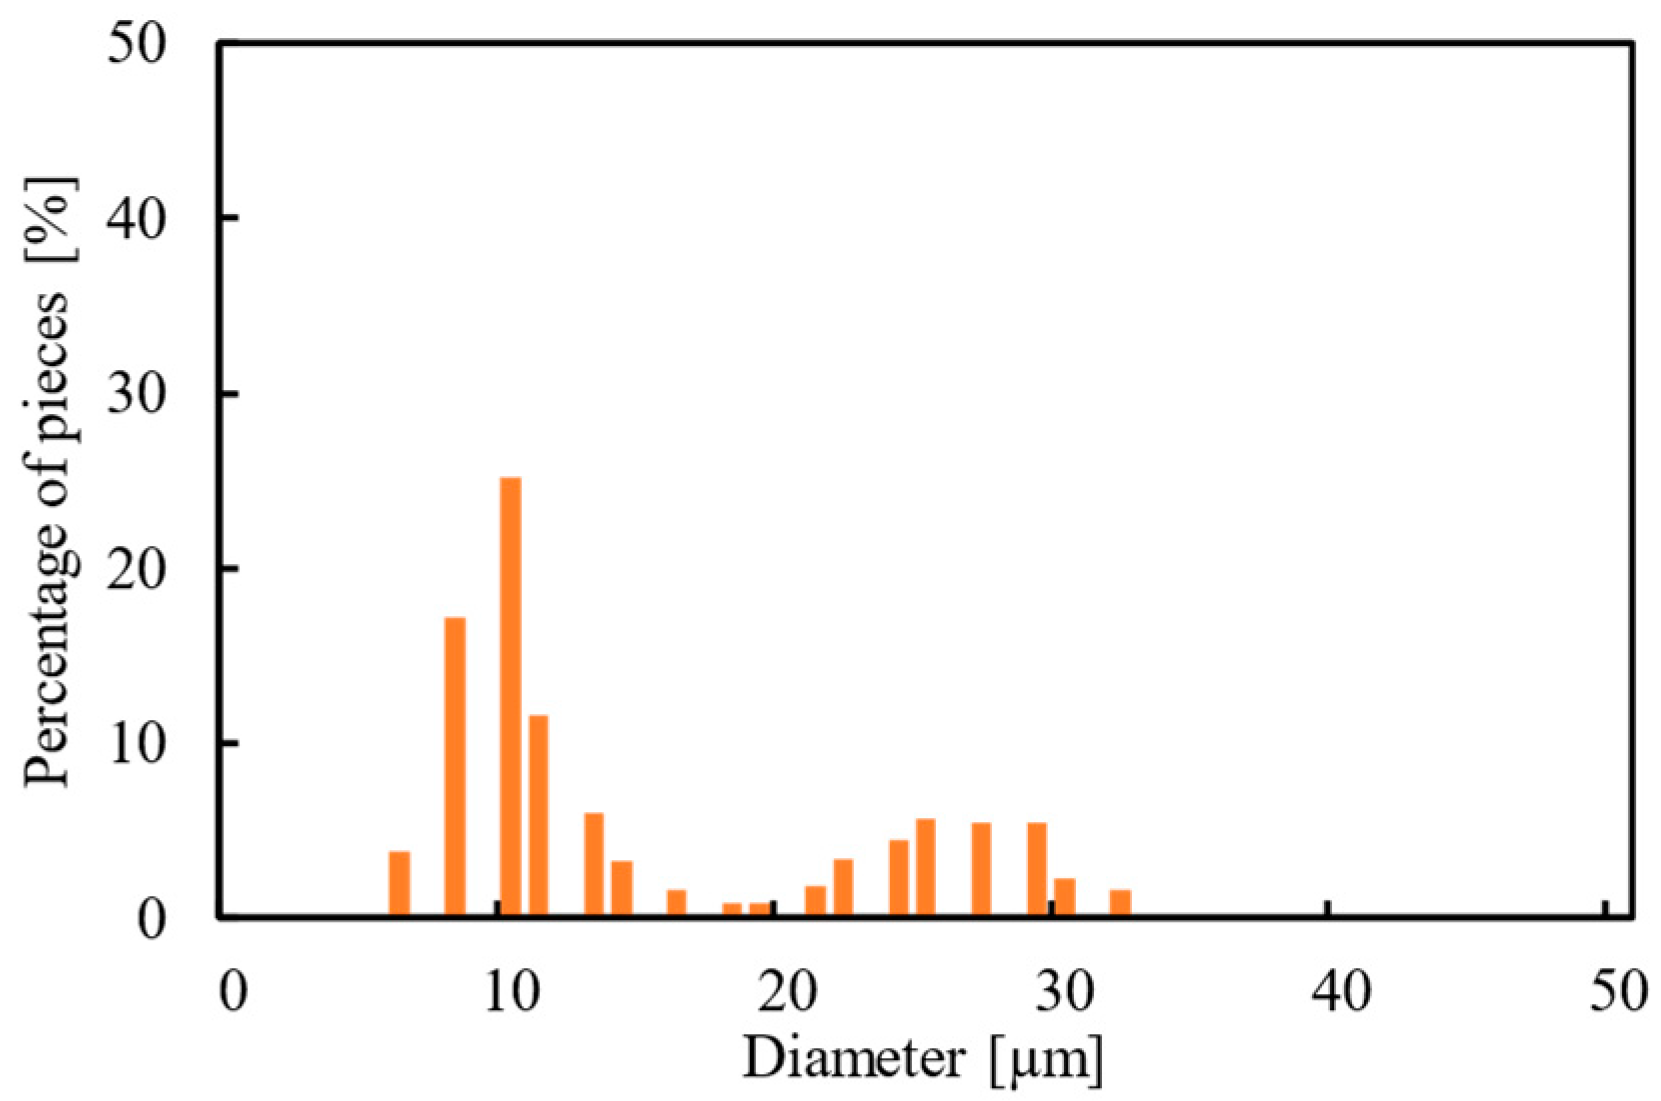
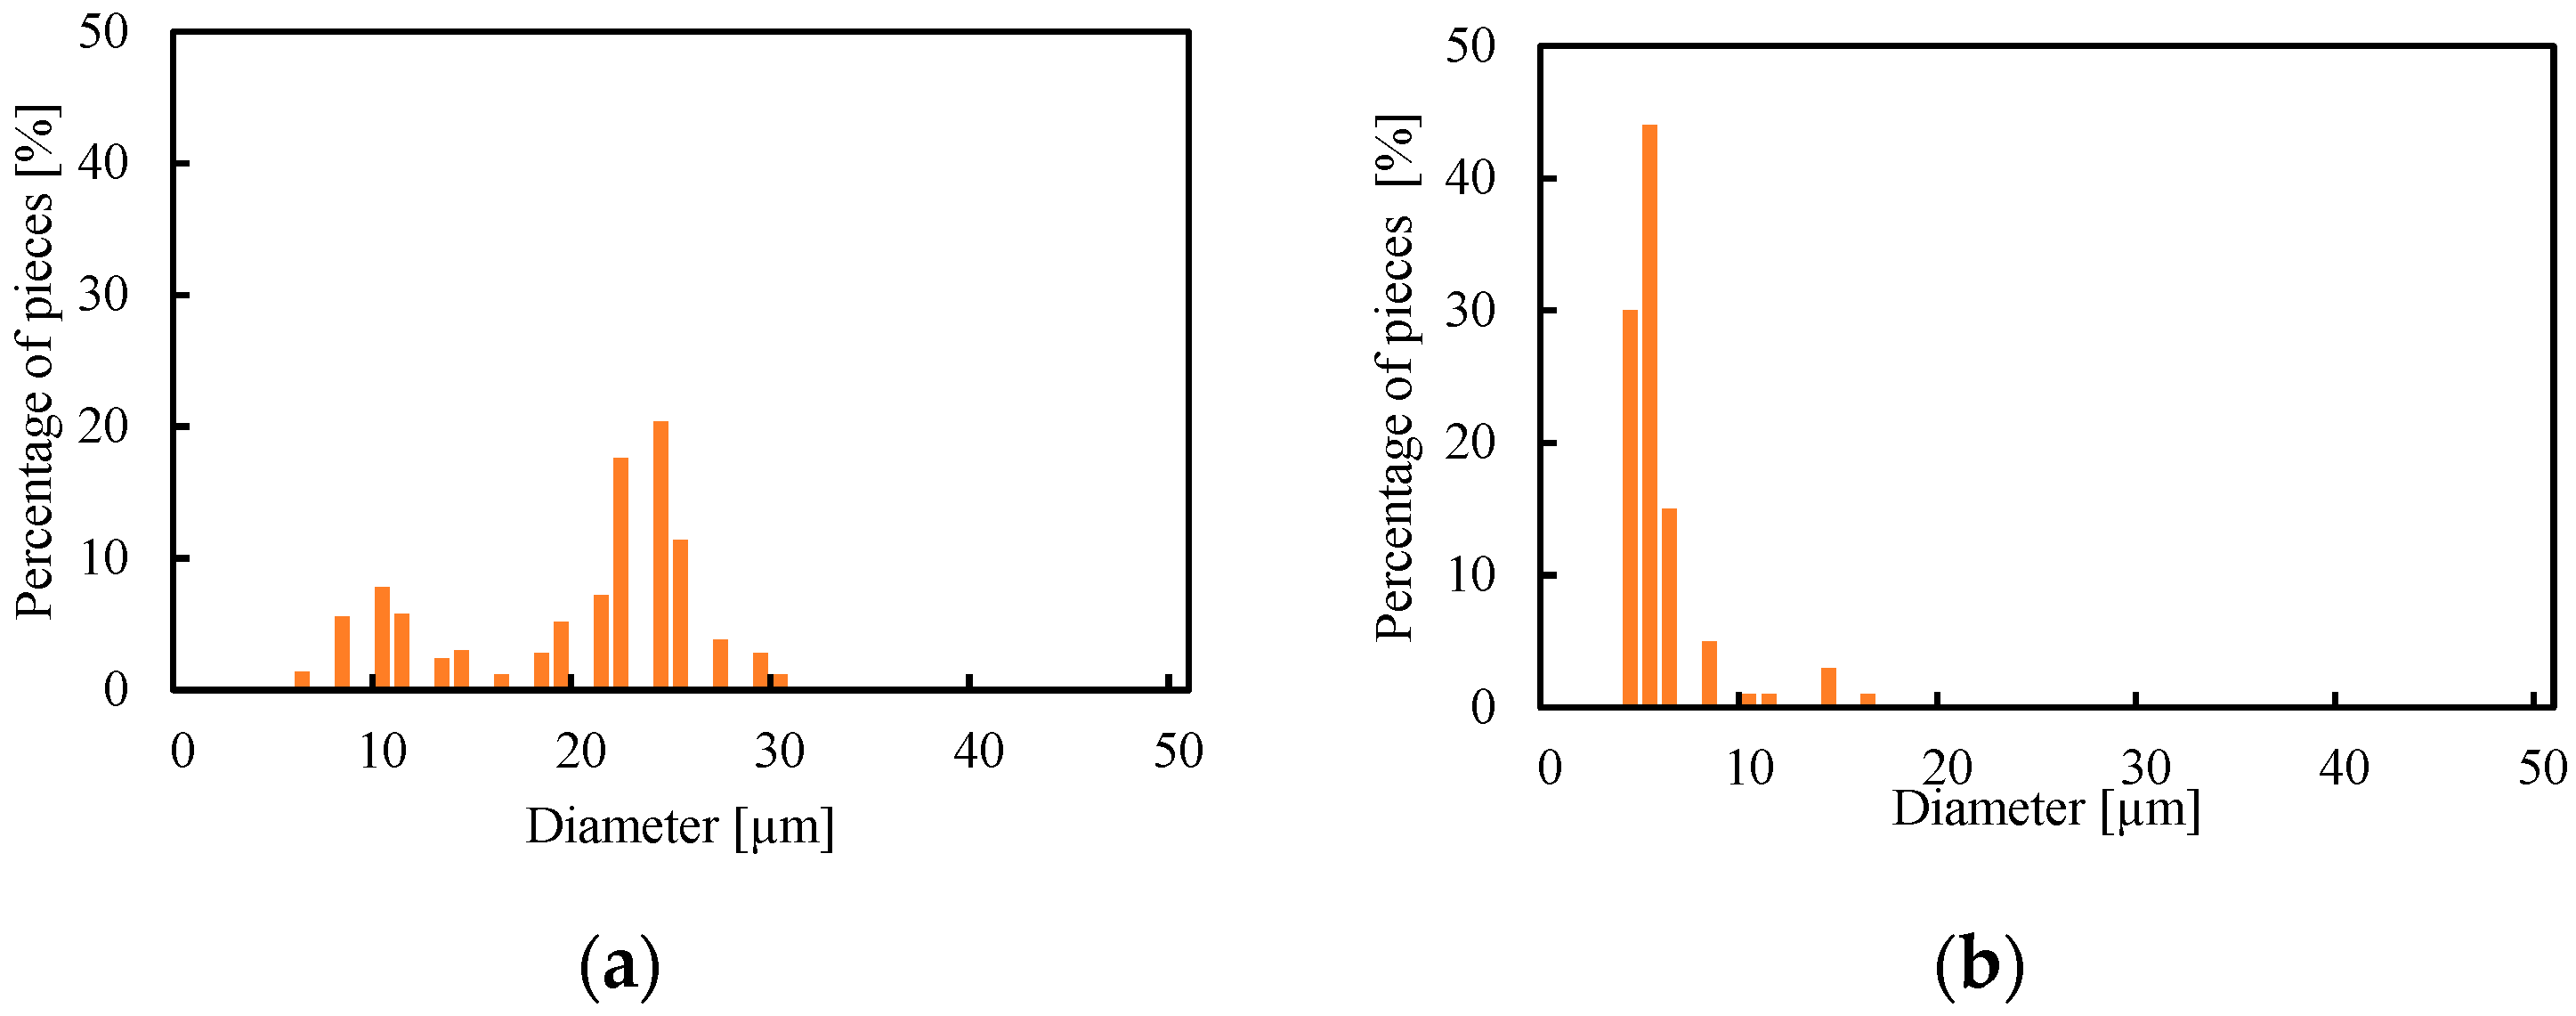
The experimental conditions were as follows: the flow rates of the continuous phase (1 wt% SDS solution) and the dispersed phase (n-dodecane) were 100 µL/min and 2 µL/min, respectively. The driving frequency of the droplet manipulation device was 2.25 MHz, and the applied voltage was 120 . The emulsions collected from each channel after the droplet manipulation process were observed, and the droplet diameters were measured using image analysis software. Figure 18 shows the measured droplet diameters of the emulsions generated by the Y-type microchannel in Figure 16. Figure 19 shows the droplet diameter distributions of the emulsions collected in the channels on both sides and in the central channel, respectively, after the droplet manipulation process using the microchannel without a constriction. Compared with the droplet diameter distribution in the emulsion before the operation, the emulsion collected from the central channel contained more droplets with diameters of 20 µm or less. The droplet diameters of the emulsions collected from the channels on both sides were polydispersed compared to the droplet diameters of the emulsions collected from the central channel.
Next, similar experiments were carried out using a microchannel with a constriction: Figure 20 shows the droplet diameter distributions of the emulsions collected from both channels after droplet manipulation and from the central channel, respectively. The proportion of droplet diameters of 20–30 µm in the emulsions collected from the channels on both sides after the operation was higher than that of the microchannel without a constriction.
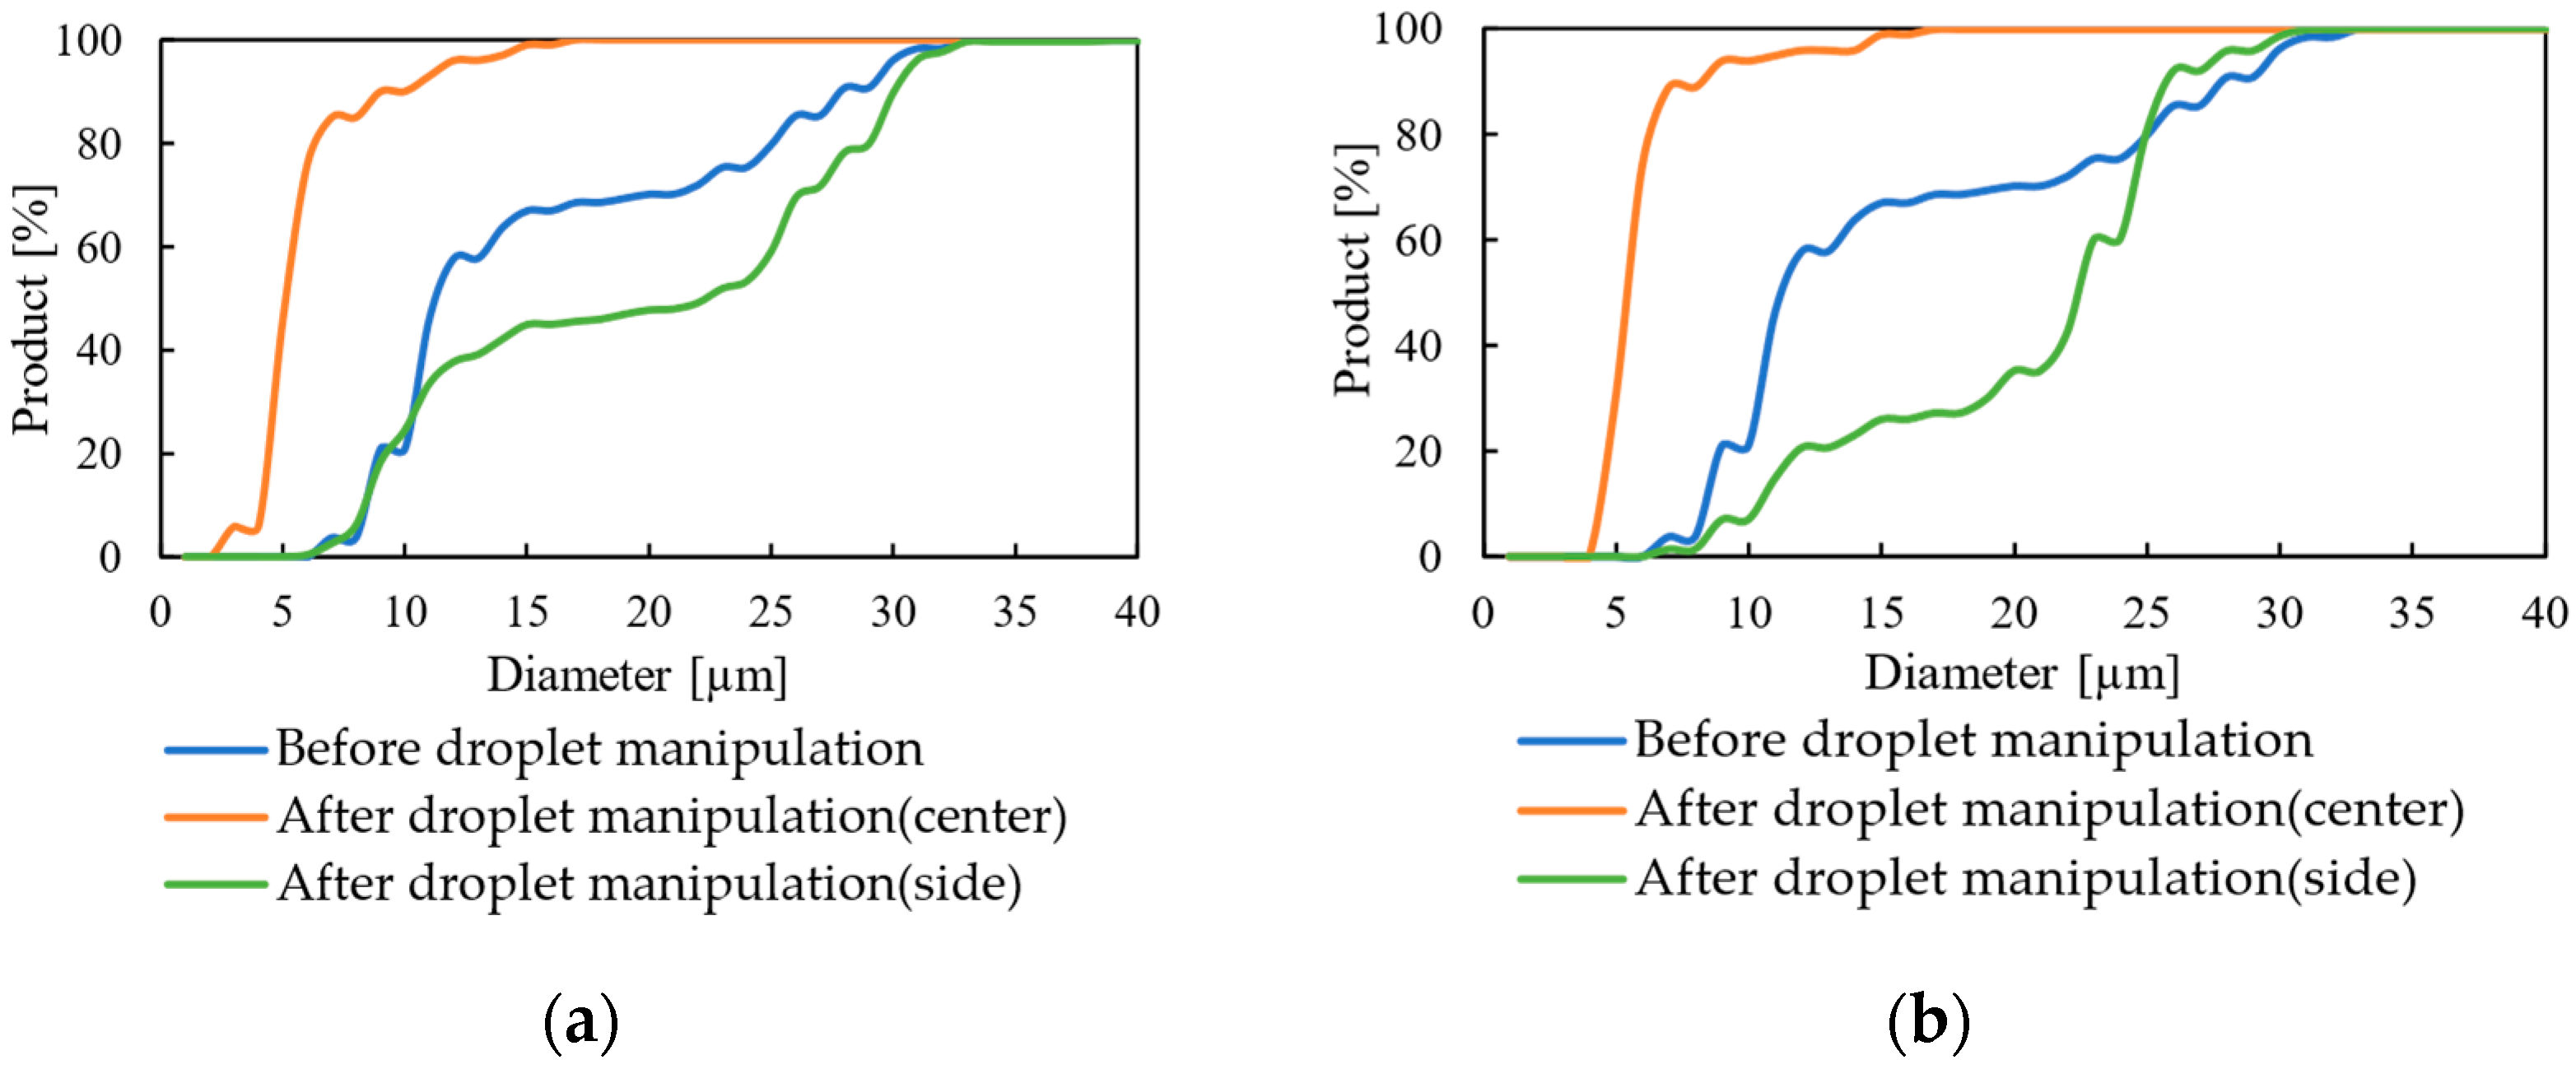
To clarify the effect of the microfluidic channel with a constriction, Figure 21 shows graphs comparing the number of droplets in the emulsion before the operation and the number of droplets in the recovered emulsion, using the amount of the ratio integrated from the smallest diameter to the largest. The side and center mean locations of the collected droplets are depicted in Figure 16. The emulsion collected at the center of the channel after droplet manipulation had a droplet content of 94% with a diameter of 9 µm or less, while the emulsion collected from the channels on both sides after manipulation had a droplet content of 7%. Furthermore, the 21% content of droplets smaller than 9 µm in the emulsion prior to their manipulation suggests that droplets larger than 9 µm could have been manipulated. This result is consistent with the theoretical value derived in Figure 14. The effect of the microchannel with a constriction was also observed, as the emulsion collected in the center of the channel after droplet manipulation had a droplet content of 90% for droplets smaller than 9 µm and 18.4% for emulsions collected from the channels on both sides after the manipulation.
4. Conclusions
In this study, theoretical values and particle behaviors with polystyrene particles were estimated and, the effect of the classification of microfluidic channels with a narrowing in a stacked droplet manipulation device using acoustic emission forces was evaluated. The behavior of the particles correlated with the predictions obtained from the theoretical values in manipulation experiments using 1, 6, and 10 µm polystyrene particles. The device was also evaluated in manipulation experiments on droplets in microemulsions and droplets in nano emulsions, where the continuous phase consisted of 1 wt% SDS solution and the dispersed phase consisted of n-dodecane. Our results showed that the droplet manipulation device was effective in classifying droplets in the experiments with microemulsions. Furthermore, the use of microfluidic channels with a constriction component reduced the proportion of relatively large droplets in the emulsion that were collected from the central channel and enabled us to carry out out a more effective classification.
Author Contributions
Conceptualization, T.K.; methodology, A.F. and S.S.; validation, A.F. and S.S.; data curation, S.W. and D.Y.; writing—original draft, T.K.; writing—review & editing, T.K.; supervision, T.K.; project administration and funding acquisition, T.K. All authors have read and agreed to the published version of the manuscript.
Funding
This work was partially supported by JKA and its promotion funds from KEI RIN RACE (2019M-130).
Data Availability Statement
Data is unavailable due to privacy.
Conflicts of Interest
The authors declare no conflict of interest.
References
- Meltem, S.; Burcu, Ö.; Ayşe, K. An Overview of Food Emulsions: Description, Classification and Recent Potential Applications. Turk. J. Agric. Food Sci. Technol. 2015, 3, 430–438. [Google Scholar]
- Muschiolik, G. Multiple emulsions for food use. Curr. Opin. Colloid Interface Sci. 2007, 12, 213–220. [Google Scholar] [CrossRef]
- Fredrick, E.; Walstra, P.; Dewettinck, K. Factors governing partial coalescence in oil in water emulsions. Adv. Colloid Interface Sci. 2010, 153, 30–42. [Google Scholar] [CrossRef]
- Amarasinghe, B.M.W.P.K.; Kumarasiri, M.P.M.; Gangodavilage, N.C. Effect of method of stabilization on aqueous extraction of rice bran oil. Food Bioprod. Process. 2009, 87, 108–114. [Google Scholar] [CrossRef]
- Byun, A.; Shim, J.; Han, S.W.; Kim, B.; Chae, P.S.; Shin, H.S.; Kim, J.W. One-pot microfluidic fabrication of graphene oxide-patched hollow hydrogel microcapsules with remarkable shell impermeability. Chem. Commun. 2015, 51, 12756–12759. [Google Scholar] [CrossRef]
- Kwon, W.T.; Park, K.; Han, S.D.; Yoon, S.M.; Kim, J.Y.; Bae, W.; Rhee, Y.W. Investigation of water separation from water-in-oil emulsion using electric field. J. Ind. Eng. Chem. 2010, 16, 684–687. [Google Scholar] [CrossRef]
- Filho, R. Occlusive power evaluation of O/W/O multiple emulsions on gelatin support cells. Int. J. Cosmet. Sci. 1997, 19, 65–73. [Google Scholar] [CrossRef] [PubMed]
- Koyama, D.; Kiyan, W.; Watanabe, Y. Optical observation of microcapsule destruction in an acoustic standing wave. Jpn. J. Appl. Phys. 2004, 43, 3215–3219. [Google Scholar] [CrossRef]
- Anna, S.L.; Bontoux, N.; Stone, H.S. Formation of dispersions using ‘flow focusing’ in microchannels. Appl. Phys. Lett. 2003, 82, 364–366. [Google Scholar] [CrossRef]
- Taha, A.; Ahmed, E.; Ismaiel, A.; Ashokkumar, M.; Xu, X.; Pan, S.; Hu, H. Ultrasonic emulsification: An overview on the preparation of different emulsifiers-stabilized emulsions. Trends Food Sci. Technol. 2020, 105, 363–377. [Google Scholar] [CrossRef]
- Carugo, D.; Browing, R.J.; Iranmanesh, I.; Messaoudi, W.; Rademeyer, P.; Stride, E. Scaleable production of microbubbles using an ultrasound-modulated microfluidic device. J. Acoust. Soc. Am. 2021, 150, 1577–1589. [Google Scholar] [CrossRef] [PubMed]
- Harada, T.; Kanda, T.; Suzumori, K.; Ono, T.; Iwabuchi, S.; Ito, K.; Higaki, K. Emulsion generating microchannel device oscillated by 2.25 MHz ultrasonic vibrator. Jpn. J. Appl. Phys. 2010, 49, 07HE13. [Google Scholar] [CrossRef]
- Kanda, T.; Harada, T.; Tominaga, Y.; Ono, T.; Iwabuchi, S.; Ito, K.; Ogawara, K.; Higaki, K.; Yoshizawa, Y. Design and Evaluation of Emulsion Gemeration Device Using Ultrasonic Vibration and Microchannel. Jpn. J. Appl. Phys. 2011, 50, 07HE24. [Google Scholar] [CrossRef]
- Kanda, T.; Yabumoto, M.; Suzumori, K. A piezoelectric polymer cavitation sensor installed in an emulsion generation microchannel device and an evaluation of cavitation state. Jpn. J. Appl. Phys. 2016, 55, 07KE07. [Google Scholar] [CrossRef]
- Mason, T.G.; Bibette, J. Emulsification in viscoelastic media. Phys. Rev. Lett. 1996, 77, 3481–3484. [Google Scholar] [CrossRef] [PubMed]
- Wang, Z.; Neves, M.A.; Isoda, H.; Nakajima, M. Preparation and Characterization of Micro / Nano-emulsions Containing Functional Food Components. Jpn. J. Food Eng. 2015, 16, 263–276. [Google Scholar] [CrossRef]
- Kuntaegowdanahalli, S.S.; Bhagat, A.A.S.; Kumar, G.; Papautsky, I. Inertial microfluidics for continuous particle separation in spiral microchannels. Lab Chip 2009, 9, 2973–2980. [Google Scholar] [CrossRef]
- Raihan, M.K.; Li, D.; Kummetz, A.J.; Song, L.; Yu, L.; Xuan, X. Vortex trapping and separation of particles in shear thinning fluids. Appl. Phys. Lett. 2020, 116, 183701. [Google Scholar] [CrossRef]
- Pamme, N.; Manz, A. On-chip free-flow magnetophoresis: Continuous flow separation of magnetic particles and agglomerates. Anal. Chem. 2004, 76, 7250–7256. [Google Scholar] [CrossRef]
- Sajeesh, P.; Sen, A.K. Particle separation and sorting in microfluidic devices: A review. Microfluid. Nanofluid. 2014, 17, 1–52. [Google Scholar] [CrossRef]
- Hung, S.H.; Lin, Y.H.; Lee, G.B. A microfluidic platform for manipulation and separation of oil-in-water emulsion droplets using optically induced dielectrophoresis. J. Micromech. Microeng. 2010, 20, 045026. [Google Scholar] [CrossRef]
- Zhao, K.; Li, D. Tunable Droplet Manipulation and Characterization by ac-DEP. ACS Appl. Mater. Interfaces 2018, 10, 36572–36581. [Google Scholar] [CrossRef]
- Chen, X.; Chang, C.L.; Hui, L. Microfluidic chip for blood cell separation and collection based on crossflow filtration. Sens. Actuators B Chem. 2008, 130, 216–221. [Google Scholar] [CrossRef]
- Pangu, G.D.; Feke, D.L. Acoustically aided separation of oil droplets from aqueous emulsions. Chem. Eng. Sci. 2004, 59, 3183–3193. [Google Scholar] [CrossRef]
- Ding, X.; Lin, S.S.; Kiraly, B.; Yue, H.; Li, S.; Chiang, I.; Shi, J.; Benkovic, S.J.; Huang, T.J. On-chip manipulation of single microparticles, cells, and organisms using surface acoustic waves. Proc. Natl. Acad. Sci. USA 2012, 109, 11105–11109. [Google Scholar] [CrossRef] [PubMed]
- Chen, Y.; Nawaz, A.A.; Zhao, Y.; Huang, P.; Mccoy, J.; Levine, S.; Wang, L.; Huang, J.T. Standing surface acoustic wave (SSAW)-based microfluidic cytometer. Lab Chip 2014, 14, 916–923. [Google Scholar] [CrossRef] [PubMed]
- Ogawa, T.; Kiyama, Y.; Kanda, T.; Suzumori, K.; Ono, T. An Ultrasonic vibration device for emulsion concentration. In Proceedings of the ACTUATOR14 14th International Conference on New Actuators & 8th International Exhibition on Smart Actuators and Drive Systems, Bremen, Germany, 23–25 June 2014; pp. 402–405. [Google Scholar]
- Onishi, K.; Kanda, T.; Ogawa, N.; Suzumori, K. Study of Droplet Manipulation Condition in Droplet Manipulation Device Using Ultrasonic Vibration. IEEJ Trans. Sens. Micromach. 2016, 136, 348–356. [Google Scholar] [CrossRef]
- Kanda, T.; Seo, S.; Ohara, Y.; Wakimoto, S. A Microchannel Device for Droplet Classification by Manipulation Using Piezoelectric Vibrator. In Proceedings of the 18th International Conference on New Actuator Systems and Applications (Actuator 2022), Mannheim, Germany, 28–30 June 2022; pp. 272–273. [Google Scholar]
- Guo, J.; Li, J.L.; Chen, Y.; Yeo, L.Y.; Friend, J.R.; Kang, Y. RF activated standing surface acoustic wave for on-chip particle manipulation. IEEE Trans. Microw. Theory Tech. 2014, 62, 1898–1904. [Google Scholar] [CrossRef]
Figure 1.
Finite element method simulation result of pressure distribution in a cross-section of a microchannel Simulation results of pressure distribution. (a) Device configuration. (b) Simulation result.
Figure 1.
Finite element method simulation result of pressure distribution in a cross-section of a microchannel Simulation results of pressure distribution. (a) Device configuration. (b) Simulation result.

Figure 2.
Relationship between acoustic pressure and particle size required to focus polystyrene particle.
Figure 2.
Relationship between acoustic pressure and particle size required to focus polystyrene particle.

Figure 3.
Overall view of droplet manipulation device; (a) Surface. (b) backside.

Figure 4.
Configuration of droplet manipulation device.

Figure 5.
Results of admittance measurements for droplet manipulation device.

Figure 6.
Relationship between applied voltage and vibration velocity.

Figure 7.
Schematic of the droplet manipulation experiment.

Figure 8.
Photographs of the results of polystyrene particle manipulation experiment when the radius of polystyrene particle was 10 µm; (a) Without vibration. (b) With vibration.
Figure 8.
Photographs of the results of polystyrene particle manipulation experiment when the radius of polystyrene particle was 10 µm; (a) Without vibration. (b) With vibration.

Figure 9.
Photographs of experimental results of particle manipulation when the flow rate was 100 µL/min; (a) µm polystyrene particles. (b) µm polystyrene particles.
Figure 9.
Photographs of experimental results of particle manipulation when the flow rate was 100 µL/min; (a) µm polystyrene particles. (b) µm polystyrene particles.

Figure 10.
Photographs of experimental results of polystyrene particle manipulation when polystyrene particle was 1.0 µm and the flow rate was 0 µL/min; (a) Without vibration. (b) With vibration.
Figure 10.
Photographs of experimental results of polystyrene particle manipulation when polystyrene particle was 1.0 µm and the flow rate was 0 µL/min; (a) Without vibration. (b) With vibration.

Figure 11.
Relationship between focusing time and radius of polystyrene particles.

Figure 12.
Relationship between droplet size and travel distance.

Figure 13.
Overview of droplet manipulation using microchannels; (a) Wituout constriction component. (b) With constriction component.
Figure 13.
Overview of droplet manipulation using microchannels; (a) Wituout constriction component. (b) With constriction component.

Figure 14.
Relationship between time and travel distance with constriction component.

Figure 15.
Microchannel plate of droplet manipulation device with constriction component; (a) Overall view of plate. (b) Closeup view of the constriction section of the channel plate.
Figure 15.
Microchannel plate of droplet manipulation device with constriction component; (a) Overall view of plate. (b) Closeup view of the constriction section of the channel plate.

Figure 16.
Schematic of droplet Manipulation Experiments.

Figure 17.
Droplet manipulation in microchannels; (a) Without vibration. (b) With vibration.

Figure 18.
Droplet size distribution of emulsion generated by Y-type microchannel.

Figure 19.
Droplet size distribution of emulsion collected without constriction component; (a) Collected from both side channels. (b) Collected from the central channel.
Figure 19.
Droplet size distribution of emulsion collected without constriction component; (a) Collected from both side channels. (b) Collected from the central channel.

Figure 20.
Droplet size distribution of emulsion with constriction; (a) Collected from both side channels. (b) Collected from the central channel.
Figure 20.
Droplet size distribution of emulsion with constriction; (a) Collected from both side channels. (b) Collected from the central channel.

Figure 21.
Comparison of droplet diameters in recovered emulsions; (a) Without constriction component. (b)With constriction component.
Figure 21.
Comparison of droplet diameters in recovered emulsions; (a) Without constriction component. (b)With constriction component.


Table 1.
Parameter values for the estimation of the relationship between the pressure value required to focus polystyrene particles and the particle size.
Table 1.
Parameter values for the estimation of the relationship between the pressure value required to focus polystyrene particles and the particle size.
| Experimental Condition and Physical Property | Value | Unit |
|---|---|---|
| Frequency | 3.14 | MHz |
| Wavelength | 3.95 × 10⁻⁴ | m |
| Density of solvent | 853.3 | |
| Density of particles | 940 | |
| Viscosity of solvent | 1.4 × 10⁻³ | |
| Sound velocity of solvent | 1252.8 | m/s |
| Sound velocity of particles | 2340 | m/s |
| Flow rate | 100 | µL/min |
| Cross-sectional area of flow channel | 0.08 |
Table 2.
Parameters used to derive travel distance.
| Experimental Condition | Value | Unit |
|---|---|---|
| Pressure in the microchannel | 1.54 × 10⁵ | Pa |
| Frequency | 2.25 | MHz |
| Wavelength | 6.65 × 10⁻⁴ | m |
Table 3.
Physical properties of substances used.
| Material | Physical Property | Value | Unit |
|---|---|---|---|
| n-dodecane | Density | 750 | kg/m3 |
| Speed of sound | 1280 | m/s | |
| 1 wt% SDSsolution | Density | 1000 | |
| Speed of sound | 1500 | m/s | |
| Viscosity | 8.9 × 10⁻⁴ |
Disclaimer/Publisher’s Note: The statements, opinions and data contained in all publications are solely those of the individual author(s) and contributor(s) and not of MDPI and/or the editor(s). MDPI and/or the editor(s) disclaim responsibility for any injury to people or property resulting from any ideas, methods, instructions or products referred to in the content. |
© 2024 by the authors. Licensee MDPI, Basel, Switzerland. This article is an open access article distributed under the terms and conditions of the Creative Commons Attribution (CC BY) license (https://creativecommons.org/licenses/by/4.0/).
Share and Cite
MDPI and ACS Style
Fujioka, A.; Seo, S.; Kanda, T.; Wakimoto, S.; Yamaguchi, D. A Microchannel Device for Droplet Classification by Manipulation Using Piezoelectric Vibrator. Actuators 2024, 13, 95. https://doi.org/10.3390/act13030095
AMA Style
Fujioka A, Seo S, Kanda T, Wakimoto S, Yamaguchi D. A Microchannel Device for Droplet Classification by Manipulation Using Piezoelectric Vibrator. Actuators. 2024; 13(3):95. https://doi.org/10.3390/act13030095
Chicago/Turabian StyleFujioka, Ao, Shoko Seo, Takefumi Kanda, Shuichi Wakimoto, and Daisuke Yamaguchi. 2024. "A Microchannel Device for Droplet Classification by Manipulation Using Piezoelectric Vibrator" Actuators 13, no. 3: 95. https://doi.org/10.3390/act13030095
Note that from the first issue of 2016, this journal uses article numbers instead of page numbers. See further details here.