Experimental Study on Damage Identification of Nano-SiO2 Concrete Filled GFRP Tube Column Using Piezoceramic Transducers

1
College of Technology & Engineering, Yangtze University, Jingzhou 434020, China
2
College of Civil Engineering, Fuzhou University, Fuzhou 350116, China
*
Author to whom correspondence should be addressed.
Sensors 2020, 20(10), 2883; https://doi.org/10.3390/s20102883
Submission received: 28 March 2020
/
Revised: 29 April 2020
/
Accepted: 12 May 2020
/
Published: 19 May 2020
(This article belongs to the Special Issue Damage Detection of Structures Based on Piezoelectric Sensors)
Abstract
:This paper proposes a new approach to damage detection of nano-SiO2 concrete-filled glass fiber reinforced polymer (GFRP) tube column using piezoceramic transducers. Stress waves are emitted and received by a pair of piezoceramic transducers embedded in the concrete-filled GFRP tube, and the energy and damage indices at different levels of loading in the tube are obtained by wavelet packet to evaluate the damage degree of GFRP tube nano-SiO2 concrete column. Through the experimental studies, the effects of different nano-SiO2 contents, concrete grades, and superplasticizer on the damage were analyzed to gain load–displacement curves, load–energy index curves, and load–damage index curves. The results show that the wave method can be adopted to monitor the damage of GFRP tube nano-SiO2 concrete column. The specimens with 3% nano-SiO2 content have the smallest energy change rate, indicating that adding 3% nano-SiO2 content into concrete can effectively delay the development of damage. After the addition of superplasticizer, with the increase in the strength grade of concrete, the cracks in the specimen tend to develop slowly, and therefore the specimens have a stronger resistance to damage. The damage of the specimens with the nano-SiO2 content of 1% appeared the latest, while the damage without the nano-SiO2 specimen appeared the fastest. The experimental results show that this method can better monitor the damage of the Nano-SiO2 concrete in the glass fiber reinforced polymer (GFRP) tube.
1. Introduction
Nano-SiO2 has been widely used in optics, electronics, biomedicine, building materials and photonic crystals because of its unique physical, chemical and structural characteristics due to its small size [1,2,3]. The fabrication, characterization, and application of cobalt ferrite (CoFe2O4 MNPs) nanocatalysts (CF-MNPs) in organic reactions were presented by Kaz et al. [4]. The studies on nanotechnology in drilling, reservoir protection, sensing and imaging techniques in oil and gas migration and accumulation were summarized by Zhang et al. [5]. The preparation method of CuO-ZnO nanocomposite was mentioned by Das et al. [6]. Antibacterial potential of nanocomposite-based materials was proposed by Kar et al. [7]. The characteristics and preparation of titanium dioxide nano photocatalysts were presented by Ramos-Delgado et al. [8]. At present, the research on nano-SiO2 concrete has become more and more extensive. The mechanical properties and durability of concrete can be improved by adding appropriate amounts of nano-SiO2 [9,10,11].
Traditionally, concrete is often reinforced with steel rebars or integrated with other steel components, such as tubes [12,13,14] and plates [15,16]. Since steel components are subject to corrosion [17,18,19], fiber reinforced polymer (FRP) materials, which have strong corrosion resistance [20,21], are increasingly used with concrete structures in different forms [22,23,24]. Among them, a glass fiber reinforced polymer (GFRP) tube concrete column is a composite structure formed by pouring concrete into GFRP tube. Compared with other restrained concrete members, a GFRP tube concrete column has many advantages such as strong bearing capacity, good integrity, high ductility, good corrosion resistance, and easy construction [25], thus having been widely applied to pile foundation structure, load-bearing column structure and bridge pier structure in civil engineering. However, due to the factors of environment and service life, cracks in concrete can seriously affect the safety of the structure. Hence, it is of immense significance to monitor the health of concrete columns. In recent years, piezoceramic materials have been actively used in structural health monitoring (SHM) owing to their high sensitivity [26,27,28], fast response [29], dual functions of sensing and actuating [30], and energy harvesting [31], and piezoceramic transducers have the capacity to generate and sense stress waves. Since stress waves, including ultrasonic waves, are important tools in SHM such as active sensing methods [32,33,34], piezoceramics-based SHM and damage detection are receiving increasing attention [35,36,37].
Currently, many scholars have conducted extensive research on the health monitoring of civil structures using lead zirconate titanate (PZT) transducers [38,39,40,41]. PZT is a type of piezoceramic material with strong piezoelectric effect. Kar et al. [42] conducted an experimental study for the damage assessment of concrete reinforcing bars using piezoelectric sensors. Song et al. [43,44] developed novel PZT-based multi-functional smart aggregates, which can be embedded in concrete structures. Furthermore, Song et al. conducted exploratory work on SHM of concrete structures using the smart aggregate technology [45,46]. Feng et al. conducted research on using embedded PZT transducers for concrete early age hydration monitoring [47]. In addition, Feng et al. applied smart aggregates to pile damage detection [48]. Jiang et al. investigated debonding between a FRP bar and concrete structures using PZT transducers [49]. PZT transducers are also used to monitor the grouting quality of the tendon duct of prestressed concrete beams [50]. Kong and Song compared the performances of shear and compressive smart aggregates [51]. Kong et al. monitored the cyclic cracks of a concrete structure using embedded PZT transducers [52]. Ma et al. [53] contrasted the measured signal amplitude of the piezoelectric sensor under harmonic excitation and the wavelet packet energy under frequency-sweep excitation at various grades of load, defined corresponding damage indices, and realized the effective monitoring of the damage status of bamboo beam members during loading. Xu et al. [54] fabricated embedded piezoelectric functional elements from piezoceramic plates and pre-embedded them in the specimens of concrete-filled steel tubular column with local interface damage, so as to monitor the bonding quality of the interface between the concrete and the steel tube wall. Meng et al. [55] proposed a statistical algorithm for the damage identification of concrete structures using piezoelectric smart sensors, in order to fulfill dynamic monitoring and damage evaluation in the specimen damage and destruction process. Yi et al. [56] adopted ANSYS simulation to study the damage identification of reinforced concrete structures based on PZT-guided wave method.
Even so, few scholars have studied the damage identification of GFRP tube nano-SiO2 concrete columns. When the GFRP tube nano-SiO2 concrete column is in the natural environment, the concrete in the GFRP tube will inevitably produce tiny cracks under the influence of loads and various emergencies (earthquake, typhoon, etc). As time goes on, the continuous increases in such cracks will greatly reduce the strength and stiffness of the structure, causing great harm to the whole structure. Hence, this paper intended to systematically study the damage identification of GFRP tube nano-SiO2 concrete columns by the wave method, perform wavelet packet analysis to calculate the stress wave energy before and after concrete column damage, and then gain the relative damage index to reveal the damage of the concrete in GFRP tube. Moreover, the influences of concrete grade and nano-SiO2 content on the damage of GFRP tube nano-SiO2 concrete column were analyzed, and the appropriate content of nano-SiO2 in concrete was suggested, which has not only profound theoretical importance but also significant engineering application value for the application of piezoceramics in the field of structural health monitoring.
2. Experiment Principle
2.1. Piezoelectric Effect of Piezoelectric Materials
The piezoceramic material refers to a crystalline material that generates charge transfer on the surfaces of both ends when subjected to pressure, as well as being a kind of smart material with the characteristics of self-perception, self-diagnosis, and self-repair. All piezoelectric materials have a positive piezoelectric effect and a negative piezoelectric effect. The positive piezoelectric effect refers to the fact that when a piezoelectric material deforms because of mechanical force applied, it can cause the internal positive and negative charge centers to move relative each other and cause polarization. As a result, charges with opposite signs appear on both surfaces of the material, and the charge density is proportional to the external force. The polarity of the charge changes with the direction of the external force, converting mechanical energy into electrical energy. Piezoceramic materials can be made into sensors using the positive piezoelectric effect, which have the advantages of fast response speed, wide frequency response range, and simple fabrication. The sensors can be used in health monitoring systems to detect structural damage sensitively and determine the location and size of the damage [57,58]. In contrast, the negative piezoelectric effect refers to the fact that the action of the electric field makes the materials deform and converts electrical energy into mechanical energy. A piezoelectric material can be made into a driver using the negative piezoelectric effect, which can be embedded in the structure or pasted on the surface of the structure as well as deform the structure or change the stress state of the structure [59].
2.2. Piezoceramic-Based Stress Wave Method
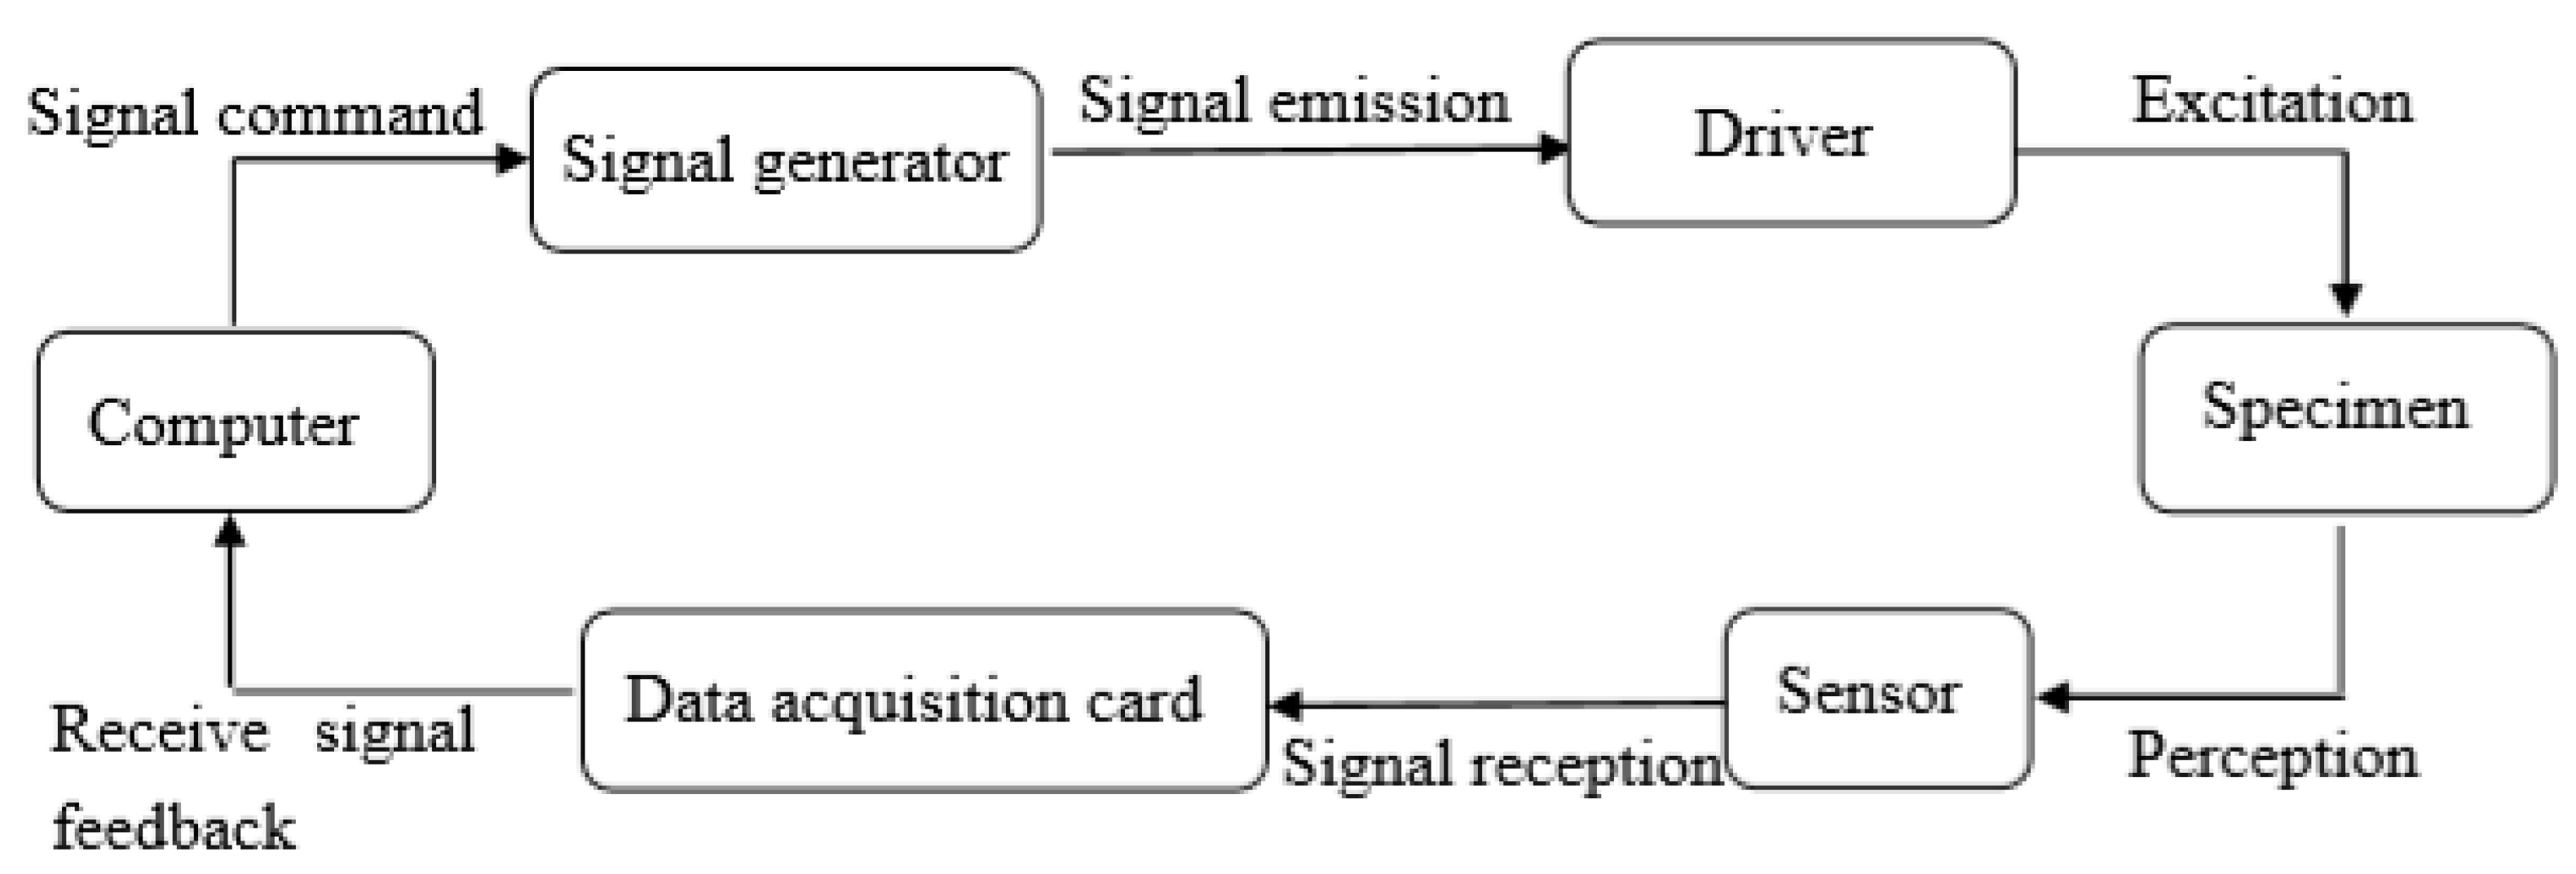
In the use of piezoelectric materials for structural health monitoring and damage identification technology [60,61], there are mainly two methods of active health monitoring and passive health monitoring. The active monitoring method based on piezoelectric materials primarily focuses on impedance method and wave method [62]. The impedance method generally attaches the piezoceramic plate to the structural surface, which is easily affected by environmental factors, making the monitoring inaccurate and the internal damage of the structure difficult to monitor. Conversely, the wave method has the advantages of large monitoring interval, abundant parameters for damage analysis, and strong resistance to disturbance, and therefore it has been widely applied in the field of health monitoring. The basic principle of the wave method is to fabricate a pair of piezoceramic sensors into smart aggregate and embed them inside the structure. One sensor acts as a driver and emits stress waves which are transmitted inside the structure under test. Another piezoelectric ceramic sensor at a certain distance receives the stress waves and converts the measured stress waves into electrical signals for output. Figure 1 shows the basic composition of a health monitoring system based on the wave method. By comparing the parameters of the signal before and after damage, including the amplitude, energy, phase, and time delay of the signal, the health of the structure can be judged, and the damage location and degree of the structure can be confirmed [63]. On the basis of the principle of stress wave propagation in concrete, the stress wave energy decreases with the increase in the damage, so that the real-time damage monitoring of the structure can be carried out through the change trend of the stress wave energy during the process of damage development.
2.3. Wavelet Packet-Based Damage Identification Approach
Traditional signal analysis and processing methods generally use Fourier analysis, which is a fixed window function analysis method. It plays an irreplaceable role in the processing of stationary random signals. However, a large number of real signals are non-stationary time-varying signals. Traditional Fourier analysis cannot reflect the characteristics of a signal, such as non-stationary, short duration, time-domain and frequency-domain localization. The traditional Fourier transform processing is not ideal for non-stationary signals and hence it has been improved, which promotes the development of wavelet theory analysis. The developed wavelet theory analysis can perform multi-resolution analysis and solve many difficult problems in Fourier analysis, so it is an excellent tool for time domain analysis and frequency analysis of signals. Wavelet analysis is a time-frequency localization analysis method which can change time and frequency window. As it only decomposes the low-frequency signal in the process of decomposition, and does not decompose the high-frequency signal, its frequency resolution decreases with the increase in frequency [64]. The wavelet packet theory analysis method developed on the basis of wavelet theory analysis makes up for the characteristic of the wavelet theory analysis that the high-frequency signal cannot be deeply decomposed, and realizes the complete analysis of the signal [65,66]. The wavelet packet theory analysis has been widely applied in the field of time-frequency signal analysis and processing, such as single-dimensional signal recognition, signal noise elimination, and feature extraction. Due to the existence of damage in the structure, the amplitude of the received signal is greatly attenuated, and the energy of the signal is a physical quantity proportional to the quadratic power of the amplitude of the signal, so the health status of the structure can be identified by the change of signal energy. In this experiment, damage indices based on the wavelet packet analysis method were used to evaluate the damage severity of the GFRP tube concrete column.
Firstly, the received original signal (Si) of the ith measurement was decomposed into 2n signal subsets with different frequency bands. The signal subset is Xi,j, where j is the frequency band (j = 1, 2, …, 2n), which can be expressed as:
In the above formula, m is the number of data samples that decompose the signal subset.
Xi,j = { Xi,j,1, . . . , Xi,j,m}
Secondly, the energy of the jth sub signal in each band of the N-layer signal can be defined as:
The total energy of the original signal Si after wavelet packet decomposition and reconstruction is defined as:
In structural health monitoring, the damage degree of structure or component is defined as damage index, which is a quantitative measure. Generally, the parameters related to the structural characteristic parameters, such as the elastic modulus and the energy of monitoring signal, are selected to judge the damage degree quantitatively [67]. Finally, the damage index can be defined as [68]:
where stands for the energy in the healthy state, and stands for the energy the in damaged state. The higher the damage index H is, the higher the damage degree of the specimen. When H = 0, it means that the specimen is not damaged, but when H = 1, it means that the specimen is completely destroyed.
3. Experiment Scheme
3.1. Specimen Design
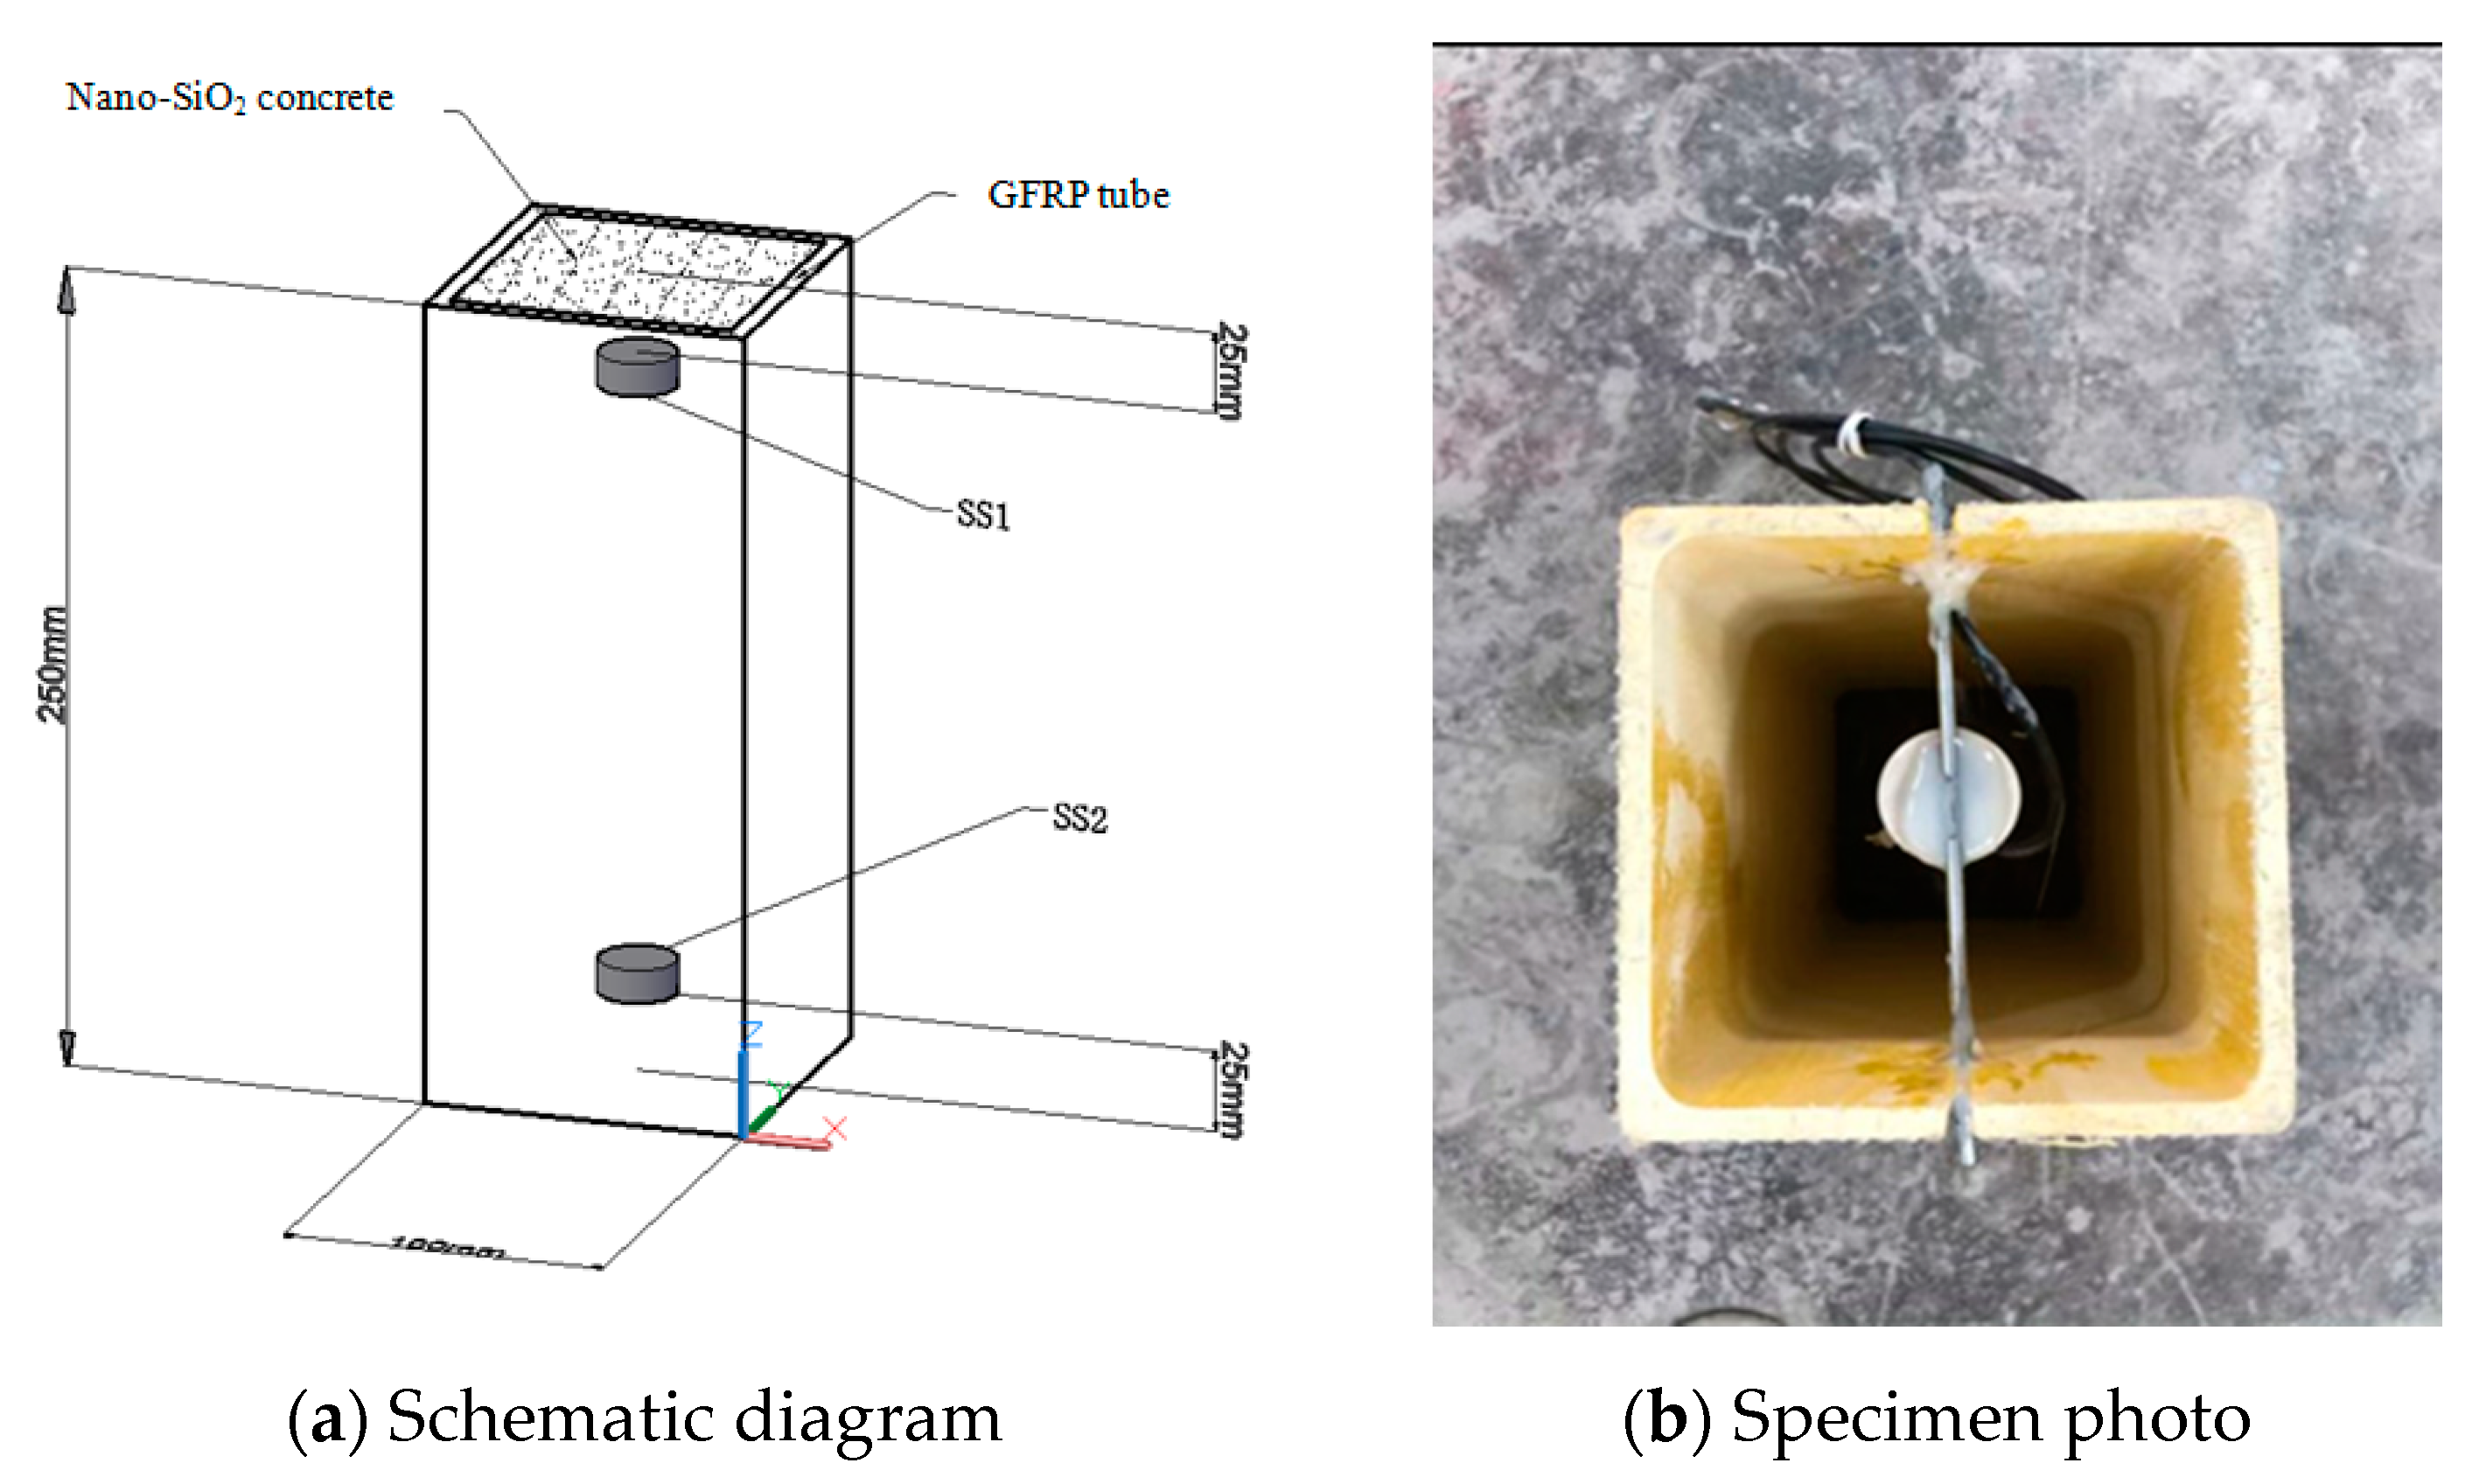
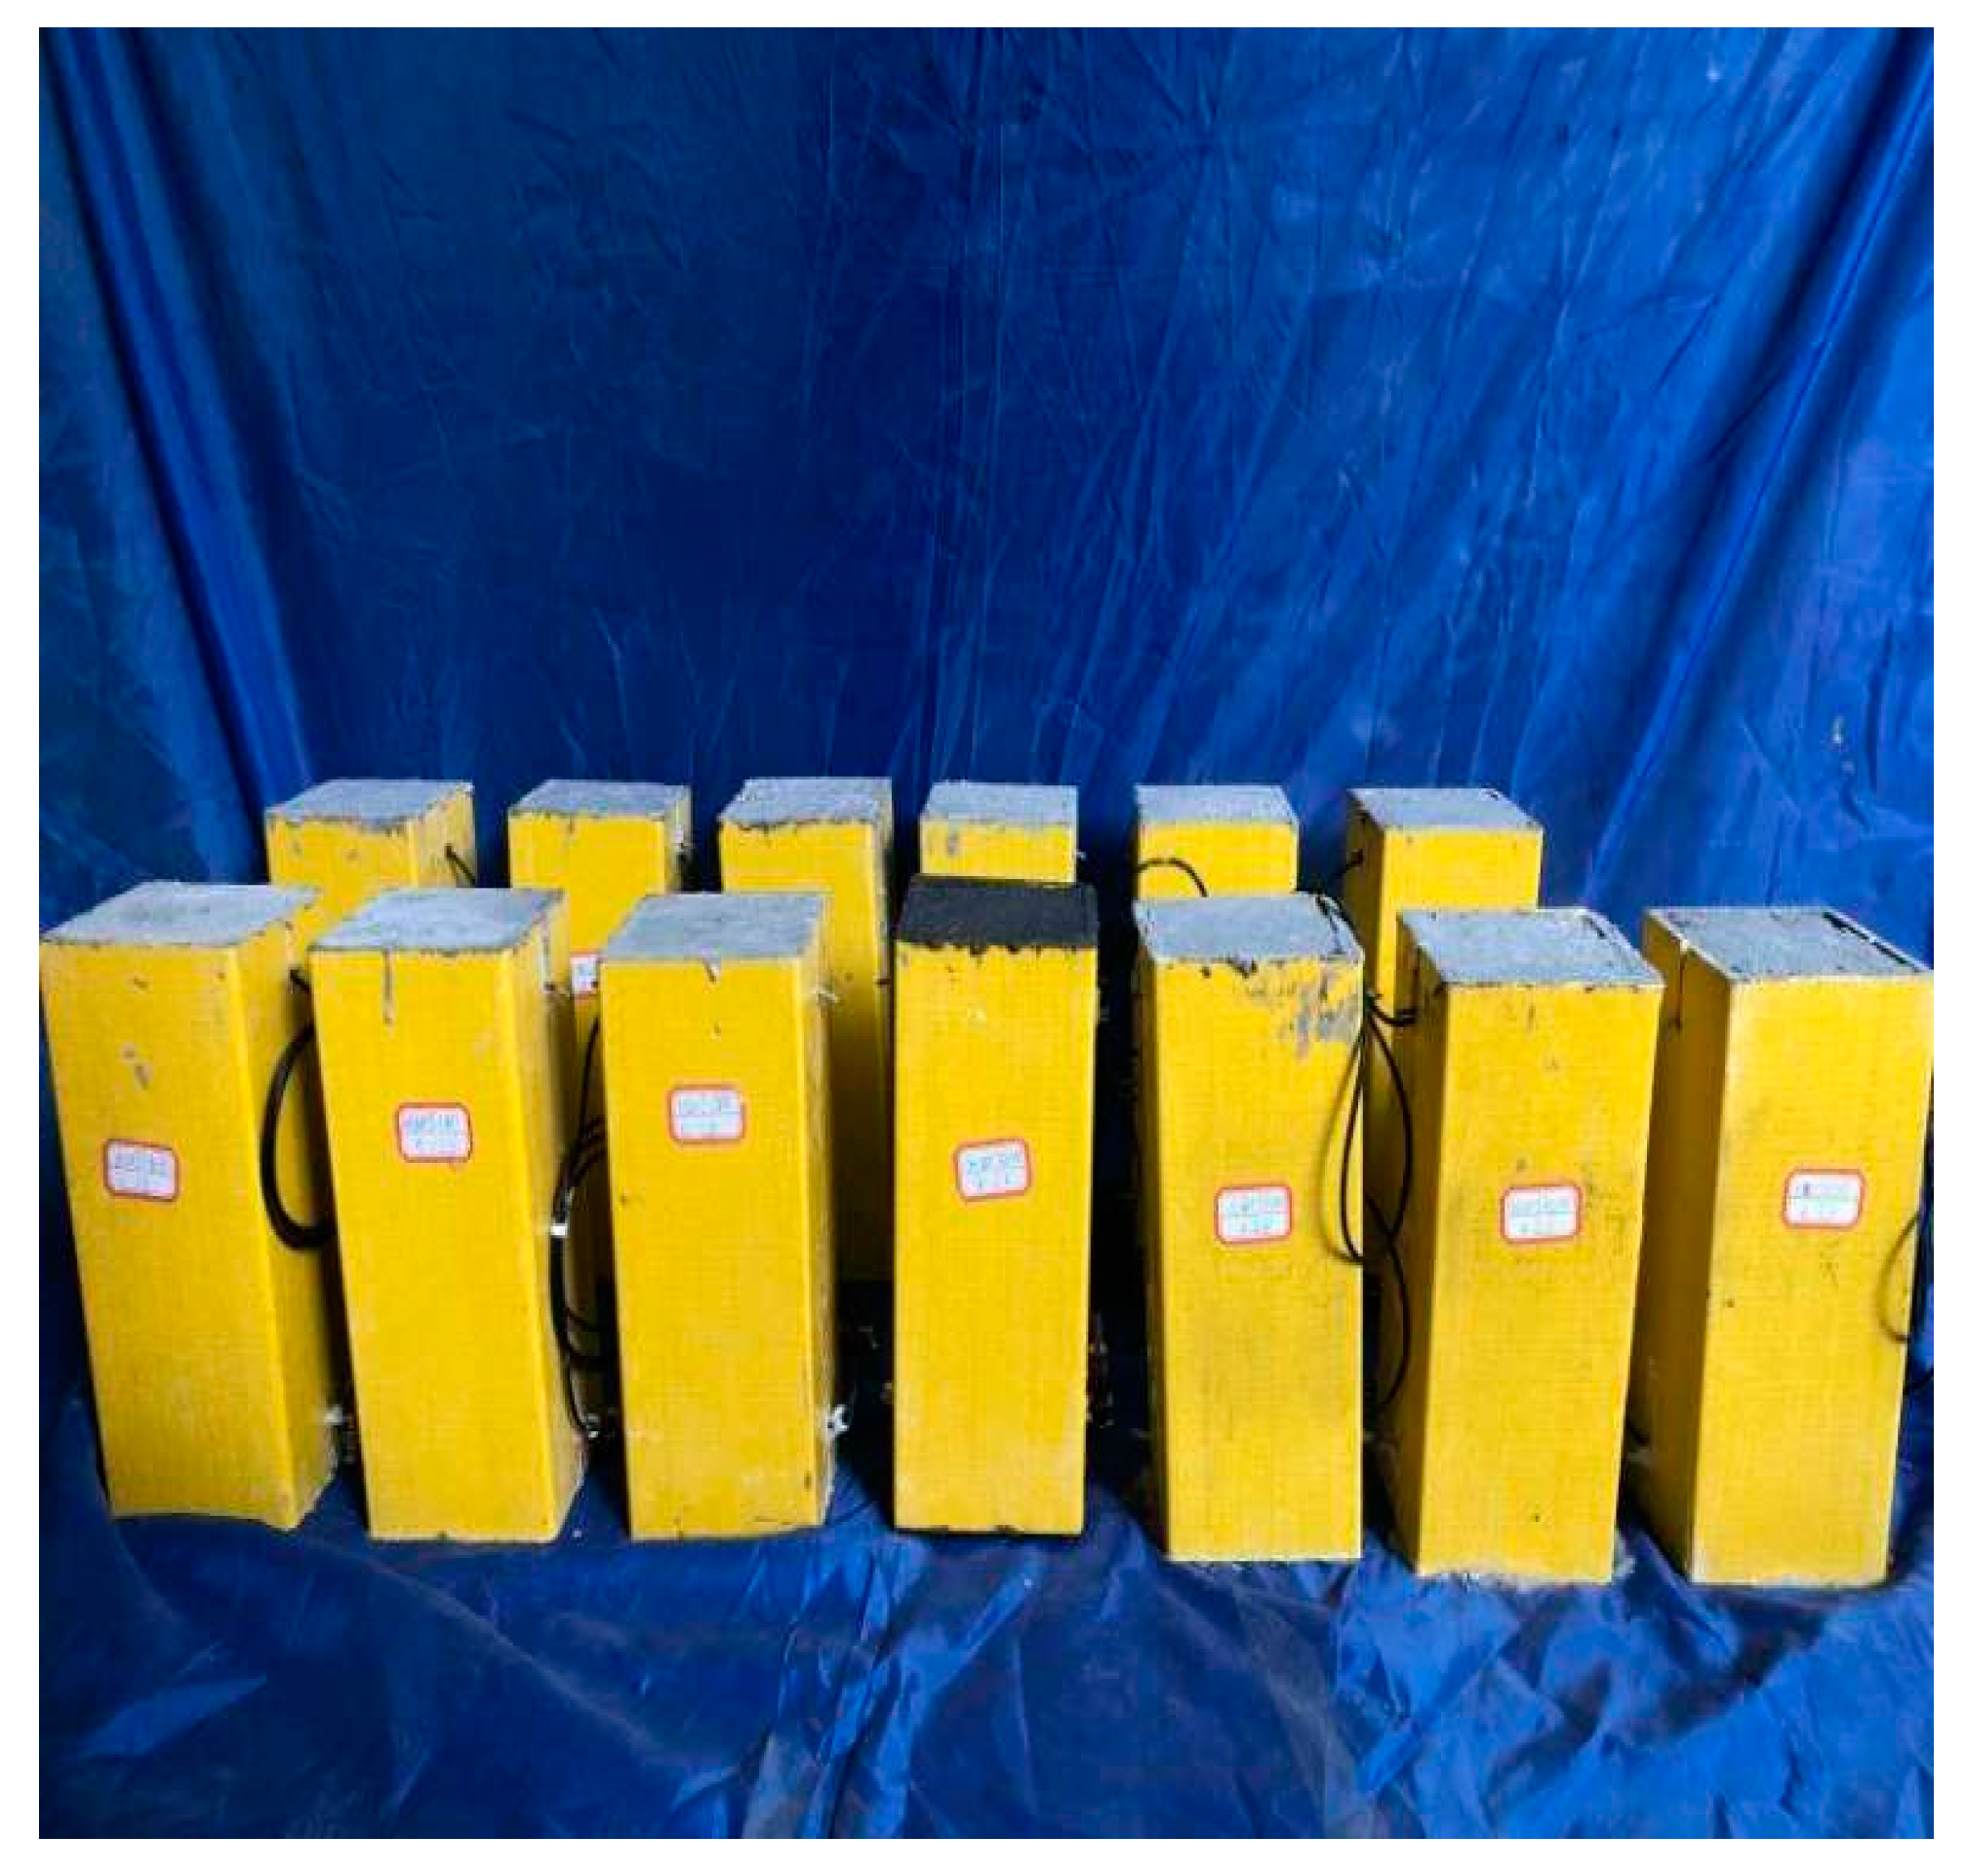
In this experiment, a total of 13 nano-SiO2 concrete filled GFRP tube column specimens were designed in line with different parameters, including concrete grade, nano-SiO2 content, and superplasticizer content, among which the concrete grades include C10, C20, C30, and C40, and the nano-SiO2 contents are 0%, 1%, and 3%, respectively. The content of the superplasticizer is 0.8%. The tested GFRP tube was produced by pultrusion process and made of E glass fiber and polyester resin, with a wall thickness (T) of 6 mm, a column height (H) of 250 mm, and a square cross section with side length (L) of 100 mm, as shown in Figure 2. The specimen number and specific parameters are shown in Table 1. Taking GC20-WRA1-NS1 as an example, G represents the GFRP tube, C20 represents a concrete grade of C20, WAR1 represents the superplasticizer included, and NS1 represents 1% of nano-SiO2 content. A pair of piezoceramic sensors were made into smart aggregate and embedded in the concrete of GFRP tube, of which one sensor, SS1, acted as an exciter to generate stress wave signals, and the other sensor, SS2, acted as a receiver to receive stress wave signals. The piezoceramic transducers are manufactured by Hengke Technology Co., Ltd., Qinhuangdao City, Hebei Province, China.
3.2. Material Properties
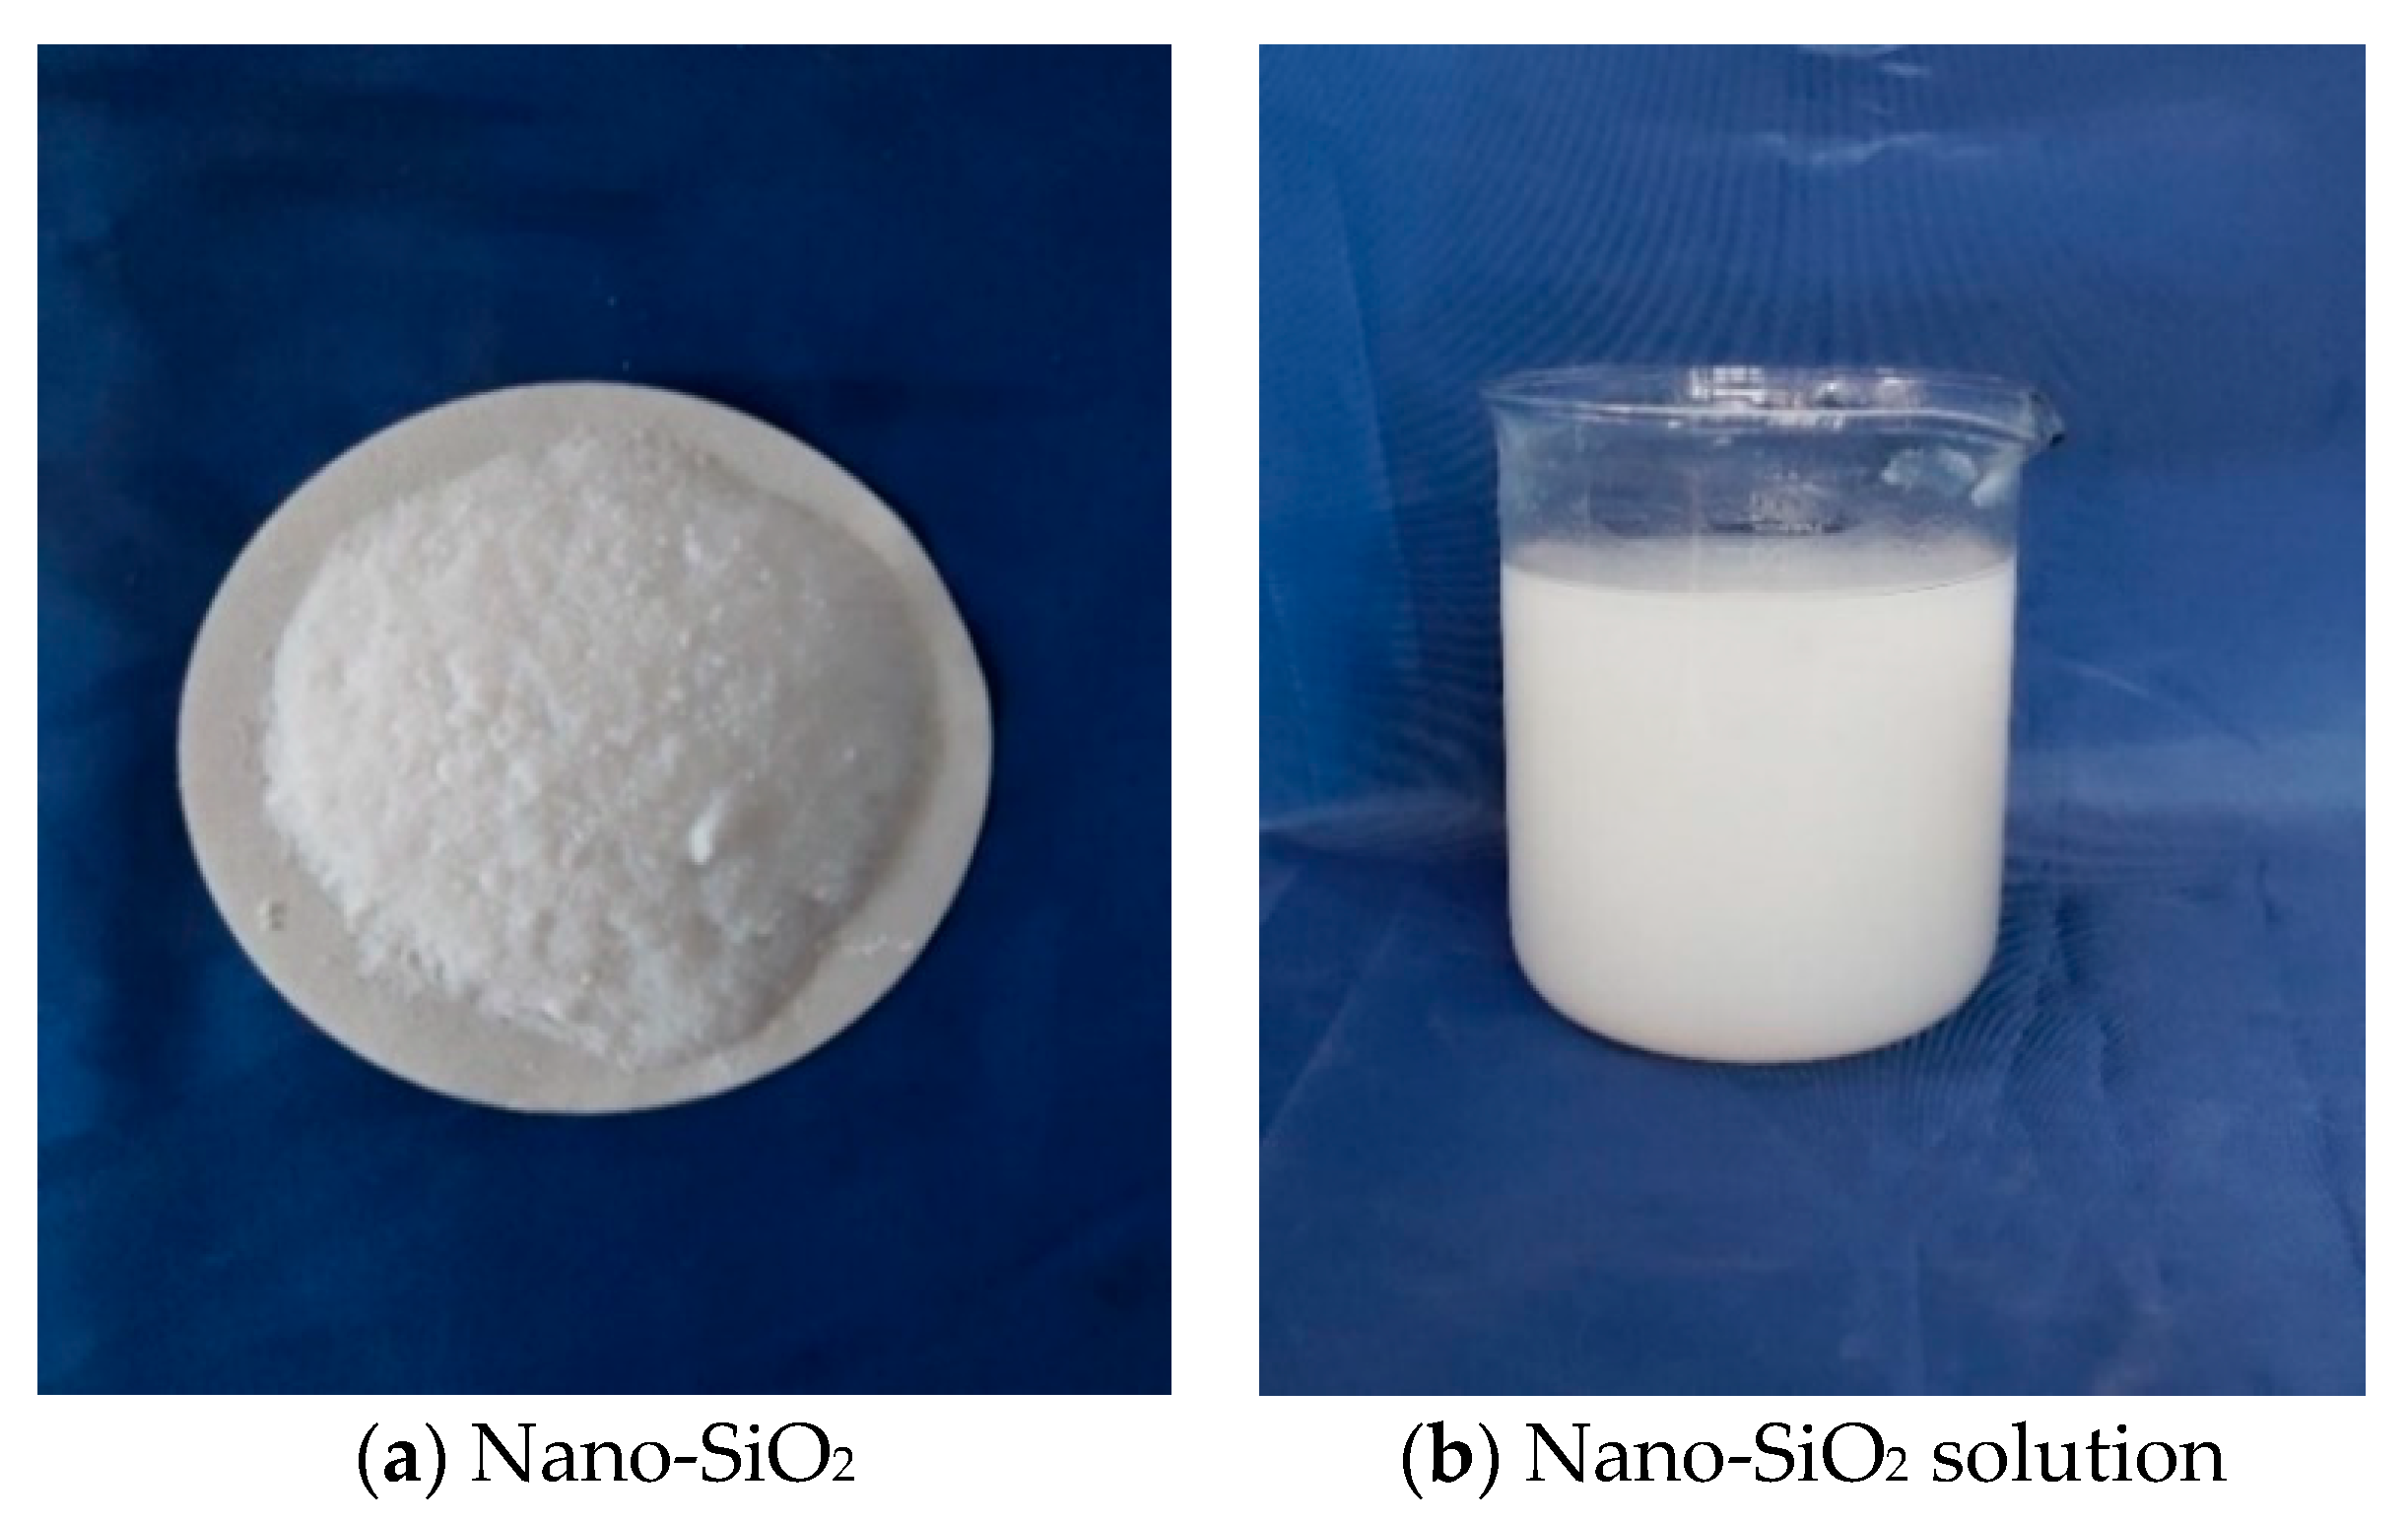
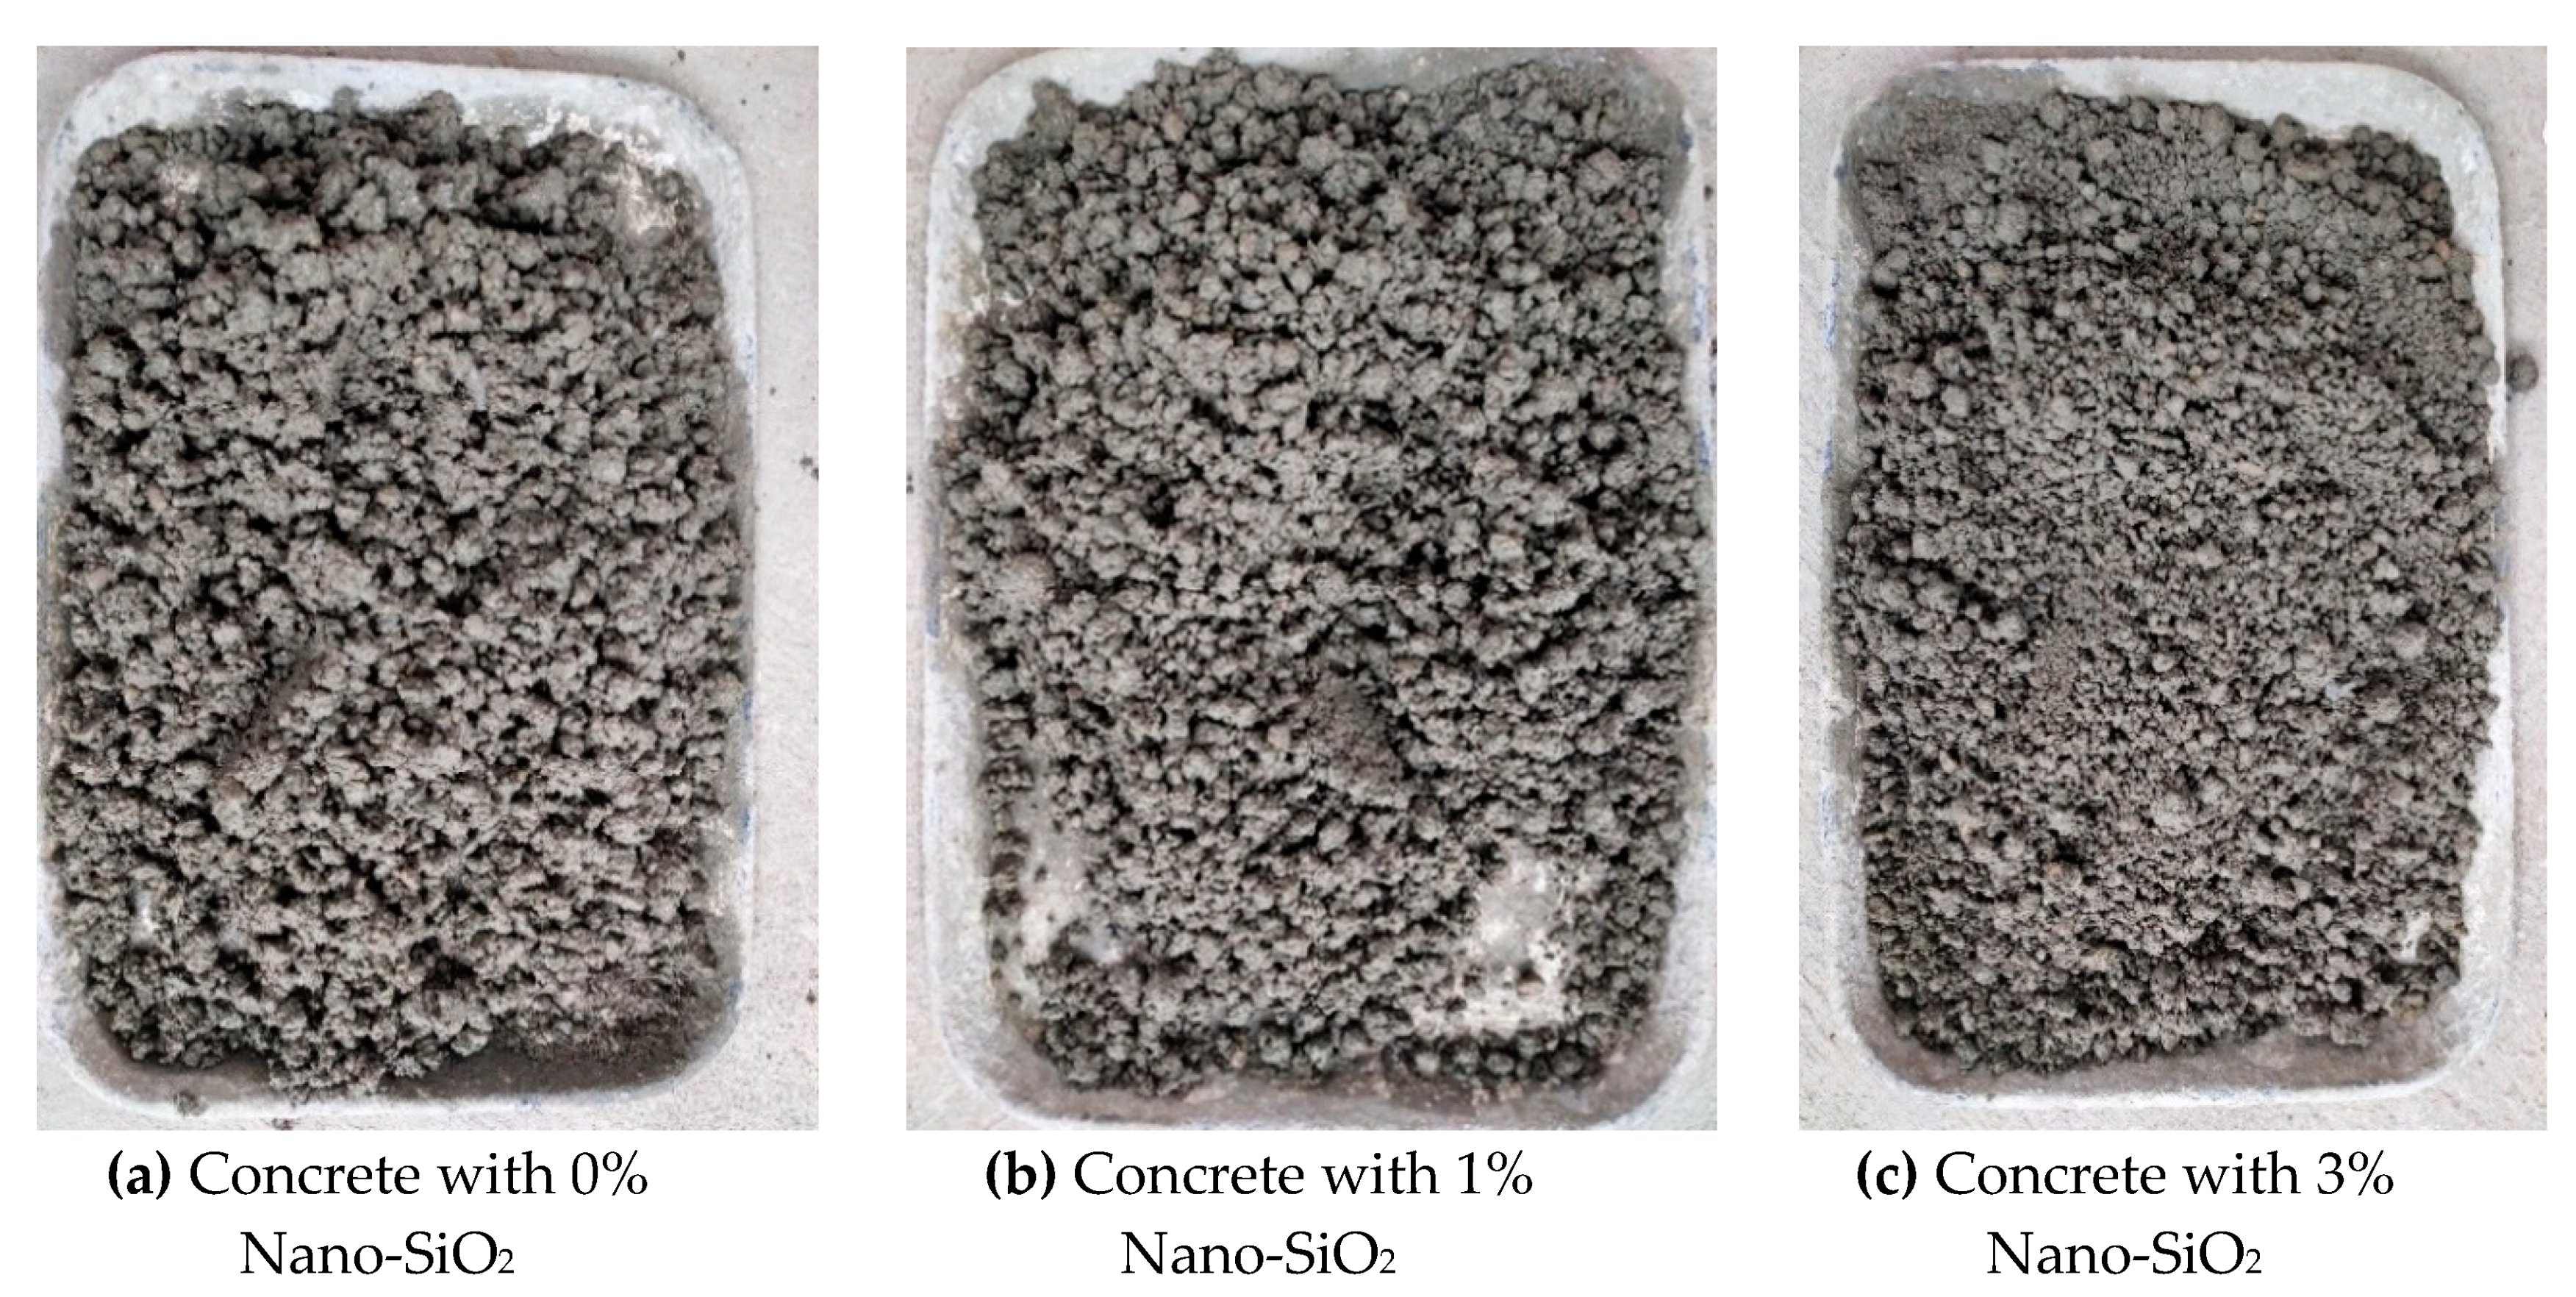
In accordance with GB/T1447-2005 “Test Method for Tensile Properties of Fiber Reinforced Plastics” [69] and GB/T1448-2005 “Test Method for Compressive Properties of Fiber Reinforced Plastics” [70], GFRP material properties were tested by taking standard specimens on the surface of GFRP tube, of which the average compressive strength was 118 MPa, the tensile strength was 550 MPa, and the specific gravity was 2000 kg/m3. The mechanical property test of concrete was sampled according to GB/T50080-2002 “Standard for Test Methods of Performance of Common Concrete Mixtures” [71] and configured in the school laboratory. The design codes were C10, C20, C30 and C40, respectively, and the standard cube blocks of 150 mm × 150 mm × 150 mm were cast with the configured concrete. The average compressive strengths of C10, C20, C30 and C40 measured on the testing machine were 17.3, 24.6, 32.5 and 41.3 MPa, respectively. The nano-SiO2 adopted hydrophilic gas phase nano-silica Hydrophilic-380, with a specific surface area of 380 mm2/g and a particle size of 7–40 nm. The nano-SiO2 powder and the prepared nano-SiO2 solution are shown in Figure 3. The concrete added with different nano-SiO2 is shown in Figure 4. As can be seen from Figure 4, the concrete mixed with nano-SiO2 becomes viscous with a poor fluidity. The superplasticizer was appropriately added so as to reduce the influence of poor fluidity. All experimental specimens are shown in Figure 5.
3.3. Loading and Testing Scheme Design
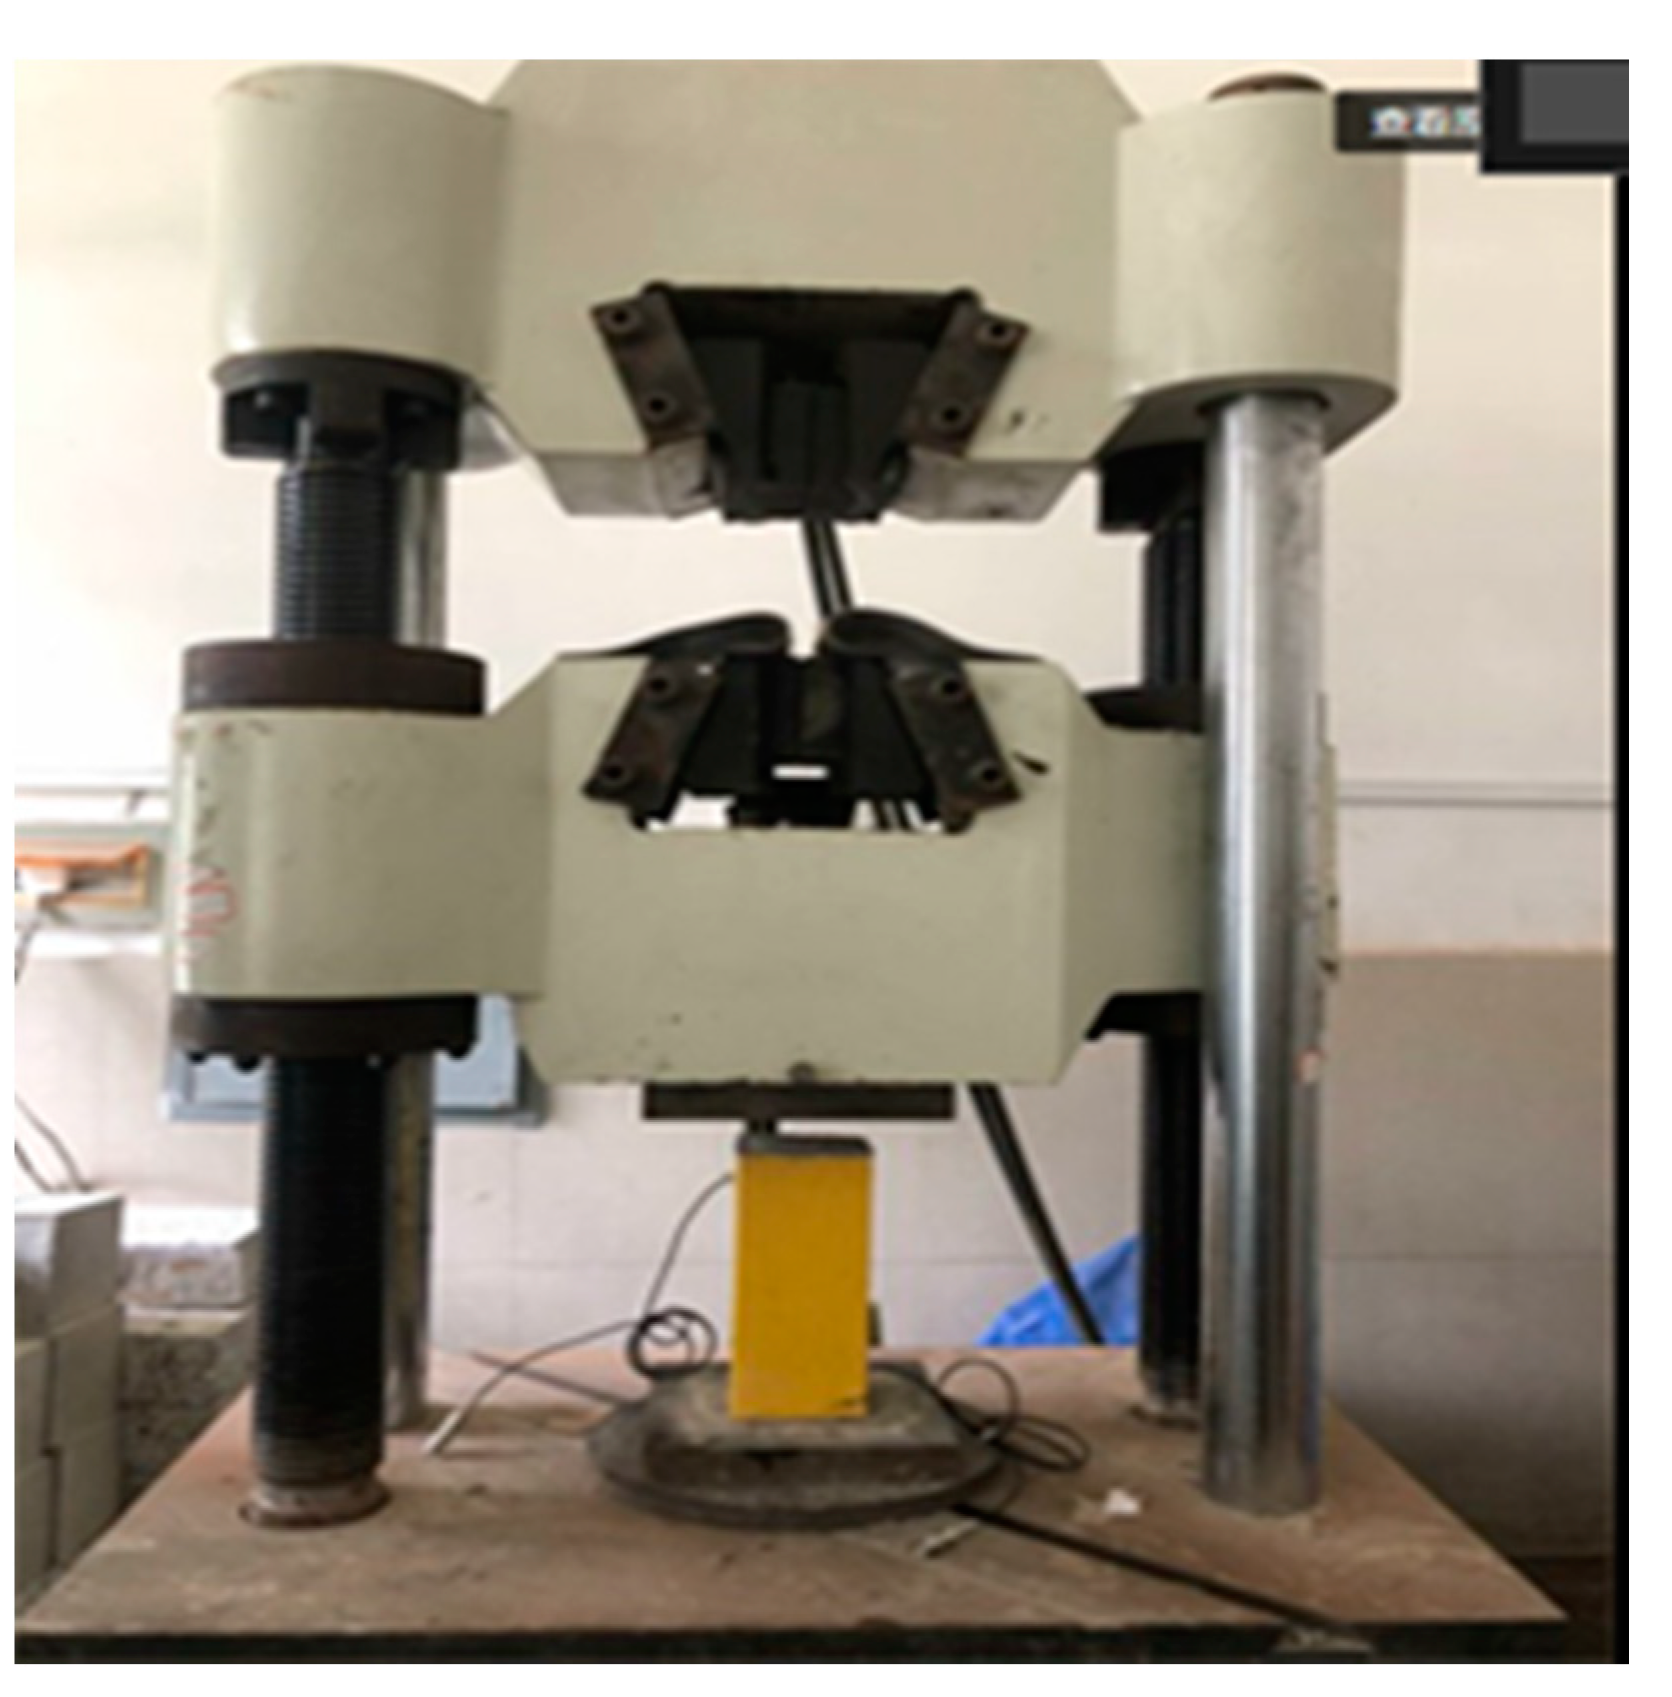
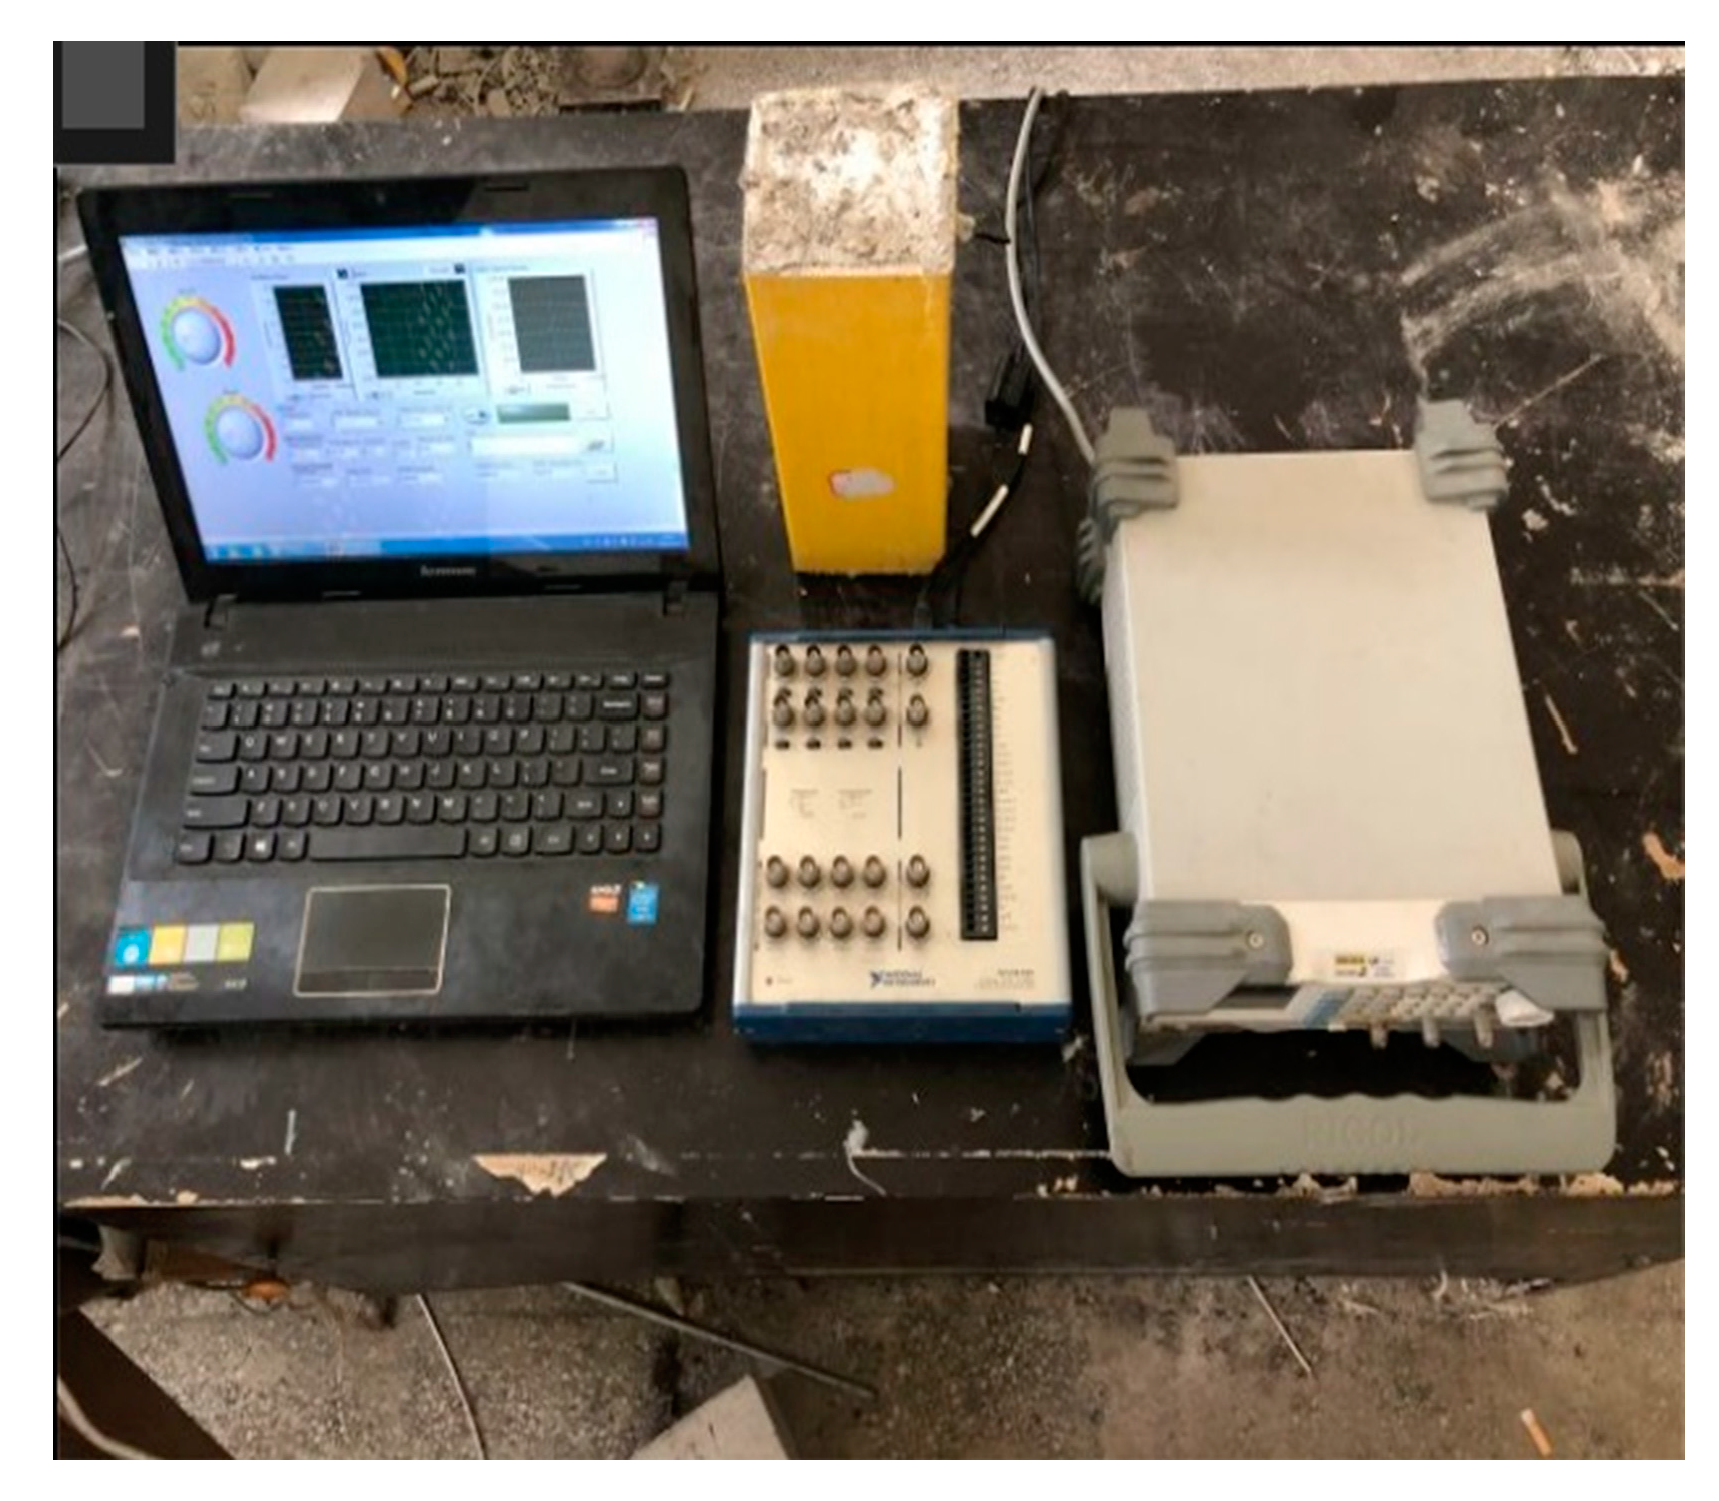
The cross-sections of the specimens were polished smooth prior to each test to prevent bias during loading. The 1000 kN electro-hydraulic servo universal testing machine was used for loading, and the displacement control loading mode was adopted, with a speed of 0.5 mm/min. The loading device is shown in Figure 6. The whole health monitoring system consisted of a signal generator, a signal acquisition and analysis system, and a computer, as shown in Figure 7. The signal generator, as the signal source, stimulated SS1 to generate stress waves. The maximum response frequency of the piezoelectric ceramic sensor reached 450 kHz. The signal acquisition and analysis system used a USB-6361 signal collector from the American NI company in order to collect the stress waves received by SS2, and finally stored data in the computer. The frequency sweep mode was put into use in the experiment, with a sweep signal amplitude of 10 V, a frequency range of 100 Hz–50 kHz, and a cycle of 1s. The signal collector obtained the stress waves transmitted in the concrete in real time, which could make the amount of data collected too large. Consequently, according to the loading feedback of the testing machine, the loading was recorded and the stress waves were collected every 30 s until all specimens were completely destroyed. The data collected from all specimens are shown in Table 2.
4. Experiment Results and Analysis
4.1. Failure Modes
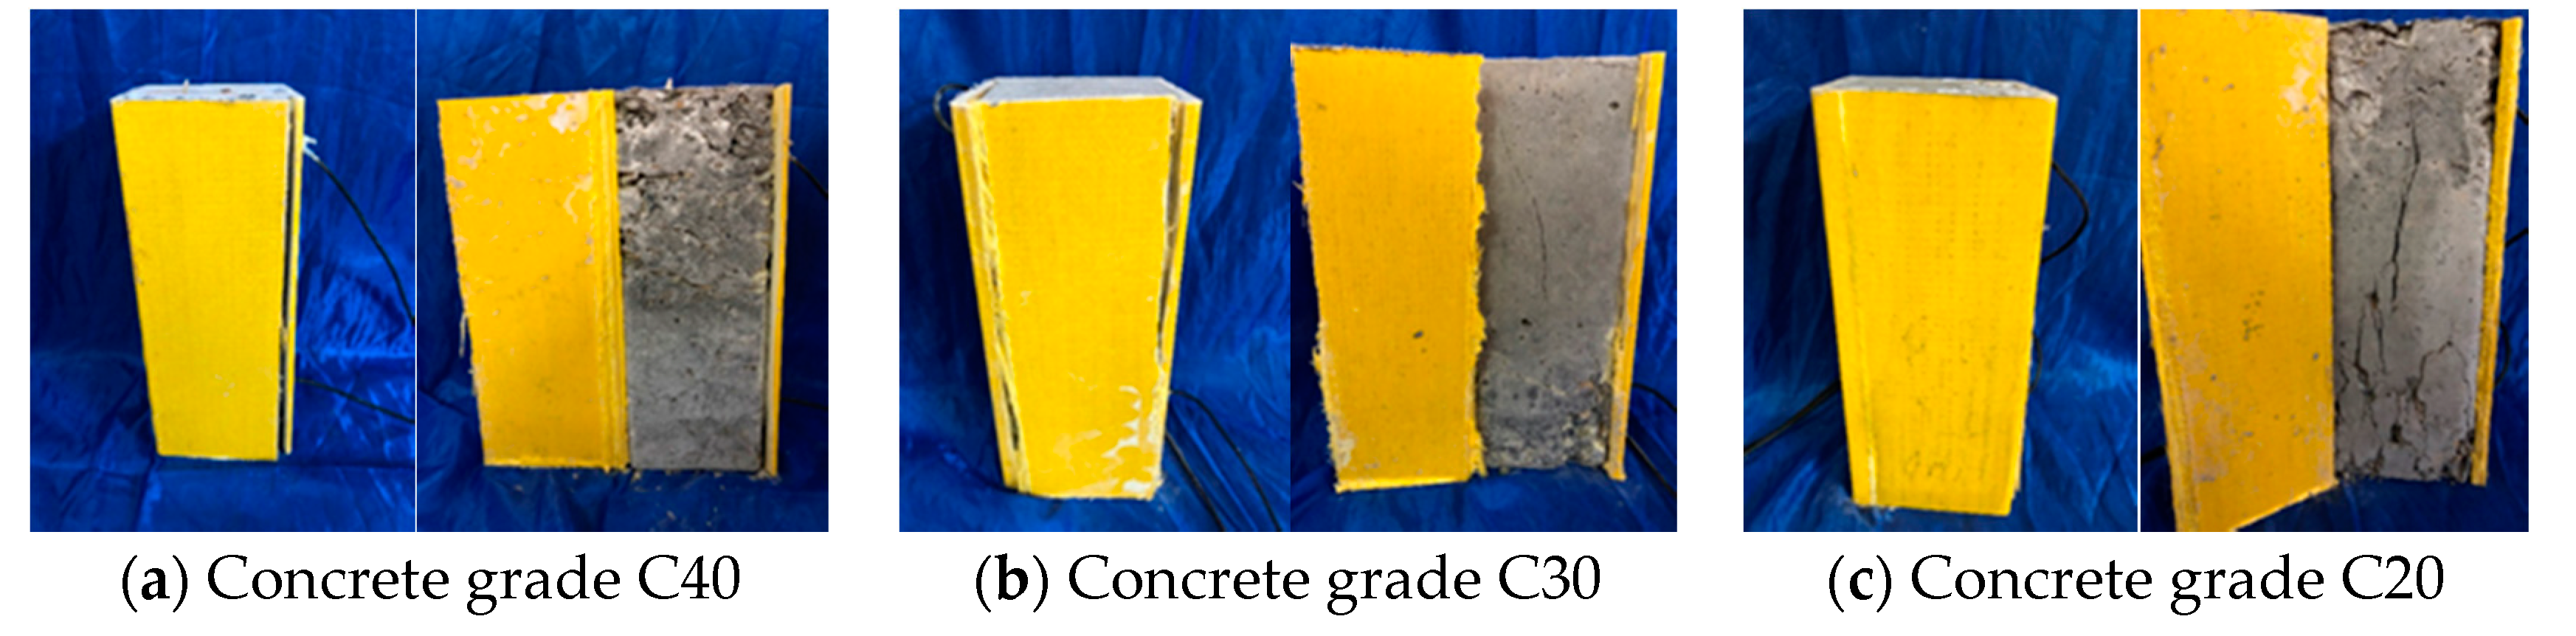
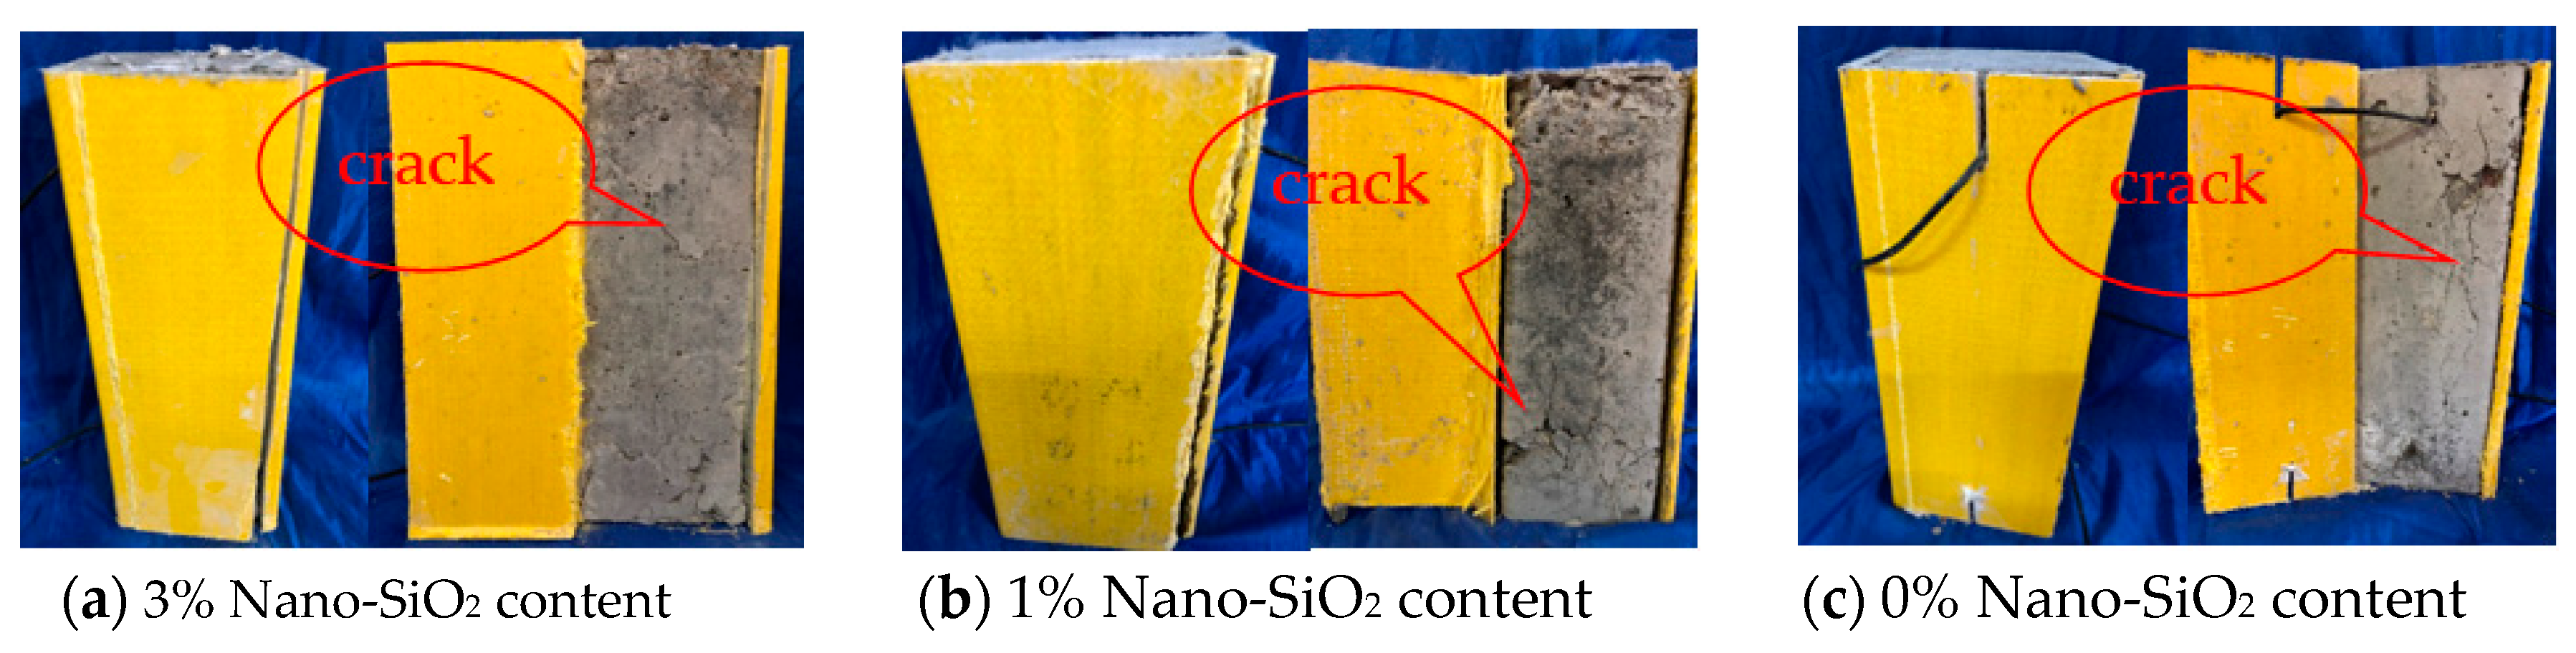
At the initial stage of loading, there was no obvious change in the GFRP tube wall. With the continuous increase in the load, the top end corner of the specimen was torn, accompanied by the hissing sound of glass fiber tearing; when approaching the ultimate load, the longitudinal tearing became more and more obvious until complete tearing. In order to further observe the damage of the concrete inside the GFRP tube, the torn side of the GFRP tube was stripped. Figure 8 shows the failure modes of specimens at different concrete grades. Figure 9 shows the failure modes of GFRP tube specimens with different nano-SiO2 contents.
It can be seen from Figure 8 and Figure 9 that the concrete columns inside the specimens had various degrees of damage, and longitudinal cracks appeared. The C40 concrete column had the smallest crack width and the smallest number of cracks, while the C20 concrete column had the largest crack width and the largest number of cracks; the concrete with 3% nano-SiO2 had the smallest crack width and the smallest number of cracks, whereas the concrete without nano-SiO2 had the largest crack width and the largest number of cracks.
4.2. Load–Displacement Curves
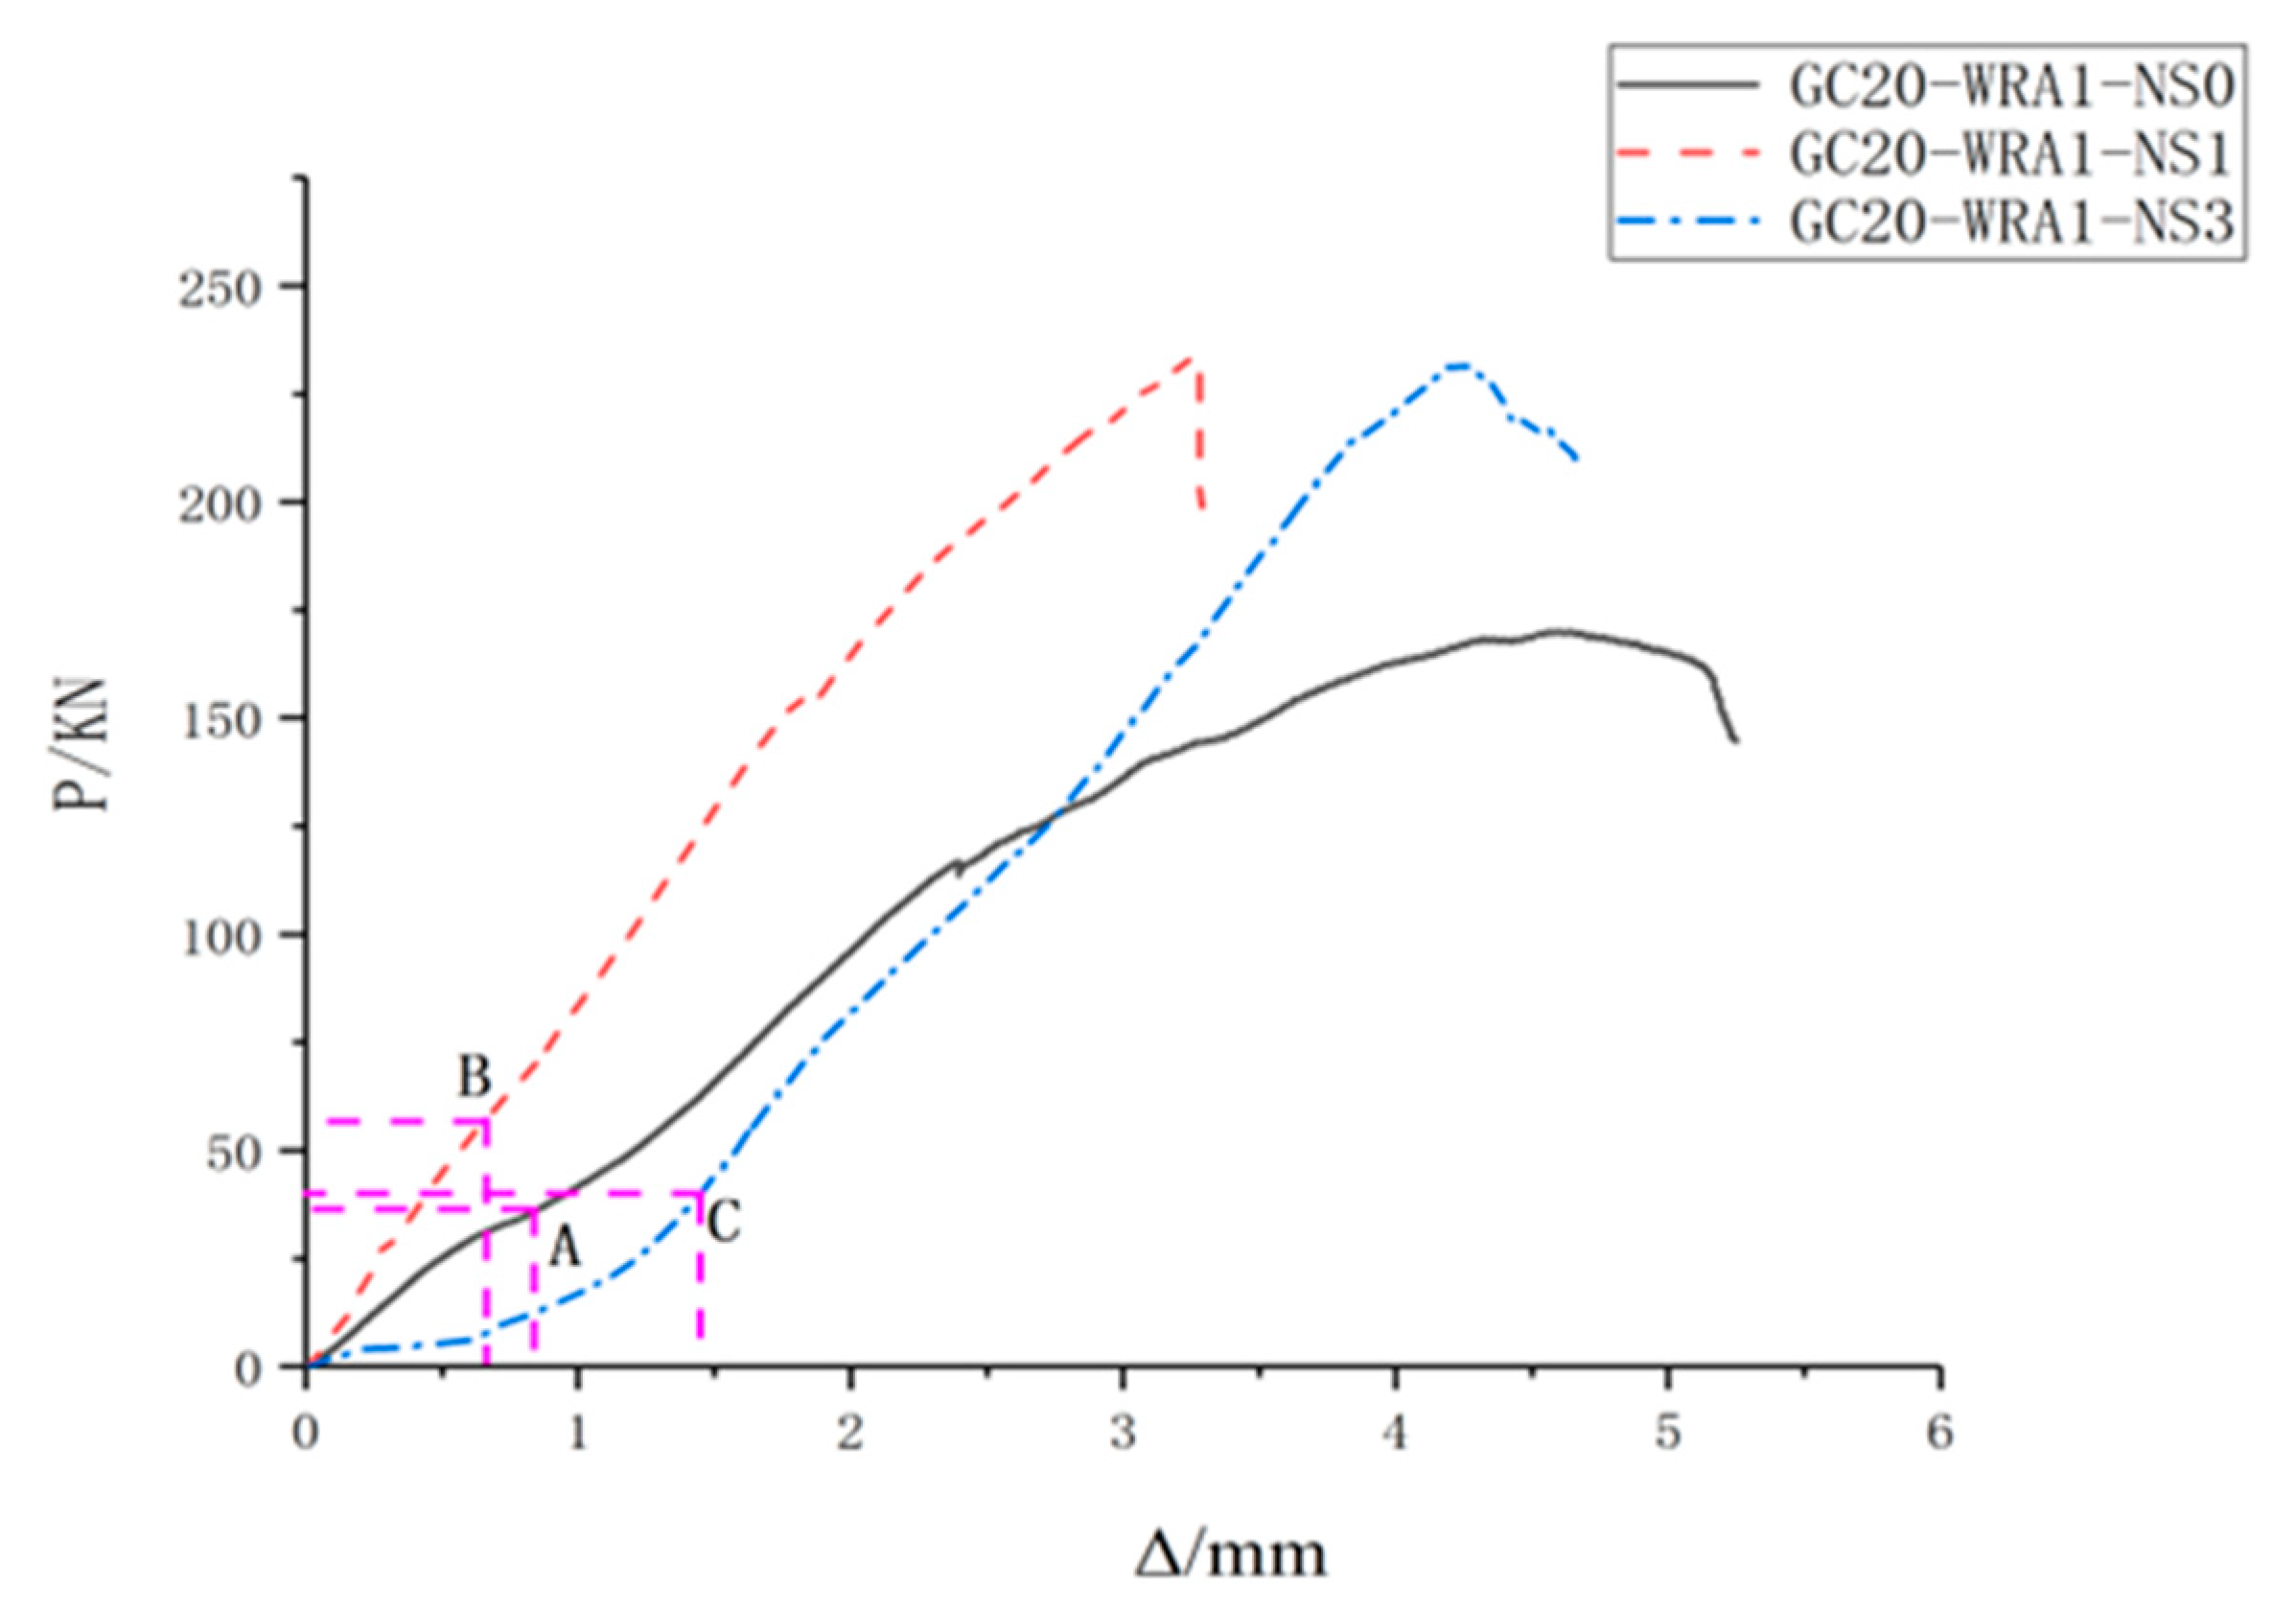
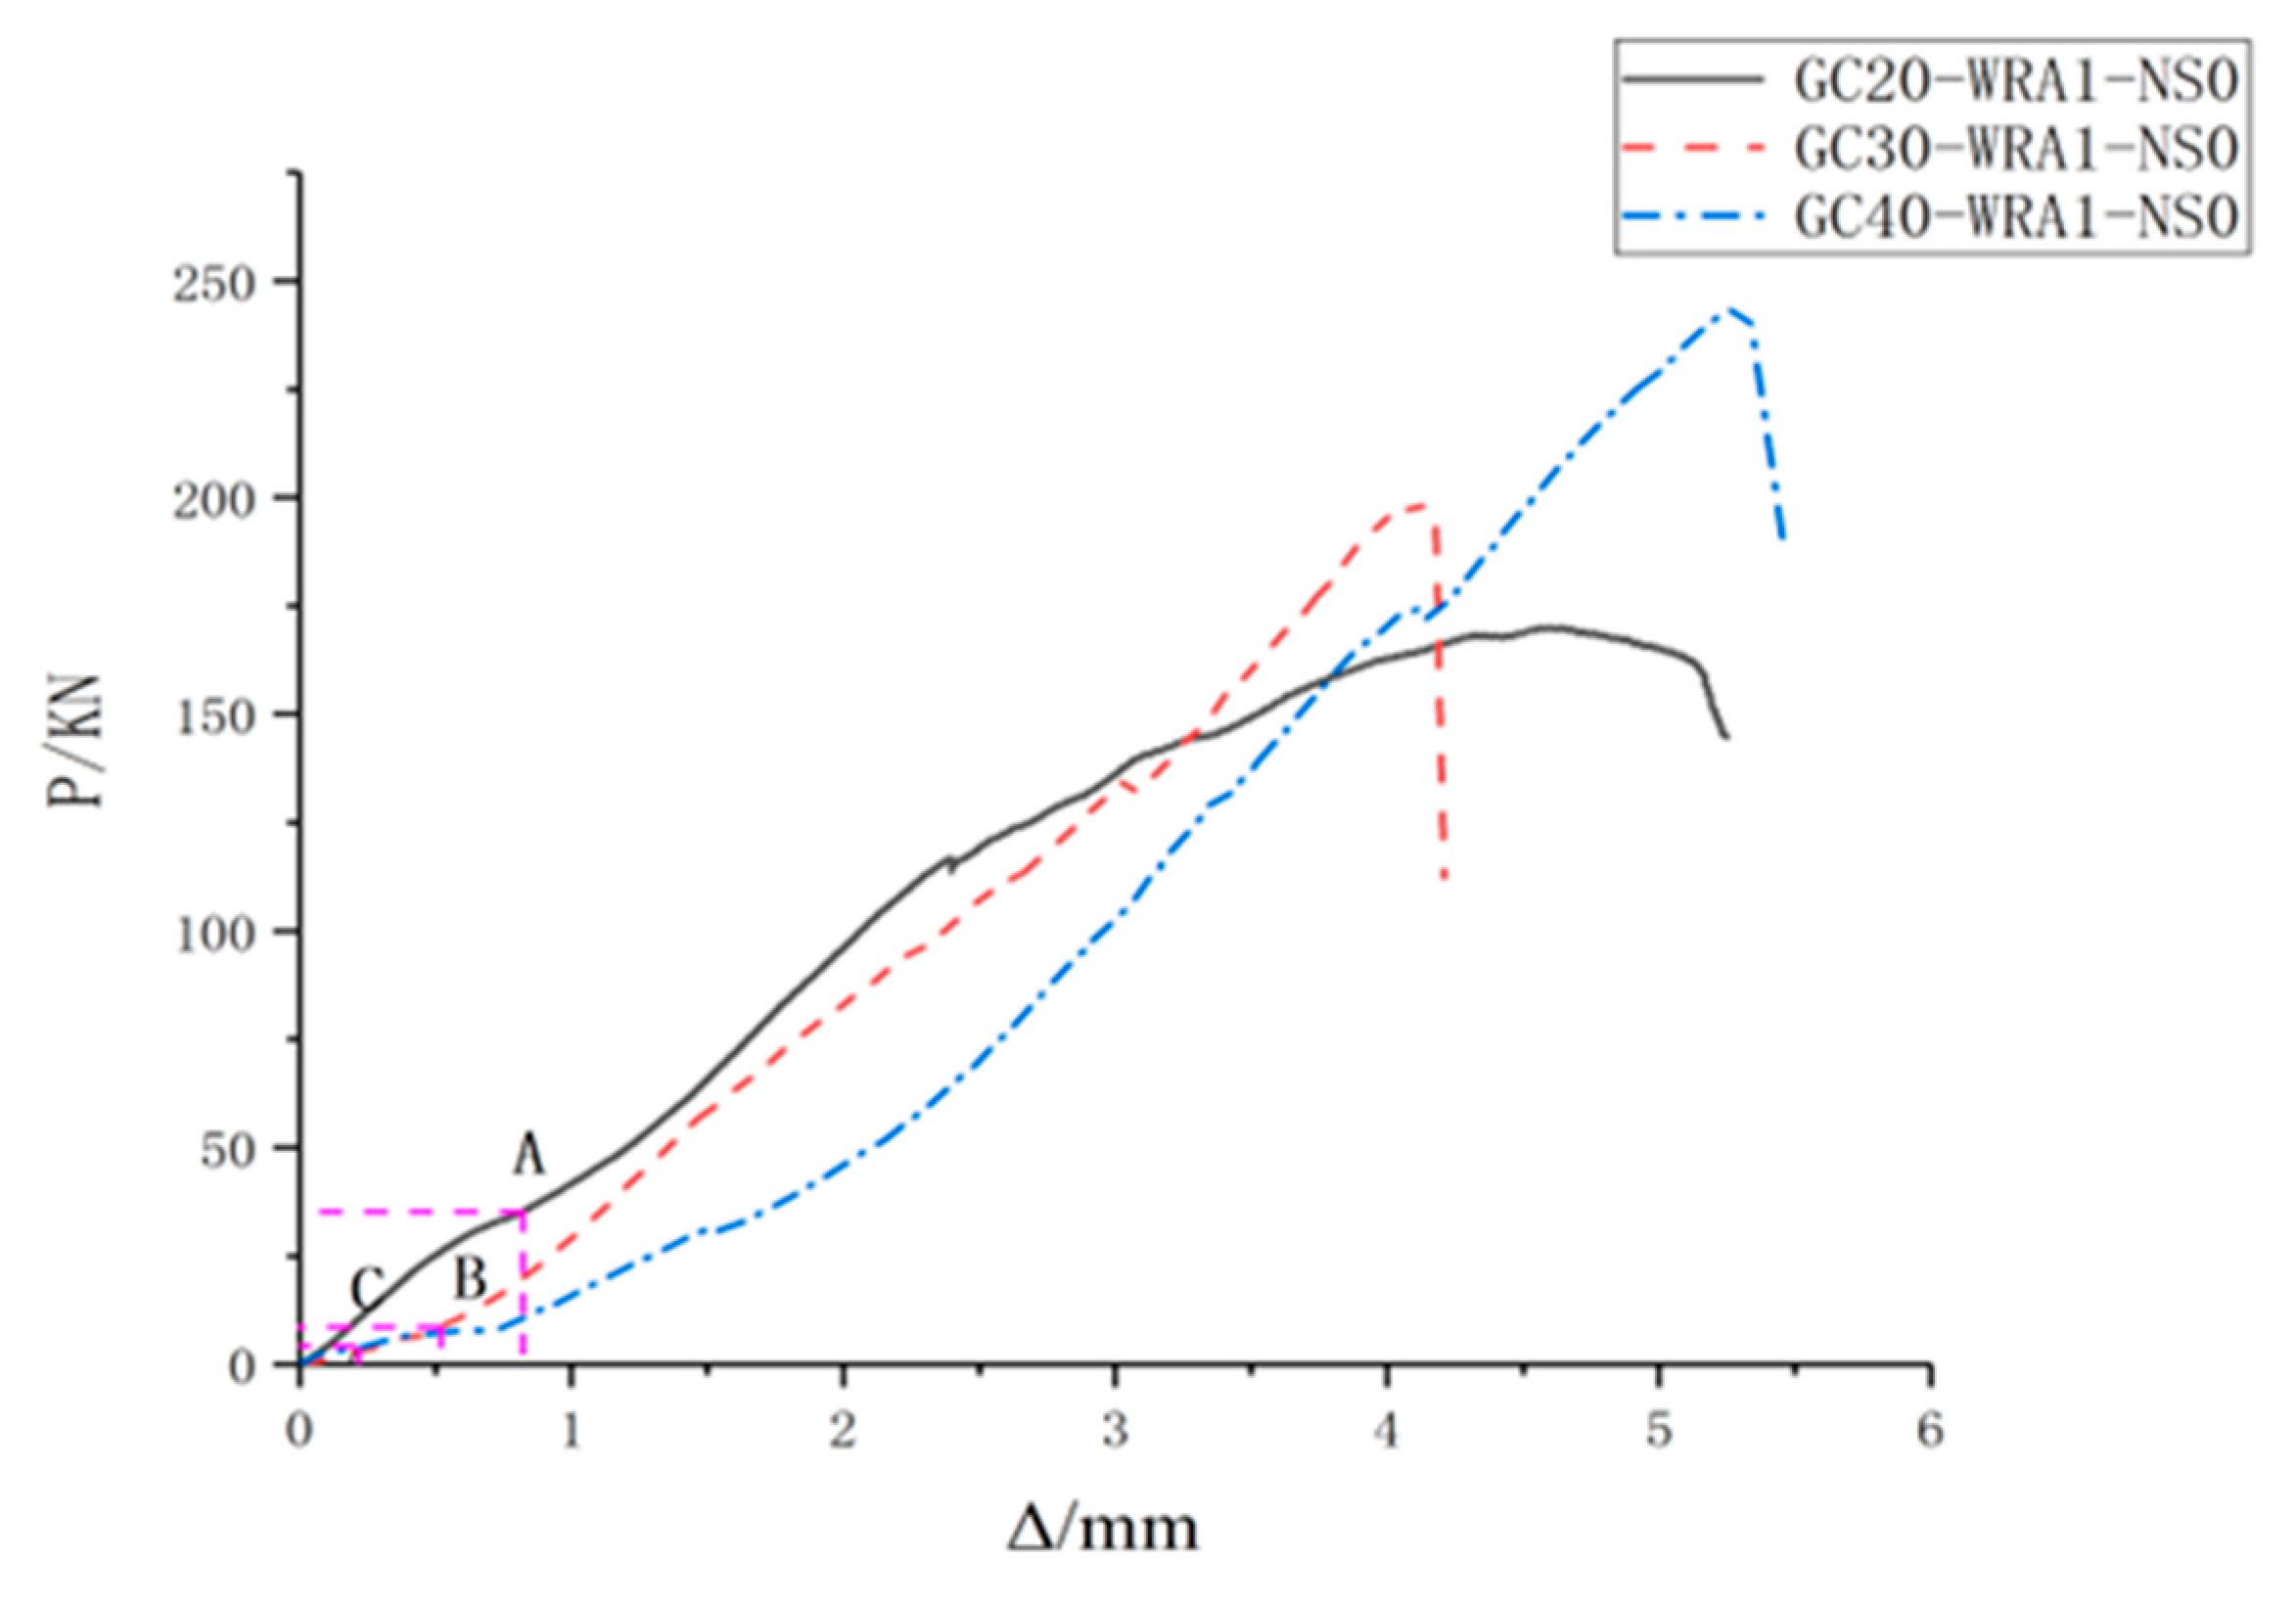
The experimental data were processed to obtain load–displacement curves, where the horizontal axis (Δ) represents displacement, the vertical axis (P) represents load, and A, B and C represent corresponding loads when the sensor receives the maximum energy. Figure 10 shows the load–displacement curves of specimens with different nano-SiO2 contents, and Figure 11 shows the load–displacement curves of specimens at different concrete grades.
As can be seen from Figure 10, when the load is 24.6% of the ultimate load, specimens with 1% nano-SiO2 content are damaged; however, when specimens with 0% and 3% nano-SiO2 contents are damaged, the loads are respectively 18.7% and 17.9% of the ultimate load. As can be seen from Figure 11, when the applied loads are 3%, 3.2% and 6.5% of the ultimate load, specimens at the concrete grades of C20, C30, and C40 are damaged, respectively.
4.3. Load–Energy Index Curves
4.3.1. Load–Energy Index Curves of Specimens with Superplasticizer
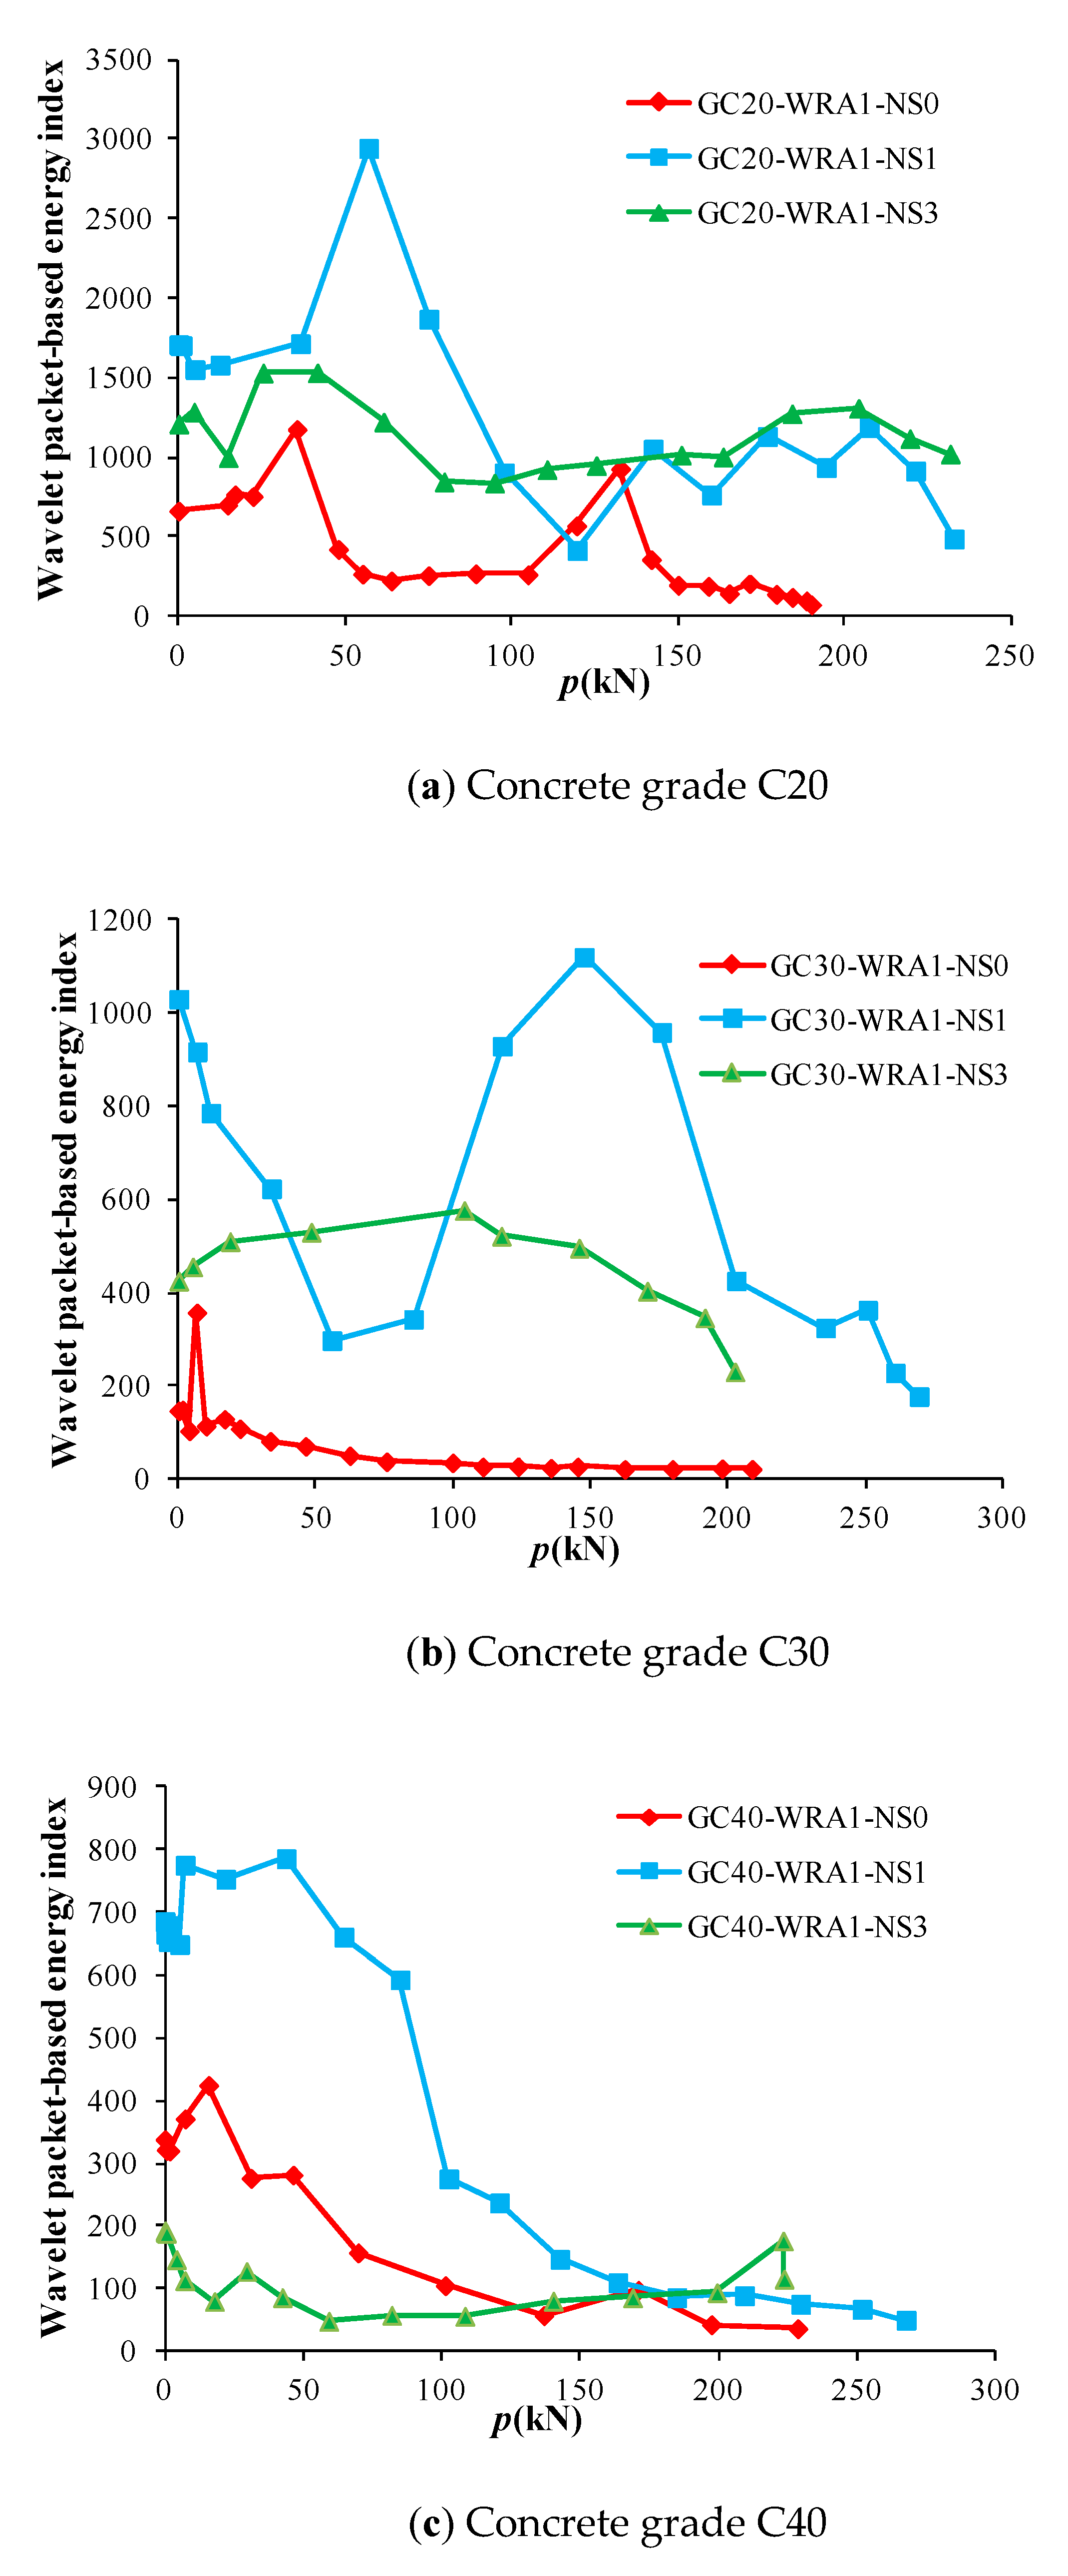
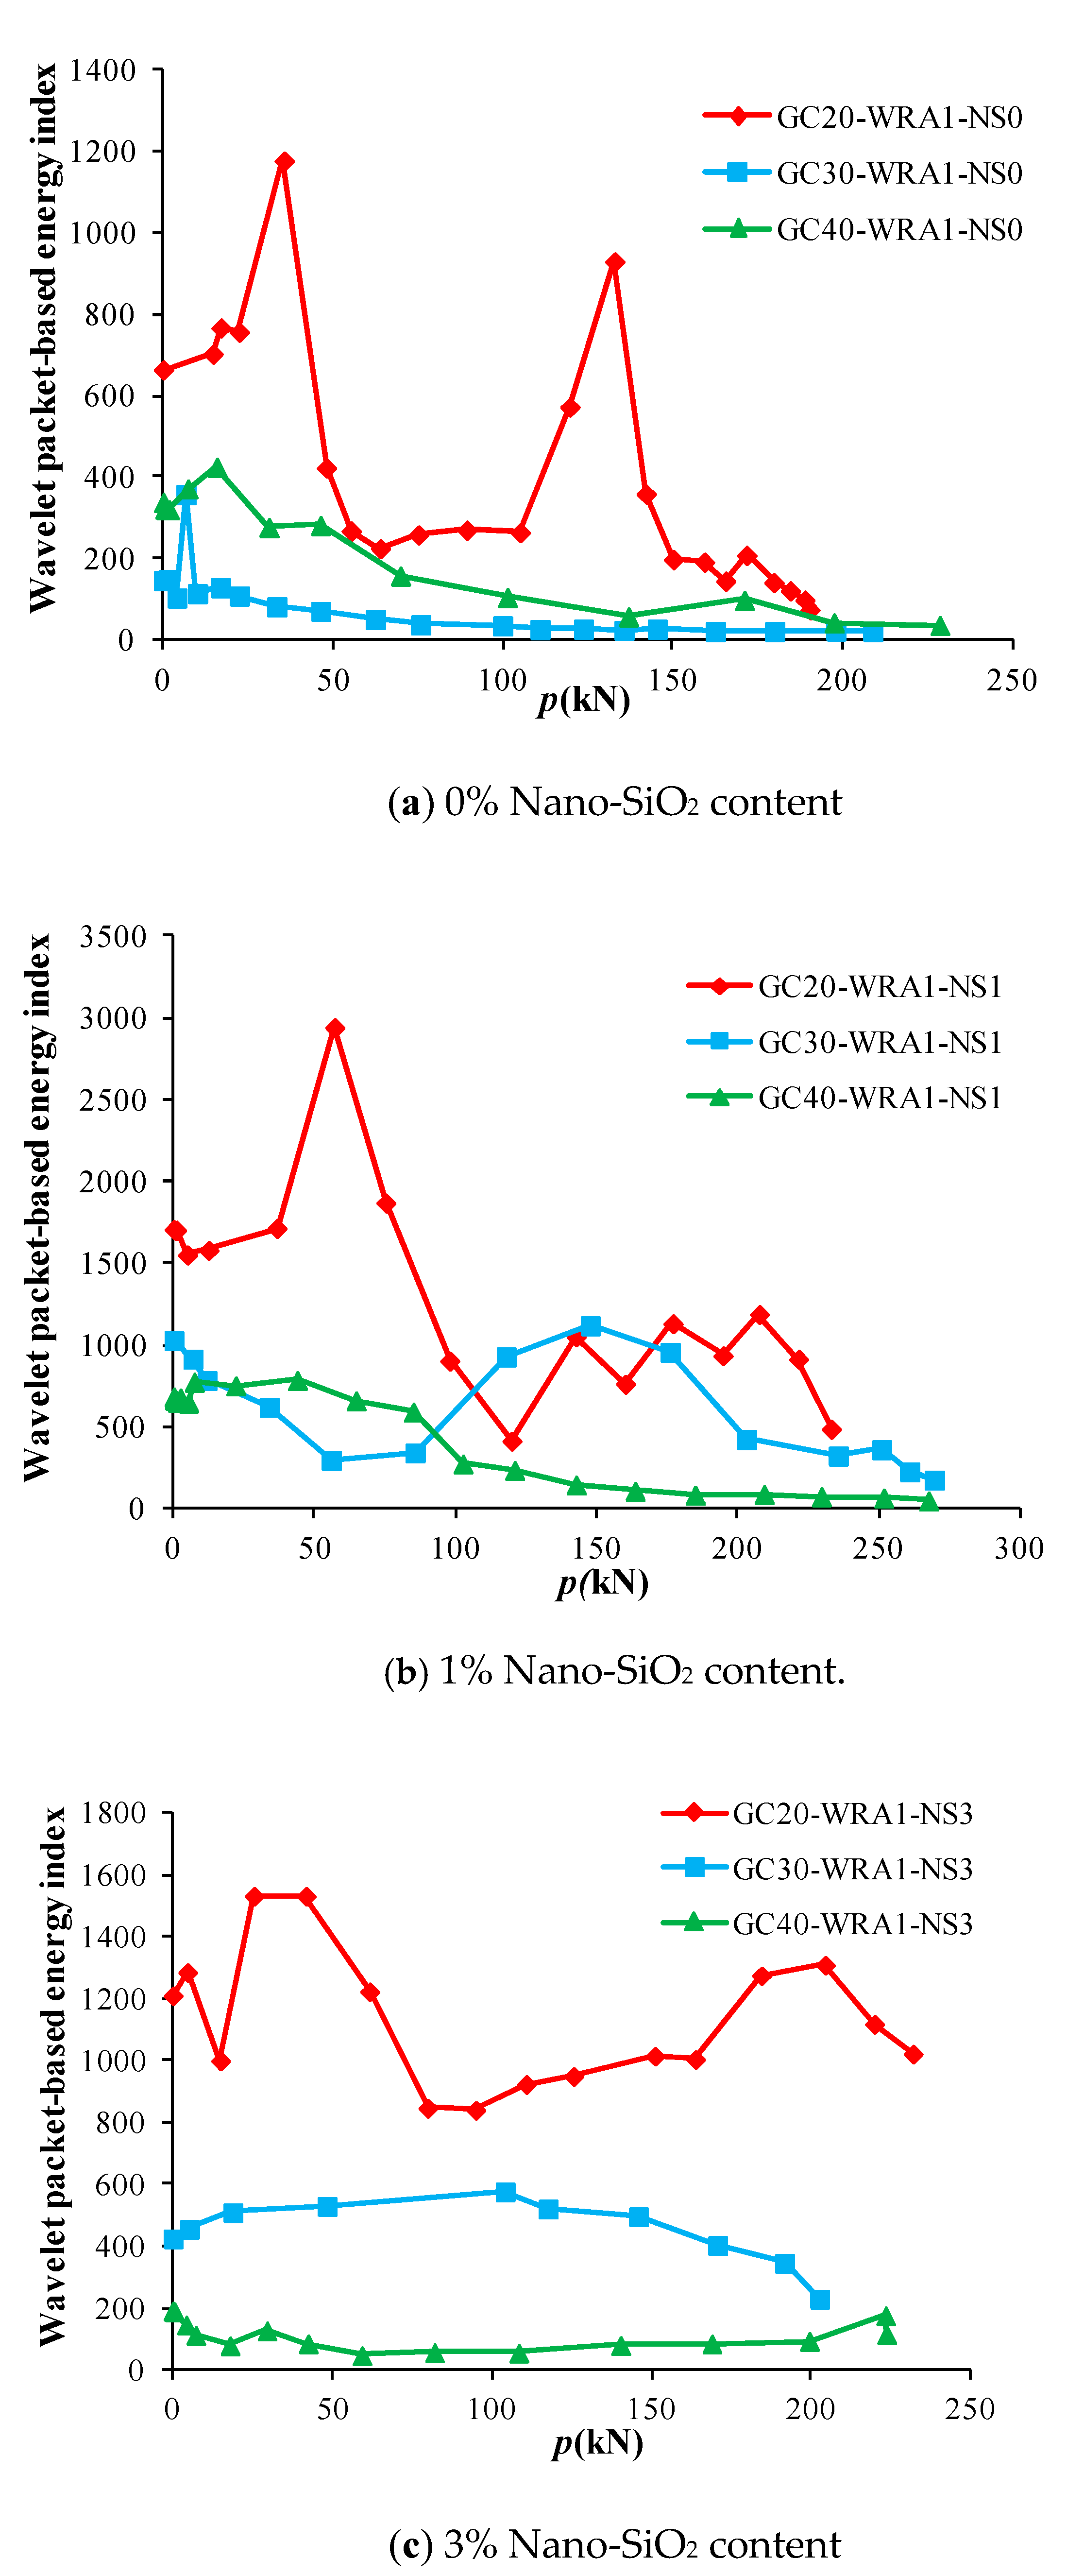
The collected data were analyzed and calculated by wavelet packet to obtain the load–energy index curves of specimens with superplasticizer. Figure 12 shows the load–energy index curves of superplasticizer-added specimens with different nano-SiO2 contents, and Figure 13 shows the load–energy index curves of superplasticizer-added specimens at different concrete grades.
At the initial stage of loading, the compression and compaction of concrete in GFRP tube played a major role, and the energy of the received signal increased and gradually reached the maximum. Then, with the further increase in load, the concrete was damaged under compression, and micro-cracks began to develop, resulting in a gradual decrease in energy. As can be seen from Figure 12, specimens with 1% nano-SiO2 content have the highest initial energy, and can bear the largest load with the increase in load until being destroyed. However, when the concrete inside specimens is damaged, specimens with 1% nano-SiO2 content have the maximum energy attenuation slope value of 4.71, whereas specimens with 3% nano-SiO2 content have the minimum energy attenuation slope value of 0.53., implying that adding 3% nano-SiO2 content to concrete can effectively delay the development of damage.
As it can be seen from Figure 13, during the entire loading period, the energy of superplasticizer-added specimens at a concrete grade of C20 is basically higher than that at the concrete grades of C30 and C40, indicating that there are relatively few cracks in C20 concrete. Nevertheless, in the process of increasing load, the energy attenuation slope value of specimens at a concrete grade of C20 is the largest, which is 6.31. However, the energy attenuation slope value of specimens at the concrete grades of C30 and C40 are relatively smaller. This indicates that after the addition of superplasticizer, the higher the concrete grade of the specimen, the slower the development of cracks in concrete, and the stronger the resistance to damage.
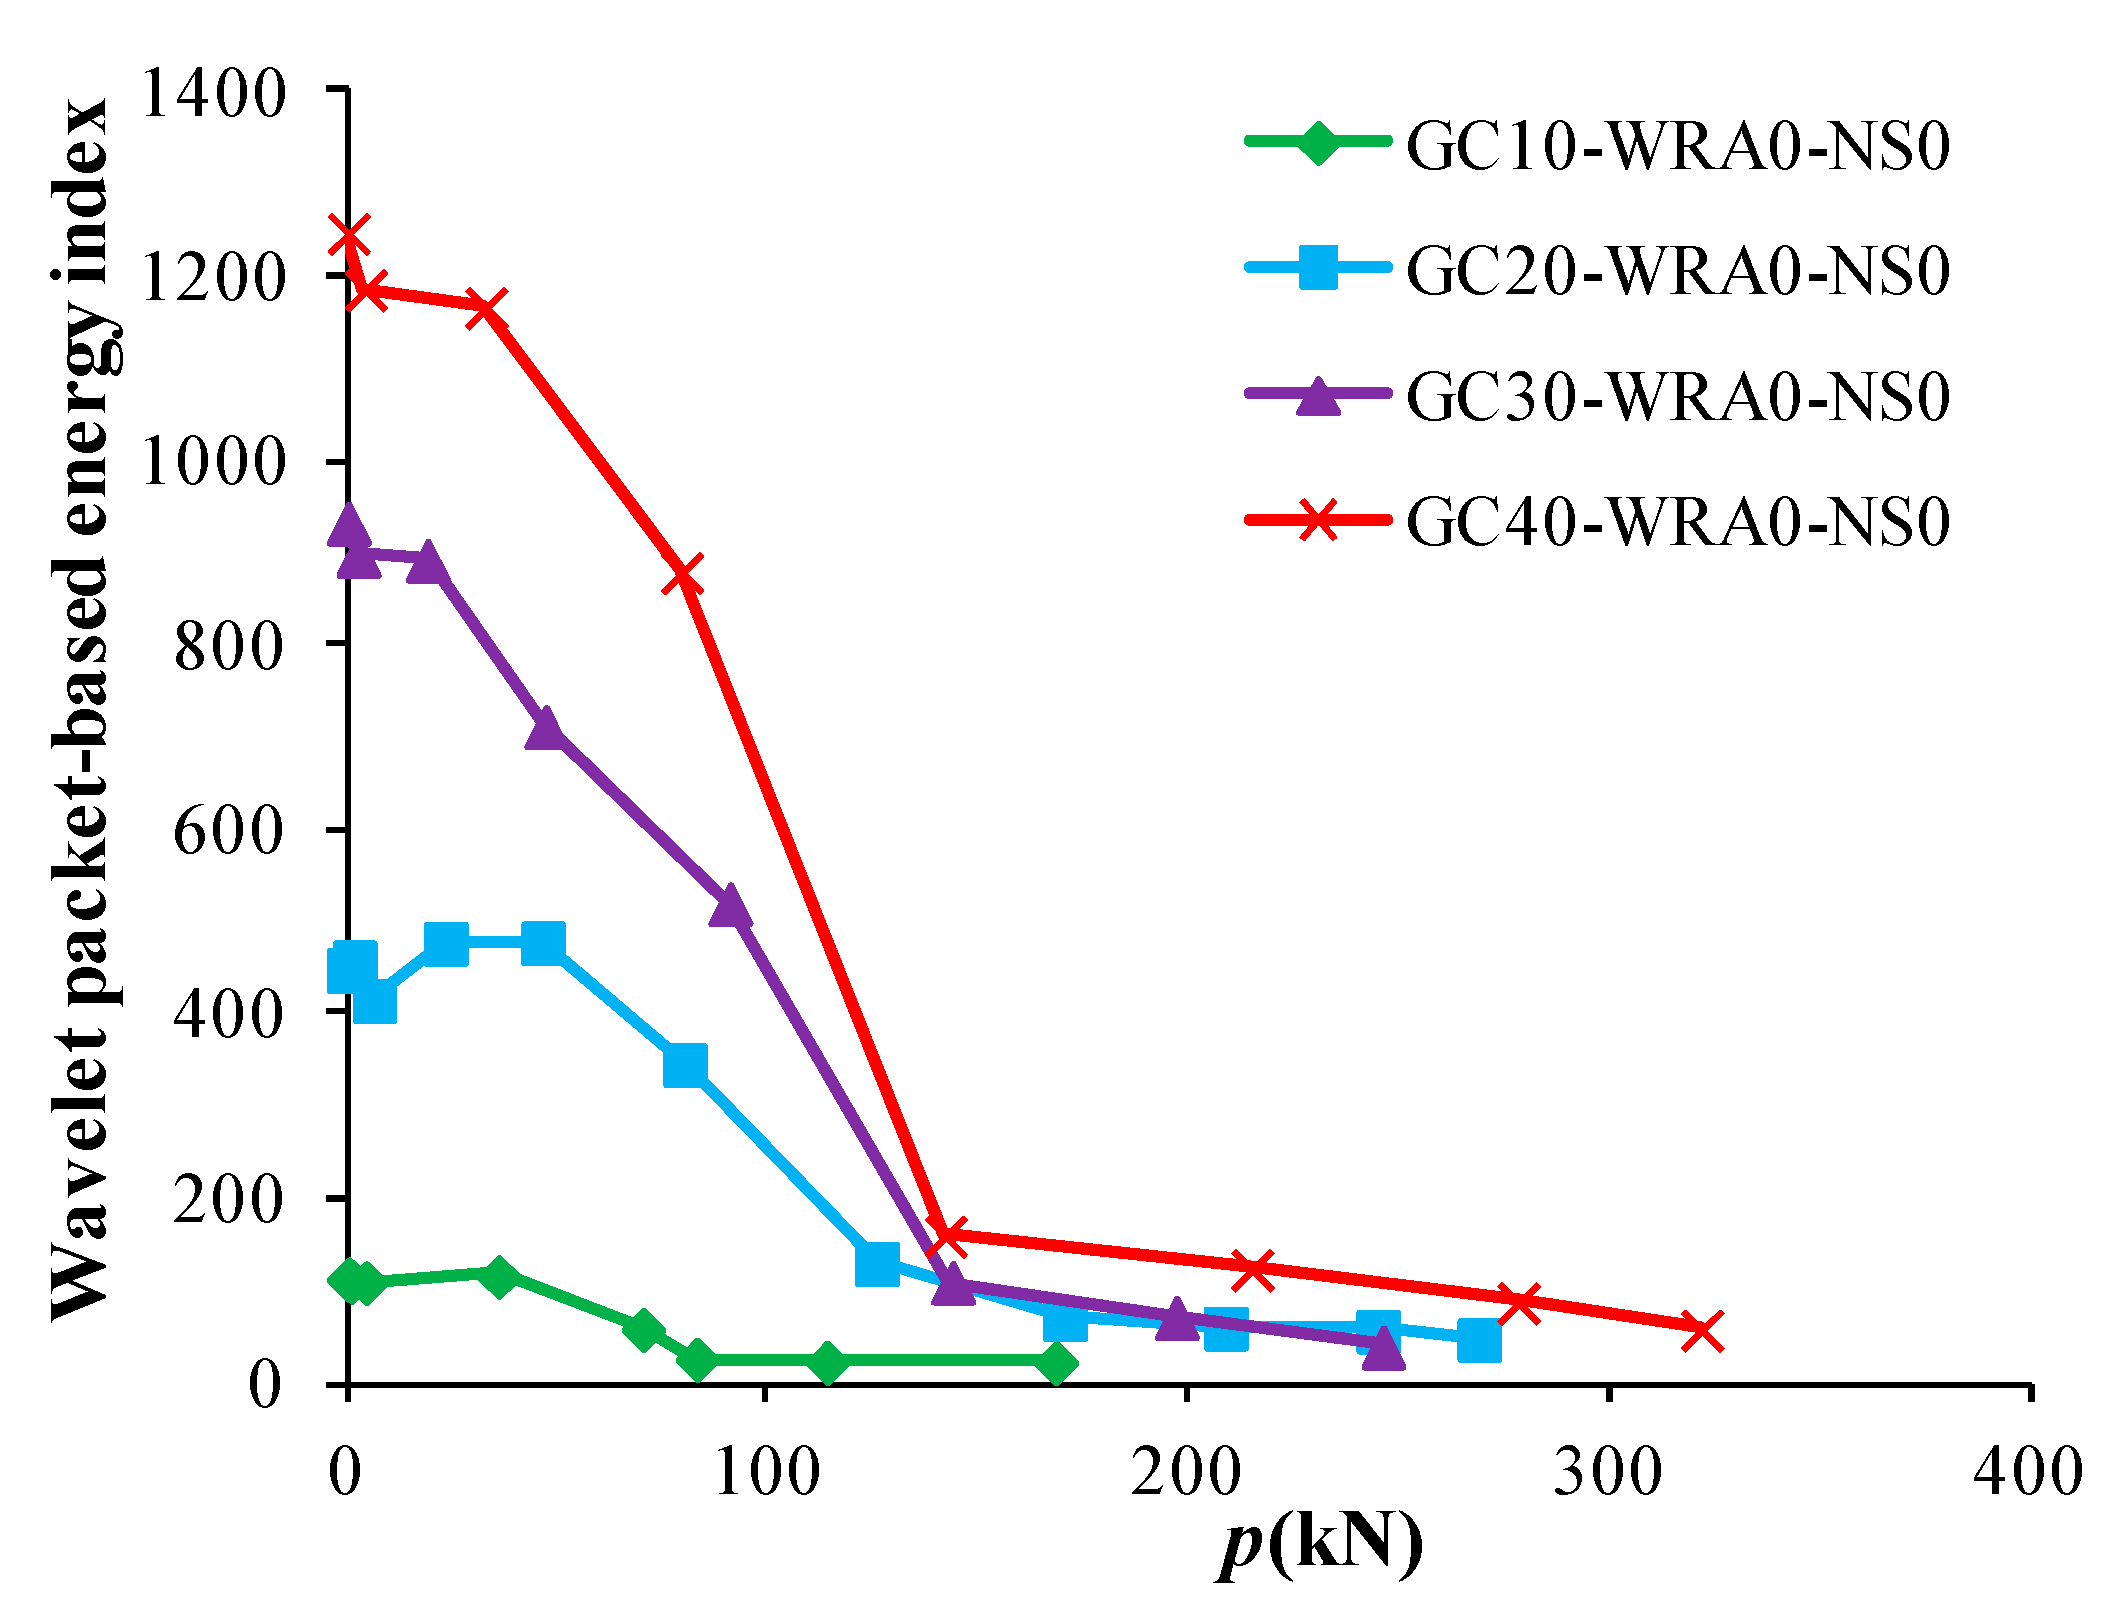
4.3.2. Load–Energy Index Curves of Specimens without Superplasticizer
Figure 14 shows the load–energy index curves of specimens without superplasticizer at different concrete grades. As it can be seen from Figure 14, when no superplasticizer is added, the initial energy of specimen at a concrete grade of C10 is the smallest, whereas that at a concrete grade of C40 is the largest. With the increase in load, the energy attenuation of specimens at a concrete grade of C40 is the fastest, indicating that when superplasticizer is not added, the higher the concrete grade, and the faster the development of specimen damage.
4.4. Load–Damage Index Curves
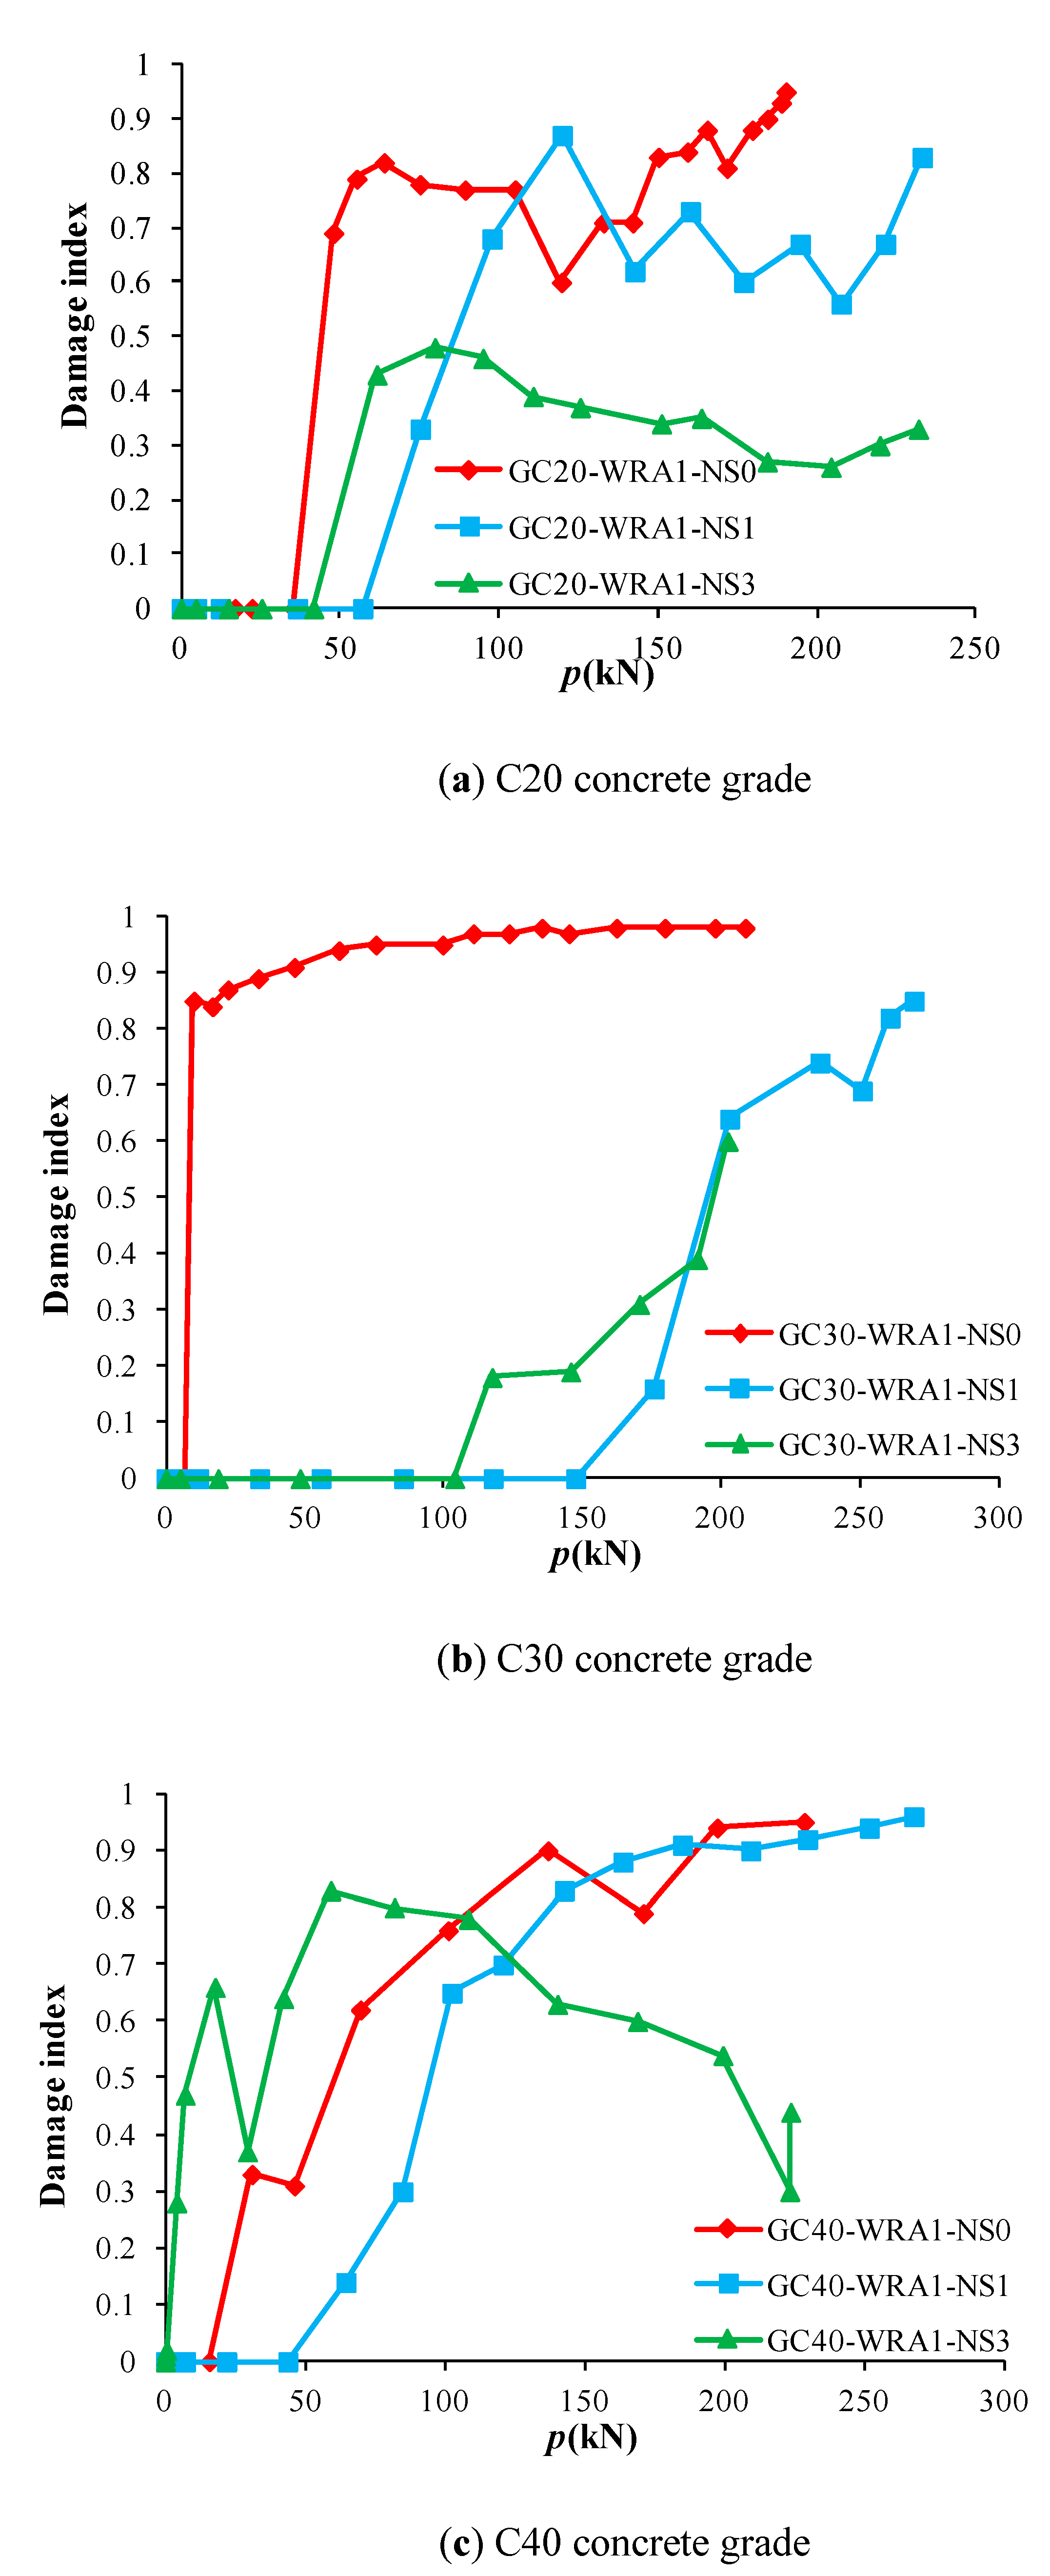
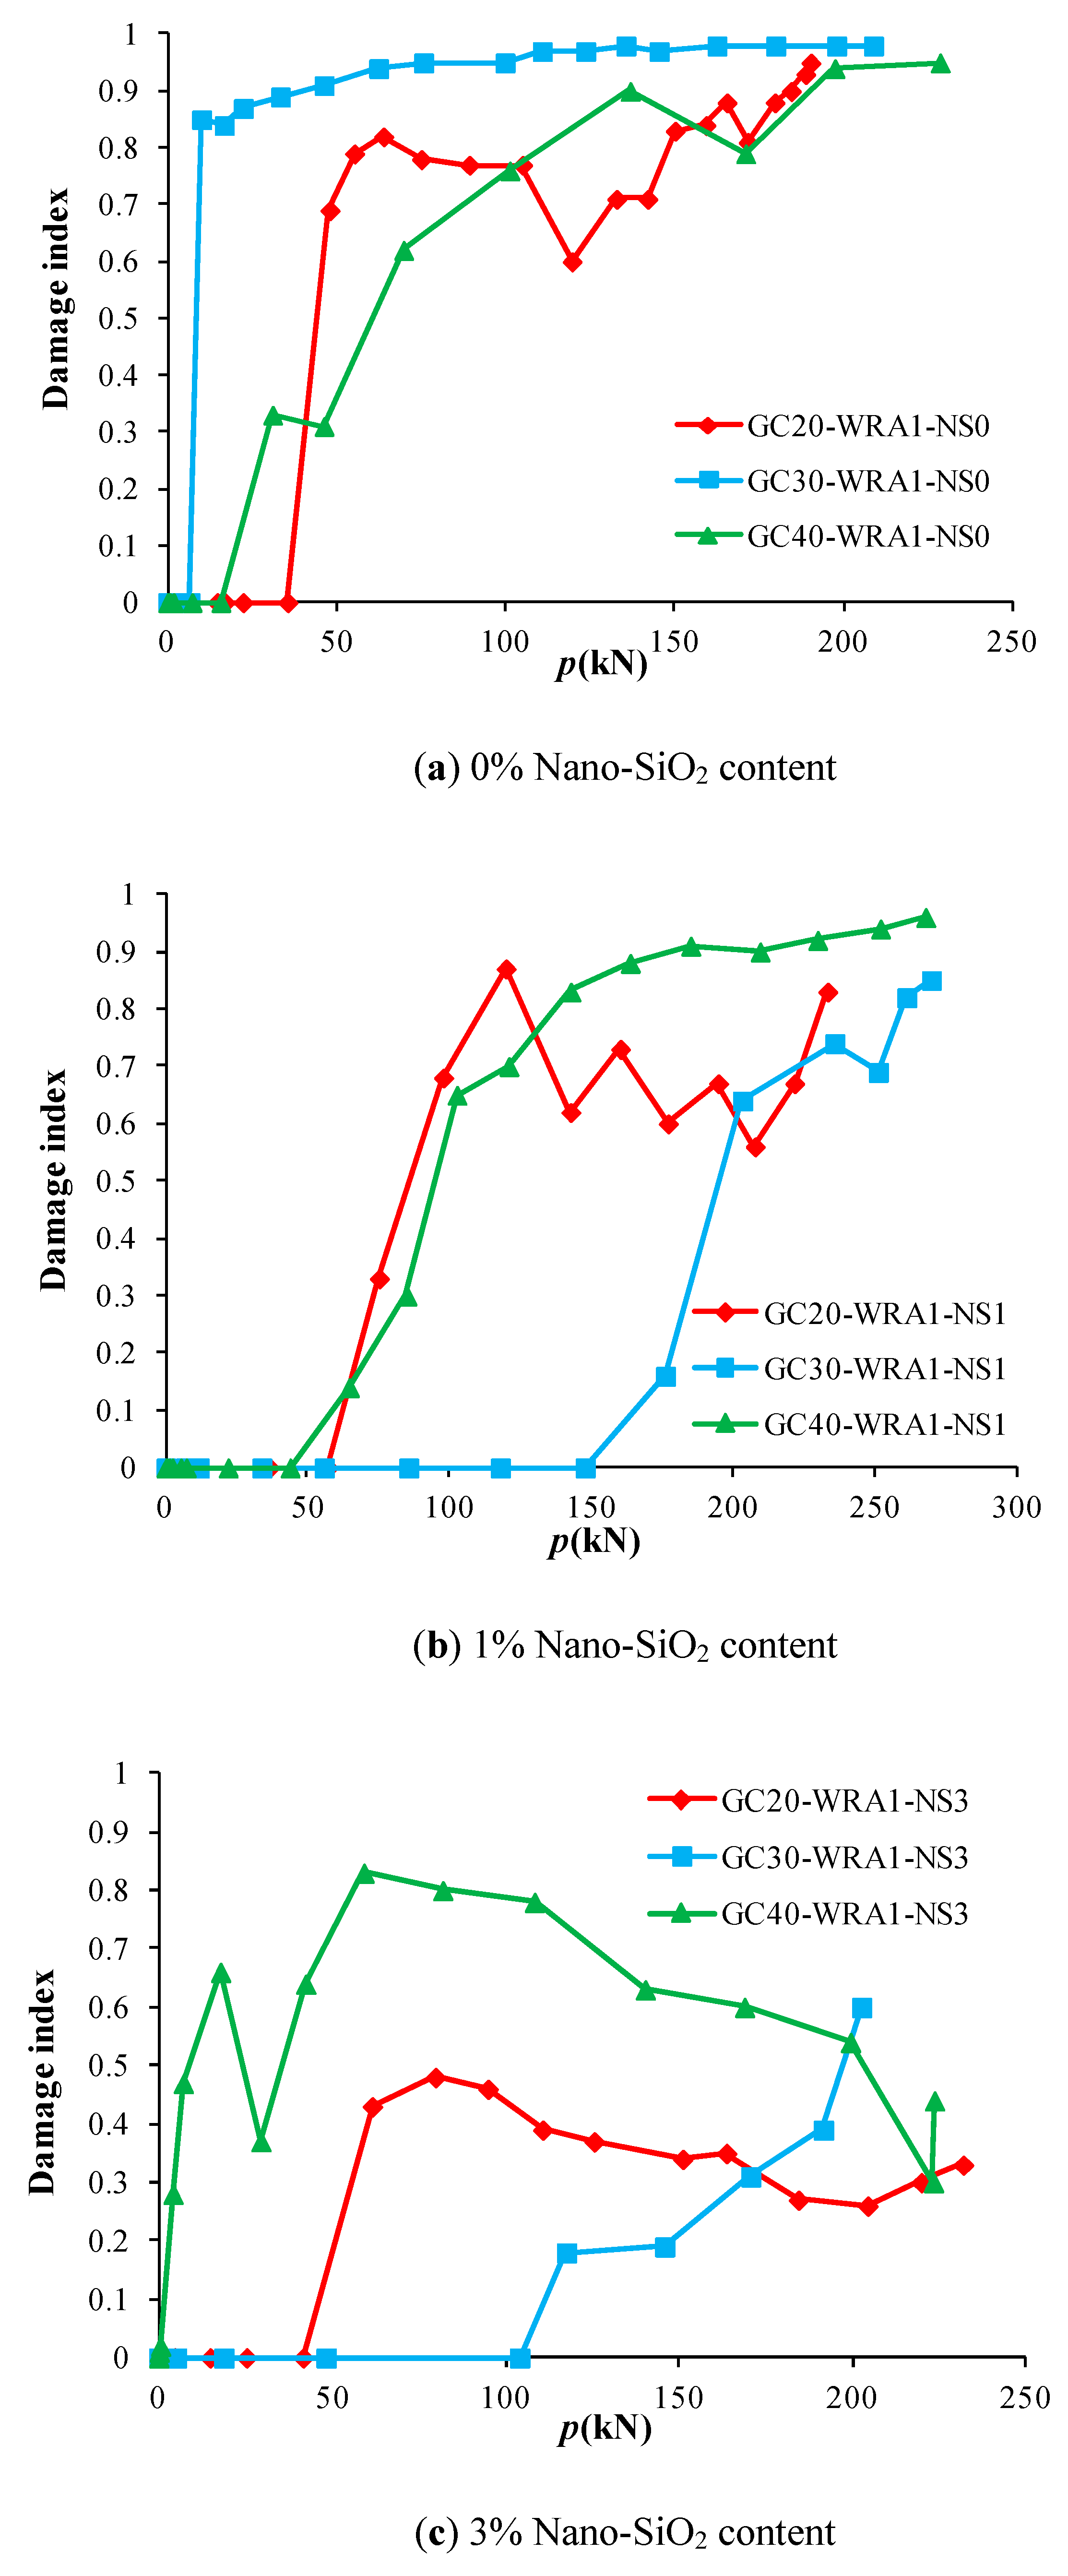
The load–damage index curve of each specimen can be gained from Table 2. Figure 15 shows the load–damage index curves of specimens with different nano-SiO2 contents, and Figure 16 shows the load–damage index curves of specimens at different concrete grades.
As can be seen from Figure 15, specimens with 1% nano-SiO2 content have the highest load at the beginning of damage, indicating that the damage of specimens with 1% nano-SiO2 content occurs the latest, followed by specimens with 3% nano-SiO2 content, yet the damage without the nano-SiO2 specimen occurs the fastest. With the increase in load, the damage index of specimens without nano-SiO2 increases rapidly to over 0.8, followed by specimens with 1% nano-SiO2 content, while the damage index of specimens with 3% nano-SiO2 content changes the slowest, demonstrating that the damage of specimens without nano-SiO2 content develops the fastest. The damage index of each specimen changes relatively slowly when reaching 0.6. As can be seen from Figure 16, the change rate of the damage index of specimens at a concrete grade of C20 is the largest, while that at a concrete grade of C40 is the smallest, implying that the higher the concrete grade, the lower the damage rate.
5. Conclusions
In this paper, a new method of damage identification using piezoelectric transducers to monitor nano-SiO2 concrete filled glass fiber reinforced polymer (GFRP) tube column is mentioned. The results show that the damage index based on wavelet packet energy can effectively monitor the damage of concrete in GFRP tube, and the damage identification method based on wave analysis is feasible and effective. Based on the analysis of the experiment results, the conclusions can be summarized as follows:
- The stress wave method using piezoceramic transducers can monitor the damage of the concrete in the glass fiber reinforced polymer (GFRP) tube well. The failure modes of specimens and the development trend of load–displacement curves are well reflected in the changes in energy and damage indices.
- At the initial stage of load, when the concrete is under compression and compaction, the stress wave energy increases; however, as the load increases, cracks appear in the concrete and develop, the energy decreases, and the damage index increases from 0 to 1.
- Specimens with 1% nano-SiO2 content have the largest initial energy and the maximum ultimate load. When the concrete inside specimens is damaged, the energy change rate of specimens with 3% nano-SiO2 content is the smallest, indicating that adding 3% nano-SiO2 content to concrete can effectively delay the development of damage.
- After the addition of superplasticizer, the higher the concrete grade of the specimen, the slower the development of cracks in concrete, and the stronger the resistance to damage. When no superplasticizer is added, the higher the concrete grade is, the faster the damage of the specimen develops.
- The damage index of specimens with 0% nano-SiO2 content develops the fastest. After the damage index reaches 0.6, the damage index of each specimen changes relatively slowly.
The structure health monitoring technology using piezoelectric transducers can monitor the health status of the structure in real time and produce early warnings of potential risks, which is suitable for the long-term monitoring of high-rise buildings and large-scale infrastructure. In future research, the interface peeling of GFRP tubular concrete columns using piezoelectric tranducers and the monitoring and identification of internal concrete defects will be studied. Different characteristic parameters of signals, such as signal amplitude, signal energy and signal power spectral density, will be selected as research objects in the time and frequency domain, and various damage indexes based on characteristic parameters will be proposed.
Author Contributions
X.C., and Y.C. incepted the research. Y.C. designed the experiments. X.C. and Y.C. conducted the experiments. X.C., and Y.C. wrote the paper. All authors have read and agreed to the published version of the manuscript.
Funding
This research work was funded by the National Natural Science Foundation of China, grant number 51778066; The Natural Science Foundation of Hubei Province, grant number 2018CFB730.
Conflicts of Interest
The authors declare no conflict of interest.
References
- Karunarathne, V.K.; Paul, S.C.; Šavija, B. Development of Nano-SiO2 and Bentonite-Based Mortars for Corrosion Protection of Reinforcing Steel. Materials 2019, 12, 2622. [Google Scholar] [CrossRef] [Green Version]
- Lee, J.W.; Jang, Y.I.; Park, W.S.; Kim, S.W.; Lee, B.J. Photocatalytic and Pozzolanic Properties of Nano-SiO2/Al2O3-TiO2 Powder for Functional Mortar. Materials 2019, 12, 1037. [Google Scholar] [CrossRef] [Green Version]
- Papanicolaou, G.C.; Manara, A.E.; Kontaxis, L.C. Experimental and Prediction Study of Displacement-Rate Effects on Flexural Behaviour in Nano and Micro TiO2 Particles-Epoxy Resin Composites. Polymers 2020, 12, 22. [Google Scholar] [CrossRef] [PubMed] [Green Version]
- Kazemi, M.; Ghobadi, M.; Mirzaie, A. Cobalt Ferrite Nanoparticles (CoFe2O4 Mnps) As Catalyst and Support: Magnetically Recoverable Nanocatalysts in Organic Synthesis. Nanotechnol. Rev. 2018, 7, 43–68. [Google Scholar] [CrossRef]
- Zhang, Z.; An, Y.X. Nanotechnology for The Oil and Gas Industry—An Overview of Recent Progress. Nanotechnol. Rev. 2018, 7, 341–353. [Google Scholar]
- Das, S.; Srivastava, V.C. An Overview of The Synthesis of CuO-ZnO Nanocomposite for Environmental and Other Applications. Nanotechnol. Rev. 2018, 7, 267–282. [Google Scholar] [CrossRef]
- Karwowska, E. Antibacterial Potential of Nanocomposite-Based Materials—A Short Review. Nanotechnol. Rev. 2017, 6, 243–254. [Google Scholar] [CrossRef]
- Ramos-Delgado, N.A.; Gracia-Pinilla, M.A.; Mangalaraja, R.V.; O’Shea, K.; Dionysiou, D.D. Industrial synthesis and characterization of nanophotocatalysts materials: Titania. Nanotechnol. Rev. 2016, 5, 467–479. [Google Scholar] [CrossRef] [Green Version]
- Zhang, P.; Li, Q.F.; Zhu, H.T.; Zhang, T.H. Fracture Toughness of Nano-SiO2 and Steel Fiber Reinforced Concrete. J. Build. Mater. 2017, 20, 366–372. [Google Scholar]
- Zhang, P.; Zhao, S.K.; Chang, H.L.; Chen, J.Z.; Yu, H.L. Frost resistance and crack resistance of Nano-SiO2 and steel fiber reinforced concrete. J. Civ. Eng. Manag. 2018, 35, 73–78. [Google Scholar]
- Fan, Y.H.; Niu, H.C.; Zhang, X.G. Experimental study on nano-SiO2 modified recycled concrete. Concrete 2017, 333, 92–95. [Google Scholar]
- Zhang, J.; Xu, J.; Guan, W.; Du, G. Damage detection of concrete-filled square steel tube (CFSST) column joints under cyclic loading using piezoceramic transducers. Sensors 2018, 18, 3266. [Google Scholar] [CrossRef] [PubMed] [Green Version]
- Xu, B.; Zhang, T.; Song, G.; Gu, H. Active interface debonding detection of a concrete-filled steel tube with piezoelectric technologies using wavelet packet analysis. Mech. Syst. Signal Process. 2013, 36, 7–17. [Google Scholar] [CrossRef]
- Du, G.; Andjelic, A.; Li, Z.; Lei, Z.; Bie, X. Residual axial bearing capacity of concrete-filled circular steel tubular columns (CFCSTCs) after transverse impact. Appl. Sci. 2018, 8, 793. [Google Scholar] [CrossRef] [Green Version]
- Alasadi, S.; Shafigh, P.; Ibrahim, Z. Experimental Study on the Flexural Behavior of over Reinforced Concrete Beams Bolted with Compression Steel Plate: Part I. Appl. Sci. 2020, 10, 822. [Google Scholar] [CrossRef] [Green Version]
- Qin, F.; Kong, Q.; Li, M.; Mo, Y.L.; Song, G.; Fan, F. Bond slip detection of steel plate and concrete beams using smart aggregates. Smart Mater. Struct. 2015, 24, 115039. [Google Scholar] [CrossRef]
- Peng, J.; Xiao, L.; Zhang, J.; Cai, C.S.; Wang, L. Flexural behavior of corroded HPS beams. Eng. Struct. 2019, 195, 274–287. [Google Scholar] [CrossRef]
- Li, W.; Xu, C.; Ho, S.C.M.; Wang, B.; Song, G. Monitoring concrete deterioration due to reinforcement corrosion by integrating acoustic emission and FBG strain measurements. Sensors 2017, 17, 657. [Google Scholar] [CrossRef] [Green Version]
- Xiao, L.; Peng, J.; Zhang, J.; Ma, Y.; Cai, C.S. Comparative assessment of mechanical properties of HPS between electrochemical corrosion and spray corrosion. Constr. Build. Mater. 2020, 237, 117735. [Google Scholar] [CrossRef]
- Zheng, Y.; Yu, T.; Yang, J.; Li, Y.; Sun, C. Investigation of the behaviour of reinforcement-free concrete deck slabs restrained by FRP rods. Eng. Struct. 2017, 135, 191–208. [Google Scholar] [CrossRef]
- Xia, L.; Zheng, Y. Deep embedment (DE) FRP shear strengthening of concrete bridge slabs under loads close to supports. Appl. Sci. 2018, 8, 721. [Google Scholar] [CrossRef] [Green Version]
- Luo, M.; Li, W.; Hei, C.; Song, G. Concrete infill monitoring in concrete-filled FRP tubes using a PZT-based ultrasonic time-of-flight method. Sensors 2016, 16, 2083. [Google Scholar] [CrossRef] [PubMed]
- Zheng, Y.; Zhou, L.; Taylor, S.E.; Ma, H. Serviceability of one-way high-volume fly ash-self-compacting concrete slabs reinforced with basalt FRP bars. Constr. Build. Mater. 2019, 217, 108–127. [Google Scholar] [CrossRef]
- Di, B.; Wang, J.; Li, H.; Zheng, J.; Zheng, Y.; Song, G. Investigation of bonding behavior of FRP and steel bars in self-compacting concrete structures using acoustic emission method. Sensors 2019, 19, 159. [Google Scholar] [CrossRef] [Green Version]
- Tian, J.; Wu, X.; Zheng, Y.; Du, Y.; Quan, X. Experimental study and mixed-dimensional FE analysis of T-rib GFRP plate-concrete composite bridge decks. Adv. Mater. Sci. Eng. 2018. [Google Scholar] [CrossRef] [Green Version]
- Lee, M.K.; Han, S.H.; Park, K.H.; Park, J.J.; Kim, W.W.; Hwang, W.J.; Lee, G.J. Design Optimization of Bulk Piezoelectric Acceleration Sensor for Enhanced Performance. Sensors 2019, 19, 3360. [Google Scholar] [CrossRef] [Green Version]
- Park, S.S.; Lee, J.S.; Lee, D.E.; Lee, J.C. Measurement of Unit Weight of Dry Sand Using Piezoelectric Sensor. Appl. Sci. 2018, 8, 2277. [Google Scholar] [CrossRef] [Green Version]
- Lee, G.J.; Hwang, W.J.; Park, J.J.; Lee, M.K. Study of sensitive parameters on the sensor performance of a compression-type piezoelectric accelerometer based on the meta-model. Energies 2019, 12, 1381. [Google Scholar] [CrossRef] [Green Version]
- Wu, A.; He, S.; Ren, Y.; Wang, N.; Ho, S.C.M.; Song, G. Design of a new stress wave-based pulse position modulation (PPM) communication system with piezoceramic transducers. Sensors 2019, 19, 558. [Google Scholar] [CrossRef] [Green Version]
- Kang, S.H.; Han, D.H.; Kang, L.H. Defect Visualization of a Steel Structure Using a Piezoelectric Line Sensor Based on Laser Ultrasonic Guided Wave. Materials 2019, 12, 3992. [Google Scholar] [CrossRef] [Green Version]
- Peddigari, M.; Kim, G.Y.; Park, C.H.; Min, Y.; Kim, J.W.; Ahn, C.W.; Choi, J.J.; Hahn, B.D.; Choi, J.H.; Park, D.S.; et al. A comparison study of fatigue behavior of hard and soft piezoelectric single crystal macro-fiber composites for vibration energy harvesting. Sensors 2019, 19, 2196. [Google Scholar] [CrossRef] [PubMed] [Green Version]
- Mei, H.; Haider, M.F.; Joseph, R.; Migot, A.; Giurgiutiu, V. Recent advances in piezoelectric wafer active sensors for structural health monitoring applications. Sensors 2019, 19, 383. [Google Scholar] [CrossRef] [PubMed] [Green Version]
- Wang, F.; Chen, Z.; Song, G. Monitoring of multi-bolt connection looseness using entropy-based active sensing and genetic algorithm-based least square support vector machine. Mech. Syst. Signal Process. 2020, 136, 106507. [Google Scholar] [CrossRef]
- Li, N.; Wang, F.; Song, G. New entropy-based vibro-acoustic modulation method for metal fatigue crack detection: An exploratory study. Measurement 2020, 150, 107075. [Google Scholar] [CrossRef]
- Zhou, L.; Zheng, Y.; Song, G.; Chen, D.; Ye, Y. Identification of the structural damage mechanism of BFRP bars reinforced concrete beams using smart transducers based on time reversal method. Constr. Build. Mater. 2019, 220, 615–627. [Google Scholar] [CrossRef]
- Xu, Y.; Luo, M.; Liu, Q.; Du, G.; Song, G. PZT transducer array enabled pipeline defect locating based on time-reversal method and matching pursuit de-noising. Smart Mater. Struct. 2019, 28, 075019. [Google Scholar] [CrossRef]
- Wang, F.; Song, G. Bolt early looseness monitoring using modified vibro-acoustic modulation by time-reversal. Mech. Syst. Signal Process. 2019, 130, 349–360. [Google Scholar] [CrossRef]
- Liu, Y.; Zhang, M.; Yin, X.; Huang, Z.; Wang, L. Debonding detection of reinforced concrete (RC) beam with near-surface mounted (NSM) pre-stressed carbon fiber reinforced polymer (CFRP) plates using embedded piezoceramic smart aggregates (SAs). Appl. Sci. 2020, 10, 50. [Google Scholar] [CrossRef] [Green Version]
- Wang, F.; Ho, S.C.M.; Song, G. Monitoring of early looseness of multi-bolt connection: A new entropy-based active sensing method without saturation. Smart Mater. Struct. 2019, 28, 10LT01. [Google Scholar] [CrossRef]
- Karayannis, C.G.; Voutetaki, M.E.; Chalioris, C.E.; Providakis, C.P.; Angeli, G.M. Detection of flexural damage stages for RC beams using Piezoelectric sensors (PZT). Smart Struct. Syst. 2015, 15, 997–1018. [Google Scholar] [CrossRef]
- Wang, Z.; Wei, L.; Cao, M. Damage Quantification with Embedded Piezoelectric Aggregates Based on Wavelet Packet Energy Analysis. Sensors 2019, 19, 425. [Google Scholar] [CrossRef] [PubMed] [Green Version]
- Karayannis, C.G.; Chalioris, C.E.; Angeli, G.M.; Papadopoulos, N.A.; Favvata, M.J.; Providakis, C.P. Experimental damage evaluation of reinforced concrete steel bars using piezoelectric sensors. Constr. Build. Mater. 2015, 105, 227–244. [Google Scholar] [CrossRef]
- Song, G.; Gu, H.; Mo, Y.L.; Hsu, T.T.C.; Dhonde, H. Concrete structural health monitoring using embedded piezoceramic transducers. Smart Mater. Struct. 2007, 16, 959–968. [Google Scholar] [CrossRef] [Green Version]
- Song, G.; Mo, Y.L.; OTERO, K. Health monitoring and rehabilitation of a concrete structure using intelligent materials. Smart Mater. Struct. 2006, 15, 309–314. [Google Scholar] [CrossRef] [Green Version]
- Song, G.; Olmi, C.; Gu, H. An over height vehicle-bridge collision monitoring system using piezoelectric transducer. Smart Mater. Struct. 2007, 16, 462–468. [Google Scholar] [CrossRef]
- Song, G.; Gu, H. Smart aggregate: Multi-functional sensors for concrete structures-a tutorial land review. Smart Mater. Struct. 2008, 17, 033001. [Google Scholar] [CrossRef]
- Feng, Q.; Liang, Y.; Song, G. Real-time monitoring of early-age concrete strength using piezoceramic-based smart aggregates. J. Aerosp. Eng. 2019, 32, 04018115. [Google Scholar] [CrossRef]
- Feng, Q.; Kong, Q.; Song, G. Damage detection of concrete piles subject to typical damage types based on stress wave measurement using embedded smart aggregates transducers. Measurement 2016, 88, 345–352. [Google Scholar] [CrossRef] [Green Version]
- Jiang, T.; Kong, Q.; Patil, D.; Luo, Z.; Huo, L.; Song, G. Detection of debonding between FRP rebar and concrete structure using piezoceramic transducers and wavelet packet analysis. IEER Sens. J. 2017, 17, 1992–1998. [Google Scholar] [CrossRef]
- Jiang, T.; Kong, Q.; Song, G. Monitoring of Grouting Compactness in a Post-Tensioning Tendon Duct Using Piezoceramic Transducers. Sensors 2016, 16, 1343. [Google Scholar] [CrossRef] [Green Version]
- Kong, Q.; Song, G. A comparative study of the very early age cement hydration monitoring using compressive and shear mode smart aggregates. IEEE Sens. J. 2017, 17, 256–260. [Google Scholar] [CrossRef]
- Kong, Q.; Robert, R.H.; Silva, P.; Mo, Y.L. Cyclic crack monitoring of a reinforced concrete column under simulated pseudo-dynamic loading using piezoceramic-based smart aggregates. Appl. Sci. 2016, 6, 341. [Google Scholar] [CrossRef] [Green Version]
- Ma, X.; Xu, B.; Li, J. Monitoring test of bamboo beam interface stripping based on piezoelectric wave measurement. Piezoelectrics Acoustooptics 2017, 39, 750–758. [Google Scholar]
- Li, B.; Xu, B. Experimental study on stripping damage identification of the interface between steel tube and concrete constructed by concrete filled steel tube. Build. Sci. 2013, 29, 54–58. [Google Scholar]
- Meng, Y.; Yan, S.; Sun, W.; Ma, L.; He, B. The active health monitoring test of piezoelectric concrete beam. J. Shenyang Jianzhu Univ. Nat. Sci. 2011, 27, 253–259. [Google Scholar]
- Yi, J.; Wu, F. Numerical simulation of PZT rebar for flaw detection of concrete structures. J. Harbin Eng. Univ. 2015, 2, 139–142. [Google Scholar]
- Hou, S.; Zhang, H.B.; Ou, J.P. A PZT-based smart aggregate for compressive seismic stress monitoring. Smart Mater. Struct. 2012, 21, 105035. [Google Scholar] [CrossRef]
- Fan, S.; Zhao, S.; Qi, B.; Kong, Q. Damage evaluation of concrete column under impact load using a piezoelectric-based EMI technique. Sensors 2018, 18, 1591. [Google Scholar] [CrossRef] [Green Version]
- Song, G.; Qiao, P.; Binienda, W.K.; Zou, G.P. Active vibration damping of a composite beam using smart sensors and actuators. ASCE J. Aerosp. Eng. 2002, 15, 97–103. [Google Scholar] [CrossRef]
- De Oliveira, M.; Monteiro, A.; Vieira Filho, J. A New Structural Health Monitoring Strategy Based on PZT Sensors and Convolutional Neural Network. Sensors 2018, 18, 2955. [Google Scholar] [CrossRef] [Green Version]
- Liao, W.; Wang, J.X.; Song, G.; Gu, H.; Olmi, C.; Mo, Y.L. Structural health monitoring of concrete columns subjected to seismic excitations using piezoceramic-based sensors. Smart Mater. Struct 2011, 20, 125015. [Google Scholar] [CrossRef]
- Yang, Y.; Divsholi, B.S.; Soh, C.K. A reusable PZT transducer for monitoring initial hydration and structural health of concrete. Sensors 2010, 10, 5193–5208. [Google Scholar] [CrossRef]
- Pillatsch, P.; Xiao, B.L.; Shashoua, N.; Gramling, H.M.; Yeatman, E.M.; Wright, P.K. Degradation of bimorph piezoelectric bending beams in energy harvesting applications. Smart Mater. Struct 2017, 26, 035046. [Google Scholar] [CrossRef]
- Sun, Z.; Chang, C.C. Structural damage assessment based on wavelet packet transform. J. Struct. Eng. 2002, 128, 1354–1361. [Google Scholar] [CrossRef]
- Ravanfar, S.A.; Razak, H.A.; Ismail, Z.; Monajemi, H. An improved method of parameter identification and damage detection in beam structures under flexural vibration using wavelet multi-resolution analysis. Sensors 2015, 15, 22750–22775. [Google Scholar] [CrossRef] [PubMed] [Green Version]
- Gómez, M.; Castejón, C.; García-Prada, J. Review of recent advances in the application of the wavelet transform to diagnose cracked rotors. Algorithms 2016, 9, 19. [Google Scholar] [CrossRef]
- Liu, Y.; Ye, Y.C.; Wang, Q.H.; Wang, W.Q. Experimental Research on Shear Failure Monitoring of Composite Rocks Using Piezoelectric Active Sensing Approach. Sensors 2020, 20, 1376. [Google Scholar] [CrossRef] [Green Version]
- Zhang, J.; Huang, Y.; Zheng, Y. A Feasibility Study on Timber Damage Detection Using Piezoceramic-Transducer-Enabled Active Sensing. Sensors 2018, 18, 1563. [Google Scholar] [CrossRef] [Green Version]
- General Administration of Quality Supervision, Inspection and Quarantine of the People’s Republic of China. Test Method for Tensile Properties of Fiber Reinforced Plastics: GB/T 1447-2005; Standards Press of China: Beijing, China, 2005.
- General Administration of Quality Supervision, Inspection and Quarantine of the People’s Republic of China. Test Method for Compressive Properties of Fiber Reinforced Plastics: GB/T 1448-2005; Standards Press of China: Beijing, China, 2005.
- Ministry of Construction of the People’s Republic of China. Standard for Test Methods of Performance of Common Concrete Mixtures: GB/T 50080-2016; China Architecture & Building Press: Beijing, China, 2016.
Figure 1.
Block diagram of health monitoring system based on wave method.

Figure 2.
Schematic diagram and specimen photo of short glass fiber reinforced polymer (GFRP) concrete column.
Figure 2.
Schematic diagram and specimen photo of short glass fiber reinforced polymer (GFRP) concrete column.

Figure 3.
Nano-SiO2 powder and solution.

Figure 4.
Concrete with different nano-SiO2 contents.

Figure 5.
Short GFRP tube concrete column with nano-SiO2.

Figure 6.
Loading device.

Figure 7.
Picture of monitoring system.

Figure 8.
Failure modes of specimens at different concrete grades.

Figure 9.
Failure modes of specimens with different nano-SiO2 contents.

Figure 10.
Load–displacement curves of specimens with different nano-SiO2 contents.

Figure 11.
Curves of specimens at different concrete grades.

Figure 12.
Load–energy index curves of superplasticizer-added specimens with different nano-SiO2 contents.
Figure 12.
Load–energy index curves of superplasticizer-added specimens with different nano-SiO2 contents.

Figure 13.
Load–energy index curves of superplasticizer-added specimens at different concrete grades.
Figure 13.
Load–energy index curves of superplasticizer-added specimens at different concrete grades.

Figure 14.
Load–energy index curves of specimens without superplasticizer at different concrete grades.
Figure 14.
Load–energy index curves of specimens without superplasticizer at different concrete grades.

Figure 15.
Index curves of specimens with different nano-SiO2 contents.

Figure 16.
Load–damage index curves of specimens at different concrete grades.


Table 1.
Specimen number and specific parameters.
| Specimen Name | Height H (mm) | Length L (mm) | Thickness T (mm) | Concrete Grade C (MPa) | Nano SiO2 Content | Polycarboxylate Superplasticizer |
|---|---|---|---|---|---|---|
| GC20-WRA1-NS0 | 250 | 100 | 6 | C20 | 0 | 0.8% |
| GC20-WRA1-NS1 | 250 | 100 | 6 | C20 | 1% | 0.8% |
| GC20-WRA1-NS3 | 250 | 100 | 6 | C20 | 3% | 0.8% |
| GC30-WRA1-NS0 | 250 | 100 | 6 | C30 | 0 | 0.8% |
| GC30-WRA1-NS1 | 250 | 100 | 6 | C30 | 1% | 0.8% |
| GC30-WRA1-NS3 | 250 | 100 | 6 | C30 | 3% | 0.8% |
| GC40-WRA1-NS0 | 250 | 100 | 6 | C40 | 0 | 0.8% |
| GC40-WRA1-NS1 | 250 | 100 | 6 | C40 | 1% | 0.8% |
| GC40-WRA1-NS3 | 250 | 100 | 6 | C40 | 3% | 0.8% |
| GC10-WRA0-NS0 | 250 | 100 | 6 | C10 | 0 | 0 |
| GC20-WRA0-NS0 | 250 | 100 | 6 | C20 | 0 | 0 |
| GC30-WRA0-NS0 | 250 | 100 | 6 | C30 | 0 | 0 |
| GC40-WRA0-NS0 | 250 | 100 | 6 | C40 | 0 | 0 |
Table 2.
Specimen loading and data collection.
| GC20-WRA1-NS0 | Load(KN) | 0 | 14.6 | 16.9 | 22.3 | 35.5 | 47.9 | 55.2 | 63.8 | 75.0 | 89.2 | 104.9 | 119.5 | 132.7 | 141.9 | 150.0 | 159.1 | 165.3 | 171.5 | 179.5 | 184.3 | 188.6 | 190.1 |
| Wavelet packet-based energy index | 664.2 | 702.9 | 767.0 | 756.4 | 1176.7 | 423.0 | 268.0 | 225.1 | 259.0 | 270.4 | 264.7 | 572.6 | 929.3 | 359.2 | 198.4 | 191.9 | 145.5 | 208.4 | 141.7 | 121.6 | 99.1 | 75.1 | |
| Damage index | 0 | 0 | 0 | 0 | 0 | 0.69 | 0.79 | 0.82 | 0.78 | 0.77 | 0.77 | 0.60 | 0.71 | 0.71 | 0.83 | 0.84 | 0.88 | 0.81 | 0.88 | 0.90 | 0.93 | 0.95 | |
| GC20-WRA1-NS1 | Load(KN) | 0 | 0.3 | 0.9 | 4.8 | 12.3 | 36.5 | 57.0 | 75.1 | 97.7 | 119.7 | 142.5 | 160.0 | 176.8 | 194.5 | 207.4 | 221.3 | 232.9 | |||||
| Wavelet packet-based energy index | 1709.4 | 1705.3 | 1705.3 | 1553.6 | 1582.2 | 1716.5 | 2943.8 | 1870.7 | 905.3 | 415.9 | 1053.0 | 764.4 | 1133.7 | 937.1 | 1190.5 | 916.4 | 488.4 | ||||||
| Damage index | 0 | 0 | 0 | 0 | 0 | 0 | 0 | 0.33 | 0.68 | 0.87 | 0.62 | 0.73 | 0.60 | 0.67 | 0.56 | 0.67 | 0.83 | ||||||
| GC20-WRA1-NS3 | Load(KN) | 0 | 4.6 | 14.8 | 25.3 | 41.6 | 61.5 | 79.7 | 94.8 | 110.6 | 125.4 | 150.9 | 163.5 | 184.2 | 204.2 | 219.6 | 231.7 | ||||||
| Wavelet packet-based energy index | 1211.0 | 1286.3 | 1000.5 | 1532.6 | 1533.0 | 1224.0 | 847.8 | 840.6 | 924.3 | 950.4 | 1015.9 | 1005.0 | 1275.8 | 1309.9 | 1118.9 | 1022.5 | |||||||
| Damage index | 0 | 0 | 0 | 0 | 0 | 0.43 | 0.48 | 0.46 | 0.39 | 0.37 | 0.34 | 0.35 | 0.27 | 0.26 | 0.30 | 0.33 | |||||||
| GC30-WRA1-NS0 | Load(KN) | 0 | 1.4 | 3.9 | 6.6 | 10.0 | 16.7 | 22.3 | 33.3 | 46.2 | 62.3 | 75.6 | 99.7 | 110.7 | 123.5 | 135.4 | 145.2 | 162.3 | 179.7 | 197.7 | 208.6 | ||
| Wavelet packet-based energy index | 147.3 | 149.2 | 104.3 | 358.2 | 114.8 | 129.7 | 109.1 | 82.2 | 71.4 | 51.3 | 38.3 | 35.8 | 27.0 | 27.7 | 24.8 | 27.4 | 22.0 | 22.1 | 23.4 | 22.2 | |||
| Damage index | 0 | 0 | 0 | 0 | 0.85 | 0.84 | 0.87 | 0.89 | 0.91 | 0.94 | 0.95 | 0.95 | 0.97 | 0.97 | 0.98 | 0.97 | 0.98 | 0.98 | 0.98 | 0.98 | |||
| GC30-WRA1-NS1 | Load(KN) | 0 | 6.7 | 11.7 | 33.7 | 55.7 | 85.4 | 117.7 | 147.5 | 175.8 | 202.9 | 235.4 | 250.7 | 260.7 | 269.4 | ||||||||
| Wavelet packet-based energy index | 1031.1 | 917.9 | 786.3 | 623.9 | 298.2 | 343.9 | 930.3 | 1121.1 | 959.9 | 426.3 | 325.7 | 363.7 | 228.9 | 178.3 | |||||||||
| Damage index | 0 | 0 | 0 | 0 | 0 | 0 | 0 | 0 | 0.16 | 0.64 | 0.74 | 0.69 | 0.82 | 0.85 | |||||||||
| GC30-WRA1-NS3 | Load(KN) | 0 | 5.1 | 18.7 | 48.2 | 103.9 | 117.4 | 145.7 | 170.5 | 191.4 | 202.4 | ||||||||||||
| Wavelet packet-based energy index | 425.7 | 456.5 | 510.5 | 530.7 | 577.4 | 522.2 | 496.8 | 404.3 | 346.8 | 231.1 | |||||||||||||
| Damage index | 0 | 0 | 0 | 0 | 0 | 0.18 | 0.19 | 0.31 | 0.39 | 0.60 | |||||||||||||
| GC40-WRA1-NS0 | Load(KN) | 0 | 0.4 | 0.5 | 0.6 | 1.7 | 7.2 | 15.7 | 31.0 | 46.2 | 69.7 | 101.1 | 136.7 | 170.8 | 197.2 | 228.3 | |||||||
| Wavelet packet-based energy index | 338.7 | 322.5 | 322.3 | 321.6 | 320.9 | 371.9 | 425.3 | 276.9 | 282.3 | 158.0 | 105.5 | 57.8 | 98.3 | 43.0 | 36.7 | ||||||||
| Damage index | 0 | 0 | 0 | 0 | 0 | 0 | 0 | 0.33 | 0.31 | 0.62 | 0.76 | 0.90 | 0.79 | 0.94 | 0.95 | ||||||||
| GC40-WRA1-NS1 | Load(KN) | 0 | 0.1 | 0.2 | 0.3 | 1.2 | 2.3 | 5.2 | 7.2 | 21.9 | 43.7 | 64.5 | 84.8 | 102.4 | 120.7 | 142.5 | 163.4 | 184.7 | 209.1 | 229.4 | 251.5 | 267.4 | |
| Wavelet packet-based energy index | 686.3 | 684.8 | 670.3 | 666.1 | 653.9 | 679.7 | 649.5 | 776.5 | 754.0 | 786.7 | 661.7 | 594.1 | 276.0 | 237.5 | 147.7 | 110.2 | 86.4 | 89.6 | 76.0 | 67.7 | 50.4 | ||
| Damage index | 0 | 0 | 0 | 0 | 0 | 0 | 0 | 0 | 0 | 0 | 0.14 | 0.30 | 0.65 | 0.70 | 0.83 | 0.88 | 0.91 | 0.90 | 0.92 | 0.94 | 0.96 | ||
| GC40-WRA1-NS3 | Load(KN) | 0 | 0.1 | 0.5 | 4.1 | 7.1 | 17.8 | 29.4 | 42.3 | 59.1 | 81.8 | 108.2 | 140.1 | 168.7 | 199.2 | 223.1 | 223.4 | ||||||
| Wavelet packet-based energy index | 192.8 | 190.5 | 189.2 | 147.0 | 113.4 | 80.1 | 128.0 | 86.4 | 48.4 | 58.1 | 56.6 | 80.7 | 85.9 | 94.2 | 176.8 | 115.8 | |||||||
| Damage index | 0 | 0.01 | 0.02 | 0.28 | 0.47 | 0.66 | 0.37 | 0.64 | 0.83 | 0.80 | 0.78 | 0.63 | 0.60 | 0.54 | 0.30 | 0.44 | |||||||
| GC10-WRA0-NS0 | Load(KN) | 0 | 0.1 | 0.1 | 0.8 | 4.2 | 35.7 | 70.0 | 82.8 | 113.7 | 168.1 | ||||||||||||
| Wavelet packet-based energy index | 113.3 | 113.7 | 113.5 | 111.4 | 109.7 | 116.3 | 58.9 | 26.5 | 23.2 | 22.9 | |||||||||||||
| Damage index | 0 | 0 | 0.06 | 0.08 | 0.10 | 0.08 | 0.59 | 0.92 | 0.96 | 0.96 | |||||||||||||
| GC20-WRA0-NS0 | Load(KN) | 0 | 0.1 | 1.4 | 6.1 | 23.0 | 46.2 | 79.9 | 125.5 | 170.2 | 208.4 | 244.6 | 268.7 | ||||||||||
| Wavelet packet-based energy index | 449.2 | 447.5 | 457.3 | 415.9 | 477.8 | 478.1 | 345.9 | 130.6 | 70.5 | 60.7 | 57.3 | 48.0 | |||||||||||
| Damage index | 0 | 0 | 0 | 0 | 0 | 0 | 0.28 | 0.34 | 0.47 | 0.75 | 0.90 | 0.93 | |||||||||||
| GC30-WRA0-NS0 | Load(KN) | 0 | 2.3 | 18.8 | 46.9 | 90.7 | 143.6 | 196.8 | 245.9 | ||||||||||||||
| Wavelet packet-based energy index | 933.1 | 898.5 | 893.2 | 712.6 | 520.6 | 110.1 | 72.0 | 40.0 | |||||||||||||||
| Damage index | 0 | 0.03 | 0.25 | 0.32 | 0.44 | 0.45 | 0.61 | 0.65 | |||||||||||||||
| GC40-WRA0-NS0 | Load(KN) | 0 | 4.1 | 32.7 | 79.2 | 141.9 | 214.8 | 278.0 | 321.6 | ||||||||||||||
| Wavelet packet-based energy index | 1247.3 | 1186.1 | 1166.8 | 879.8 | 160.0 | 123.6 | 88.0 | 58.4 | |||||||||||||||
| Damage index | 0 | 0.05 | 0.26 | 0.34 | 0.87 | 0.90 | 0.94 | 0.97 |
© 2020 by the authors. Licensee MDPI, Basel, Switzerland. This article is an open access article distributed under the terms and conditions of the Creative Commons Attribution (CC BY) license (http://creativecommons.org/licenses/by/4.0/).
Share and Cite
MDPI and ACS Style
Chen, X.; Chen, Y. Experimental Study on Damage Identification of Nano-SiO2 Concrete Filled GFRP Tube Column Using Piezoceramic Transducers. Sensors 2020, 20, 2883. https://doi.org/10.3390/s20102883
AMA Style
Chen X, Chen Y. Experimental Study on Damage Identification of Nano-SiO2 Concrete Filled GFRP Tube Column Using Piezoceramic Transducers. Sensors. 2020; 20(10):2883. https://doi.org/10.3390/s20102883
Chicago/Turabian StyleChen, Xixiang, and Yu Chen. 2020. "Experimental Study on Damage Identification of Nano-SiO2 Concrete Filled GFRP Tube Column Using Piezoceramic Transducers" Sensors 20, no. 10: 2883. https://doi.org/10.3390/s20102883
Note that from the first issue of 2016, this journal uses article numbers instead of page numbers. See further details here.