Perceived Risk and Intentions to Practice Health Protective Behaviors in a Mining-Impacted Region

 ,
,  , ,
, ,
Abstract
:1. Introduction
2. Theoretical Framework and Hypotheses
Hypotheses
3. Materials and Methods
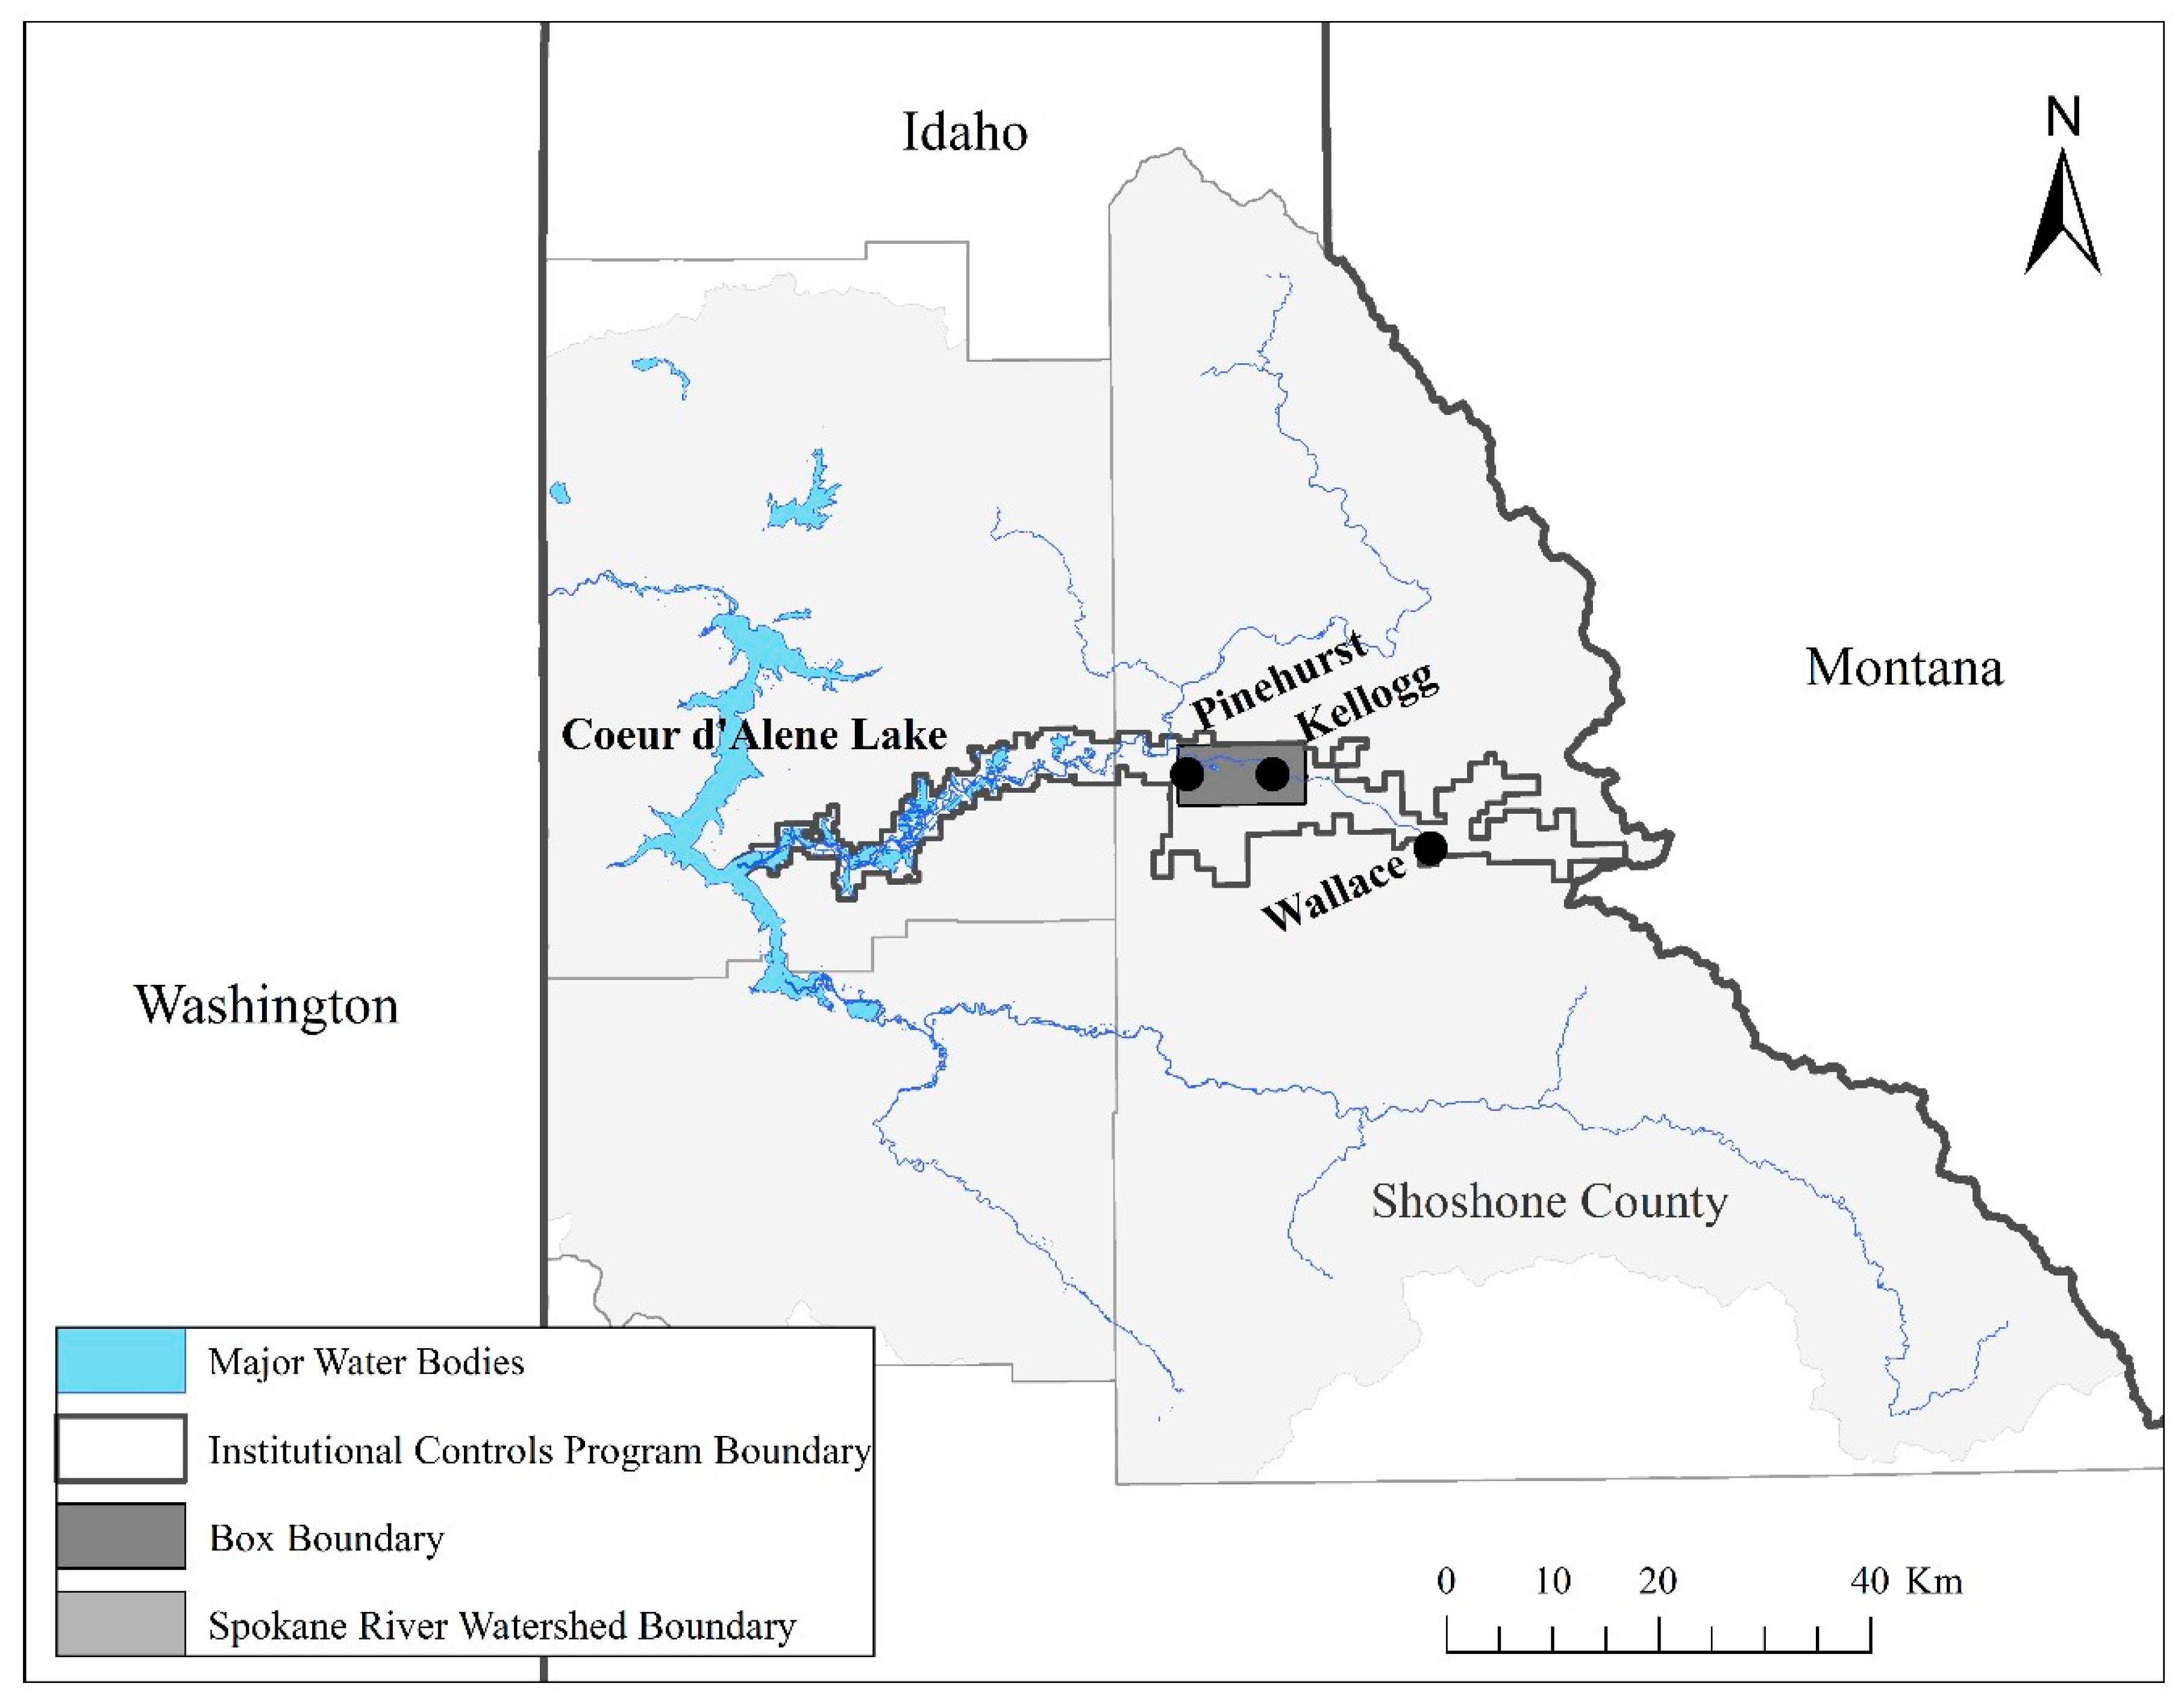
3.1. Study Area
3.2. Survey Development
3.2.1. Survey Measures
- Behavioral intentions: Respondents were asked to consider their intentions to complete six health protective behaviors related to avoiding exposure to Pb contamination over the next year. These behaviors included: removing dirt from clothes, toys, pets, cars, and equipment after spending time outdoors; staying on designated trails while recreating in areas with lead contamination warning signs; washing hands with clean water or wipes before eating or drinking after recreating or working outdoors; using a protective barrier such as a blanket when sitting on a sandy beach; and following the advice of a local public health official about ways to safely avoid lead contamination. Participants responded to all items on a 1 = very unlikely to 5 = very likely scale. A “does not apply” option was included, but these responses were excluded from the analysis. One example of an item measuring behavioral intentions asked about the likelihood that the participant would, “promptly removing dirt from your clothes, toys, pets, cars, and equipment after spending time outdoors.”
- HBM constructs: Twenty-seven items were included in the survey to measure the HBM constructs perceived severity, perceived susceptibility, perceived benefits, perceived barriers, and self-efficacy. Participants responded to all items on a 1 = strongly disagree to 5 = strongly agree scale. These items were adopted from several studies related to heavy metal contamination (e.g., [16,25,39,53]. The cue to action construct was measured through two items that asked respondents about how frequently they had thought about, read, or heard about Pb contamination issues in the past year. The scale ranged from 1 = never to 5 = very often. One example item, a measure for the perceived susceptibility construct, was, “I have experienced health effects related to lead contamination.”
- Sociodemographic characteristics: Eight items were about sociodemographic characteristics. Three items were included in the final analysis as covariates due to their possible influence on behavioral intentions. Survey respondents were asked to indicate gender (male, female, and prefer not to answer), age (continuous), and connections to mining. The latter item was phrased: “has a member of your household ever worked in a mining-related job in your local area?” Response options included “yes,” “no,” and “I do not know.” Response options for “I do not know” and “prefer not to answer” were excluded from the model analysis. Remaining items about the sociodemographic characteristics of the sample are reported in the results.
3.2.2. Survey Pretesting
3.2.3. Drop-off, Pick-up Survey Procedures
3.3. Data Analysis
3.3.1. Multiple Imputation
3.3.2. Structural Equation Model Analysis
4. Results
4.1. Sociodemographic Characteristics
4.2. Exploratory Factor Analysis
4.3. Confirmatory Factor Analysis
4.4. Path Analysis
5. Discussion
5.1. Mining-Impacted Communities, Risk Perception, and Behavioral Intentions
5.2. Sociodemographic Characteristics and Behavioral Intentions
5.3. Study Limitations
6. Conclusions
Supplementary Materials
Author Contributions
Funding
Acknowledgments
Conflicts of Interest
References
- Levin, R.; Brown, M.J.; Kashtock, M.E.; Jacobs, D.E.; Whelan, E.A.; Rodman, J.; Schock, M.R.; Padilla, A.; Sinks, T. Lead exposures in US children, 2008: Implications for prevention. Environ. Health Perspect. 2008, 116, 1285–1293. [Google Scholar] [CrossRef] [PubMed] [Green Version]
- Schoof, R.A.; Johnson, D.L.; Handziuk, E.R.; Van Landingham, C.; Feldpausch, A.M.; Gallagher, A.E.; Dell, L.D.; Kephart, A. Assessment of blood lead level declines in an area of historical mining with a holistic remediation and abatement program. Environ. Res. 2016, 150, 582–591. [Google Scholar] [CrossRef] [PubMed] [Green Version]
- Entwistle, J.A.; Hursthouse, A.S.; Reis, P.A.M.; Stewart, A.G. Metalliferous Mine Dust: Human Health Impacts and the Potential Determinants of Disease in Mining Communities. Curr. Pollut. Rep. 2019, 5, 67–83. [Google Scholar] [CrossRef] [Green Version]
- Landrigan, P.J.; Goldman, L.R. Children’s vulnerability to toxic chemicals: A challenge and opportunity to strengthen health and environmental policy. Health Aff. 2011, 30, 842–850. [Google Scholar] [CrossRef] [Green Version]
- Hon, K.L.; Fung, C.K.; Leung, A.K. Childhood lead poisoning: An overview. Hong Kong Med. J. 2017, 23, 616–621. [Google Scholar] [CrossRef] [Green Version]
- Niemuth, N.A.; Brown, V.J.; Sanford, J.D.; Naber, S.J.; Copas, K.L. Basis for educational recommendations on reducing childhood lead exposure. In Basis for Educational Recommendations on Reducing Childhood Lead Exposure; EPA: Washington, DC, USA, 2000. [Google Scholar]
- Needleman, H.L. Human Lead Exposure; CRC Press: Boca Raton, FL, USA, 1991; ISBN 9780849360343. [Google Scholar]
- Rossi, E. Low level environmental lead exposure–a continuing challenge. Clin. Biochem. Rev. 2008, 29, 63. [Google Scholar]
- Vorvolakos, T.; Arseniou, S.; Samakouri, M. There is no safe threshold for lead exposure: A literature review. Psychiatrike 2016, 27, 204–214. [Google Scholar] [CrossRef]
- Betts, K.S. CDC Updates Guidelines for Children’s Lead Exposure; National Institute of Environmental Health Sciences: Research Triangle, CA, USA, 2012.
- Klemick, H.; Mason, H.; Sullivan, K. Superfund cleanups and children’s lead exposure. J. Environ. Econ. Manag. 2020, 100, 102289. [Google Scholar] [CrossRef] [Green Version]
- von Lindern, I.; Spalinger, S.; Petroysan, V.; von Braun, M. Assessing remedial effectiveness through the blood lead: Soil/dust lead relationship at the Bunker Hill Superfund Site in the Silver Valley of Idaho. Sci. Total Environ. 2003, 303, 139–170. [Google Scholar] [CrossRef]
- Binns, H.J.; Gray, K.A.; Chen, T.; Finster, M.E.; Peneff, N.; Schaefer, P.; Ovsey, V.; Fernandes, J.; Brown, M.; Dunlap, B. Evaluation of landscape coverings to reduce soil lead hazards in urban residential yards: The Safer Yards Project. Environ. Res. 2004, 96, 127–138. [Google Scholar] [CrossRef]
- Ramirez, M.; Massolo, S.; Frache, R.; Correa, J.A. Metal speciation and environmental impact on sandy beaches due to El Salvador copper mine, Chile. Mar. Pollut. Bull. 2005, 50, 62–72. [Google Scholar] [CrossRef] [PubMed]
- Spalinger, S.M.; von Braun, M.C.; Petrosyan, V.; von Lindern, I.H. Northern Idaho house dust and soil lead levels compared to the Bunker Hill Superfund site. Environ. Monit. Assess. 2007, 130, 57. [Google Scholar] [CrossRef] [PubMed]
- Bland, A.D.; Kegler, M.C.; Escoffery, C.; Malcoe, L.H. Understanding childhood lead poisoning preventive behaviors: The roles of self-efficacy, subjective norms, and perceived benefits. Prev. Med. 2005, 41, 70–78. [Google Scholar] [CrossRef]
- USEPA Basis for Educational Recommendations on Reducing Childhood Lead Exposure; United States Environmental Protection Agency: Washington, DC, USA, 2000.
- Ramirez-Andreotta, M.D.; Brody, J.G.; Lothrop, N.; Loh, M.; Beamer, P.I.; Brown, P. Improving environmental health literacy and justice through environmental exposure results communication. Int. J. Environ. Res. Public Health 2016, 13, 690. [Google Scholar] [CrossRef] [PubMed] [Green Version]
- Basil, M.; Witte, K. Health risk message design using the extended parallel process model. In Health Communication Message Design: Theory and Practice; Sage Publications: Newbury Park, CA, USA, 2012; pp. 41–58. [Google Scholar]
- Sullivan, M.; Green, D. Misled about lead: An assessment of online public health education material from Australia’s lead mining and smelting towns. Environ. Health 2016, 15, 1. [Google Scholar] [CrossRef] [PubMed] [Green Version]
- Attems, M.-S.; Thaler, T.; Snel, K.A.W.; Davids, P.; Hartmann, T.; Fuchs, S. The influence of tailored risk communication on individual adaptive behaviour. Int. J. Disaster Risk Reduct. 2020, 49, 101618. [Google Scholar] [CrossRef]
- Fishbein, M.; Ajzen, I. Belief, Attitude, Intention, and Behavior: An Introduction to Theory and Research; Elsevier Science Publishing: New York, NY, USA, 1977. [Google Scholar]
- Glanz, K. Health Behavior: Theory, Research, and Practice; John Wiley & Sons: Hoboken, NJ, USA, 2015. [Google Scholar]
- Andrade, L.; O’Malley, K.; Hynds, P.; O’Neill, E.; O’Dwyer, J. Assessment of two behavioural models (HBM and RANAS) for predicting health behaviours in response to environmental threats: Surface water flooding as a source of groundwater contamination and subsequent waterborne infection in the Republic of Ireland. Sci. Total Environ. 2019, 685, 1019–1029. [Google Scholar] [CrossRef]
- Straub, C.L.; Leahy, J.E. Application of a Modified Health Belief Model to the Pro-Environmental Behavior of Private Well Water Testing. Jawra J. Am. Water Resour. Assoc. 2014, 50, 1515–1526. [Google Scholar] [CrossRef]
- Sheeran, P. Intention—behavior relations: A conceptual and empirical review. Eur. Rev. Soc. Psychol. 2002, 12, 1–36. [Google Scholar] [CrossRef]
- Mix, M.C. Leaded: The Poisoning of Idaho’s Silver Valley; Oregon State University Press: Corvallis, OR, USA, 2016. [Google Scholar]
- Gustavson, K.E.; Barnthouse, L.W.; Brierley, C.L.; Clark, E.H.; Ii, I.I.; Ward, C.H. Superfund and Mining Megasites; ACS Publications: Washington, DC, USA, 2007. [Google Scholar]
- Helkey, A. Getting the Lead Out—30 Years of Remediation and Education in the Silver Valley. Available online: https://static1.squarespace.com/static/585aee335016e1541642dc0c/t/5b86c97df950b7278c23dc62/1535560095766/Getting+the+Lead+Out.pdf (accessed on 22 March 2020).
- Rosenstock, I.M. Historical origins of the health belief model. Health Educ. Monogr. 1974, 2, 328–335. [Google Scholar] [CrossRef]
- Lippke, S. Outcome Expectation. In Encyclopedia of Personality and Individual Differences; Zeigler-Hill, V., Shackelford, T.K., Eds.; Springer International Publishing: Cham, Germany, 2017; pp. 1–2. ISBN 9783319280998. [Google Scholar]
- Bandura, A. Self-efficacy: Toward a unifying theory of behavioral change. Psychol. Rev. 1977, 84, 191–215. [Google Scholar] [CrossRef] [PubMed]
- Janz, N.K.; Becker, M.H. The health belief model: A decade later. Health Educ. Q. 1984, 11, 1–47. [Google Scholar] [CrossRef] [Green Version]
- Carpenter, C.J. A meta-analysis of the effectiveness of health belief model variables in predicting behavior. Health Commun. 2010, 25, 661–669. [Google Scholar] [CrossRef] [PubMed] [Green Version]
- Sheeran, P.; Maki, A.; Montanaro, E.; Avishai-Yitshak, A.; Bryan, A.; Klein, W.M.P.; Miles, E.; Rothman, A.J. The impact of changing attitudes, norms, and self-efficacy on health-related intentions and behavior: A meta-analysis. Health Psychol. 2016, 35, 1178. [Google Scholar] [CrossRef]
- Harrison, J.A.; Mullen, P.D.; Green, L.W. A meta-analysis of studies of the health belief model with adults. Health Educ. Res. 1992, 7, 107–116. [Google Scholar] [CrossRef]
- Jones, C.L.; Jensen, J.D.; Scherr, C.L.; Brown, N.R.; Christy, K.; Weaver, J. The Health Belief Model as an Explanatory Framework in Communication Research: Exploring Parallel, Serial, and Moderated Mediation. Health Commun. 2015, 30, 566–576. [Google Scholar] [CrossRef] [PubMed] [Green Version]
- Halpern, M.T.; Warner, K.E. Radon risk perception and testing: Sociodemographic correlates. J. Environ. Health 1994, 56, 31. [Google Scholar]
- Rinker, G.H.; Hahn, E.J.; Rayens, M.K. Residential radon testing intentions, perceived radon severity, and tobacco use. J. Environ. Health 2014, 76, 42–47. [Google Scholar]
- Davidson, D.J.; Freudenburg, W.R. Gender and environmental risk concerns: A review and analysis of available research. Environ. Behav. 1996, 28, 302–339. [Google Scholar] [CrossRef]
- Rice, L.J.; Brandt, H.M.; Hardin, J.W.; Ingram, L.A.; Wilson, S.M. Exploring perceptions of cancer risk, neighborhood environmental risks, and health behaviors of Blacks. J. Community Health 2015, 40, 419–430. [Google Scholar] [CrossRef]
- Greenberg, P. Risk perceptions and the maintenance of environmental injustice in Appalachia. Environ. Sociol. 2020, 6, 54–67. [Google Scholar] [CrossRef]
- Zhuang, J.; Cox, J.; Cruz, S.; Dearing, J.W.; Hamm, J.A.; Upham, B. Environmental stigma: Resident responses to living in a contaminated area. Am. Behav. Sci. 2016, 60, 1322–1341. [Google Scholar] [CrossRef] [Green Version]
- U.S. Census US Census QuickFacts, Shoshone County, Idaho; U.S. Census Bureau: Washington, DC, USA, 2018.
- ACS 2016 American Community Survey: 5-Year Data [2012–2016, Counties]. Available online: https://www.census.gov/programs-surveys/acs (accessed on 22 March 2020).
- Panhandle Health District Community Health Assessment. Available online: http://panhandlehealthdistrict.org/wp-content/uploads/2019/06/CHA-2018-final.pdf (accessed on 22 March 2020).
- USGS Watershed Boundary Dataset. Available online: https://www.usgs.gov/core-science-systems/ngp/national-hydrography/watershed-boundary-dataset?qt-science_support_page_related_con=4#qt-science_support_page_related_con (accessed on 22 March 2020).
- Alta Science and Engineering Inc. 2017 and 2018 Blood Lead Data Evaluation–Bunker Hill Mining and Metallurgical Complex. Superfund Site; Idaho Department of Environmental Quality and Environmental Protection Agency: Boise, ID, USA, 2019.
- Elias, R.W.; Gulson, B. Overview of lead remediation effectiveness. Sci. Total Environ. 2003, 303, 1–13. [Google Scholar] [CrossRef]
- von Lindern, I.; Spalinger, S.; Stifelman, M.L.; Stanek, L.W.; Bartrem, C. Estimating children’s soil/dust ingestion rates through retrospective analyses of blood lead biomonitoring from the Bunker Hill Superfund Site in Idaho. Environ. Health Perspect. 2016, 124, 1462. [Google Scholar] [CrossRef] [PubMed] [Green Version]
- Sprenke, K.F.; Rember, W.C.; Bender, S.F.; Hoffmann, M.L.; Rabbi, F.; Chamberlain, V.E. Toxic metal contamination in the lateral lakes of the Coeur d’Alene River valley, Idaho. Environ. Geol. 2000, 39, 575–586. [Google Scholar] [CrossRef]
- Revilla, M.A.; Saris, W.E.; Krosnick, J.A. Choosing the number of categories in agree–disagree scales. Sociol. Methods Res. 2014, 43, 73–97. [Google Scholar] [CrossRef]
- Devitt, C.; O’Neill, E.; Waldron, R. Drivers and barriers among householders to managing domestic wastewater treatment systems in the Republic of Ireland; implications for risk prevention behaviour. J. Hydrol. 2016, 535, 534–546. [Google Scholar] [CrossRef]
- Brown, T.A. Confirmatory Factor Analysis for Applied Research; Guilford Publications: New York, NY, USA, 2014. [Google Scholar]
- Steele, J.; Bourke, L.; Luloff, A.E.; Liao, P.-S.; Theodori, G.L.; Krannich, R.S. The drop-off/pick-up method for household survey research. Community Dev. 2001, 32, 238–250. [Google Scholar] [CrossRef]
- Dillman, D.A. Mail and Internet Surveys: The Tailored Design Method–2007 Update with New Internet, Visual, and Mixed-Mode Guide; John Wiley & Sons: Hoboken, NJ, USA, 2011. [Google Scholar]
- Kline, R.B. Principles and Practice of Structural Equation Modeling; Guilford Publications: New York, NY, USA, 2015. [Google Scholar]
- Olinsky, A.; Chen, S.; Harlow, L. The comparative efficacy of imputation methods for missing data in structural equation modeling. Eur. J. Oper. Res. 2003, 151, 53–79. [Google Scholar] [CrossRef]
- van Buuren, S.; Groothuis-Oudshoorn, K. mice: Multivariate Imputation by Chained Equations in R. J. Stat. Softw. 2011, 45, 1–67. [Google Scholar] [CrossRef] [Green Version]
- Rosseel, Y. Lavaan: An R package for structural equation modeling and more. Version 0.5–12 (BETA). J. Stat. Softw. 2012, 48, 1–36. [Google Scholar] [CrossRef] [Green Version]
- Williams, B.; Onsman, A.; Brown, T. Exploratory factor analysis: A five-step guide for novices. Australas. J. Paramed. 2010, 8. [Google Scholar] [CrossRef] [Green Version]
- Costello, A.B.; Osborne, J. Best practices in exploratory factor analysis: Four recommendations for getting the most from your analysis. Pract. Assess. Res. Eval. 2005, 10, 7. [Google Scholar]
- Santos, J.R.A. Cronbach’s alpha: A tool for assessing the reliability of scales. J. Ext. 1999, 37, 1–5. [Google Scholar]
- Rahman, W.; Shah, F.A.; Rasli, A. Use of Structural Equation Modeling in Social Science Research. Asian Soc. Sci. 2015, 11, 371. [Google Scholar] [CrossRef]
- Muthén, B. A general structural equation model with dichotomous, ordered categorical, and continuous latent variable indicators. Psychometrika 1984, 49, 115–132. [Google Scholar] [CrossRef] [Green Version]
- Şimşek, G.G.; Noyan, F. Structural equation modeling with ordinal variables: A large sample case study. Qual. Quant. 2012, 46, 1571–1581. [Google Scholar] [CrossRef]
- Suh, Y. The Performance of Maximum Likelihood and Weighted Least Square Mean and Variance Adjusted Estimators in Testing Differential Item Functioning With Nonnormal Trait Distributions. Struct. Equ. Modeling 2015, 22, 568–580. [Google Scholar] [CrossRef]
- Xia, Y.; Yang, Y. RMSEA, CFI, and TLI in structural equation modeling with ordered categorical data: The story they tell depends on the estimation methods. Behav. Res. 2019, 51, 409–428. [Google Scholar] [CrossRef]
- National Research Council. Superfund and Mining Megasites: Lessons from the Coeur d’Alene River Basin; The National Academies Press: Washington, DC, USA, 2005; ISBN 9780309097147. [Google Scholar]
- Zaragoza, L.J. The Environmental Protection Agency’s Use of Community Involvement to Engage Communities at Superfund Sites. Int. J. Environ. Res. Public Health 2019, 16, 4166. [Google Scholar] [CrossRef] [Green Version]
- Messer, C.M.; Shriver, T.E.; Adams, A.E. Collective Identity and Memory: A Comparative Analysis of Community Response to Environmental Hazards. Rural Sociol. 2015, 80, 314–339. [Google Scholar] [CrossRef]
- Shriver, T.E.; Messer, C.M.; Whittington, J.R.; Adams, A.E. Industrial pollution and acquiescence: Living with chronic remediation. Environ. Polit. 2019, 29, 1–20. [Google Scholar] [CrossRef]
- Adams, A.E.; Shriver, T.E.; Saville, A.; Webb, G. Forty years on the fenceline: Community, memory, and chronic contamination. Environ. Sociol. 2018, 4, 210–220. [Google Scholar] [CrossRef]
- Shriver, T.; Kennedy, D. Contested Environmental Hazards and Community Conflict Over Relocation*. Rural Sociol. 2005, 70, 491–513. [Google Scholar] [CrossRef]
- Tang, Z.; Guo, Z.; Zhou, L.; Xue, S.; Zhu, Q.; Zhu, H. Combined and Relative Effect Levels of Perceived Risk, Knowledge, Optimism, Pessimism, and Social Trust on Anxiety among Inhabitants Concerning Living on Heavy Metal Contaminated Soil. Int. J. Environ. Res. Public Health 2016, 13, 1076. [Google Scholar] [CrossRef] [PubMed] [Green Version]
- Baxter, J.; Lee, D. Understanding expressed low concern and latent concern near a hazardous waste treatment facility. J. Risk Res. 2004, 7, 705–729. [Google Scholar] [CrossRef]
- Grasmück, D.; Scholz, R.W. Risk perception of heavy metal soil contamination by high-exposed and low-exposed inhabitants: The role of knowledge and emotional concerns. Risk Anal. Int. J. 2005, 25, 611–622. [Google Scholar] [CrossRef]
- Walpole, H.D.; Wilson, R.S. Extending a broadly applicable measure of risk perception: The case for susceptibility. J. Risk Res. 2020. [Google Scholar] [CrossRef]
- Dömötör, Z.; Nordin, S.; Witthöft, M.; Köteles, F. Modern health worries: A systematic review. J. Psychosom. Res. 2019, 124, 109781. [Google Scholar] [CrossRef]
- Wolde, B.; Lal, P.; Harclerode, M.; Rossi, A. Comparative Optimism: Relative Risk Perception and Behavioral Response to Lead Exposure. Environ. Manag. 2019, 63, 691–701. [Google Scholar] [CrossRef]
- Noar, S.M.; Zimmerman, R.S. Health Behavior Theory and cumulative knowledge regarding health behaviors: Are we moving in the right direction? Health Educ. Res. 2005, 20, 275–290. [Google Scholar] [CrossRef] [Green Version]
- Sheeran, P.; Abraham, C. The health belief model. Predict. Health Behav. 1996, 2, 29–80. [Google Scholar]
- Weinstein, N.D. Misleading tests of health behavior theories. Ann. Behav. Med. 2007, 33, 1–10. [Google Scholar] [CrossRef] [PubMed]
- Grimm, P. Social Desirability Bias. In Wiley International Encyclopedia of Marketing; American Cancer Society: Atlanta, GA, USA, 2010; ISBN 9781444316568. [Google Scholar]


| Survey Sample | n (%) | Household Type | Community | |||
|---|---|---|---|---|---|---|
| Multifamily | Single-Family | Kellogg | Pinehurst | Wallace | ||
| Selected households | 773 (100%) | 193 (25%) | 580 (75%) | 365 (47%) | 255 (33%) | 159 (20%) |
| Removed from sample | ||||||
| Vacant/unsafe | 204 (26%) | |||||
| Refusals | 126 (16%) | |||||
| Unreturned mailers | 119 (15%) | |||||
| Incomplete | 18 (5%) | |||||
| Survey responses | 306 (40%) | 58 (18%) | 248 (82%) | 143 (47%) | 113 (37%) | 49 (16%) |
| Characteristic | Mean (SD) (% (frequency)) |
|---|---|
| Age (years, M (SD)) | 54.5 (17.7) |
| Years lived in study region (years, M (SD)) | 33.3 (21.5) |
| Gender (% (frequency)) | |
| Female | 54% (165) |
| Male | 44% (134) |
| Prefer not to say | 2% (6) |
| Race/ethnicity (% (frequency)) | |
| White | 90.8% (278) |
| No response | 4.6% (14) |
| All others | 5% (14) |
| Highest education (% (frequency)) | |
| Advanced degree | 9.8% (30) |
| College degree | 26.1% (80) |
| Some college but no degree | 30.1% (92) |
| High school graduate | 28.1% (86) |
| Less than high school degree | 5.2% (16) |
| Occupational status (% (frequency)) | |
| Retired | 35.6% (109) |
| Working full-time | 36.3% (114) |
| Homemaker | 8.8% (27) |
| Working part-time | 7.2% (26) |
| Disabled/medical leave | 4.6% (5) |
| Student | 0.7% (2) |
| Unemployed | 1.3% (4) |
| No response | 3.0% (9) |
| Approximate household income (% (frequency)) | |
| Less than $20,000 | 21.6% (66) |
| $20,000 to $49,999 | 30.7% (94) |
| $50,000 to $79,999 | 22.5% (69) |
| $80,000 to $99,000 | 8.2% (26) |
| $100,000 or more | 6.5% (21) |
| No response | 10% (30) |
| Family in mining (% (frequency)) | |
| No | 53.3% (163) |
| Yes | 44.4% (136) |
| Not sure | 1.6% (5) |
| Item | B (SE) a,b | β |
|---|---|---|
| Perceived Benefits | ||
| Indicate to what extent you agree that completing the following actions are good for your health: | ||
| Promptly removing dirt from your clothes, toys, pets, cars, and equipment after spending time outdoors. | 1.00 | 0.80 |
| Staying on designated trails while recreating in areas with lead contamination warning signs posted. | 1.01 (0.03) | 0.87 |
| Washing your hands with clean water or wipes before eating or drinking after recreating or working outdoors. | 0.92 (0.04) | 0.77 |
| Using a protective barrier such as a blanket when sitting on a sandy beach. | 1.03 (0.03) | 0.86 |
| Following the advice of a local public health official about ways to safely avoid lead contamination. | 0.10 (0.03) | 0.83 |
| Perceived Severity | ||
| I worry about lead contamination while spending time outdoors. | 1.00 | 0.80 |
| It is worth my time to avoid lead contamination while spending time outdoors. | 1.02 (0.06) | 0.79 |
| I worry about lead contamination entering my home. | 0.97 (0.04) | 0.75 |
| It is worth my time to clean my home to prevent lead contamination. | 1.01 (0.06) | 0.79 |
| Behavioral Intention | ||
| Consider your recreational and outdoor activities in your local area over the next 12 months. How likely is it that you will? | ||
| Promptly removing dirt from your clothes, toys, pets, cars, and equipment after spending time outdoors. | 1.00 | 0.80 |
| Staying on designated trails while recreating in areas with lead contamination warning signs posted. | 0.90 (0.05) | 0.72 |
| Washing your hands with clean water or wipes before eating or drinking after recreating or working outdoors. | 0.90 (0.06) | 0.71 |
| Using a protective barrier such as a blanket when sitting on a sandy beach. | 0.97 (0.05) | 0.77 |
| Following the advice of a local public health official about ways to safely avoid lead contamination. | 1.07 (0.05) | 0.85 |
| Perceived Susceptibility | ||
| I have experienced health effects related to lead contamination. | 1.00 | 0.90 |
| I feel I will experience health effects related to lead contamination at some time during my life. | 1.10 (0.03) | 0.99 |
| I am more likely than the average person to experience health effects from lead contamination. | 0.88 (0.03) | 0.79 |
| Self-Efficacy | ||
| I know a lot about the health effects from lead contamination. | 1.00 | 0.90 |
| I am better informed about the health effects of lead contamination than most people. | 0.96 (0.04) | 0.90 |
| Perceived Barriers | ||
| I know who to ask if I have questions about preventing health effects from lead contamination. | 1.00 | 0.90 |
| I am aware of the available resources for preventing health effects of lead contamination. | 1.03 (0.03) | 0.96 |
| Model | Model 1 | Model 2 | Model 3 | |||
|---|---|---|---|---|---|---|
| Independent Variable | b (SE) | β | b (SE) | β | b (SE) | β |
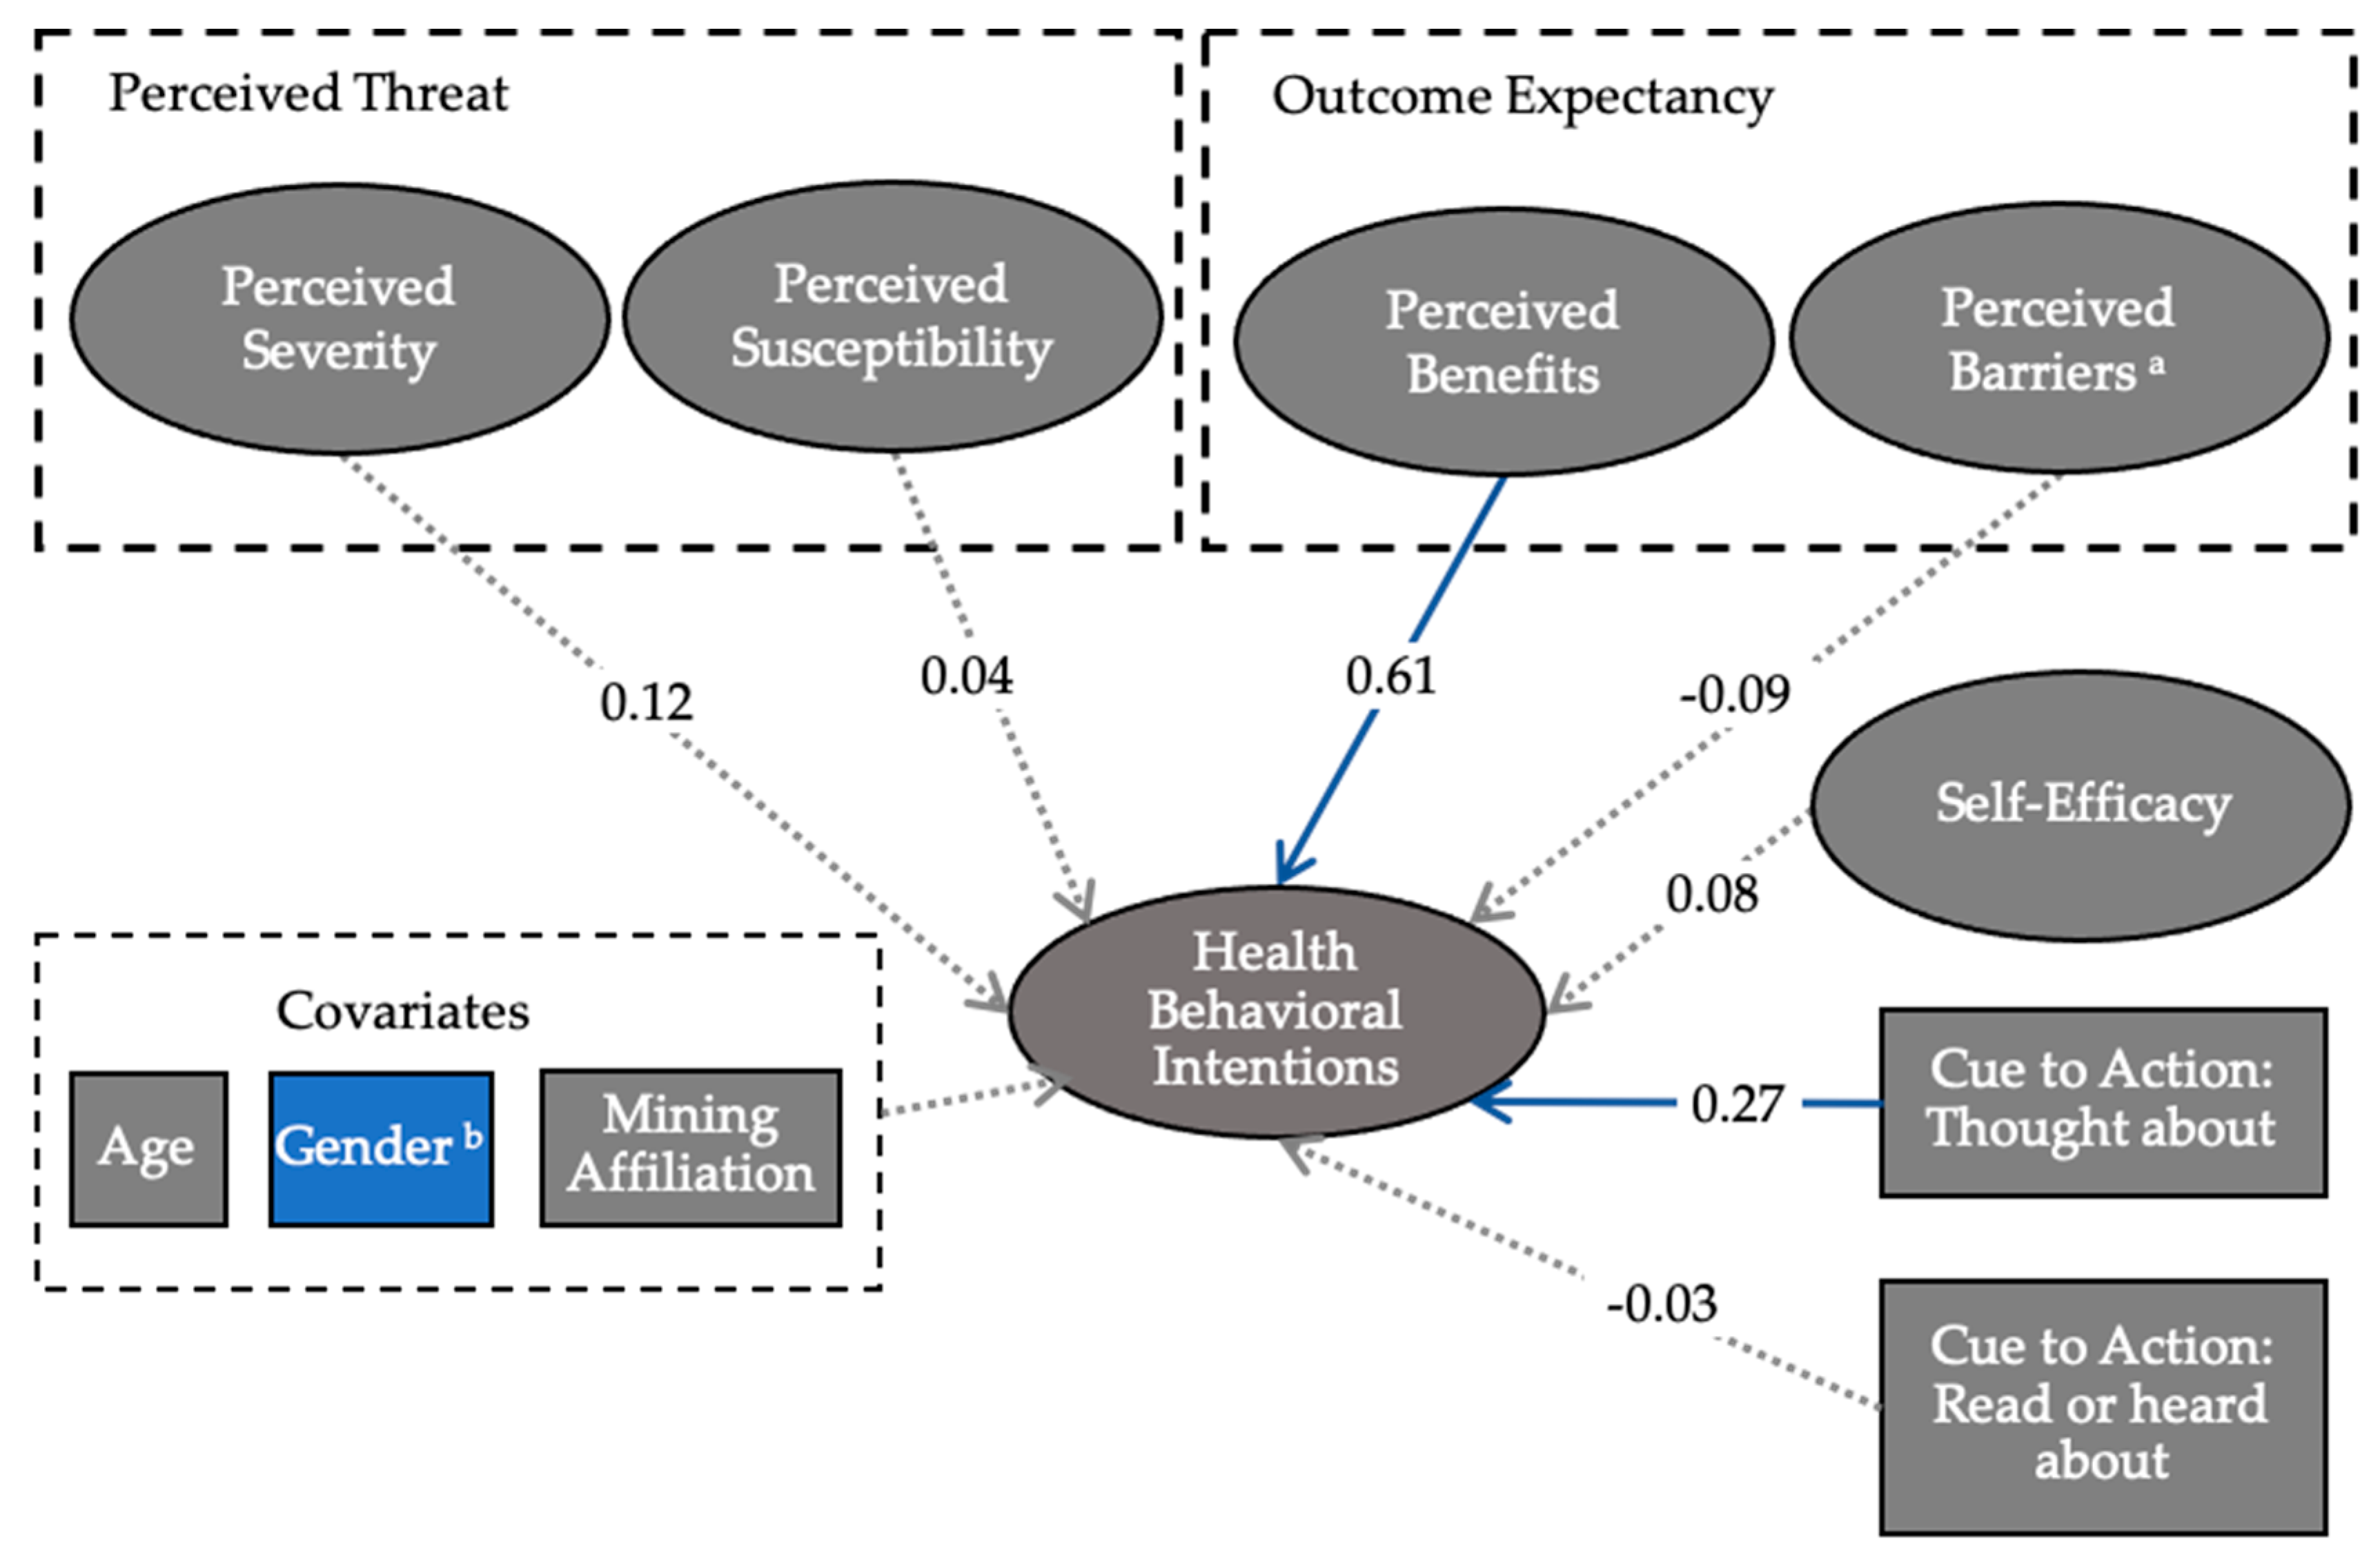
| Perceived severity | 0.17 (0.09) | 0.16 | 0.57 (0.07) * | 0.62 | 0.15 (0.09) | 0.12 |
| Perceived susceptibility | 0.00 (0.06) | 0.00 | −0.12 (0.07) | −0.14 | 0.04 (0.06) | 0.04 |
| Perceived benefits | 0.64 (0.06) * | 0.67 | 0.63 (0.06) * | 0.61 | ||
| Perceived barriers | −0.06 (0.09) | −0.08 | 0.07 (0.10) | 0.08 | −0.08 (0.09) | −0.09 |
| Self-efficacy | 0.05 (0.08) | 0.06 | 0.02 (0.09) | 0.02 | 0.08 (0.09) | 0.08 |
| 1 Cue: thought about | 0.21 (0.04) * | 0.26 | 0.21 (0.04) * | 0.26 | 0.21 (0.04) * | 0.26 |
| 1 Cue: read or heard about | −0.02 (0.05) | −0.03 | −0.02 (0.05) | −0.03 | −0.02 (0.05) | −0.03 |
| Gender (0 = F, 1 = M) | −0.36 (0.10) * | −0.22 | ||||
| Mining affiliation (0 = no, 1 = yes) | −0.13 (0.10) | −0.07 | ||||
| Age | −0.00 (0.00) | −0.03 | ||||
Publisher’s Note: MDPI stays neutral with regard to jurisdictional claims in published maps and institutional affiliations. |
© 2020 by the authors. Licensee MDPI, Basel, Switzerland. This article is an open access article distributed under the terms and conditions of the Creative Commons Attribution (CC BY) license (http://creativecommons.org/licenses/by/4.0/).
Share and Cite
Cooper, C.M.; Langman, J.B.; Sarathchandra, D.; Vella, C.A.; Wardropper, C.B. Perceived Risk and Intentions to Practice Health Protective Behaviors in a Mining-Impacted Region. Int. J. Environ. Res. Public Health 2020, 17, 7916. https://doi.org/10.3390/ijerph17217916
Cooper CM, Langman JB, Sarathchandra D, Vella CA, Wardropper CB. Perceived Risk and Intentions to Practice Health Protective Behaviors in a Mining-Impacted Region. International Journal of Environmental Research and Public Health. 2020; 17(21):7916. https://doi.org/10.3390/ijerph17217916
Chicago/Turabian StyleCooper, Courtney M., Jeff B. Langman, Dilshani Sarathchandra, Chantal A. Vella, and Chloe B. Wardropper. 2020. "Perceived Risk and Intentions to Practice Health Protective Behaviors in a Mining-Impacted Region" International Journal of Environmental Research and Public Health 17, no. 21: 7916. https://doi.org/10.3390/ijerph17217916