Virological characteristics correlating with SARS-CoV-2 spike protein fusogenicity
 MST Monira Begum1
  Kimiko Ichihara1 Otowa Takahashi1
  Hesham Nasser1,2
  Michael Jonathan1,3
  Kenzo Tokunaga4 Isao Yoshida5 Mami Nagashima5
  Kenji Sadamasu5
  Kazuhisa Yoshimura5 The Genotype to Phenotype Japan (G2P-Japan) Consortium
  Kei Sato6,7,8,9,10,11,12
  Terumasa Ikeda1*
- 1Division of Molecular Virology and Genetics, Joint Research Center for Human Retrovirus Infection, Kumamoto University, Kumamoto, Japan
- 2Department of Clinical Pathology, Faculty of Medicine, Suez Canal University, Ismailia, Egypt
- 3Graduate School of Medical Sciences, Kumamoto University, Kumamoto, Japan
- 4Department of Pathology, National Institute of Infectious Diseases, Tokyo, Japan
- 5Tokyo Metropolitan Institute of Public Health, Tokyo, Japan
- 6Division of Systems Virology, Department of Microbiology and Immunology, The Institute of Medical Science, The University of Tokyo, Tokyo, Japan
- 7International Research Center for Infectious Diseases, The Institute of Medical Science, The University of Tokyo, Tokyo, Japan
- 8International Vaccine Design Center, The Institute of Medical Science, The University of Tokyo, Tokyo, Japan
- 9Graduate School of Medicine, The University of Tokyo, Tokyo, Japan
- 10Graduate School of Frontier Sciences, The University of Tokyo, Kashiwa, Japan
- 11Collaboration Unit for Infection, Joint Research Center for Human Retrovirus infection, Kumamoto University, Kumamoto, Japan
- 12CREST, Japan Science and Technology Agency, Kawaguchi, Japan
Introduction: The severe acute respiratory syndrome coronavirus (SARS-CoV-2) spike (S) protein is essential in mediating membrane fusion of the virus with the target cells. Several reports demonstrated that SARS-CoV-2 S protein fusogenicity is reportedly closely associated with the intrinsic pathogenicity of the virus determined using hamster models. However, the association between S protein fusogenicity and other virological parameters remains elusive.
Methods: In this study, we investigated the virological parameters (e.g., S1/S2 cleavage efficiency, plaque size, pseudoviral infectivity, pseudovirus entry efficiency, and viral replication kinetics) of eleven previous variants of concern (VOCs) and variants of interest (VOIs) correlating with S protein fusogenicity.
Results and discussion: S protein fusogenicity was found to be strongly correlated with S1/S2 cleavage efficiency and plaque size formed by clinical isolates. However, S protein fusogenicity was less associated with pseudoviral infectivity, pseudovirus entry efficiency, and viral replication kinetics. Taken together, our results suggest that S1/S2 cleavage efficiency and plaque size could be potential indicators to predict the intrinsic pathogenicity and S protein fusogenicity of newly emerged SARS-CoV-2 variants.
Introduction
Severe acute respiratory syndrome coronavirus 2 (SARS-CoV-2) is the causative agent of coronavirus disease 2019 (COVID-19). Since the first cases of a novel coronavirus infection were detected in Wuhan, Hubei Province, China, in December 2019 (1, 2), the disease spread rapidly over the world and World Health Organization (WHO) declared it a Public Health Emergency of International Concern (PHEIC) as a COVID-19 pandemic on January 30, 2020 (3). Although WHO announced the end of PHEIC on May 5, 2023 (4), the COVID-19 pandemic is not over, thus far causing millions of deaths globally (5).
SARS-CoV-2 displays a long RNA genome of approximately 30 kbp [reviewed in (6, 7)], encoding 4, structural proteins [Spike (S), Envelope (E), Nucleocapsid (N), Membrane (M)], 9 accessory proteins (ORF3a, 3b, 6, 7a, 7b, 8, 9b, 9c, and 10), and 16 nonstructural proteins (NSPs; NSP1–16, encoded by the ORF1a and ORF1b genes), respectively [reviewed in (7–9)]. SARS-CoV-2 S protein fulfills an important role in mediating the virus-target cell membrane fusion, thereby triggering viral entry into the target cells [reviewed in (10, 11)]. After its translation, cellular proteases (e.g., Furin in the Golgi apparatus of the infected cells) cleave the S protein into two subunits, S1 and S2 [reviewed in (10)]. This S1/S2 cleavage is important for SARS-CoV2 pathogenicity as SARS-CoV-2 lacking the furin cleavage site in the S protein exhibits attenuated viral pathogenicity in cell line, mouse, and hamster models (12). The S protein is assembled as a trimer, inserted into viral particles along with the other viral components. The S1 and S2 subunits bind noncovalently and are exposed on the viral surface until meeting the target cells. To enter the target cells, the viral S protein and the host cell receptor angiotensin-converting enzyme 2 (ACE2) have to interact (13). The engagement of the receptor-binding domain in the S1 subunit to ACE2 induces conformational changes in the S protein, leading to the S2’ site cleavage in the S2 subunit and fusion peptide insertion into the target cell membrane [reviewed in (10)]. Next, the 6-bundle helix is formed by heptad repeats (HR) 1 and 2 of the S2 subunit as an indispensable fusion step, creating a fusion pore that facilitates genetic material transfer into the host cells. The S2’ site cleavage in the S2 subunit depends on the following SARS-CoV-2 entry routes [reviewed in (10)]. First, the endosome-mediated entry pathway. Upon the S1 subunit-ACE2 interaction, a virus-ACE2 complex is internalized into the target cells by forming an endosome, where Cathepsin L cleaves the S2 subunit S2’ site [reviewed in (10)]. Second, the target cell surface, using transmembrane protease serine 2 (TMPRSS2) for the S2 subunit S2’ site cleavage [reviewed in (10, 14)].
SARS-CoV-2 is continually evolving, with mutations appearing in its RNA genome since its discovery in 2019 [reviewed in (6, 15)]. These S gene mutations influence transmissibility, pathogenicity, and vaccine- and viral infection-induced immune response resistance [reviewed in (11, 14, 16–19)]. Multiple SARS-CoV-2 variants have emerged during the pandemic, certain among them predominantly spreading across the world. Initially, the Wuhan-Hu1 strain was outcompeted by the B.1 lineage (harboring the D614G mutation in the S protein), a potential ancestor of all recent variants [reviewed in (11, 15, 17)]. Then, WHO defined the Alpha, Beta, Gamma, Delta, and Omicron BA.1, BA.2, and BA.5 variants as variants of concern (VOCs) as well as Lambda and Mu as variants of interest (VOIs) [reviewed in (11, 15, 17)], being already de-escalated from the VOC and VOI lists.
Efforts to describe the SARS-CoV-2 S protein features revealed that the S protein fusogenic potential of the SARS-CoV-2 variants is closely associated with their pathogenicity, determined using a hamster model without immunity against vaccines and viral infection (hereafter referred to as intrinsic pathogenicity) (20–24). For example, the Delta variant possesses relatively more fusogenic S protein than the Omicron BA.1 and B.1.1 variants (21, 23). SARS-CoV-2 variants display higher intrinsic pathogenicity associated with the S protein-mediated fusogenicity strength (20–24). However, the association of S protein-mediated fusogenicity with other virological parameters (e.g., S1/S2 cleavage efficiency, plaque size, pseudoviral infectivity, pseudovirus entry efficiency, and viral replication kinetics) remains to be fully determined. In this study, we investigate the virological parameters of eleven SARS-CoV-2 variants correlating with S protein fusogenicity.
Methods
Cell lines
HEK293T cells (a human embryonic kidney cell line; ATCC, CRL-1573), HEK293 cells (a human embryonic kidney cell line; ATCC, CRL-1573) and HOS-ACE2/TMPRSS2 cells (HOS cells stably expressing human ACE2 and TMPRSS2) (25) were cultured in high glucose Dulbecco’s Modified Eagle Medium (DMEM, high glucose) (Wako, Cat# 044-29765) supplemented with 10% fetal bovine serum (FBS) (NICHIREI, Cat# 175012) and 1% penicillin/streptomycin (P/S) (Wako, Cat# 168-23191). VeroE6/TMPRSS2 cells (VeroE6 cells stably expressing human TMPRSS2; JCRB Cell Bank, JCRB1819) (26) were maintained in DMEM (low glucose, Wako, Cat# 041-29775) containing 10% FBS, G418 (1 mg/ml; Wako, Cat#070-06803) and 1% P/S. Calu-3 cells (ATCC, HTB-55) were maintained in EMEM (Wako, Cat#055-08975) containing 20% FBS and 1% P/S. Calu-3/DSP1-7 cells [Calu-3 cells stably expressing dual split protein1-7 (DSP1-7)] (27) were maintained in EMEM (Wako, Cat# 055-08975) containing 20% FBS and 1% P/S. All cells were maintained at 37°C with 5% CO2.
Virus preparation
SARS-CoV-2 Wuhan variant (strain SARS-CoV-2/Hu/DP/Kng/19-020 strain, Genbank accession no. LC528232) (28) was provided by Drs. Tomohiko Takasaki and Jun-Ichi Sakuragi (Kanagawa Prefectural Institute of Public Health). SARS-CoV-2 Alpha (strain QHN001, GISAID ID: EPI_ISL_804007) (28), Beta (strain TY8-612, GISAID ID: EPI_ISL_1123289) (29), Gamma (strain TY7-503, GISAID ID: EPI_ISL_877769) (28, 29), Delta (strain TY11-927, GISAID ID: EPI_ISL_2158617), Lambda (strain TY33-456, GISAID ID: EPI_ISL_4204973), Mu (strain TY26-717, GISAID ID: EPI_ISL_4470503), Omicron BA.1 (strain TY38-873, GISAID ID: EPI_ISL_7418017) (23), and Omicron BA.2 (strain TY40-385, GISAID ID: EPI_ISL_9595859) (22, 30) variants were obtained from National Institute of Infectious Diseases. D614G-bearing B.1.1 (strain TKYT41838, Genbank accession no. LC606020) and BA.5 (strain TKYS14631; GISAID ID: EPI_ISL_12812500) (20, 22) variants were provided by Tokyo Metropolitan Institute of Public Health.
Virus propagation was performed as previously described (28, 30, 31). Briefly, VeroE6/TMPRSS2 cells (5 × 10⁶ cells) were seeded in a T-75 flask the day before infection. Virus was diluted in virus dilution buffer [1M HEPES, DMEM (low glucose), Non-essential Amino acid (gibco, Cat# 11140-050), 1% P/S] and the dilution buffer containing virus was added to the flask after removing the initial medium. After 1 hour of incubation at 37°C, the supernatant was replaced with 15 ml of 2% FBS/DMEM (low glucose) and cell culture was continued to incubate at 37°C until visible cytopathic effect (CPE) was clearly observed. Then, cell culture supernatant was collected, centrifuged at 300 × g for 10 minutes and frozen at –80°C as working virus stock. The titer of the prepared working virus was determined as the 50% tissue culture infectious dose (TCID50) (20, 30, 32). The day before infection, VeroE6/TMPRSS2 cells (10,000 cells) were seeded in a 96-well plate and infected with serially diluted working virus stocks. The infected cells were incubated at 37°C for 4 days and the appearance of CPEs in the infected cells was observed by a microscope. The value of TCID50/ml was calculated by the Reed-Muench method (33).
Plasmid construction
Plasmids expressing the codon-optimized SARS-CoV-2 S proteins of Wuhan (34), B.1.1 (S gene bearing D614G mutation) (34), Alpha (21), Beta (21), Gamma (35), Delta (21), Lambda (35), Mu (36), BA.1 (23), BA.2 (24), and BA.5 (20) variants were prepared in previous studies. For creation of S proteins with 19 amino acids deletion at the C-terminal end, each S gene was amplified with primers; forward, 5’-NNN NNG GTA CCA TGT TTG TGT TCC TGG TGC T-3´ and reverse 5’-GTG GCG GCC GCT CTA GAT TCA ACA ACA GGA GCC ACA GGA A-3’. The resulting PCR fragment was digested with KpnI (New England Biolabs, Cat# R3142S) and NotI (New England Biolabs, Cat# R3189L) and inserted into the corresponding site of the pCAGGS vector (37). All constructs were confirmed by Sanger sequencing (AZENTA) and the sequence data were analyzed by Sequencher v5.4.6 software (Gene Codes Corporation).
SARS-CoV-2 S-based fusion assay
A SARS-CoV-2 S-based fusion assay with dual split protein (DSP) encoding Renilla luciferase (RL) and green fluorescence protein (GFP) genes was performed as previously described (38). On day 1, effector cells (i.e., S-expressing) and target cells (Calu-3/DSP1-7 cells) were prepared at a density of 0.6-0.8 × 10⁶ cells/well in a 6 well plate. On day 2, to prepare effector cells, HEK293 cells were cotransfected with the S expression plasmids (400 ng) and pDSP8-11 (39, 40) (400ng) using TransIT-LT1 (Takara, Cat# MIR2306). On day 3 (24 hours post transfection), effector cells were detached by pipetting and 16,000 effector cells/well were reseeded into a 96 well black plate (PerKinElmer, Cat# 6005225), and target cells were reseeded at a density of 1 × 10⁶ cells/2 ml/well in a 6 well plate. On day 4 (48 hours post transfection), the target cells were incubated with Enduren live cell substrate (Pomega, Cat# E6481) for 3 hours and then detached, and 32,000 target cells/well were added to a 96 well plate with effector cells. RL activity was measured at the indicated time points using a Centro XS3 LB960 (Berthhold Technologies). To measure the surface expression level of the S protein, effector cells were stained with rabbit anti-SARS-CoV-2 S S1/S2 polyclonal antibody (Thermo Fisher Scientific, Cat#PA5-112048, 1:100 dilution). Normal rabbit IgG (SouthernBiotech, Cat# 0111-01, 1:100) was used as negative control, and APC-conjugated goat anti-rabbit IgG polyclonal antibody (Jackson immunoresearch, Cat# 111-136-144, 1:50) was used as a secondary antibody. The expression level of the surface S proteins was detected by FACS Canto II (BD Biosciences) and analyzed by FlowJo software v10.7.1 (BD Biosciences). RL activity was normalized to the mean fluorescence intensity (MFI) of surface S proteins, and the normalized values are shown as fusion activity.
Pseudovirus assay
For pseudovirus production, lentivirus (HIV-1)-based luciferase-expressing reporter viruses were pseudotyped with the SARS-CoV-2 S protein (20, 22, 34, 41–43). HEK293T cells (2 × 10⁶ cells) were cotransfected with 2 μg of psPAX2-IN/HiBiT (44), 2 μg of pWPI-Luc2 (44) and 1 μg of plasmids expressing SARS-CoV-2 S protein with the C-terminal deletion of 19 amino acids (Δ19CT) using TransIT-LT1 according to the manufacturer’s protocol. After 2 days, cell culture supernatants were collected and filtered, and the pseudoviruses were stored at –80°C until use. The amount of pseudovirus prepared was quantified using Nano Glo HiBiT lytic detection system (Promega, Cat# N3040) because HiBiT-based luciferase activity is perfectly correlated with the amount of p24 antigen levels (44). Then, the same amount of pseudoviruses normalized by the HiBiT value was inoculated into HOS-ACE2/TMPRSS2 cells (10,000 cells/well/50μl) in a 96 well plate. At 2 days postinfection, the infected cells were lysed with a Bright-Glo Luciferase Assay System (Promega, cat# E2620) and the luminescent signal was measured using a Centro XS3 LB960 plate reader (Berthhold Technologies).
BlaM-Vpr assay
HIV-1-based BlaM-Vpr assay (45, 46) was modified to perform SARS-CoV-2 S-based BlaM-Vpr assay. To produce SARS-CoV-2 S pseudovirus with β-lactamase-Vpr (BlaM-Vpr), HEK293T cells (2 × 10⁶ cells) were cotransfected with 1.6 μg of psPAX2-IN/HiBiT, 1.6 μg of pWPI-Luc2, 0.8 μg of plasmids expressing SARS-CoV-2 S protein with Δ19CT and 0.8 μg of BlaM-Vpr expression plasmid, pMM310 (HIV reagent program, Cat# ARP-11444) using TransIT-LT1 according to the manufacturer’s protocol. At 2 days posttransfection, cell culture supernatants were collected, filtered, and mixed with 40% polyethylene glycol #6000 (Nacalai Tesque Cat# 10200-25), followed by incubation at 4°C for 16 hours. After spinning down at 1,700 × g for 40 minutes at 4°C, the viral pellets were resuspended in 10% FBS/DMEM (high glucose) and the amount of pseudovirus prepared was quantified using the HiBiT assay. Note that the 24 well-collagen plate used in the following step should be kept at 4°C to inhibit starting fusion. The same amount of pseudoviruses normalized by HiBiT value was inoculated into HOS-ACE2/TMPRSS2 cells (2 × 10⁵ cells/well/1 ml) in a 24 well-collagen plate on ice and spinoculation was performed at 1,500 × g for 1 hour at 4°C to allow virus-cell attachment. After 1 hour, the cell culture supernatant including pseudoviruses was replaced with warmed fresh DMEM (high glucose), followed by incubation for 3 hours at 37°C. Then, each well was washed with phosphate-buffered saline (PBS) and β-lactamase loading solution (Invitrogen, Cat# K1030) [CCF4 substrate, solution B, solution C and anion transport inhibitor (Invitrogen, Cat# K1156) in Opti-MEM] was loaded. The plate was covered with aluminum foil to avoid light exposure and kept for 2 hours at room temperature. After 2 hours, cells were harvested, washed with PBS twice, and fixed with 2% paraformaldehyde phosphate (Nacalai Tesque, Cat# 09154-85). The fluorescence intensities at 520 nm (Pacific Blue; uncleaved CCF4) and 447 nm (AmCyan; cleaved CCF4) were detected by FACS Canto II (BD Biosciences) and analyzed by FlowJo software v10.7.1 (BD Biosciences). The ratio of cleaved CCF4 signal to the sum of uncleaved and cleaved CCF4 signals was calculated and shown as entry efficiency.
SARS-CoV-2 infection
The day before infection, 1 × 10⁴ VeroE6/TMPRSS2 and Calu-3 cells were seeded into a 96-well plate. Then, VeroE6/TMPRSS2 (100 TCID50) and Calu-3 (5000 TCID50) cells were inoculated with SARS-CoV-2 and incubated at 37°C for 1 hour. After washing, 180 μl of fresh cell culture medium was added. 15 μl of cell culture supernatant was harvested at the indicated timepoints and used for RT-qPCR to quantify the viral RNA copy number (see “RT-qPCR” section).
RT-qPCR
RT-qPCR was performed as previously described (32, 34, 43, 47–50). Briefly, 5 μl of culture supernatant was mixed with 5 μl of 2 × RNA lysis buffer [2% Triton X-100 (Nacalai Tesque, Cat#12969-25), 50 mM KCl, 100mM Tris-HCl (pH 7.4), 40% glycerol, 0.8 U/μl recombinant RNase inhibitor (Takara, Cat# 2313A)] and incubated at room temperature for 10 minutes. 90 μl of RNase free water was added and then 2.5 μl of diluted sample was used for real-time RT-PCR according to the manufacturer’s protocol with One step TB green PrimeScript PLUS RT-PCR Kit (Takara, Cat# RR096A) and primers for Nucleocapsid (N) gene; Forward N, 5’-AGC CTC TTC TCG TTC CTC ATC-3’ and Reverse N, 5’-CCG CCA TTG CCA GCC ATT C-3’. The viral RNA copy number was standardized using a SARS-CoV-2 direct detection RT-qPCR kit (Takara, Cat# RC300A). Fluorescent signals from resulting PCR products were acquired using a Thermal Cycler Dice Real Time System III (Takara).
Plaque assay
Plaque assay was performed as previously described (21, 31, 48, 51). One day before infection, 1 × 10⁵ VeroE6/TMPRSS2 cells were seeded into 24 well plate and infected with SARS-CoV-2 (50,000, 5000, 500, and 50 TCID50 respectively) at 37°C for 1 hour. 3% FBS and 1.5% carboxymethyl cellulose (Wako, Cat# 039-1335) containing mounting solution was overlaid, followed by incubation at 37°C. At 3 days postinfection, the cell culture medium was removed, and the cells were washed with PBS three times and fixed with 4% paraformaldehyde phosphate (Nacalai Tesque, Cat# 09154-85). The fixed cells were washed with tap water, dried, and stained with 0.1% methylene blue (Nacalai Tesque, Cat# 22412-14) in water for 30 minutes. The stained cells were washed with tap water and dried. The size of plaques was measured using Fiji software v2.2.0 (Image J).
Western blot analysis
As previously described, sample preparation for western blotting was performed with minor modifications (38, 50, 52–54). The cell culture supernatants containing pseudoviruses produced from the HEK293T cells (see “Pseudovirus assay” section and “BlaM-Vpr assay” above) and the HEK293 cells transfected with the S expression plasmids (see “SARS-CoV-2 S-based fusion assay” section above) were used for western blotting. For viral lysate preparation, at 2 days posttransfection, cell culture supernatants were collected, filtered, and subjected to ultracentrifugation using 20% sucrose (22,000 × g, 4˚C, 2 hours). Then, virions were dissolved in phosphate-buffered saline (PBS). To quantify HIV-1 p24 antigen in the pseudovirus, HiBiT-based luciferase activity in viral supernatants was determined with a Nano Glo HiBiT lytic detection system and translated into p24 antigen levels. After normalization with HiBiT value, the samples were diluted with 2 × SDS sample buffer [100 mM Tris-HCl (pH6.8), 4% SDS, 12% β- mercaptoethanol, 20% glycerol, 0.05% bromophenol blue] and boiled for 5–10 minutes at 100°C. For cell lysate preparation, the transfected cells were detached, washed twice with PBS, and lysed in lysis buffer [25mM HEPES (pH7.2), 20% glycerol, 125 mM NaCl, 1% Nonidet P40 substitute (Nacalai Tesque, Cat# 18558-54), protease inhibitor cocktail (Nacalai Tesque, Cat# 03969-21)]. Quantification of total protein in the cell lysates was done by protein assay dye (Bio-Rad, Cat# 5000006) according to manufacturer’s instruction. Then, cell lysates were diluted with 2 × SDS sample buffer and boiled for 5–10 minutes. After cooling down, viral (pseudovirus) and cell lysates were mixed with diluted sample buffer (proteinsimple, Cat# 99351). Then, 5 × Fluorescent Master mix (proteinsimple, Cat# PS-ST01EZ-8) was added at a ratio of 4:1. Simple Western System was used for protein analysis. For protein detection, the following antibodies were used: rabbit anti-SARS-CoV-2 S polyclonal antibody (Novus Biologicals, Cat# NB100-56578, viral lysate; 1:40, cell lysate; 1:200). mouse anti-HIV-1 p24 monoclonal antibody (HIV Reagent Program, ARP-3537, 1:500), mouse anti-α tubulin monoclonal antibody (Sigma-Aldrich, Cat# T5168, 1:300), anti-rabbit secondary antibody (proteinsimple, Cat# 042-206), and anti-mouse secondary antibody (proteinsimple, Cat# 042-205). Bands were visualized and analyzed using Compass for Simple Western v6.1.0 (proteinsimple).
Statistical analysis
A one-way ANOVA and Dunnett’s test were performed to compare the S1/S2 cleavage efficiency, plaque size, pseudoviral infectivity, and pseudovirus entry efficiency. Pearson’s correlation analysis was conducted to ascertain the relationship between two variables tested in this study. The P value was calculated by a two-tailed test. The magnitude of the linear relationship between two variables is classified into several groups according to prior studies (55, 56). GraphPad Prism software v8.4.3 (GraphPad Software) was used for these statistical tests. In the time-course experiments, we conducted a two-way ANOVA, incorporating both experimental conditions (namely, S protein and SARS-CoV-2 variants) and timepoints as indicator variables. These analyses were used to assess differences across all timepoints between the various experimental conditions. The time point zero was excluded from this analysis. The P value was calculated by a two-sided t test. Subsequently, familywise error rates (FWERs) were calculated using the Holm method. These analyses were performed in R v4.1.2 (https://www.r-project.org/).
Results
S protein fusogenicity of eleven SARS-CoV-2 variants
SARS-CoV-2 S protein mediates the virus-infected cell membrane fusion (10, 11). To quantitatively monitor the fusion kinetics between effector cells expressing S protein from eleven SARS-CoV-2 variants (including the previous VOCs and VOIs) and target cell membranes, we performed S protein-mediated membrane fusion assay in Calu-3/DSP1-7 cells (Figure 1A) (20, 22–24, 30, 32, 38, 42, 43, 50). In this assay, dual split protein (DSP), DSP1–7 and DSP8–11 was utilized (39, 40) and the reconstituted Renilla luciferase signal was measured over 24 hours (Figure 1A). Although the Alpha, Beta, Gamma, Delta Lambda, Mu, and BA.5 S protein expression levels were lower than that of the B.1.1 S protein (harboring the D614G mutation) on the transfected HEK293 cell surface, the surface S protein levels of the remaining variants were comparable (Figure 1B). Compared to B.1.1 S protein, the Wuhan S protein exhibited lower fusogenicity, while the Alpha, Beta, Gamma, Delta, Lambda, and Mu S proteins was significantly more fusogenic (Figure 1C). Notably, the Delta S protein exhibited profound fusogenicity (21, 23), being the highest of all tested S proteins (Figure 1C). The BA.1 and BA.2 S proteins exhibited lower fusogenicity compared to the B.1.1 S protein while the fusogenicity of the BA.5 S protein was not significantly different (Figure 1C). These data indicate that SARS-CoV-2 S protein fusogenicity is different before and after Omicron variant emergence.
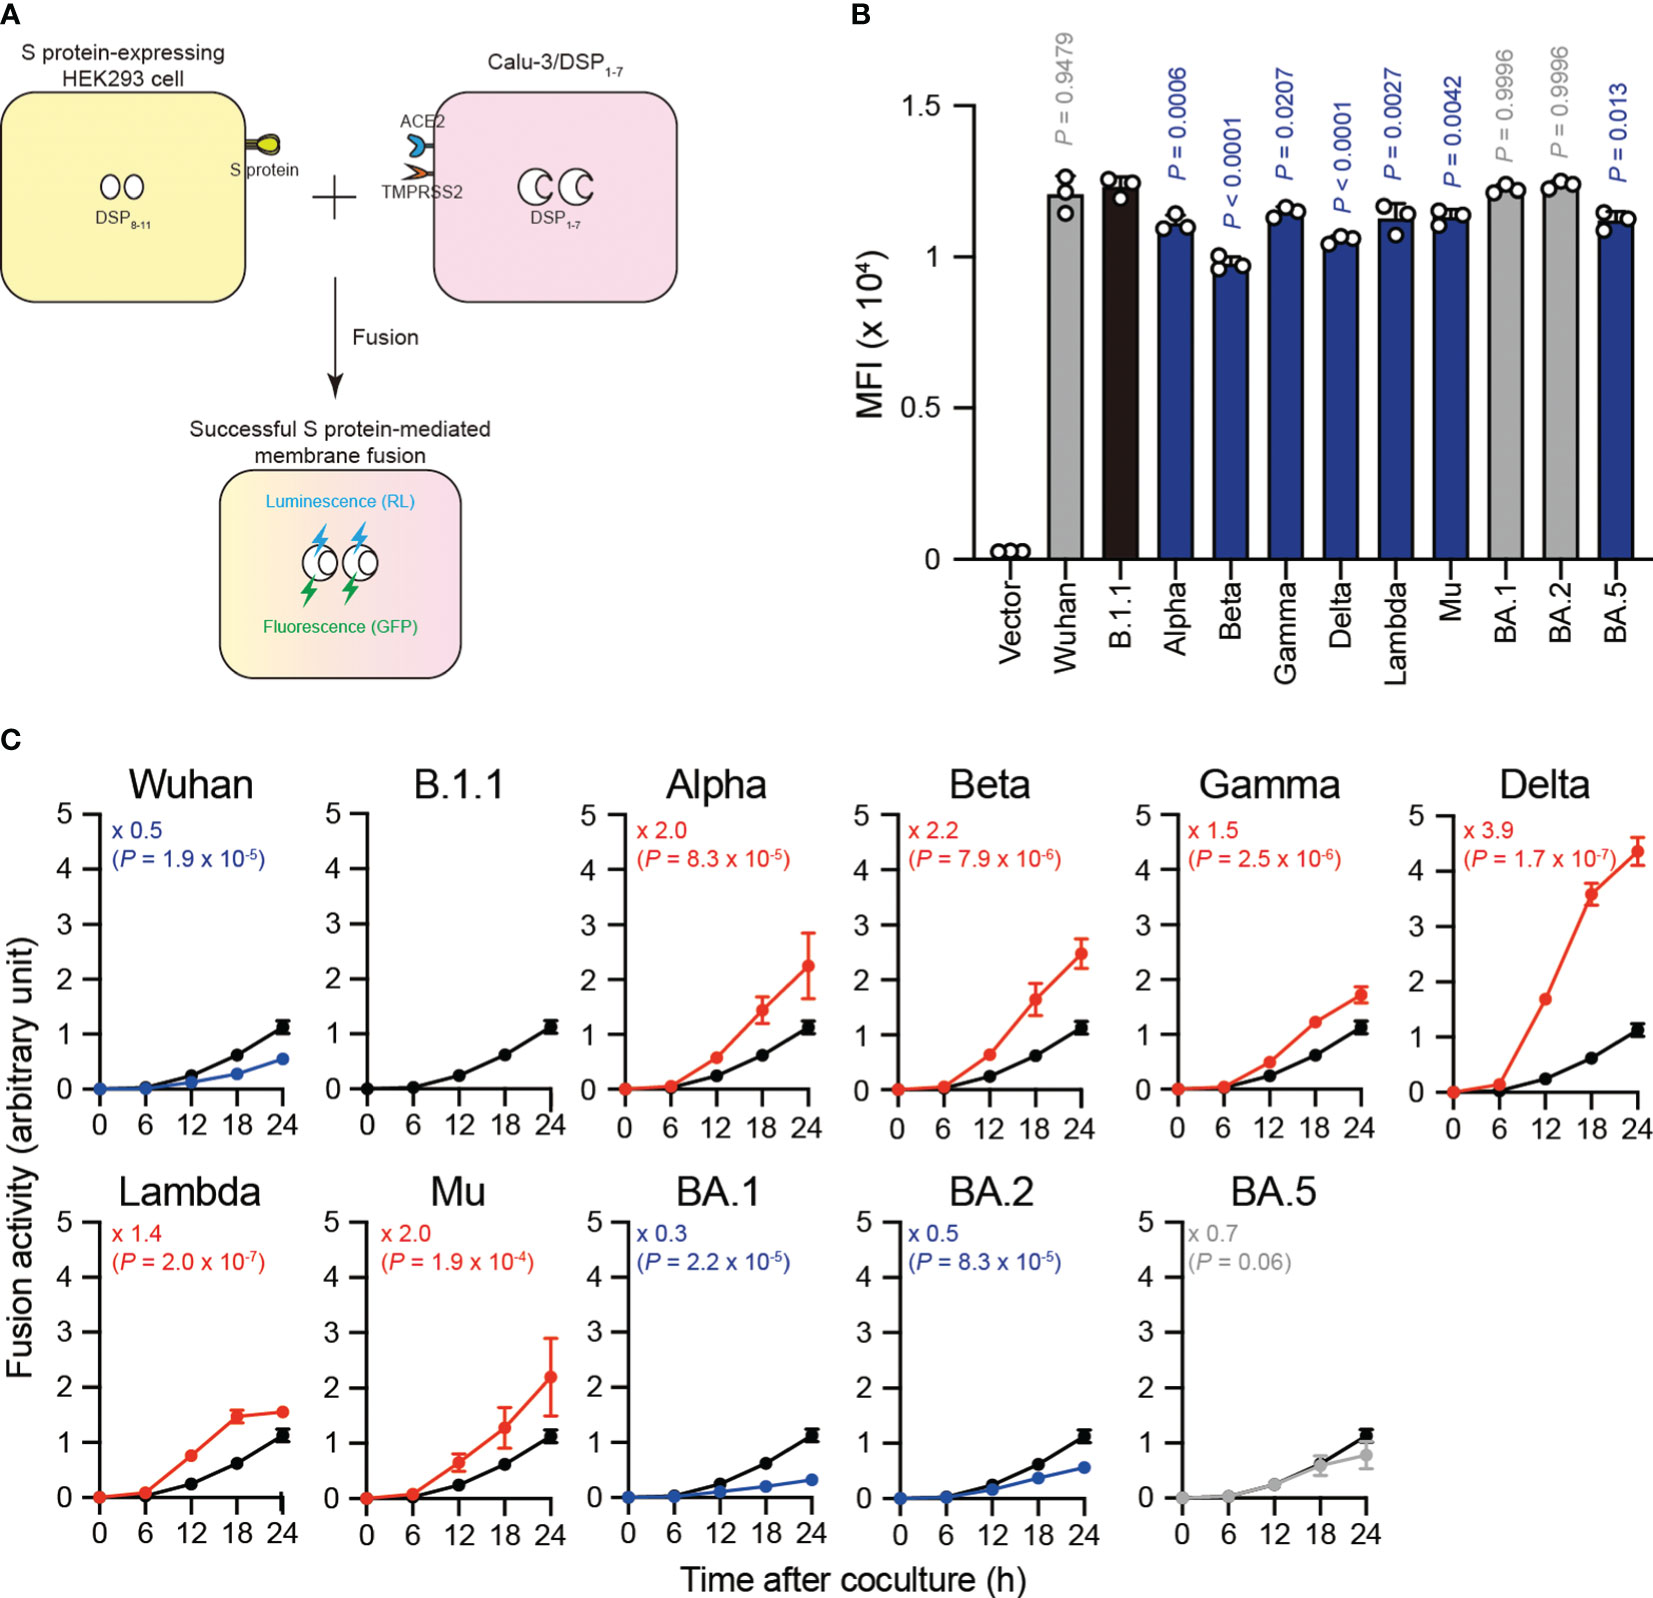
Figure 1 Eleven S proteins, including the previous VOCs and VOIs, exhibit varying fusogenicity. (A) Schematic diagram showing SARS-CoV-2 S protein-mediated membrane fusion assay in Calu-3/DSP1-7. HEK293 cell transiently expressing SARS-CoV-2 S protein and DSP8-11 (yellow) is mixed with Calu-3 cell stably expressing DSP1-7 (pink). Then, luminescence (RL) and fluorescence (GFP) signals are produced only when the fragments of the split RL and GFP protein are successfully reconstituted in the same cytosol after fusion. (B) Surface S protein expression in transfected HEK293 cells. The data represent the mean fluorescence intensity (MFI) with the mean ± standard deviation (SD) from 3 independent experiments. The statistical significance was tested against B.1.1 (black bar) using a one-way ANOVA and Dunnett’s test. The P values are indicated above each bar. The gray and blue bars indicate no significance and significantly reduced expression levels, respectively. (C) Indicated S variant fusion activities. The S protein-mediated membrane fusion assay was performed in Calu-3/DSP1-7 cells. Renilla luciferase activity was normalized to the MFI of surface S proteins and the normalized values are shown as fusion activity. The data at each time point are represented as the mean ± SD from 4 independent experiments. The numbers in each graph indicate the fold change 24 hours after S protein-expressing HEK293 and Calu-3 cell coculture compared to those expressing the B.1.1 S protein (black line). Statistical differences between B.1.1 S and each S variant across timepoints were determined by a two-way ANOVA. The P values are indicated in blue (reduction), red (increase), or gray (not significant) in each graph. We excluded 0 h data from the analyses. We indicated the Family-wise error rates (FWERs), calculated using the Holm method, in the figures.
Correlation of S1/S2 cleavage efficiency with S protein fusogenicity
The SARS-CoV-2 S protein S1/S2 cleavage is pivotal, affecting viral fusogenicity (57). For example, the level of Delta S protein S1/S2 cleavage is higher than that of the B.1.1 and BA.1 S proteins, being associated with higher fusogenic potential in the Delta variant (21, 23, 38, 47). To investigate whether the relationship between S protein S1/S2 cleavage and its fusogenicity could apply to S proteins from the other SARS-CoV-2 variants, we subjected HEK293 cells expressing each S protein to western blotting and quantified the full-length S and cleaved S2 band intensities (Figures 2A, B). Full-length S and S2 band intensity variations indicated that each S protein exhibits a different susceptibility to cellular protease-induced S1/S2 cleavage. Consistent with previous results (21, 23, 38), the Delta and Lambda S proteins displayed the highest S1/S2 cleavage efficiencies (Figures 2A, B). In addition, the Wuhan, BA.1, and BA.2 S protein S1/S2 cleavage was significantly lower than that of the B.1.1 S protein (Figures 2A, B). Finally, we investigated how fusogenicity and S1/S2 cleavage efficiency correlate among the eleven SARS-CoV-2 variants (Figure 2C). Remarkably, the correlation coefficient (r = 0.7730) indicated a strong positive correlation between fusogenicity and S1/S2 cleavage efficiency of all eleven SARS-CoV-2 S protein variants (Figure 2C, Supplementary Table S1). In summary, these results demonstrated that SARS-CoV-2 S protein fusogenicity is strongly associated with S protein S1 and S2 subunit cleavage.
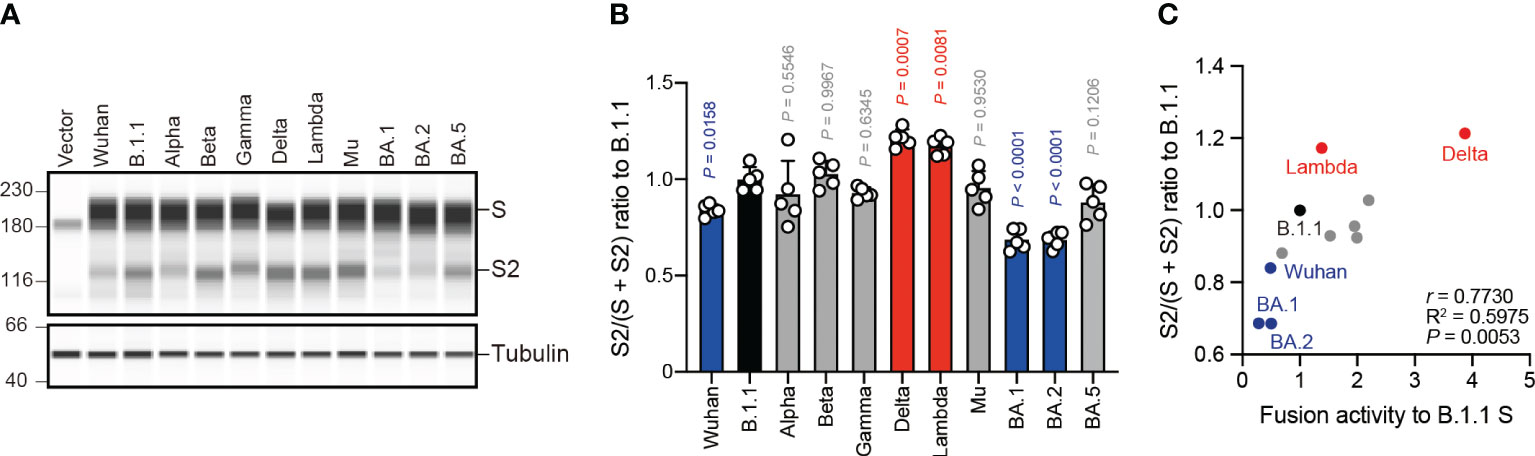
Figure 2 S protein fusogenicity correlates with S1/S2 cleavage efficiency. (A) Western blot analysis of S protein expressed in transfected HEK293 cells. The S and S2 proteins were detected using a rabbit anti-SARS-CoV-2 S2 polyclonal antibody. We used anti-a-tubulin as a loading control. The uncropped images of western blots are shown in Supplementary Figure S1. (B) Indicated S variant S/S2 cleavage efficiencies. Each bar represents the S/(S + S2) values with the mean ± standard deviation from 5 independent experiments. The statistical significance was tested against B.1.1 (black bar) using a one-way ANOVA and Dunnett’s test. The P values above each bar are indicated in blue (reduction), red (increase), or gray (not significant). (C) Correlation between the S variant S/S2 cleavage efficiencies and fusion activities 24 hours after coculture. The Pearson correlation coefficient (r) and correlation squared (R2) are indicated in the figure. The P value was calculated by a two-tailed test.
Correlation of infection-induced plaque size with S protein fusogenicity
The Delta variant with higher fusogenic S protein reportedly forms larger plaques than the B.1.1 variant in infected VeroE6/TMPRSS2 cells (21). However, the BA.1 variant encoding the lower fusogenic S gene displays smaller plaques compared to the B.1.1 variant (23). These results suggest that S protein fusogenicity is potentially associated with viral infection, indicated the size of the plaques formed by clinical isolates. To address this question, we performed plaque assays using the eleven clinical isolates including the previous VOCs and VOIs and compared the plaque diameters formed by each clinical isolate in VeroE6/TMPRSS2 cells (Figures 3A, B). We observed that the Alpha, Beta, Gamma, Delta, Lambda, and Mu variants formed significantly larger plaques than B.1.1 (Figures 3A, B). In contrast, the BA.1, BA.2, and BA.5 variant-related plaque sizes were smaller compared to that of the B.1.1 variant (Figures 3A, B). Interestingly, the SARS-CoV-2 infection-induced plaque size in VeroE6/TMPRSS2 very strongly and positively correlated with S protein fusogenicity and S1/S2 cleavage efficiency (Figure 3C, Supplementary Table S1; r = 0.8356 and 0.8222, respectively). These results indicate that SARS-CoV-2 S protein fusogenicity strongly influences the SARS-CoV-2 infection plaque size.
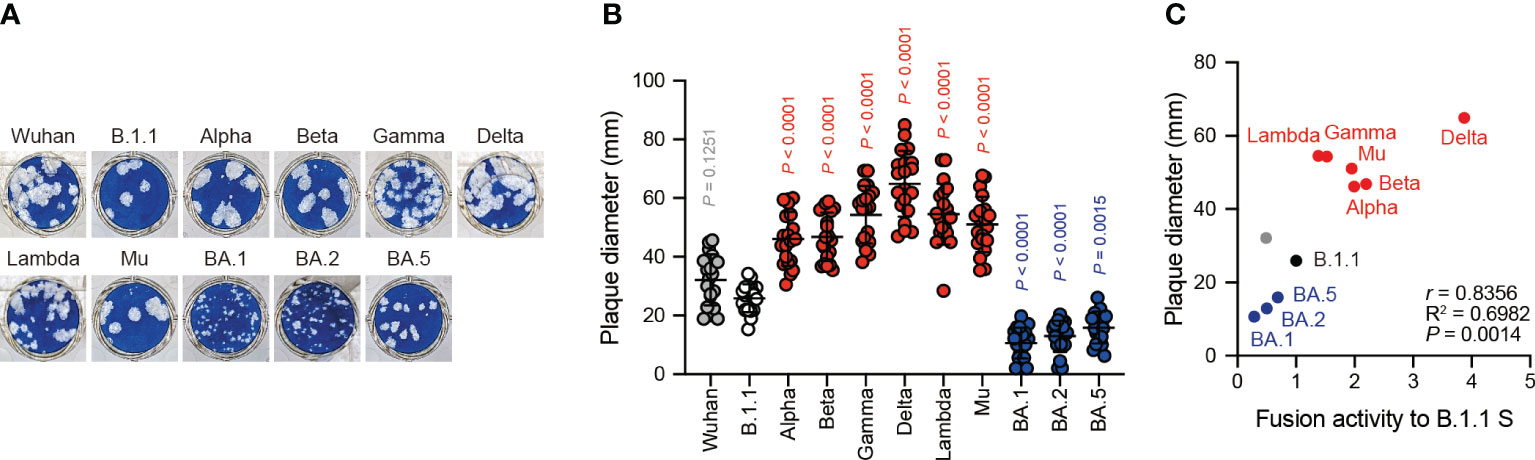
Figure 3 Clinical isolate-formed plaque size correlates with S protein fusogenicity. (A) Representative images of the plaque assays. (B) Plaque diameter summary. The data are represented as the plaque diameter with the mean ± standard deviation from 20 plaques per each variant. The statistical significance was tested against B.1.1 (white circles) by using a one-way ANOVA and Dunnett’s test. The P values above each bar are indicated in red (increase), blue (reduction), or gray (not significant). (C) Correlation between the plaque diameter and fusion activity of the corresponding variants 24 hours after coculture. The Pearson correlation coefficient (r) and correlation squared (R2) are indicated in the figure. The P value was calculated by a two-tailed test.
Correlation of SARS-CoV-2 S pseudovirus infectivity with S protein fusogenicity
Next, we examined the correlation of S protein-mediated cell-free viral infection with S protein fusogenicity. We used HEK293T cells to produce HIV-1 virions pseudotyped with SARS-CoV-2 S protein carrying the C-terminal deletion of 19 amino acids (Δ19CT), normalized by HiBiT-based luciferase activity, and measured viral infectivity as described previously (20–24, 30, 32, 34, 47, 51). Our results revealed that the BA.5 S pseudoviral infectivity measured using the HOS-ACE2/TMPRSS2 system were significantly higher than that of the B.1.1 S pseudovirus while that of the Wuhan, Alpha, Beta, Lambda, Mu, BA.1 and BA.2 S pseudoviruses significantly decreased in HOS-ACE2/TMPRSS2 cells compared to B.1.1 (Figure 4A). We observed no statistically significant difference between the Gamma and Delta S pseudoviral infectivities and that of the B.1.1 S pseudovirus (Figure 4A). Notably, we noticed that the infectivity degrees of the eleven SARS-CoV-2 variant-derived S protein-mediated cell-free pseudoviruses did not correlate with the fusogenicity mediated by these S proteins (Figure 4B, Supplementary Table S1; r = 0.0574). This discrepancy suggests that each S protein incorporation level into the pseudoviruses might vary, thereby leading to incorrect viral infectivity validation. To test this hypothesis, we analyzed the S protein incorporation levels in the viral particles using western blotting (Figures 4C, D). The S protein band intensity quantification revealed that compared to the B.1.1 S pseudovirus, Wuhan, Alpha, Mu, BA.1, BA.2, and BA.5 variant-derived S proteins incorporated less in the pseudovirus particles (Figures 4C, D). These data indicate variable S protein incorporation levels, prompting that viral infectivity per incorporated S protein should be evaluated. Although most SARS-CoV-2 S pseudoviral infectivity divided by S protein incorporation levels became comparable or lower than that of the B.1.1 S pseudovirus, only those of the BA.2 and BA.5 S pseudoviruses were significantly higher (Figure 4E). In addition, the r value between the cell-free pseudoviral infectivity per S protein and fusogenicity mediated by these S proteins changed from 0.0574 to –0.3849 and indicated moderate negative correlation (Figures 4B, F, Supplementary Table S1). In summary, these data suggest that S protein fusogenicity might have little effect on pseudovirus infection in target cells.
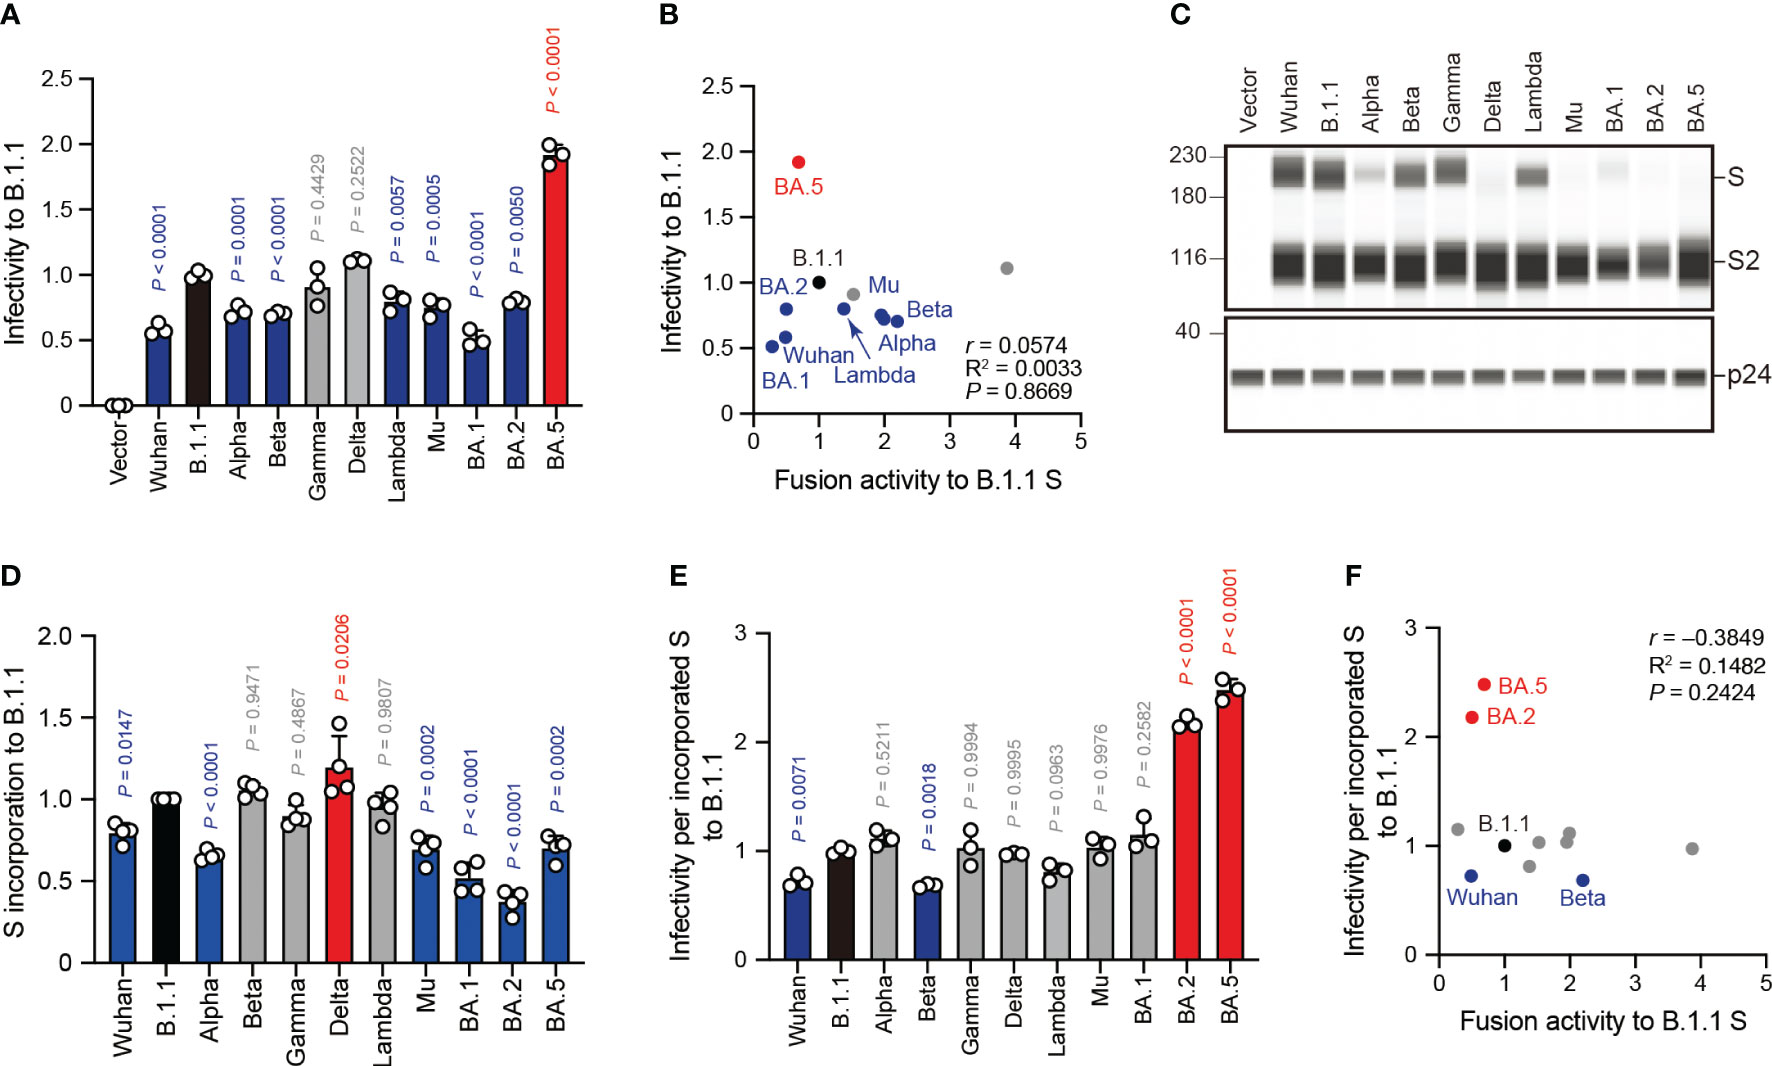
Figure 4 SARS-CoV-2 S pseudovirus infectivity does not correlate with S protein fusogenicity. (A) Representative SARS-CoV-2 pseudoviral infectivity data. We used HEK293T cells to produce the HIV-1-based pseudoviruses with the indicated SARS-CoV-2 S proteins for HOS-ACE2/TMPRSS2 cell infection. We measured the intracellular luciferase activity of each virus-infected cell and expressed as viral infectivity relative to that of B.1.1 S pseudovirus (black bar) with the mean ± standard deviation (SD) from three independent experiments. The statistical significance was tested against B.1.1 S using a one-way ANOVA and Dunnett’s test. The P values above each bar are indicated in blue (reduction), red (increase), or gray (not significant). (B) Correlation between relative pseudoviral infectivity and fusion activity 24 hours after coculture. The Pearson correlation coefficient (r) is indicated in the figure. The P value was calculated by a two-tailed test. (C) Representative western blot data of S proteins incorporated in the pseudoviruses. S and S2 were detected using a rabbit anti-SARS-CoV-2 S2 polyclonal antibody. We used p24 as a loading control. The uncropped images of western blots are shown in Supplementary Figure S2. (D) S protein incorporation levels determined by (S + S2)/p24 in the pseudoviruses relative to B.1.1. The data are represented as the mean ± SD from 4 independent experiments. The statistical significance was tested against B.1.1 S (black bar) using a one-way ANOVA and Dunnett’s test. The P values above each bar are indicated in blue (reduction), red (increase), or gray (not significant). (E) Representative infectivity data of SARS-CoV-2 pseudoviruses per S protein incorporation level. SARS-CoV-2 pseudoviral infectivities were divided by the incorporation level of each S protein and the viral infectivities were normalized by that of the B.1.1 S pseudovirus (black bar). The data are represented as the mean ± SD from three independent experiments. The statistical significance was tested against B.1.1 S using a one-way ANOVA and Dunnett’s test. The P values above each bar are indicated in blue (reduction), red (increase), or gray (not significant). (F) Correlation between relative pseudoviral infectivity per S protein incorporation level and fusion activity 24 hours after coculture. The Pearson correlation coefficient (r) and correlation squared (R2) are indicated in the figure. The P value was calculated by a two-tailed test.
Correlation of SARS-CoV-2 S pseudovirus entry efficiency with S protein fusogenicity
The aforementioned pseudovirus assays indicated a weak correlation between S protein fusogenicity and SARS-CoV-2 S pseudoviral infectivity even after normalizing the S protein incorporation levels into the viral particles (Figure 4F). These data suggest that HIV-1 infection mechanisms, such as reverse transcription and integration, might affect the pseudovirus assay results. To address this hypothesis, we performed an assay using β-lactamase-Vpr (BlaM-Vpr) chimeric protein and S protein with Δ19CT enabling us to quantify cell-free virus entry efficiency into HOS-ACE2/TMPRSS2 cells (Figure 5A). The BlaM-Vpr chimeric protein is incorporated into pseudoviral particles and cleaves a CCF4 fluorescent dye substrate upon entry into a target cell, leading to change in the fluorescence emission spectrum of the dye from green (520 nm) to blue (447 nm) (Figure 5A) (45, 46). The results indicated that all S pseudoviruses exhibited comparable or lower entry efficiencies compared to the B.1.1 S pseudovirus (Figure 5B). Similar to the pseudovirus assays (Figures 5B, C), we normalized the fluorescence signals indicating entry efficiency into the target cells by the S protein incorporation levels due to the variable S protein incorporation levels into the viral particles (Figures 5C–E). Interestingly, although the entry efficiency determined by BlaM-Vpr assays and normalized by the viral S protein level strongly correlated with the S pseudovirus infectivities per S protein incorporation levels (Figure 5F, Supplementary Table S1; r = 0.7880), the relationship with S protein fusogenicity was very weak (Figure 5G, Supplementary Table S1; r = 0.0368). These data support the results suggesting that the S protein fusogenic potential could have little effect on pseudovirus entry into the HOS-ACE2/TMPRSS2 cells.
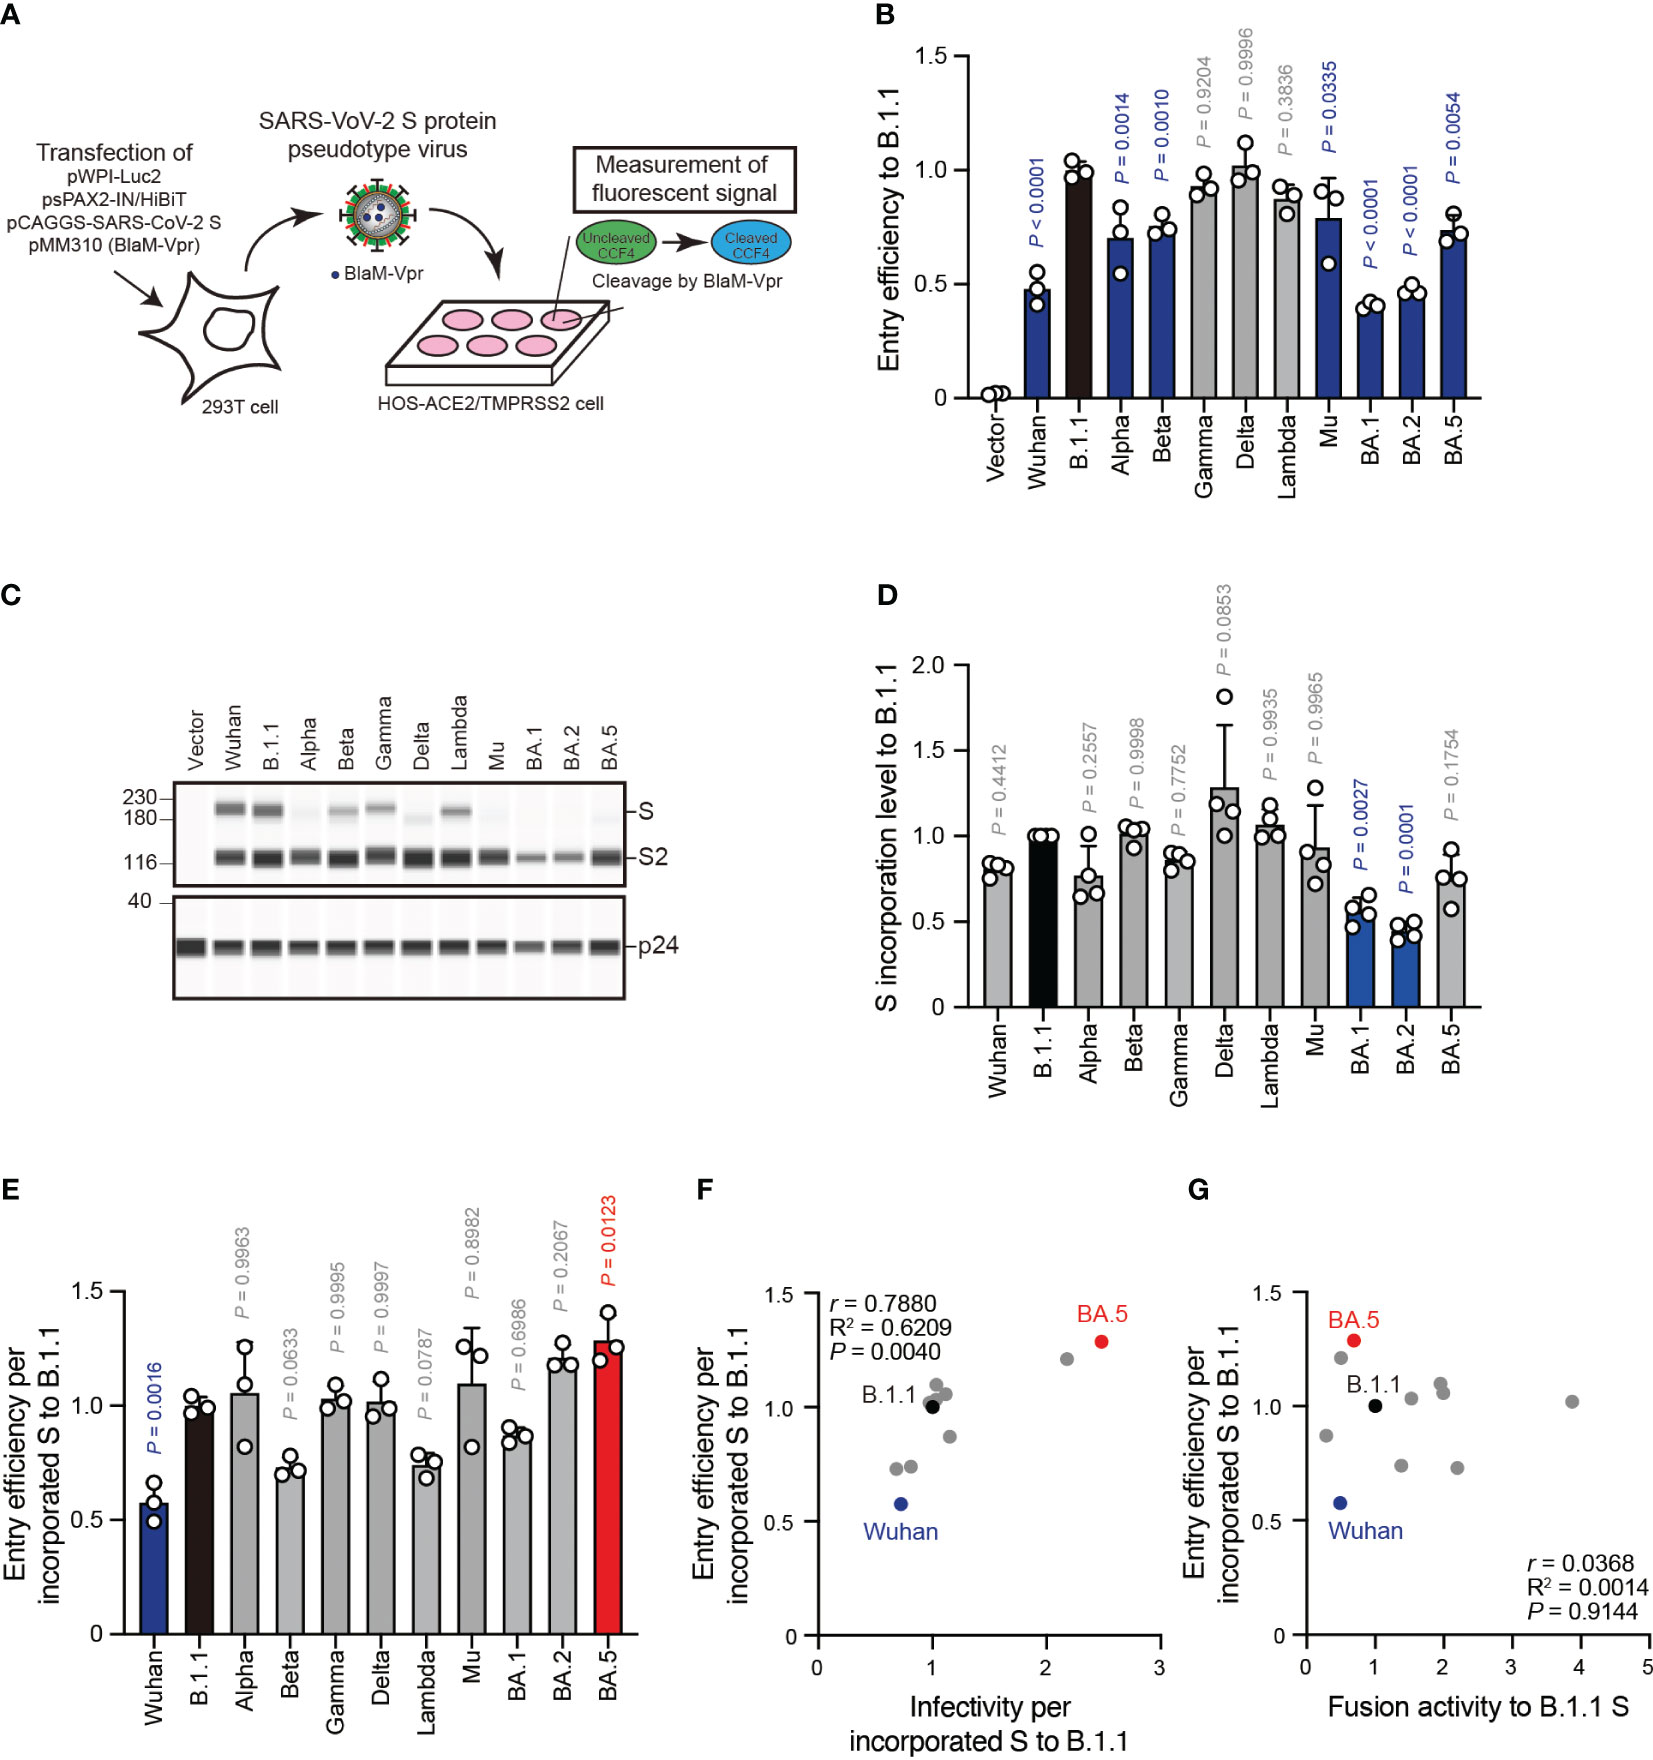
Figure 5 S protein-mediated pseudovirus entry efficiency does not correlate with S protein fusogenicity. (A) Schematic diagram representing BlaM-Vpr assay. The BlaM-Vpr chimeric protein is loaded into pseudoviral particles. Then, it cleaves a CCF4 fluorescent dye substrate following entry into a target cell, causing a change in the fluorescence emission spectrum of the dye from green (520 nm) to blue (447 nm). (B) Representative BlaM-Vpr assay data. We used HEK293T cells to produce HIV-1-based pseudoviruses with the indicated SARS-CoV-2 S proteins for HOS-ACE2/TMPRSS2 cell infection. The cleaved CCF4 signal ratio to the sum of uncleaved and cleaved CCF4 signals was calculated and indicated as the entry efficiency relative to that of the B.1.1 S pseudovirus (black bar) with the mean ± standard deviation (SD) from three independent experiments. The statistical significance was tested against B.1.1 S using a one-way ANOVA and Dunnett’s test. The P values above each bar are indicated in blue (reduction) or gray (not significant). (C) Representative western blot data of S proteins incorporated in the pseudoviruses. S and S2 were detected using a rabbit anti-SARS-CoV-2 S2 polyclonal antibody. We used p24 as a loading control. The uncropped images of western blots are shown in Supplementary Figure S3. (D) S protein incorporation levels determined by (S + S2)/p24 in the pseudoviruses relative to B.1.1. The data are represented as the mean ± SD from 4 independent experiments. The statistical significance was tested against B.1.1 S (black bar) using a one-way ANOVA and Dunnett’s test. The P values above each bar are indicated in blue (reduction) or gray (not significant). (E) Representative BlaM-Vpr data normalized by the S protein incorporation levels. S protein-mediated SARSCoV-2 pseudovirus entry efficiencies were divided by each S protein incorporation level and the entry efficiencies were normalized by that of the B.1.1 S pseudovirus (black bar). The data are represented as the mean ± SD from three independent experiments. The statistical significance was tested against B.1.1 S using a one-way ANOVA and Dunnett’s test. The P values above each bar are indicated in blue (reduction), red (increase), or gray (not significant). (F) Correlation between relative pseudoviral infectivities and S protein-mediated entry efficiencies per S protein incorporation levels. The Pearson correlation coefficient (r) and correlation squared (R2) are indicated in the figure. The P value was calculated by a two-tailed test. (G) Correlation between S protein-mediated entry efficiency and fusogenicity 24 hours after coculture. The Pearson correlation coefficient (r) and correlation squared (R2) are indicated in the figure. The P value was calculated by a two-tailed test.
Correlation of replication kinetics of clinical isolates in VeroE6/TMPRSS2 and Calu-3 cells with S protein fusogenicity
To investigate the clinical isolate replication kinetics, we inoculated the eleven SARS-CoV-2 variants into VeroE6/TMPRSS2 and Calu-3 cells and measured the viral RNA levels in the cell culture supernatants using RT-qPCR (Figures 6A, B). Compared to the B.1.1 variant, the Lambda, BA.1, and BA.5 variants displayed slower replication kinetics in VeroE6/TMPRSS2 cells while the other variants were comparable (Figure 6A). In Calu-3 cells, the Alpha, Gamma, Delta, Mu, and BA.5 variant replication kinetics indicated significantly higher and that of the BA.2 variant lower values than that of the B.1.1 variant (Figure 6B). The other variants, such as Wuhan, Beta, Lambda, and BA.1, displayed no statistically significant difference (Figure 6B). Finally, we aimed at addressing a potential correlation between viral RNA production in VeroE6/TMPRSS2 or Calu-3 cells 48 hours postinfection and S protein fusogenicity (Figures 6C, D). However, we obtained low r values, indicating a weak viral RNA production correlation with S protein fusogenicity (Figures 6C, D, Supplementary Table S1; r = 0.1233 in VeroE6/TMPRSS2 cells and r = 0.3927 in Calu-3 cells, respectively). These data suggest that S protein fusogenicity might only slightly affect viral RNA production during viral replication in VeroE6/TMPRSS2 and Calu-3 cells.
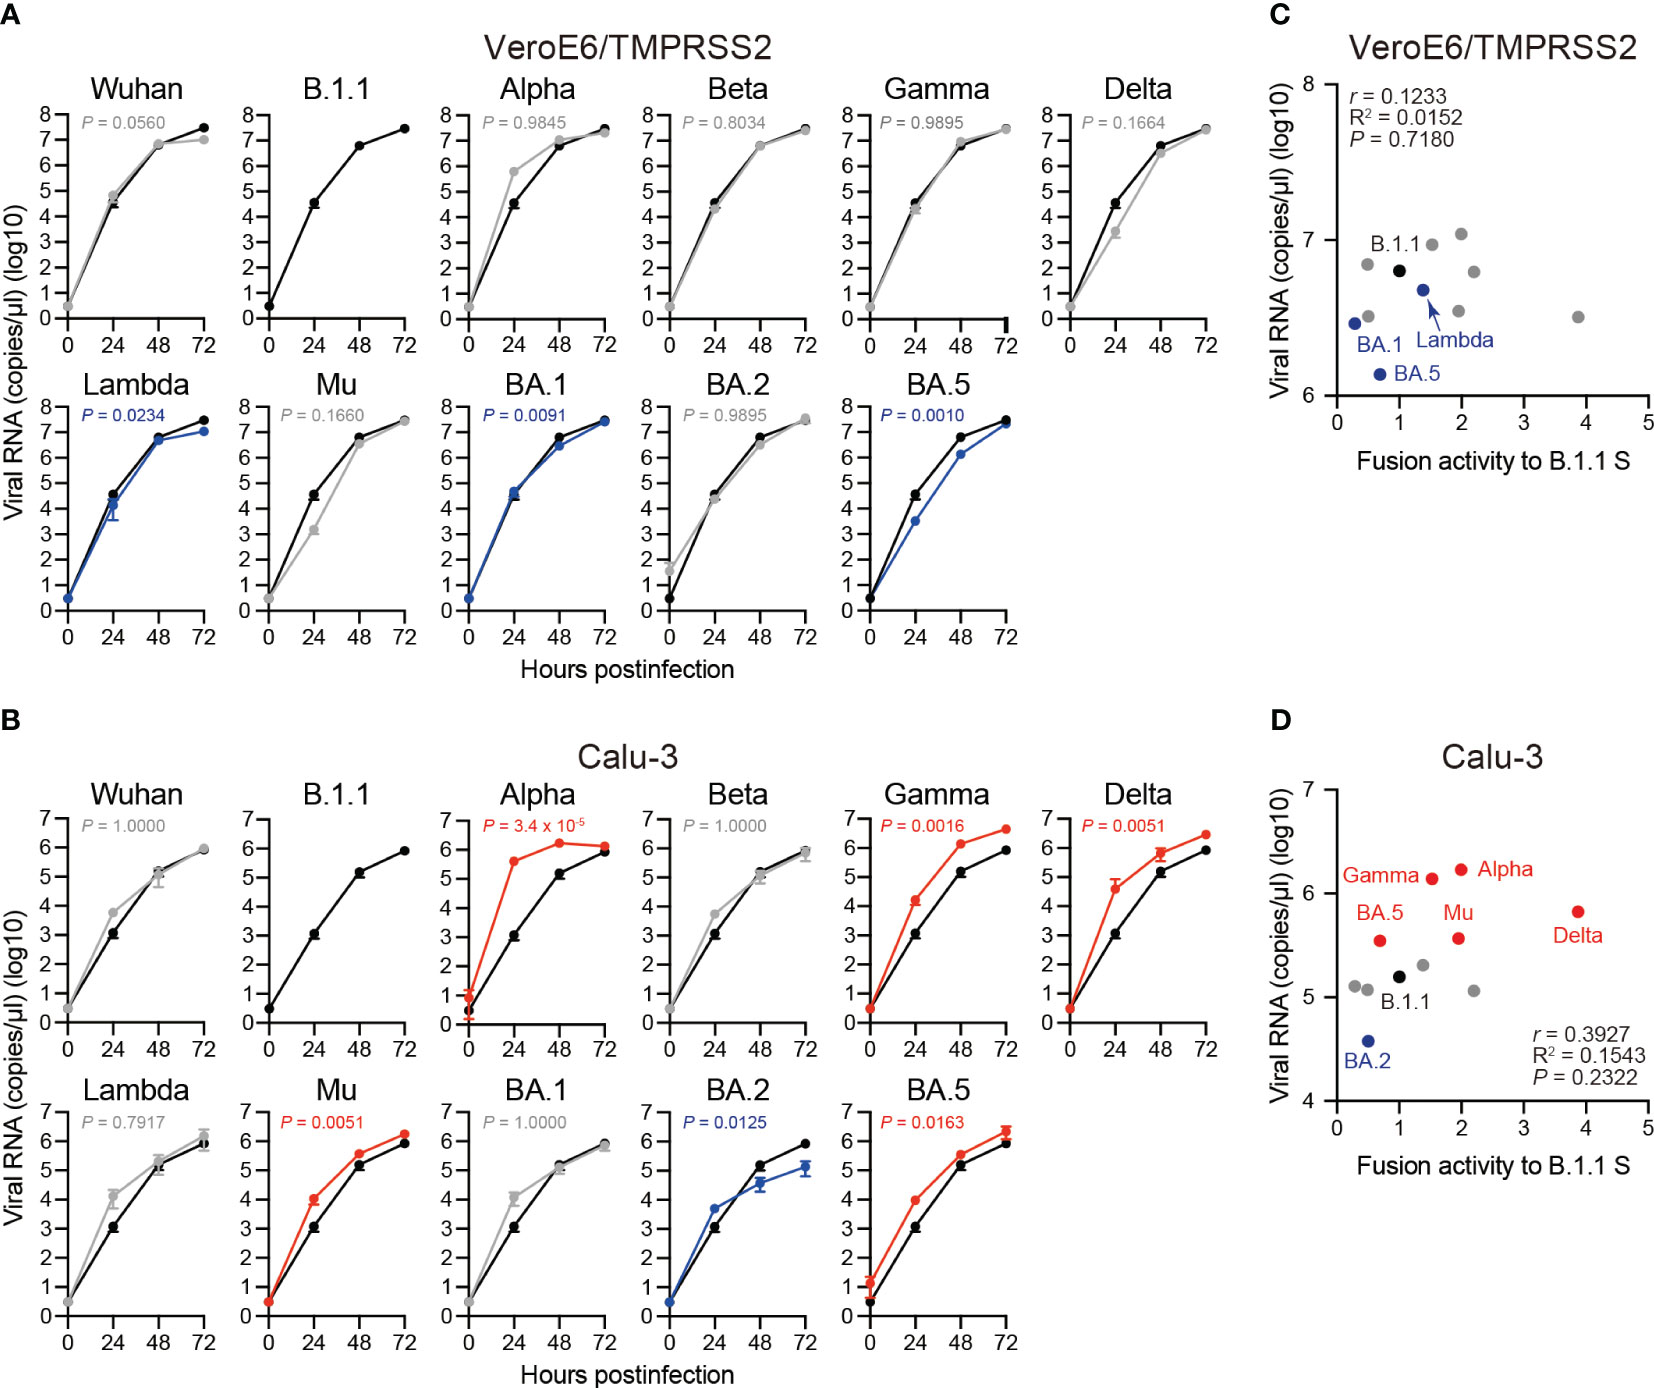
Figure 6 Replication kinetics of the eleven SARS-CoV-2 variants in VeroE6/TMPRSS2 and Calu-3 cells. (A) Representative replication kinetics of indicated clinical isolates in VeroE6/TMPRSS2 cells. The viral RNA copy number in the supernatant was quantified using RT–qPCR. The data at each time point are represented as the mean ± standard deviation (SD) from 4 independent experiments. The statistical differences between B.1.1 S (black line) and each S variant across the timepoints were determined using a two-way ANOVA. The P values are indicated in blue (reduction) or gray (not significant) in each graph. The 0 h data were excluded from the analyses. We indicated the Family-wise error rates (FWERs), calculated using the Holm method. (B) Representative replication kinetics of indicated clinical isolates in Calu-3 cells. The viral RNA copy number in the supernatant was quantified using RT–qPCR. The data at each time point are represented as the mean ± SD from 4 independent experiments. The statistical differences between B.1.1 S (black line) and each S variant across the timepoints were determined using a two-way ANOVA. The P values are indicated in blue (reduction), red (increase), or gray (not significant) in each graph. The 0 h data were excluded from the analyses. We indicated the FWERs, calculated using the Holm method. (C) Correlation between viral RNA copy numbers 48 hours postinfection and the fusogencity of the indicated S variants 24 hours after coculture. The Pearson correlation coefficient (r) and correlation squared (R2) are indicated in the figure. The P value was calculated by a two-tailed test. (D) Correlation between viral RNA copy numbers 48 hours postinfection and fusogenicities of the indicated S variants 24 hours after coculture. The Pearson correlation coefficient (r) and correlation squared (R2) are indicated in the figure. The P value was calculated by a two-tailed test.
Discussion
SARS-CoV-2 constantly evolves with mutations in its viral genome since its emergence in late 2019. In particular, the virological characteristics of the Omicron variants, such as transmissibility, pathogenicity, and immunity resistance, are rather different from those of the pre-Omicron variants [reviewed in (11, 15, 18, 19, 58, 59)]. The S gene is the most variable gene in the emerged SARS-CoV-2 variants. The SARS-CoV-2 S protein is pivotal in mediating the virus-target cell membrane fusion. Previous studies indicated that the SARS-CoV-2 S protein fusogenicity is closely associated with intrinsic pathogenicity (20–24). Therefore, describing S protein features is of utmost importance. In this study, we investigated the correlation between S protein fusogenicity and other virological parameters in eleven SARS-CoV-2 variants including previous SARS-CoV-2 VOCs and VOIs. The S protein fusogenicity strongly and positively correlated with S protein S1/S2 cleavage in transfected HEK293 cells (Figure 2C) and the plaque size in VeroE6/TMPRSS2 cells infected by clinical isolates (Figure 3C). However, the S protein fusogenicity was weakly associated with S protein-mediated pseudoviral infectivity (Figures 4B, F) and entry efficiency in HOS-ACE2/TMPRSS2 cells (Figure 5G) as well as viral replication kinetics in VeroE6/TMPRSS2 and Calu-3 cells (Figures 6C, D) (see Supplementary Table S1 for a summary of all comparisons). Taken together, our data suggest that, similar to SARS-CoV-2 S protein fusogenicity, S1/S2 cleavage and plaque size could be potential indicators to predict the intrinsic pathogenicity and S protein fusogenicity of newly emerged SARS-CoV-2 variants.
Newly emerged SARS-CoV-2 variant pathogenicity is rather different in clinical settings before and after the emergence of the Omicron BA.1 variant [reviewed in (18)]. Although the Delta variant resulted in more severe outcome in infected patients, those of the Omicron BA.1 variant were attenuated [reviewed in (18)]. Indeed, studies have suggested that several amino acid substitutions in the Fusion protein of measles virus confer hyperfusogenicity on it, implicating the pathogenicity in subacute sclerosing panencephalitis and measles inclusion body encephalitis (60–63). Newly emerged SARS-CoV-2 variant pathogenicity might be predictable by measuring S protein fusogenicity as the latter is reportedly closely associated with the intrinsic pathogenicity of certain SARS-CoV-2 variants (20–24). For example, the Delta variant displays more fusogenic S proteins and represents higher pathogenicity as demonstrated in a hamster model (21). In contrast, the S protein of the Omicron BA.1 variant is less fusogenic and its pathogenicity also remains relatively low (23, 24). In support of these clinical and experimental observations, our data demonstrated that the S proteins of six pre-Omicron variants (Alpha, Beta, Gamma, Delta, Lambda, and Mu) exhibited higher fusogenicity than the D614G S protein based on our S protein-mediated membrane fusion assay, while the Omicron S proteins of the BA.1, BA.2 and BA.5 variants yielded comparable or lower fusogenicity (Figure 1C). Moreover, we demonstrated that the S protein S1/S2 cleavage efficiency and plaque size in clinical isolates correlated with S protein fusogenicity (Figures 2C, 3C), suggesting that these parameters could serve as potential markers for intrinsic pathogenicity and S protein fusogenicity prediction of newly emerged SARS-CoV-2 variants.
Nevertheless, the relationship between viral fusogenicity and viral intrinsic pathogenicity is not applied to recently emerged Omicron subvariants, the BQ.1.1 and XBB.1 variants (30, 32). Although these variants demonstrated higher fusogenicity than the BA.5 and BA.2.75 variants, their intrinsic pathogenicity was comparable or lower (30, 32). These unexpected results might be explained by a scenario where non-S proteins could cancel the S protein-induced viral intrinsic pathogenicity increase. In fact, ORF1ab (64–67), ORF3a (68–70), ORF6 (68, 71), ORF7a (72), and ORF8 (49, 73, 74) gene deletions or mutations and those of genes downstream of the S gene (48) are reportedly associated with viral growth attenuation in cell lines or pathogenicity in infected animal models. Remarkably, the BQ.1.1 and XBB.1 variants display at least six and seven amino acid substitutions in the non-S protein coding region compared to the BA.5 and BA.2.75 variants (30, 32). One or some of these substitutions might be involved in attenuating the S protein-augmented intrinsic pathogenicity. Further studies would be required to investigate the non-S gene-intrinsic pathogenesis interaction.
It is thought to be a positive correlation of S1/S2 cleavage efficiency between HEK293 cells and authentic viral particles produced from VeroE6/TMPRSS2 because a report showed similar S1/S2 cleavage of at least Delta and Omicron BA.1 variants in virus-producing Vero-ACE2/TMPRSS2 cells and in the viral particles (47). However, S1/S2 cleavage in the viral particles might not be associated with cell-free viruses since cell-cell fusion mediated by S proteins on the cell surface forms syncytia, causing cytopathic effect and the degree of S protein fusogenicity determines plaque size (21, 23, 24, 75).
SARS-CoV-2 S protein fusogenicity is essential for viral entry into the target cells. Nevertheless, SARS-CoV-2 S pseudoviral infectivity, entry efficiency, and viral replication indicated less correlation with S protein fusogenicity (Figures 4F, 5G, 6C, D). Concerning our pseudovirus and BlaM-Vpr assays, we used lentiviruses pseudotyped with different S proteins of interest carrying Δ19CT. The C-terminal deletion of 19 amino acids in the S protein decreases endoplasmic reticulum retention and facilitate the incorporation of S protein into pseudoviral particles (76–78). Importantly, S proteins are more cleaved in the pseudoviral particles (Figures 4C, 5C) as seen in prior studies (77). Therefore, it is likely that the C-terminal deletion of 19 amino acids in the S protein is attributed to the differences in S1/S2 cleavage efficiency in pseudoviruses compared to that in HEK293 cells.
In addition, we used HOS-ACE2/TMPRSS2 cells as non-natural SARS-CoV-2 target cells that stably express ACE2 and TMPRSS2. Notably, BA.1 and BA.2 variants were sensitive to the Cathepsin L inhibitor E64d in HOS-ACE2/TMPRSS2 (24). Indeed, Omicron variants increased pseudoviral infectivity and entry efficiency in HOS-ACE2/TMPRSS2 cells than pre-Omicron variants after normalization by S protein incorporation levels (Figures 4E, 5E). These results suggest that TMPRSS2 usage may affect pseudoviral infectivity and entry efficiency in HOS-ACE2/TMPRSS2 cells. The efficiency of S1/S2 cleavage and S protein incorporation into the pseudoviral particles is important for pseudoviral infectivity (47, 79). Furthermore, ACE2 binding affinity of S protein with ACE2 receptor and entry pathways (usage for TMPRSS2 or Cathepsin L) are also associated with pseudoviral infectivity (24, 32, 47). Therefore, these results demonstrate that multiple factors affect pseudoviral infectivity.
The related observations could contribute to drawing a difference from viral infection in vivo. Furthermore, viral RNA production during viral replication in VeroE6/TMPRSS2 and Calu-3 cells did not correlate with S protein fusogenicity. Indeed, various studies described that at least pseudoviral infectivity is not necessarily consistent with viral fusogenicity, pathogenicity, and epidemiology (22, 24, 30, 32, 41, 49, 80–82). Accordingly, our pseudoviral infectivity, BlaM-Vpr, and viral replication assay-related data might be reasonable. However, performing these assays in at least primary lung cells would be needed to better understand how virological parameters (e.g., SARS-CoV-2 S pseudoviral infectivity, entry efficiency, and viral replication kinetics) could affect viral pathogenicity.
In summary, we revealed that S protein S1/S2 cleavage efficiency and clinical isolate plaque size are associated with SARS-CoV-2 S protein fusogenicity. Since the S protein fusogenicity is closely associated with intrinsic viral pathogenicity, these virological parameters could be used as potential markers to predict the intrinsic pathogenicity of newly emerged SARS-CoV-2 variants. However, the relationship between viral fusogenicity and intrinsic pathogenicity do not apply to the BQ.1.1 and XBB.1 variants. Therefore, further studies would be required to precisely describe the virological features of newly emerged SARS-CoV-2 variants, such as viral pathogenicity-determining factor(s).
Data availability statement
The original contributions presented in the study are included in the article/Supplementary Material, further inquiries can be directed to the corresponding author/s.
Ethics statement
Ethical approval was not required for the studies on animals in accordance with the local legislation and institutional requirements because only commercially available established cell lines were used.
Author contributions
MB: Conceptualization, Investigation, Validation, Writing – original draft, Writing – review & editing. KI: Conceptualization, Investigation, Writing – review & editing. OT: Conceptualization, Investigation, Writing – review & editing. HN: Conceptualization, Investigation, Writing – review & editing. MJ: Conceptualization, Investigation, Writing – review & editing. KT: Conceptualization, Investigation, Writing – review & editing. IY: Conceptualization, Investigation, Writing – review & editing. MN: Conceptualization, Investigation, Writing – review & editing. KS: Conceptualization, Investigation, Writing – review & editing. KY: Conceptualization, Investigation, Writing – review & editing. KS: Conceptualization, Investigation, Writing – review & editing. TI: Conceptualization, Funding acquisition, Investigation, Methodology, Project administration, Supervision, Validation, Writing – original draft, Writing – review & editing.
The Genotype to Phenotype Japan (G2P-Japan) Consortium
Keita Matsuno13, Naganori Nao13, Hirofumi Sawa13, Shinya Tanaka13, Masumi Tsuda13, Lei Wang13, Yoshikata Oda13, Zannatul Ferdous13, Kenji Shishido13,Takasuke Fukuhara13, Tomokazu Tamura13, Rigel Suzuki13, Saori Suzuki13, Hayato Ito13, Jumpei Ito6, Yu Kaku6, Naoko Misawa6, Arnon Plianchaisuk6, Ziyi Guo6, Alfredo Jr. Hinay6, Keiya Uriu6, Yusuke Kosugi6, Shigeru Fujita6, Jarel Elgin Mendoza Tolentino6, Luo Chen6, Lin Pan6, Mai Suganami6, Mika Chiba6, Ryo Yoshimura6, Kyoko Yasuda6, Keiko Iida6, Naomi Ohsumi6, Adam Patrick Strange6, Hiroyuki Asakura5, Isao Yoshida5, So Nakagawa14, Akifumi Takaori-Kondo15, Kotaro Shirakawa15, Kayoko Nagata15, Ryosuke Nomura15, Yoshihito Horisawa15, Yusuke Tashiro15, Yugo Kawai15, Kazuo Takayama15, Rina Hashimoto15, Sayaka Deguchi15, Yukio Watanabe15, Ayaka Sakamoto15, Naoko Yasuhara15, Takao Hashiguchi15, Tateki Suzuki15, Kanako Kimura15, Jiei Sasaki15, Yukari Nakajima15, Hisano Yajima15, Takashi Irie16, Ryoko Kawabata16, Kaori Tabata17, Ryo Shimizu1, Yuka Mugita1, Takamasa Ueno18, Chihiro Motozono18, Mako Toyoda18, Akatsuki Saito19, Maya Shofa19, Yuki Shibatani19, Tomoko Nishiuchi19, 13 Hokkaido University, 14 Tokai University, 15 Kyoto University, 16 Hiroshima University, 17 Kyushu University, 18 Kumamoto University, 19 Miyazaki University.
Funding
The author(s) declare financial support was received for the research, authorship, and/or publication of this article. This study was supported in part by AMED SCARDA Japan Initiative for World-leading Vaccine Research and Development Centers “UTOPIA” (JP223fa627001, to Kei Sato), AMED SCARDA Program on R&D of new generation vaccine including new modality application (JP223fa727002, to Kei Sato); AMED Research Program on Emerging and Re-emerging Infectious Diseases (JP21fk0108574, to Hesham Nasser; JP22fk0108146, to Kei Sato; JP21fk0108494 to G2P-Japan Consortium, Terumasa Ikeda and Kei Sato; JP21fk0108425, to Kei Sato; 22fk0108506, Kei Sato; JP21fk0108432, to Kei Sato; JP22fk0108511, to G2P-Japan Consortium, Terumasa Ikeda and Kei Sato; JP22fk0108516, to Kei Sato; JP22fk0108506, to Kei Sato; JP22fk0108534, to Terumasa Ikeda and Kei Sato); AMED Research Program on HIV/AIDS (JP22fk0410055, to Terumasa Ikeda; and JP22fk0410039, to Kei Sato); JST CREST (JPMJCR20H4, to Kei Sato); JSPS KAKENHI Grant-in-Aid for Scientific Research C (21K07060, to Kenzo Tokunaga; 22K07103, to Terumasa Ikeda); JSPS KAKENHI Grant-in-Aid for Early-Career Scientists (22K16375, to Hesham Nasser); JSPS Core-to-Core Program (A. Advanced Research Networks) (JPJSCCA20190008, to Kei Sato); JSPS Leading Initiative for Excellent Young Researchers (LEADER) (to Terumasa Ikeda); The Cooperative Research Program (Joint Usage/Research Center program) of Institute for Life and Medical Sciences, Kyoto University (to Kei Sato); The Tokyo Biochemical Research Foundation (to Kei Sato); Takeda Science Foundation (to Terumasa Ikeda); Mochida Memorial Foundation for Medical and Pharmaceutical Research (to Terumasa Ikeda); The Naito Foundation (to Terumasa Ikeda); Waksman Foundation of Japan (to Terumasa Ikeda); The Uehara Memorial Foundation (to Terumasa Ikeda); an intramural grant from Kumamoto University COVID-19 Research Projects (AMABIE) (to Terumasa Ikeda); International Joint Research Project of the Institute of Medical Science, the University of Tokyo (to Terumasa Ikeda).
Acknowledgments
We would like to thank all members belonging to The Genotype to Phenotype Japan (G2P-Japan) Consortium, particularly Dr. Jumpei Ito for the assistance of statistical analyses. We thank Dr. Jin Gohda (The University of Tokyo, Japan) for providing reagents. We also thank Drs. Tomohiko Takasaki and Jun-Ichi Sakuragi (Kanagawa Prefectural Institute of Public Health) for providing SARS-CoV-2 Wuhan variant (strain SARS-CoV-2/Hu/DP/Kng/19-020, Genbank accession no. LC528232) and National Institute of Infectious Diseases for providing SARS-CoV-2 Alpha (strain QHN001, GISAID ID: EPI_ISL_804007), Beta (strain TY8-612, GISAID ID: EPI_ISL_1123289), Gamma (strain TY7-503, GISAID ID: EPI_ISL_877769), Delta (strain TY11-927, GISAID ID: EPI_ISL_2158617), Lambda (strain TY33-456, GISAID ID: EPI_ISL_4204973), Mu (strain TY26-717, GISAID ID: EPI_ISL_4470503), Omicron BA.1 (strain TY38-873, GISAID ID: EPI_ISL_7418017), and Omicron BA.2 (strain TY40-385, GISAID ID: EPI_ISL_9595859).
Conflict of interest
The reviewer MY declared a shared affiliation with the author KS to the handling editor at the time of the review. RE MY Research Center for Asian Infectious Diseases, Institute of Medical Science, The University of Tokyo. Dr. Kei Sato has consulting fees from Moderna Japan Co., Ltd. and Takeda Pharmaceutical Co. Ltd. and honoraria for lectures from Gilead Sciences, Inc., Moderna Japan Co., Ltd., and Shionogi & Co., Ltd.
The remaining authors declare that the research was conducted in the absence of any commercial or financial relationships that could be constructed as a potential conflict of interest.
The author(s) declared that they were an editorial board member of Frontiers, at the time of submission. This had no impact on the peer review process and the final decision.
Publisher’s note
All claims expressed in this article are solely those of the authors and do not necessarily represent those of their affiliated organizations, or those of the publisher, the editors and the reviewers. Any product that may be evaluated in this article, or claim that may be made by its manufacturer, is not guaranteed or endorsed by the publisher.
Supplementary material
The Supplementary Material for this article can be found online at: https://www.frontiersin.org/articles/10.3389/fviro.2024.1353661/full#supplementary-material
Supplementary Figure 1 | Uncropped images of western blots corresponding to Figures 2A. (A) An uncropped image of western blots with a rabbit anti-SARS-CoV-2 S polyclonal antibody. A red box indicates the cropped area. (B) An uncropped image of western blots with a mouse anti-α-tubulin monoclonal antibody. A red box indicates the cropped area.
Supplementary Figure 2 | Uncropped images of western blots corresponding to Figures 4C. (A) An uncropped image of western blots with a rabbit anti-SARS-CoV-2 S polyclonal antibody. A red box indicates the cropped area. (B) An uncropped image of western blots with a mouse anti-HIV-1 p24 monoclonal antibody. A red box indicates the cropped area.
Supplementary Figure 3 | Uncropped images of western blots corresponding to .Figures 5C (A) An uncropped image of western blots with a rabbit anti-SARS-CoV-2 S polyclonal antibody. A red box indicates the cropped area. (B) An uncropped image of western blots with a mouse anti-HIV-1 p24 monoclonal antibody. A red box indicates the cropped area.
References
1. Wu F, Zhao S, Yu B, Chen YM, Wang W, Song ZG, et al. A new coronavirus associated with human respiratory disease in China. Nature. (2020) 579:265–9. doi: 10.1038/s41586-020-2008-3
2. Zhou P, Yang XL, Wang XG, Hu B, Zhang L, Zhang W, et al. A pneumonia outbreak associated with a new coronavirus of probable bat origin. Nature. (2020) 579:270–3. doi: 10.1038/s41586-020-2012-7
3. WHO. COVID-19 Public Health Emergency of International Concern (PHEIC) Global research and innovation forum (2020). Available online at: https://www.who.int/publications/m/item/covid-19-public-health-emergency-of-international-concern-(pheic)-global-research-and-innovation-forum.
4. WHO. Statement on the fifteenth meeting of the IHR (2005) Emergency Committee on the COVID-19 pandemic (2023). Available online at: https://www.who.int/news/item/05-05-2023-statement-on-the-fifteenth-meeting-of-the-international-health-regulations-(2005)-emergency-committee-regarding-the-coronavirus-disease-(covid-19)-pandemic.
5. WHO. WHO coronavirus (COVID-19) Dashboard (2023). Available online at: https://covid19.who.int.
6. Polatoglu I, Oncu-Oner T, Dalman I, Ozdogan S. COVID-19 in early 2023: Structure, replication mechanism, variants of SARS-CoV-2, diagnostic tests, and vaccine & drug development studies. MedComm (2020). (2023) 4:e228. doi: 10.1002/mco2.228
7. Salimi-Jeda A, Abbassi S, Mousavizadeh A, Esghaie M, Bokharaei-Salim F, Jeddi F, et al. SARS-CoV-2: Current trends in emerging variants, pathogenesis, immune responses, potential therapeutic, and vaccine development strategies. Int Immunopharmacol. (2021) 101:108232. doi: 10.1016/j.intimp.2021.108232
8. Chen Y, Liu Q, Guo D. Emerging coronaviruses: Genome structure, replication, and pathogenesis. J Med Viro. (2020) 92:418–23. doi: 10.1002/jmv.25681
9. Suryawanshi RK, Koganti R, Agelidis A, Patil CD, Shukla D. Dysregulation of cell signaling by SARS-coV-2. Trends Microbiol. (2021) 29:224–37. doi: 10.1016/j.tim.2020.12.007
10. Jackson CB, Farzan M, Chen B, Choe H. Mechanisms of SARS-CoV-2 entry into cells. Nat Rev Mol Cell Biol. (2021) 23(1):3–20. doi: 10.1038/s41580-021-00418-x
11. Mykytyn AZ, Fouchier RA, Haagmans BL. Antigenic evolution of SARS coronavirus 2. Curr Opin Virol. (2023) 62:101349. doi: 10.1016/j.coviro.2023.101349
12. Johnson BA, Xie X, Bailey AL, Kalveram B, Lokugamage KG, Muruato A, et al. Loss of furin cleavage site attenuates SARS-CoV-2 pathogenesis. Nature. (2021) 591:293–9. doi: 10.1038/s41586-021-03237-4
13. Hoffmann M, Kleine-Weber H, Schroeder S, Kruger N, Herrler T, Erichsen S, et al. SARS-coV-2 cell entry depends on ACE2 and TMPRSS2 and is blocked by a clinically proven protease inhibitor. Cell. (2020) 181:271–80 e8. doi: 10.1016/j.cell.2020.02.052
14. Lamers MM, Haagmans BL. SARS-coV-2 pathogenesis. Nat Rev Microbiol. (2022) 20:270–84. doi: 10.1038/s41579-022-00713-0
15. Markov PV, Ghafari M, Beer M, Lythgoe K, Simmonds P, Stilianakis NI, et al. The evolution of SARS-coV-2. Nat Rev Microbiol. (2023) 21:361–79. doi: 10.1038/s41579-023-00878-2
16. Souza PFN, Mesquita FP, Amaral JL, Landim PGC, Lima KRP, Costa MB, et al. The spike glycoprotein of SARS-CoV-2: A review of how mutations of spike glycoproteins have driven the emergence of variants with high transmissibility and immune escape. Int J Biol Macromol. (2022) 208:105–25. doi: 10.1016/j.ijbiomac.2022.03.058
17. Harvey WT, Carabelli AM, Jackson B, Gupta RK, Thomson EC, Harrison EM, et al. SARS-CoV-2 variants, spike mutations and immune escape. Nat Rev Microbiol. (2021) 19:409–24. doi: 10.1038/s41579-021-00573-0
18. Shrestha LB, Foster C, Rawlinson W, Tedla N, Bull RA. Evolution of the SARS-CoV-2 omicron variants BA.1 to BA.5: Implications for immune escape and transmission. Rev Med Virol. (2022) 32:e2381. doi: 10.1002/rmv.2381
19. Carabelli AM, Peacock TP, Thorne LG, Harvey WT, Hughes J, Consortium C-GU, et al. SARS-CoV-2 variant biology: immune escape, transmission and fitness. Nat Rev Microbiol. (2023) 21:162–77. doi: 10.1038/s41579-022-00841-7
20. Kimura I, Yamasoba D, Tamura T, Nao N, Suzuki T, Oda Y, et al. Virological characteristics of the SARS-CoV-2 Omicron BA.2 subvariants, including BA.4 and BA.5. Cell. (2022) 185:3992–4007 e16. doi: 10.1016/j.cell.2022.09.018
21. Saito A, Irie T, Suzuki R, Maemura T, Nasser H, Uriu K, et al. Enhanced fusogenicity and pathogenicity of SARS-CoV-2 Delta P681R mutation. Nature. (2022) 602:300–6. doi: 10.1038/s41586-021-04266-9
22. Saito A, Tamura T, Zahradnik J, Deguchi S, Tabata K, Anraku Y, et al. Virological characteristics of the SARS-CoV-2 Omicron BA.2.75 variant. Cell Host Microbe. (2022) 30(11):1540–55. doi: 10.1016/j.chom.2022.10.003
23. Suzuki R, Yamasoba D, Kimura I, Wang L, Kishimoto M, Ito J, et al. Attenuated fusogenicity and pathogenicity of SARS-CoV-2 Omicron variant. Nature. (2022) 603:700–5. doi: 10.1038/s41586-022-04462-1
24. Yamasoba D, Kimura I, Nasser H, Morioka Y, Nao N, Ito J, et al. Virological characteristics of the SARS-CoV-2 Omicron BA.2 spike. Cell. (2022) 185:2103–15 e19. doi: 10.1016/j.cell.2022.04.035
25. Ozono S, Zhang Y, Ode H, Sano K, Tan TS, Imai K, et al. SARS-CoV-2 D614G spike mutation increases entry efficiency with enhanced ACE2-binding affinity. Nat Commun. (2021) 12:848. doi: 10.1038/s41467-021-21118-2
26. Matsuyama S, Nao N, Shirato K, Kawase M, Saito S, Takayama I, et al. Enhanced isolation of SARS-CoV-2 by TMPRSS2-expressing cells. Proc Natl Acad Sci U.S.A. (2020) 117:7001–3. doi: 10.1073/pnas.2002589117
27. Yamamoto M, Kiso M, Sakai-Tagawa Y, Iwatsuki-Horimoto K, Imai M, Takeda M, et al. The anticoagulant Nafamostat potently Inhibits SARS-CoV-2 S protein-mediated fusion in a cell fusion assay system and viral infection in vitro in a cell-type-dependent manner. Viruses. (2020) 12(6):629. doi: 10.3390/v12060629
28. Fukuda M, Islam MS, Shimizu R, Nasser H, Rabin NN, Takahashi Y, et al. Lethal interactions of SARS-coV-2 with graphene oxide: implications for COVID-19 treatment. ACS Appl Nano Mater. (2021) 4:11881–7. doi: 10.1021/acsanm.1c02446
29. Kaku Y, Kuwata T, Zahid HM, Hashiguchi T, Noda T, Kuramoto N, et al. Resistance of SARS-CoV-2 variants to neutralization by antibodies induced in convalescent patients with COVID-19. Cell Rep. (2021) 36:109385. doi: 10.1016/j.celrep.2021.109385
30. Tamura T, Ito J, Uriu K, Zahradnik J, Kida I, Anraku Y, et al. Virological characteristics of the SARS-CoV-2 XBB variant derived from recombination of two Omicron subvariants. Nat Commun. (2023) 14:2800. doi: 10.1038/s41467-023-38435-3
31. Islam MS, Fukuda M, Hossain MJ, Rabin NN, Tagawa R, Nagashima M, et al. SARS-CoV-2 suppression depending on the pH of graphene oxide nanosheets. Nanoscale Adv. (2023) 5:2413–7. doi: 10.1039/D3NA00084B
32. Ito J, Suzuki R, Uriu K, Itakura Y, Zahradnik J, Kimura KT, et al. Convergent evolution of SARS-CoV-2 Omicron subvariants leading to the emergence of BQ.1.1 variant. Nat Commun. (2023) 14:2671. doi: 10.1038/s41467-023-38188-z
33. Reed LJ, Muench H. A simple method of estimating fifty per cent endopoints. Am J Epidemiol. (1938) 27:493–7. doi: 10.1093/oxfordjournals.aje.a118408
34. Motozono C, Toyoda M, Zahradnik J, Saito A, Nasser H, Tan TS, et al. SARS-CoV-2 spike L452R variant evades cellular immunity and increases infectivity. Cell Host Microbe. (2021) 29:1124–36 e11. doi: 10.1016/j.chom.2021.06.006
35. Kimura I, Kosugi Y, Wu J, Zahradnik J, Yamasoba D, Butlertanaka EP, et al. The SARS-CoV-2 Lambda variant exhibits enhanced infectivity and immune resistance. Cell Rep. (2022) 38:110218. doi: 10.1016/j.celrep.2021.110218
36. Uriu K, Kimura I, Shirakawa K, Takaori-Kondo A, Nakada TA, Kaneda A, et al. Neutralization of the SARS-CoV-2 Mu variant by convalescent and vaccine serum. N Engl J Med. (2021) 385:2397–9. doi: 10.1056/NEJMc2114706
37. Niwa H, Yamamura K, Miyazaki J. Efficient selection for high-expression transfectants with a novel eukaryotic vector. Gene. (1991) 108:193–9. doi: 10.1016/0378-1119(91)90434-D
38. Nasser H, Shimizu R, Ito J, Genotype to Phenotype Japan C, Saito A, Sato K, et al. Monitoring fusion kinetics of viral and target cell membranes in living cells using a SARS-CoV-2 spike-protein-mediated membrane fusion assay. STAR Protoc. (2022) 3:101773. doi: 10.1016/j.xpro.2022.101773
39. Kondo N, Miyauchi K, Meng F, Iwamoto A, Matsuda Z. Conformational changes of the HIV-1 envelope protein during membrane fusion are inhibited by the replacement of its membrane-spanning domain. J Biol Chem. (2010) 285:14681–8. doi: 10.1074/jbc.M109.067090
40. Kondo N, Miyauchi K, Matsuda Z. Monitoring viral-mediated membrane fusion using fluorescent reporter methods. Curr Protoc Cell Biol. (2011) 50(1):26–9 doi: 10.1002/0471143030.cb2609s50
41. Uriu K, Ito J, Kosugi Y, Tanaka YL, Mugita Y, Guo Z, et al. Transmissibility, infectivity, and immune evasion of the SARS-CoV-2 BA.2.86 variant. Lancet Infect Dis. (2023) 23:e460–e1. doi: 10.1016/S1473-3099(23)00575-3
42. Masuda Y, Nasser H, Zahradnik J, Mitoma S, Shimizu R, Nagata K, et al. Characterization of the evolutionary and virological aspects of mutations in the receptor binding motif of the SARS-CoV-2 spike protein. Front Virol. (2023) 3:1328229. doi: 10.3389/fviro.2023.1328229
43. Tsujino S, Deguchi S, Nomai T, Padilla-Blanco M, Plianchaisuk A, Wang L, et al. Virological characteristics of the SARS-CoV-2 Omicron EG. 5.1 variant. BioRxiv. (2023). doi: 10.1101/2023.10.19.563209
44. Ozono S, Zhang Y, Tobiume M, Kishigami S, Tokunaga K. Super-rapid quantitation of the production of HIV-1 harboring a luminescent peptide tag. J Biol Chem. (2020) 295:13023–30. doi: 10.1074/jbc.RA120.013887
45. Cavrois M, Neidleman J, Greene WC. HIV-1 fusion assay. Bio Protoc. (2014) 4(16):e1212–. doi: 10.21769/bioprotoc.1212
46. Tan TS, Toyoda M, Tokunaga K, Ueno T. Aromatic Side Chain at Position 412 of SERINC5 Exerts Restriction Activity toward HIV-1 and Other Retroviruses. J Virol. (2021) 95:e0063421. doi: 10.1128/JVI.00634-21
47. Meng B, Abdullahi A, Ferreira I, Goonawardane N, Saito A, Kimura I, et al. Altered TMPRSS2 usage by SARS-CoV-2 Omicron impacts infectivity and fusogenicity. Nature. (2022) 603:706–14. doi: 10.1038/s41586-022-04474-x
48. Kimura I, Yamasoba D, Nasser H, Ito H, Zahradnik J, Wu J, et al. Multiple mutations of SARS-CoV-2 Omicron BA.2 variant orchestrate its virological characteristics. J Virol. (2023) 97:e0101123. doi: 10.1128/jvi.01011-23
49. Tamura T, Irie T, Deguchi S, Yajima H, Tsuda M, Nasser H, et al. Virological characteristics of the SARS-CoV-2 XBB.1.5 variant. BioRxiv. (2023). doi: 10.1101/2023.08.16.553332
50. Tamura T, Mizuma K, Nasser H, Deguchi S, Padilla-Blanco M, Oda Y, et al. Virological characteristics of the SARS-CoV-2 BA.2.86 variant. Cell Host Microbe. (2024) 32(2):170–80. doi: 10.1016/j.chom.2024.01.001
51. Kimura I, Yamasoba D, Nasser H, Zahradnik J, Kosugi Y, Wu J, et al. The SARS-CoV-2 spike S375F mutation characterizes the Omicron BA.1 variant. iScience. (2022) 25:105720. doi: 10.1016/j.isci.2022.105720
52. Ikeda T, Symeonides M, Albin JS, Li M, Thali M, Harris RS. HIV-1 adaptation studies reveal a novel Env-mediated homeostasis mechanism for evading lethal hypermutation by APOBEC3G. PloS Pathog. (2018) 14:e1007010. doi: 10.1371/journal.ppat.1007010
53. Ikeda T, Molan AM, Jarvis MC, Carpenter MA, Salamango DJ, Brown WL, et al. HIV-1 restriction by endogenous APOBEC3G in the myeloid cell line THP-1. J Gen Virol. (2019) 100:1140–52. doi: 10.1099/jgv.0.001276
54. Ikeda T, Shimizu R, Nasser H, Carpenter MA, Cheng AZ, Brown WL, et al. APOBEC3 degradation is the primary function of HIV-1 Vif determining virion infectivity in the myeloid cell line THP-1. mBio. (2023) 14:e0078223. doi: 10.1128/mbio.00782-23
55. Evans JD. Straightforward Statistics for the Behavioral Sciences. Pacific Grove, Calif: Brooks/Cole Publishing (1996).
56. Papageorgiou SN. On correlation coefficients and their interpretation. J Orthod. (2022) 49:359–61. doi: 10.1177/14653125221076142
57. Xia S, Lan Q, Su S, Wang X, Xu W, Liu Z, et al. The role of furin cleavage site in SARS-CoV-2 spike protein-mediated membrane fusion in the presence or absence of trypsin. Signal Transduct Target Ther. (2020) 5:92. doi: 10.1038/s41392-020-0184-0
58. Gili R, Burioni R. SARS-CoV-2 before and after Omicron: two different viruses and two different diseases? J Transl Med. (2023) 21:251. doi: 10.1186/s12967-023-04095-6
59. Araf Y, Akter F, Tang YD, Fatemi R, Parvez MSA, Zheng C, et al. Omicron variant of SARS-CoV-2: Genomics, transmissibility, and responses to current COVID-19 vaccines. J Med Virol. (2022) 94:1825–32. doi: 10.1002/jmv.27588
60. Ayata M, Takeuchi K, Takeda M, Ohgimoto S, Kato S, Sharma LB, et al. The F gene of the Osaka-2 strain of measles virus derived from a case of subacute sclerosing panencephalitis is a major determinant of neurovirulence. J Virol. (2010) 84:11189–99. doi: 10.1128/JVI.01075-10
61. Watanabe S, Shirogane Y, Suzuki SO, Ikegame S, Koga R, Yanagi Y. Mutant fusion proteins with enhanced fusion activity promote measles virus spread in human neuronal cells and brains of suckling hamsters. J Virol. (2013) 87:2648–59. doi: 10.1128/JVI.02632-12
62. Jurgens EM, Mathieu C, Palermo LM, Hardie D, Horvat B, Moscona A, et al. Measles fusion machinery is dysregulated in neuropathogenic variants. mBio. (2015) 6(1):10–128. doi: 10.1128/mBio.02528-14
63. Watanabe S, Ohno S, Shirogane Y, Suzuki SO, Koga R, Yanagi Y. Measles virus mutants possessing the fusion protein with enhanced fusion activity spread effectively in neuronal cells, but not in other cells, without causing strong cytopathology. J Virol. (2015) 89:2710–7. doi: 10.1128/JVI.03346-14
64. Lin X, Sha Z, Trimpert J, Kunec D, Jiang C, Xiong Y, et al. The NSP4 T492I mutation increases SARS-CoV-2 infectivity by altering non-structural protein cleavage. Cell Host Microbe. (2023) 31:1170–84 e7. doi: 10.1016/j.chom.2023.06.002
65. Taha TY, Chen IP, Hayashi JM, Tabata T, Walcott K, Kimmerly GR, et al. Rapid assembly of SARS-CoV-2 genomes reveals attenuation of the Omicron BA.1 variant through NSP6. Nat Commun. (2023) 14:2308. doi: 10.1038/s41467-023-37787-0
66. Kim SM, Kim EH, Casel MAB, Kim YI, Sun R, Kwak MJ, et al. SARS-CoV-2 variants with NSP12 P323L/G671S mutations display enhanced virus replication in ferret upper airways and higher transmissibility. Cell Rep. (2023) 42:113077. doi: 10.1016/j.celrep.2023.113077
67. Chen DY, Chin CV, Kenney D, Tavares AH, Khan N, Conway HL, et al. Spike and nsp6 are key determinants of SARS-CoV-2 Omicron BA.1 attenuation. Nature. (2023) 615:143–50. doi: 10.1038/s41586-023-05697-2
68. Silvas JA, Vasquez DM, Park JG, Chiem K, Allue-Guardia A, Garcia-Vilanova A, et al. Contribution of SARS-coV-2 accessory proteins to viral pathogenicity in K18 human ACE2 transgenic mice. J Virol. (2021) 95:e0040221. doi: 10.1128/JVI.00402-21
69. Liu Y, Zhang X, Liu J, Xia H, Zou J, Muruato AE, et al. A live-attenuated SARS-CoV-2 vaccine candidate with accessory protein deletions. Nat Commun. (2022) 13:4337. doi: 10.1038/s41467-022-31930-z
70. McGrath ME, Xue Y, Dillen C, Oldfield L, Assad-Garcia N, Zaveri J, et al. SARS-CoV-2 variant spike and accessory gene mutations alter pathogenesis. Proc Natl Acad Sci U.S.A. (2022) 119:e2204717119. doi: 10.1073/pnas.2204717119
71. Kehrer T, Cupic A, Ye C, Yildiz S, Bouhhadou M, Crossland NA, et al. Impact of SARS-CoV-2 ORF6 and its variant polymorphisms on host responses and viral pathogenesis. bioRxiv. (2022). doi: 10.1101/2022.10.18.512708
72. Nemudryi A, Nemudraia A, Wiegand T, Nichols J, Snyder DT, Hedges JF, et al. SARS-CoV-2 genomic surveillance identifies naturally occurring truncation of ORF7a that limits immune suppression. Cell Rep. (2021) 35:109197. doi: 10.1016/j.celrep.2021.109197
73. Kohyama M, Suzuki T, Nakai W, Ono C, Matsuoka S, Iwatani K, et al. SARS-CoV-2 ORF8 is a viral cytokine regulating immune responses. Int Immunol. (2023) 35:43–52. doi: 10.1093/intimm/dxac044
74. Bello-Perez M, Hurtado-Tamayo J, Mykytyn AZ, Lamers MM, Requena-Platek R, Schipper D, et al. SARS-CoV-2 ORF8 accessory protein is a virulence factor. mBio. (2023) 14(5):e0045123. doi: 10.1128/mbio.00451-23
75. Rajah MM, Hubert M, Bishop E, Saunders N, Robinot R, Grzelak L, et al. SARS-CoV-2 Alpha, Beta, and Delta variants display enhanced Spike-mediated syncytia formation. EMBO J. (2021) 40:e108944. doi: 10.15252/embj.2021108944
76. Giroglou T, Cinatl J Jr., Rabenau H, Drosten C, Schwalbe H, Doerr HW, et al. Retroviral vectors pseudotyped with severe acute respiratory syndrome coronavirus S protein. J Virol. (2004) 78:9007–15. doi: 10.1128/JVI.78.17.9007-9015.2004
77. Ou X, Liu Y, Lei X, Li P, Mi D, Ren L, et al. Characterization of spike glycoprotein of SARS-CoV-2 on virus entry and its immune cross-reactivity with SARS-CoV. Nat Commun. (2020) 11:1620. doi: 10.1038/s41467-020-15562-9
78. Johnson MC, Lyddon TD, Suarez R, Salcedo B, LePique M, Graham M, et al. Optimized pseudotyping conditions for the SARS-COV-2 spike glycoprotein. J Virol. (2020) 94(21):10–128. doi: 10.1128/JVI.01062-20
79. Peacock TP, Goldhill DH, Zhou J, Baillon L, Frise R, Swann OC, et al. The furin cleavage site in the SARS-CoV-2 spike protein is required for transmission in ferrets. Nat Microbiol. (2021) 6:899–909. doi: 10.1038/s41564-021-00908-w
80. Syed AM, Ciling A, Taha TY, Chen IP, Khalid MM, Sreekumar B, et al. Omicron mutations enhance infectivity and reduce antibody neutralization of SARS-CoV-2 virus-like particles. Proc Natl Acad Sci U.S.A. (2022) 119:e2200592119. doi: 10.1073/pnas.2200592119
81. Faraone JN, Qu P, Evans JP, Zheng YM, Carlin C, Anghelina M, et al. Neutralization escape of Omicron XBB, BR.2, and BA.2.3.20 subvariants. Cell Rep Med. (2023) 4:101049. doi: 10.1016/j.xcrm.2023.101049
Keywords: SARS-CoV-2, fusogenicity, pathogenicity, S1/S2 cleavage efficiency, plaque size, pseudoviral infectivity, pseudovirus entry efficiency, viral replication kinetics
Citation: Begum MM, Ichihara K, Takahashi O, Nasser H, Jonathan M, Tokunaga K, Yoshida I, Nagashima M, Sadamasu K, Yoshimura K, The Genotype to Phenotype Japan (G2P-Japan) Consortium, Sato K and Ikeda T (2024) Virological characteristics correlating with SARS-CoV-2 spike protein fusogenicity. Front. Virol. 4:1353661. doi: 10.3389/fviro.2024.1353661
Received: 11 December 2023; Accepted: 28 February 2024;
Published: 14 March 2024.
Edited by:
Jie Cui, Fudan University, ChinaReviewed by:
Mizuki Yamamoto, The University of Tokyo, JapanMitsuhiro Nishimura, Kobe University, Japan
Copyright © 2024 Begum, Ichihara, Takahashi, Nasser, Jonathan, Tokunaga, Yoshida, Nagashima, Sadamasu, Yoshimura, The Genotype to Phenotype Japan (G2P-Japan) Consortium, Sato and Ikeda. This is an open-access article distributed under the terms of the Creative Commons Attribution License (CC BY). The use, distribution or reproduction in other forums is permitted, provided the original author(s) and the copyright owner(s) are credited and that the original publication in this journal is cited, in accordance with accepted academic practice. No use, distribution or reproduction is permitted which does not comply with these terms.
*Correspondence: Terumasa Ikeda, ikedat@kumamoto-u.ac.jp