Clostridium autoethanogenum protein inclusion in the diet for broiler: Enhancement of growth performance, lipid metabolism, and gut microbiota
 Yushan Wu1,2†
  Jing Wang3† Ming Jia1 Shixin Huang2 Ying Cao2 Ting Yao1 Junguo Li1
  Yuxin Yang3 Xu Gu1*
- 1Institute of Feed Research of Chinese Academy of Agricultural Sciences, Laboratory of Feed-Derived Factor Risk Assessment for Animal Product Quality and Safety, Ministry of Agriculture and Rural Affairs, Beijing, China
- 2Shanghai Municipal Supervisory Institute Veterinary Drugs and Feedstaff, Shanghai, China
- 3College of Animal Science and Technology, Northwest A&F University, Xianyang, China
This study aimed to investigate the effects of dietary supplementation of the new single-cell protein Clostridium autoethanogenum protein (CAP) on growth performance, plasma biochemical indexes, liver histology, lipid metabolism, and gut microbiota in Cobb broilers. According to the randomized block experimental design, 960 Cobb broilers (1d old) were divided into six treatments with eight replicates of 20 birds each. Six isonitrogenous and isoenergetic diets were formulated with different contents of CAP (0, 1, 2, 3, 4, and 5%) to replace soybean meal (SBM). The results showed that the addition of CAP did not influence liver health when it exceeded 2%. The protein metabolism markers and feed conversion rate increased (P < 0.05), significantly improving the growth performance. When the content of CAP was greater than 4%, it could promote lipolysis without affecting lipogenesis, decreasing the abdominal fat rate. There was no significant difference in MDA between these groups (P = 0.948). The increase of SOD and GSH-Px indicated the enhancement of antioxidant response. Alpha diversity did not significantly differ between groups (P > 0.05). Inclusion of 4% or less CAP led to the increase in beneficial microbiota, the concentration of short-chain fatty acids (SCFAs) such as acetic acid, propionic acid, and butyric acid (P < 0.05), and the concentration of primary bile acids such as cholic acid and goose deoxycholic acid (P < 0.05). While the concentration of secondary bile acids such as taurocholic acid and taurine goose deoxycholic acid was decreased (P < 0.05). These results illustrated that the CAP had a high potential for application in poultry nutrition. In terms of improving growth performance and antioxidant capacity and reducing fat deposition rate, 4% CAP content is recommended.
Introduction
As the most commonly used plant-based protein in the feed industry, SBM is widely used with the advantages of fewer anti-nutritional factors, amino acid balance, and various vitamins in poultry farming (1–3). However, in recent years, because of the high price and the source of SBM mainly on import, the protein feed resources in China have become a disgrace with the rapid development of the poultry industry. This trend suggests that traditional protein can no longer alleviate the pressure of protein shortage these days (4). Therefore, while improving the utilization of existing protein resources, searching for new cost-effective protein resources to gradually reduce and replace the expensive feed resources like SBM has become an important issue in poultry farming and an effective way to alleviate the shortage of feeding protein resources.
Single-cell protein (SCP) is also called microbial or bacterial protein. The concept of SCP was first proposed at MIT in the 20th century, which used to represent microbial protein for food and feed production by a large-scale culture of yeast or bacteria. SCP can be obtained by culturing bacteria, yeasts, molds, algae, and basidiomycetes with various substrates (5–9) and has various benefits such as short culture cycle, high crude protein, and rich vitamins (10, 11). Meanwhile, it can increase palatability efficiency, opening up numerous opportunities for production and use as a viable alternative to animal-based protein sources. Much attention has been paid to the application of SCP in animal feed. In the research about SCP on poultry breeding, several studies have been reported, which focus on chlorella (12), date palm fermentation protein (13), yeast single cell protein (14), and autolyzed saccharomyces cerevisiae (15). All of them positively affect the health of Cobb broilers, but it is necessary to pay attention to the proportion of SCP when using it. Otherwise, serious death of broilers may be caused (16). Due to the particularity of the poultry digestive system (17), the study of SCP for poultry farming is of great importance (18).
Clostridium autoethanogenum protein (CAP) is a new type of bacterial protein. It can be produced industrially with carbon monoxide as a carbon source and under the fermentation of Clostridium autoethanogenum (CA). Because the carbon source can be derived from industrial waste gas, using industrial waste effectively alleviates the environmental problems caused by harmful gas emissions and contributes to achieving carbon neutrality. As one of the main by-products in ethanol fermentation, it is green, low-carbon, energy-saving, and environmentally friendly. The “out of nothing” feed protein is critically important, and CAP's abundance of organic proteins helps realize this transformation of by-products into something of value. In addition, for every 10,000 tons of ethanol produced, about 1,500 tons of bacterial protein could be obtained (19), proving that it has the characteristics of high yield and improving quality and efficiency. CAP has a crude protein level of 83.2%, is rich in trace minerals and vitamins, and lacks anti-nutritional components. The essential amino acid balance is similar to that of fish meal (FM) and higher than that of SBM (19, 20).
Furthermore, CAP is rich in methionine, the first limiting amino acid required by chickens, which can make up for the deficiency of methionine in SBM (21). Taken together, the CAP can be used as a potential protein source for animals. CAP has been widely studied in aquaculture animals. The potential value of CAP in several species has been assessed, including grass carp (19), large-mouth bass (22, 23), Pacific white shrimp (24), Tilapia juveniles (25, 26), and juvenile Jian carp (27). An appropriate proportion of SBM without adverse effects on the growth of the above aquaculture animals could enhance their growth performance.
Despite its potential as a feed protein, CAP has yet to be studied in the context of a broiler diet, and its use in actual production remains limited. With that in mind, this study used a gradient addition experiment in which CAP was substituted for SBM to learn more about how CAP affects the health and growth of Cobb broilers and their biochemistry, hepatic histopathology, lipid metabolism, and gut microbiota.
Materials and methods
Materials
During the feeding period, the experimental broilers were maintained in compliance with the Laboratory Animal Welfare Guidelines of China (Decree No. 2 of the Ministry of Science and Technology, issued in 1988). All experimental procedures were performed in accordance with (the Cobb broiler feeding management manual) and the Regulations for the Administration of Affairs Concerning Experimental Animals. Animal experiments were conducted at the Nankou Base of the Chinese Academy of Agricultural Sciences. CAP used in the experiment is a light yellow powder provided by Beijing Shoulang Biotechnology Co., Ltd. The crude protein content is 84.69%, and the digestibility of pepsin is 90.2%.
Experimental design and diets
At the beginning of the experiment, a total of 960 one-day-old broilers (male of Cobb) with an average initial weight of 41.43nt (male of the Co-treatment group had eight replicates pens with 20 chickens per pen). The experiment lasted for 6 weeks and was divided into two stages, feeding the early feed for 1 to 21 d and the late feed for 22 to 42 d. The ingredients and calculated chemical composition of the basal diet are shown in Supplementary Table S1.
The basic diet was given to the control group (T0), and the experimental groups (T1, T2, T3, T4, and T5) were given 1, 2, 3, 4, and 5% CAP, respectively, to replace 6, 12, 18, 25, and 31% of SBM in the basic beginning diet and 8, 15, 22, 29, and 36% of SBM, respectively. The basal diet met the NRC (28) recommended nutrient requirements for broiler chickens. Six experimental diets were kept to be isonitrogenous and isoenergetic. The amino acid composition of experimental diets is shown in Supplementary Table S1. Pelleted feed was prepared under the conditions of a ring mold aperture of 3.0 mm, and a length diameter ratio of 10:1.
All the chickens were reared in the same experimental room, housed in a room with the same automatic control artificial light (16:8, L/D) and light intensity (20 lx). The relative humidity of the experimental house was maintained at 60%. The room temperature remained at 33 chickens reared in the same experimental room. For the first three days, the temperature in the room stayed at 33°C, and on the fourth day, it was lowered to 25°C. Chickens were vaccinated in accordance with the immunization program. All diets were in granular form. During the experiment, feed and water were fed at will.
Composition analysis
Dietary crude protein, crude lipid, moisture, and ash were determined using AOAC standard methods (2006). Dry matter was analyzed by drying the samples to constant weight at 105°C. Crude protein was determined with a Kjeltec TM 2300 Unit (FOSS, Denmark) using the Kjeldahl method, and crude protein content was estimated by multiplying nitrogen by 6.25. Crude lipid was analyzed using a Soxtec System HT 1047 Hydrolyzing Unit (FOSS, Denmark), followed by Soxhlet extraction using a Soxtec System 1043 (FOSS, Denmark). Ash was analyzed by combustion in a CF 1100 muffle furnace (Carbolite, UK) at 550°C for 6 h. All actual measured values are listed in Supplementary Table S2.
Growth performance and slaughter performance
Two nutritional phases, including the beginning phase (1 to 21 d) and the final phase (22 to 42 d), were designed for this experiment (Supplementary Table S2). At the end of 3 and 6 weeks of age, chickens (after a 12-h fast) were weighed, and feed intake was recorded for each treatment pen for the calculation of average final body weight (FBW), body weight gain (BWG), average daily feed intake (ADFI), and feed-to-gain ratio (F/G). Mortality and culling were recorded daily for each pen. Dead chickens were weighed, and the weights were used to correct the F/G of chickens.
At the 21 and 42 d, blood samples were collected from 48 broilers (one bird per cage and eight birds per treatment) via bleeding from the jugular vein. The broilers to be slaughtered were weighed separately and killed by cervical dislocation. After obtaining the blood sample, it was centrifuged at 3000 g at 4°C for 15 min (Becton Dickinson Vacutainer Systems, Franklin Lakes, NJ). In this way, the plasma is obtained. Then plasma was stored below −20°C. The leg, breast, and abdominal fat were harvested and weighed to calculate the relative organ weights (% of live BW).
Assay of serum metabolites
Triglyceride (TG), total cholesterol (TC), total protein (TP), albumin (ALB), uric acid (UA) activities and the enzymatic activities of Superoxide Dismutase (SOD), Glutathione Peroxidase (GSH-Px), Catalase (CAT) and the Malondialdehyde (MDA) were determined by assay kits (Nanjing jiancheng Co., Nanjing, China). The numbers of the kit are shown in Supplementary Table S3.
RNA isolation, reverse transcription, and mRNA levels analysis
Total RNA was isolated from the liver using RNAiso Plus reagent (Takara, Japan), spectrophotometrically quantified using a NanoDrop 2000 (Thermo, USA), and electrophoresed on a 1% denaturing agarose gel to test the integrity. Refer to the instructions for the specific operation process. The core fragments of all the genes were obtained from the database of RNA-Seq. β-actin (GenBank accession no. NM2055181), a housekeeping gene whose expression was found to be unaffected by the treatment in the present experiment, was used as an endogenous reference to normalize the template amount. The gene-specific primers used for mRNA quantification by RT-qPCR are shown in Table 1. Detection process and setting reference Wei et al. (19).
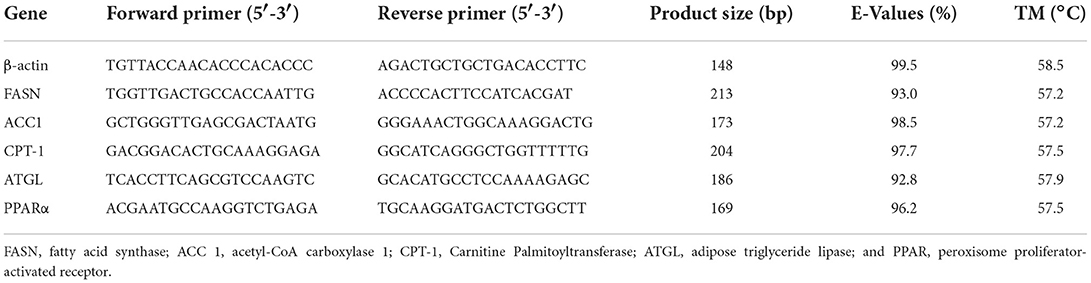
Table 1. Primer sequences for real-time PCR.
Histopathological examination of the liver
First, the liver samples were fixed in 4% paraformaldehyde for 24 h. Subsequently, all liver samples were dehydrated according to standard procedures. Then, the samples were embedded in paraffin. Cut to 6 μm after cooling and demolding section. Finally, the staining of liver sections was carried out according to the hema-toxylinandeosin (H & E) protocol. The stained sections were observed with an optical LAS V4.0 light microscope (Leica DM2500, Leica, Germany). After confirming successful staining, we applied the data.
Composition and association analysis of gut microbiota
Genomic DNA of the valve intestines was extracted using a PowerSoil DNA1 Isolation Kit (MoBio Laboratories, Carlsbad, CA) following the manual. The purity and quality of the genomic DNA were checked on 0.8% agarose gels. The V3-V4 hypervariable region of the seven bacterial 16S rRNA gene was amplified with the primers 338F (ACTCCTACGGGAGGCAGCAG) and 806R (GGACTACHVGGGTWTCTAAT). The PCR products were purified using a QIAquick Gel Extraction Kit (QIAGEN, Germany), quantified using real-time PCR, and performed deep sequencing on a MiSeq platform (San Diego, USA). Quality control of the raw data was performed by FastQC (version 0.19.6). Qualified reads were separated using the sample-specific barcode sequences and denoised with DADA2, then the sequences were clustered into the ASVs at a similarity level of 100%. Based on the silva138/16s_bacteria RNA gene database, 16S rRNA target genes were sequenced, and taxonomy assignments were derived. QIIME2, R packages (version 3.3.1), and python (version 2.7) were mainly used to analyze the raw sequence dataset. All the raw 16S rRNA gene amplicon sequencing data are deposited in the NCBI SRA database under the BioProject accession number PRJNA877374.
SCFAs quantitative analysis
SCFAs in plasma and cecum samples were determined as the description by Feng et al. (29). SCFAs were quantify with UHPLC-QqQ-MS/MS after 5-(dimethylamino)-1-carbohydrazide-isoquinoline (DMAQ) derivatization. Chromatographic separation was achieved on a UPLC BEH C18 column (2.1 × 150 mm, 1.7 μm particle size, pore size: 130 Å). A binary gradient was used with mobile phase A of deionized water and mobile phase B of ACN. Both mobile phases contained 1% formic acid. MS acquisition was performed in the positive ESI mode.
Bile acids quantitative analysis
Plasma and bile samples were prepared in accordance with a previous report (30). The eluted substances of ultra-performance liquid chromatography systems coupled with a triple-quadrupole mass spectrometer (UHPLC-QqQ-MS/MS) were ionized in an electrospray ionization source, the negative mode (ESI-). Chromatographic separation was operated on a UPLC BEH C18 column (100 × 2.1 mm, 1.7 μm). The mobile phase consisted of water in 0.1% formic acid (A) and acetonitrile in 0.1% formic acid (B). The gradient elution was applied, and MS detection was conducted in the negative mode. Standards for all BAs were used to identify the different BA metabolites detected by UHPLC-MS/MS. The Agilent Mass Hunter software (version B.08.00) was used to control instruments and acquire data. The raw data were processed by Agilent Mass Hunter Workstation Software (version B.08.00) using the default parameters and assisting manual inspection in ensuring each compound's qualitative and quantitative accuracies. The peak areas of target compounds were integrated and output for quantitative calculations.
Statistical analyses
The normal distribution of all data was tested before statistical Analysis. The mean and significant differences between groups were performed using the social science statistical software package (SPSS, version 20.0). We used a one-way analysis of variance (one-way ANOVA) and a non-parametric test (Kruskal–Wallis test) for comparing the data. P < 0.05 were considered to be statistically significant, and data were reported as mean value Kruskal–Wallis test) for comparison, tel (version 2010) was used for all graphics except those in the microbiological section, where R (version 3.3.1) was used.
Results
Growth performance and slaughter performance
Table 2 describes the effects of adding CAP on growth performance for the broiler. In the beginning, there were significant differences in the average daily feed intake (ADFI) and F/G (P 0.05) between the CAP addition groups, and throughout all the periods, the F/G was also considerably decreased (P 0.05). Compared with the control group, the supplementation of CAP had increased the body weight gain (BWG) in the beginning phase and overall phase of broilers. The T2 group increased significantly (P < 0.05). Other performance indicators had no significant differences (P > 0.05).
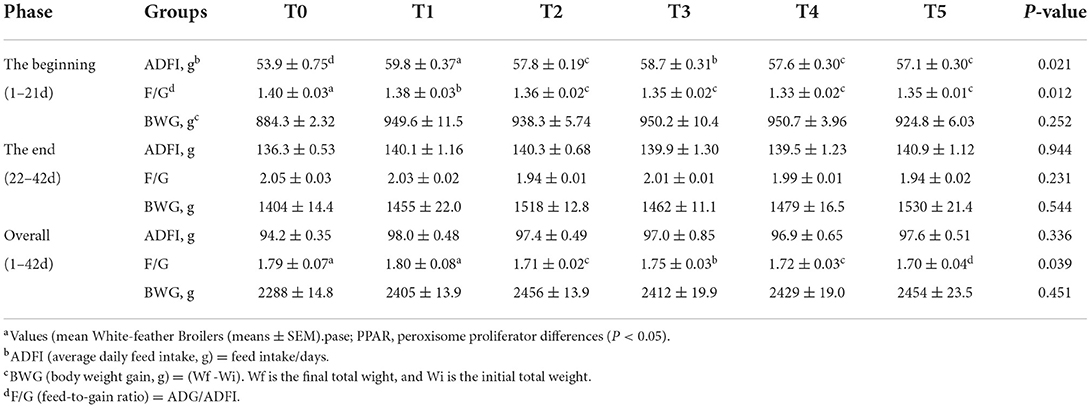
Table 2. Effects of adding CAP level on growth performance of White-feather Broilers (means ± SEM).
The slaughtered performances are presented in Table 3. Dressing percentage showed no significant differences among groups (P = 0.701), while eviscerated yields of treatments were increased compared with in T4 and T0 (P = 0.042), and the treatment groups increased compared with the control group. There is no significant change in breast muscle yield (P = 0.424) and thigh muscle yield (P = 0.320). Although the abdominal fat yield of all treatments was reduced, T4 was significantly lower than T0 and T1 (P < 0.001).
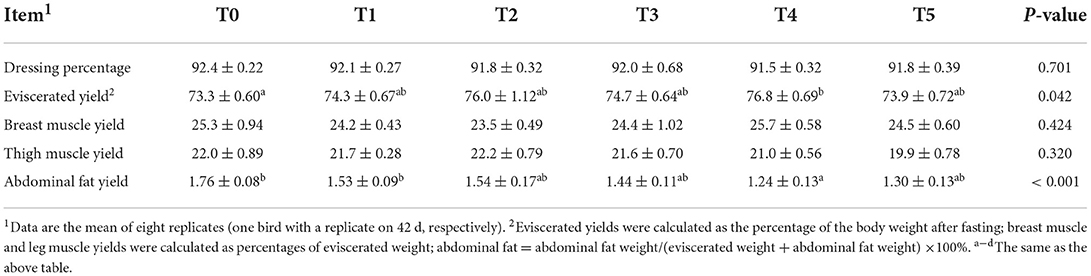
Table 3. Effects of adding CAP level (%) on slaughtered performances of 1–42d White-feather Broilers (means ± SEM).
Serum metabolites
The effects of adding CAP difference level on serum metabolism parameters were presented in Table 4. At the beginning (1–21d), the plasma TG, TC, and UA were no different between all groups. CAP-supplemented diets do not significantly increase ALB (P = 0.148) and TP (P = 0.103). At the end (22–42d), CAP-supplemented diets decreased TP (P = 0.048) and UA (P = 0.019) significantly. Besides, CAP-supplemented diets significantly decrease TG (P = 0.048). The plasma TC and ALB were no different among the groups. UA in treatment groups increased compared to the control group, and T3 was significantly higher than in the T0 group. The effects of adding CAP difference level on antioxidant parameters were presented in Table 5. At the beginning (1–21d), the activity of glutathione peroxidase (GSH-Px) in the treatment groups was significantly higher than that in the control group (P = 0.03), especially T3 and T4. The activity of superoxide dismutase (SOD) in all treatment groups was higher than that in the control group, and T2 and T3 were significant (P < 0.001). Malondialdehyde (MDA) addition group was significantly higher than the control group (P = 0.023), the highest in T2. Treatment groups decreased GSH-Px/MDA (P < 0.001) and SOD/MDA (P < 0.001) significantly. At the end (22–42d), the level of GSH-Px in T2 and T5 was significantly lower than in the other groups (P = 0.001). The activity of SOD in all the treatment groups was higher than in the control group, especially T1 (P = 0.024). There was no significant difference in MDA between groups (P = 0.948). GSH/MDA was significantly declining in all phases. SOD/MDA significantly declined in the beginning phase and increased dramatically in the final phase.
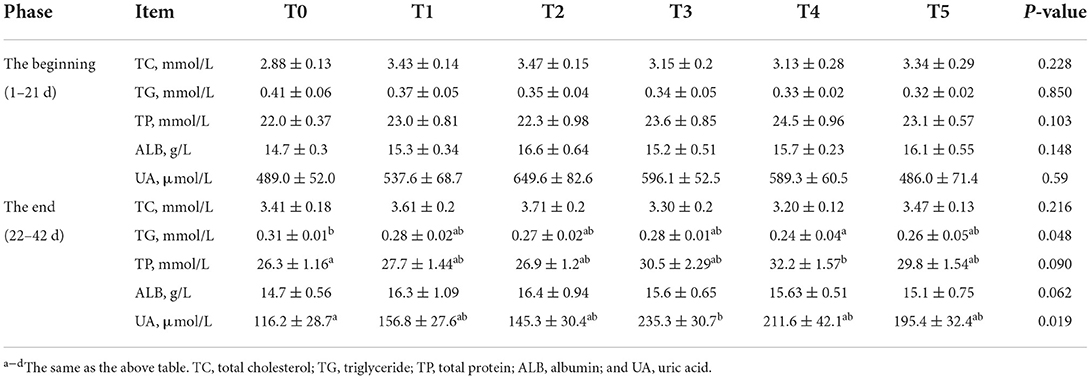
Table 4. Effects of adding CAP difference level on serum metabolism parameters of white-feather broilers (means ± SEM).
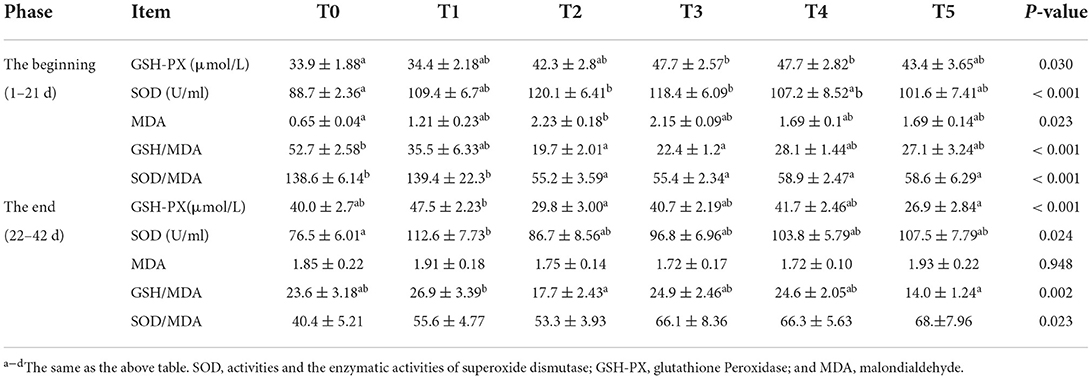
Table 5. Effects of adding CAP difference level on antioxidant parameters of white-feather broilers (means ± SEM).
Expression of lipid metabolism genes
The mRNA levels of lipid metabolism-related genes in liver tissues at the beginning were shown in Figure 1. Broiler feed CAP improved lipolysis genes (ATGL, PPARα, CPT1) and gene mRNA levels in T1, T4, T5 groups (P < 0.05). There was no significantly different in lipogenesis (ACC1, FASN) mRNA level (P > 0.05). In the end, The mRNA levels of lipid metabolism-related genes in liver tissues were shown in Figure 2, Upregulated lipogenic genes (ACC1, FASN) of T2 were significantly increased (P < 0.05). ATGL and PPAR of T2, T4, and T5 were increased (genes in T4 and T5 were significantly higher than T0 (P < 0.05).
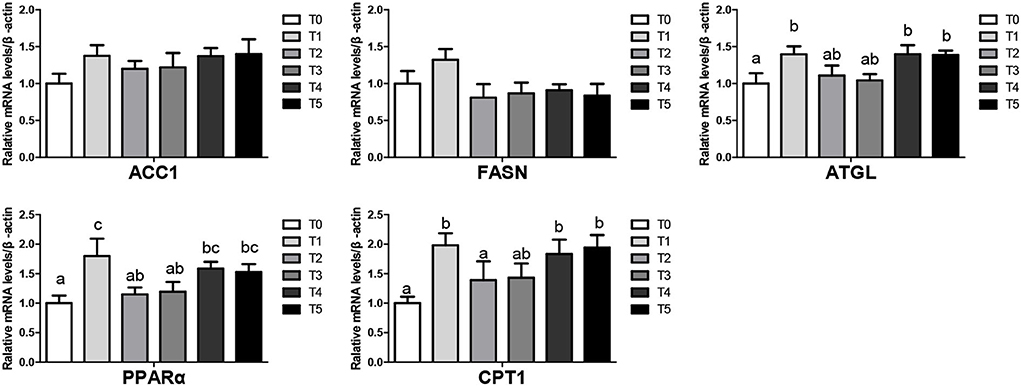
Figure 1. Lipid metabolism in the liver of broiler when CAP partially replaced dietary SBM at the beginning (values having different letters are significantly different, P < 0.05, mean s (means ± SEM). Calculated as thhase; ACC 1, acetyl-CoA carboxylase 1; CPT-1, Carnitine palmitoyltransferase; ATGL, adipose triglyceride lipase; PPAR, peroxisome proliferator-activated receptor.
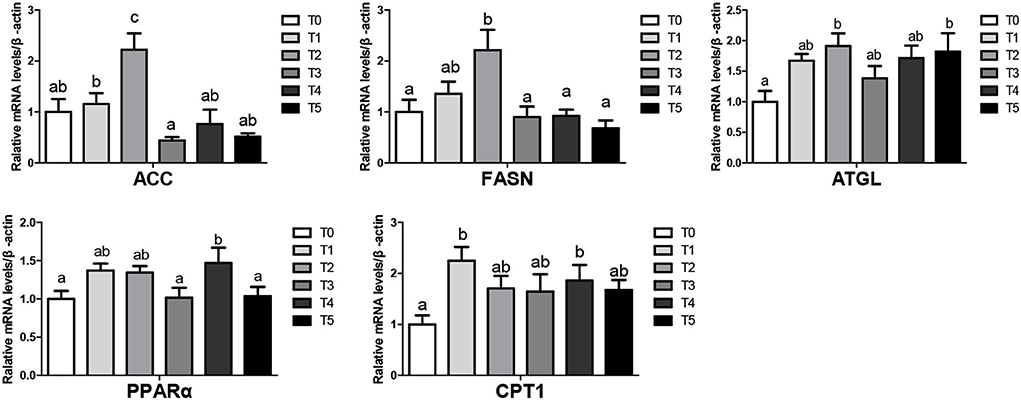
Figure 2. Lipid metabolism in the liver of broiler when CAP partially replaced dietary SBM at the end (values having different letters are significantly different, P < 0.05, mean activated receptor). Receptor. Ed assynthase; ACC 1, acetyl-CoA carboxylase 1; CPT-1, Carnitine palmitoyltransferase; ATGL, adipose triglyceride lipase; PPAR, peroxisome proliferator-activated receptor.
Hepatic histological examination
Broiler liver sections were examined after H&E staining for collagen, and eight samples were observed in each group. In Figure 3A, three typical phenotypes are observed on the hepatic samples of the broiler. Phenotype I showed normal hepatocytes with well-shaped cells and evenly distributed cytoplasm. Phenotype II defined the structure of the hepatic lobule was unclear. Part of the hepatic cord structure disappeared, the arrangement of liver cells was disordered, the liver became narrow, and there were many lipid-like vacuoles in liver cells. Phenotype III defines inflammation as a large number of inflammatory cell infiltration in the liver tissue, hepatocyte degeneration, necrosis, and widespread necrosis. The hepatic histopathological examination results of each group are shown in Figure 3B. All treatment groups showed more liver damage than the T0 group. At the beginning in the T0 group, there were no phenotypes II and III and eight with normal (phenotype I). All dietary CAP inclusion groups showed no serious damage to hepatic health. In the T1 group, only two samples were typically inflamed (phenotype III), there was no phenotype II, and six samples were considered normal (phenotype I). In the T2 group, only one sample was observed as being inflamed (phenotype III), there were no phenotype II samples, and seven samples showed no obvious abnormity (phenotype I). All samples showed a normal morphological structure in the T3, T4, and T5 groups.
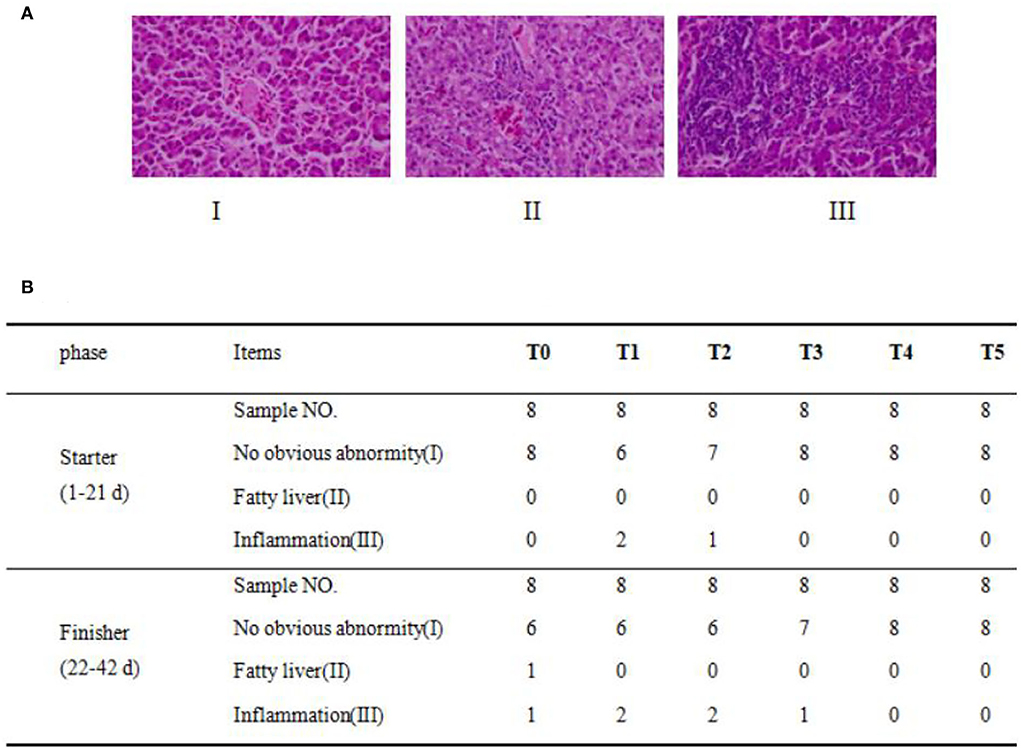
Figure 3. Dietary CAP induced liver histological lesions and increased inflammation. (A) Histopathological analysis of broiler. Three phenotypes of hepatic histopathological examination with symptoms from light to heavy by HandE staining (n = 8) under a magnification of 400×, in which there were (I): no obvious abnormity, (II): fatty liver or steatohepatitis, (III): inflammatory cell infiltration, and (B) Phenotypes statistical results (n = 8).
In the end, in the T0 group, there was only one sample with inflammation (phenotype III), one with phenotype II, and six with normal phenotypes (phenotype I). Six samples showed normal morphological structure in the T1 and T2 groups, and two exhibited inflammation. In the T3 group, only one sample was observed as inflammation (phenotype III), and seven with no obvious abnormity (phenotype I). In T4 and T5 groups, all samples showed a normal morphological structure. In general, dietary CAP inclusion will not cause the occurrence of inflammation.
Composition and association analysis of gut microbiota
The taxonomic composition in Figure 4 was analyzed at the level of phylum, genus, and species. At the phylum level, the major taxa in all groups were Bacteroidota, Firmicutes, and Campilobacterota, and the proportion of the first two types of microbiota exceeded 35%. Compared to the T0 group, Bacteroidota in treatment groups decreased, while Firmicutes increased. At the genus level, the top ten microbiota of dominant groups were Bacteroides, Faecalibacterium, o__Clostridia_UCG-014, Alistipes, o__Clostridia_vadinBB60_group, f__Lachnospiraceae, f__Rikenellaceae, f__Oscillospiraceae, UCG-005 and Barnesiella. The proportion of Bacteroides showed a decrease compared to control treatments, while the proportion of o__Clostridia_UCG-014, o__Clostridia_vadinBB60_group, and f__Rikenellaceae showed overall induction. Except for the predominant microbiota above, the proportion of Enterococcus increased significantly in the T4 group (P < 0.05). At the species level, the top ten microbiota of dominant groups were g__Bacteroides, g__Faecalibacterium, Bacteroides_sp._Marseille-P3166, o__Clostridia_UCG-014, f__Lachnospiraceae, g__Alistipes, Rikenella_sp._Marseille-P3215, f__Oscillospiraceae, o__Clostridia_vadinBB60_group, and Bacteroides_plebeius. The proportion of Bacteroides_sp._Marseille-P3166 showed decreased trends compared to control treatments, while the proportion of g__Bacteroides, g__Faecalibacterium, g__Alistipes, Rikenella_sp._Marseille-P3215 and Bacteroides_plebeius showed an overall induction.
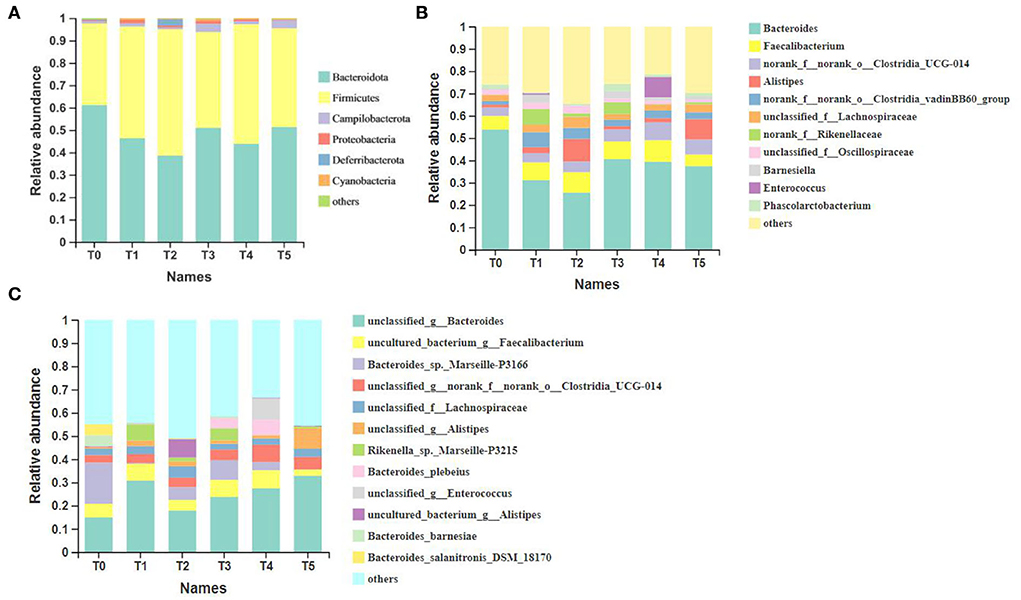
Figure 4. All taxa at three different levels and the top more than ten most abundant taxa of all samples (n = 6). (A) Phylum; (B) genus; (C) species. o__: order; f__: family; g__: genus. T0: fed diets based on SBM as the only protein source; T1, T2, T3, T4, T5: 1, 2, 3, 4, and 5% of CAP were added.
In total 1990 ASVs, 1,123 ASVs were identified as core ASVs according to their prevalence in each sample. In Figure 5, a total of 285 ASVs were universally present in all 36 samples, of which 91% were classified as Firmicutes, 7% were classified as Bacteroidota, and after classifying the above ASVs at the species level, the top five microbiota were o__Clostridia_UCG-014, f__Lachnospiraceae, f__Oscillospiraceae, g__Bacteroides and o__Clostridia_vadinBB60_group. Besides the T2 group, the other groups were lower than the number of unique ASVs in the T0 group.
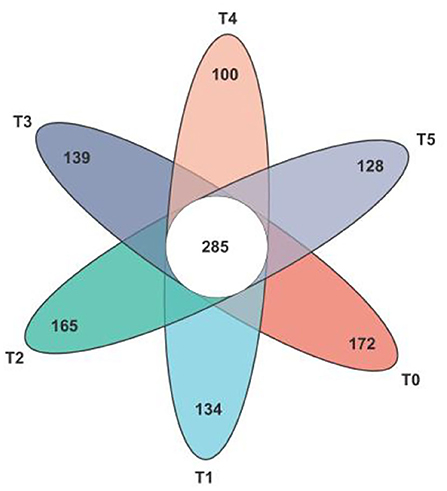
Figure 5. Venn diagram of the gut microbiota composition in Cobb broilers shows the number of shared and unique core ASVs among the six study groups. T0: fed diets based on SBM as the only protein source; T1, T2, T3, T4, T5: 1, 2, 3, 4, and 5% of CAP were added.
In Figure 6, the alpha-diversity indices relating to community richness, including sobs and Chao, presented the tendency to increase first and then decrease. No significant differences between the above two indexes were found between control and treatment groups (P > 0.05), although the index value in treatment groups was higher than in control groups. For Shannon and Simpson, which relates to community diversity, the dispersion degrees were relatively increased, but with no significant difference in index values (P > 0.05).
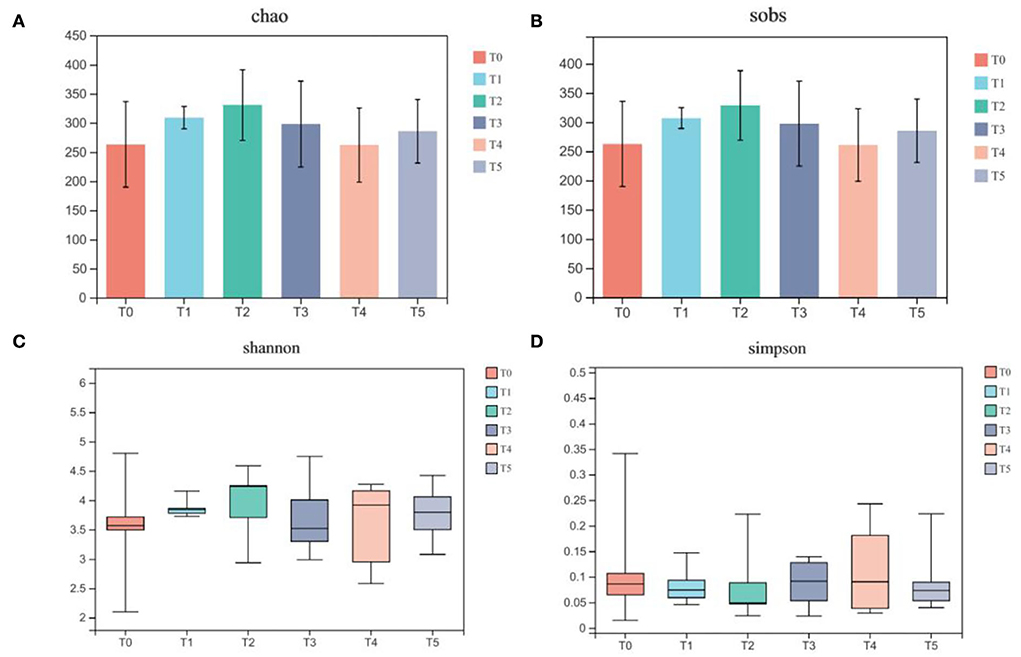
Figure 6. Dietary supplementation of CAP affects the alpha diversity of gut microbiota in Cobb broilers (n = 6). (A) Chao; (B) sobs; (C) Shannon; (D) Simpson. Multiple comparisons were determined by one-way analysis of varlance (one-way ANOVA), followed by Tukey-Kramer as a post hoc test. T0: fed diets based on SBM as the only protein source; T1, T2, T3, T4, T5: 1, 2, 3, 4, and 5% of CAP were added.
Cobb broilers' intestinal SCFAs, plasma SCFAs, and digesta bile acids are displayed in Tables 6–8, which contain the related microbiome metadata. P 0.05 denoted a statistically significant difference determined using Duncan's multiple range test. In the intestine, the content of acetic acid and propionic acid was significantly increased by CAP addition (P < 0.05). At the same time, with the increase of the additional quantities, the content of butyric acid, valeric acid, isobutyric acid, and isovaleric acid was higher in the treatment groups than in the control group. Additionally, in plasma, the addition of CAP caused a significant increase in the content of acetic acid, propionic acid, butyric acid, and isobutyric acid (P < 0.05). Regarding bile acids, the findings show that CAP addition led to a statistically significant increase in primary bile acids such as cholic acid (CA) and chenodeoxycholic acid (CDCA), but for secondary bile acids like taurocholic acid (TCA) and taurochenodeoxycholic acid (TCDCA), it behaved a general trend of first increase and then decreased.
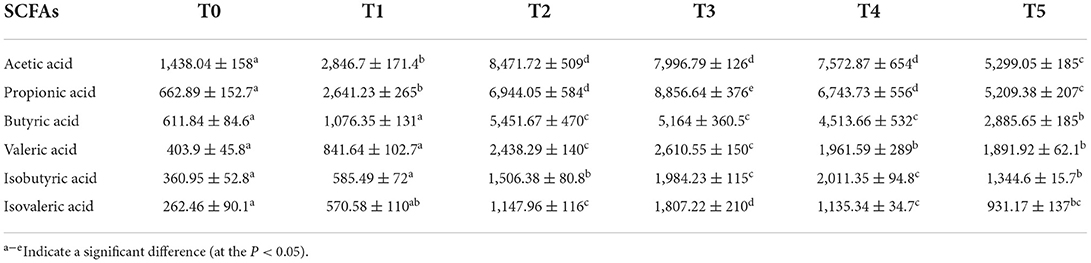
Table 6. Effects of adding CAP level (μg/L) on SCFAs in the intestine of white-feather broilers (means ± SEM).
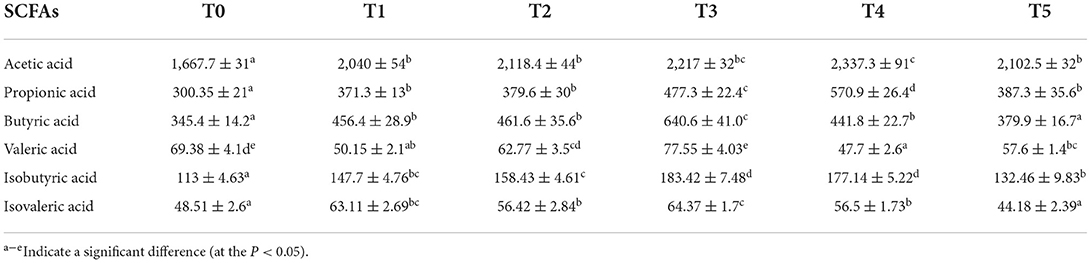
Table 7. Effects of adding CAP level (μg/L) on SCFAs in the plasma of white-feather broilers (means ± SEM).
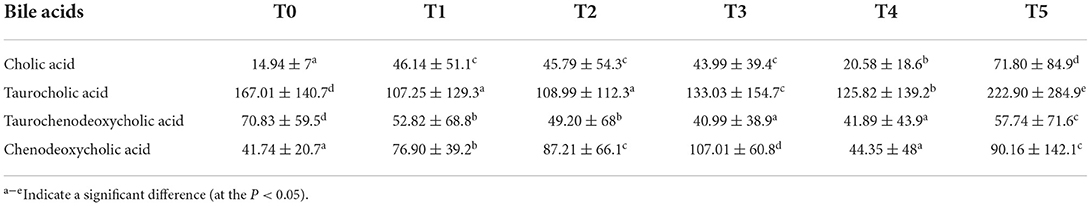
Table 8. Effects of adding CAP level (ng/mg) on bile acids in the digesta of white-feather broilers (means ± SEM).
The multivariate association analysis in Figures 7, 8 was conducted on the genus and species levels. According to the metadata source, we analyzed the top 25 microbiota in terms of total abundance at various taxonomic levels. The multivariate association analysis of intestinal SCFAs in Cobb broilers at genus and species levels showed that eight microbiota, including Helicobacter_pullorum, o__Clostridia_UCG-014, f__Lachnospiraceae and o_RF39, were positively correlated with all the six short-chain acids (P < 0.05). Bacteroides and Bacteroides_salanitronis_DSM_18170 were negatively correlated with the other five short-chain acids, with the exception of isobutyric acid (P < 0.05). Meanwhile, the Analysis of plasma SCFAs in Cobb broilers at the above two levels showed that 12 microbiota, including Rikenella_sp._Marseille-P3215, g__Phascolarctobacterium, Bacteroides_barnesiae, Bacteroides_clarus, o__Clostridia_UCG-014, and f__Ruminococcaceae, were positively correlated with all the six short-chain acids (P < 0.05), and g__Alistipe was negatively correlated with isovaleric acid (P < 0.05). Finally, the analysis of digesta bile acids in Cobb broilers also at the above two levels showed that eight microbiota, including g__Alistipes, Bacteroides_massiliensis, and f__Ruminococcaceae, were positively correlated with all the four bile acids (P < 0.05). Furthermore, it can also be determined that four microbiota, including Blautia, Ruminococcus, o__Clostridia_UCG-014, and g__Alistipes, were significantly correlated with both some SCFAs in plasma and some bile acids in digesta (P < 0.05).
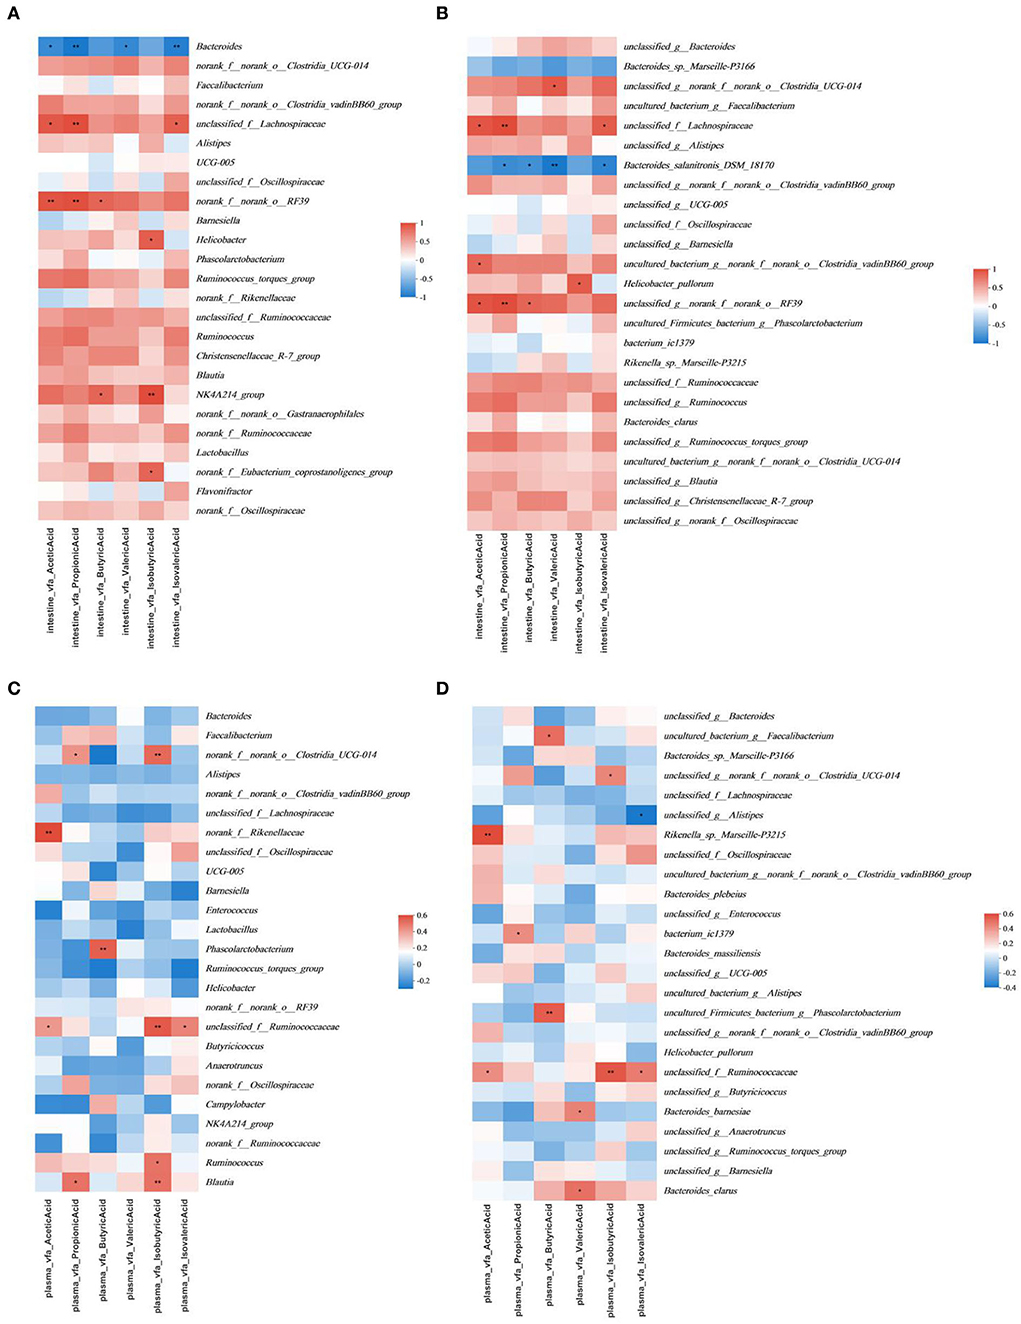
Figure 7. Significant associations between intestinal and plasma microbial and sample metadata of intestinal SCFAs (n = 6). (A) Intestinal in the genus; (B) intestinal in species; (C) plasma in the genus; (D) plasma in species. Cells that denote associations are colored (red or blue) and overlaid with asterisks which show statistically significant differences (*, P < 0.05; **, P < 0.01; ***, P < 0.001). o__: order; f__: family; g__: genus. T0: fed diets based on SBM as the only protein source; T1, T2, T3, T4, T5: 1, 2, 3, 4, and 5% of CAP were added.
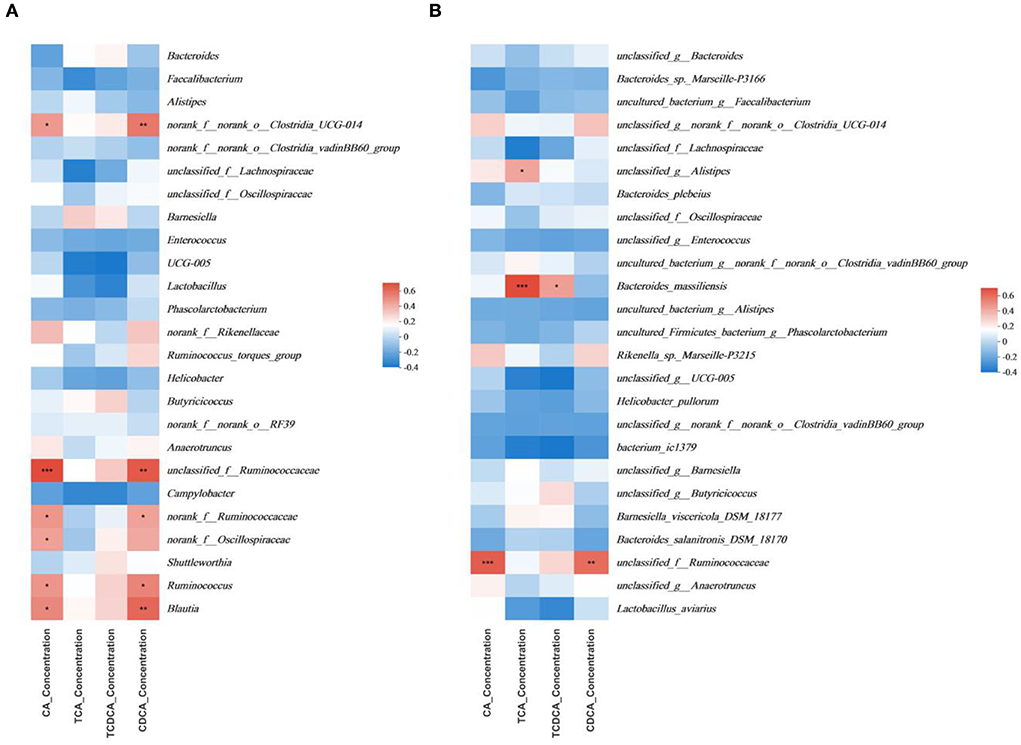
Figure 8. Significant associations between intestinal microbial and sample metadata of digesta bile acids (n = 6). (A) genus; (B) species. Cells that denote associations are colored (red or blue) and overlaid with asterisks which show statistically significant differences (*, P < 0.05; **, P < 0.01; ***, P < 0.001). o__: order; f__: family; g__: genus. T0: fed diets based on SBM as the only protein source; T1, T2, T3, T4, T5: 1, 2, 3, 4, and 5% of CAP were added.
Discussion
Growth performance effect
Several functions of CAP have been demonstrated, such as promoting growth performance and improving immune ability in carp and Tilapia mossambica (31). Some researchers found that CAP has no apparent negative impact on growth performance in a particular proportion. With the increase of CAP, WG and SGR initially increased and then decreased, and the peak value appeared in the CAP 14.55% diet (22). Using 5% CAP to replace 27.6% SBM was helpful to the growth performance of Grass Carp, according to the results of a trial conducted by other researchers (19). Some researchers have explored using CAP as an effective protein source for fish, but there is little research on poultry. In the poultry industry, it takes at least 42 days for a broiler to reach market size. Compared to the control group, which was fed only SBM, feeding 2.5 or 5% SCP resulted in greater body weight growth over various phases and cumulatively (32). Additionally, our study showed improvements in ADFI in the beginning phase when CAP was included in Cobb broiler diets. Therefore, for BWG, there were significantly increased values in the T2 group, consistent with the above literature findings, showing the improvements in production performance when CAP was included in Cobb broiler diets.
Moreover, the effects of F/G quality could significantly reflect the broiler's growth. As some researchers have explored, the feed conversion efficiency is greatly influenced by feed digestibility (33, 34). In our present study, CAP effectively reduced F/G at the beginning and overall phases, and when adding 4% CAP, the feed conversion efficiency was highest, which meant broilers had better feed conversion. Other research results have also confirmed these points.
Protein metabolism and fat deposition effect
TP and ALB can reflect the body's nutritional status and protein metabolism. Additionally, the content increases with the increase in nutrient absorption (35–37). UA is an indicator of amino acid utilization and nitrogen-containing waste after protein decomposition (38–40). In the present study, we found that adding CAP to the diet could effectively improve the content of TP in broiler plasma at the last phase. Thus, this change indicated that feeding with CAP could increase protein absorption while improving growth performance (41). The blood UA level changed with the increasing CAP addition during the whole experiment. The broiler absorbed CAP more easily than the soybean, but more nitrogen content was excreted from the body. CAP could increase BW and decrease fat deposition in broiler chickens. In some articles, reducing abdominal fat or fat deposition is accompanied by improved growth performance or a better material-weight ratio (41, 42). There is no clear conclusion, but combined with experience, CAP can reduce abdominal fat deposition and improve feed conversion efficiency.
Lipid metabolism genes effect
Adipose tissue formation is a complex process affected by many alterations in the expression of lipogenesis and lipolysis genes. ACC1 catalysis acetyl-CoA to malonyl-CoA is the first step for fatty acid synthesis and limits fatty acid biosynthesis (43). FASN is the key enzyme for the de novo synthesis of fat (44). The synthesis and decomposition of fat are carried out simultaneously. Inhibiting lipogenesis and de novo lipolysis can reduce fat storage by regulating the expression of lipogenic genes (45, 46). Our research showed no significant changes in ACC1 and FASN at the beginning or the end, except for T2. So, the lipid synthesis genes of broilers treated with CAP remained stable.
ATGL is the most important lipase for initiating triglyceride hydrolysis and does not require hormone activation (47). PPARα participates in the transcriptional regulation of lipid metabolism and liver fatty acid oxidation to reduce fatty acid synthesis (48, 49). ATGL can promote fatty acid oxidation by increasing the activity of PPARl (50, 51). CPT-1 is the key gene that controls mitochondrial and beta-oxidation of fatty acids (52, 53), which can increase the rate of lipolysis and activity of lipolytic enzymes (54). Our results showed a noticeable increase in ATGL, PPAR, and CPT-1. It could reduce the levels of TG (55, 56). TG is the main form of nutrients in the blood after digestion and absorption by the body, which can continuously accumulate to form fat. Comprehensive results: in treatment groups, the content of TG was reduced by upregulated lipolysis gene's expression level, leading to fat deposition reduction.
Antioxidant capacity effect
Lipid metabolism is known to relate to oxidation reaction (57) and oxidation reaction reduction of fat (58, 59). A deficiency of ATGL and lipolytic genes may cause oxidative stress and inflammation and even affect organ health (60). CPT1 can protect hepatic mitochondria function and attenuate oxidative stress by activating the Nrf2 pathway (61, 62). Antioxidant capacity affects poultry health, which is reflected in SOD, GSH-Px, and MDA. SOD can reflect the ability to scavenge free radicals and promote the synthesis of immune-related proteins (63). Free radicals produce oxygen molecules and hydrogen peroxide under the action of SOD. CAT catalyzes the decomposition of hydrogen peroxide, thus reducing lipid superoxide damage and scavenging free radicals (64).
MDA is the final product of lipid peroxidation and can be used to measure oxidative damage (65). In the present study, SOD and MDA increased with the addition of CAP in the beginning phase. The change of SOD/MDA resulted from the common change of SOD and MDA. Both values increased, but the decrease of the SOD/MDA indicates that MDA increases more. Thus, we speculated that MDA played a leading role in both changes. It may be that adding CAP to increase the content of MDA will increase the activity of GSH-Px and SOD within the adjustment range or other reasons, which require follow-up research. In the last phase, with the addition of CAP, SOD increased, increasing SOD/MDA, while MDA returned to normal in all groups. This may be because CAP can improve antioxidant enzyme activity, effectively remove excessive free radicals, and prevent lipid peroxidation-related damage. In a similar paper (66), the antioxidant index of T-AOC was caused by increased breeder dietary vitamin E, thereby reducing the MDA level. In the article on CAP, the addition and use of CAP improve the antioxidant capacity of fish. Thus, CAP generally improves the antioxidant capacity of broilers. It may come into force at the last stages. It may be due to individual differences. In this study, the phenotype of animals did not change linearly in the same proportion as the additive proportion. But all of the changes were toward positive phenotypes.
Liver histology effect
The liver is the main organ of metabolism and protein synthesis (67). In addition to the T4 group, the amount of liver inflammation increased slightly by adding CAP to the diet. This may be due to excessive pressure on metabolism or detoxification (68). Because of intestinal health or changes in gut microbiota and liver inflammation (69). Because this is the first study of CAP in the field of broilers, the conclusions on the use of CAP in broilers need to be updated according to the follow-up research. Further research can focus on intestinal microbial composition, intestinal reabsorption, and blood composition.
Core microbiota effect
Chickense is the first study of CAP in the field of broilers. The conclusions on using CAP in broilers need to be updated according to the follow-up research. The gut microbiota is in a symbiotic relationship with its hosts and stays in a stable state for a long time. When the abundance and diversity of microbiota in the gut are at high levels, its own microbiota has a strong competitive power while reducing the overgrowth of foreign microbiota and enhancing immunity. Among the alpha-diversity indices, the Chao and sobs indexes are used to evaluate the abundance of a microbial community, and their values mainly reflect the number of species in the environment. The Shannon and Simpson indexes are mainly used to measure the diversity and uniformity of the microbial community. In the present study, we found that the treatment groups' Chao, sobs, and Shannon indices all have a little increase, and the fluctuation of the Shannon indices also increases. Thus, this change indicated that the addition of CAP could not only increase the number of gut microbiota but also improve the richness and evenness of the gut microbiota to a certain extent.
Many studies have shown that the Firmicutes and the Bacteroidetes are the dominant microbiota in the mammalian gut, accounting for more than 90% of the population (70). Firmicutes/Bacteroidetes show a positive association with body weight in a certain range (70). Other studies have proved that when the Firmicutes/Bacteroidete ratio is high, it will have a strong fermentation ability and can produce more SCFAs for better nutrient absorption (71). In the present study, of the ASVs prevalent in all samples, 91% were classified as Firmicutes, and 7% were classified as Bacteroidetes, which were higher than other microbiota, indicating that Firmicutes and Bacteroidetes were the dominant microbiota in the intestinal tract of Cobb broilers. Meanwhile, in the taxonomical composition analysis at the phylum level, the addition of CAP decreased the abundance of Bacteroidetes. It increased the abundance of Firmicutes in broiler cecum microorganisms compared with the control group. As can be seen, adding CAP can increase Firmicutes/Bacteroidetes and improve the growth performance of Cobb broilers to some extent.
Significant interactions SCFAs and gut microbiota
SCFAs are metabolites produced from fiber fermentation by intestinal microbiota (72). SCFAs contribute to the absorption and utilization of nutrients, and they can be used as energy substrates and positively influence growth. They also affect digestion and absorption of nutrients by altering intestinal pH and further affect the body's metabolic activity. SCFAs include acetic acid, propionic acid, butyric acid, valeric acid, isobutyric acid, isovaleric acid, and so on. Among them, Bacteroidetes mainly produce acetic and propionic acids, while butyrate is mainly produced by Firmicutes (73). Family Ruminococcaceae, species Bacteroides uniformis and Bacteroides ovatus are all degraders of plant polysaccharides such as cellulose and hemicellulose, which may lead to the production of SCFAs (74). In the intestinal epithelial cells specific aryl hydrocarbon receptor deficiency (AhrDeltaIEC) mice, not only was the overgrowth of H. hepaticus and H. ganmani detected in the gut, but it was also found that among the altered metabolites, the amount of isobutyric acid in the cecal of AhrDeltaIEC mice was increased compared to the control group (75). Phascolarctobacterium has been identified as butyric acid-producing gut microbiota in humans (76). In animal experiments, the increase in the relative abundance of SCFAs, including acetic acid, propionic acid, and butyric acid, was detected in the intestines of piglets treated with Gegen Qinlian decoction (GQD) for infectious diarrhea. The same increase was detected in the relative abundance of microbiota, including Phascolarctobacterium (77). Moreover, as microbiota isolated from the broiler intestine, there is substantial variation between Bacteroides_barnesiae and Bacteroides_clarus in the adaptability to broilers (78, 79).
In the present study, we found that in the multivariate association analysis on the intestine, the decreasing trend of Bacteroides was consistent with the increasing trend of SCFAs in treatment groups of the cecum. At the species level, Bacteroides_sp._Marseille-P3166 and Bacteroides_salanitronis_DSM_18170 were negatively correlated with all SCFAs. They negatively correlated significantly with propionic acid, butyric acid, valeric acid, and isovaleric acid. That is to say, the tendency of microbiota was consistent with the change of the four SCFAs above. Combined with the p-values, it can be inferred that the above two Bacteroides are the main factors affecting the correlation between Bacteroides and six SCFAs above in the gut of cobb broilers, and Bacteroides_salanitronis_DSM_18170 had a much stronger correlation with the contents of above four SCFAs compared to Bacteroides_sp._Marseille-P3166. The proportion of Helicobacter_pullorum and the mean content of isobutyric acid increased in the T3 and T5 test groups, and the proportion of Helicobacter_pullorum changed in the same trend as Helicobacter. Therefore, it can be assumed that Helicobacter_pullorum is the main factor affecting the correlation between Helicobacter and isobutyric acid.
Other correlations exist in the multivariate association analysis based on plasma SCFAs. The increasing trend of Phascolarctobacterium was consistent with that of butyric acid in the treatment group. At the species level, the trend for proportions of g_Phascolarctobacterium was consistent with Phascolarctobacterium, so it can be assumed that the proportion of g_Phascolarctobacterium was the main factor affecting the correlation between Phascolarctobacterium and butyric acid, and could account for the decrease of butyric acid content in the T4 and T5 treatment groups which similar to that in T0 control group. The proportion of Bacteroides_barnesiae continued to decrease in the treatment group, and the proportion of Bacteroides_clarus showed an increase in the T3 treatment groups, while the average content of valeric acid in the plasma of treatment groups was lower than that of the control group, and there was a peak value in the T3 treatment group. Combined with the p-value, it could be inferred that the content of valeric acid in the plasma of Cobb broilers was indeed affected by the Bacteroides_barnesiae and Bacteroides_clarus. In addition, Bacteroides_sp._Marseille-P3166 and Rikenella_sp._Marseille-P3215 had opposite correlations with acetic acid, the former was positively correlated with the content of acetic acid in plasma, and the latter was negatively correlated with it in the cecum. Given the existence of the same sp. classification level, these microbiotas could be further studied. All results in this study were consistent with the above literature findings.
Significant interactions between bile acids and gut microbiota
Bile acids, the sterol of cholesterol metabolism in animals, are the main constituents of bile. They are synthesized in the liver, secreted into bile, and then excreted into the duodenum. They can undergo bacterial biotransformations in the gut and reabsorb into the blood. They are shown to be the main natural forcing factors and play a role in hepatic fat metabolism in the liver. Bile acids in the gut have been associated with bacterial overgrowth, while gut microbiota metabolizes bile acids to regulate the hosted metabolism (80). Bile acids are categorized into primary and secondary bile acids, hepatocytes synthesize the former, and the latter is converted primary bile acids into secondary bile acids by gut microbiota in the distal gut. Thus secondary bile acids are more susceptible to the gut microbiota (81). Research results indicated that when clostridia were associated only with GF (germ-free) mice, free-form bile acids accounted for less than 40% of total bile acids, and the percentage of secondary bile acids was similar to that of the other groups (82). The blue light treatment significantly increased the beta diversity of gut microbiota and the relative abundances of bacteria-producing bile acid hydrolase, especially Alistipes. These changes promoted the synthesis of secondary bile acids (83). In experiments about human feces, one of the secondary bile acid-producing bacteria was identified as Bacteroides Intestinalis AM-1, which could convert CA and deoxycholic acid (TCDA) into 7-oxo-DCA, 7-oxo-cholic acid, and other secondary bile acids (84).
There is a negative correlation between Ruminococcaceae_NK4A214_group and bile acid content, which leads to vitamin A deficiency in the intestinal tract (85). In the present study, we found that in the multivariate association analysis on digesta, o__Clostridia_UCG-014 was not highly correlated with TCA and TCDCA and had no influence on the content of secondary bile acids. However, it showed significant positive correlations with primary bile acids such as CDCA and CA, so the correlation remains to be further studied. Also, g__Alistipes and Bacteroides_massiliensis both had significant positive correlations with TCA, the correlation of the latter is lower compared to the former, and the changing trend of TCA content was consistent with that of the above two microbiota. Therefore, we have come to the preliminary conclusion that both g__Alistipes and Bacteroides_massiliensis could determine the average content of TCA. Furthermore, the changes in the consent of CA and CDCA were consistent with the changes in the proportion of f __Ruminococcaceae, so the correlations with primary bile acids need further consideration. These above findings were consistent with the above literature findings.
Conclusion
In conclusion, CAP can reduce the feed-to-gain ratio, promote protein metabolism markers and feed conversion rate, decrease abdominal fat yield, and effectively improve the antioxidant capacity in the final period. Meanwhile, CAP can increase the content of SCFAs and primary bile acids in the intestine and plasma, increase the Firmicutes/Bacteroides value, upregulate the abundance of beneficial bacteria, and elucidate the microbial mechanism of CAP on improving growth performance in Cobb broilers. So CAP has potential in Cobb broiler feed. It is recommended to add 4% CAP for promoting growth and maintaining the intestinal health of Cobb broilers. Subsequently, more experiments are still needed to verify the existing results and explore the deeper mechanism to ensure that the use and dosage of CAP in the future are more explicit, which can be popularized and applied in broiler farming after ensuring safety and effectiveness.
Data availability statement
The original contributions presented in the study are publicly available. This data can be found here: https://www.ncbi.nlm.nih.gov/bioproject/PRJNA877374.
Ethics statement
The animal study was reviewed and approved by Feed Research Institute, Chinese Academy of Agricultural Sciences Experimental Animal Ethics Committee.
Author contributions
YW: funding acquisition and methodology. JW: writing–original draft and data curation. MJ: formal analysis and visualization. JL and YY: investigation. SH: conceptualization. YC: writing-reviewing and editing. TY: project administration. XG: supervision. All authors have read and agreed to the published version of the manuscript.
Funding
This study was supported by the National Key Research and Development Program of China (Grant No. 2021YFD1300300), the Beijing Innovation Consortium of Poultry Industry Research System of China (BAIC04-2022), and the Agricultural Science and Technology Innovation Program of CAAS, China (CAAS-ASTIP-2022-FRI-08).
Conflict of interest
The authors declare that the research was conducted in the absence of any commercial or financial relationships that could be construed as a potential conflict of interest.
Publisher's note
All claims expressed in this article are solely those of the authors and do not necessarily represent those of their affiliated organizations, or those of the publisher, the editors and the reviewers. Any product that may be evaluated in this article, or claim that may be made by its manufacturer, is not guaranteed or endorsed by the publisher.
Supplementary material
The Supplementary Material for this article can be found online at: https://www.frontiersin.org/articles/10.3389/fvets.2022.1028792/full#supplementary-material
References
1. Attia YA, Al-Harthi MA, El-Deek AA. Nutritive value of undehulled sunflower meal as affected by multienzyme supplementation to broiler diets. Archiv fur Geflugelkunde. (2003) 67:97–106.
2. Sun H, Tang J, Yao X, Wu YF, Wang X. Effects of dietary inclusion of fermented cottonseed meal on growth, cecal microbial population, small intestinal morphology, and digestive enzyme activity of broilers. Trop Animal Health Prod. (2013) 45:987–93. doi: 10.1007/s11250-012-0322-y
3. Sharma M, Kumar Bajaj B, Energy S. Optimization of bioprocess variables for production of a thermostable and wide range pH stable carboxymethyl cellulase from Bacillus subtilis MS 54 under solid state fermentation. Environ Prog. (2017) 36:1123–30. doi: 10.1002/ep.12557
4. Santos JFS, Naval LP. Spatial and temporal dynamics of water footprint for soybean production in areas of recent agricultural expansion of the Brazilian savannah (Cerrado). J Clean Prod. (2020) 251:119482. doi: 10.1016/j.jclepro.2019.119482
5. Goldberg I. Organisms and substrates. In: Single Cell Protein. Berlin, Heidelberg: Springer. (1985). p. 11–66. doi: 10.1007/978-3-642-46540-6_2
6. Li HG, Lu LX. Research on production of active protein fodder by solid fermentation of extraction mother liquor of desalination glutamic acid. Environ Eng. (1999) 05:65–8.
7. Anupama RP. Value-added food: Single cell protein. Biotechnol Adv. (2000) 18:459–79. doi: 10.1016/S0734-9750(00)00045-8
8. Øverland M, Skrede A. Yeast derived from lignocellulosic biomass as a sustainable feed resource for use in aquaculture. J Sci Food Agric. (2017) 97:733–42. doi: 10.1002/jsfa.8007
9. DuBois FM. Acid whey treatment and conversion to single cell protein via aerobic yeast activated sludge. Water Pract Technol. (2020) 15:494–505. doi: 10.2166/wpt.2020.036
10. Davies SJ, Wareham H. A preliminary evaluation of an industrial single cell protein in practical diets for tilapia (Oreochromis mossambicus Peters). Aquaculture. (1988) 73:189–99. doi: 10.1016/0044-8486(88)90053-1
11. Westendorf ML, Wohlt JE. Brewing by-products: their use as animal feeds. Veter Clin North Am. (2002) 18:233–52. doi: 10.1016/S0749-0720(02)00016-6
12. Kang HK, Park SB, Kim CH. Effects of dietary supplementation with a chlorella by-product on the growth performance, immune response, intestinal microflora and intestinal mucosal morphology in broiler chickens. J Anim Physiol Anim Nutr. (2016) 101:2. doi: 10.1111/jpn.12566
13. Najib H. Feeding value of single cell protein produced from date palm (phoenix dactylifera) fruits for broiler chickens. Clothing Textiles Res J. (2014) 4:2406–13. doi: 10.9734/ARRB/2014/9524
14. Ting C, Lian JH, Wu JH, Xi QY, Sun JJ, Luo JY, et al. Effects of compound probiotics fermentation feed on nutritional apparent digestibility and meat quality of xuefeng black-boned chicken. Chin Animal Husbandry Veter Med. (2019) 46:2964–72. doi: 10.16431/j.cnki.1671-7236.2019.10.017
15. Moniruzzaman M, Mollah M. Autolyzed Saccharomyces cerevisiae as a single cell protein for broiler diet. Bangladesh J Animal Sci. (2019) 48:1–8. doi: 10.3329/bjas.v48i1.44551
16. Pourelmi MR, Seifi S, Kakroudi ARA, Khoshbakht R. Evaluation of single cell protein as a non-conventional feedstuff in broilers feeding. Iranian J Appl Animal Sci. (2018) 8:317–24.
17. Adeniji AA. Effect of replacing groundnut cake with maggot meal in the diet of broilers. Int J Poult Sci. (2007) 6:822–5. doi: 10.3923/ijps.2007.822.825
18. Xiong ZH. Research progress of single cell protein in feed industry. Animals Breed Feed. (2006) 7:11–5. doi: 10.13300/j.cnki.cn42-1648/s.2006.07.003
19. Wei HC, Yu HH, Chen XM, Chao W, Zou FQ, Zheng YH, et al. Effects of soybean meal replaced by Clostridium autoethanogenum protein on growth performance, plasma biochemical indexes and hepatopancreas and intestinal histopathology of grass carp. Chin J Animal Nutr. (2018) 30:4190–201. doi: 10.3969/j.issn.1006-267x.2018.10.045
20. Norman ROJ, Millat T, Winzer K, Minton NP, Hodgman C. Progress towards platform chemical production using Clostridium autoethanogenum. Biochem Soc Trans. (2018) 46:523–35. doi: 10.1042/BST20170259
21. Song YS, Frias J, Martinez-Villaluenga C, Vidal-Valdeverde C, De Mejia EG. Immunoreactivity reduction of soybean meal by fermentation, effect on amino acid composition and antigenicity of commercial soy products. Food Chem. (2008) 108:571–81. doi: 10.1016/j.foodchem.2007.11.013
22. Yang P, Li X, Song B, He M, Wu C, Leng X. The potential of Clostridium autoethanogenum, a new single cell protein, in substituting fish meal in the diet of largemouth bass (Micropterus salmoides): Growth, feed utilization and intestinal histology. Aquac Fisher. (2022) 8:67–75. doi: 10.1016/j.aaf.2021.03.003
23. Zhu S, Gao W, Wen Z, Chi S, Shi Y, Hu W, et al. Partial substitution of fish meal by Clostridium autoethanogenum protein in the diets of juvenile largemouth bass (Micropterus salmoides). Aquac Rep. (2022) 22:100938. doi: 10.1016/j.aqrep.2021.100938
24. Jiang X, Yao W, Yang H, Tan S, Leng X, Li X. Dietary effects of Clostridium autoethanogenum protein substituting fish meal on growth, intestinal histology and immunity of Pacific white shrimp (Litopenaeus vannamei) based on transcriptome analysis. Fish Shellfish Immunol. (2021) 119:635–44. doi: 10.1016/j.fsi.2021.10.005
25. Sahya M, Hualiang L, Xianping G, Heng Y, Dongyu H, Ji K, et al. Effect of dietary Clostridium autoethanogenum protein on growth, body composition, plasma parameters and hepatic genes expression related to growth and AMPK/TOR/PI3K signaling pathway of the genetically improved farmed tilapia (GIFT: Oreochromis niloticus) juveniles. Anim Feed Sci Technol. (2021) 276:114914. doi: 10.1016/j.anifeedsci.2021.114914
26. Maulu S, Liang H, Ke J, Ren M, Ge X, Huang D, et al. Dietary Clostridium autoethanogenum protein modulates intestinal absorption, antioxidant status, and immune response in GIFT (Oreochromis niloticus) juveniles. Aquac Res. (2021) 52:1–13. doi: 10.1111/are.15454
27. Li MY, Liang HL, Xie J, Chao W, Zou FQ, Ge XP, et al. Diet supplemented with a novel Clostridium autoethanogenum protein have a positive effect on the growth performance, antioxidant status and immunity in juvenile Jian carp (Cyprinus carpio var. Jian). Aquac Rep. (2021) 19:100572. doi: 10.1016/j.aqrep.2020.100572
28. NRC. (1994). Available online at: https://nap.nationalacademies.org/catalog/2114/nutrient-requirements-of-poultry-ninth-revised-edition-1994
29. Feng XH, Liu N, Yang YY, Feng SN, Wang J, Meng QS. Isotope-coded chemical derivatization method for highly accurately and sensitively quantifying short-chain fatty acids. J Agric Food Chem. (2022) 70:6253–63. doi: 10.1021/acs.jafc.2c01836
30. Wei X, Yao T, Fall FN, Xue M, Liang X, Wang J, et al. An integrated bile acids profile determination by UHPLC-MS/MS to identify the effect of bile acids supplement in high plant protein diet on common carp (cyprinus carpio). Foods. (2021) 10:2465. doi: 10.3390/foods10102465
31. Tan BP. New non-food protein sources in aquafeed. In: Proceedings of the 5th International Symposium on Feed Processing Technology. (2000).
32. Hombegowda GP, Suresh BN, Shivakumar MC, Ravikumar P, Girish BC, Rudrappa SM, et al. Growth performance, carcass traits and gut health of broiler chickens fed diets incorporated with single cell protein. Animal Biosci. (2021) 34:1951–62. doi: 10.5713/ab.20.0844
33. Moutinho S, Peres H, Serra C, Martínez-Llorens S, Tomás-Vidal A, Jover-Cerdá M, et al. Meat and bone meal as partial replacement of fishmeal in diets for gilthead sea bream (Sparus aurata) juveniles: Diets digestibility, digestive function, and microbiota modulation. Aquaculture. (2017) 479:721–731. doi: 10.1016/j.aquaculture.2017.07.021
34. Diógenes AF, Castro C, Miranda AC, Oliva-Teles A, Peres H. Dietary replacement of fishmeal by corn distillers dried grains with solubles (DDGS) in diets for turbot (Scophthalmus maximus, Linneaus, 1758) Juveniles. Aquaculture. (2018) 492:113–22. doi: 10.1016/j.aquaculture.2018.04.005
35. Coma J, Carrion D, Zimmerman DR. Use of plasma urea nitrogen as a rapid response criterion to determine the lysine requirement of pigs. J Anim Sci. (1995) 73:472–81. doi: 10.2527/1995.732472x
36. Li X, Feng Y, Wang H, Song M, Jin J, Cui Z, et al. Nutritional status survey of aplastic anemia patients-a single center experience in China. Appl Nurs Res. (2016) 30:142–7. doi: 10.1016/j.apnr.2015.09.003
37. Torres-Pitarch A, Hermans D, Manzanilla EG, Bindelle J, Everaert N, Beckers Y, et al. Effect of feed enzymes on digestibility and growth in weaned pigs: A systematic review and meta-analysis. Anim Feed Sci Technol. (2017) 233:145–59. doi: 10.1016/j.anifeedsci.2017.04.024
38. Harr KE. Clinical chemistry of companion avian species: a review. Veter Clin Pathol. (2002) 31:140–51. doi: 10.1111/j.1939-165X.2002.tb00295.x
39. Rajman M, Juráni M, Lamošová D, Máčajová M, Sedlačková M, Koštál L, et al. The effects of feed restriction on plasma biochemistry in growing meat type chickens (Gallus gallus). Compar Biochem. (2006) 145:363–371. doi: 10.1016/j.cbpa.2006.07.004
40. Donsbough AL, Powell S, Waguespack A, Bidner TD, Southern LL. Uric acid, urea, and ammonia concentrations in serum and uric acid concentration in excreta as indicators of amino acid utilization in diets for broilers. Poult Sci. (2010) 89:287–94. doi: 10.3382/ps.2009-00401
41. Attia YA, Al-Harthi MA, Abo El-Maaty HM. The effects of different oil sources on performance, digestive enzymes, carcass traits, biochemical, immunological, antioxidant, and morphometric responses of broiler chicks. Front Veter Sci. (2020) 7:181. doi: 10.3389/fvets.2020.00181
42. Chao W, Rui C, Yueping C, Liren D, Tian W, Yanmin Z. Betaine improves growth performance, liver health, antioxidant status, breast meat yield, and quality in broilers fed a mold-contaminated corn-based diet. Anim Nutrit. (2021) 7:661–6. doi: 10.1016/j.aninu.2020.11.014
43. Tong L. Acetyl-coenzyme a carboxylase: crucial metabolic enzyme and attractive target for drug discovery. Cell Molec Life Sci. (2005) 62:1784–803. doi: 10.1007/s00018-005-5121-4
44. Menendez JA, Lupu R. Fatty acid synthase and the lipogenic phenotype in cancer pathogenesis acid. Nat Rev Cancer. (2007) 7:763–77. doi: 10.1038/nrc2222
45. Laplante M, Sabatini DM. An Emerging Role of mTOR in Lipid Biosynthesis. Curr Biol. (2009) 19:R1046–52. doi: 10.1016/j.cub.2009.09.058
46. Chakrabarti P, English T, Shi J, Smas CM, Kandror KV. Mammalian target of rapamycin complex 1 suppresses lipolysis, stimulates lipogenesis, and promotes fat storage. Diabetes. (2010) 59:775–81. doi: 10.2337/db09-1602
47. Zimmermann R, Strauss JG, Haemmerle G, Schoiswohl G. Fat mobilization in adipose tissue is promoted by adipose triglyceride lipase. Science. (2004) 306:1383–6. doi: 10.1126/science.1100747
48. Schoonjans K, Staels B, Auwerx J. Role of the peroxisome proliferator-activated receptor (PPAR) in mediating the effects of fibrates and fatty acids on gene expression. J Lipid Res. (1996) 13:301–24. doi: 10.1016/S0022-2275(20)42003-6
49. Stéphane R, Johan A. Peroxisome proliferator-activated receptor gamma, the ultimate liaison between fat and transcription. Br J Nutr. (2000) 84:S223–7. doi: 10.1079/096582197388581
50. Ahmadian M, Abbott MJ, Tang T, Hudak CS, Kim Y, Bruss M, et al. Desnutrin/ATGL is regulated by AMPK and is required for a brown adipose phenotype. Cell Metab. (2011) 13:739–48. doi: 10.1016/j.cmet.2011.05.002
51. Haemmerle G, Moustafa T, Woelkart G, Büttner S, Schmidt A, van de Weijer T, et al. ATGL-mediated fat catabolism regulates cardiac mitochondrial function via PPAR-α and PGC-1. Nat Med. (2011) 17:1076–85. doi: 10.1038/nm.2439
52. Louet JF, Chatelain F, Decaux JF, Park EA, Kohl C, Pineau T, et al. Long-chain fatty acids regulate liver carnitine palmitoyltransferase I gene (L-CPT I) expression through a peroxisome-proliferator-activated receptor α (PPARα)-independent pathway. Biochem J. (2001) 354:189. doi: 10.1042/bj3540189
53. Kersten S. Effects of fatty acids on gene expression: role of peroxisome proliferator-activated receptor α, liver X receptor α and sterol regulatory element-binding protein-1c. Proc Nutr Soc. (2022) 61:371–4. doi: 10.1079/PNS2002169
54. Huang JB, Zhang Y, Zhou YB, Wan XC, Zhang JS. Effects of epigallocatechin gallate on lipid metabolism and its underlying molecular mechanism in broiler chickens. J Anim Physiol Anim Nutr. (2015) 99:719–27. doi: 10.1111/jpn.12276
55. Geraert PA, Padilha JC, Guillaumin S. Chronic heat exposure in chickens: metabolic and endocrine changes induced by chronic heat exposure in broiler chickens: growth performance, body composition and energy retention. Br J Nutr. (1996) 75:195–204. doi: 10.1079/BJN19960124
56. Luo J, Song J, Liu L, Xue B, Tian G, Yang YJ. Effect of epigallocatechin gallate on growth performance and serum biochemical metabolites in heat-stressed broilers. Poult Sci. (2018) 97:1–8. doi: 10.3382/ps/pex353
57. Zhang XD, Saarinen AM, Hitosugi T, Wang ZH, Wang LG, Ho TH, et al. Inhibition of intracellular lipolysis promotes human cancer cell adaptation to hypoxia. Elife. (2017) 6:e31132. doi: 10.7554/eLife.31132
58. Liu X, Jang SS, An Z, Song H, Kim WD, Yu JR, et al. Fenofibrate decreases radiation sensitivity via peroxisome proliferator-activated receptor obiota. Radiat Oncol J. (2012) 30:88–95. doi: 10.3857/roj.2012.30.2.88
59. Khoo NKH, Hebbar S, Zhao W, Moore SA, Domann FE, Robbins ME. Differential activation of catalase expression and activity by PPAR agonists: Implications for astrocyte protection in anti-glioma therapy. Redox Biol. (2013) 1:70–9. doi: 10.1016/j.redox.2012.12.006
60. Astrid S, Marion M, Sarah W, Guenter H, Heike S, Gerald W, et al. Cardiac oxidative stress in a mouse model of neutral lipid storage disease. Sponsored Docum. (2013) 1831:1600–8. doi: 10.1016/j.bbalip.2013.07.004
61. Yi Y, Wang L, Yang L, Yuning S, Yan L, Qing Y, et al. Alpha-lipoic acid improves high-fat diet-induced hepatic steatosis by modulating the transcription factors SREBP-1, FoxO1 and Nrf2 via the SIRT1/LKB1/AMPK pathway. J Nutr Biochem. (2014) 25:1207–17. doi: 10.1016/j.jnutbio.2014.06.001
62. Zhao M, Sheng X, Huang Y, Wang Y, Jiang C, Zhang J, et al. Triterpenic acids-enriched fraction from Cyclocarya paliurus attenuates non-alcoholic fatty liver disease via improving oxidative stress and mitochondrial dysfunction. Compar Biochem Physiol C. (2018) 104:7–14. doi: 10.1016/j.biopha.2018.03.170
63. Scapigliati G, Romano N, Buonocore F, Picchietti S, Baldassini MR, Prugnoli D, et al. The immune system of sea bass, Dicentrarchus labrax, reared in aquaculture. Dev Comp Immunol. (2022) 26:151–60. doi: 10.1016/S0145-305X(01)00057-X
64. Halliwell B. Reactive species and antioxidants. Redox biology is a fundamental theme of aerobic life. Plant Physiol. (2006) 141:312–22. doi: 10.1104/pp.106.077073
65. Ding Z, Zhang Y, Ye J, Du Z, Kong Y. An evaluation of replacing fish meal with fermented soybean meal in the diet of Macrobrachium nipponense: Growth, nonspecific immunity, and resistance to Aeromonas hydrophila. Fish Shellfish Immunol. (2015) 44:295–301. doi: 10.1016/j.fsi.2015.02.024
66. Yang J, Ding X, Bai S, Wang J, Zeng Q, Peng H, et al. The effects of broiler breeder dietary vitamin E and egg storage time on the quality of eggs and newly hatched chicks. Animals. (2020) 10:1409. doi: 10.3390/ani10081409
67. Gowda S, Desai PB, Hull VV, Math AA, Vernekar SN, Kulkarni SS. A review on laboratory liver function tests. Pan African Med J. (2009) 3:17.
68. Fosoul SS, Azarfar A, Gheisari A, Khosravinia H. Energy utilisation of broiler chickens in response to guanidinoacetic acid supplementation in diets with various energy contents. Br J Nutr. (2018) 120:1–10. doi: 10.1017/S0007114517003701
69. Cani PD, Bibiloni R, Knauf C, Waget A, Neyrinck AM, Delzenne NM, et al. Changes in gut microbiota control metabolic endotoxemia-induced inflammation in high-fat diet-induced obesity and diabetes in mice. Diabetes. (2008) 57:1470–81. doi: 10.2337/db07-1403
70. Turnbaugh PJ, Ley RE, Mahowald MA, Magrini V, Mardis ER, Gordon JI. An obesity-associated gut microbiome with increased capacity for energy harvest. Nature. (2006) 21:1027–31. doi: 10.1038/nature05414
71. Ley RE, Bäckhed F, Turnbaugh P, Lozupone CA, Knight RD, Gordon JI. Obesity alters gut microbial ecology. Proc Nat Acad Sci. (2005) 102:11070–5. doi: 10.1073/pnas.0504978102
72. Peng L, Li ZR, Green RS, Holzman IR, Lin J. Butyrate enhances the intestinal barrier by facilitating tight junction assembly via activation of AMP-Activated protein kinase in Caco-2 cell monolayers. J Nutr. (2009) 139:1619–25. doi: 10.3945/jn.109.104638
73. Walker AW, Duncan SH, Leitch ECM, Child MW, Flint HJ. pH and peptide supply can radically alter bacterial populations and short-chain fatty acid ratios within microbial communities from the human colon. Appl Environ Microbiol. (2005) 71:3692–700. doi: 10.1128/AEM.71.7.3692-3700.2005
74. Shirvani-Rad S, Ejtahed HS, Ettehad Marvasti F, Taghavi M, Sharifi F, Arzaghi SM, et al. The role of gut microbiota-brain axis in pathophysiology of ADHD: A systematic review. J Attent Diso. (2022) 26:10870547211073474 doi: 10.1177/10870547211073474
75. Qian M, Liu J, Zhao D, Cai P, Pan C, Jia W, et al. Aryl hydrocarbon receptor deficiency in intestinal epithelial cells aggravates alcohol-related liver disease. Cell Molec Gastroenterol Hepatol. (2022) 13:233–56. doi: 10.1016/j.jcmgh.2021.08.014
76. Hu J, Zhong X, Liu Y, Yan J, Zhou D, Qin D, et al. Correlation between intestinal flora disruption and proteind its underlying molecular mechanism in broiler chickens. BMC Nephrol. (2022) 130:23. doi: 10.1186/s12882-022-02762-2
77. Liu CS, Liang X, Wei XH, Jin Z, Chen FL, Tang QF, et al. Gegen Qinlian decoction treats diarrhea in piglets by modulating gut microbiota and short-chain fatty acids. Front Microbiol. (2019) 10:825. doi: 10.3389/fmicb.2019.00825
78. Lan PTN, Sakamoto M, Sakata S, Benno Y. Bacteroides barnesiae sp. nov, Bacteroides salanitronis sp nov and Bacteroides gallinarum sp nov, isolated from chicken caecum. Int J System Evolut Microbiol. (2006) 56:2853–9. doi: 10.1099/ijs.0.64517-0
79. Kollarcikova M, Faldynova M, Matiasovicova J, Jahodarova E, Kubasova T, Seidlerova Z, et al. Different bacteroides species colonise human and chicken intestinal tract. Microorganisms. (2022) 8:1483. doi: 10.3390/microorganisms8101483
80. Chiang JYL, Ferrell JM. Bile acid metabolism in liver pathobiology. Gene Expr. (2018) 18:71–87. doi: 10.3727/105221618X15156018385515
81. Hofmann AF. The enterohepatic circulation of bile acids in mammals: form and functions. Front Biosci Landmark. (2009) 14:2584–98. doi: 10.2741/3399
82. Narushima S, Itoh K, Kuruma K, Uchida K. Bile acid transformation in gnotobiotic mice associated with human intestinal flora. Biosci Microflora. (2002) 21:145–50. doi: 10.12938/bifidus1996.21.145
83. Xia DY, Yang L, Cui JJ, Li Y, Jiang XZ, Meca G, et al. Combined analysis of the effects of exposure to blue light in ducks reveals a reduction in cholesterol accumulation through changes in methionine metabolism and the gut microbiota. Front Nutr. (2021) 8:737059. doi: 10.3389/fnut.2021.737059
84. Fukiya S, Arata M, Kawashima H, Yoshida D, Kaneko M, Minamida K, et al. Conversion of cholic acid and chenodeoxycholic acid into their 7-oxo derivatives by Bacteroides intestinalis AM-1 isolated from human feces. FEMS Microbiol Lett. (2009) 293:263–70. doi: 10.1111/j.1574-6968.2009.01531.x
Keywords: cobb broiler, Clostridium autoethanogenum protein, biochemical indexes, lipid metabolism, gut microbiota
Citation: Wu Y, Wang J, Jia M, Huang S, Cao Y, Yao T, Li J, Yang Y and Gu X (2022) Clostridium autoethanogenum protein inclusion in the diet for broiler: Enhancement of growth performance, lipid metabolism, and gut microbiota. Front. Vet. Sci. 9:1028792. doi: 10.3389/fvets.2022.1028792
Received: 26 August 2022; Accepted: 30 September 2022;
Published: 24 November 2022.
Edited by:
Qinghui Ai, Ocean University of China, ChinaReviewed by:
Mo Peng, Jiangxi Agricultural University, ChinaShuang Zhang, Guangdong Ocean University, China
Copyright © 2022 Wu, Wang, Jia, Huang, Cao, Yao, Li, Yang and Gu. This is an open-access article distributed under the terms of the Creative Commons Attribution License (CC BY). The use, distribution or reproduction in other forums is permitted, provided the original author(s) and the copyright owner(s) are credited and that the original publication in this journal is cited, in accordance with accepted academic practice. No use, distribution or reproduction is permitted which does not comply with these terms.
*Correspondence: Xu Gu, guxu@caas.cn
†These authors have contributed equally to this work and share first authorship