Development and validation of a prognostic nomogram for neuroendocrine prostate cancer, based on the SEER database
 Siming Chen1,†
  Kangping Xiong1,†
  Jiageng Shi1,†
  Shijie Yao2
  Gang Wang3,4,5*
  Kaiyu Qian3,4,5*
  Xinghuan Wang1,5,6*
- 1Department of Urology, Zhongnan Hospital of Wuhan University, Wuhan, China
- 2Department of Gynecological Oncology, Zhongnan Hospital of Wuhan University, Wuhan, China
- 3Department of Biological Repositories, Zhongnan Hospital of Wuhan University, Wuhan, China
- 4Laboratory of Precision Medicine, Zhongnan Hospital of Wuhan University, Wuhan, China
- 5Wuhan Research Center for Infectious Diseases and Cancer, Chinese Academy of Medical Sciences, Wuhan, China
- 6Medical Research Institute, Wuhan University, Wuhan, China
Background: The tumor biology of neuroendocrine prostate cancer (NEPC) is different from that of ordinary prostate cancer, herefore, existing clinical prognosis models for prostate cancer patients are unsuitable for NEPC. The specialized individual situation assessment and clinical decision-making tools for NEPC patients are urgently needed. This study aimed to develop a valid NEPC prognostic nomogram and risk stratification model to predict risk associated with patient outcomes.
Methods: We collected 340 de-novo NEPC patients from the SEER database, and randomly selected 240 of them as the training set and the remaining 100 as the validation set. Cox regression model was used to screen for risk factors affecting overall survival (OS) and cancer-specific survival (CSS) and construct a corresponding nomogram. The receiver operating characteristic (ROC) curves, calibration curves, C-indexes, and decision curve analysis (DCA) curves are used to verify and calibrate nomograms.
Results: NEPC prognosis nomograms were constructed by integrating independent risk factors. The C-indexes, ROC curves, calibration curves, and DCA curves revealed excellent prediction accuracy of the prognostic nomogram. Furthermore, we demonstrated that NEPC patients in the high-risk group had significantly lower OS and CSS than those in the low-risk group with risk scores calculated from nomograms.
Conclusions: The nomogram established in this research has the potential to be applied to the clinic to evaluate the prognosis of NEPC patients and support corresponding clinical decision-making.
Introduction
Prostate cancer (PCa) is one of the most common malignant tumors in men worldwide, ranking the first in morbidity and the second in mortality among men in the United States (1). In recent years, the incidence of prostate cancer in China has also continued to rise. As a subspecies of hormone-refractory prostate cancer, neuroendocrine prostate cancer (NEPC) is highly aggressive, lacks effective treatments and has a poor prognosis. In addition, NEPC patients have the following clinical characteristics: rapid deterioration and often accompanied by visceral metastasis and lytic bone lesions, obvious prostate hypertrophy, but low prostate-specific antigen levels (2). NEPC can be diagnosed after conventional adenocarcinoma therapy or as a de-novo entity. The former is mainly due to the inevitable development of castration-resistant prostate cancer after androgen deprivation therapy (ADT), and further expression of neuroendocrine markers to develop NEPC (2). However, the rate of neuroendocrine (NE) differentiation in prostate cancer after ADT is difficult to assess correctly, and many patients die from PCa without biopsy confirmation of NE differentiation, so cases are limited (3). De-novo NEPC is a rare and highly malignant disease that can be effectively diagnosed by biopsy (3). Based on this, we hope to study the prognostic factors of de-novo NEPC based on SEER, a database with a large sample size.
The tumor biology of NEPC is different from that of ordinary prostate cancer, which means that traditional prostate cancer treatments have limited efficacy in treating NEPC, so the existing clinical prognosis models for prostate cancer patients are not suitable for NEPC. We need to establish specialized individual situation assessment and clinical decision-making tools for NEPC patients.
Nomograms could integrate TMN staging and other key prognostic factors to assess patient prognosis, overall survival (OS), and cancer-specific survival (CSS). Nomograms are widely used to assess many types of cancers such as carcinoma of urinary bladder, inflammatory breast cancer, Non-Small-Cell lung cancer, and duodenal adenocarcinoma (4–7). It supports clinical decision making by predicting the prognosis of patients more accurately.
It is worth noting that although nomograms studies on prostate cancer have been reported, the independent prognostic factors of de-novo NEPC and ordinary prostate cancer are significantly different, we urgently need to establish a new prognostic model for de-novo NEPC instead of ordinary prostate cancer (8). Based on the SEER database, a de-novo NEPC-targeting nomogram prediction model was constructed to predict the OS and CSS of NEPC at 1-, 3-, and 5- year. This is the first nomogram model for assessing the patient prognosis of de-novo NEPC.
Materials and methods
Data collection and ethical statement
All data in our research were derived from the SEER database (https://seer.cancer.gov/). After obtaining the license, we collected information on the confirmed de-novo NEPC patients registered in the SEER database from 2010 to 2015. Since SEER is a public database with anonymous data, this study was waived from ethical review. By using the ICD-O-3 site code: C61.9 in combination with the histopathological code of neuroendocrine carcinoma: 8,012, 8,013, 8,020, 8,021, 8,041, 8,042, 8,240, 8,246 to screen NEPC cases. Inclusion criteria: (1) pathological diagnosis of pure NEPC; (2) de-novo NEPC; (3) Age ≥18; (4) The years of diagnosis were 2010–2015. Exclusion criteria: (1) absence of survival data; (2) non-primary tumors; (3) Cases recorded as T0; (4) patients with NE differentiation.
Research factors
The patient's race, gender, marital status, age at diagnosis, AJCC TNM stage, treatment plan (surgery, radiotherapy, and chemotherapy), distant metastasis (bone, brain, liver, lung), and survival status and time were collected. The X-tile version 3.6.1 was used to determine the optimal threshold for age and nomogram points. The OS and CSS were identified as the study endpoints. OS was defined as the time from the NEPC diagnosis date to the date of death (event occurred) or last contact (censor). CSS was defined as the time from the NEPC diagnosis date to the date of death due to NEPC (event occurred) or last contact (censor).
Statistical analysis
SPSS 26.0 software was used for data analysis, and the chi-square test or Fisher's exact test was used to compare categorical variables. Univariate and multivariate analyses were performed using Cox proportional hazards regression models to screen independent risk factors for OS and CSS in NEPC patients. Variables with significant differences in multivariate analysis were considered prognostic variables affecting patient survival, and a nomogram was drawn. The accuracy of the nomogram was assessed by C-index, calibration curve, DAC curve, ROC curve, and their corresponding AUC. Survival analysis between groups was performed using the Kaplan-Meier method and log-rank test. R 3.4.3 software is used to construct nomogram and generate ROC curve, calibration curve and DCA curve. P < 0.05 was considered significant difference.
Results
Characteristics of patients
340 patients were chosen from the SEER database. We randomly selected 240 patients as the training group, and the remaining 100 cases were selected to be included in the validation group (7:3 ratio). The details of patient selection were summarized in Figure 1. The Clinicopathological date of 340 cases of NEPC are shown in Table 1. The majority of patients in the training and validation cohorts were white (77.5% and 84.0%, respectively) and married (64.2% and 66.0%, respectively). In addition, the majority of patients in both cohorts were in AJCC stage III–IV (78.3% and 79.0%, respectively). Among the training set, 98 (40.8%) patients aged < 69 years, 111 (46.3%) patients were among 69–83 years, 31 (12.9%) patients aged > 83 years. In validation group, 27 (27.0%) patients with liver metastasis, 3 (3.0%) patients with brain metastasis, 52 (52.0%) patients received chemotherapy. All variables were not statistically significantly different between the training and validation set.

Figure 1. The flow chart of patient selection and data analysis.
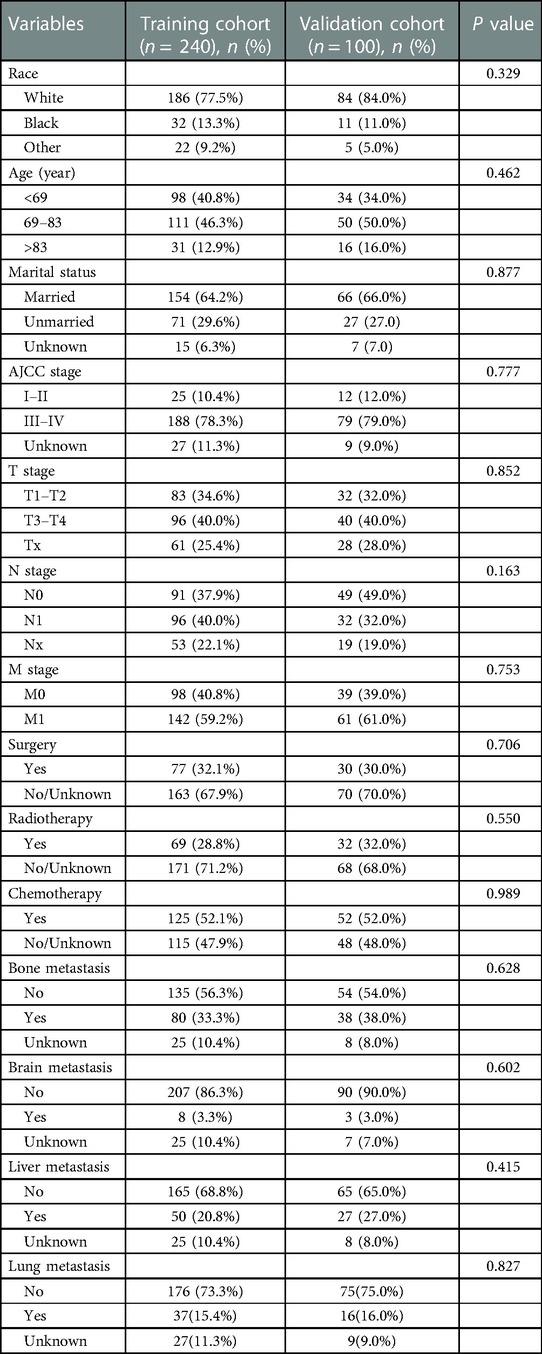
Table 1. The clinicopathological features of the patients in training cohort and validation cohort.
The risk factors of OS and CSS for NEPC
The univariate analysis indicated that race, age, AJCC stage, N or M stage, liver or lung metastasis were closely correlated with OS and CSS, and radiotherapy was associated with OS (P < 0.05) (Tables 2, 3). Further analysis showed that race, age, AJCC stage, T stage, chemotherapy, and liver metastasis were related to OS in the multivariate analysis (Table 2). In addition, six risk factors, including race, age, T stage, chemotherapy, brain metastasis, and liver metastasis, were closely associated with CSS (P < 0.05) (Table 3).
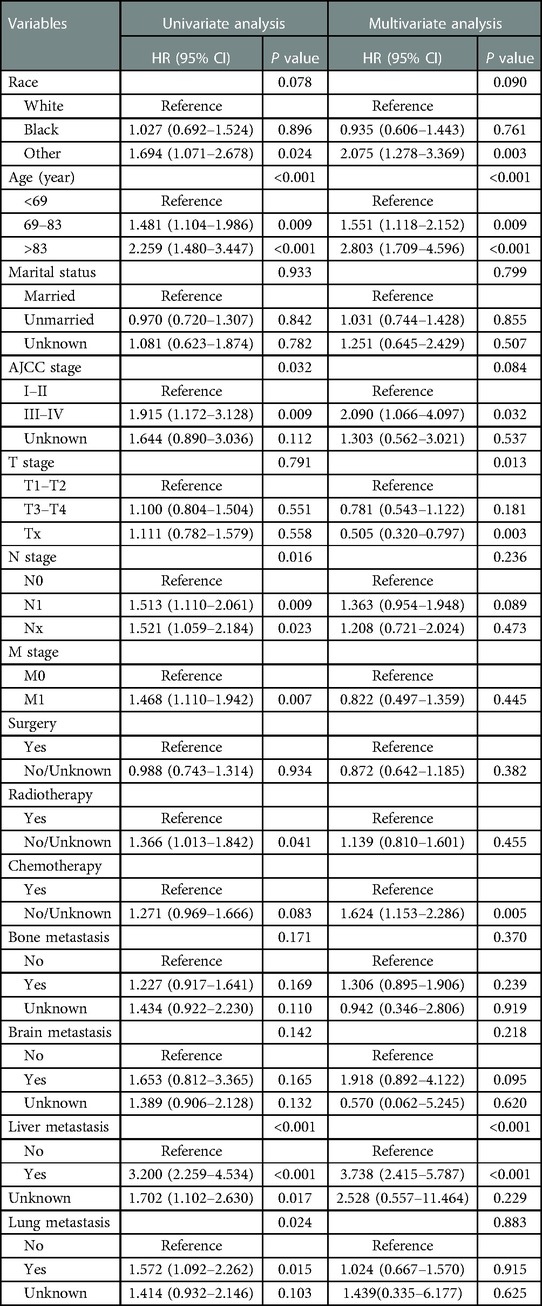
Table 2. Univariate and multivariate analyses of OS risk factors for NEPC.
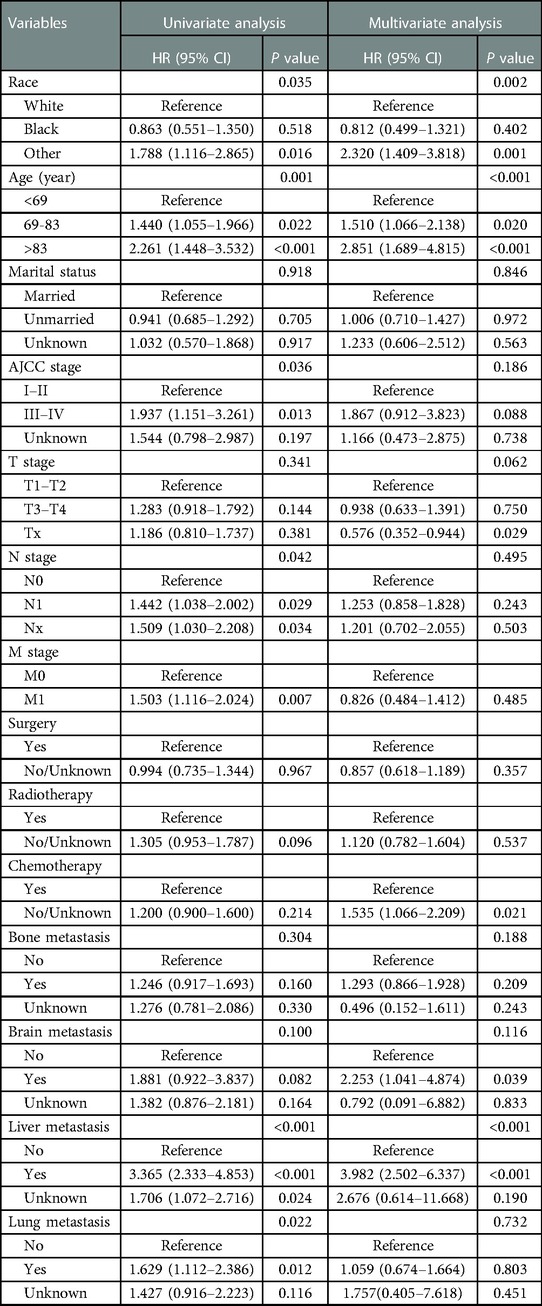
Table 3. Univariate and multivariate analyses of CSS risk factors for NEPC.
Construction of a prognostic nomogram for OS and CSS for NEPC
We constructed nomograms of 1-, 3-, and 5-year OS (Figure 2A) and CSS (Figure 2B) using risk factors determined by multivariate analysis. Each risk factor corresponds to the value on the points scale, and all the risk factor points are added up to calculate the corresponding points. By drawing a line perpendicular to the total score axis, 1-, 3-, and 5-year probability of OS or CSS can be predicted for a single patient.
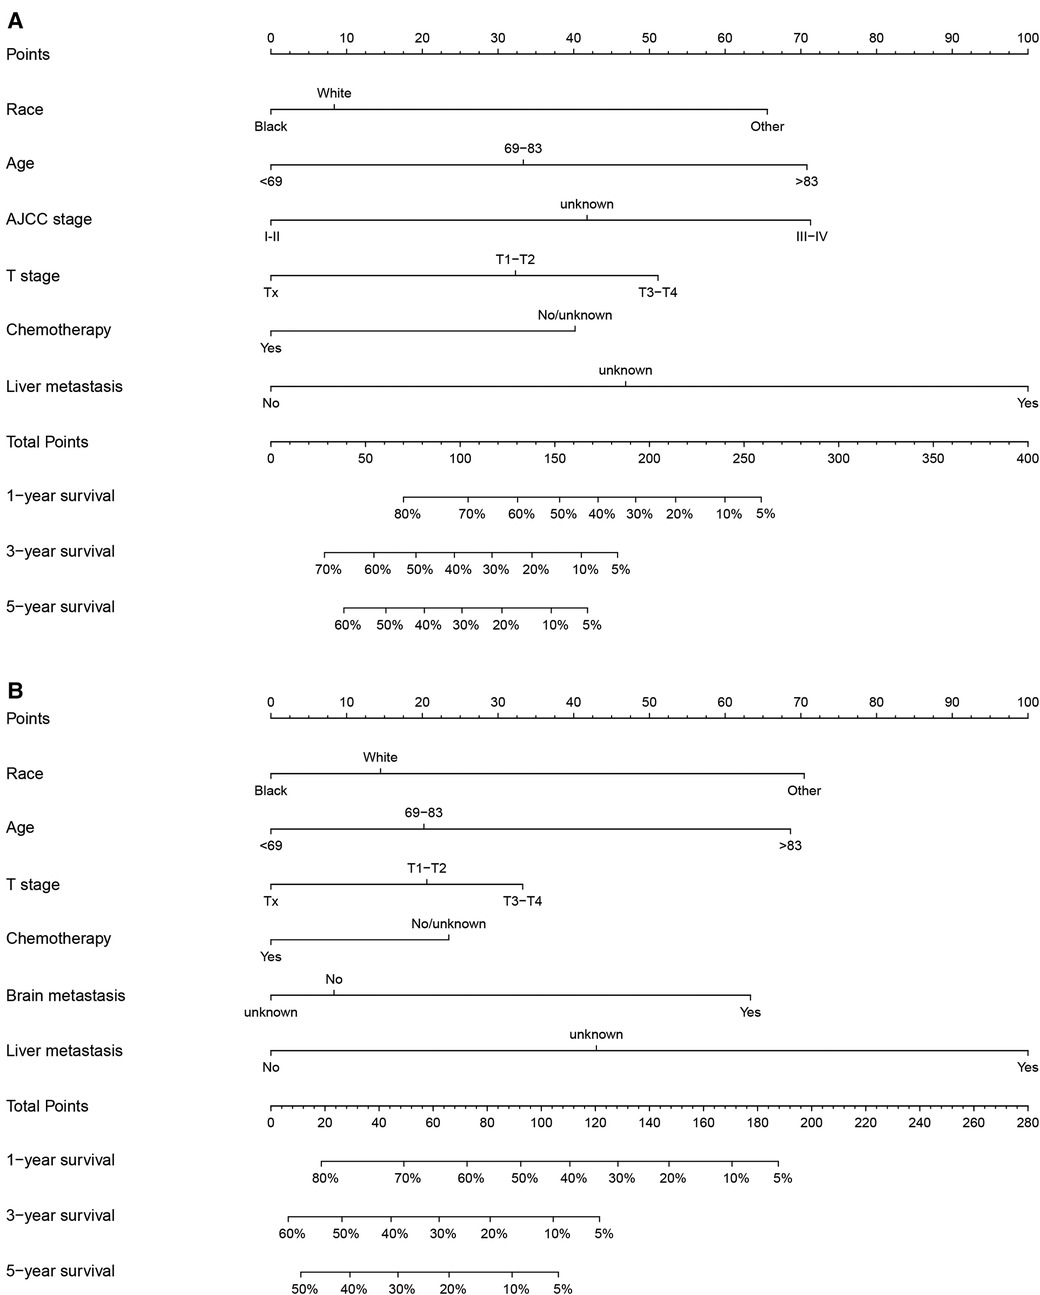
Figure 2. Nomograms to predict 1-, 3-, and 5-year OS or CSS of NEPC patients. (A) Nomogram for OS; (B) Nomogram for CSS.
Verification of the accuracy of the prognostic nomogram for OS and CSS
In the training group, the C-index for OS was 0.684 (95%CI: 0.648–0.721). After calculation, the C-index was 0.689 (95%CI: 0.654–0.725) for the CSS. This meant that the nomograms we constructed had high prediction accuracy. In the validation group, the C-index for OS and CSS were 0.702 (95%CI: 0.647–0.757) and 0.686 (95%CI: 0.624–0.748), respectively. Moreover, the ROC curves also showed the models had good prediction accuracy whether in the training set or the validation set (Figure 3). For the OS, the AUCs for the 1-, 3-, and 5-year survival were 0.734 (Figure 3A), 0.722 (Figure 3B) and 0.738 (Figure 3C) in the training cohort. Beyond this, in the validation group, the AUCs for the 1-, 3-, and 5-year survival were 0.706 (Figure 3D), 0.738 (Figure 3E) and 0.777 (Figure 3F). Similar to the OS, the model showed a good accuracy to predict CSS in both training group (1-,3-, and 5-years AUC: 0.762, 0.701, and 0.711) (Figures 3G–I) or the validation group (1-,3-, and 5-years AUC: 0.708, 0.756 and 0.787) (Figures 3J–L) over a period of 5 years. To go a step further, the calibration curves were established to assess the agreement between the estimated value of the nomogram and the actual value. This result showed that no matter in training cohort (Figures 4A,C,E) or validation cohort (Figures 4B,D,F), the estimated value of the nomogram and the actual value showed excellent consistency in the OS of 1-, 3-, and 5-year. And this consistency was also well reflected in the training set (Figures 5A,C,E) and the validation set (Figures 5B,D,F) of CSS. In addition, the DCA curve in (Figures 6, 7) showed that the established NEPC nomogram has better clinical applicability than the classic TNM tumor staging.
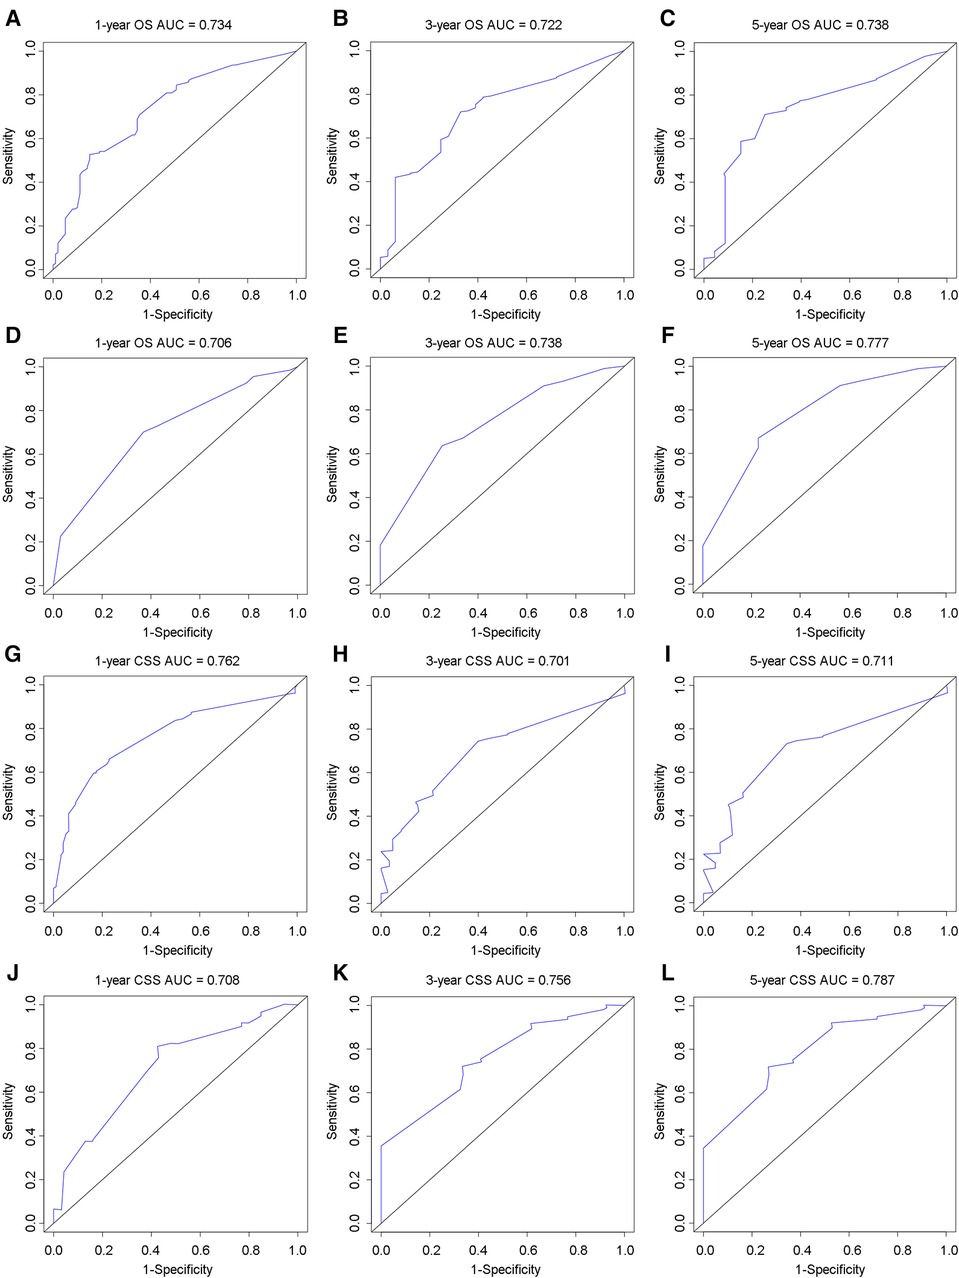
Figure 3. ROC curves to analyze the accuracy of the nomogram for 1-, 3-, and 5-year OS and CSS. ROC for OS at 1-year (A), 3-year (B), 5-year (C) in training group; ROC for OS at 1-year (D), 3-year (E), 5-year (F) in validation group; ROC for CSS at 1-year (G), 3-year (H), 5-year (I) in training group; ROC for CSS at 1-year (J), 3-year (K), 5-year (L) in validation group.
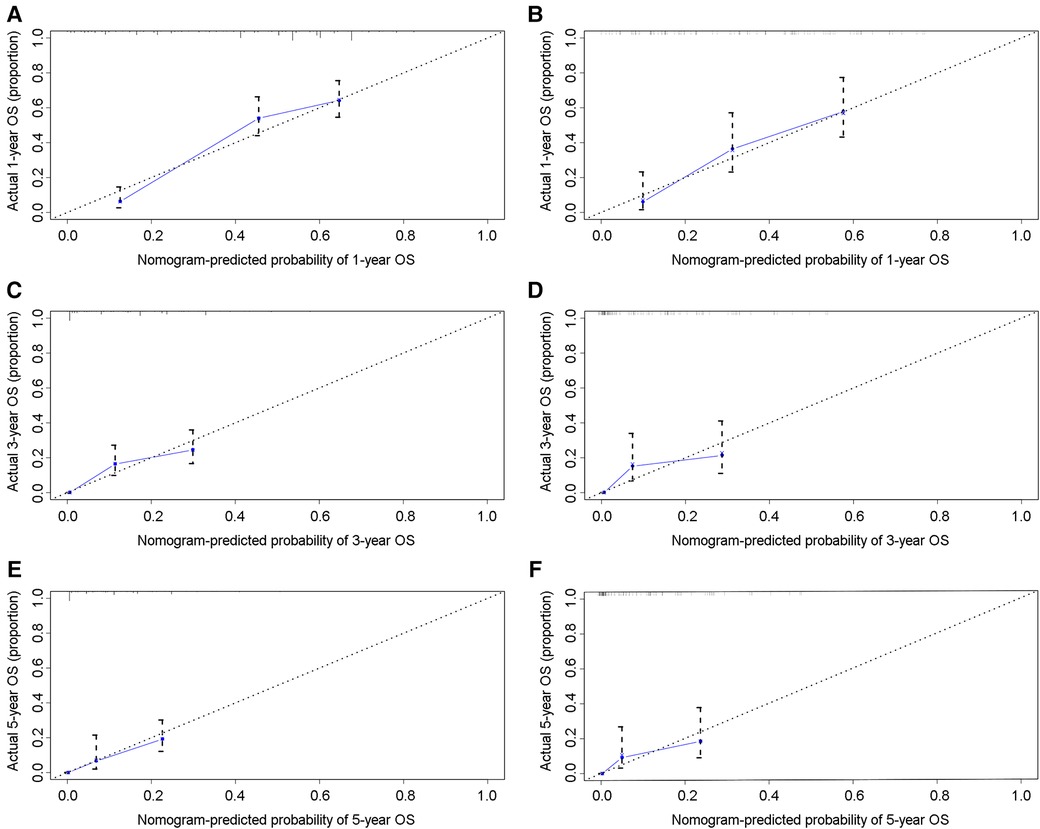
Figure 4. Calibration curves of the 1-, 3-, and 5-year OS of NEPC patients. 1-year (A), 3-year (C), 5-year (E) OS in training group; 1-year (B), 3-year (D), 5-year (F) OS in validation group.
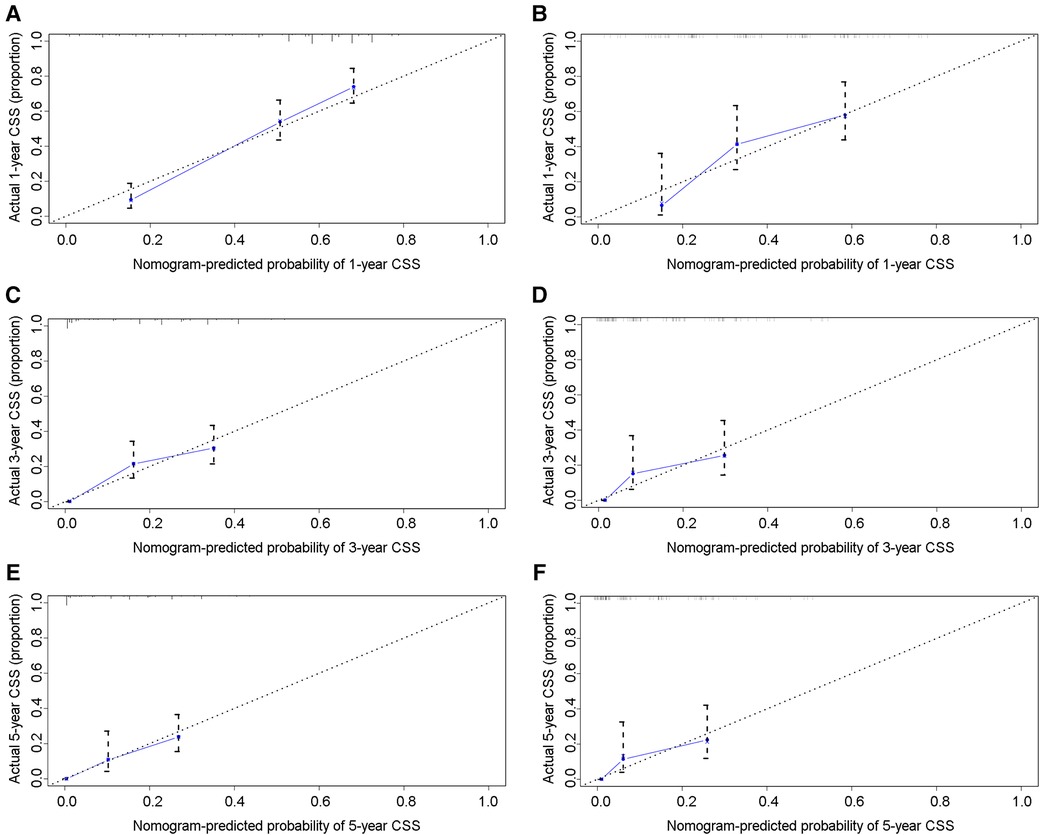
Figure 5. Calibration curves of the 1-, 3-, and 5-year CSS of NEPC patients. 1-year (A), 3-year (C), 5-year (E) CSS in training group; 1-year (B), 3-year (D), 5-year (F) CSS in validation group.
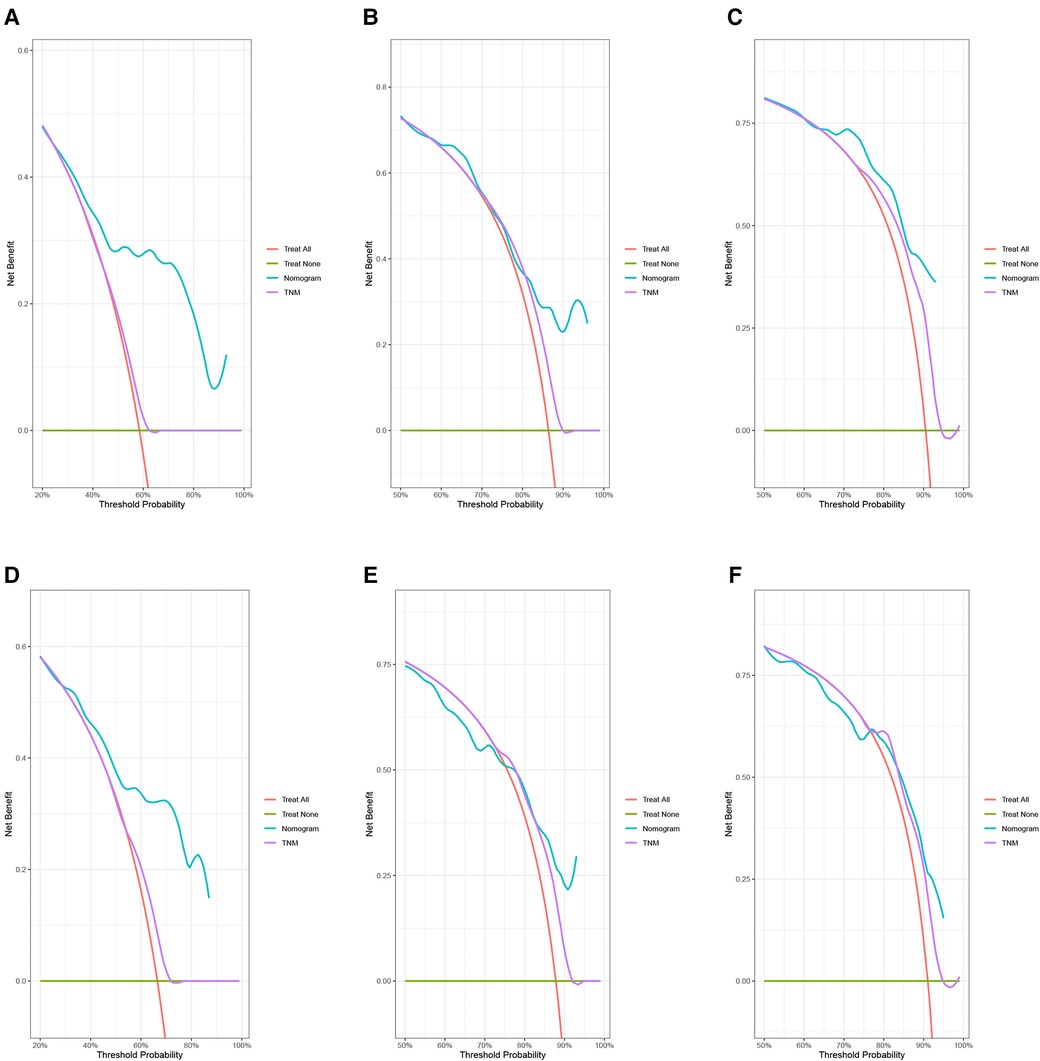
Figure 6. DCA curves of the 1-, 3-, and 5-year OS of NEPC patients. 1-year (A), 3-year (B), 5-year (C) OS in training group; 1-year (D), 3-year (E), 5-year (F) OS in validation group.
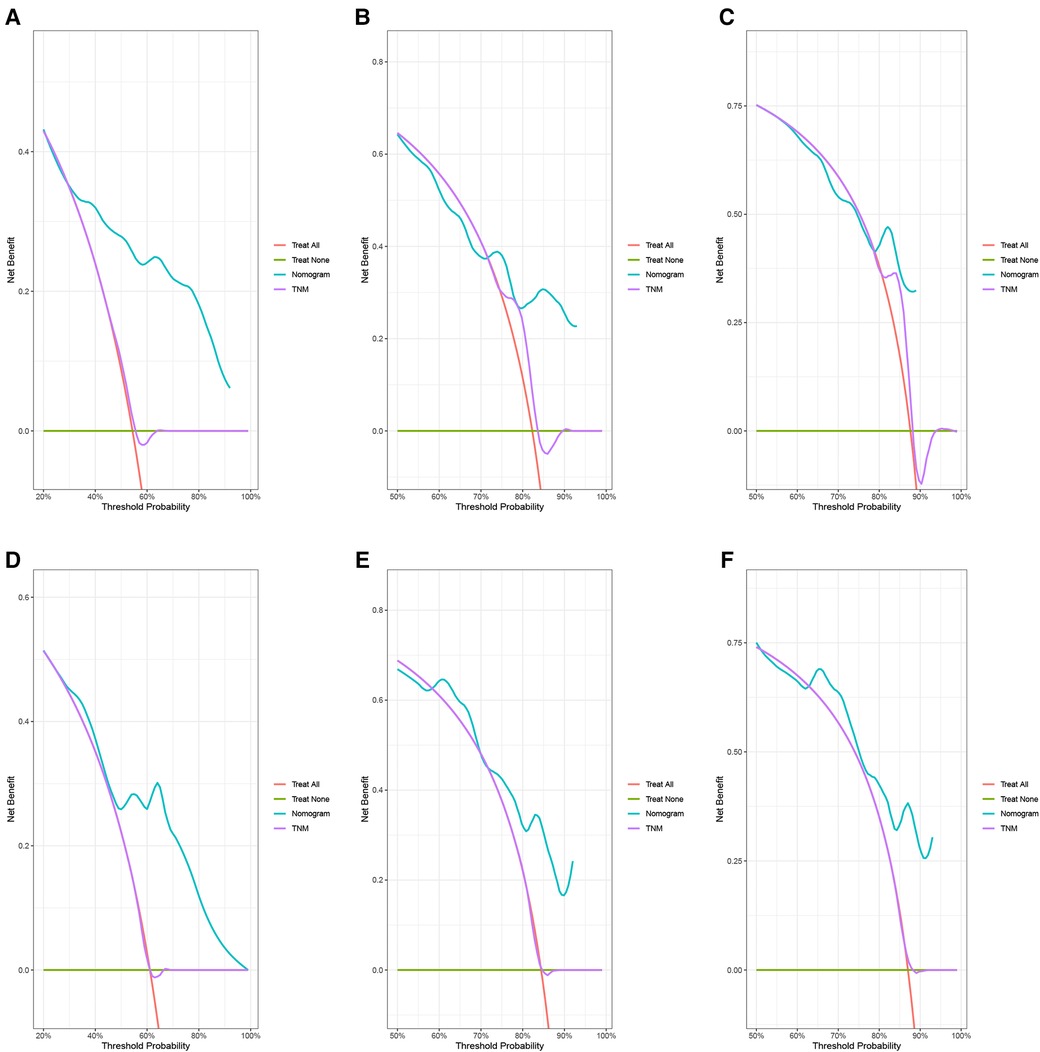
Figure 7. DCA curves of the 1-, 3-, and 5-year CSS of NEPC patients. 1-year (A), 3-year (B), 5-year (C) CSS in training group; 1-year (D), 3-year (E), 5-year (F) CSS in validation group.
Predict the probability of OS or CSS by risk
Based on the nomogram, the patients were divided into two groups according to the degree of risk based on the threshold values obtained by the X-tile software. For OS, patients were divided into low-risk group (total score <193.28) and high-risk group (total score ≥193.28). For CSS, patients were divided into low risk group (total score <129.92) and high risk group (total score ≥129.92). In training cohort, by analyzing the survival curve generated by Kaplan-Meier survival analysis, it was indicated that the prognosis of the two groups was significantly different in OS or CSS (Figures 8A,C). In the validation cohort, the results further demonstrated significant differences in the prognosis of OS or CSS between patients in the low-risk group and the high-risk group (Figures 8B,D).
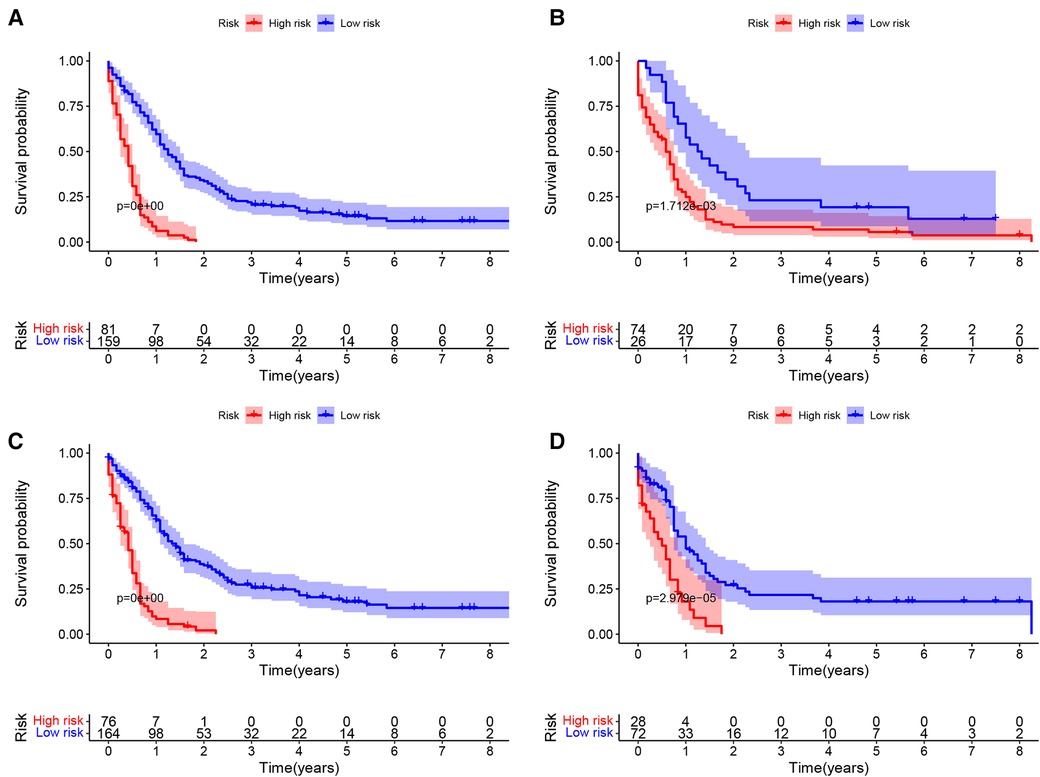
Figure 8. Kaplan–meier curves of OS and CSS of NEPC patients by different risk levels. OS in training set (A) and validation set (B); CSS in training set (C) and validation set (D).
Discussion
At present, medical data mining is more and more applied in clinical practice (9). Clinical big data plays an important role in the establishment of prognostic models, assessment of risk factors, diagnosis and treatment of diseases, and benefits patients a lot (10, 11). Today, the nomogram has become an important decision-making tool in modern medicine to predict disease risk or long-term survival outcomes (12, 13). The nomogram visualizes the probability of disease or death for each patient by quantifying the impact of various individual risk factors on the outcome event (14, 15). Given that NEPC is a rare and highly aggressive malignancy, the prognosis of patients with NEPC remains a challenging issue for physicians, yet most NEPC investigations are based on case reports or retrospective studies limited by small sample sizes (16–20). Therefore, this study examined a cohort of prostate cancer patients based on a large population from the SEER registry between 2010 and 2015. We aim to investigate the prognostic value of NEPC based on various clinicopathological features and construct a survival prognosis nomogram.
Various factors such as age, race, marital status, and TNM stage have been shown to be independent prognostic factors for prostate cancer (21, 22). In contrast to their study, we developed a prognostic model for NEPC patients only, which is essential to exclude the heterogeneity of common prostate cancer and NEPC. In our study, race, age, AJCC stage, T stage, chemotherapy, and liver metastasis were strongly associated with OS, whereas race, age, T stage, chemotherapy, brain metastasis, and liver metastasis were independent prognostic factors for CSS. Interestingly, radiotherapy was not correlated with OS or CSS in NEPC. Age and race have long been identified as predictors of survival in prostate cancer patients (23, 24). As age increases, the risk of death is higher. Surprisingly, we found that other ethnic groups such as American Indians /AK Natives and Asian/Pacific Islanders had worse survival probabilities compared to whites, contrary to the conclusion of the general prostate cancer study(25, 26), but consistent with the results of other NEPC studies (27). Akoto et al. noted that most deaths associated with PCa are caused by metastatic disease characterized by prostate tumor cells metastasizing to various distant organs (28). Similarly, we found that NEPC patients with liver or brain metastases had a higher risk of death, especially for liver metastases. Regarding clinical staging, they are widely considered to be robust prognostic predictors and are used in combination to analyze the risk of death in patients with NEPC (29).
The TNM staging system is considered the standard method for staging prostate patients (30). However, the inherent limitations of the TNM staging system are unavoidable, as it only emphasizes the primary tumor site, regional lymph node involvement, and distant metastasis in assessing patient prognosis, without considering other factors that affect patient prognosis, such as age, race, surgery, and chemoradiotherapy (31, 32). The advantage of establishing prognostic assessment tools is that they provide intuitive initial survival expectations on which clinicians and patients can jointly determine treatment options. However, predictive tools are not a substitute for clinical judgment, and clinicians need to make trade-offs based on individual differences, such as severity of comorbidities and physical conditions. This is the first column graph to evaluate survival in patients with NEPC and may therefore provide new clues for clinical transformation.
Our study had some limitations. First, the incidence of NEPC is too low and easy to be ignored, resulting in only 340 eligible cases in the database we eventually included. In addition, the low incidence made it difficult for us to collect enough external cases for external verification, so we could only use internal verification. Secondly, since our study was a retrospective case study based on the SEER database, related prognostic factors such as PSA and Gleason score for prostate cancer were not available. However, we have included basic variables such as age, stage, metastatic status and other important prognostic factors and will not cause devastating deviations. Lastly, as a retrospective study, the model we have established still needed some prospective clinical trials to verify it.
Conclusion
In conclusion, in our research, we identified the risk factors of NEPC through univariate and multivariate analyses and constructed the nomogram of OS and CSS for 1-, 3-, and 5-year. We further conducted ROC analysis and established calibration curves and DCA curves to verify the accuracy of the nomogram of OS and CSS. To the best of our knowledge, our study applied a nomogram on the basis of the SEER database to NEPC for the first time. Therefore, the nomogram has the potential to be broadly applied to NEPC patients for specialized individual situation assessment and clinical decision-making.
Data availability statement
The original contributions presented in the study are included in the article/Supplementary Material, further inquiries can be directed to the corresponding author/s.
Ethics Statement
The local ethics committee waived approval, as SEER is a public database with anonymous data.
Author contributions
SC, KX, JS, GW, KQ, XW: conceived and designed the study. SC, KX, JS and SY: collected and sorted out patient clinical information. SY, GW and KQ: analyzed and interpreted the data; SC and KX: wrote the manuscript. GW, KQ and XW: reviewed and revised the manuscript. All authors contributed to the article and approved the submitted version.
Funding
This work was supported by the Non-profit Central Research Institute Fund of the Chinese Academy of Medical Sciences (2020-PT320-004), Improvement Project for Theranostic ability on Difficulty miscellaneous disease (Tumor) from the National Health Commission of China (ZLYNXM202006), Zhongnan Hospital of Wuhan University Science, Technology and Innovation Seed Fund (CXPY2020031), Hubei Provincial Natural Science Foundation (2021CFB453).
Acknowledgments
We are very grateful to all the staff and participants of the SEER program.
Conflict of interest
The authors declare that the research was conducted in the absence of any commercial or financial relationships that could be construed as a potential conflict of interest.
Publisher's note
All claims expressed in this article are solely those of the authors and do not necessarily represent those of their affiliated organizations, or those of the publisher, the editors and the reviewers. Any product that may be evaluated in this article, or claim that may be made by its manufacturer, is not guaranteed or endorsed by the publisher.
References
1. Siegel RL, Miller KD, Jemal A. Cancer statistics, 2020. CA Cancer J Clin. (2020) 70(1):7–30. doi: 10.3322/caac.21590
2. Wang HT, Yao YH, Li BG, Tang Y, Chang JW, Zhang J. Neuroendocrine prostate cancer (nepc) progressing from conventional prostatic adenocarcinoma: factors associated with time to development of nepc and survival from nepc diagnosis-a systematic review and pooled analysis. J Clin Oncol. (2014) 32(30):3383–90. doi: 10.1200/JCO.2013.54.3553
3. Alanee S, Moore A, Nutt M, Holland B, Dynda D, El-Zawahry A, et al. Contemporary incidence and mortality rates of neuroendocrine prostate cancer. Anticancer Res. (2015) 35(7):4145–50.26124369
4. Zhang Y, Hong Y-K, Zhuang D-W, He X-J, Lin M-E. Bladder cancer survival nomogram: development and validation of a prediction tool, using the seer and tcga databases. Medicine . (2019) 98(44):e17725. doi: 10.1097/MD.0000000000017725
5. Jiang S, Zhao R, Li Y, Han X, Liu Z, Ge W, et al. Prognosis and nomogram for predicting postoperative survival of duodenal adenocarcinoma: a retrospective study in China and the seer database. Sci Rep. (2018) 8(1):7940. doi: 10.1038/s41598-018-26145-6
6. Pan X, Yang W, Chen Y, Tong L, Li C, Li H. Nomogram for predicting the overall survival of patients with inflammatory breast cancer: a seer-based study. Breast. (2019) 47:56–61. doi: 10.1016/j.breast.2019.05.015
7. Zuo Z, Zhang G, Song P, Yang J, Li S, Zhong Z, et al. Survival nomogram for stage ib non-small-cell lung cancer patients, based on the seer database and an external validation cohort. Ann Surg Oncol. (2021) 28(7):3941–50. doi: 10.1245/s10434-020-09362-0
8. Dess RT, Suresh K, Zelefsky MJ, Freedland SJ, Mahal BA, Cooperberg MR, et al. Development and validation of a clinical prognostic stage group system for nonmetastatic prostate cancer using disease-specific mortality results from the international staging collaboration for cancer of the prostate. JAMA Oncol. (2020) 6(12):1912–20. doi: 10.1001/jamaoncol.2020.4922
9. Ngiam KY, Khor IW. Big data and machine learning algorithms for health-care delivery. Lancet Oncol. (2019) 20(5):e262–e73. doi: 10.1016/s1470-2045(19)30149-4
10. Wu WT, Li YJ, Feng AZ, Li L, Huang T, Xu AD, et al. Data mining in clinical big data: the frequently used databases, steps, and methodological models. Mil Med Res. (2021) 8(1):44. doi: 10.1186/s40779-021-00338-z
11. Yang J, Li Y, Liu Q, Li L, Feng A, Wang T, et al. Brief introduction of medical database and data mining technology in big data era. J Evid Based Med. (2020) 13(1):57–69. doi: 10.1111/jebm.12373
12. He C, Mao Y, Wang J, Duan F, Lin X, Li S. Nomograms predict long-term survival for patients with periampullary adenocarcinoma after pancreatoduodenectomy. BMC cancer. (2018) 18(1):327. doi: 10.1186/s12885-018-4240-x
13. Bai Y, Liu ZS, Xiong JP, Xu WY, Lin JZ, Long JY, et al. Nomogram to predict overall survival after gallbladder cancer resection in China. World J Gastroenterol. (2018) 24(45):5167–78. doi: 10.3748/wjg.v24.i45.5167
14. Balachandran VP, Gonen M, Smith JJ, DeMatteo RP. Nomograms in oncology: more than meets the eye. Lancet Oncol. (2015) 16(4):e173–80. doi: 10.1016/s1470-2045(14)71116-7
15. Iasonos A, Schrag D, Raj GV, Panageas KS. How to build and interpret a nomogram for cancer prognosis. J Clin Oncol. (2008) 26(8):1364–70. doi: 10.1200/jco.2007.12.9791
16. Kumar K, Ahmed R, Chukwunonso C, Tariq H, Niazi M, Makker J, et al. Poorly differentiated small-cell-type neuroendocrine carcinoma of the prostate: a case report and literature review. Case Rep Oncol. (2018) 11(3):676–81. doi: 10.1159/000493255
17. Hu J, He T, Jin L, Li Y, Zhao Y, Li W, et al. Pure small-cell carcinoma of the prostate presenting with increasing prostate-specific antigen levels: a case report and review of the literature. Mol Clin Oncol. (2018) 9(2):197–200. doi: 10.3892/mco.2018.1644
18. Weprin S, Yonover P. Small cell carcinoma of the prostate: a case report and brief review of the literature. Urol Case Rep. (2017) 13:61–2. doi: 10.1016/j.eucr.2016.10.010
19. Whitaker DA J, Miller DH, Jagadesh N, Strong GW, Hintenlang L, Schenk WB, et al. Small cell carcinoma of the prostate in an elderly patient: a case report and review of the literature. Rare Tumors. (2016) 8(4):6657. doi: 10.4081/rt.2016.6657
20. Alves D, Calmeiro ME, Silva R, Coelho H. Small-cell neuroendocrine cancer of the prostate: an atypical presentation of a common disease. BMJ Case Rep (2016) 2016. doi: 10.1136/bcr-2016-216199. [online ahead of print]
21. Zhou Y, Lin C, Zhu L, Zhang R, Cheng L, Chang Y. Nomograms and scoring system for forecasting overall and cancer-specific survival of patients with prostate cancer. Cancer Med. (2022) 12(3):2600–13. doi: 10.1002/cam4.5137
22. Hou G, Zheng Y, Wei D, Li X, Wang F, Tian J, et al. Development and validation of a seer-based prognostic nomogram for patients with bone metastatic prostate cancer. Medicine. (2019) 98(39):e17197. doi: 10.1097/md.0000000000017197
23. Cuzick J, Thorat MA, Andriole G, Brawley OW, Brown PH, Culig Z, et al. Prevention and early detection of prostate cancer. Lancet Oncol. (2014) 15(11):e484–92. doi: 10.1016/s1470-2045(14)70211-6
24. Patel AR, Klein EA. Risk factors for prostate cancer. Nat Clin Pract Urol. (2009) 6(2):87–95. doi: 10.1038/ncpuro1290
25. Liu D, Kuai Y, Zhu R, Zhou C, Tao Y, Han W, et al. Prognosis of prostate cancer and bone metastasis pattern of patients: a seer-based study and a local hospital based study from China. Sci Rep. (2020) 10(1):9104. doi: 10.1038/s41598-020-64073-6
26. Mahal BA, Berman RA, Taplin ME, Huang FW. Prostate cancer-specific mortality across gleason scores in black vs nonblack men. JAMA. (2018) 320(23):2479–81. doi: 10.1001/jama.2018.11716
27. Wang J, Xu W, Mierxiati A, Huang Y, Wei Y, Lin G, et al. Low-serum prostate-specific antigen level predicts poor outcomes in patients with primary neuroendocrine prostate cancer. Prostate. (2019) 79(13):1563–71. doi: 10.1002/pros.23878
28. Akoto T, Saini S. Role of exosomes in prostate cancer metastasis. Int J Mol Sci. (2021) 22(7):3528. doi: 10.3390/ijms22073528
29. Mahal BA, Yang DD, Wang NQ, Alshalalfa M, Davicioni E, Choeurng V, et al. Clinical and genomic characterization of low-prostate-specific antigen, high-grade prostate cancer. Eur Urol. (2018) 74(2):146–54. doi: 10.1016/j.eururo.2018.01.043
30. Cheng L, Montironi R, Bostwick DG, Lopez-Beltran A, Berney DM. Staging of prostate cancer. Histopathology. (2012) 60(1):87–117. doi: 10.1111/j.1365-2559.2011.04025.x
31. Nguyen NP, Davis R, Bose SR, Dutta S, Vinh-Hung V, Chi A, et al. Potential applications of image-guided radiotherapy for radiation dose escalation in patients with early stage high-risk prostate cancer. Front Oncol. (2015) 5:18. doi: 10.3389/fonc.2015.00018
Keywords: SEER, neuroendocrine prostate cancer, nomogram, prognosis, overall survival, cancer-specific survival
Citation: Chen S, Xiong K, Shi J, Yao S, Wang G, Qian K and Wang X (2023) Development and validation of a prognostic nomogram for neuroendocrine prostate cancer, based on the SEER database. Front. Surg. 10:1110040. doi: 10.3389/fsurg.2023.1110040
Received: 28 November 2022; Accepted: 21 February 2023;
Published: 10 March 2023.
Edited by:
Sharanjot Saini, University of California, United StatesReviewed by:
Zhaoxia Zhang, Chongqing Medical University, ChinaAndrey O. Morozov, I.M. Sechenov First Moscow State Medical University, Russia
© 2023 Chen, Xiong, Shi, Yao, Wang, Qian and Wang. This is an open-access article distributed under the terms of the Creative Commons Attribution License (CC BY). The use, distribution or reproduction in other forums is permitted, provided the original author(s) and the copyright owner(s) are credited and that the original publication in this journal is cited, in accordance with accepted academic practice. No use, distribution or reproduction is permitted which does not comply with these terms.
*Correspondence: Kaiyu Qian qky1009@whu.edu.cn Gang Wang gangwang.uro@whu.edu.cn Xinghuan Wang wangxinghuan@whu.edu.cn
†These authors have contributed equally to this work
Specialty Section: This article was submitted to Genitourinary Surgery, a section of the journal Frontiers in Surgery