Spatio-temporal variability of climatic variables and its impacts on rice yield in Bangladesh
 Md. Abdullah Al Mamun1
  Sheikh Arafat Islam Nihad2
  Md. Abdur Rouf Sarkar3,4* Mou Rani Sarker5 Jitka Skalicka6
  Milan Skalicky7
- 1Agricultural Statistics Division, Bangladesh Rice Research Institute, Gazipur, Bangladesh
- 2Plant Pathology Division, Bangladesh Rice Research Institute, Gazipur, Bangladesh
- 3Agricultural Economics Division, Bangladesh Rice Research Institute, Gazipur, Bangladesh
- 4School of Economics, Zhongnan University of Economics and Law, Wuhan, China
- 5Sustainable Impacts Platform, International Rice Research Institute, Dhaka, Bangladesh
- 6Department of Landscape Architecture, Faculty of Agrobiology, Food and Natural Resources, Czech University of Life Sciences Prague, Prague, Czechia
- 7Department of Botany and Plant Physiology, Faculty of Agrobiology, Food and Natural Resources, Czech University of Life Sciences Prague, Prague, Czechia
Bangladesh is a significant contributor to the global food basket but is also one of the most vulnerable countries to climate change. Understanding regional climatic variability helps reduce climate risks and ensure food security. This research examined monthly, seasonal, and yearly temperature, rainfall, and relative humidity in Bangladesh using data from 35 meteorological stations from 1970–2020. The study utilized the Mann–Kendall method to evaluate trends and employed Sen’s slope to quantify their magnitude. Additionally, quantile regression was applied to analyze the impact of climatic variables on rice yield. The findings revealed that maximum (Tmax) and minimum (Tmin) temperatures were steadily increasing, with the southwest experiencing a more rapid rise compared to other regions in Bangladesh. Seasonal Tmax and Tmin rose in most parts of Bangladesh, particularly during the monsoon. In most areas, there was a significant (p < 0.05) increase in Tmax from June to September and Tmin in December. The variability of minimum temperature was considerably affected by warming throughout the country. The eastern area had the most significant (p < 0.05) annual rainfall increase rate, while the northern region had the lowest. There was evidence of inter-seasonal rainfall shipment, with post-monsoon rainfall rising compared to monsoon season. The quantile regression showed that the rice yield of Aus (summer) and Aman (wet) seasons were influenced by maximum temperature and relative humidity, whereas the rice yield of the Boro (dry) season was affected by maximum temperature, rainfall, and relative humidity. Across geographical segmentation, the regression analysis indicated a high level of variability in the northern climate. Overall, the intensity of mean temperature increased throughout the country. So, there is a need to develop heat or drought-resistant rice varieties and modernized irrigation facilities to mitigate these climate risks. However, farmers should employ automated weather-based advisory services for sustaining rice productivity and food security.
1 Introduction
The impacts of climate change are one of the most pressing concerns for global food security (Schmidhuber and Tubiello, 2007; Wheeler and von Braun, 2013; Raj et al., 2022). Climate change is likely to alter long-term rainfall patterns, temperature, and relative humidity, which are the prime variables to measure the climate of a given region. Each of these variables plays a crucial role in agricultural productivity, and a slight change in any one of them can significantly reduce crop yields (Zhao et al., 2017). Rising temperature and precipitation uncertainties are projected to impact agricultural production adversely (IPCC IPOCC, 2007; Fisher et al., 2015). Changes in rainfall trends, rising temperatures, floods, droughts, salinity, etc., are projected to reduce rice and wheat production by 8 and 23 per cent in 2050, respectively, compared to the baseline production values in 1990 (Cancelliere et al., 2007). Like other countries, Bangladesh is not beyond the threat of climate change, and it is predicted that Bangladesh is one of the world’s most vulnerable countries to climate change (Nagabhatla et al., 2014; Rahman et al., 2022).
Bangladesh has over 160 million people, with more than 1,44,000 km2 of land area. Agriculture significantly contributes to the country’s economic growth, accounting for 16.33% of the gross domestic product (GDP) and employing more than 53% of the population (Rahman et al., 2017). Kabir et al. (2016) predicted that the population of Bangladesh would reach 215.4 million by 2050. They highlighted that reduced crop productivity, caused by biotic factors such as insects, diseases, and rats, as well as abiotic stresses like drought, salinity, and floods, along with decreasing cultivable land, will hinder the food security of this population. Therefore, studies are required to better understand the magnitude of climate change in Bangladesh and influence policy and decision-makers to take necessary action to reduce the impacts of climate change on agricultural production in Bangladesh.
Moreover, the crucial role of environmental factors, particularly rainfall, in shaping agricultural productivity has been widely recognized (Amare et al., 2018). Notably, the evolving rainfall patterns globally and regionally due to climate change have profoundly affected Bangladesh (Hulme and Viner, 1998; Dore, 2005; Kayano and Sanságolo, 2009; Gemmer et al., 2011), leading to unprecedented dry and wet periods over the last three and a half decades (Shahid and Behrawan, 2008; Al Mamun et al., 2018). These fluctuations have resulted in adverse consequences, for example, in 1994–1995, drought reduced rice and wheat production by 3.5 × 10⁶ MT (Habiba et al., 2011), and heavy rainfall during 2007 caused a severe flood that affected more than 9 million people in the country. In 2019–2020, the rice production loss due to natural calamities in Bangladesh was 1,11,289 MT (BBS, 2021).
Furthermore, the intricate interplay between temperature and crop production has been well-established, as demonstrated by research on the regulation of crucial physiological processes by temperature, such as photosynthesis, evapotranspiration, respiration, and grain filling (Griffin et al., 2004; Oh-e et al., 2007; Kang et al., 2009). In Bangladesh, the average temperature in the winter (November to February) is 7.20°C to 12.80°C and in the summer months (May to July) is 23.90°C to 31.10° (Shahid, 2010). However, temperature and rainfall intensity are changing due to climate change, which is responsible for the vast economic loss of the farmers and the country.
Similarly, relative humidity is another critical variable that indirectly affects crop production and is mainly related to rainfall and temperature. High relative humidity favours disease and insect incidence and reduces crop productivity by reducing proper nutrient and water uptake through the transpiration channel (Tho et al., 2019). Contrarily, low humidity and sunny days may cause plant leaves to wilt and plants death in severe water shortage conditions.
The significance of comprehensive studies on climate change cannot be overstated, as underscored by the Intergovernmental Panel on Climate Change (IPCC), which emphasizes the need for detailed assessments on regional and local scales to build resilience against an array of potential environmental hazards. Thorough investigations into the spatiotemporal dynamics of Bangladesh’s climate, drawing on extensive observational data, can facilitate the identification of climate variability within the country. Additionally, such studies can play a pivotal role in shaping policymaker decisions, enabling the implementation of measures aimed at mitigating the adverse effects of climate change on agricultural production. While some research has investigated short-term trends in climatic parameters, particularly rainfall, temperature, and humidity in Bangladesh (Ahmed and Karmakar, 1993; Hasan et al., 2014; Bhuyan et al., 2018; Rakib, 2018; Mullick et al., 2019), long-term analyses assessing historical trends and their implications for crop productivity remain scarce, as exemplified by the limited studies available on this subject (Shahid, 2010; Hasan et al., 2014; Rahman et al., 2017; Uddin et al., 2020).
In response to these gaps, this study endeavors to fill the void by conducting a comprehensive assessment of 51 years’ worth of time-series data spanning 1970 to 2020. By analyzing data from all 35 meteorological stations, the study aims to provide a detailed understanding of the spatio-temporal variations in Bangladesh’s climate, shedding light on the multifaceted impacts of climate variables, including temperature, rainfall, and relative humidity, on rice yield in the region.
The article is organized into five sections. The second section outlines the methodology following the introduction. In the third section, the study findings are presented, encompassing the trends of meteorological parameters and their impacts on rice yield. The fourth section offers discussions on the research findings. Finally, the last section of the article provides conclusions and policy recommendations.
2 Methodology
2.1 Study area
The climate of Bangladesh is humid subtropical, categorized with significant seasonal variations in rainfall, moderately warm temperatures, and high humidity (Rashid, 2019; Rahman et al., 2023). Bangladesh, however, is one of the most vulnerable countries to climate change due to its geographical position (Harmeling and Röse, 2010; Nagabhatla et al., 2014; Rahman et al., 2022). To measure the variability of climate variables and their impacts on rice production, Bangladesh is divided into four representative regions: central (CR), northern (NR), southwestern (SWR), and eastern (ER) (Figure 1).
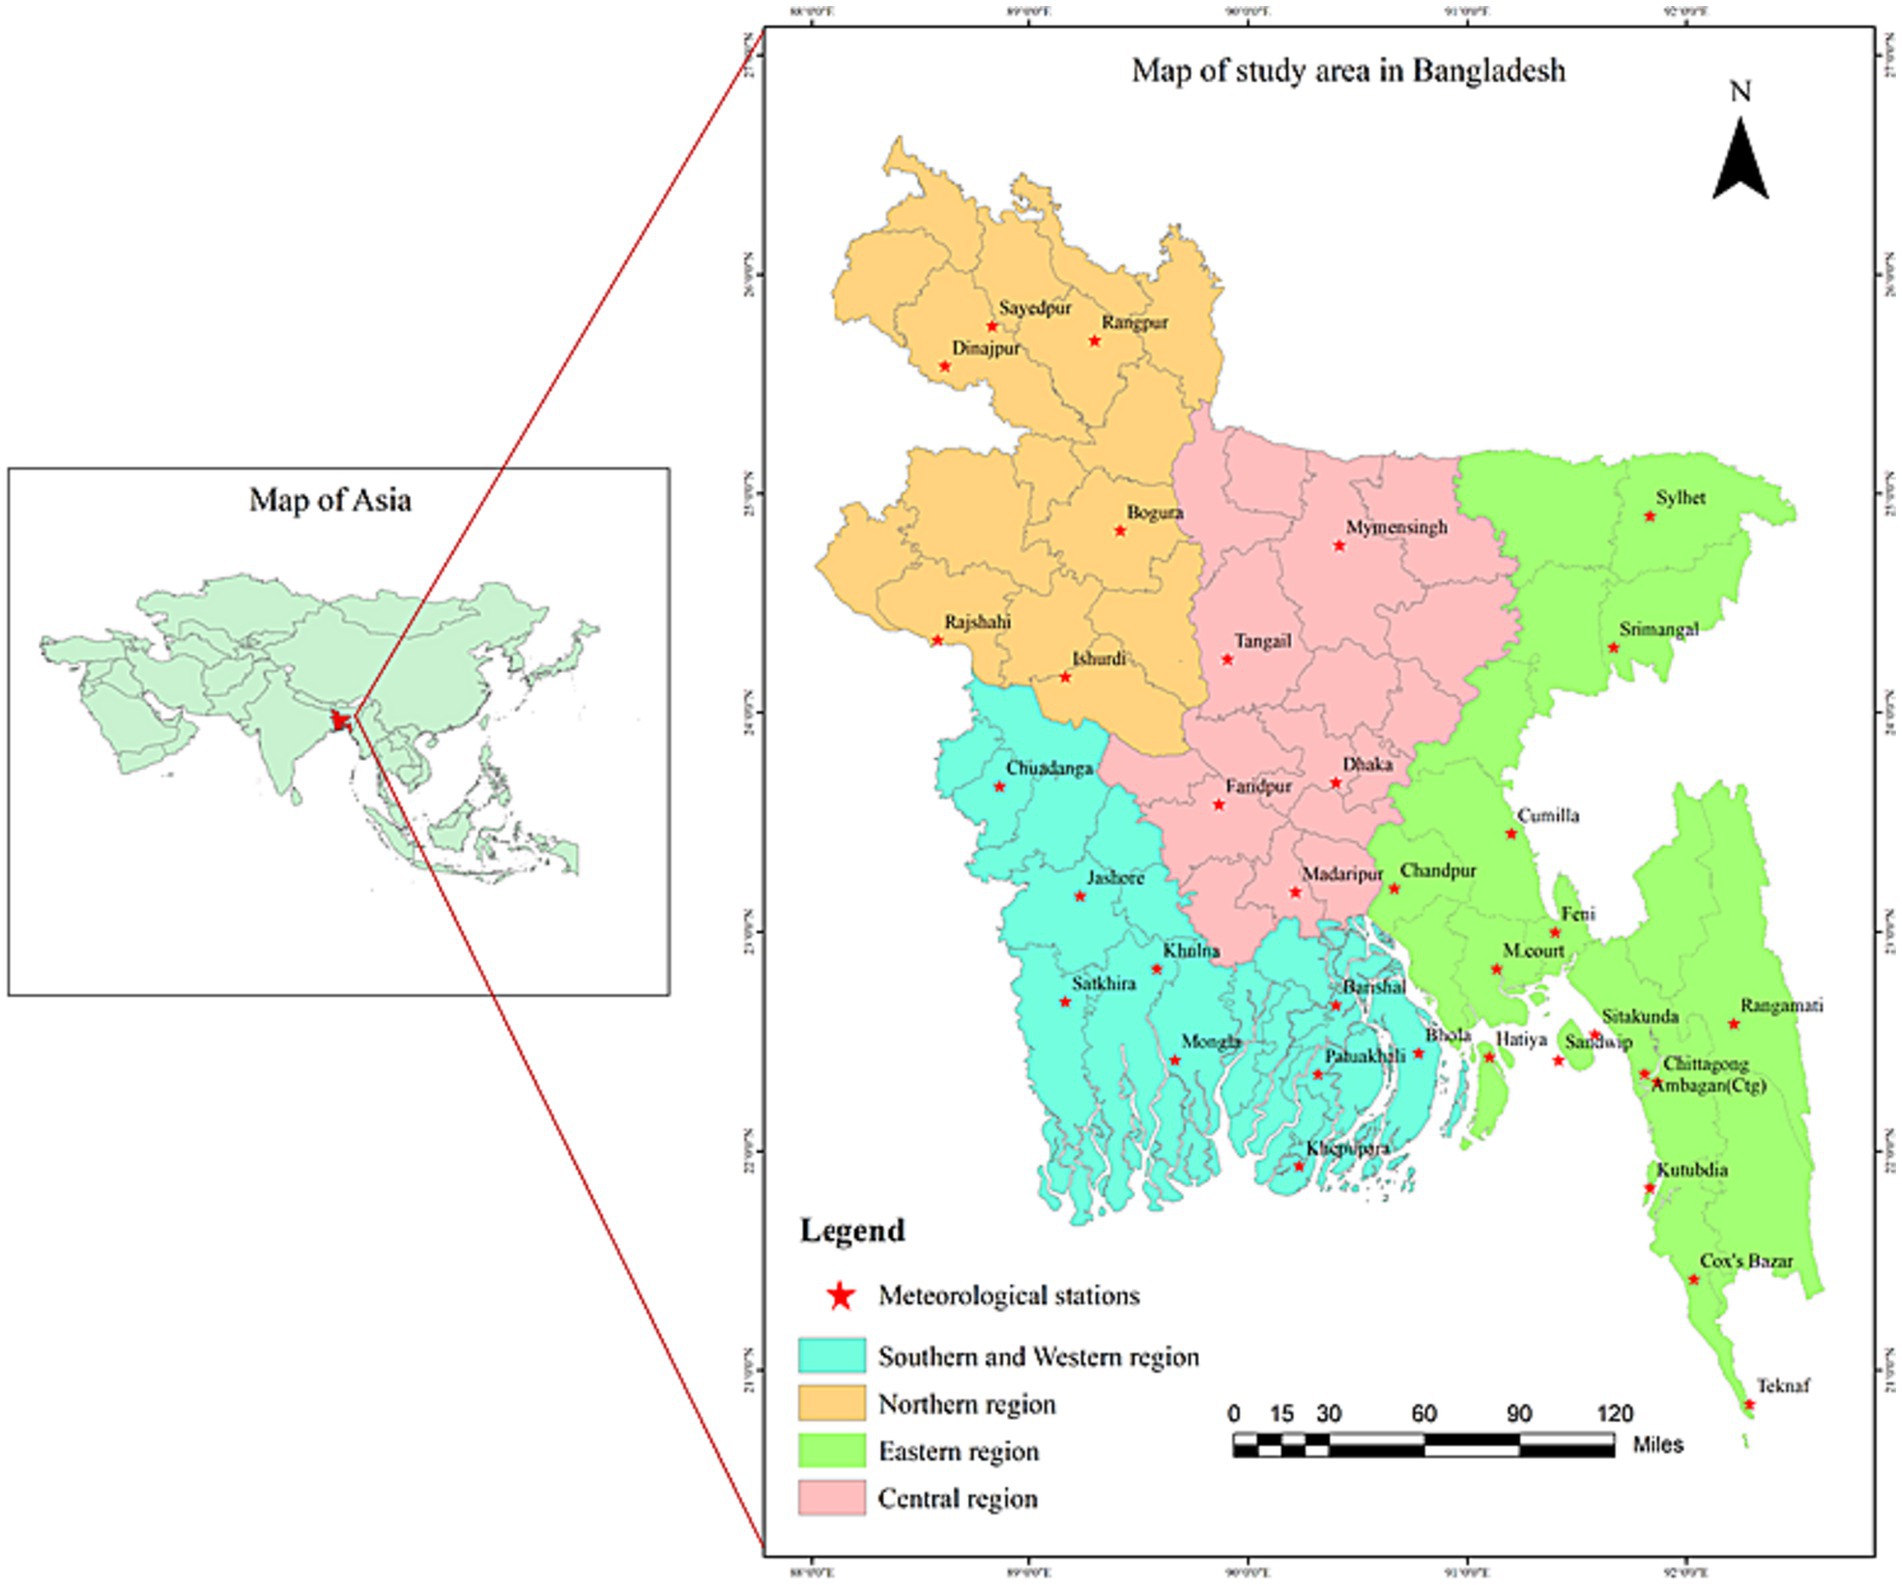
Figure 1. Map of the study area and distribution of meteorological weather stations of Bangladesh.
2.2 Data used
A dataset consisting of 51 years (1970–2020) of rainfall, relative humidity, maximum temperature (Tmax), and minimum temperature (Tmin) was collected from the Bangladesh Meteorological Department (BMD). Data from 35 weather stations (Figure 1) were utilized in this study. The data were purposively subdivided into four periods: 1970–1981 (Period I or P-I), 1982–1993 (Period II or P-II), 1994–2005 (Period III or P-III), and 2006–2020 (Period IV or P-IV) to see the periodic changes of climatic parameters over time. The mean of each month over the 51 years was used to estimate the monthly distribution pattern of each parameter. The climate of Bangladesh can be divided into four seasons: pre-monsoon (March–May), monsoon (June–September), post-monsoon (October–November), and winter (December–February). Seasonal variability was calculated by taking the mean of the monthly averages corresponding to each respective season. Monthly averages were then used to calculate each station’s annual mean, and the standard of all stations within a region was used to assess regional variation. The rice growing season varies across the different regions of Bangladesh, primarily due to differences in climatic conditions. Bangladesh has three rice-growing seasons: Aus (summer), Aman (wet), and Boro (dry). Rice varieties of Aus season are typically sown in late March or April and harvested from mid-July to August; the Aman variety is usually planted from late June to August and harvested in November or December, and Boro is typically sown in December and harvested in May or June (BRRI, 2020; BBS, 2021).
2.3 Trend analysis
Trends are identified using the non-parametric Mann–Kendall test to evaluate the statistical significance of a trend deviating from zero. Additionally, Sen’s method (Sen, 1968) is applied to assess the increasing or decreasing slope of trends in the time series of monthly, seasonal, and annual maximum temperature, minimum temperature, rainfall, and relative humidity. The Mann–Kendall test involves comparing each value in the time series for both the entire period (1970–2020) and the four periods, allowing for the determination of the magnitude and significance of trends relative to others while maintaining sequential order. Sen’s slope method (Sen, 1968; Gilbert, 1988) was utilized to determine the trends, and the Mann–Kendall trend test (Mann, 1945; Kendall, 1957) was employed to identify the presence of statistically significant trends.
2.3.1 Mann–Kendall test
The Mann–Kendall (MK) test is commonly used when several data adequacy do not obey a normal distribution to evaluate the trend of hydrological and meteorological time series data (Cancelliere et al., 2007; Kampata et al., 2008; Tabari et al., 2011). MK test determines time series data’s monotonic (expanding and diminishing) movement. It is even applicable in case of some missing data that does not have to fit into any statistical distribution (Gilbert, 1988; Libiseller and Grimvall, 2002). MK test is a robust and straightforward nonparametric test with a statistic based on positive or negative signs (Helsel and Hirsch, 1992; Birsan et al., 2005). The MK test statistic (S) is given by:
where n is the number of data, X is the data point at times i and k (k > i), and the sign function is given as:
where the sample size n is greater than 10, the S statistic is considered to be asymptotically normal, with E(S) = 0, and the variance of S, i.e., V(S) is calculated by
Here, T denotes the size of any given tie, and T represents the total number of relations. A link occurs when the sample data has the same value and the total matches. The following equation is used to calculate the standard average deviation Z (Partal and Kahya, 2006).
The Z value is used to determine if a statistically significant pattern exists. If [Z] > Zα/2, at the significance level in a two-sided trend test, the null hypothesis H0 should be accepted. This study examined the null hypothesis at a 95% confidence level.
2.3.2 Sen’s slope
To estimate the magnitude of a time series pattern, Sen’s slope model has been widely used (Partal and Kahya, 2006). Sen’s slope is more robust than traditional regression slopes since it is unaffected by outliers or incomplete data. It accurately estimates the time series data (Hirsch et al., 1982). The method entails computing slopes for all pairs of ordinal time points and calculating the overall slope using the median of these slopes (Sen, 1968; Gilbert, 1988). For N pairs of data, the slope estimates Qk is determined using the following formula:
where, Xi and Xj are data values at times i and j (i > j), respectively, the median of these N values of Qk is Sen’s slope estimator. If each period has only one datum, then N = n(n1)/2, where n denotes the number of periods. The N values of slopes are ranked from the smallest to largest, and Sen’s estimator is calculated as:
If N is odd,
If N is even,
A positive Q value indicates an upward (increasing) trend in the time series, while a negative value indicates a downward (decreasing) trend. The analyses were performed in the “wql” and “ggplot2” packages of programming R version 4.0.5.
2.4 Regression analysis
To examine the effect of climatic variables on rice yield as the dependent variable, we have used four climate variables (maximum temperature, minimum temperature, relative humidity, and rainfall) as independent variables by averaging the respective months for respective seasons. Earlier studies used different periods, such as months, phonological periods, and growing seasons, to assess climate variables’ impacts on crop production (Ozkan and Akcaoz, 2002; Lobell et al., 2007; Almaraz et al., 2008). When the dependent variable has a normally distributed distribution, the ordinary least square (OLS) method is used; however, when the variable has a non-normal distribution, the quantile or median regression (QR) approach performs better (Sarker et al., 2013). It has been shown that the QR (median) regression is more robust to outliers than the mean regression (OLS) (Sarker et al., 2013). Moreover, quantile or median regression is appropriate for heteroscedastic data and may be used to adjust a model for the issue of heteroscedasticity that has been introduced (Koenker and Bassett, 1978; Benhin, 2008; Cameron and Trivedi, 2010).
The analyses were performed in the “wql” and “ggplot2” packages of programming R version 4.0.5 (Jassby and Cloern, 2022). Histograms revealed the data were not normally distributed, which was corrected by using quantile-regression (Sarker et al., 2013).
Median regression (at the 0.5 quantiles) was selected for the Aus, Aman, and Boro rice to estimate the central tendency of our data. Therefore, to assess the effects of climate variables on the rice yields (Aus, Aman, and Boro), the following regression models are employed:
where Yt is the yield for Aus, Aman and Boro rice (in metric tons per hectare), is the average maximum temperature (°C), is the average minimum temperature (°C); RHt is the average relative humidity (%), and Raint is the total rainfall (mm) for Aus, Aman and Boro season, et is the error term and t is the time (i.e., year). Daily weather data has generated averaged data for all the independent variables. For respective independent variables, we used averaged data from May to August for Aus, June to December for Aman, and December to May for Boro season.
3 Results
3.1 Descriptive statistics
There was considerable variability in each climate parameter across the different regions (Figures 2, 3). In the central region, the highest magnitude of monthly average minimum temperature (28.1°C), monthly average maximum temperature (37.3°C), monthly total rainfall (1,351 mm), and monthly average relative humidity (93.3%) was found in P-III, P-II, P-II, and P-I, respectively. The lowest value of these parameters in those areas was recorded in P-III (9.5°C), P-I (20.8°C), entire period (EP) (0 mm), and P-II (47.6%), respectively. In the eastern region, the highest value of Tmin, Tmax, rainfall, and relative humidity was found in P-III (28.1°C), P-IV (37.3°C), P-III (3,001 mm), and P-III (97.1%), respectively (Supplementary Figures S1, S2). The lowest value was recorded in P-I (6.6°C), P-III (23.0°C), EP (0 mm), and P-I (49.9%). In the Northern region, the highest value of Tmin, Tmax, rainfall, and relative humidity was observed in P-III (27.5°C), P-I (39.9°C), P-II (1,314 mm), and P-I (93.9%). The lowest was observed in P-III (8.2°C), P-I (17.1°C), EP (0 mm), and P-I (39.8%). For the southwestern region, the highest value of Tmin (27.8°C), Tmax (39.3°C), rainfall (1,512 mm), and relative humidity (100%) was noticed in P-III and P-IV, P-II, P-II, and P-I, respectively. The lowermost value was detected in P-IV (8.6°C), P-III (21.9°C), EP (0 mm), and P-II (45.5%), respectively (Supplementary Figures S1, S2).
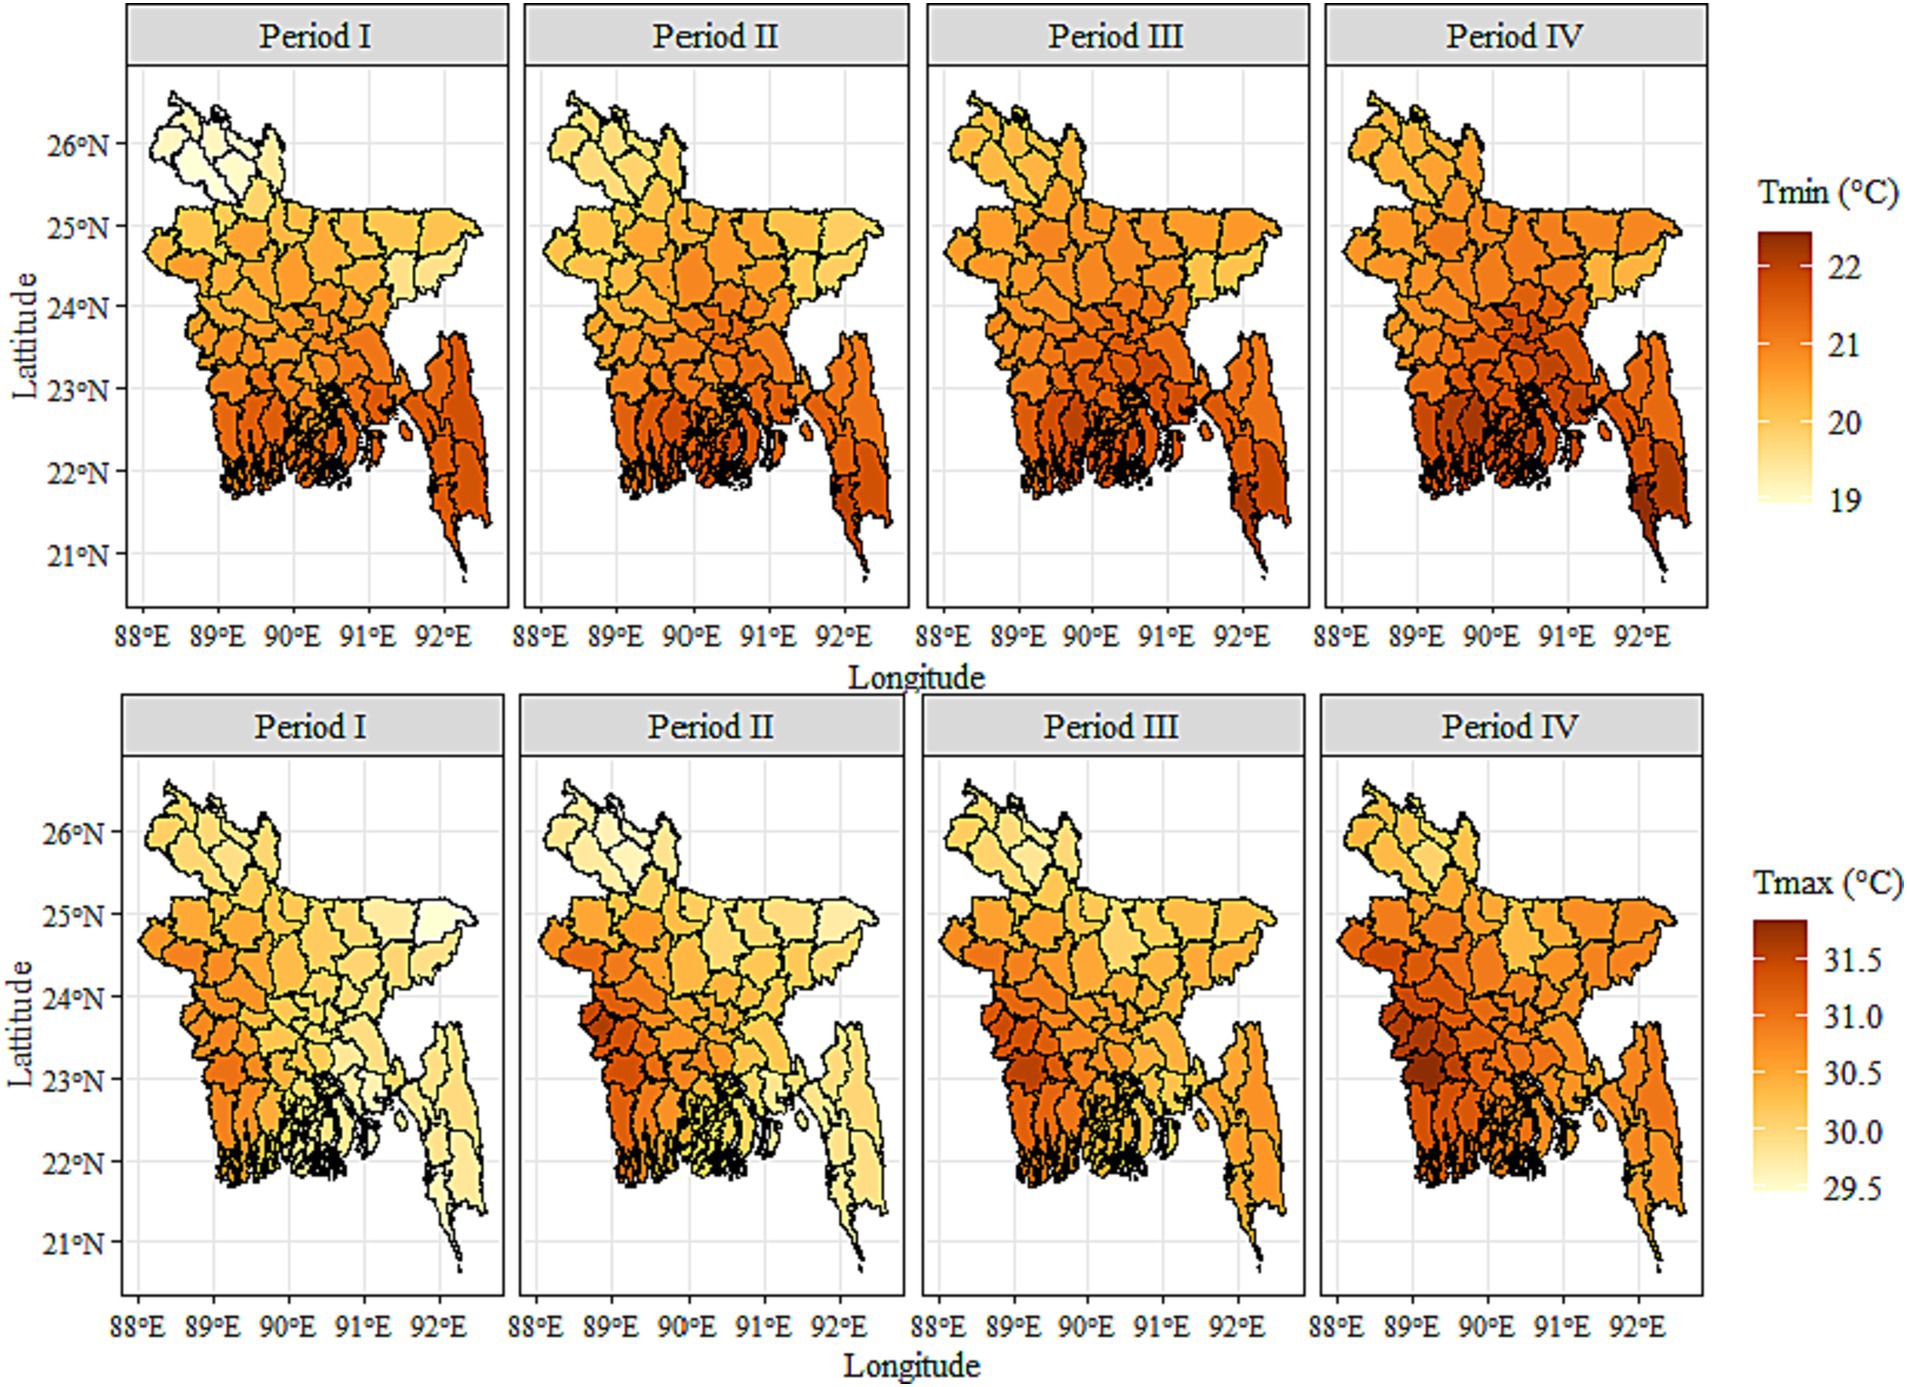
Figure 2. Spatial and temporal distribution of average minimum and maximum temperature of Bangladesh. Here, Period I = 1970–1981, Period II = 1982–1993, Period III = 1994–2005, Period IV = 2006–2020.
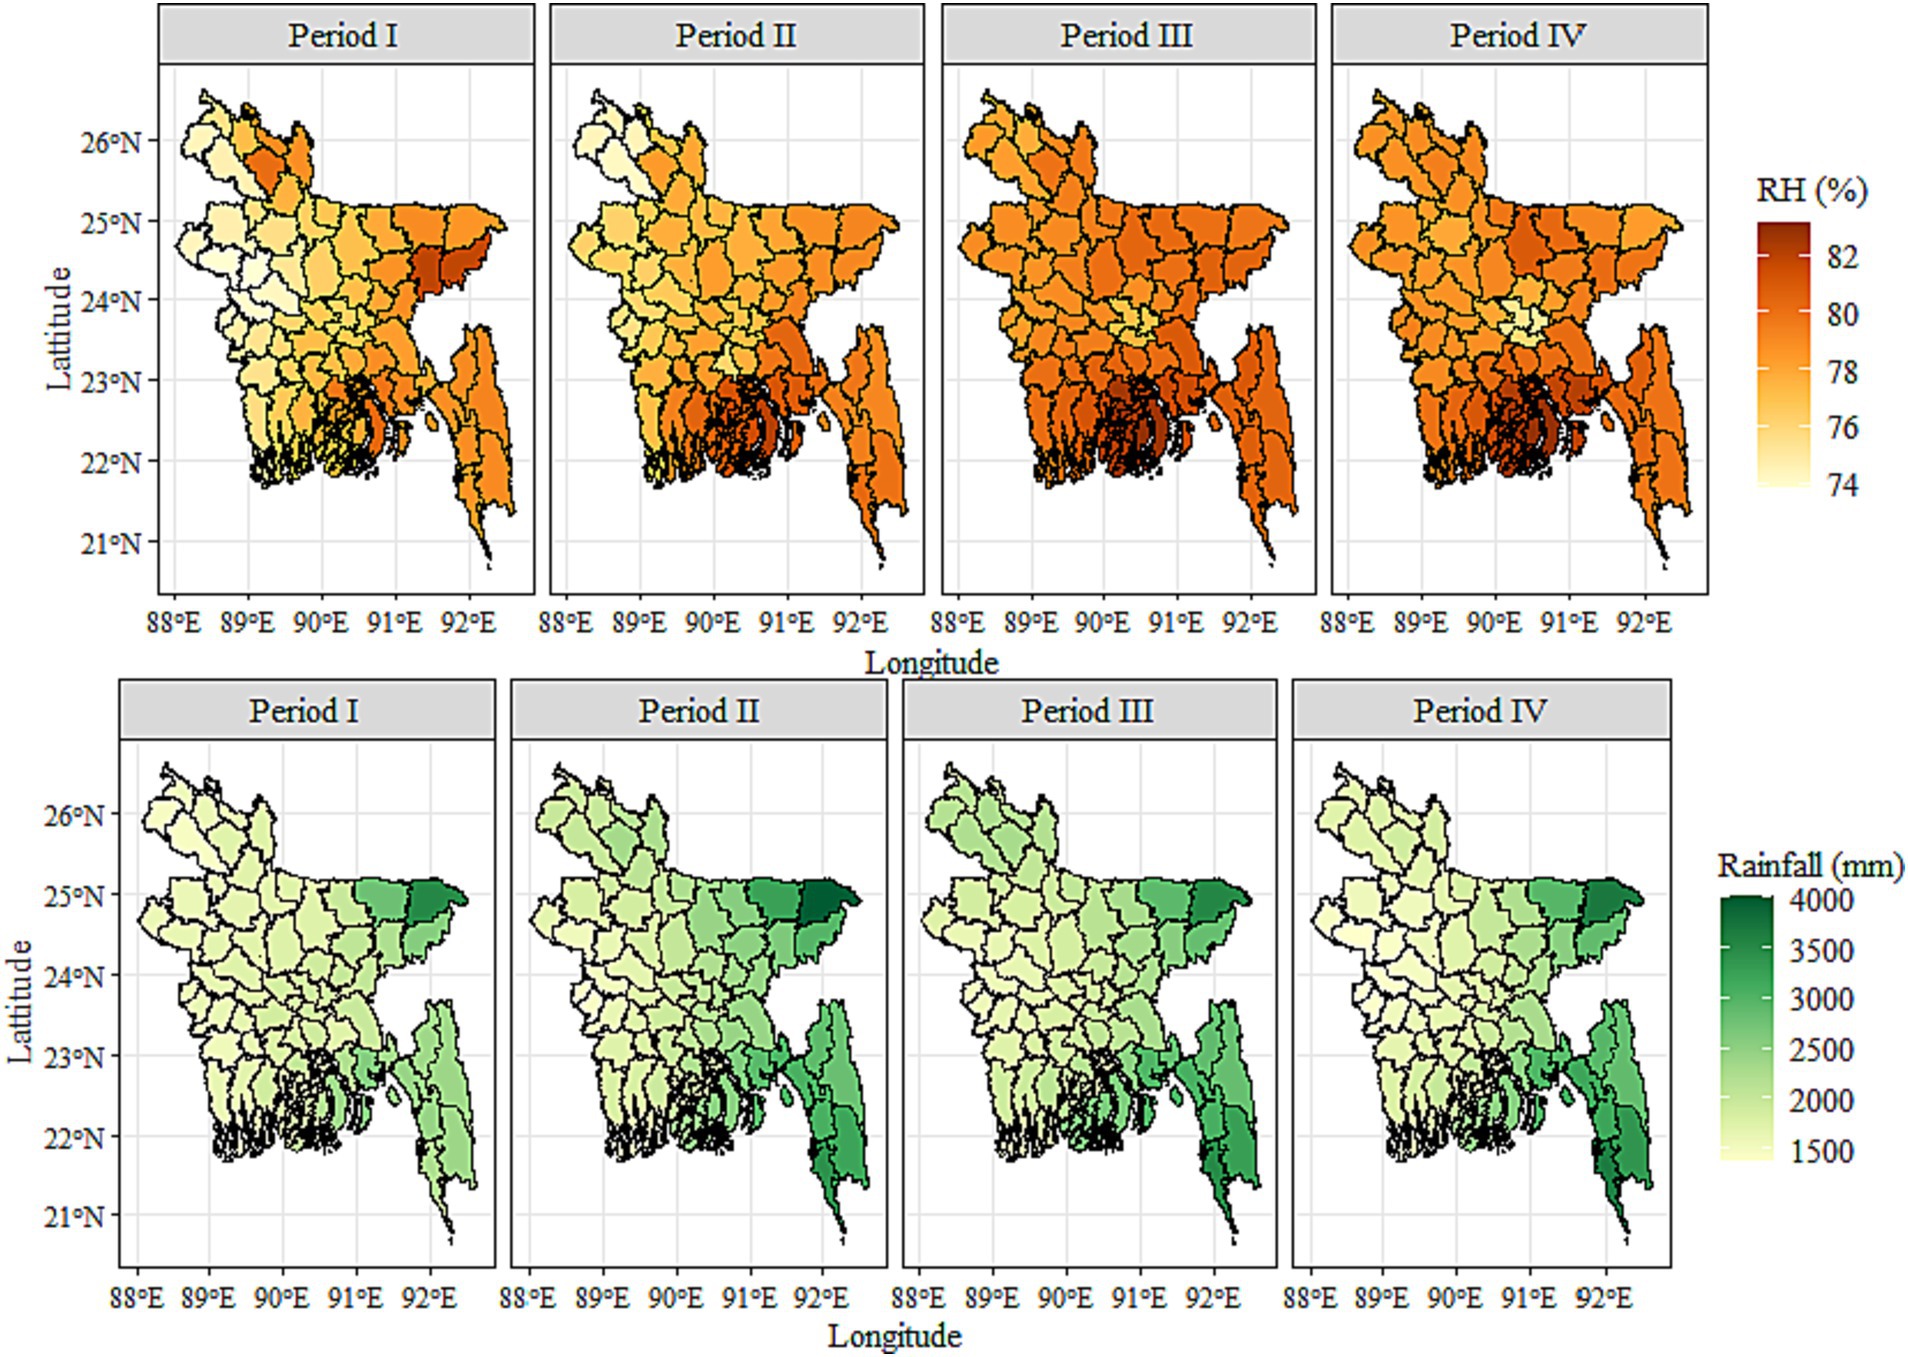
Figure 3. Spatial and temporal distribution of average relative humidity and average total rainfall of Bangladesh. Here, Period I = 1970–1981, Period II = 1982–1993, Period III = 1994–2005, Period IV = 2006–2020.
3.2 Climate variables
3.2.1 Monthly trend of maximum temperature, minimum temperature, rainfall, and relative humidity
The regional and periodic monthly trends of maximum temperature over Bangladesh (1970–2020) are presented in Table 1. The monthly mean Tmax in the central region showed an increasing trend for all months except January during the whole period (1970–2020). However, the rising trends were statistically significant (p < 0.05) for May, June, July, August, September, October, and November. The magnitudes of trends varied from 0.006°C to 0.046°C/year. Significant increasing trends (0.019°C to 0.041°C/year, p < 0.05) were found in the eastern region for all months. In the northern part, a significant decreasing trend was found for January (−0.041°C/year, p < 0.05) and April (−0.056°C/year, p < 0.05), and important increasing trends (0.014 to 0.035°C/year) were found for June to November. The southwestern and central regions saw a positive increasing trend for all months except January. All parts’ trend magnitudes varied from −0.014 to 0.046°C/year from 1970 to 2020 (Table 1). The significant highest (0.046°C/year, p < 0.05) and the lowest (−0.056°C/year, p < 0.05) warming trend was found in May of southwestern and in April of the northern region, respectively.
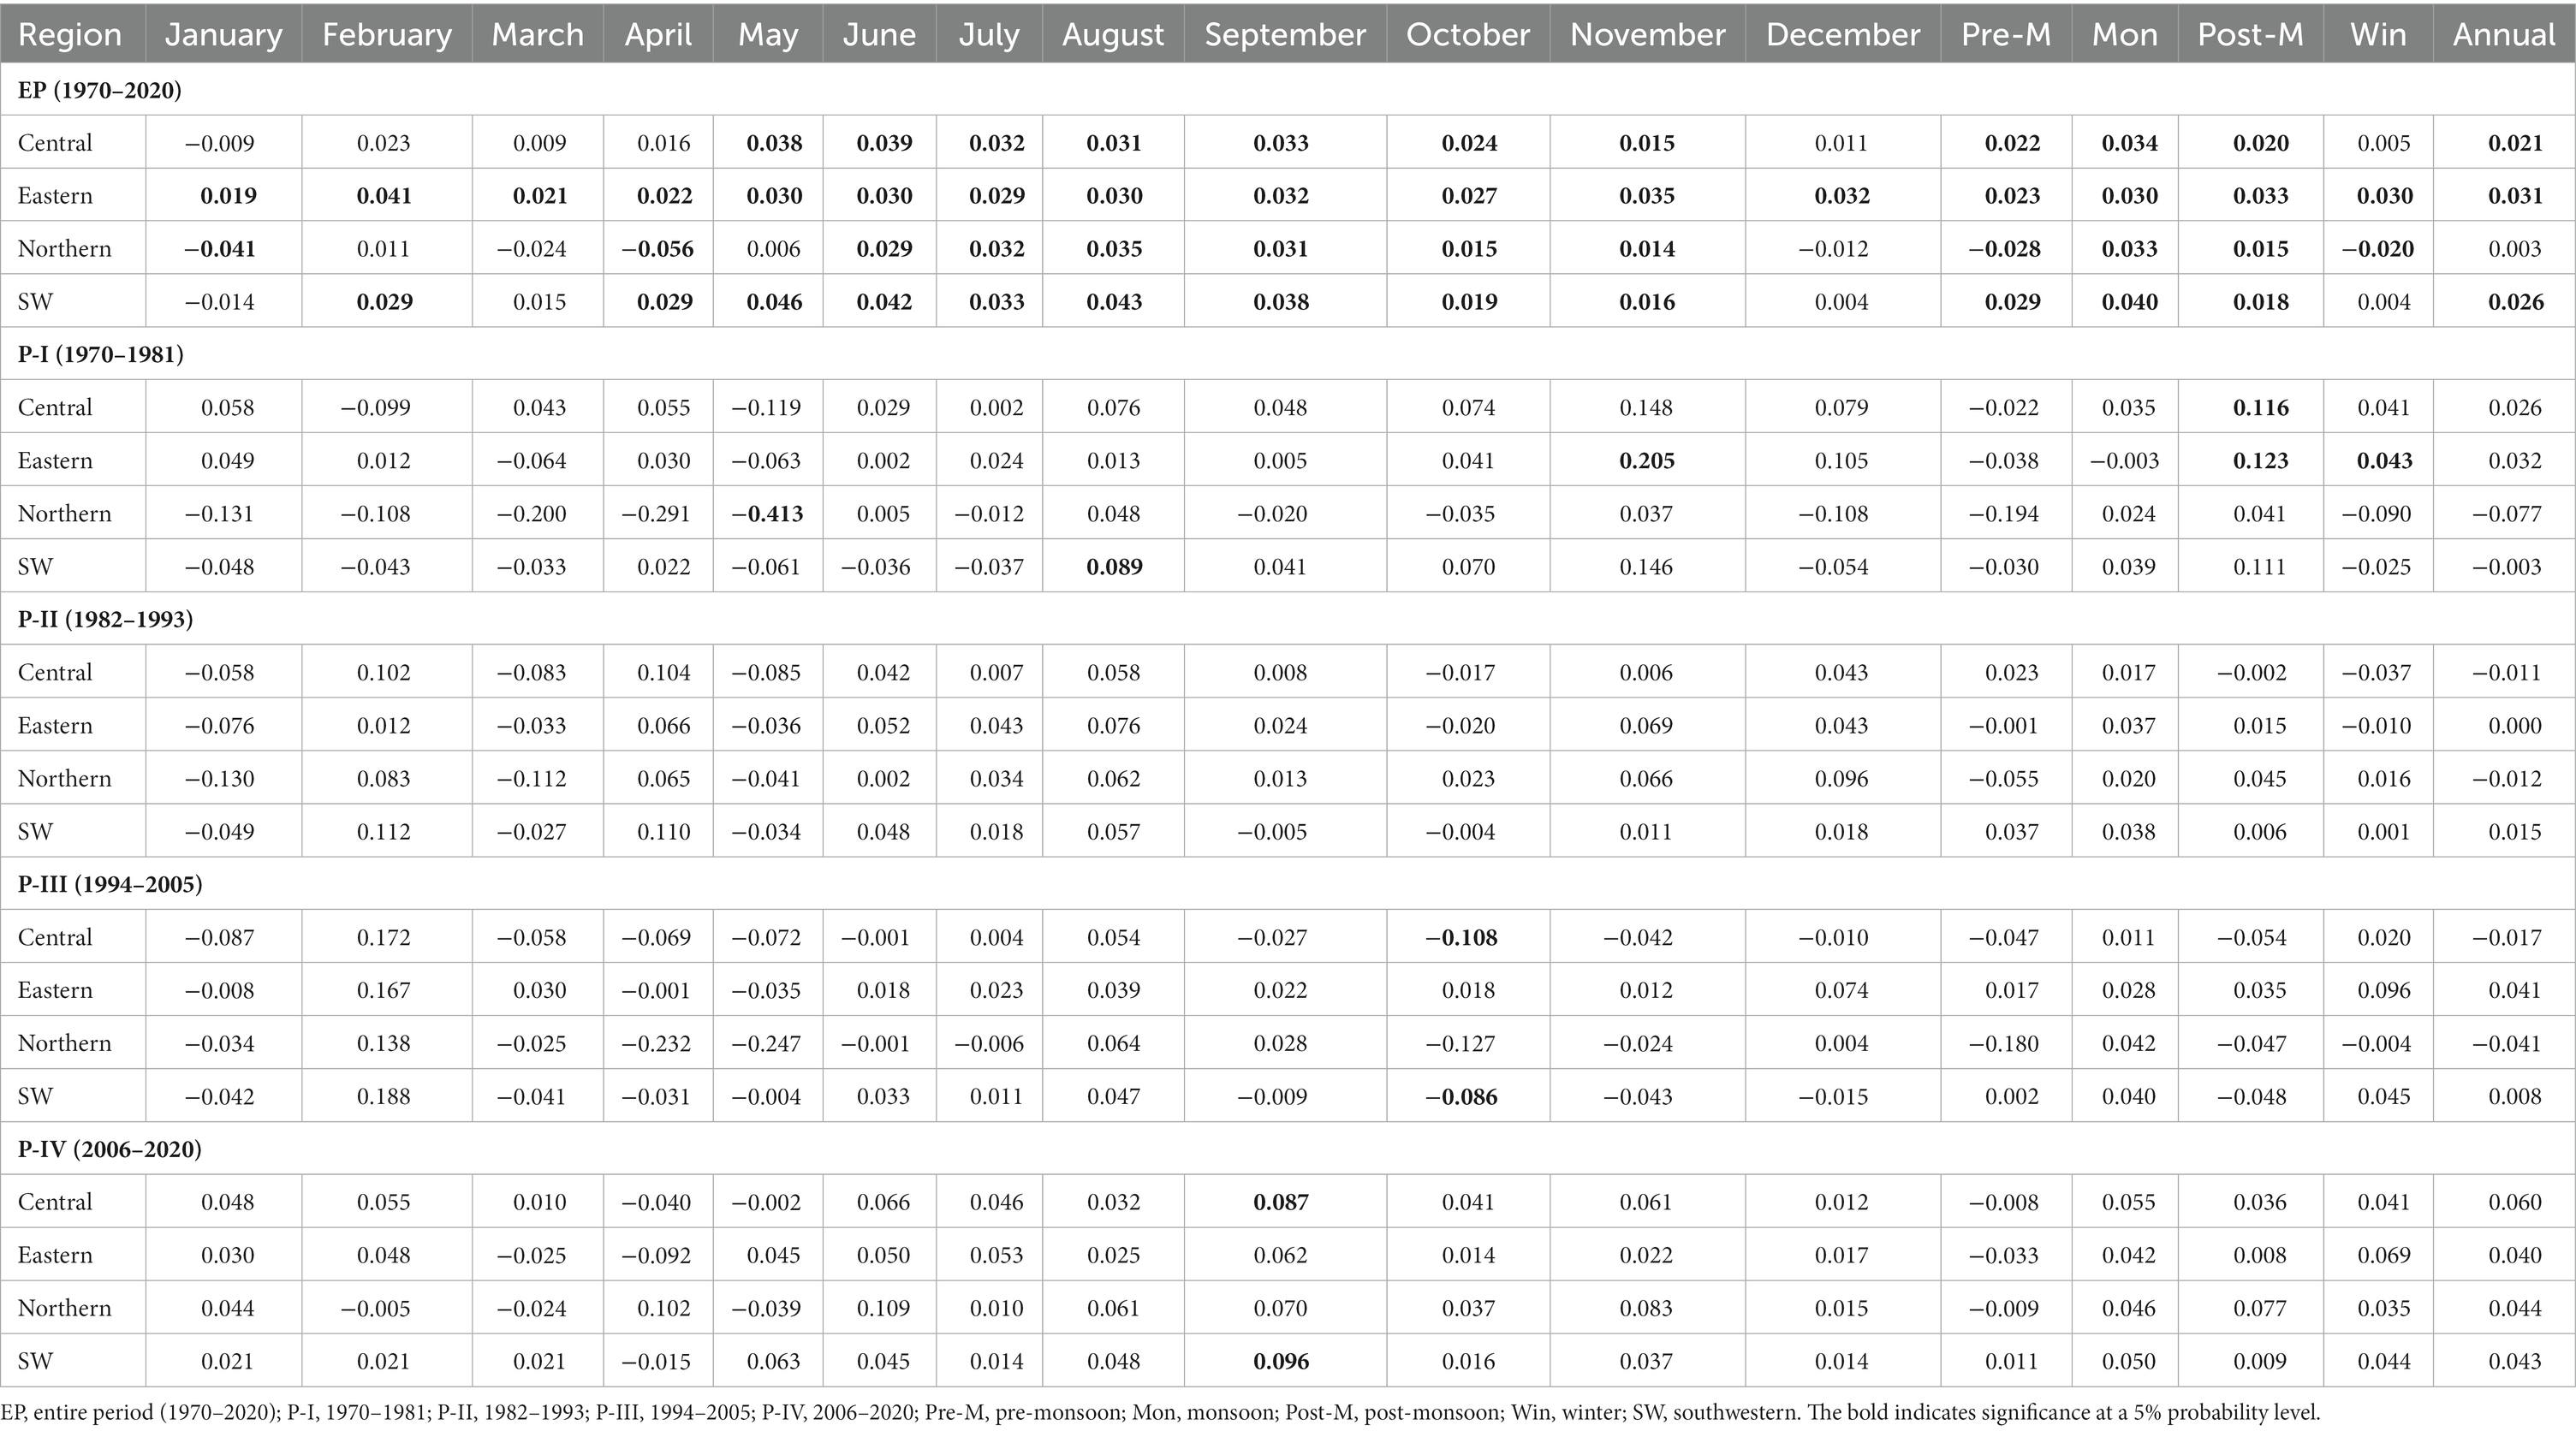
Table 1. Monthly, seasonal, and annual maximum temperature trend of Bangladesh.
Except for January, April, October, and November, the rest of the months of the central region showed a significantly (p < 0.05) increasing trend of Tmin ranging from 0.02 to 0.031°C/year (Table 2). In the eastern part, positive trends (0.006°C to 0.019°C/year) were found for all months except November (−0.009°C/year). Significant (p < 0.05) increasing trends were noticed in the eastern region from May to September and December. The northern region showed a positive direction for all months, and the months of February, March, June to September, and December month followed a significant increasing trend (0.013°C to 0.034°C/year, p < 0.05). For the southwestern region, significant (p < 0.05) trends were found in April to September and December.
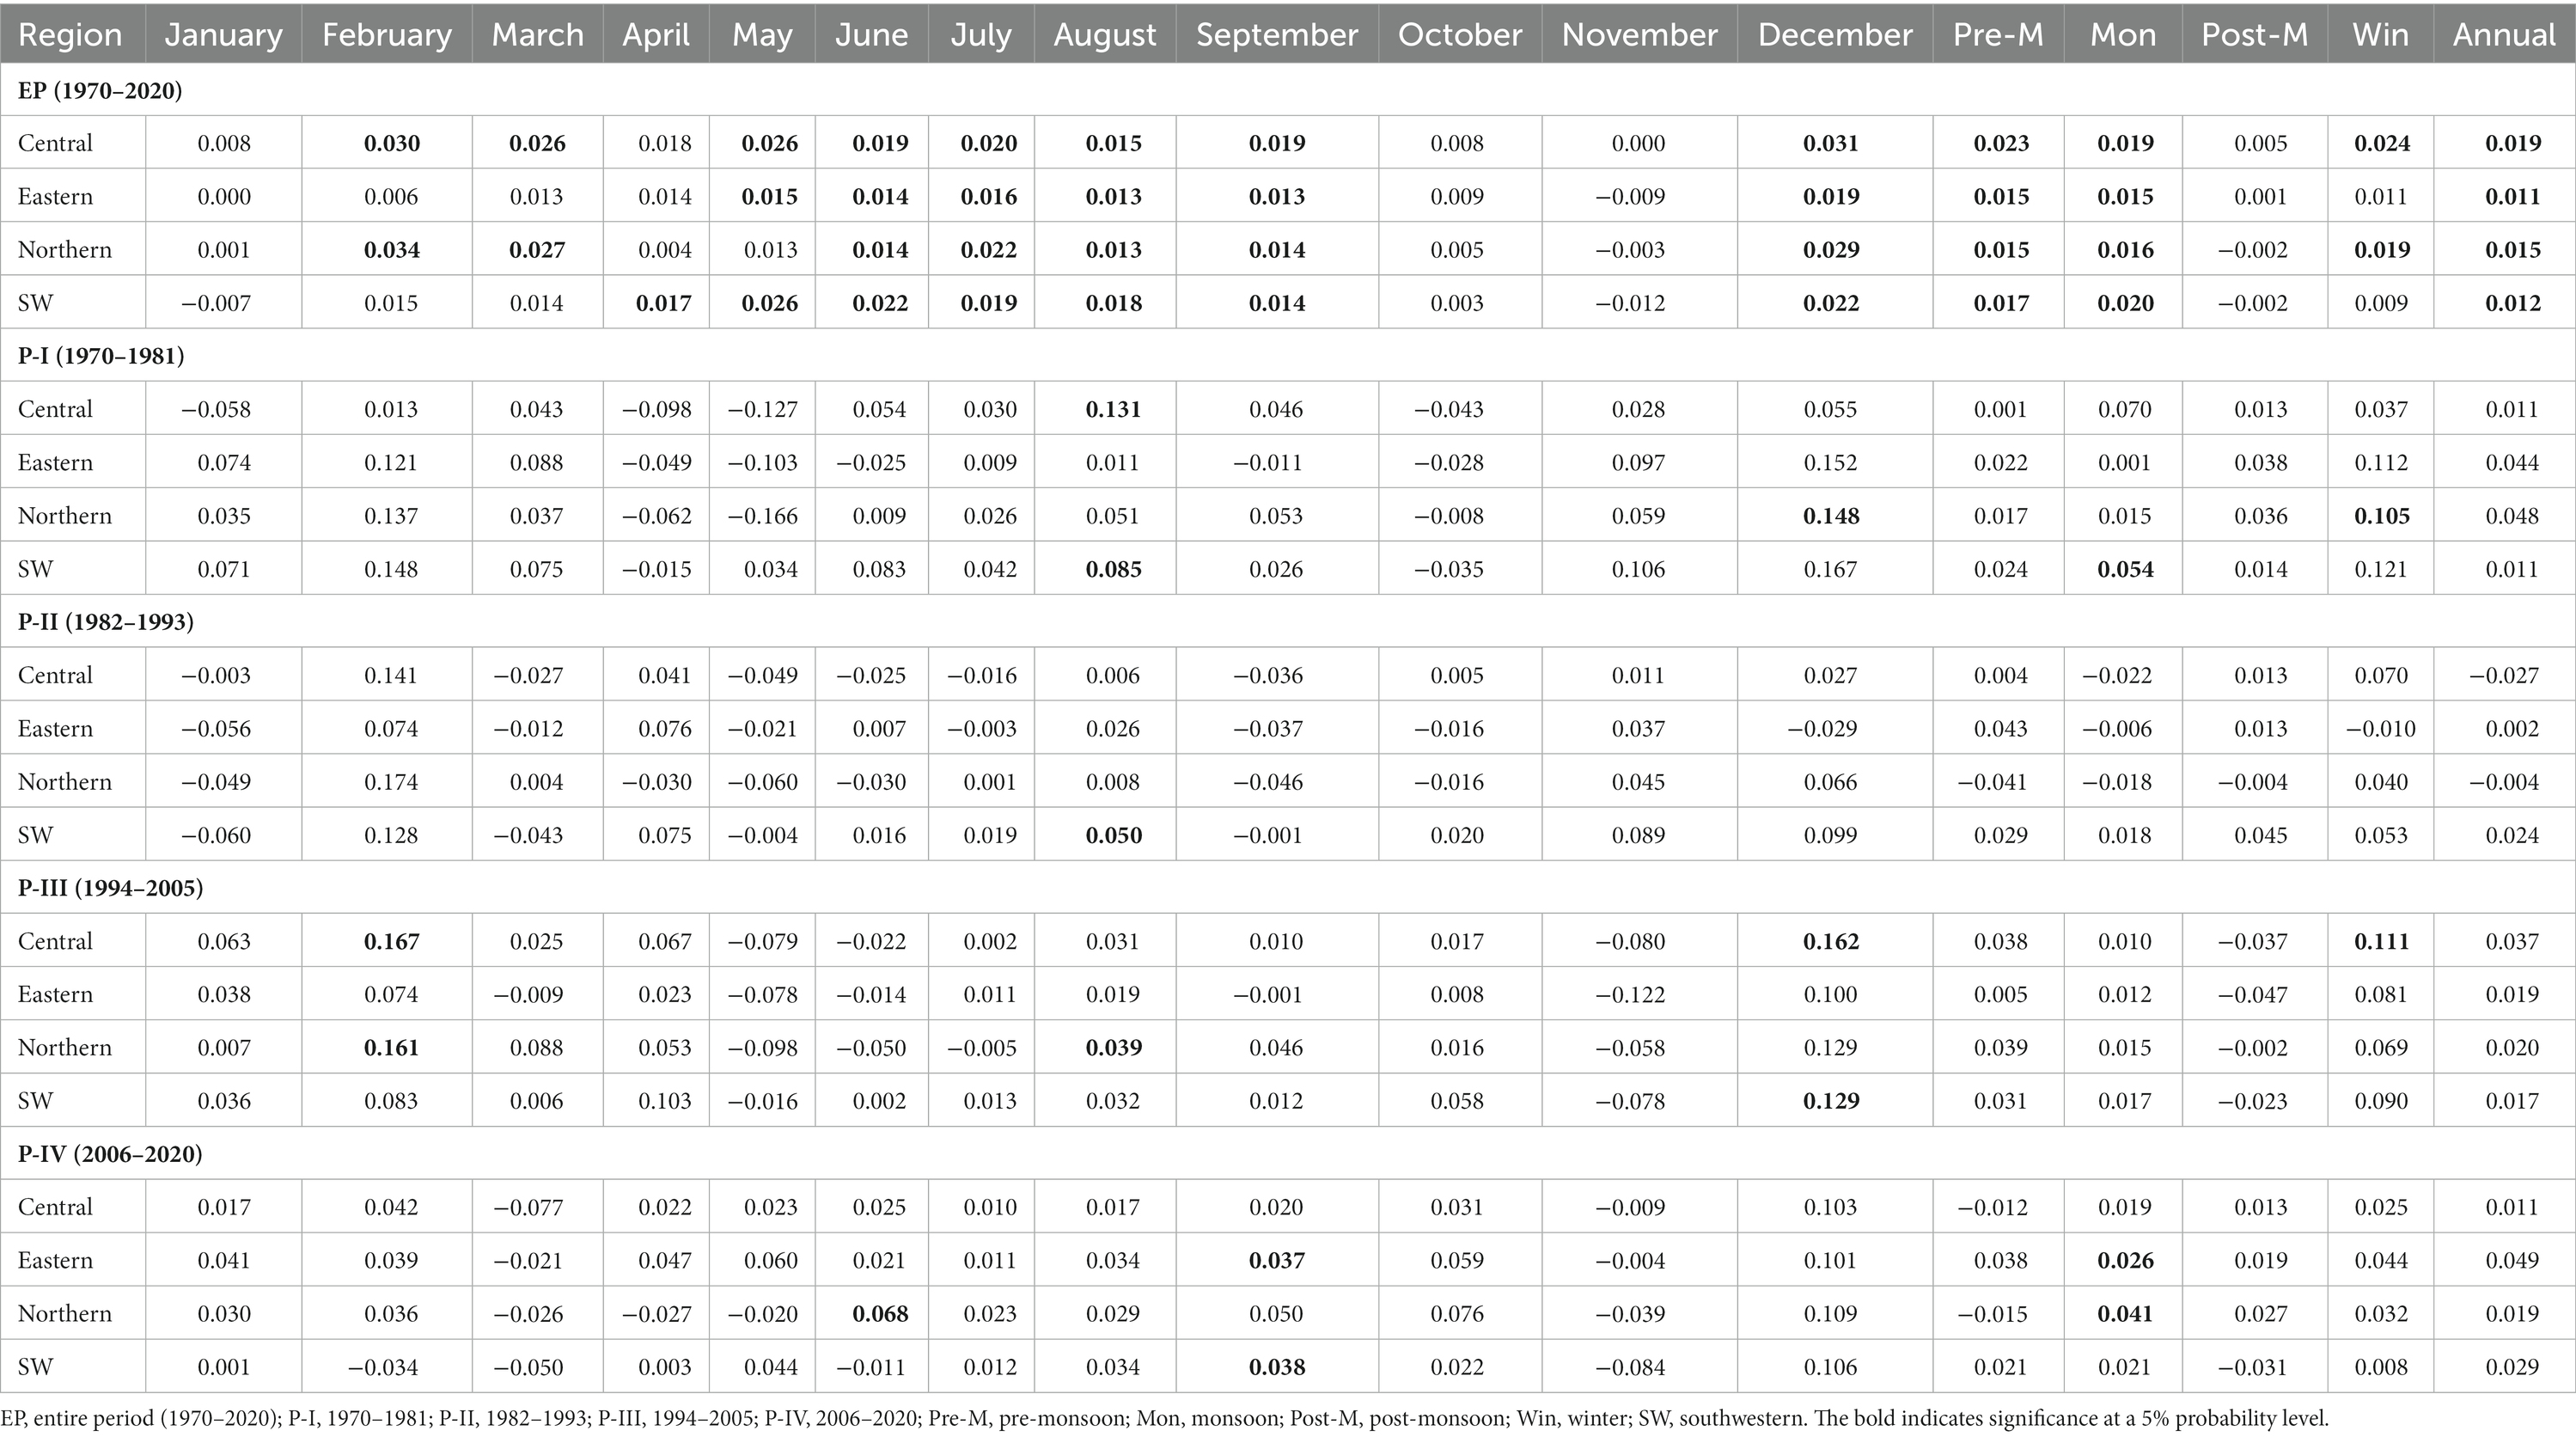
Table 2. Monthly, seasonal, and annual minimum temperature trend of Bangladesh.
The trend magnitudes of monthly rainfall during the study period (1970–2020) were found to be within the range from −0.656 to 0.868 mm/year for the central region, −0.836 to 2.896 mm/year in the eastern part, −1.804 to 0.467 mm/year in the northern region and −0.391 to 1.899 mm/year in southwestern region (Table 3). In the eastern region, a significant increase (2.896 mm/year, p < 0.05) and decrease (−0.836 mm/year, p < 0.05) trend were found in September and November, respectively, and a significant increasing trend (1.899 mm/year, p < 0.05) was also observed in October of the southwestern region.
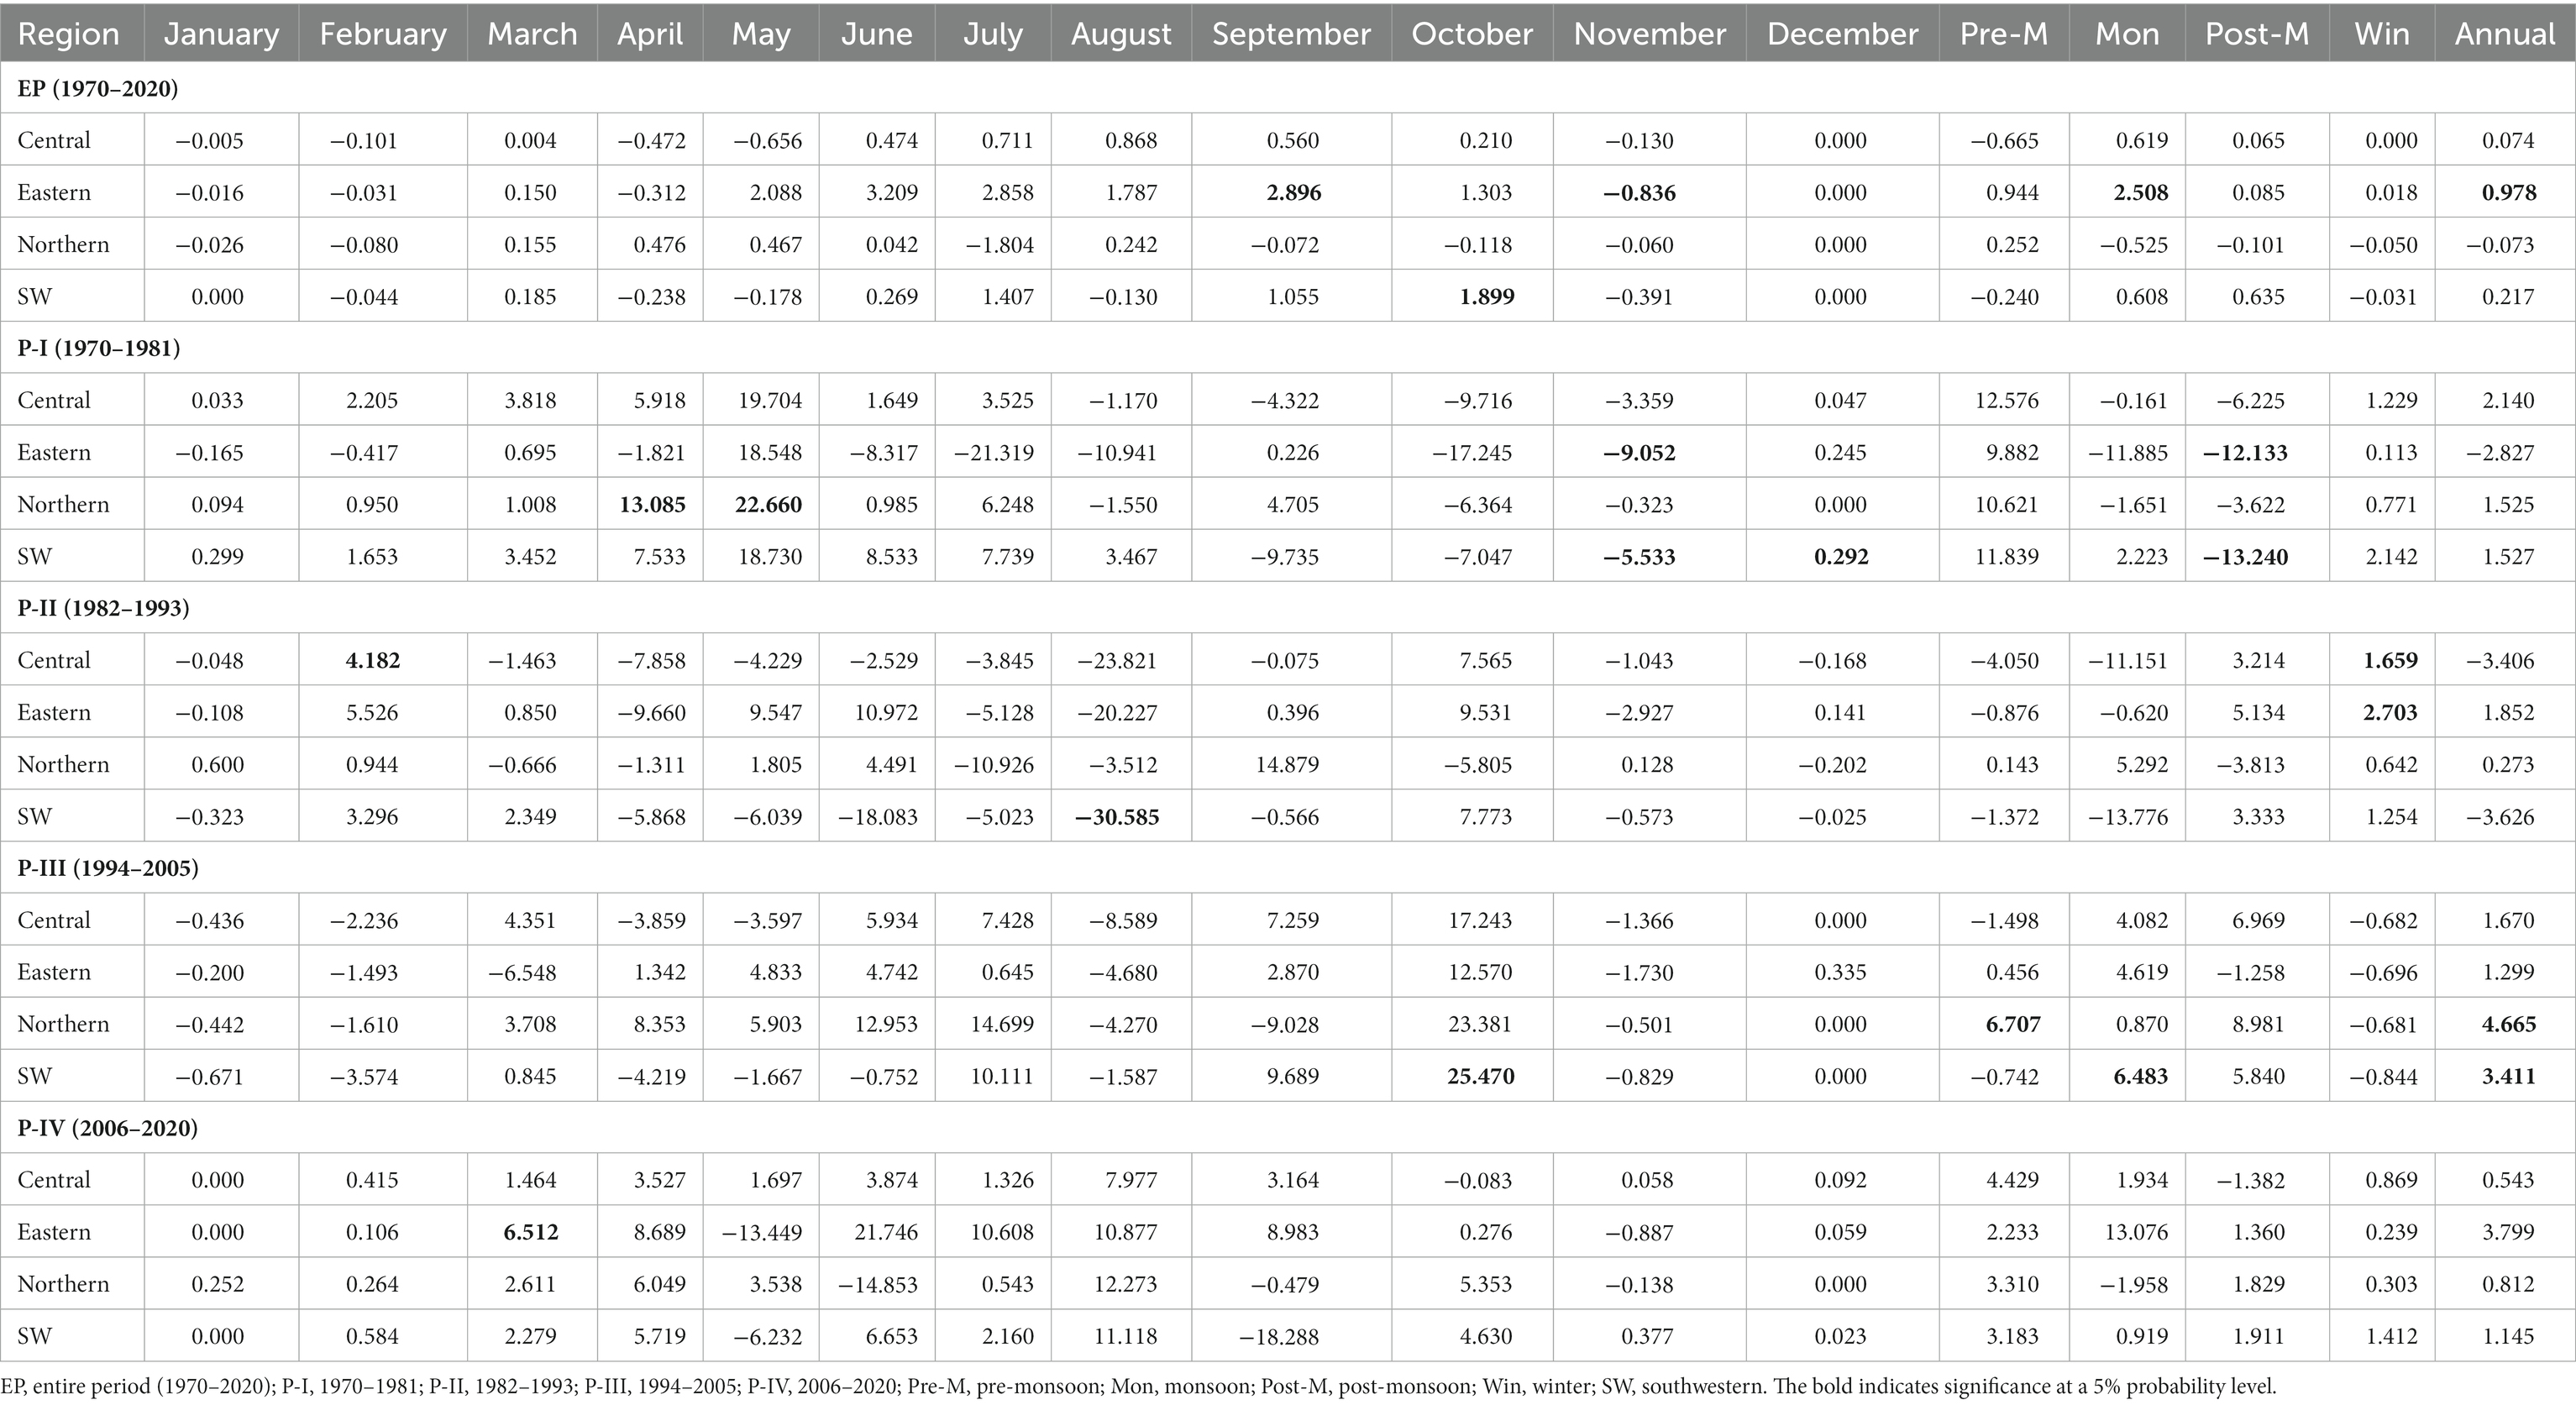
Table 3. Monthly, seasonal, and annual rainfall trends of Bangladesh.
In the whole period (1970–2020), the trend magnitudes of monthly relative humidity followed a positive trend in central, eastern, northern, and southwestern regions from January to April and October to December (Table 4). In the central part, significant (p < 0.05) increasing trends were found in January to April, and December ranged from 0.092% to 0.228%/year. Moreover, a significant decreasing trend was found in the central region in June (−0.038%/year, p < 0.05) and July (−0.047%/year, p < 0.05). The northern part showed a significant (p < 0.05) positive trend for January to April, November, and December, with magnitudes ranging from 0.051%–0.262%/year. For the southwestern region, 7 months were found to have significantly increased trends (0.032% to 0.244%/year, p < 0.05), and the months were January to March and September to December.
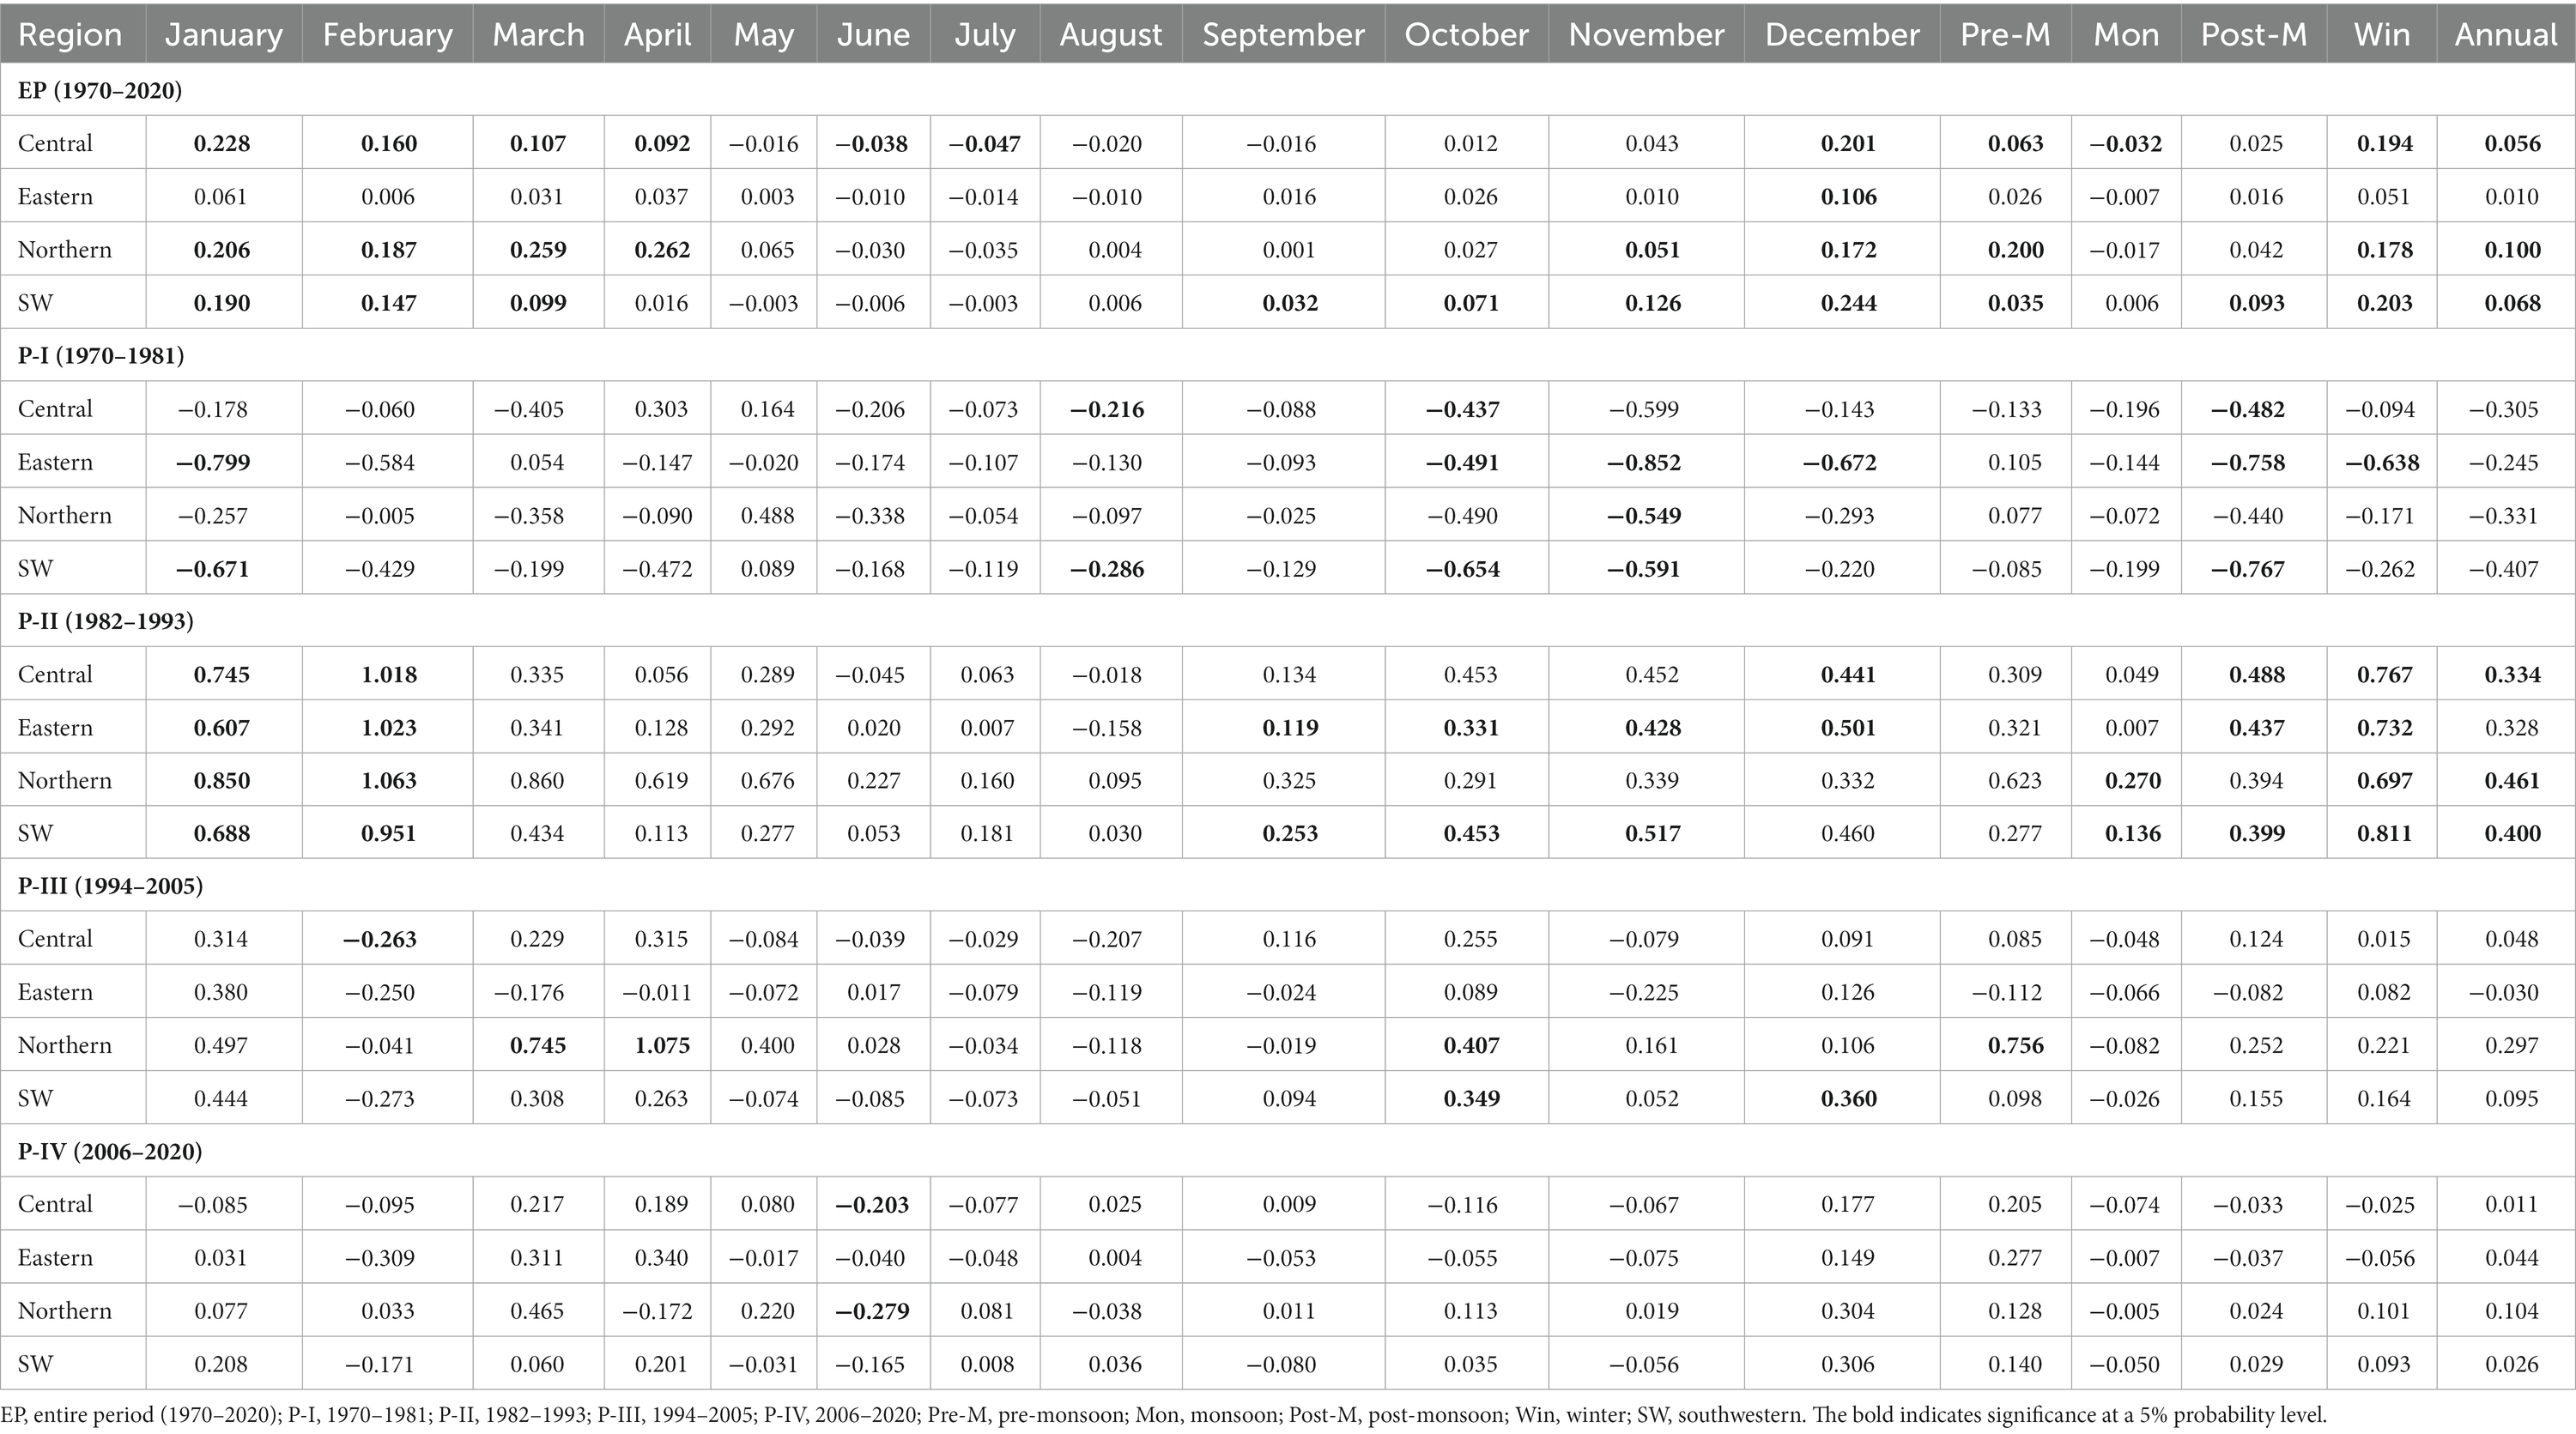
Table 4. Monthly, seasonal, and annual relative humidity trend of Bangladesh.
3.2.2 Seasonal maximum temperature, minimum temperature, rainfall, and relative humidity trends
The analysis of the pre-monsoon time series showed a significant increasing trend (0.022°C to 0.029°C/year, p < 0.05) for the central, eastern, and southwestern regions and a decreasing trend (−0.028°C/year) for the northern region (Figure 4; Table 1). In monsoon, significant (p < 0.05) increasing trends were found at 0.030°C, 0.033°C, 0.034°C, and 0.040°C/year for the eastern, northern, central, and southwestern regions, respectively. The mean Tmax showed significantly (p < 0.05) increasing trends in the post-monsoon season for all areas, with the trend magnitudes ranging from 0.015°C/year to 0.033°C/year. In the winter, significant (p < 0.05) growing and decreasing trends were found at 0.03 and − 0.02°C/year for the eastern and northern regions, respectively.
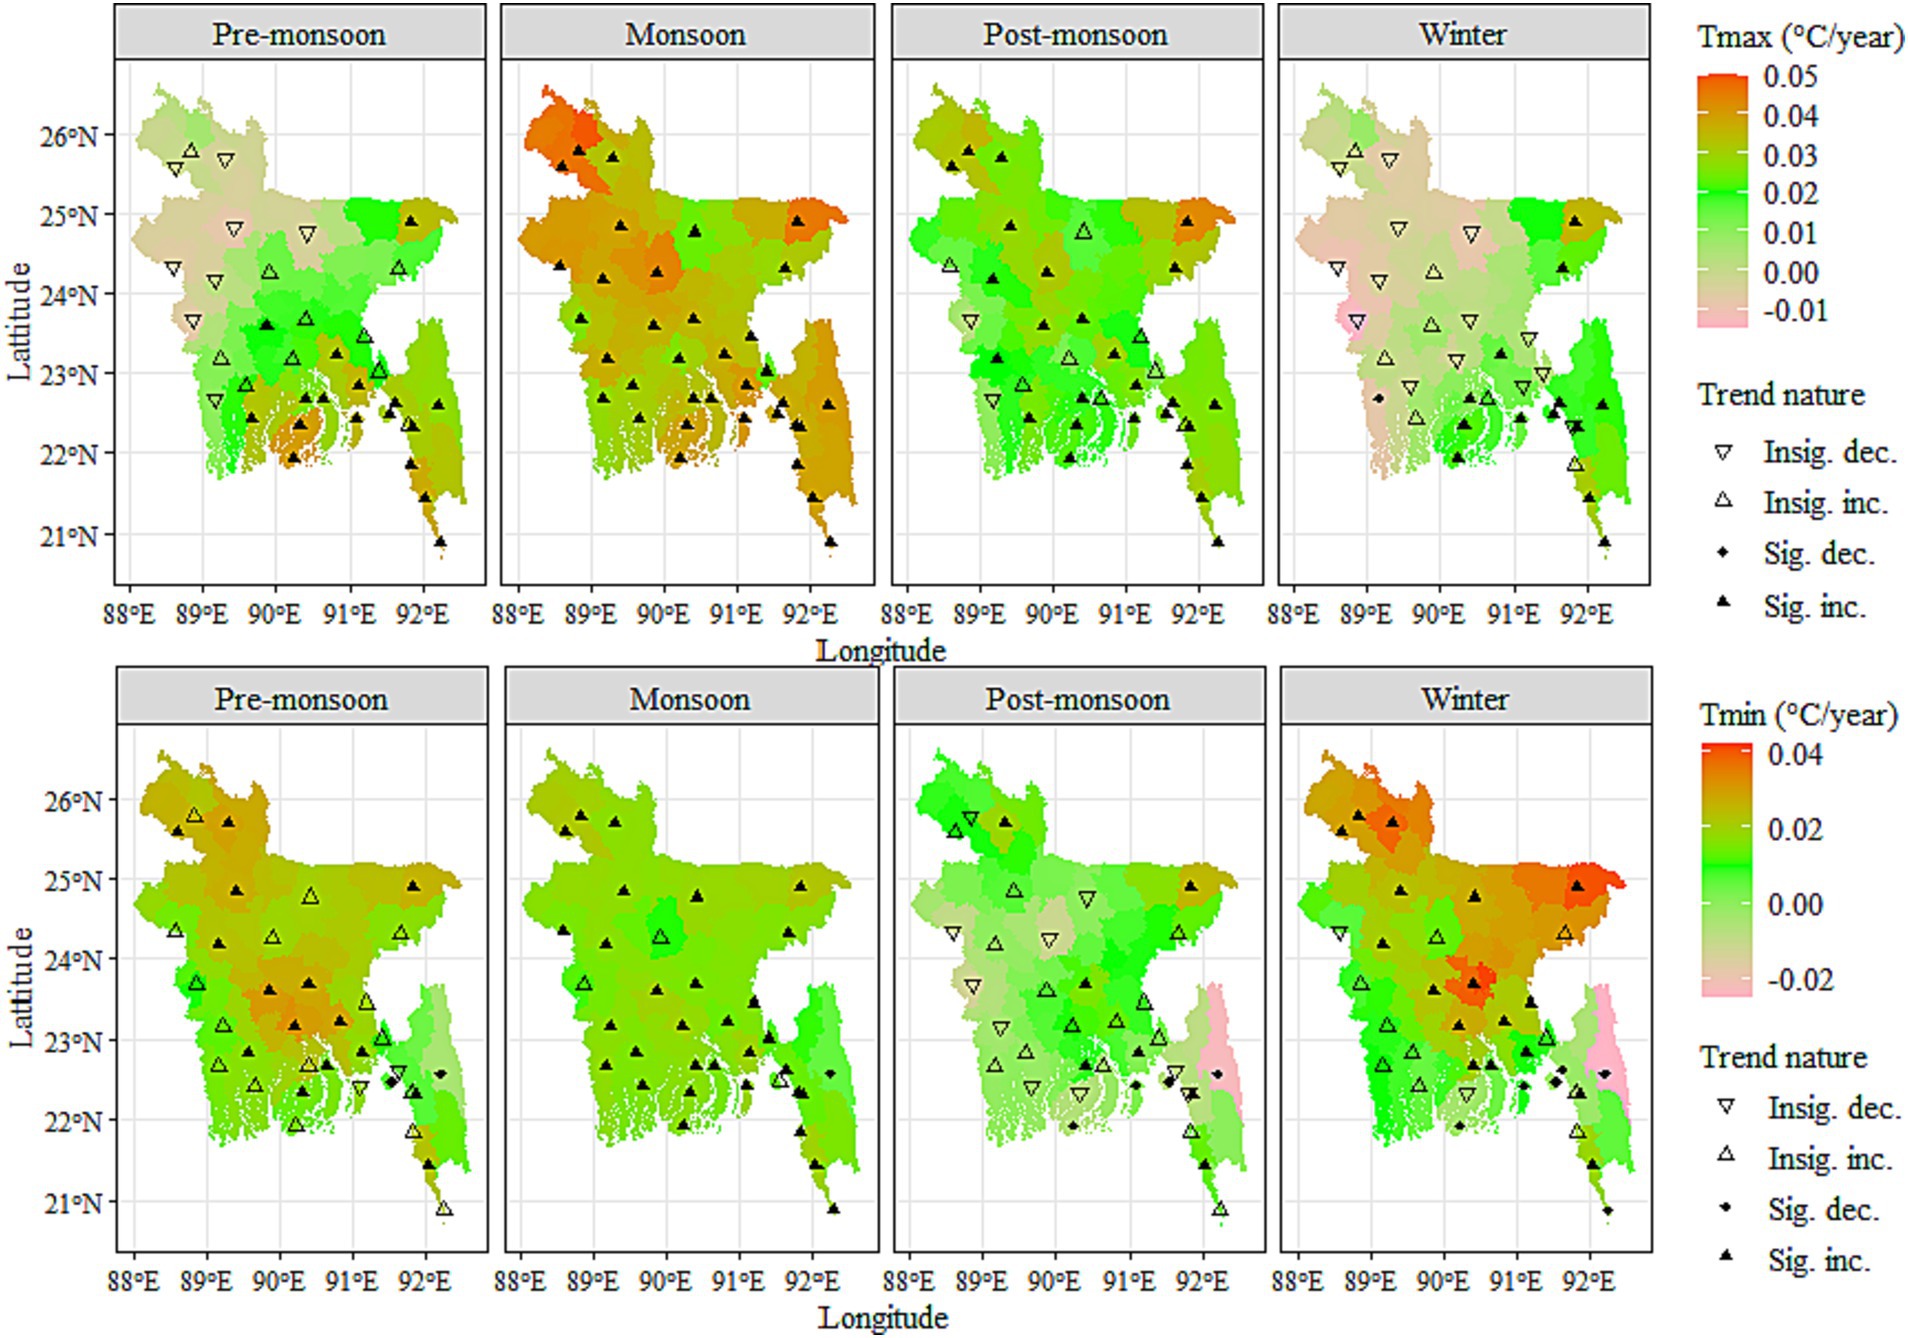
Figure 4. Spatial distribution of trends in seasonal maximum and minimum temperature over Bangladesh (1970–2020).
The pre-monsoon average Tmin significantly (p < 0.05) increased at 0.023°C/year in the central, 0.015°C/year in the eastern and northern, and 0.017°C/year in southwestern regions (Figure 4; Table 2). During 1971–2020, the monsoon mean Tmin trend was significant (p < 0.05), ranging from 0.015°C to 0.020°C/year for central, eastern, northern, and southwestern regions. In the post-monsoon period, there were increasing and decreasing trends, but the rate of change was close to zero in all regions. In Winter, an increasing trend at 0.024°C and 0.019°C/year was found for the eastern and northern regions, respectively.
Pre-monsoon rainfall showed a slight increasing and decreasing trend (−0.665 to 0.944 mm/year) during the last 51 years (1970–2020) in different regions of Bangladesh (Figure 5; Table 3). Monsoon season rainfall revealed an increasing trend during 1970–2020 in all parts except the northern region. The eastern region showed a significant increasing trend (2.508 mm/year, p < 0.05) for the whole period. Post-monsoon rainfall trends were positive in all regions except the northern part. However, winter rainfall in the north and southwestern regions decreased over the entire period, i.e., −0.05 and −0.031 mm/year, respectively. The other two areas of Bangladesh showed almost no change of direction in winter.

Figure 5. Spatial distribution of trends in seasonal rainfall and relative humidity over Bangladesh (1970–2020).
Pre-monsoon relative humidity showed a significant increasing trend (0.035% to 0.20%/year, p < 0.05) during the last 51 years (1970–2020) in the different regions except for the eastern region (0.026%/year, p < 0.05) of Bangladesh (Figure 5; Table 4). Relative humidity in the monsoon season revealed a decreasing trend (−0.007% to −0.032%/year) except in the southwestern region (0.006%/year), and a significant decreasing trend (−0.032%/year, p < 0.05) was found in the central region. The trends of post-monsoon relative humidity were positive in all regions, and a statistically significant trend (0.093%/year, p < 0.05) was found in the southwestern region. The relative humidity of the winter season showed a significant increasing trend for central (0.194%/year, p < 0.05), northern (0.178%/year, p < 0.05), and southwestern (0.203%/year, p < 0.05) regions of Bangladesh during 1970–2020.
3.2.3 Spatio-temporal annual trends of maximum and minimum temperature, rainfall, and relative humidity
Spatial and temporal annual trends of annual maximum and minimum temperature are illustrated in Figure 6. For annual mean Tmax, significant (p < 0.05) increasing trends of 0.021°C, 0.026°C, and 0.031°C/year were found in the central, southwestern, and eastern regions, respectively (Table 1). In the annual mean Tmin, the highest significant (p < 0.05) increasing trend of 0.019°C/year was found in the central region, followed by northern (0.015°C/year), southwestern (0.012°C/year), and 0.011°C/year in the eastern areas during 1970–2020 (Table 2). The annual spatial and temporal distribution of rainfall and relative humidity are depicted in Figure 7. The annual rainfall trend positively increased in the central, eastern, and southwestern regions. A significant positive trend (0.978 mm/year, p < 0.05) of rainfall was found in the east region, and a decreasing but non-significant trend (−0.073 mm/year) was observed in the northern region (Table 3). A significant increasing trend (0.056% to 0.10%/year, p < 0.05) for annual relative humidity was found in all the regions of Bangladesh except for the eastern region (0.01%/year, p < 0.05) (Table 4).
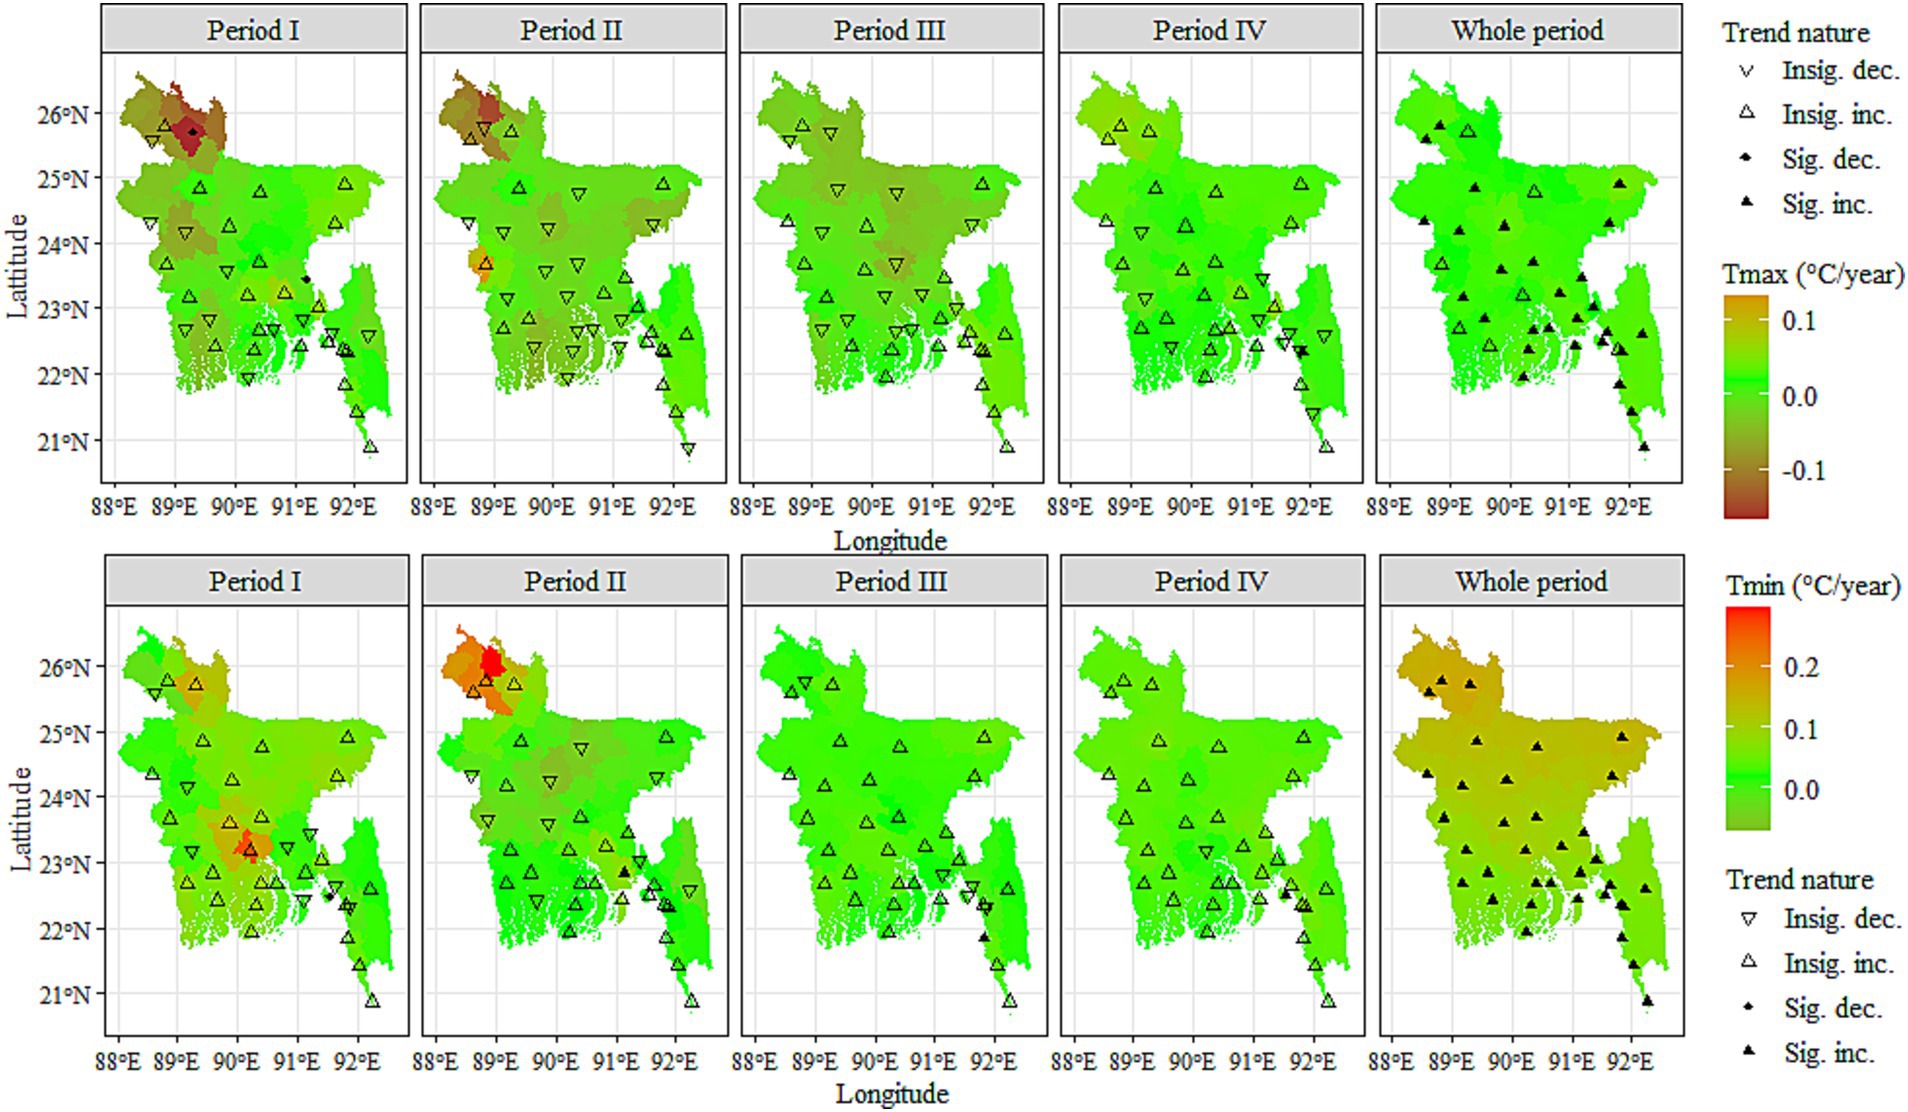
Figure 6. Spatial distribution of trends in annual maximum and minimum temperature over Bangladesh (1970–2020). Here, Period I = 1970–1981, Period II = 1982–1993, Period III = 1994–2005, and Period IV = 2006–2020.
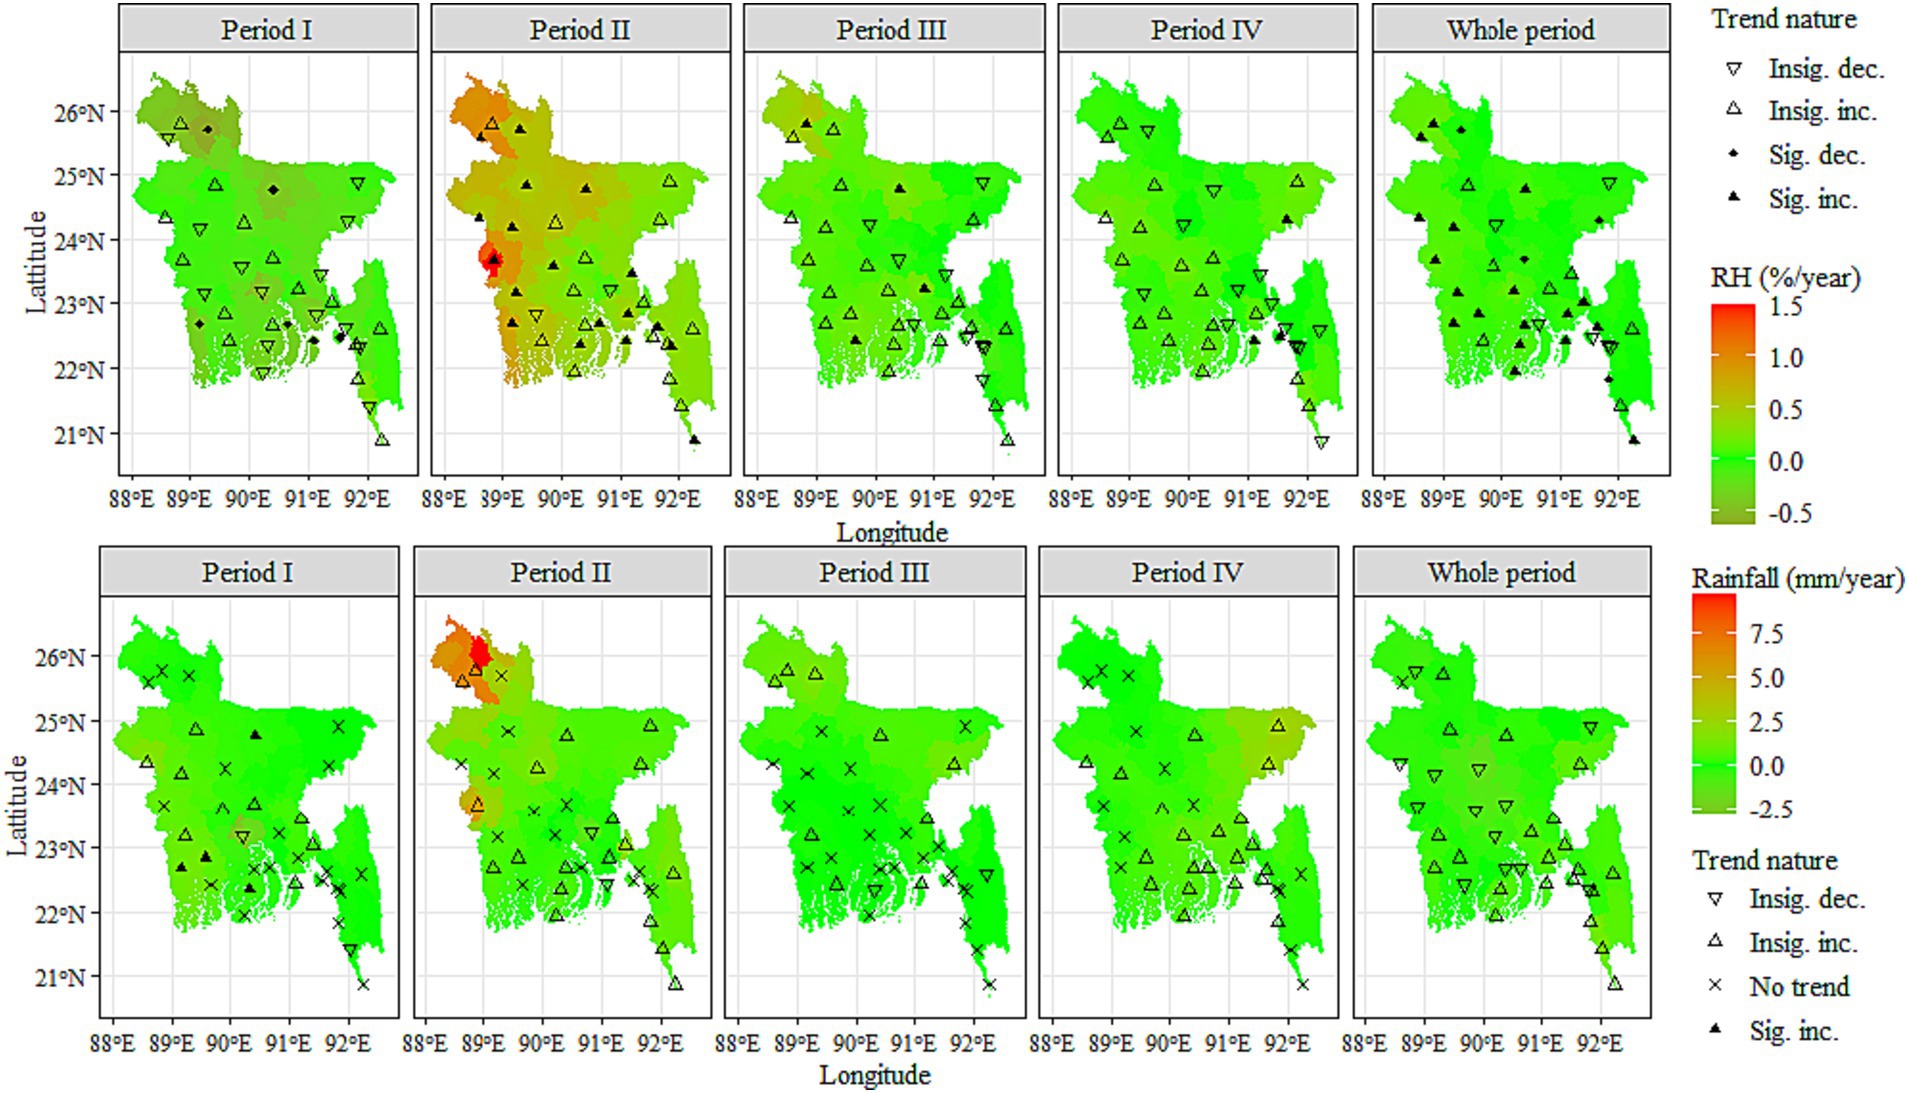
Figure 7. Spatial distribution of trends in annual rainfall and relative humidity over Bangladesh (1970–2020). Here, Period I = 1970–1981, Period II = 1982–1993, Period III = 1994–2005, and Period IV = 2006–2020.
3.3 Impacts of climatic variables on rice production
The association of climatic factors and rice yield showed statistically significant (p < 0.05) positive and negative changes for all rice-growing seasons (Aus, Aman, and Boro) for all regions of Bangladesh (Figures 8–10). The yield of Aus, Aman, and Boro seasons showed a significant (p < 0.05) upward trend for all areas. Both yield and climatic variables showed a significant change over 1970–2020 for all regions, indicating evidence of changing climatic factors affecting rice yield (Figures 8–10). The effect of the climate variables on the Aus, Aman, and Boro rice yield is shown in Table 5, which indicates that the overall yield is statistically significant and implies that the climate variables can explain some variations in Aus, Aman, and Boro rice yield. The pesudo R2 value showed that climatic factors explained 41% of the variation in the Aus rice yield for the eastern region, followed by the southwestern (40%), northern (24%), and central (20%) regions of the country (Table 5). The highest t-values are found for maximum temperature, relative humidity, and total rainfall in most areas, indicating that these factors impacted Aus rice production in that location. In the Aman season, the maximum temperature, relative humidity, and total rainfall positively influenced Aman rice yield, but the Tmin harmed all the regions (Table 5). Climatic factors explained 57% of the variation in Aman rice production in the eastern area, followed by the northern region (51%), southwestern region (50%), and central region (47%). In the case of the Boro season, the influence of climatic factors explained the 35% variation in Boro rice yield in the northern and southern regions. In comparison, 32% and 30% of the yield variation were found in the central and eastern regions, respectively (Table 5). All the climatic variables examined in this study positively affected Boro rice production in the east and central regions.
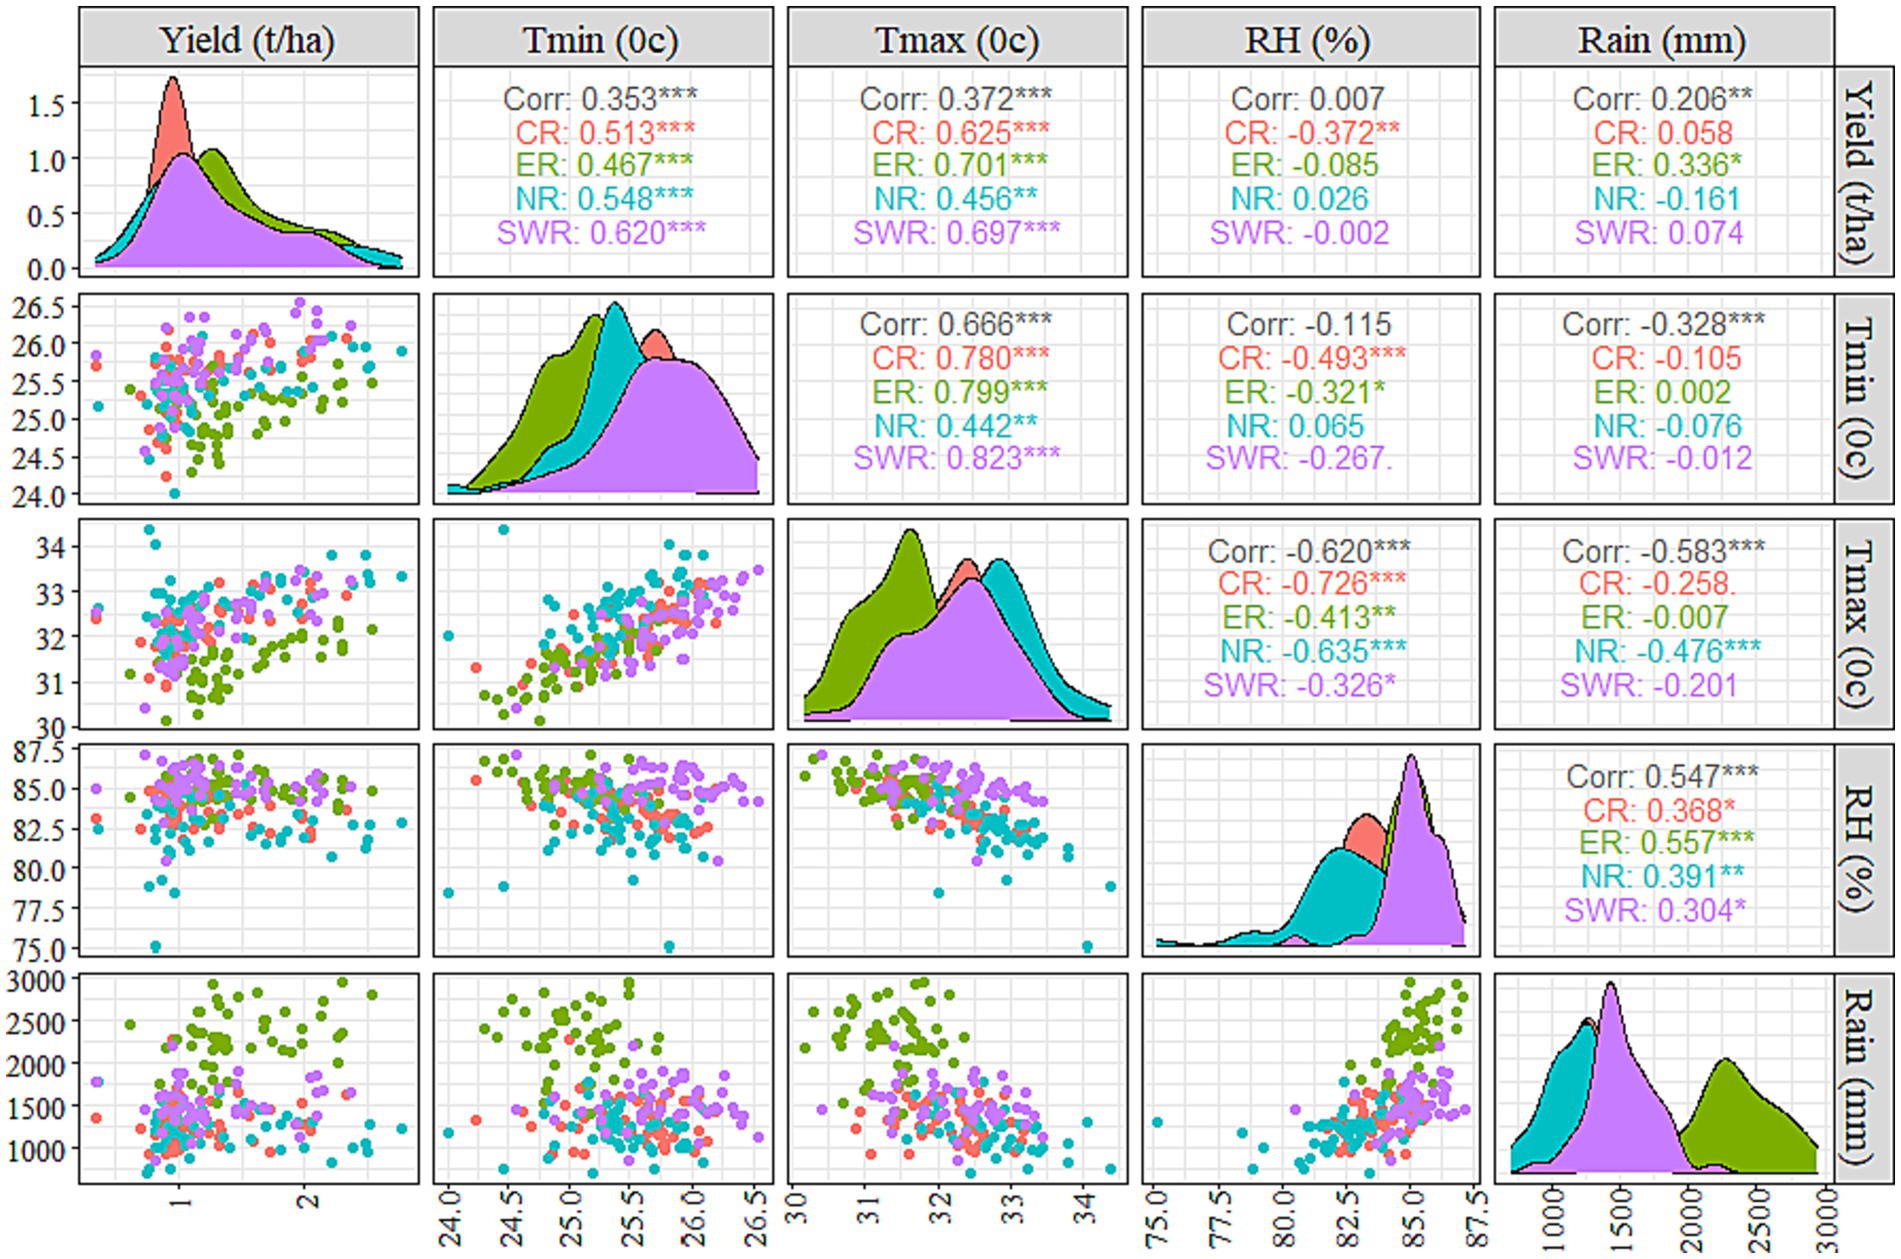
Figure 8. Scatterplot, correlation matrix, and probability density plot of climatic variables as independent variables and yield as response variables for Aus season. Corr, overall correlation; CR, central region; ER, eastern region; NR, northern region; SWR, southwestern region and regions were differentiated by different colours; Tmax, average maximum temperature; Tmin, average minimum temperature; RH, average relative humidity; Rain, rainfall.
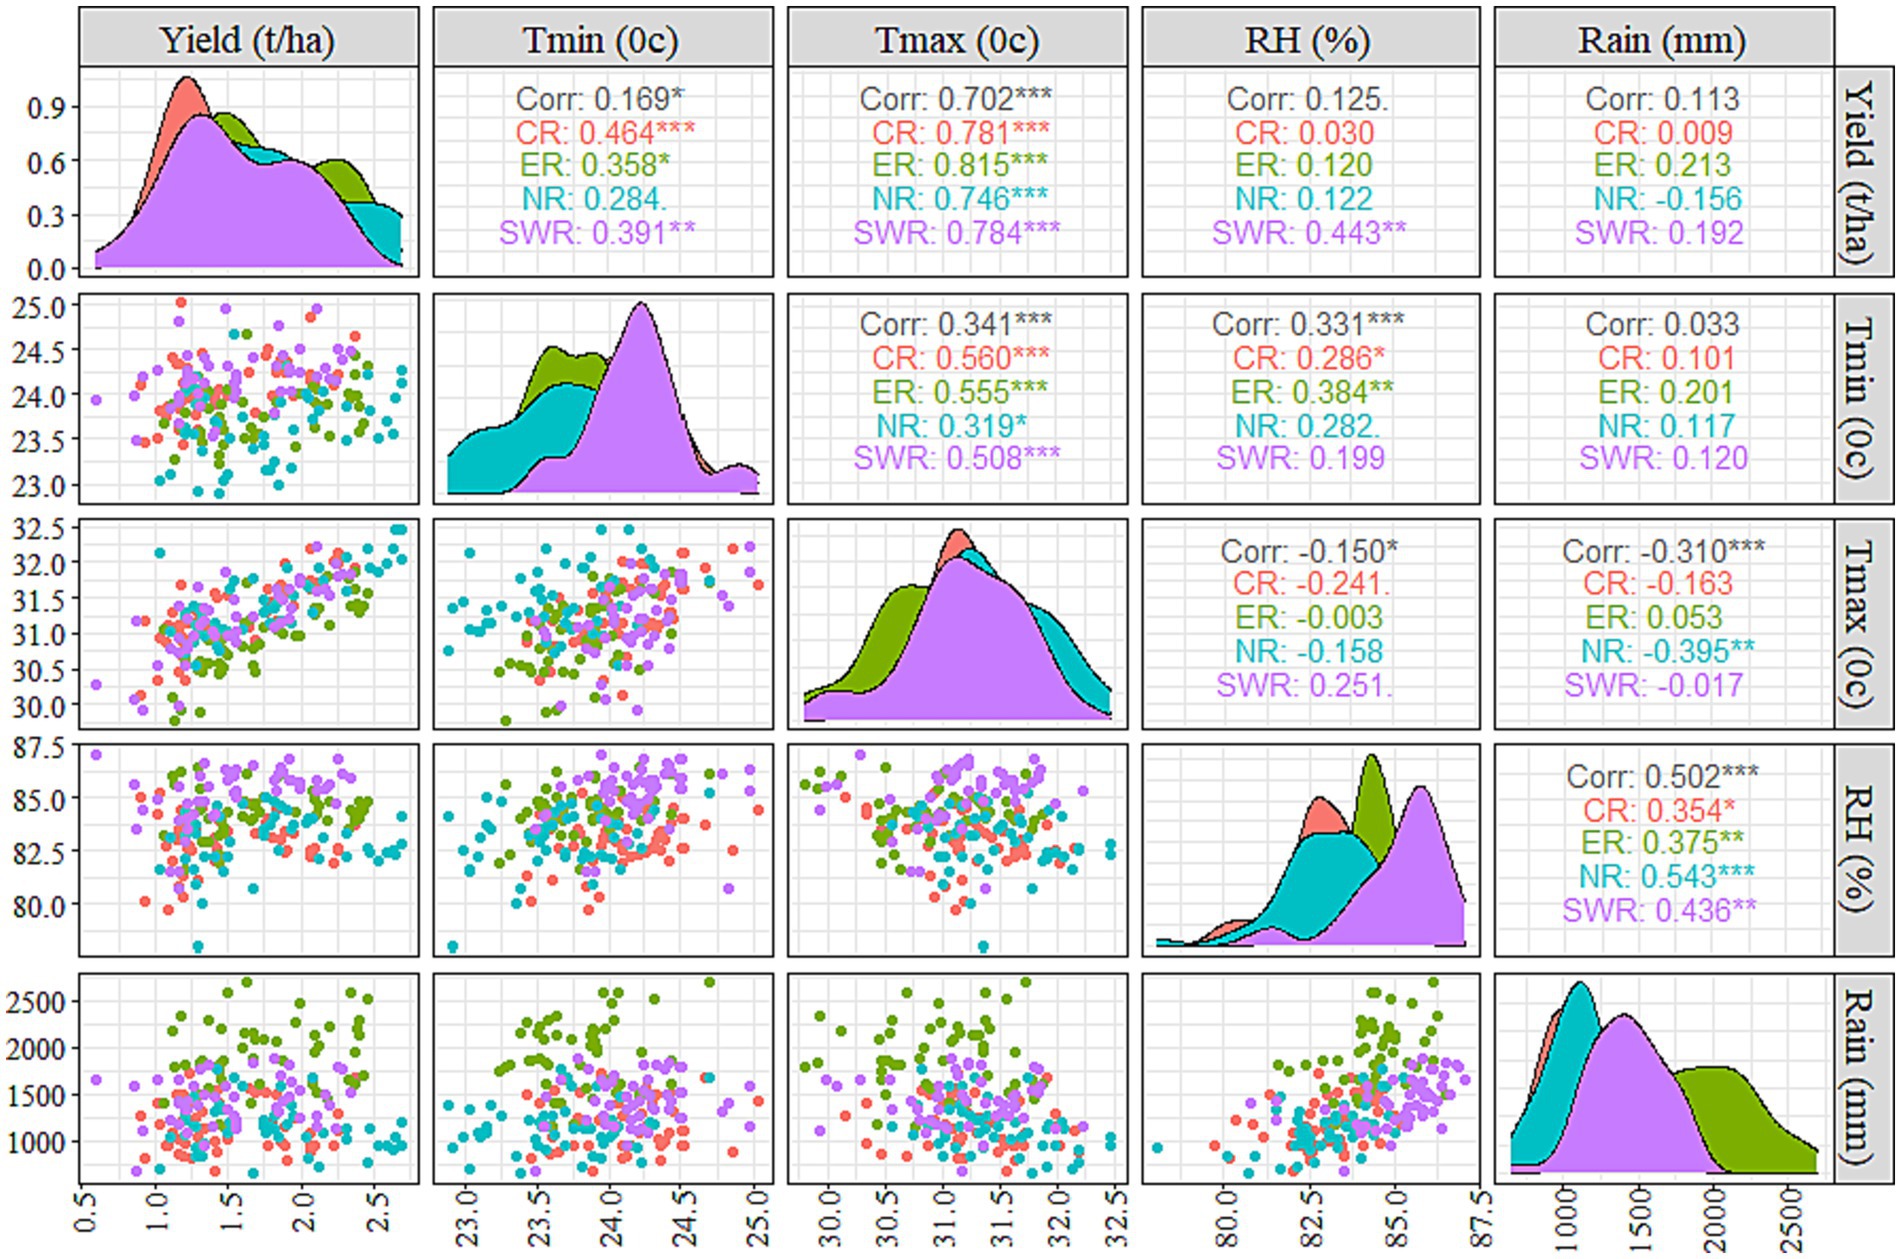
Figure 9. Scatterplot, correlation matrix, and probability density plot of climatic variables as independent variables and yield as response variables for Aman season. Corr, overall correlation; CR, central region; ER, eastern region; NR, northern region; SWR, southwestern region and regions were differentiated by different colours; Tmax, average maximum temperature; Tmin, average minimum temperature; RH, average relative humidity; Rain, rainfall.
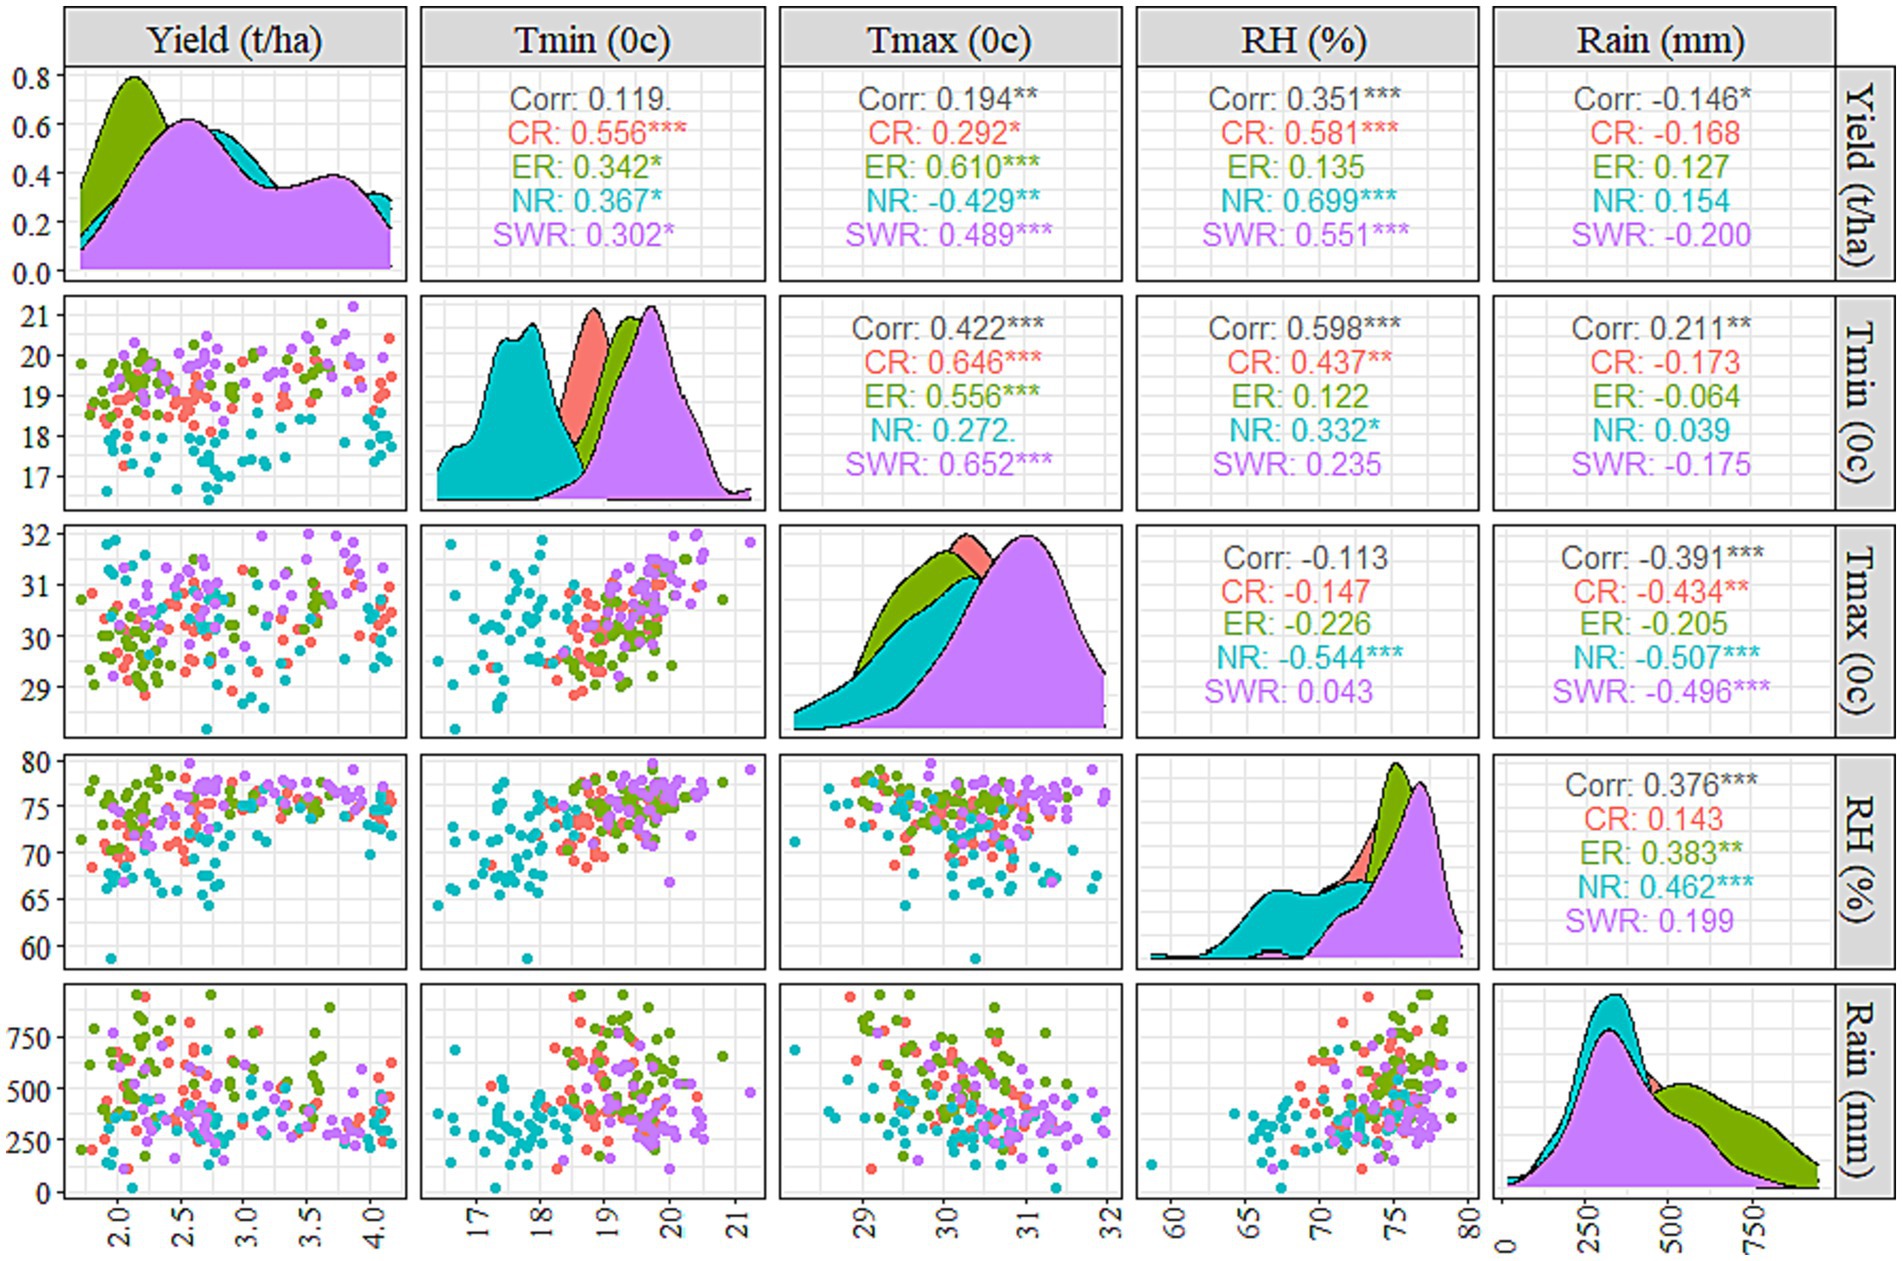
Figure 10. Scatterplot, correlation matrix, and probability density plot of climatic variables as independent variables and yield as response variables for Boro season. Corr, overall correlation; CR, central region; ER, eastern region; NR, northern region; SWR, southwestern region and regions were differentiated by different colours; Tmax, average maximum temperature; Tmin, average minimum temperature; RH, average relative humidity; Rain, rainfall.
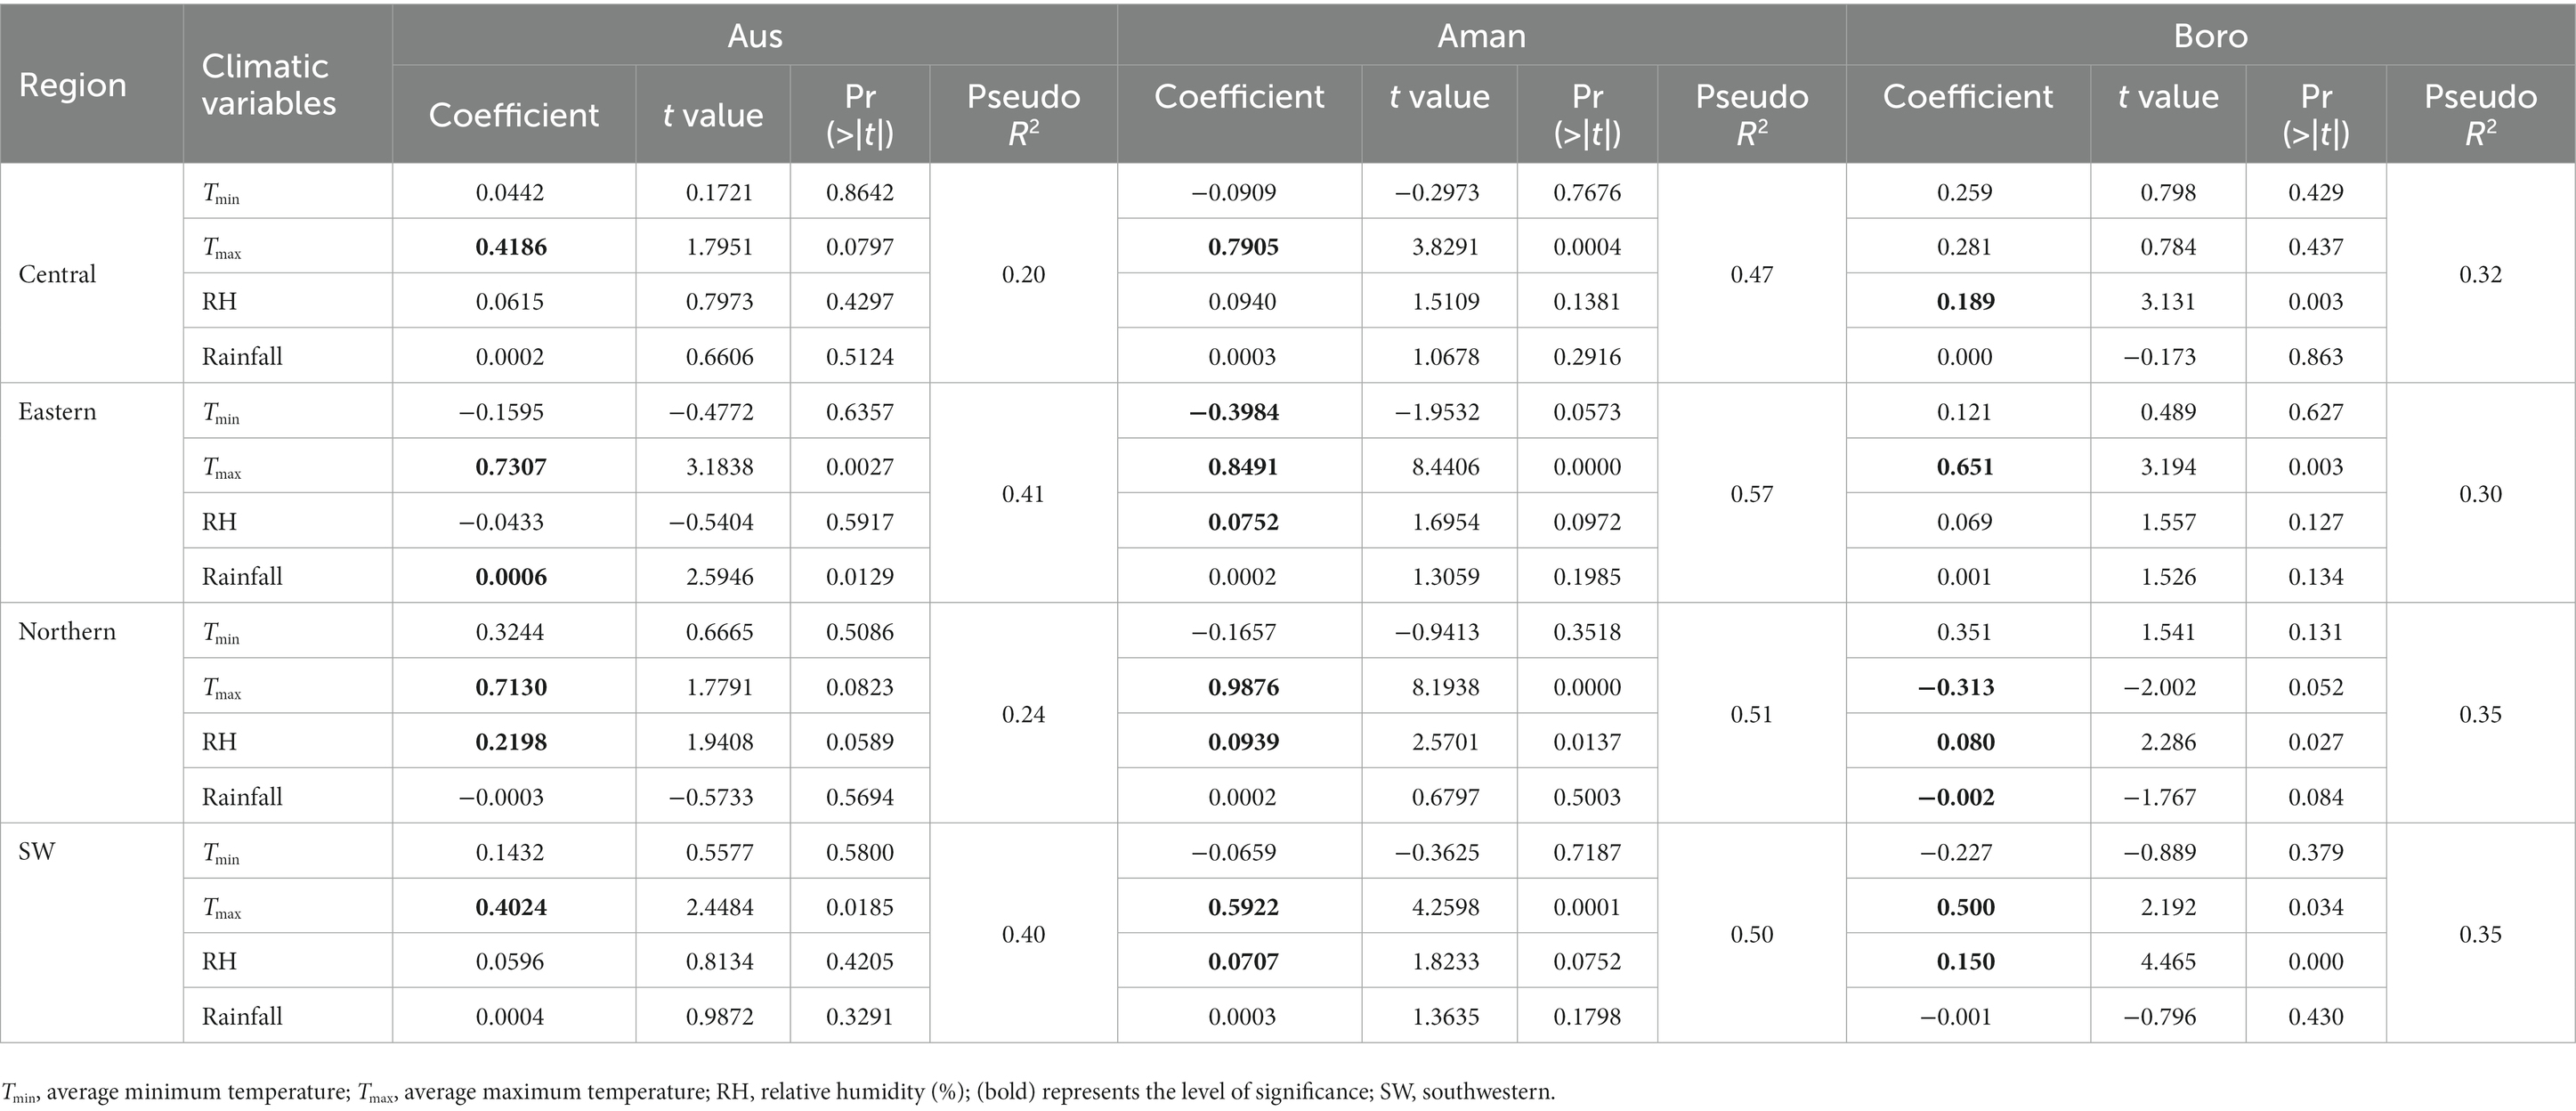
Table 5. Estimation of climatic variables effects on seasonal rice yield by quantile regression model in different regions of Bangladesh (1970–2020).
4 Discussion
The climate is changing due to anthropogenic activity, the effects of which are noticeable across the planet (Couture and Lindroth, 2013). Bangladesh is predicted to be one of the most vulnerable countries to climate change (Kulp and Strauss, 2019). These insights are critical, given the country’s heavy reliance on rice production as a staple food source for its large population (Mohidem et al., 2022). The study highlights the significant temporal and spatial variability in temperature, rainfall, and relative humidity across Bangladesh. This variability emphasizes the importance of understanding regional differences in climate patterns. Temperature is an essential measure of the climate. The gradual increase in temperature across Bangladesh, particularly during the monsoon and winter seasons, is a concerning trend. Extreme temperature events can cause crop wilting and sterility, while low temperatures are responsible for cold injury and reduction of plant growth and development (Khalil et al., 2018; Atayee and Noori, 2020). Moreover, high temperatures without rainfall and irrigation water are responsible for drought, crop loss, and migration of human generation (Al Mamun et al., 2018; Parrish et al., 2020). The temperature of Bangladesh is increasing in most studied regions, which is similar to the previous prediction (Agrawala et al., 2003; IPCC, 2007). These temperature increases can have far-reaching impacts on rice production, as it is a highly temperature-sensitive crop (Hussain et al., 2019). The increasing population, deforestation, and greenhouse gas emissions are the key reasons for the rising temperature of Bangladesh (Islam and van Amstel, 2018). Historically, the northern region of Bangladesh remains colder during the winter season than the other regions because it is located near the piedmont of the Himalayas. In most regions, an increase in Tmax would be associated with a decrease in agricultural production, but in this particular region (northern), an increase in Tmax may be related to higher yields as it would make this region more conducive to growing crops.
However, the projections of Global Climate Model (GCM) data stated globally the winter will be more warming than the previous (Turral et al., 2011), and the results of our study support this statement. Traditionally, January and April are the coldest and hottest months in Bangladesh, respectively. Still, the present study’s finding indicates that May becomes the hottest month in the southwestern region, and temperature is decreasing gradually in January, which might be due to climate change. Seasonal maximum temperature will increase shortly except in the northern part of the pre-monsoon season and winter region. Albeit more than 75% of rainfall occurs in the monsoon season, the present study indicates that Tmin is increasing in the monsoon season. Rain decreases temperature, but our study showed that monsoon temperatures rise until 2020. While the study notes relatively consistent rainfall patterns in Bangladesh, the eastern part of the country experiences the highest rainfall. However, some areas in the east are showing decreasing rainfall trends. The observed inter-seasonal shifts in precipitation patterns, with an increase in post-monsoon rainfall, necessitate adaptation strategies for effective water resource management and irrigation (Shahid, 2012). If this trend continues, the temperature of monsoon season will increase.
Crop productivity, as well as human life, depends upon water. Rainfall variation is the key concern for the policymaker and the researcher to take the initiative to adjust crop cultivation or meet future water challenges. A sharp rise in temperature and rainfall patterns is evident in Bangladesh (Shahid, 2010; Shahid et al., 2012). July to September is the highest rainfall occurrence month in Bangladesh, and the highest rainfall occurs in the eastern region throughout the year. The analysis of data spanning the last 51 years in this study revealed a consistent upward trend in September rainfall compared to that in July and August. If the current trend continues, September will be the most rainfall month in the eastern part. Higher rainfall in the northeast region is caused by the additional uplifting effect of the Meghalaya plateau (Shahid, 2010). In the southwestern region, a significant increasing trend was found in October, which was much ahead of the rainfall pattern of July–August. Kamruzzaman et al. (2019) reported that the location-wise rainfall intensity of Bangladesh is shifting gradually, which supports the findings of our study. The southwestern region is a saline-prone area, and due to salinity, rabi (December to February) crop cultivation is very tough in that area (Alam et al., 2017). Rainfall decreases salinity (Geng and Boufadel, 2017), and an increasing trend of precipitation in October month will be helpful for rabi crop cultivation in saline areas. In the monsoon season, a significant growing trend for rainfall was found in the eastern region. The finding of this study forewarns that the future rainfall intensity of the east region will be increased. The eastern part comprises hilly areas, and the highest spell of rainfall sometimes causes landslides or floods (Sarker et al., 2013; Sultana, 2020). The rising rain trend may cause more damage to life and crops by increasing landslides or flooding. Spatial distribution and annual and seasonal rainfall variability are caused by rising temperatures followed by increased evapotranspiration and moisture-holding capacity of the air (Shahid and Khairulmaini, 2009).
Relative humidity means the availability of moisture in the air. Depending on relative humidity, we, the human being, feel hot and cool weather. Moreover, relative humidity also influences plant growth and development (Mortensen, 1986; Hirai et al., 2000). High relative humidity is responsible for blocking evaporation as well as water and nutrient uptake from the soil, and low relative humidity is responsible for higher transpiration, and if irrigation cannot supply appropriately in this situation, then the plant will wilt and ultimately die (Mortensen and Gislerød, 1990; Sawan, 2018). In our study, a significant increasing trend of relative humidity was found in the winter and pre-monsoon seasons of central, northern, and southwestern regions, which means that these seasons will be warmer in the future compared to previous years. The decreasing relative humidity trend was observed in the Monsoon season, corroborated by Mortuza et al. (2014). A significant increasing trend of relative humidity was found in the pre-monsoon, post-monsoon, and winter seasons of the southwestern region, which revealed that the magnitude of warmer will be higher in the southwest area than the earlier. A similar kind of result reported by Mortuza et al. (2014) stated an increasing trend of relative humidity in the western region of Bangladesh. The southwestern part is located near the sea, which might cause high humidity (Luo et al., 2012; Byrne and O’Gorman, 2018). April is the hottest month in Bangladesh, and the increasing trend of Relative humidity in the central and northern regions indicates that April will be the hottest month in the future compared to previous years. On the other hand, an increase in relative humidity in April, May, December, and January will favour the outbreak of plant diseases such as sheath blight leaf and neck blast disease of rice. High humidity increases the hotness of the weather and favours the causing of many plant diseases.
The climate has an impact on rice production, and this influence will continue to affect rice cultivation, both positively and negatively, as climate change advances (Kabir et al., 2020). In the Aus season, eastern and southern rice production is mostly influenced by climatic variables. In the case of Aman and Boro, maximum temperature and relative humidity mostly controlled the rice production. Among the climatic variables, the maximum temperature was highly correlated with Aus, Aman, and Boro rice yield in Bangladesh, similar to previous findings (Chowdhury and Khan, 2015). Temperature up to 35°C increases rice plants’ vegetative growth and photosynthesis (Yoshida, 1981). The average mean temperature of Bangladesh does not exceed the maximum optimum temperature (35°C) for rice production. This might be one of the essential causes contributing to the current enhancement of rice yield in Bangladesh. Another factor is the rapid adoption of climate-smart technological innovations in the farmers’ fields (Al Mamun et al., 2021), which may currently have minimal or no impact on climate variables. However, if this trend continues to rise over time, it could significantly impede the growth of rice productivity in Bangladesh. A recent study revealed that the historical temperature anomaly of Bangladesh was positively correlated with the rice production of Bangladesh (Kabir et al., 2020), and our present findings are also corroborated with their conclusions.
5 Conclusions and recommendations
The assessment of climatic parameters and their impacts on rice production in Bangladesh has yielded valuable insights. The summary of findings from this study are:
• Long-term weather data in Bangladesh reveals significant temporal and spatial variability in temperature, rainfall, and relative humidity.
• Gradual temperature increases were observed, with noticeable changes in southwestern Bangladesh. The monsoon season experienced a significant rise in maximum temperature. In contrast, December in the winter season sees a marked increase in minimum temperature, with a higher growth rate for minimum temperature. Overall, the minimum temperature growth rate was higher than the maximum temperature.
• Rainfall patterns were relatively consistent across Bangladesh, with the highest rainfall occurring in the eastern part. However, certain areas in the east exhibit decreasing rainfall trends compared to previous periods. The study also noted inter-seasonal shifts in precipitation, with an increase in post-monsoon rainfall.
• The study identified maximum temperature and relative humidity as the most influential parameters for rice production in Bangladesh. Among the seasons, rice production during the Aman season is significantly affected by maximum temperature, more so than during the Aus and Boro seasons.
• Overall, no detrimental effects of climatic variables on rice production in Bangladesh were found. However, proactive measures are essential to address the challenges of climate change, particularly the threat posed by rising maximum temperatures.
The findings suggest no negative impacts on rice production in the country thus far; it is crucial to recognize the looming challenges posed by climate change. The observed increases in maximum temperature, shifts in rainfall patterns, and the varying influences of temperature and humidity on crop production highlight the need for proactive climate-smart strategies.
To ensure food security in the face of climate change, several key recommendations emerge from this study:
• Develop location-specific climate-smart technologies: tailor climate-smart management technologies to specific regions in Bangladesh to address the unique challenges posed by varying climatic conditions.
• Drought and heat-tolerant varieties: invest in the development and promotion of rice varieties that are resistant to drought and heat, as these will be increasingly critical in ensuring stable crop yields.
• Modernized irrigation facilities: upgrade irrigation systems to enhance water availability and efficiency, allowing for better adaptation to changing precipitation patterns.
• Continuous monitoring and adaptation: implement systems for constantly monitoring climatic parameters and their impacts on farming. Adapt strategies as needed to mitigate future risks.
These measures, when implemented, will help Bangladesh to proactively address the challenges of climate change and safeguard its food security.
Data availability statement
The data analyzed in this study is subject to the following licenses/restrictions: all data published in this article are available upon request to the corresponding author. Requests to access these datasets should be directed to Md. Abdur Rouf Sarkar, mdrouf_bau@yahoo.com.
Code availability
The study primarily used the following R packages: “wql” and “ggplot2” of programming R version 4.0.5.
Author contributions
MAAM: Conceptualization, Data curation, Funding acquisition, Methodology, Visualization, Writing – original draft. SAIN: Data curation, Funding acquisition, Methodology, Visualization, Writing – original draft. MARS: Conceptualization, Methodology, Visualization, Writing – review & editing. MRS: Data curation, Funding acquisition, Writing – original draft. JS: Writing – review & editing. MS: Supervision, Writing – review & editing.
Funding
The author(s) declare financial support was received for the research, authorship, and/or publication of this article. This work was supported by the National Academy of Sciences and the United States Agency for International Development (Partnerships for Enhanced Engagement in Research (PEER) program grant award number: AID-OAA-A-11-00012), and the Ministry of Education, Youth and Sports of the Czech Republic (grant number # S grant of MSMT CR).
Acknowledgments
The authors express gratitude to the Bangladesh Meteorological Department (BMD) for providing essential weather data. Acknowledgment is also due to the Partnerships for Enhanced Engagement in Research (PEER) fund by the National Academy of Sciences and the United States Agency for International Development, which partially supported the data collection. The authors appreciate the valuable contributions of scientists from the Bangladesh Rice Research Institute (BRRI) during discussions at different manuscript stages. Special thanks to Telha Rehman, Research Assistant at the University of California Davis, USA, for language editing.
Conflict of interest
The authors declare that the research was conducted in the absence of any commercial or financial relationships that could be construed as a potential conflict of interest.
Publisher’s note
All claims expressed in this article are solely those of the authors and do not necessarily represent those of their affiliated organizations, or those of the publisher, the editors and the reviewers. Any product that may be evaluated in this article, or claim that may be made by its manufacturer, is not guaranteed or endorsed by the publisher.
Supplementary material
The Supplementary material for this article can be found online at: https://www.frontiersin.org/articles/10.3389/fsufs.2023.1290055/full#supplementary-material
References
Agrawala, S., Ota, T., Ahmed, A. U., Smith, J., and van Aalst, M. (2003) Development and climate change in Bangladesh: focus on coastal flooding and the Sundarbans. Paris, France: OECD.
Ahmed, R., and Karmakar, S. (1993). Arrival and withdrawal dates of the summer monsoon in Bangladesh. Int. J. Climatol. 13, 727–740. doi: 10.1002/joc.3370130703
Al Mamun, M. A., Nihad, S. A. I., Sarkar, M. A. R., Aziz, M. A., Qayum, M. A., Ahmed, R., et al. (2021). Growth and trend analysis of area, production and yield of rice: a scenario of rice security in Bangladesh. PLoS One 16:e0261128. doi: 10.1371/JOURNAL.PONE.0261128
Al Mamun, A., Rahman, M. N. F., Abdullah Aziz, M., Qayum, M. A., Hossain, M. I., Nihad, S. A. I., et al. (2018). Identification of meteorological drought prone area in Bangladesh using standardized precipitation index. J. Earth Sci. Clim. Change 9:1000457. doi: 10.4172/2157-7617.1000457
Alam, M. Z., Carpenter-Boggs, L., Mitra, S., Haque, M. M., Halsey, J., Rokonuzzaman, M., et al. (2017). Effect of salinity intrusion on food crops, livestock, and fish species at Kalapara coastal belt in Bangladesh. J. Food Qual. 2017, 1–23. doi: 10.1155/2017/2045157
Almaraz, J. J., Mabood, F., Zhou, X., Gregorich, E. G., and Smith, D. L. (2008). Climate change, weather variability and corn yield at a higher latitude locale: southwestern Quebec. Clim. Chang. 88, 187–197. doi: 10.1007/s10584-008-9408-y
Amare, M., Jensen, N. D., Shiferaw, B., and Cissé, J. D. (2018). Rainfall shocks and agricultural productivity: implication for rural household consumption. Agric. Syst. 166, 79–89. doi: 10.1016/j.agsy.2018.07.014
Atayee, A. R., and Noori, M. S. (2020). Alleviation of cold stress in vegetable crops. J. Sci. Agric. 4, 38–44. doi: 10.25081/jsa.2020.v4.6110
Benhin, J. K. A. (2008). South African crop farming and climate change: an economic assessment of impacts. Glob. Environ. Change 18, 666–678. doi: 10.1016/j.gloenvcha.2008.06.003
Bhuyan, M. D. I., Islam, M. M., and Bhuiyan, M. E. K. (2018). A trend analysis of temperature and rainfall to predict climate change for northwestern region of Bangladesh. Am. J. Clim. Change 7, 115–134. doi: 10.4236/ajcc.2018.72009
Birsan, M. V., Molnar, P., Burlando, P., and Pfaundler, M. (2005). Streamflow trends in Switzerland. J. Hydrol. 314, 312–329. doi: 10.1016/j.jhydrol.2005.06.008
Byrne, M. P., and O’Gorman, P. A. (2018). Trends in continental temperature and humidity directly linked to ocean warming. Proc. Natl. Acad. Sci. U. S. A. 115, 4863–4868. doi: 10.1073/pnas.1722312115
Cancelliere, A., Di Mauro, G., Bonaccorso, B., and Rossi, G. (2007). Drought forecasting using the standardized precipitation index. Water Resour. Manag. 21, 801–819. doi: 10.1007/s11269-006-9062-y
Chowdhury, I. U. A., and Khan, M. A. E. (2015). The impact of climate change on rice yield in Bangladesh: A time series analysis. Russ. J. Agric. Soc. Econ. Sci. 40, 12–28. doi: 10.18551/rjoas.2015-04.02
Couture, J. J., and Lindroth, R. L. (2013). Impacts of atmospheric change on tree-arthropod interactions. Dev. Environ. Sci. 13, 227–248. doi: 10.1016/B978-0-08-098349-3.00011-6
Dore, M. H. I. (2005). Climate change and changes in global precipitation patterns: what do we know? Environ. Int. 31, 1167–1181. doi: 10.1016/j.envint.2005.03.004
Fisher, R. J., Wellicome, T. I., Bayne, E. M., Poulin, R. G., Todd, L. D., and Ford, A. T. (2015). Extreme precipitation reduces reproductive output of an endangered raptor. J. Appl. Ecol. 52, 1500–1508. doi: 10.1111/1365-2664.12510
Gemmer, M., Fischer, T., Jiang, T., Su, B., and Liu, L. L. (2011). Trends in precipitation extremes in the Zhujiang River basin, South China. J. Clim. 24, 750–761. doi: 10.1175/2010JCLI3717.1
Geng, X., and Boufadel, M. C. (2017). The influence of evaporation and rainfall on supratidal groundwater dynamics and salinity structure in a sandy beach. Water Resour. Res. 53, 6218–6238. doi: 10.1002/2016WR020344
Gilbert, R. O. (1988). Statistical methods for environmental pollution monitoring. Biometrics 44:319. doi: 10.2307/2531935
Griffin, J. J., Ranney, T. G., and Pharr, D. M. (2004). Heat and drought influence photosynthesis, water relations, and soluble carbohydrates of two ecotypes of redbud (Cercis canadensis). J. Am. Soc. Hortic. Sci. 129, 497–502. doi: 10.21273/jashs.129.4.0497
Habiba, U., Shaw, R., and Takeuchi, Y. (2011). Drought risk reduction through a socio-economic, institutional and physical approach in the northwestern region of Bangladesh. Environ. Hazards. 10, 121–138. doi: 10.1080/17477891.2011.582311
Harmeling, S., and Röse, M. (2010). Global climate risk index 2010: who is most vulnerable? Weather-related loss events since 1990 and how Copenhagen needs to respond. Bonn, Germany: Germanwatch.
Hasan, Z., Akhter, S., and Islam, M. (2014). Climate change and trend of rainfall in the south-east part of coastal Bangladesh. Eur. Sci. J. 10, 25–39.
Helsel, D. R., and Hirsch, R. M. (1992). Statistical methods in water resources. Technometrics 36:323. doi: 10.2307/1269385
Hirai, G., Okumura, T., Takeuchi, S., Tanaka, O., and Chujo, H. (2000). Studies on the effect of the relative humidity of the atmosphere on the growth and physiology of rice plants. Plant Prod. Sci. 3, 129–133. doi: 10.1626/pps.3.129
Hirsch, R. M., Slack, J. R., and Smith, R. A. (1982). Techniques of trend analysis for monthly water quality data. Water Resour. Res. 18, 107–121. doi: 10.1029/WR018i001p00107
Hulme, M., and Viner, D. (1998). A climate change scenario for the tropics. Clim. Chang. doi: 10.1023/a:1005376007729
Hussain, S., Khaliq, A., Ali, B., Hussain, H. A., Qadir, T., and Hussain, S. (2019). “Temperature extremes: impact on rice growth and development” in Plant abiotic stress tolerance: agronomic, molecular and biotechnological approaches. eds. M. Hasanuzzaman, K. R. Hakeem, K. Nahar, and H. F. Alharby (Cham: Springer), 153–171.
IPCC (2007) Impacts, adaptation and vulnerability: Working Group II contribution to the fourth assessment report of the IPCC. New York, NY, USA: Intergovernmental Panel on Climate Change, Cambridge University Press.
IPCC IPOCC (2007) Climate change 2007—the physical science basis: Working Group I contribution to the fourth assessment report of the IPCC. New York, NY, USA: Intergovernmental Panel on Climate Change, Cambridge University Press.
Islam, M. N., and van Amstel, André (2018) Bangladesh I: climate change impacts, mitigation and adaptation in developing countries. Switzerland: Springer Cham, Springer Nature. doi: 10.1007/978-3-319-26357-1
Jassby, A., and Cloern, J. (2022) wql: Exploring water quality monitoring data. Vienna: Institute for Statistics and Mathematics.
Kabir, M. S., Salam, M. U., Chowdhury, A., Rahman, N. M. F., Iftekharuddaula, K. M., Rahman, M. S., et al. (2016). Rice vision for Bangladesh: 2050 and beyond. Bangladesh Rice J. 19, 1–18. doi: 10.3329/brj.v19i2.28160
Kabir, M. S., Salam, M., Islam, A., Sarkar, M. A. R., Mamun, M. A. A., Rahman, M. C., et al. (2020). Doubling rice productivity in Bangladesh: a way to achieving SDG 2 and moving forward. Bangladesh Rice J. 24, 1–47. doi: 10.3329/BRJ.V24I2.53447
Kampata, J. M., Parida, B. P., and Moalafhi, D. B. (2008). Trend analysis of rainfall in the headstreams of the Zambezi River basin in Zambia. Phys. Chem. Earth 33, 621–625. doi: 10.1016/j.pce.2008.06.012
Kamruzzaman, M., Hwang, S., Cho, J., Jang, M. W., and Jeong, H. (2019). Evaluating the spatiotemporal characteristics of agricultural drought in Bangladesh using effective drought index. Water 11:2437. doi: 10.3390/W11122437
Kang, Y., Khan, S., and Ma, X. (2009). Climate change impacts on crop yield, crop water productivity and food security—a review. Prog. Nat. Sci. 19, 1665–1674. doi: 10.1016/j.pnsc.2009.08.001
Kayano, M. T., and Sanságolo, C. (2009). Interannual to decadal variations of precipitation and daily maximum and daily minimum temperatures in southern Brazil. Theor. Appl. Climatol. 97, 81–90. doi: 10.1007/s00704-008-0050-4
Khalil, U., Ali, S., Rizwan, M., Rahman, K. U., Ata-Ul-Karim, S. T., Najeeb, U., et al. (2018). “Role of mineral nutrients in plant growth under extreme temperatures” in Plant nutrients and abiotic stress tolerance. eds. M. Fujita, H. Oku, K. Nahar, and B. Hawrylak-Nowak (Singapore: Springer).
Kulp, S. A., and Strauss, B. H. (2019). New elevation data triple estimates of global vulnerability to sea-level rise and coastal flooding. Nat. Commun. 10, 4844–4812. doi: 10.1038/s41467-019-12808-z
Libiseller, C., and Grimvall, A. (2002). Performance of partial Mann–Kendall tests for trend detection in the presence of covariates. Environmetrics 13, 71–84. doi: 10.1002/env.507
Lobell, D. B., Cahill, K. N., and Field, C. B. (2007). Historical effects of temperature and precipitation on California crop yields. Clim. Change 81, 187–203. doi: 10.1007/s10584-006-9141-3
Luo, Z. J., Kley, D., Johnson, R. H., Liu, G. Y., Nawrath, S., and Smit, H. G. J. (2012). Influence of sea surface temperature on humidity and temperature in the outflow of tropical deep convection. J. Clim. 25, 1340–1348. doi: 10.1175/2011JCLI4124.1
Mohidem, N. A., Hashim, N., Shamsudin, R., and Man, H. C. (2022). Rice for food security: revisiting its production, diversity, Rice milling process and nutrient content. Agriculture 12:741. doi: 10.3390/AGRICULTURE12060741
Mortensen, L. M. (1986). Effect of relative humidity on growth and flowering of some greenhouse plants. Sci. Hortic. 29, 301–307. doi: 10.1016/0304-4238(86)90013-0
Mortensen, L. M., and Gislerød, H. R. (1990). Effects of air humidity and supplementary lighting on foliage plants. Sci. Hortic. 44, 301–308. doi: 10.1016/0304-4238(90)90130-7
Mortuza, M. R., Selmi, S., Khudri, M. M., Ankur, A. K., and Rahman, M. M. (2014). Evaluation of temporal and spatial trends in relative humidity and dew point temperature in Bangladesh. Arab. J. Geosci. 7, 5037–5050. doi: 10.1007/s12517-013-1139-3
Mullick, M. R. A., Nur, M. R. M., Alam, M. J., and Islam, K. M. A. (2019). Observed trends in temperature and rainfall in Bangladesh using pre-whitening approach. Glob. Planet. Change 172, 104–113. doi: 10.1016/j.gloplacha.2018.10.001
Nagabhatla, N., Sahu, S. K., Gaetaniello, A., Wen, L., and Lee, W. (2014). “Understanding impacts of climate variation in varied socio-ecological domains: a prerequisite for climate change adaptation and management” in Handbook of climate change adaptation (Berlin: Springer), 1–25.
Oh-e, I., Saitoh, K., and Kuroda, T. (2007). Effects of high temperature on growth, yield and dry-matter production of rice grown in the paddy field. Plant Prod. Sci. 10, 412–422. doi: 10.1626/pps.10.412
Ozkan, B., and Akcaoz, H. (2002). Impacts of climate factors on yields for selected crops in southern Turkey. Mitig Adapt Strateg Glob Chang. 7, 367–380. doi: 10.1023/A:1024792318063
Parrish, R., Colbourn, T., Lauriola, P., Leonardi, G., Hajat, S., and Zeka, A. (2020). A critical analysis of the drivers of human migration patterns in the presence of climate change: a new conceptual model. Int. J. Environ. Res. Public Health 17:6036. doi: 10.3390/ijerph17176036
Partal, T., and Kahya, E. (2006). Trend analysis in Turkish precipitation data. Hydrol. Process. 20, 2011–2026. doi: 10.1002/hyp.5993
Rahman, M. N., Azim, S. A., Jannat, F. A., Hasan Rony, M. R., Ahmad, B., and Sarkar, M. A. R. (2023). Quantification of rainfall, temperature, and reference evapotranspiration trend and their interrelationship in sub-climatic zones of Bangladesh. Heliyon 9:e19559. doi: 10.1016/j.heliyon.2023.e19559
Rahman, M. A., Kang, S. C., Nagabhatla, N., and Macnee, R. (2017). Impacts of temperature and rainfall variation on rice productivity in major ecosystems of Bangladesh. Agric. Food Secur. 6:10. doi: 10.1186/s40066-017-0089-5
Rahman, M. C., Rahaman, M. S., Biswas, J. C., Rahman, N. M. F., Islam, M. A., Sarkar, M. A. R., et al. (2022). Climate change and risk scenario in Bangladesh. Asia-Pac. J. Reg. Sci. 7, 381–404. doi: 10.1007/s41685-022-00252-9
Raj, S., Roodbar, S., Brinkley, C., and Wolfe, D. W. (2022). Food security and climate change: differences in impacts and adaptation strategies for rural communities in the global south and north. Front. Sustain. Food Syst. 5, 1–18. doi: 10.3389/fsufs.2021.691191
Rakib, Z. (2018). Characterization of climate change in southwestern Bangladesh: trend analyses of temperature, humidity, heat index, and rainfall. Clim. Res. 76, 241–252. doi: 10.3354/cr01535
Sarker, M. A. R., Alam, K., and Gow, J. (2013). Assessing the determinants of rice farmers’ adaptation strategies to climate change in Bangladesh. Int. J. Clim. Change Strateg. Manag. 5, 382–403. doi: 10.1108/IJCCSM-06-2012-0033
Sawan, Z. M. (2018). Climatic variables: evaporation, sunshine, relative humidity, soil and air temperature and its adverse effects on cotton production. Inf. Process. Agric. 5, 134–148. doi: 10.1016/j.inpa.2017.09.006
Schmidhuber, J., and Tubiello, F. N. (2007). Global food security under climate change. Proc. Natl. Acad. Sci. U.S.A. 104, 19703–19708. doi: 10.1073/pnas.0701976104
Sen, P. K. (1968). Estimates of the regression coefficient based on Kendall’s tau. J. Am. Stat. Assoc. 63, 1379–1389. doi: 10.1080/01621459.1968.10480934
Shahid, S. (2010). Recent trends in the climate of Bangladesh. Clim. Res. 42, 185–193. doi: 10.3354/cr00889
Shahid, S. (2012). “Rainfall variability and changes in Bangladesh during the last fifty years” in Rainfall: behavior, forecasting & distribution, Eds. O. E. Martin and T. M. Roberts Nova, UK: Science Pub Inc. 23–44.
Shahid, S., and Behrawan, H. (2008). Drought risk assessment in the western part of Bangladesh. Nat. Hazards 46, 391–413. doi: 10.1007/s11069-007-9191-5
Shahid, S., Bin, H. S., and Katimon, A. (2012). Changes in diurnal temperature range in Bangladesh during the time period 1961–2008. Atmos. Res. 118, 260–270. doi: 10.1016/j.atmosres.2012.07.008
Shahid, S., and Khairulmaini, O. S. (2009). Spatio-temporal variability of rainfall over Bangladesh during the time period 1969–2003. Asia-Pac. J. Atmos. Sci. 43, 375–389.
Sultana, N. (2020). Analysis of landslide-induced fatalities and injuries in Bangladesh: 2000–2018. Cogent. Soc. Sci. 6:173402. doi: 10.1080/23311886.2020.1737402
Tabari, H., Marofi, S., Aeini, A., Talaee, P. H., and Mohammadi, K. (2011). Trend analysis of reference evapotranspiration in the western half of Iran. Agric. For. Meteorol. 151, 128–136. doi: 10.1016/j.agrformet.2010.09.009
Tho, K. E., Brisco-McCann, E., Wiriyajitsomboon, P., and Hausbeck, M. K. (2019). Effects of temperature, relative humidity, and plant age on bacterial disease of onion plants. Plant Health Prog. 20, 200–206. doi: 10.1094/PHP-05-19-0038-RS
Turral, H., Burke, J., and Faures, J. M. (2011) Climate change, water and food security. Rome: Food and Agriculture Organization of the United Nations.
Uddin, M. A., Kamal, A. S. M. M., Shahid, S., and Chung, E. S. (2020). Volatility in rainfall and predictability of droughts in northwest Bangladesh. Sustainability 12:9810. doi: 10.3390/su12239810
Wheeler, T., and von Braun, J. (2013). Climate change impacts on global food security. Science 341, 508–513. doi: 10.1126/science.1239402
Yoshida, S. (1981) Fundamentals of rice crop science. Los Baños, Laguna, Philippines: International Rice Research Institute.
Keywords: Bangladesh, climate variability, Mann–Kendall test, quantile regression, rice, Sen’s slope test
Citation: Al Mamun MA, Nihad SAI, Sarkar MAR, Sarker MR, Skalicka J and Skalicky M (2023) Spatio-temporal variability of climatic variables and its impacts on rice yield in Bangladesh. Front. Sustain. Food Syst. 7:1290055. doi: 10.3389/fsufs.2023.1290055
Edited by:
Siyabusa Mkuhlani, International Institute of Tropical Agriculture (IITA), KenyaReviewed by:
Shakirudeen Lawal, North Carolina State University, United StatesAbel Chemura, Potsdam Institute for Climate Impact Research (PIK), Germany
Copyright © 2023 Al Mamun, Nihad, Sarkar, Sarker, Skalicka and Skalicky. This is an open-access article distributed under the terms of the Creative Commons Attribution License (CC BY). The use, distribution or reproduction in other forums is permitted, provided the original author(s) and the copyright owner(s) are credited and that the original publication in this journal is cited, in accordance with accepted academic practice. No use, distribution or reproduction is permitted which does not comply with these terms.
*Correspondence: Md. Abdur Rouf Sarkar, mdrouf_bau@yahoo.com