Land tenure security and luxury support plant species and trait diversity in urban community gardens
 Stacy M. Philpott
 Peter Bichier
 Genesis Perez2
  Shalene Jha
 Heidi Liere
 Brenda B. Lin
- 1Department of Environmental Studies, University of California, Santa Cruz, Santa Cruz, CA, United States
- 2Inter American University of Puerto Rico, Arecibo, Puerto Rico
- 3Department of Integrative Biology, University of Texas, Austin, TX, United States
- 4Lady Bird Johnson Wildflower Center, University of Texas, Austin, TX, United States
- 5Environmental Studies Program, Seattle University, Seattle, WA, United States
- 6CSIRO Land and Water, Brisbane, QLD, Australia
Urban ecological communities are shaped by an array of environmental and physical factors that include climate, biogeography, species interactions, dispersal, and ecological filters at the habitat and landscape scales. In addition, many social dynamics, decision-making processes, and other social characteristics, such as development, policy, government actions, as well as socioeconomic status of residents – the so-called ‘luxury’ effect – may also play strong roles in shaping which species occur within the urban context. This interaction between ecological and social drivers may impact species richness and may also influence functional traits and functional diversity, with important implications for ecosystem services provided within urban spaces. Urban agroecosystems provide food and other well-being benefits to urban residents, and are valuable green spaces in the city that provide refuges for biodiversity. Despite this fact, one of the biggest risks to gardens is insecure land tenure. While plant communities within gardens may be shaped by gardener demographics, food cultures, and ecological processes, little is known about how factors such as luxury and land tenure security may impact plant diversity, plant functional traits, and functional diversity, as well as species and trait composition. In this study, we ask how garden physical features, luxury, and land tenure security influence plant species richness, functional diversity, and species and trait composition within gardens in the California central coast. We surveyed vegetation, assessed plant traits related to growth form, plant defense, and floral characteristics, and collected information on multiple factors associated with land tenure and luxury. We found that land tenure secure gardens had higher plant and crop richness. Variables associated with garden luxury boosted ornamental plant richness, flower abundance and height, lowered crop richness, and strongly impacted plant species composition. Garden plot size negatively correlated with plant species and functional richness and relative abundance of trees. Weed species richness was not impacted by any social or physical feature examined. Thus overall, in community gardens, cultivated plants, and their traits, are strongly shaped by the socioeconomic factors of land tenure security and luxury as well as the spatial distribution and size of garden plots, with important implications for both conservation and ecosystem services provided by garden habitats within cities.
1. Introduction
As for all ecosystems, urban ecological communities are shaped by a myriad of factors including regional climate, biogeography, environmental filtering, species interactions, and dispersal, which may be influenced by key physical features of the landscape, such as land use type, habitat patch size, and habitat patch age (Aronson et al., 2016; Andrade et al., 2020). However, beyond these physical and ecological forces, within urban ecosystems, a number of social dynamics including government actions, development decisions, as well as neighborhood and individual sociodemographic factors play an outsized and complex role in influencing species presence and abundance (Swan et al., 2011; Andrade et al., 2020). For example, decades-old discriminatory practices in city development, such as redlining, continue to dramatically alter tree cover in neighborhoods inhabited by racial and ethnic minorities (Locke et al., 2021) and can limit ecosystem services provided by trees in those areas (e.g., Ziter et al., 2019). Moreover, western social norms and preferences for manicured lawns limit herbaceous plant diversity (Nassauer et al., 2009), and worries or perceptions about safety in areas with taller, more dense vegetation (where, for example, criminals may hide) may limit the success of native plantings that benefit bee diversity (e.g., Turo and Gardiner, 2019). Many earlier studies have made important strides to elucidate ecological forces shaping communities in urban environments (e.g., Schlesinger et al., 2008; Harrison and Winfree, 2015; Glaum et al., 2017; Lowe et al., 2018; Planillo et al., 2021), and more recently, the role of social factors in shaping urban ecological communities has gained support, both in the literature, and in theoretical framings (Andrade et al., 2020). Given the current high levels of expansion of urban land use (Seto et al., 2012) and dramatic shifts in species richness and composition within cities (McKinney, 2002; Shochat et al., 2010; Aronson et al., 2014), understanding how these key ecological and social drivers both contribute to biodiversity in urban green spaces is critical.
Urban community gardens are important green spaces both for human well-being and for biodiversity, and include urban farms as well as community, allotment, backyard, and rooftop gardens, among other spaces, located across cities and dedicated to the cultivation of vegetables, medicinal plants, fruit trees, ornamental plants, and associated products (Lovell, 2010; Zezza and Tasciotti, 2010; Lin et al., 2015). These spaces serve as important habitat for biodiversity (e.g., Jha et al., 2023), provide 15–20% of the global food supply (Smit et al., 1996; Hodgson et al., 2011), are an important source of vitamin-rich vegetables and fruits (Wakefield et al., 2007; Gregory et al., 2015), and promote gardener health and well-being (Brown and Jameton, 2000; Classens, 2014). Further, patterns of biodiversity within urban gardens represent ‘facilitated assembly’ communities that cannot be explained by ecological theory alone without taking a socioeconomic perspective (e.g., Martin et al., 2004; Kinzig et al., 2005; Daniels and Kirkpatrick, 2006; Kirkpatrick et al., 2007). Because urban gardeners are the primary managers of their individual habitat patches, past work has indicated that plant species richness and composition may differ depending on gardener culture or foodways (Baker, 2004; Clarke and Jenerette, 2015; Burdine and Taylor, 2017), age, ethnicity, and class (Bernholt et al., 2009; Clarke et al., 2014; Philpott et al., 2020), gender (Richardson and Mitchell, 2010; Taylor et al., 2017; Philpott et al., 2020), years of experience or knowledge of gardening (Clarke et al., 2014) or even the total time they spend gardening (Philpott et al., 2020). Despite these past findings, a number of well-established social mechanisms remain unexplored in urban ecological research.
One potentially impactful factor for gardener planting decisions that has been underexplored in terms of its ecological impact (Raneng et al., 2023) is land tenure security. Land tenure security is often considered in a legal sense referring to the official title of a property or the recognition of property rights regardless of formal paperwork (Uwayezu and de Vries, 2018). Gardens located on publicly-held land (e.g., owned by city, county or public school entities) may have more secure land tenure relative to privately held land, in part, because public land use for gardens is often established and sustained over long time periods through community support (e.g., Glennie, 2020). In contrast, land tenure security for gardens on privately-held land is more risk-laden (Pfeiffer et al., 2015), as private landowners may allow gardener use of their property just temporarily until the space is needed for development (Yuen, 2012), or just long enough to meet the requirements for receiving tax incentives (Arnold and Roge, 2018). In addition to the land title, land tenure security is defined by the perceptions of residents or land users and can be influenced by factors such as time in use, presence of utility services, access to decision making about land use, perceived risk of loss, and how well an area represents the social identity of a surrounding community (e.g., Uwayezu and de Vries, 2018; Glennie, 2020; Dachaga and de Vries, 2022). A high fraction (upwards of 80%) of urban community gardeners do not own the land that they cultivate (Lawson and Drake, 2012). Such insecure land tenure may affect garden management by resulting in a sense of ‘temporariness’ that leads to a lack of investment in gardens (Arnold and Roge, 2018), less dedication to building soils or infrastructure (Pfeiffer et al., 2015), and may alter what gardeners choose to cultivate (Glowa et al., 2018), especially if gardeners feel threatened or do not think a garden will persist into the future (Wakefield et al., 2007). Thus, while the relationship is rarely studied, land tenure security may strongly influence gardener planting choices, and therefore impact plant diversity and composition.
A second relatively understudied factor that could influence plant diversity and community composition within urban gardens is the so-called ‘luxury effect’. The luxury effect is defined as the positive relationship between wealth and biodiversity, and it has been documented in a variety of urban settings across a number of different taxa (Leong et al., 2018; Schell et al., 2020). This relationship can be explained by the fact that households (and by default neighborhoods) with higher education, more financial resources, and more household and discretionary income, can support enhanced biodiversity in landscaping, yards, and gardens because the spaces are larger and more plants are integrated for esthetic reasons. This luxury-related difference in size and design of private green space may potentially lead to larger scale effects on within-city biodiversity patterns (Schell et al., 2020). While some past studies examine relationships between wealth metrics (e.g., household income, property value) and biodiversity in urban gardens (e.g., Clarke and Jenerette, 2015; Iuliano et al., 2017), there are few studies that evaluate patterns of plant richness and composition in gardens (e.g., agrobiodiversity), that report patterns of relative abundance of different plant species, and that examine these key social drivers of plant biodiversity and composition (Raneng et al., 2023).
Finally, beyond species-level diversity and composition, it is vital to understand the functional diversity and composition of plant traits, as these critically impact plant ecosystem functioning, and can affect herbivores and ecosystem service providers like pollinators and natural enemies (Cornelissen et al., 2003; Pérez-Harguindeguy et al., 2013; Fountain-Jones et al., 2015; Perovič et al., 2018). Despite this, we are not aware of any studies that have quantified or examined the drivers of plant trait variation and diversity within urban gardens. Variation in suites of plant traits can indicate how plants respond to environmental changes (such as in climate, atmospheric chemistry, land use, or other disturbances), explain patterns in plant growth, competition, and defense (Diaz and Cabido, 2001; Cornelissen et al., 2003), and determine how plant species affect ecosystem services (Lavorel and Garnier, 2002; Suding and Goldstein, 2008; Lavorel et al., 2013). For example, plant growth form is a trait that is affected by both climatic factors and land use and is also linked to plant adaptive strategies, like competitive vigor, biomass, rooting depth, and leaf size (de Bello et al., 2010; Funk et al., 2017 and references therein). Traits like higher average foliage height can maximize photosynthesis and minimize herbivory, and also protect plants from abiotic factors such as severe climatic conditions (Cornelissen et al., 2003; Pérez-Harguindeguy et al., 2013). The presence of trichomes can hinder herbivore feeding and have cascading effects on natural enemies (as cited in Perovič et al., 2018), while floral traits, like flower shape and color can strongly affect pollinator or natural enemy visitation (Rosas-Guerrero et al., 2014; Perovič et al., 2018).
Further, measuring trait diversity at the community level can be particularly effective at describing the suite of traits supported in a single habitat patch and can be quantified in several ways (Funk et al., 2017). Community weighted mean (CWM) values use species’ relative abundances and trait values for each species to calculate a community aggregated trait value (Violle et al., 2007). Functional diversity indices (e.g., functional richness, diversity or evenness), especially those that consider multiple traits, can be used to examine the amount of trait space that is filled by a community (Villeger et al., 2008). Still other metrics focus on abundance-weighted measures of trait space filled by members of a community (e.g., functional dispersion, Rao’s quadratic entropy, Botta-Dukat, 2005; Laliberté and Legendre, 2010). Altogether, these metrics are powerful tools for understanding community-level niche complementarity and resulting ecosystem function (Mouillot et al., 2013; Perovič et al., 2018). We posit that, in addition to understanding the drivers of plant diversity and composition, it is essential to quantify the social drivers of plant trait variation in order to capture potential impacts on ecosystem function.
Given the limited investigation of key socioeconomic impacts on urban garden plant biodiversity and functional traits, our aims were twofold. First, we aimed to quantitatively characterize the vegetation in urban gardens in the California Central Coast by describing total richness and relative abundance of herbaceous plants (crops, ornamental plants, and weeds), as well as trees and shrubs. Second, we asked two specific research questions related to the social drivers of plant and trait diversity and composition: (1) How do land tenure security, luxury, and garden physical features influence plant species richness and composition in urban community gardens?, and (2) How do land tenure security, luxury, and garden physical features influence plant functional trait diversity and composition in urban community gardens?
We focused our plant measurements on differences in crops, ornamentals, and weeds that may play fundamentally different roles for gardeners (e.g., Clarke and Jenerette, 2015), as well as traits that likely support ecosystem services provided by plants and beneficial insects. We focused our measurement of land tenure security and luxury on variables important in urban ecosystems, including factors related to income and land ownership. We also measured physical garden characteristics. Specifically, we hypothesized that gardens with greater land tenure security will have higher plant and crop species richness, higher functional richness, and more traits associated with larger or longer-lived plants. We also hypothesize that gardens will exhibit a luxury effect where plant richness across crop and ornamental groups, as well as traits associated with floral abundance, will increase with income. Additionally, we hypothesize that plant richness and diversity will correlate with garden size, and that plant species composition will differ across income levels. In posing these questions and hypotheses, we assume that gardeners are largely making planting choices for their garden plots at the level of plant species or cultivar, although they may also be selecting for particular traits that they find attractive or useful for their garden plots (e.g., colorful flowers, nitrogen fixing, beneficial to pollinators). We also suppose that gardeners are unlikely to be choosing plants with the intent of increasing functional trait diversity within their plots. Nevertheless, if land tenure, luxury, or garden physical characteristics influence gardener planting choices, this may ultimately impact plant species diversity and composition, and thereby indirectly impact plant functional trait richness and composition.
2. Methods
2.1. Description of study sites
We collected vegetation data in 2021 in a network of 23 urban community gardens in the California central coast in Monterey, Santa Clara, and Santa Cruz Counties (Supplementary Figure S1) where the research team has worked since 2013 (see Jha et al., 2023). The gardens were originally selected for their variation in management and landscape surroundings. All gardens are community gardens where vegetables, fruit trees, and ornamental plants are grown. The gardens are managed either collectively by groups of volunteer or paid managers, or in individual plots or allotments. Gardens range in size from 444 m2 to 15,400 m2, and have been cultivated for between 5–54 years. Each garden was separated from other garden sites by at least 2 km and up to 90 km.
2.2. Vegetation survey methods
In each garden, we sampled vegetation to describe the plant community. At the center of each garden, we established a 20 m × 20 m plot within which we counted the number of tree and shrub individuals and identified all trees and shrubs to species. Then, within eight randomly located 1 m × 1 m plots within the 20 m × 20 m plot, we identified and estimated the percent cover from each herbaceous plant species. We surveyed vegetation three times over the summer of 2021 (June 21–25, July 6–11, and August 2–5).
2.3. Plant classification
Because of differences in the way the gardeners may use or perceive different types of plants, following identification of plants (herbaceous, trees, and shrubs) to species, we also classified each plant species according to whether they are commonly referred to as crops (e.g., vegetables, fruits, herbs, medicinal plants), ornamentals (e.g., flowering plants planted on purpose), weeds (e.g., spontaneous herbs that although may be used by gardeners for food are not intentionally planted), or grass. For herbaceous plants, we focused species identification and trait measurement effort on forbs (herbaceous non-grasses) as in other urban garden systems (e.g., Ballare et al., 2019) as grasses comprised less than <5% of the herbaceous cover. We encountered 18 herbaceous plant morphospecies (representing just 0.9% of all plant cover surveyed) and nine tree or shrub morphospecies (representing only 1.2% of all tree and shrub individuals counted) that we were not able to identify to family or genus. These were excluded from the analysis.
2.4. Plant functional trait measurements
Using data from the same standardized vegetation surveys as those described, but conducted from 2016–2018 in 30 gardens within the same study region, we compiled a full plant species list, and calculated the relative abundance of each species based on either raw abundance data (for trees and shrubs) or percent cover data (for herbaceous plants). We then identified for trees and shrubs, and separately for herbaceous plants, the most abundant species that collectively represent 70–80% of the total relative abundance for each plant group, as this range is recommended to effectively characterize plant traits within a community (Cornelissen et al., 2003). This resulted in a list of 88 plant species from 34 families: 73 herbaceous plant species (covering 77% of percent cover) and 15 tree and shrub species (or 70% of individuals counted) (Supplementary Table S1). For each of these 88 species, we collected a suite of traits from individual plants during summer 2021, targeting traits important for beneficial insects, including pollinators and natural enemies (e.g., Perovič et al., 2018).
Specifically, we measured 11 traits for each plant species relating to four categories: (1) plant structure (plant growth, plant volume), (2) plant defense (specific leaf area, spines, trichomes, extrafloral nectaries), (3) floral attraction (flower color, maximum flower height, number of flowers), and (4) floral access (flower shape, flower volume). To capture traits across multiple gardens, we surveyed plant traits from 3 individual plants for each of the 88 selected species. We chose to sample 1 individual from each plant species at each of three sites, each in a different county, that all harbor high herbaceous plant species richness. Specifically, we sampled plant traits at the Trescony Garden in Santa Cruz County, Pacific Grove Community Garden in Monterey County, and Charles Street Garden in Santa Clara County. Some species were not present in one or more of these sites, and so we visited additional sites (Aptos Community Garden, Beach Flats Community Garden, Homeless Garden Project, Pajaro Garden, Senior Center Garden, Valle Verde Garden, and Mi Jardin Verde) to capture data for the 2nd or 3rd plant individual of each species. Due to low abundance, for two plant species, Equisitum sp. (horsetail) and Alstromeria aurea (Peruvian Lily), we measured two individuals at a single site and a third individual at a second site, and for three plant species, Chenopodium album (lamb’s quarters), Lepidium latifolium (pepper grass), and Helminthotheca echiodes (warty dandelion), we only sampled 2 individuals total, at two different sites. There were 18 of the 88 plant species that were not in flower, and thus floral traits were not assessed for those species (Supplementary Table S1).
2.4.1. Plant structure
We measured plant growth form following the categorizations of the Australian National Botanic Australian National Botanic Gardens (2021) and Pérez-Harguindeguy et al. (2013) where trees are woody plants with fewer than 3 stems and more than 5 m tall; shrubs are woody plants less than 8 m tall and with branching at or near soil level; sub-shrubs have stems that are herbaceous in their upper parts; herbs or forbs are plants with no woody tissue present; vines or lianas are climbers rooted in the ground; graminoids are tussock or tufted plants; and stem-succulent shrubs include genera such as Sarcostemma, Opuntia and some Euphorbia. We measured plant volume by measuring plant height (cm) at the tallest point, not including any flowering or fruiting structures, and plant width (cm) at the largest point, and multiplying these two values.
2.4.2. Plant defense
We measured specific leaf area (SLA) by collecting one leaf from each plant surveyed (including the petiole), storing the plant (up to 72 h) in a cooler or refrigerator until photographing with Leafscan (Version 1.3. 2) (Anderson and Rosas-Anderson, 2017) to measure leaf area. We then dried leaves in a drying oven at 40 degrees C for 72 h, or until leaves no longer lost any more mass. We then weighed leaves and calculated SLA as the leaf area divided by dry mass. We measured spines according to Callis-Duehl et al. (2017) and Pérez-Harguindeguy et al. (2013). We included all ‘spines’ (sharp, modified leaves, leaf parts or stipules), ‘thorns’ (sharp, modified twigs or branches) and ‘prickles’ (modified epidermis or cork), and scored each plant according to presence or absence of spines on leaves, stems, and flowers. We then scored plants as 0 (no spines, thorns or prickles on any structures), 1 (presence on leaves, stems, or flowers), 2 (presence on two structures), or 3 (presence on all three structures). We sampled plants for trichome presence according to Callis-Duehl et al. (2017) and Bar and Shtein (2019). We inspected for trichomes on leaves, stems, and flowers with a hand lens, and also noted the presence of simple, star-shaped, or glandular trichomes. We then scored plants as 0 (no trichomes on any structure) to 9 (presence of all three types of trichomes on all three structures). We used the World List of Plants with Extrafloral Nectaries (Weber et al., 2015) to determine for all of the plant species whether or not they are known to have extrafloral nectaries (EFNs).
2.4.3. Floral attraction
For flower color, we recorded the primary and secondary colors (e.g., pink, red, orange, yellow, green, blue, violet, mauve) according to a standardized printed color wheel and then collapsed the flower colors into 16 different color combination categories (as in Rosas-Guerrero et al., 2014). We measured maximum flower height (cm) as the height of the tallest flower on the plant above the ground. We counted the number of flowers on each plant. For plants with >100 flowers or with multiple inflorescences, we counted flowers on a particular stem or inflorescence, and then counted total stems or inflorescences to estimate the total flowers per plant.
2.4.4. Floral access
We measured flower shape according to the ‘Blossom Classes’ in Ollerton et al. (2009) and Rosas-Guerrero et al. (2014). Specifically, flowers were classified as either (a) dish – radially symmetrical, mostly flat access to pollen and nectar (not bell, gullet, brush, or trap shaped); (b) gullet – bilaterally symmetrical, rough conical shape with upper and lower ‘lip’ where pollen is always placed dorsally (near upper lip) on pollinators; (c) flag – bilaterally symmetrical, rough cylindrical shape with upper ‘banner’ and lower ‘keel’ and pollen is always placed ventrally (near keel) on pollinators; or (d) tube – radially symmetrical, narrow tube shaped corolla, often behind the more conspicuous petals. Four flower shape categories (bell, brush, inconspicuous, and trap) were not present in gardens. We measured flower volume following Hegland and Totland (2005) and Lázaro and Totland (2014). For each plant individual, we haphazardly selected one fully open flower, and measured the corolla height (mm), corolla width (mm), and corolla tube length (mm) (for tube-shaped flowers only). We then multiplied the two (or three values) to calculate floral volume.
2.5. Plant trait analysis
We used 2021 vegetation survey data to calculate relative abundance of herbaceous plants as well as trees and shrubs in each garden. For herbaceous plants, we summed total percent cover from each plant species across 24 plots (eight different plots from three time periods), summed the total percent cover from the herbaceous species from which we measured plant traits, and calculated the relative abundance for each species as a fraction of total cover of plants for which we measured plant traits. For trees and shrubs, we calculated the relative abundance as the number of individuals of a species as a fraction of total individuals of trees and shrubs from which we collected trait data. We averaged trait values for each species (for quantitative variables) (3 measurements per trait for 86 plant species and 2 measurements per trait for 2 plant species) and confirmed that categorical variables (e.g., growth form, flower shape) were the same for each species. We natural log (+1) transformed plant volume, number of flowers, flower volume, and the spine indices to meet conditions of normality.
We used the ‘dbFD’ function in the FD package in R to calculate several functional diversity metrics. Functional richness (FRic) describes how much functional trait space is filled by the community; functional evenness (FEve) describes how evenly the abundance distribution is spread across the functional trait space; and functional divergence (FDiv) describes whether the distribution of species along a trait axis is clumped or spread out, and is useful for assessing species complementarity (Villeger et al., 2008; Woodcock et al., 2019). We also measured functional dispersion (FDis) (Laliberté and Legendre, 2010), and Rao’s quadratic entropy (Q) (Botta-Dukat, 2005), two abundance-weighted measures of trait spread. FRic, FDis, and Q are positive, unbounded values representing trait space. FEve is a value bounded between 0 and 1 where values of 0 occur when most species (and species abundances) represent a small fraction of the trait space, and values of 1 occur when species (and species abundances) are regularly spread across the trait space. FDiv is a value bounded between 0 and 1 where values of 0 indicate the most abundant species have traits close to the community centroid, and values of 1 occur when the most abundant species have extreme trait values. Thus, high FDiv represents high niche complementarity (Villeger et al., 2008). We used the ‘gowdis’ function to calculate a species x species distance matrix for all continuous (i.e., plant volume, trichomes, spines, number of flowers, flower height, SLA), binary (i.e., presence or absence of EFNs), and categorical (i.e., growth form, flower shape) variables. All numerical valuables were automatically scaled to mean 0 and unit variance. For flower color, we used a ‘fuzzy coding’ approach (De Bello et al., 2020) such that a plant with multiple flower colors might have an intermediate trait distance to plants that share only one of multiple flower colors. We then calculated species distances weighted by variable type. Continuous variables and flower color (which had 16 levels) distances were multiplied by 0.67 and binary and all other categorical variables were multiplied by 0.33 to give a larger weight to those variables that do not indicate absolute similarity (0) or difference (1) between trait states (as per de Bello et al., 2020). We weighted the FEve, FDiv, FDis, and Rao’s Q calculations by species relative abundance. Finally, we used the ‘funtcomp’ function in FD to calculate the community weighted means (CWM) for each trait variable. We used ‘type all’ to return values for each value for binary and categorical variables, rather than returning the predominant trait state type for each community.
2.6. Land tenure security, ‘luxury’, and garden variables
We collected information on a large set of potential predictor variables related to land tenure security, ‘luxury’, and garden physical characteristics. First, we examined land ownership of the gardens by examining the California Multi-Source Land Ownership layer of the California government GIS database,1 web pages maintained by the organizations that support the gardens,2 and news articles (Meyberg Guzman and Kathan, 2021) and then classified garden properties as either owned publicly (by a state or local government or school district) or privately (by a church, senior or farming organization, or individual). Second, we created a land tenure security index based on the tenure status decision process in Arnold and Rogé (2018). We classified gardens where the gardeners (or their organizations) own the property as 4 (highest land tenure security), gardens with a long-term lease with the property owner as 3 (second highest land tenure security), gardens with short term memorandum of understanding as 2 (third highest land tenure security), and gardens without any of these features, or with imminent risk of eviction as 1 (lowest land tenure security). Third, we examined whether gardens had paid employees (an indicator of economic support for the gardens, and thus higher land tenure security, Arnold and Rogé, 2018) and if gardens were affiliated with a school (a positive indicator of social support and of higher land tenure security, Arnold and Rogé, 2018). Each of these three variables (land tenure security index, presence of paid employees, and affiliation with a school) were determined through informal conversations with gardeners, garden managers, and paid employees over the past decade, and by consulting information on the garden webpages listed above. Fourth, we documented whether the gardens were managed in an allotment style (with each family or individual gardener making decisions about individual plots) or by a single or small group of garden managers making management decisions about the entire garden area. Garden management style (allotment vs. single-manager) substantially overlapped with presence of paid gardeners and with affiliation with a school. For example, all four gardens in our sample with paid gardeners were also the only gardens with a single-manager style and, three of those four gardens were affiliated with a school. No other gardens were affiliated with schools or used a single-manager style. Because of this, of these three variables, we chose to maintain only garden management style in our analysis, and assume that single-manager style is associated with higher land tenure security.
As measures of garden luxury, we gathered information on median property value, percent owner occupied housing units, median household income, and percent of residents below the poverty line for each zip code containing a garden from the 2021 US Census (United States Census Bureau, 2023). We also downloaded Zillow Home Values (Zillow, 2023) for all months between June 2020–July 2021 (the 12 months leading up to the sampling) and averaged values across the year to obtain one value for the zip code for each garden. Property value can indicate both economic status and economic support for garden security (Arnold and Rogé, 2018). The percent of owner-occupied homes can indicate motivation for maintaining a garden (Glennie, 2020). Household income (and conversely percent of residents below the poverty line) can often influence aspects of garden plantings associated with the luxury effect, or indicate fewer financial resources to support garden tenure (Clarke and Jenerette, 2015; Gregory et al., 2015; Arnold and Rogé, 2018; Baldock et al., 2019).
Finally, we included three variables related to the garden physical characteristics -- garden size (ha), garden age (years), and mean plot size (m2) -- all of which may influence biodiversity of plants and other garden organisms (e.g., Goddard et al., 2013; Clarke and Jenerette, 2015; Quistberg et al., 2016). Garden size was measured from Google Earth Pro (2021) using the ruler function. Garden age was determined from speaking with garden managers and by extracting data from city or other historical documents. Mean plot size was calculated by measuring the area of eight haphazardly selected plots varying in size in each garden and calculating the mean area from those values.
2.7. Data analysis
To examine how plant species richness is related to land tenure, luxury, and garden physical features, we built four generalized linear models (GLMs) with the glm function in R (R Core Team, 2022), with total plant species richness, crop species richness, ornamental plant species richness, and weed species richness as the four dependent variables. We used a Gaussian distribution (default identity link). While the Poisson distribution provided a minimally better model fit, it had very similar residual deviance and df values and only slightly lower AIC values (<2 units), as well as identical significant factors as with the Gaussian models, which is easier to interpret in graphical form; thus, we selected the Gaussian models for further analysis. We calculated a variance inflation factor (VIF) for each model set using the car package in R (Fox and Weisberg, 2018) and ensured all VIF scores were below 3. Using this process, we ended up with a final model that included garden size, garden age, plot size, land ownership, land tenure security index, management type, median property value, percent owner occupied housing units, and median household income, the latter three extracted from US census data. We included natural log (LN) transformed values for median property value to improve model fit. We include information on the correlations between the continuous predictor variables in Supplementary Figure S2. For GLMs, we tested all combinations of the 9 selected explanatory variables with the ‘glmulti’ package (Calcagno and de Mazancourt, 2010). We selected the top model based on the AICc values. If other models were within 2 AICc points of the best model, we averaged all models within 2 AICc points with the ‘MuMIn’ package (Barton, 2012) and reported conditional averages for significant model factors (as in Coux et al., 2016). We graphed all significant predictors of total, crop, ornamental, and weed species richness with the ‘visreg’ package in R; where we report average models and visualized graphs comprised of the same variables included in the final averaged model (Breheny and Burchett, 2013).
We similarly wanted to explore the relationships between land tenure, luxury, and garden physical features on plant functional traits, and thus conducted five additional GLMs using the exact same predictor variables and approach described above. As response variables we used the five metrics related to functional trait diversity including functional richness (FRic), functional evenness (FEve), functional divergence (FDiv), functional dispersion (FDis), and Rao’s Quadradic Entropy (Q). To conduct an in-depth examination of variation in individual plant traits, we used the community weighted mean (CWM) for trees, shrubs, plant volume, number of flowers, and flower height as additional dependent variables. We chose these traits because we suspected (more than variables related to flower color, shape or size) that they would be influenced by land tenure, luxury, and hence gardener planting choices. For functional richness (FRic, FEve, FDiv, FDis, Rao’s Q) metrics, and for some of the CWM values (number of flowers, flower height, plant volume) we used a Gaussian distribution (default identity link) as this provided the best fit and lowest AIC values. We used a negative binomial (theta set to 1) for the CWM values for trees and shrubs as this provided the best fit and lowest AIC values.
We assessed differences in composition for five different communities – total plant species, crop species, ornamental plant species, weed species, and plant trait values as measured with CWM values, in three ways. First, we used a permutational multivariate analysis of variance (PERMANOVA) using the “adonis2” function in the “vegan” package version 2.5-4 (Oksanen et al., 2018) to determine if garden size, garden age, plot size, the land tenure security index, management type, land ownership, median property value, percent owner occupied housing units, and median household income are significant predictors of dissimilarity. We used Bray-Curtis distances and conducted 999 permutations for each of the five communities. Second, we created nonmetric multidimensional scaling (NMDS) plots in “ggplot2” (Wickham, 2016) to visualize differences in composition and added arrows or colors for the significant predictors to plots using the “envfit” function in the “vegan” package version 2.5-4 (Oksanen et al., 2018). Third, to determine which individual species or traits varied with significant categorical variables (e.g., management type, land ownership), we used the “multipatt” function in the “indicspecies” package version 1.7.12 (De Caceres and Legendre, 2009). To examine which species varied with significant continuous variables (e.g., garden age, median property value, percent owner occupied housing units, and median household income), we ran fractional logistic regression with the quasibinomial family and logit link. To examine which CWM trait values differed with significant continuous variables (e.g., percent owner occupied housing units) we used GLM as described above with the negative binomial family, and theta = 1. A flow chart of all field methods, data collection, variable preparation, and data analysis is shown in Supplementary Figure S3.
3. Results
3.1. Vegetation characterization
We identified 73 plant families, 187 genera, and 242 plant species or morphospecies, including 147 herbaceous species and 95 trees or shrubs. We encountered 107 crop species (66 herbaceous and 41 trees or shrubs), 94 species of ornamental plants (40 herbaceous and 54 trees or shrubs), and 40 species of weeds (all herbaceous). Crops were responsible for 62.5% of all herbaceous plant cover, ornamental plants for 9.5%, weeds for 23.5%, and grass for 4.4%. Of the trees and shrubs, 67.6% of individuals counted were crops, 32.4% were ornamentals, and none were weeds.
There were 16 herbaceous plant species that were ranked as the ten most common according to either the number of gardens found, the number of plots found, or their total percent cover across all gardens (Table 1; Supplementary Figure S4). Most of those species (14) were ranked in the top ten for all three measures, with two species in the top ten just for the number of plots and total percent cover. Similarly, there were 12 tree or shrub species that were ranked as the ten most common according to the number of gardens found or the percent of all tree or shrub individuals (Table 1; Supplementary Figure S5). Most of these species (8) were top-ranked for both measures, with two in the top ten just for number of gardens found, and two were in the top ten for just percent of individuals.
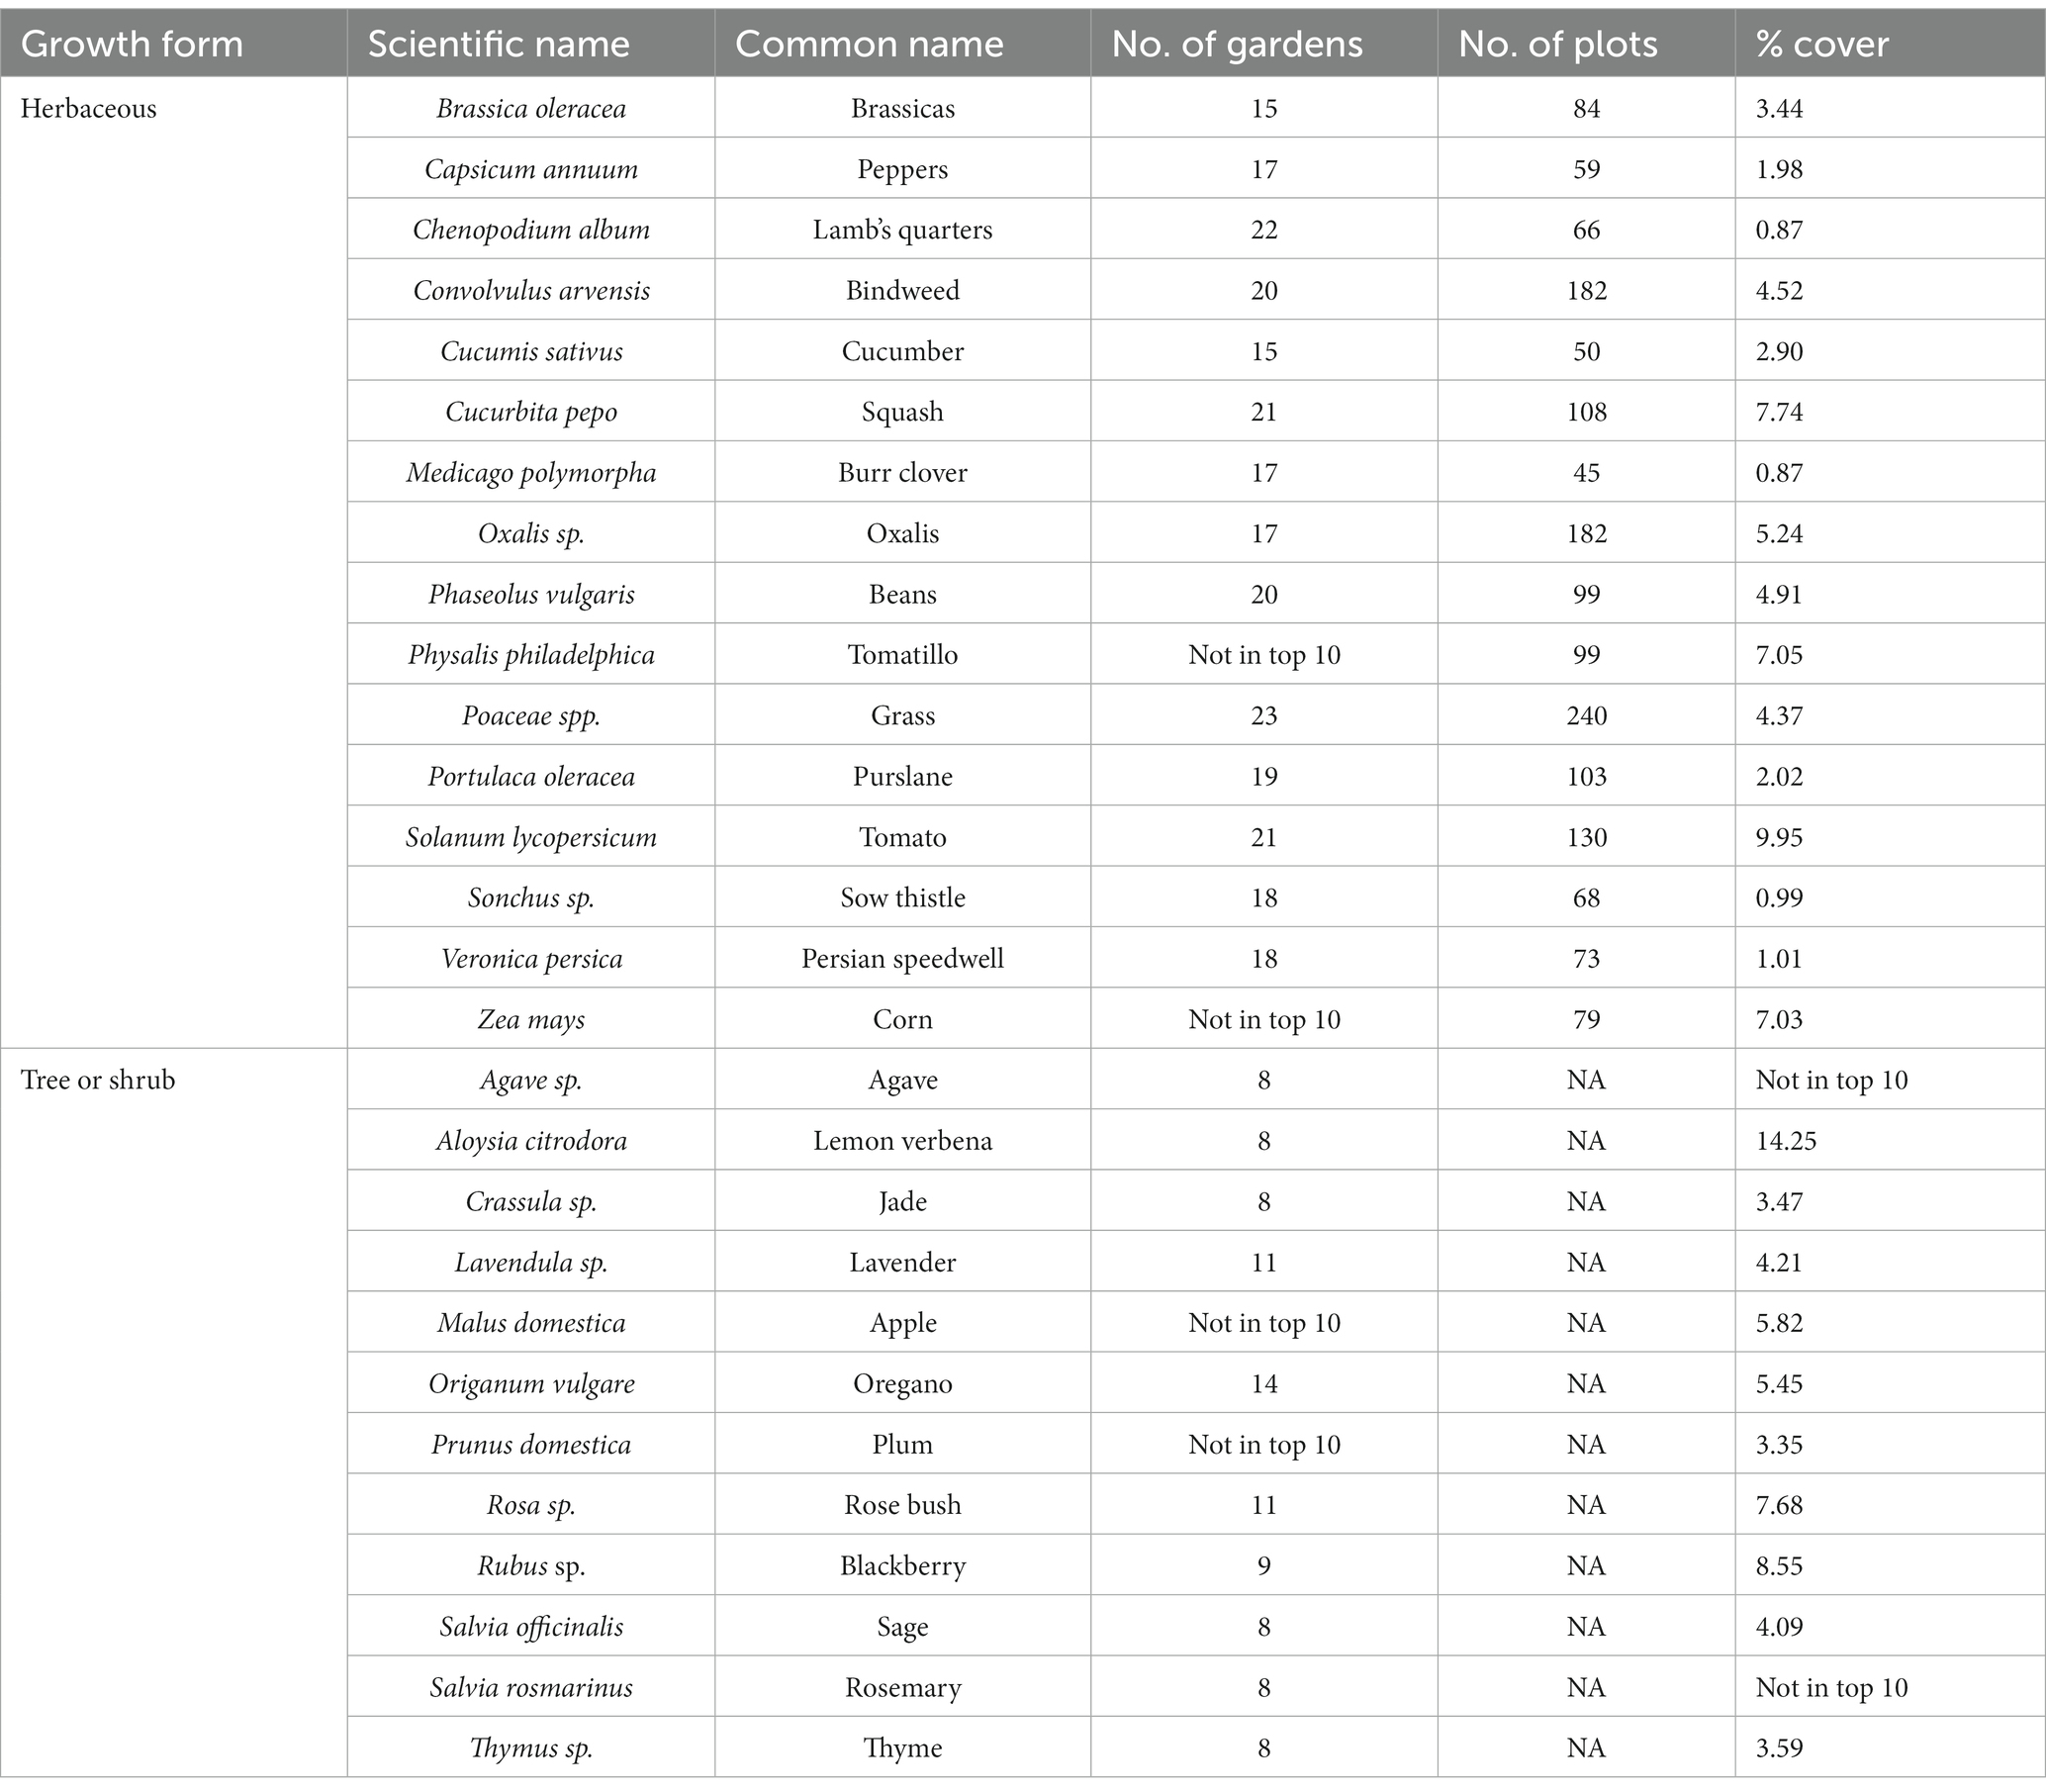
Table 1. List of the most common herbaceous plants and most common trees and shrubs according to three different metrics: number of gardens found, number of plots found, and the percent cover (herbs) or percent of individuals (trees, shrubs) within urban gardens in the California central coast.
3.2. Garden land tenure security, ‘luxury’, and physical characteristics
The characteristics of gardens varied widely in terms of all of the land tenure, ‘luxury’, and physical characteristics measured (Supplementary Table S2). In terms of the land tenure security index, we classified 14 gardens as level 4 (highest land tenure security, garden organization owns the property), five gardens as level 3 (second highest land tenure security, gardens with a long-term lease with property owner), three gardens as level 2 (third highest land tenure security, gardens with short term memorandum of understanding), and one garden as level 1 (lowest land tenure security, imminent risk of eviction). Our data set included 15 publicly-owned gardens and 8 privately-owned gardens, as well as 19 gardens with allotment style management, and 4 single-manager gardens. Property values surrounding each garden ranged from $444,400 to $1,945,100, the percent of owner-occupied housing units surrounding gardens ranged from 31.9 to 81.3%, and median household income ranged from $63,694 to $178,128 per year. Garden size ranged from 0.04 ha to 1.56 ha, garden age ranged from 5 to 54 years of cultivation, and mean plot size ranged from 2.95 m2 to 64.16 m2.
3.3. Predictors of plant species richness
Several aspects of garden physical features, land tenure security, and luxury were predictive of plant species richness. Plant species richness decreased with plot size (z = 2.948, p = 0.003), increased with the land tenure security index (z = 2.854, p = 0.004), and was higher in gardens managed as allotments (compared to those managed by a single or a few employees) (z = 3.321, p = 0.001) (Figures 1A–C; Supplementary Table S3). Similarly, crop species richness decreased with plot size (z = 2.561, p = 0.01), increased with the land tenure security index (z = 3.457, p = 0.001), and was higher in gardens managed as allotments (z = 3.859, p < 0.001) (Figures 1D–H; Supplementary Table S3). In addition, crop species richness increased with median property value (z = 2.364, p = 0.018) and declined with median household income (z = 2.615, p = 0.009). Ornamental plant species richness also decreased with plot size (z = 2.548, p < =0.011) as well as garden size (z = 1.977, p = 0.048), was higher in gardens managed by allotments (z = 2.173, p = 0.03), increased with property value (z = 2.197, p = 0.028), and decreased with the percentage of owner-occupied housing units (z = 2.786, p = 0.005) (Figures 1I–M). Weed species richness was not significantly influenced by any of the garden or socioeconomic factors (z < 1.471, p > 0.141) (Supplementary Table S3).
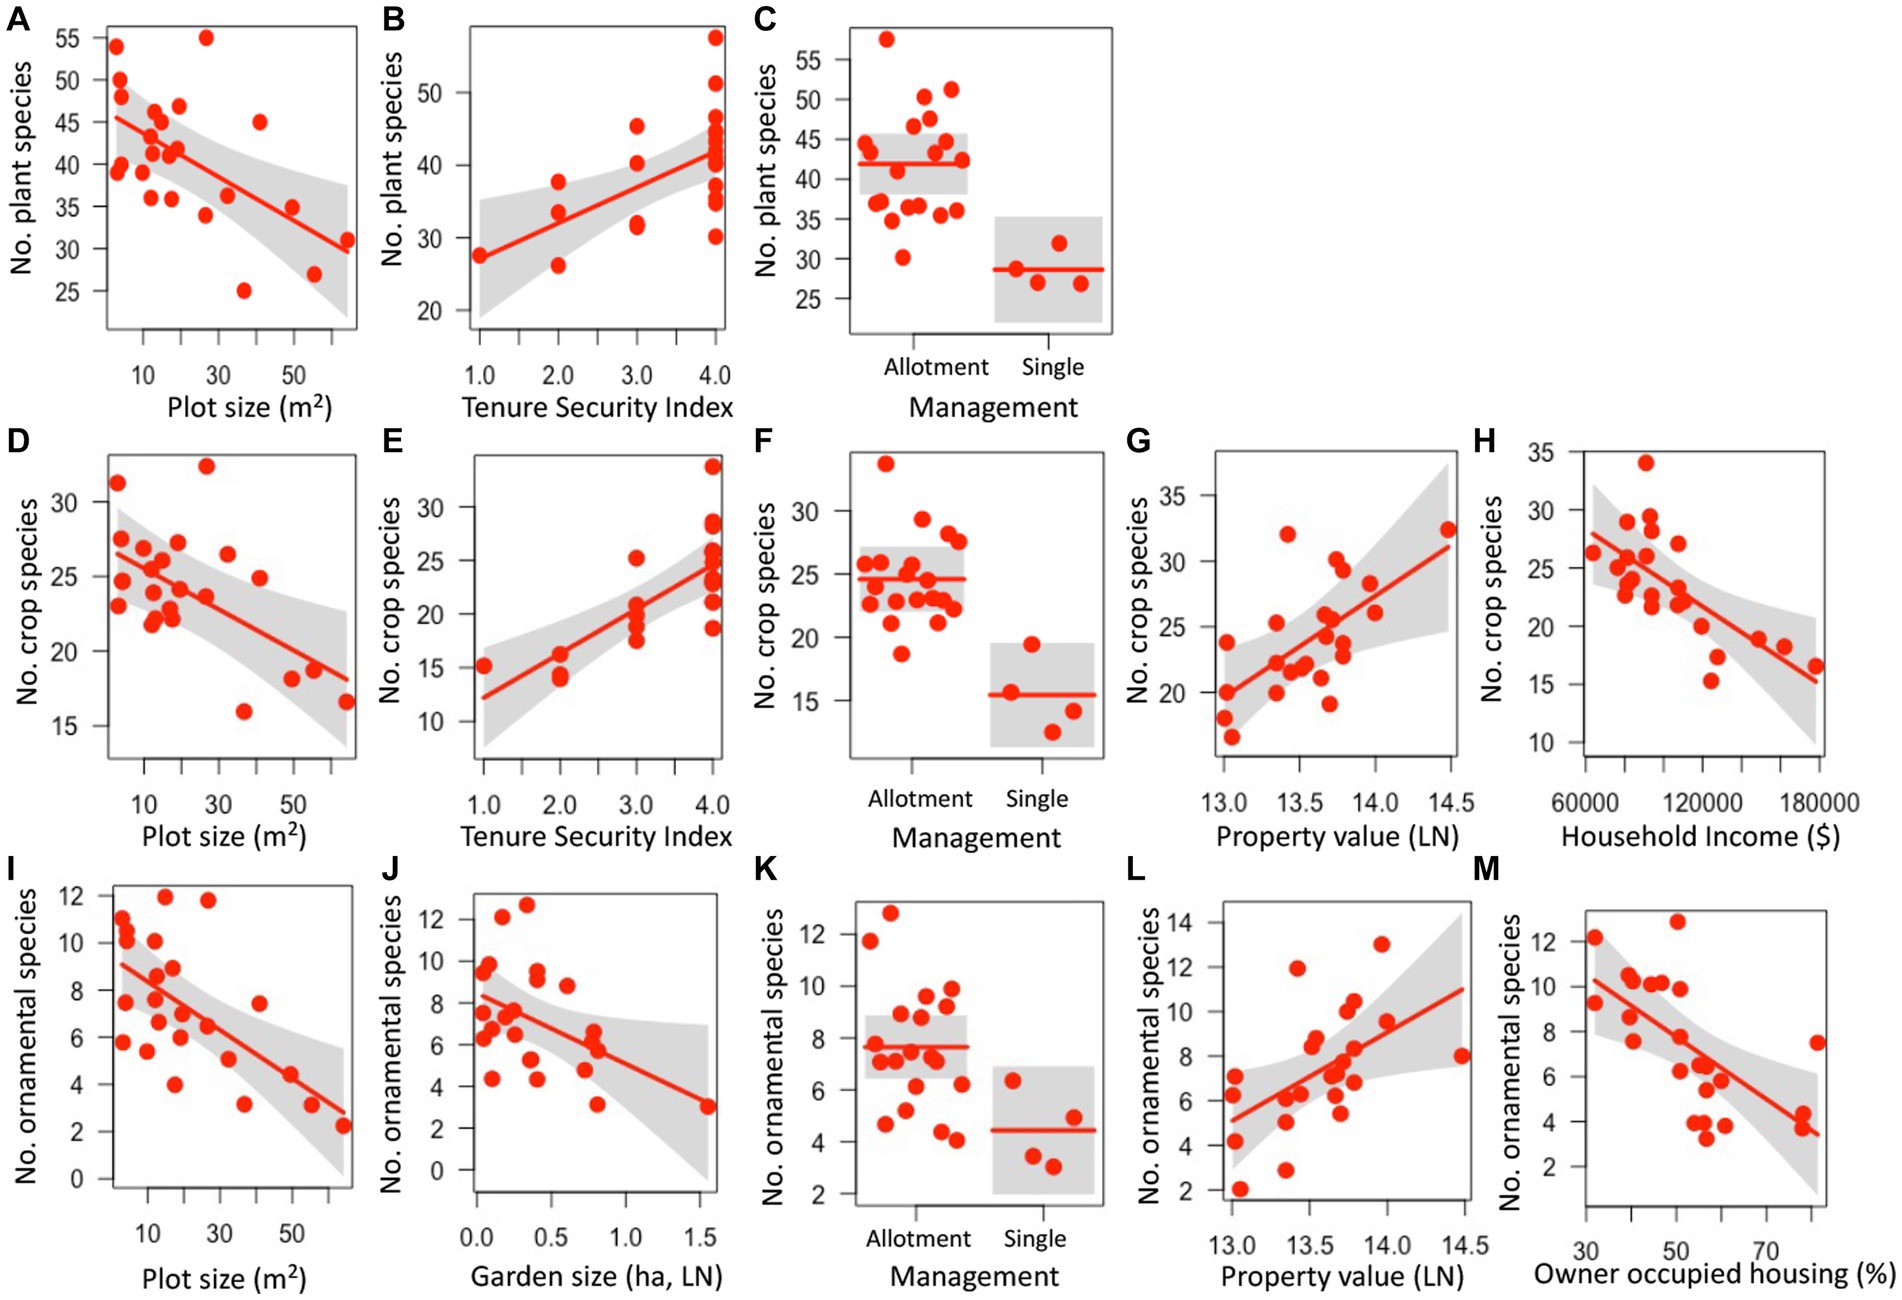
Figure 1. Relationships between garden, land tenure, and socioeconomic factors and plant (A–C), crop (D–H), and ornamental (I–M) species richness in urban gardens in the California central coast. For all panels, points show the measurements for plant, crop, or ornamental richness at the 23 gardens surveyed, lines represent predicted values for plant, crop or ornamental richness depending on continuous or categorical x-axis variables, and grey bands show 95% confidence intervals around observed values. In panels with categorical variables (C,F,K), the scatter along the x-axis is present to make the points more visible and does not have a quantitative meaning. All relationships are significant (p < 0.05).
3.4. Predictors of plant traits
Several aspects of garden physical features, land tenure security, and luxury were correlated with functional trait metrics. Functional richness (FRic) was higher in gardens managed as allotments (z = 2.369, p = 0.018) (Figure 2A; Supplementary Table S3). Functional evenness (FEve) decreased with median property value (z = 2.221, p = 0.026) (Figure 2B, Supplementary Table S3). Functional divergence (FDiv) increased with plot size (z = 2.939, p = 0.003) and declined with higher percentage of owner-occupied housing (z = 2.516, p = 0.012) (Figures 2C,D; Supplementary Table S3). Both functional divergence (FDiv) and functional dispersion (FDis) were higher in privately-owned gardens (FDiv, z = 3.134, p = 0.002; FDis, z = 2.084, p = 0.037, Figures 2E,F; Supplementary Table S3). Rao’s Q was not significantly correlated with any predictor variables (z < 1.938, p > 0.053) (Supplementary Table S3).
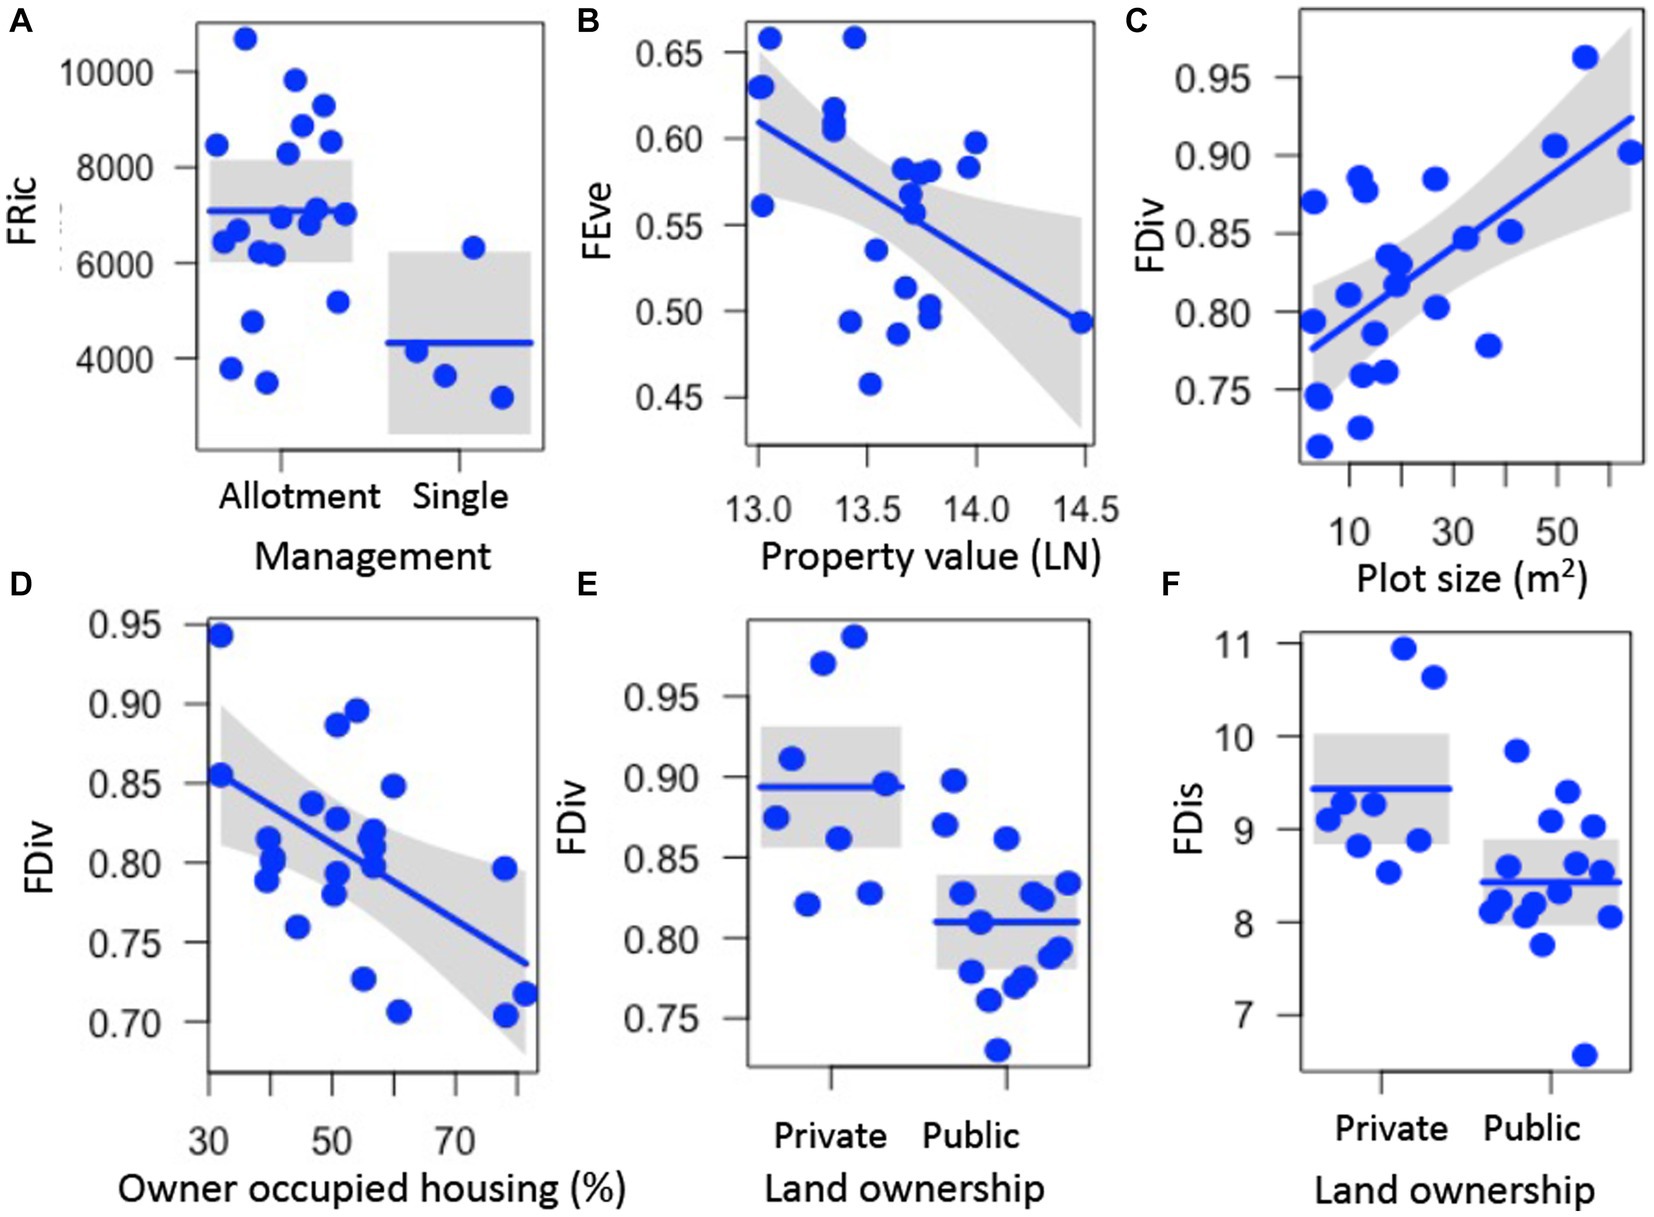
Figure 2. Relationships between garden, land tenure, and socioeconomic factors and functional richness (FRic, A), functional evenness (FEve, B), functional divergence (FDiv, C–E), and functional dispersion (FDis, F) of plant traits measured on 88 plant species in urban gardens in the California central coast. For all panels, points show the measurements for FRic, FEve, FDiv, and FDis from the 23 gardens surveyed, lines represent predicted values for FRic, FEve, FDiv, or FDis depending on continuous or categorical x-axis variables, and grey bands show 95% confidence intervals around observed values. In panels with categorical variables (A,E,F), the scatter along the x-axis is present to make the points more visible and does not have a quantitative meaning. All relationships are significant (p < 0.05).
Several aspects of garden physical features, land tenure security, and luxury were correlated with community weighted mean (CWM) trait values for select plant traits. CWM of shrubs declined with plot size (z = 3.396, p = 0.001), was higher in allotment gardens (z = 3.092, p = 0.002), and decreased with percent occupied housing (z = 2.251, p = 0.024) (Figures 3A–C; Supplementary Table S3). CWM of the number of flowers decreased with garden age (z = 2.899, p = 0.004), increased with median household income (z = 2.142, p = 0.032), and declined with percent of owner-occupied housing (z = 2.464, p = 0.014) (Figures 3D–F; Supplementary Table S3) while the CWM of flower height increased with property value (z = 2.018, p = 0.044) and decreased with owner occupied housing (z = 2.380, p = 0.017) (Figures 3G,H; Supplementary Table S3). CWM of plant volume was higher with increasing garden age (z = 2.74, p = 0.006) and was higher in allotment gardens (z = 2.971, p = 0.003) (Figures 3I,J; Supplementary Table S3). CWM of trees was not significantly correlated with any factor (z < 1.862, p > 0.063) (Supplementary Table S3).
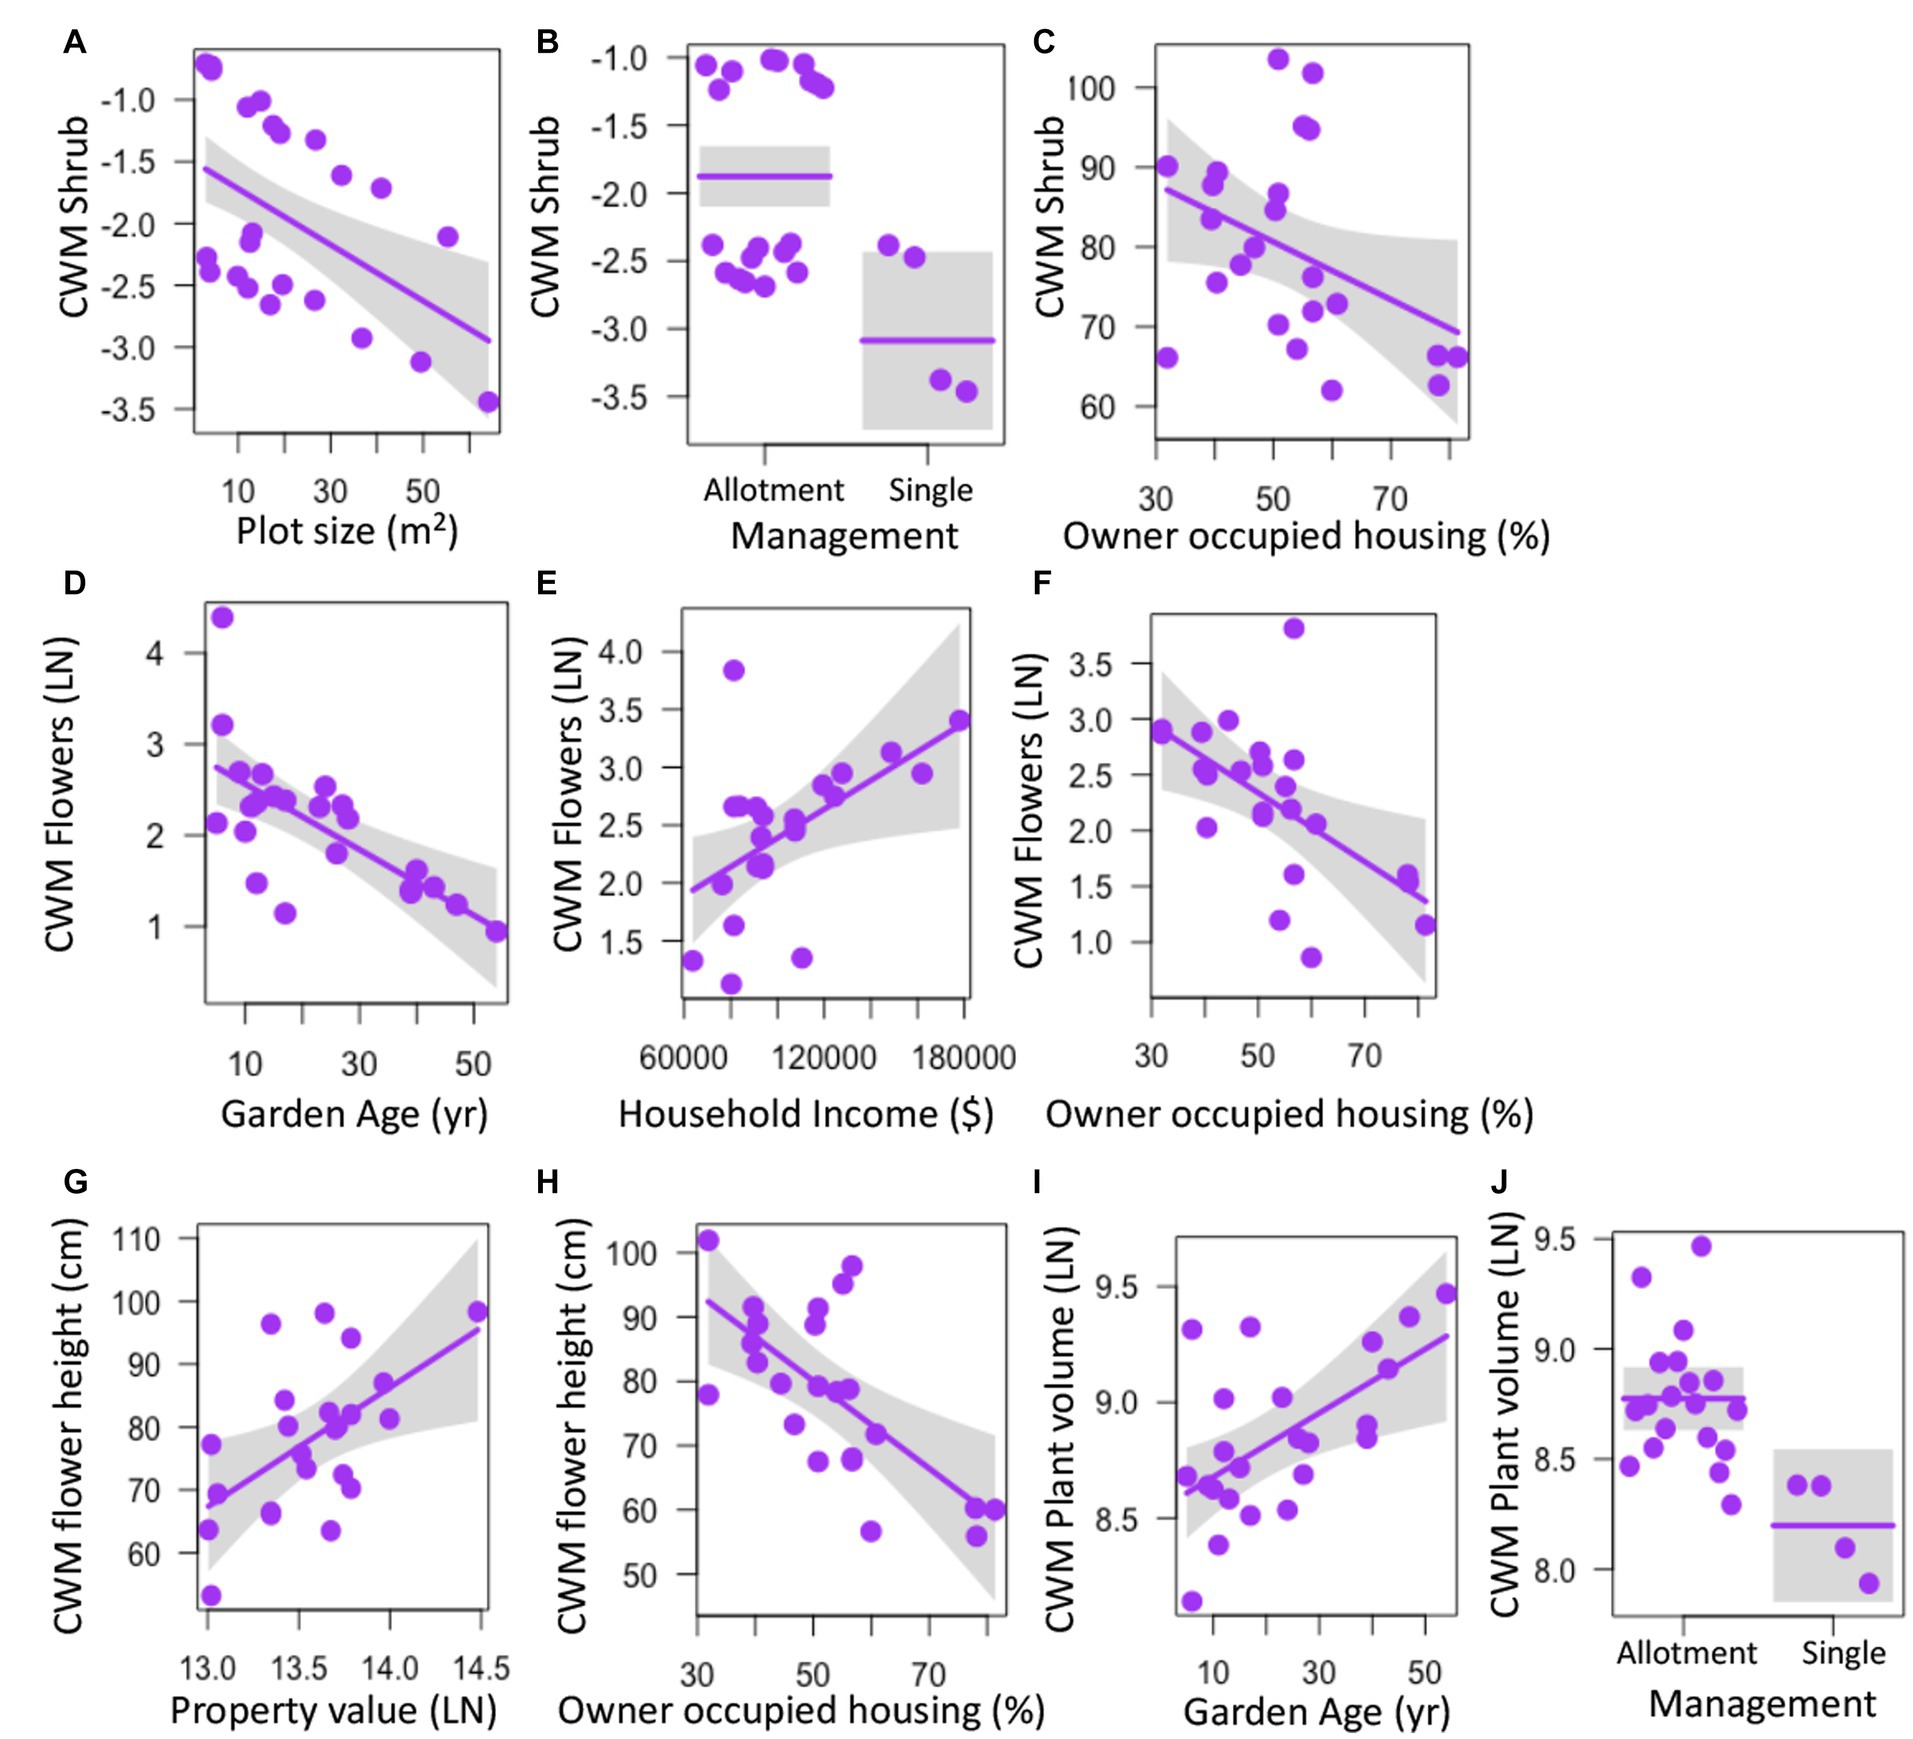
Figure 3. Relationships between garden physical features, land tenure, and socioeconomic factors and community weighted mean (CWM) values for individual plant traits measured in urban gardens in the California central coast. Graphs show values for CWM shrubs (A–C), number of flowers (D–F), flower height (G,H), and plant volume (I–J). For all panels, points show the measurements for CWM from the 23 gardens surveyed, lines represent predicted values for CWM depending on continuous or categorical x-axis variables, and grey bands show 95% confidence intervals around observed values. In panels with categorical variables (B,J), the scatter along the x-axis is present to make the points more visible and does not have a quantitative meaning. All relationships are significant (p < 0.05).
3.5. Predictors of plant species composition
We found that plant species composition, across the crop, ornamental, and weed groups, was significantly related to a number of factors. Overall, plant species composition differed between land ownership types (F = 1.643, p = 0.048), with median property values (F = 1.706, p = 0.043), and median household income values (F = 1.895, p = 0.016) (Figure 4A; Supplementary Table S4). Specifically, beans, calla lily, veronica, pineapple guava, and knotweed were more abundant in privately-owned gardens while bindweed and purslane were more abundant in public gardens (Supplementary Figure S6; Supplementary Table S5). Basil, chives, and parsley were more abundant in gardens with higher median property value, whereas apple, plantain, sow thistle, and wild radish were less abundant (Supplementary Figure S7; Supplementary Table S5). Amaranth, asparagus, basil, chives, parsley, tomato, and zinnia were more abundant in gardens with higher median household income, whereas iris, nopales, and wild radish were more abundant in lower income neighborhoods (Supplementary Figure S8; Supplementary Table S5). Crop species composition differed with median household income (F = 1.948, p = 0.024) and with median property value (F = 2.060, p = 0.019) (Figure 4B; Supplementary Table S4). Basil, chives, and parsley were more abundant in gardens with higher median property value, whereas apple was less abundant (Supplementary Figure S7; Supplementary Table S5). Amaranth, asparagus, basil, chives, parsley, and tomato were more abundant in gardens with higher median household income, whereas nopales were more abundant in lower income neighborhoods (Supplementary Figure S8; Supplementary Table S5). Ornamental species composition differed with median household income (F = 1.836, p = 0.047) and with garden age (F = 1.917, p = 0.050) (Figure 4D; Supplementary Table S4). Zinnia was more abundant in gardens with higher household income, whereas iris was less abundant (Supplementary Figure S8; Supplementary Table S5). Feverfew was more abundant in older gardens (Supplementary Figure S9; Supplementary Table S5). Finally, weed species composition differed with land ownership (F = 4.021, p = 0.005) and with garden age (F = 2.159, p = 0.047) (Figure 4C; Supplementary Table S4). There was more bindweed and purslane in public gardens with more veronica in private gardens (Supplementary Figure S6; Supplementary Table S5), and more dandelion, oxalis, petty spurge, and purslane but less plantain in older gardens (Supplementary Figure S9; Supplementary Table S5).
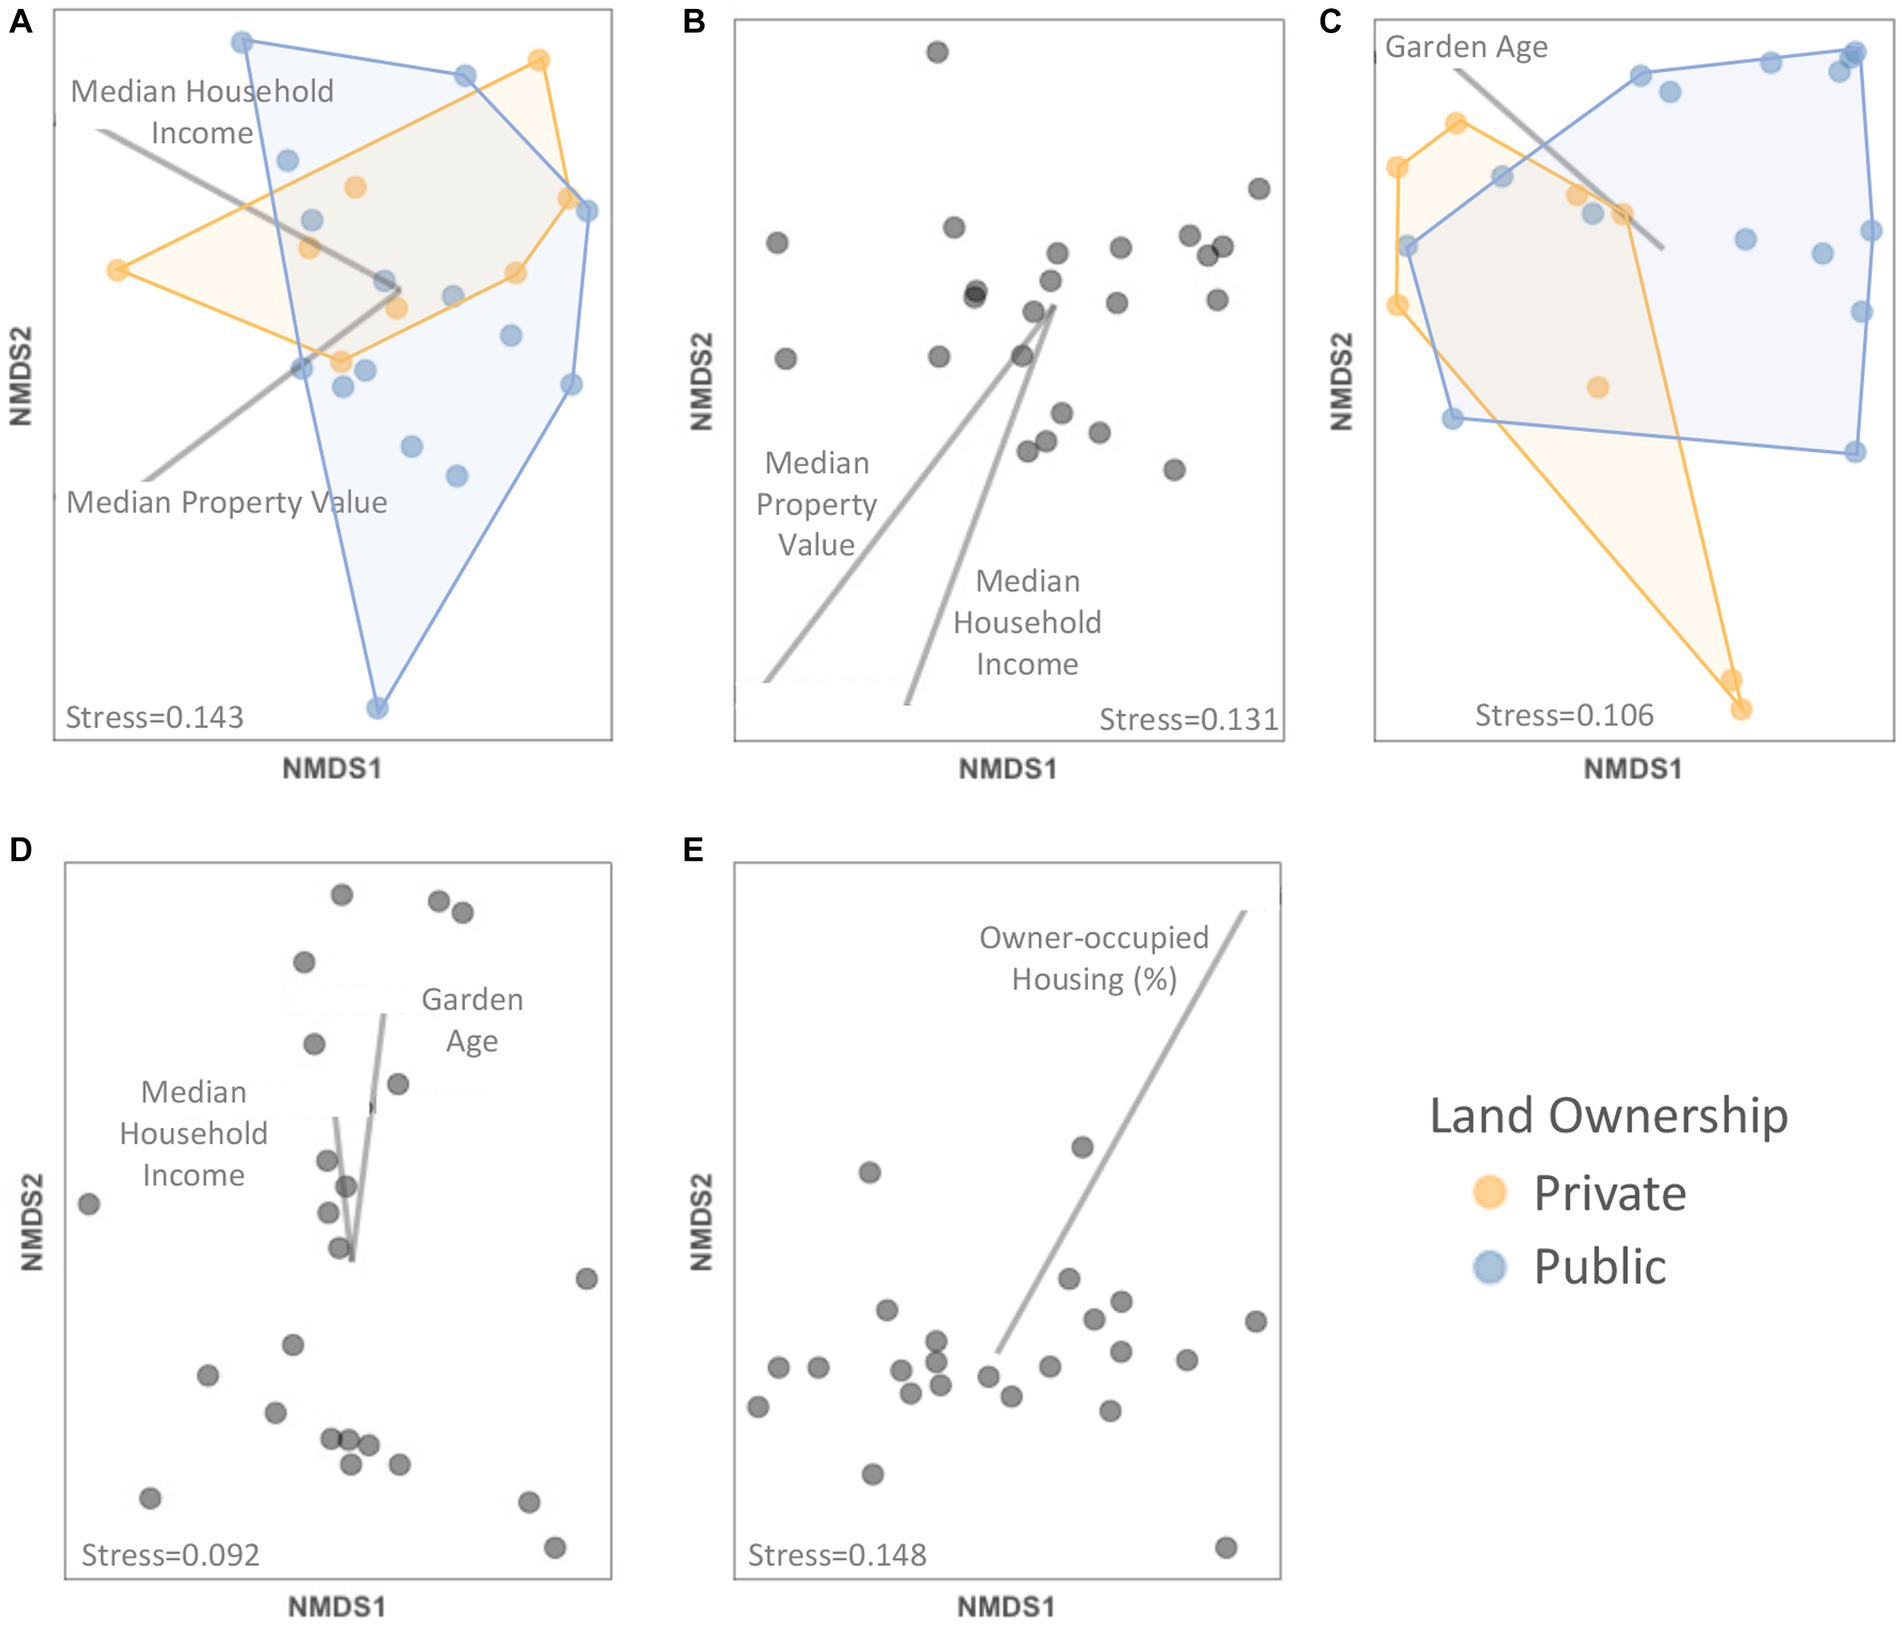
Figure 4. NMDS plots showing relationships between (A) plant, (B) crop, (C) weed, and (D) ornamental plant species composition, (E) community weighted mean trait value composition and socioeconomic factors and other garden features. Only significant factors (p < 0.05) as determined with PERMANOVA tests are depicted within each panel with vectors (continuous predictor variables) or colors (categorical variables).
3.6. Predictors of plant trait composition
The plant trait composition (measured as the collection of community weighted mean trait values) was significantly predicted by the percent of owner-occupied housing units (F = 7.756, p = 0.002) (Figure 4E; Supplementary Table S4). Specifically, flower height and vine relative abundance declined and flag-shaped flowers increased with more owner occupation (Supplementary Figure 10; Supplementary Table S5).
4. Discussion
We found that plant communities differed depending on both garden physical features and socioeconomic factors of the neighborhoods in which the gardens were located. As hypothesized, we found that land-tenure secure gardens had higher plant and crop species richness, according to some metrics, but plant, ornamental, crop species and functional richness were all higher in allotment gardens than in single-manager gardens, inconsistent with our predictions. We found some evidence for a ‘luxury effect’ with plant, crop, and ornamental species richness as well as floral height and abundance each positively correlated with at least one metric of luxury, consistent with our predictions; however, the specific variables mattered, as crop species richness as well as two metrics of functional richness declined with luxury. Finally, we found that plant, crop, and ornamental species richness, functional divergence, and CWM of shrubs all correlated negatively with garden plot size, while plant community composition was distinct between land ownership types, property values, income levels, and garden age.
4.1. Impacts of land tenure security
Our first major hypothesis was that greater land tenure security would promote greater plant species and functional richness within gardens. Indeed, we found that more land tenure secure gardens had higher plant and crop species richness according to the land tenure security index, perhaps the most straightforward land tenure metric assessed. Thus, according to predictions made by others (e.g., Wakefield et al., 2007; Glowa et al., 2018), we do find evidence that secure land tenure, from both legal and perception-based standpoints, influences the planting decisions of gardeners leading to increased plant species richness. This result alone has important implications for the management of gardens broadly, as species richness can critically impact ecosystem service provision, especially within urban gardens [reviewed in Lin et al. (2015)].
However, the observed patterns for other metrics of land tenure security, including management type (allotment vs. single-manager) and land ownership (publicly vs. privately-held gardens) conflict with results for the land tenure security index and with our expectations. In fact, these results point to lower functional richness and fewer shrubs, as well as larger plants, in more land-tenure secure gardens. For example, we found that plant, ornamental, crop species and functional richness were higher in allotment gardens than in single-manager gardens and that two metrics of functional diversity, functional divergence (FDiv) and functional dispersion (FDis), were both lower in publicly-owned gardens. Further, we found that the CWM of shrubs and CWM of plant volume (i.e., the relative abundance of plants with shrub growth form or plant sizes, respectively) were both higher in allotment gardens than in single-manager gardens. In our characterizations of metrics relating to land tenure security, we assume that the single-manager gardens included in this study are more land secure because all four have paid employees and three of them are affiliated with a school; both of these factors should be related to greater land tenure security (Arnold and Rogé, 2018). However, we only sampled four single-manager sites, and suspect that the patterns for species and functional richness observed therein may be more related to plot size than to land tenure security (see Section 4.3). While it is easy to assume that privately-held land may be less land tenure secure given that they may be more risk-laden (Pfeiffer et al., 2015) or temporary (Yuen, 2012; Arnold and Rogé, 2018), we note that private land owners are often the garden organizations (as is the case for three of eight privately-held gardens in this study), and thus the relationship may be more nuanced than expected.
4.2. Impacts of ‘luxury’
Our second major hypothesis was that gardens would exhibit a luxury effect, where increased income correlates with increased plant species and functional trait diversity. Indeed, we found that all three metrics related to luxury impacted either the composition of all plants and ornamentals (income and property value) or impacted trait composition in gardens (owner-occupied housing).
However, our results point to a more complex story. We found that higher household income was associated with lower crop species richness but higher CWM of flower abundance; higher property values were associated with more ornamental and crop species and higher CWM of flower height (e.g., taller flowers), but with lower functional evenness (FEve); and percent of owner-occupied housing units was associated with lower ornamental richness, lower functional divergence (FDiv), fewer shrubs, and shorter flowers. We expected, as has been documented for other urban systems (e.g., Hope et al., 2003), that overall plant species richness would be higher in gardens in wealthier communities, but instead we found that plant species richness patterns depended on plant group. The strong differences by which the richness and species composition of the different plant types (e.g., crop, weed, ornamental) shifted with garden and socioeconomic variables, corroborate differences previously documented between cultivated and ‘spontaneous’ plants in urban habitats (Cavender-Bares et al., 2020). Species richness of weeds, the plant group that is by definition not directly planted by people in gardens, was not influenced by any of the land tenure security or luxury variables, and only responded to garden age. In contrast, crop plant richness declined with household income, while increases in ornamental plant richness more strongly align with the luxury effect. This may be due to the fact that ornamental plants may be seen as less of a necessity to food security goals of lower-income gardeners. This “hierarchy of need” hypothesis assumes that low-income gardeners may focus on growing crops to meet their food needs, whereas high-income gardeners may focus on ornamentals because their food needs are already met (Gaston and Gaston, 2011; van Heezik et al., 2013; Clarke and Jenerette, 2015). Similar to our findings, Clarke and Jenerette (2015) found support for this hypothesis in that total species richness and ornamental plant richness (and cover) increased with household income, but crop richness and medicinal richness did not. Patterns of increased contribution of ornamental plants to overall plant richness, with accompanying drops in crop and medicinal species richness with changes in wealth, have also been observed in home gardens in different regions of Africa (Lubbe et al., 2010; Bigirimana et al., 2012; Davoren et al., 2016). We hypothesized that CWM of floral abundance would increase with garden luxury, and we found plants with more flowers and with taller flowers associated with higher income and higher property value. Others have hypothesized that vegetation structure of urban plants might vary both with income and with plant species richness (Cavender-Bares et al., 2020), and a bigger range of plant heights may be esthetically pleasing in urban domestic gardens (Ulrich, 1986; Kaplan and Kaplan, 1989). While we found a higher CWM of flower height in higher property value gardens, plants with very high flowers were still in the minority, indicating that those gardens may have higher variation in floral and, thus, plant height.
Median household income, property value, or owner-occupied housing are all used as indicators of neighborhood wealth or luxury (Schell et al., 2020) and thus we expected these three metrics to similarly influence plant species and functional richness or composition. However, this was not the case. We posit that some of these differences may be because two of our gardens are located on the campus of UC Santa Cruz, and thus share the lowest rates of owner-occupied housing in the study (31.9%), have property values that are between 12–31% below market rate compared to areas immediately surrounding the campus due to on-campus housing sales programs (Brailsford and Dunlavey, 2014), and are also both managed primarily by paid employees. Thus, as in Iuliano et al. (2017), garden management decisions may actually be made by non-students, although the presence of students within the zip code strongly shapes luxury related wealth values. We may also consider limitations of the luxury effect that do not actually consider the complexities of social relations within an urban context (Schell et al., 2020). For instance, garden rules and rule enforcement (e.g., Egerer and Fairbairn, 2018) may strongly limit what people can or choose to plant, as may social norms in wealthy neighborhoods (Nassauer, 1995; Robbins, 2012; Kuras et al., 2020). Moreover, owner-occupied housing may influence plant community composition indirectly if, for example, homeowners choose to plant certain things at home (e.g., ornamentals), and use a community garden plot to plant other items (e.g., crops) that either neighborhood rules or social norms do not allow them to grow at home. One important note is that our luxury variable information is collected per zip code, and not necessarily from the gardener population, but previous work in our system indicates that income values among gardener and census tract populations are similar (Byun, 2016). In addition, other factors, including policy decisions, sociodemographic features of gardeners, or development in inner cities may override the simple effects of income or property occupancy (Grove et al., 2014; Schell et al., 2020).
4.3. Impacts of garden physical features
We found that total plant, crop, and ornamental species richness responded negatively to plot size and also shifted with garden management type. Clarke and Jenerette (2015) found that plot size was the most important predictor of plant species richness in allotment gardens, but not important in gardens managed by a single-manager or collectively by a small group. This result is similar to our findings that allotments had higher species richness per plot compared with gardens primarily managed by one or a few paid employees. Gardens that have larger plots, or where management decisions are made for the entire garden, may be less diverse because each plot may only have a single crop sown in a row-crop planting style. For example, in single-manager gardens, one plot may be planted entirely with brassicas, while another plot holds only tomatoes and cucumbers. Conversely, in allotment gardens, where gardeners have limited space or smaller plots, individual gardeners often carefully craft their management plans to squeeze in all of the plants that they desire (Lucatero, 2023). Thus, the distribution of plants across a garden would likely differ in these two management settings and with plot size. A pattern of higher plant diversity in smaller plots is consistent with literature from rural agriculture where smaller farms (both organic and conventional) often have higher plant diversity compared with larger farms, due to practices like intercropping and filling in a smaller available space (e.g., Rosset, 2000; Belfrage et al., 2005; Marini et al., 2009). Other urban plant studies document extremely high plant densities in small cultivated spaces, with extremely high richness of planted species supplemented by opportunistic plants colonizing any space left bare (Thompson et al., 2003).
Beyond the species richness patterns, we found that functional richness (FRic) was higher in allotment gardens and that functional divergence (FDiv) increased with plot size. This means that gardeners are cultivating highly functionally diverse communities in allotment gardens and highly functionally redundant communities in smaller plots. Our results provide another important example of a human-created functionally diverse habitat that exists within the urban matrix, as seen in urban storm-water filtration systems and urban parks, among other green spaces (Czortek and Pielech, 2020; Winfree et al., 2018). Generally speaking, plant functional richness can improve ecosystem functioning through a number of different mechanisms (Eviner and Chapin, 2003; Hooper et al., 2005), including both complementarity (high FDiv values) and redundancy (low FDiv values) and may play important roles in ecosystem services within agroecosystems (Wood et al., 2015). While plant functional redundancy may not necessarily improve immediate ecosystem function or services (Kuebbing et al., 2018), functional redundancy may play an important role in gardens that are managed at very small spatial and quick temporal scales. For instance, in gardens with high functional redundancy (or low FDiv), removal of one plant by one gardener may be easily replaced by services provided by another plant, providing additional ‘insurance’ or reliability for the garden (Yachi and Loreau, 1999; Diaz and Cabido, 2001). Functionally diverse plant communities can support decomposition, nutrient cycling, and soil fertility (e.g., Mouillot et al., 2013; Hevia et al.; 2017), biomass production (e.g., Mouillot et al., 2013), as well as pollination (e.g., Goulnik et al., 2020). This relationship is particularly critical in human-modified habitats, such as agroecosystems, where functional trait diversity may play important roles for plant productivity, nutrition, pollination, and pest control among other ecosystem services (Wood et al., 2015), and may explain these services better than species diversity alone (Diaz and Cabido, 2001).
4.4. Compositional differences
Overall, our compositional analyses reveal a number of unique differences in the cultivation choices of gardeners across the range of socioeconomic factors. For example, we found that gardens on public land supported higher relative abundance of bindweed and purslane (two weed species), whereas land insecure or privately held gardens had higher relative abundances of beans and pineapple guava (crops), calla lily (ornamental), as well as veronica and knotweed (weeds). While shrub relative abundance did not differ with land tenure, pineapple guava was more common in private gardens, and this may be due to how these plants are grown in the study gardens. We have often observed these plants growing in pathways and other areas adjacent to and outside of gardener plots. This practice of cultivating plants in pathways is forbidden by the rules of gardens operated by both the City of San Jose and the City of Santa Cruz (Santa Cruz County Parks, 2014; City of San Jose, 2023), the two entities that manage half of the publicly held gardens in our study. Thus, rules may be another important feature influencing garden plant choices and practices (Yuen, 2012; Pfeiffer et al., 2015).
We also found differences in plant species depending on luxury variables. Several culinary herbs (basil, chives, and parsley) were more abundant in gardens with higher property values, and these same herbs, plus three crops (amaranth, asparagus, tomato) as well as one ornamental species (zinna) were more common in gardens with higher incomes. On the other hand, nopales, apples and several weed species (plantain, sow thistle, and wild radish) declined in sites with higher incomes and property values. At least one other study has suggested that the cultivating of “salad and herb” gardens, that contain high proportions of basil, chives, parsley, and other culinary herbs and salad greens may be a way for gardeners to display their social status (Kirkpatrick and Davison, 2018), consistent with the concept of garden luxury. Nopales are an important crop native to Mexico and strongly associated with Mexican culture (e.g., DeFelice, 2004). In our study region, nopales are abundant and mostly grown in gardens that have high populations of Latino gardeners, many of whom are farmworkers, and among the lowest paid individuals in the central coast of California (e.g., Minkoff-Zern, 2014). Thus nopales, for both the paddles and fruits, may play an important cultural and food security role in our study gardens. The result for apples is driven by just one site (Chadwick Garden on the UCSC campus), a site where apple abundance is more than twice as high as for any other garden, and where, as described earlier, property values are far below market rate for the region due to on-campus housing programs (Brailsford and Dunlavey, 2014).
5. Conclusion
This study reveals the impact of social factors on both community-level plant data and individual-level gardener decision-making and socioeconomics, and we acknowledge that both forces are important predictors of plant species and trait richness and composition within gardens. Further, while we explored variables that impact land tenure security and perception of permanence for gardens and organizations, we know that plant communities may be strongly impacted by how individual gardeners experience land tenure security, garden governance, rules that restrict planting choices, belonging, as well as by racial, age or gender dynamics that do not allow full expression of individual gardening preferences (Yuen, 2012; Pfeiffer et al., 2015; Aptekar and Myers, 2020; Glennie, 2020). We find evidence here that land tenure security promotes species richness of plants and crops, and that luxury promotes ornamental plant richness, floral abundance, and lower crop plant richness. We also acknowledge that garden plant communities are a result of a multi-layer decision making and social enterprise that influence the ways in which plants are selected and grown. While our analyses focus on community-level socioeconomic factors, they provide key insight into several significant, and fine-scale differences in how garden physical features, land tenure, and luxury may impact gardener planting choices, plant species richness, and in turn, how these choices may affect functional richness, as well as the distribution of traits in urban garden communities. Each of these aspects of diversity may have strong implications for ecosystem services provided in these increasingly important habitats.
Data availability statement
Original datasets are available in a publicly accessible repository. The data can be found at Dryad.org at the following https://doi.org/doi:10.7291/D1CQ4S. Requests to access the datasets should be directed to SP, sphilpot@ucsc.edu.
Author contributions
SP, SJ, HL, BL, and GP conceived of the project ideas. SP and PB collected field data and identified all plants. GP and SP collected trait data and entered data. SP completed all data analysis and wrote the first draft of the manuscript. All authors provided feedback and approval of the manuscript.
Funding
This work was funded by the Sustainable Agroecosystems: Health, Functions, Processes and Management Program (grant no. 2016-67019-25185/project accession no. 1009123) and (grant no. 2020-67020-31158/project accession no. 1022189), and the Research and Extension Experiences for Undergraduates Program (grant no. 2016-67032-24987/project accession no. 1009021) from the USDA National Institute of Food and Agriculture and UC Santa Cruz general funds.
Acknowledgments
The following individuals assisted with collection of plant abundance and plant trait data: C. Adams, A. Ajani, S. Albuquerque, S. Andrade, Y. Bravo, Y. Byun, H. Cohen, J. Dunne, M. Egerer, B. Ferguson, R. Fowler, A. García, E. Gonzalez, D. Hafalia-Yackel, R. Hruska, J. Hsu, Z. Jordan, C. Kirk, A. Lucatero, M. MacDonald, L. Marín, I. Mayorga, Z. McCrea, T. Milz, H. Morales, M. Muñoz-Serrano, M.E. Narvaez Cuellar, T. Omolulu, T. Ong, M. Otoshi, K. Peterson, M. Plascencia, R. Quistberg, A. Rubio, C. Sanchez, G. Santíz Ruíz, J. Schneiderman, R. Schreiber, J. Shaw, J. Tan, S-S. Thomas, C. Wing, and R. Zajonc. J. Luong provided advice on plant trait measurements and lab support. The authors thank the reviewers for their helpful and thoughtful comments on the manuscript drafts.
Conflict of interest
The authors declare that the research was conducted in the absence of any commercial or financial relationships that could be construed as a potential conflict of interest.
Publisher’s note
All claims expressed in this article are solely those of the authors and do not necessarily represent those of their affiliated organizations, or those of the publisher, the editors and the reviewers. Any product that may be evaluated in this article, or claim that may be made by its manufacturer, is not guaranteed or endorsed by the publisher.
Supplementary material
The Supplementary material for this article can be found online at: https://www.frontiersin.org/articles/10.3389/fsufs.2023.1195737/full#supplementary-material
Footnotes
2. ^https://www.mcsc-capitola.org/, https://www.sanjoseca.gov/, https://www.aptoschurch.org/aptos-community-garden, https://sites.google.com/site/liveoakgrange/about-the-green-grange/history/sclo-grange-503, https://www.middlebury.edu/institute/news, https://www.cityofsantacruz.com/
References
Anderson, C. J. R., and Rosas-Anderson, P. J. (2017). “Leafscan” in Mobile application software. Version 1.3. 21st Edn.
Andrade, R., Franklin, J., Larson, K. L., Swan, C. M., Lerman, S. B., Bateman, H. L., et al. (2020). Predicting the assembly of novel communities in urban ecosystems. Landsc. Ecol. 36, 1–15. doi: 10.1007/s10980-020-01142-1
Aptekar, S., and Myers, J. S. (2020). The tale of two community gardens: green aesthetics versus food justice in the big apple. Agric. Hum. Values 37, 779–792. doi: 10.1007/s10460-019-10011-w
Arnold, J., and Rogé, P. (2018). Indicators of land insecurity for urban farms: institutional affiliation, investment, and location. Sustainability 10:1963. doi: 10.3390/su10061963
Aronson, M. F., La Sorte, F. A., Nilon, C. H., Katti, M., Goddard, M. A., Lepczyk, C. A., et al. (2014). A global analysis of the impacts of urbanization on bird and plant diversity reveals key anthropogenic drivers. Proc. R. Soc. B Biol. Sci. 281:20133330. doi: 10.1098/rspb.2013.3330
Aronson, M. F., Nilon, C. H., Lepczyk, C. A., Parker, T. S., Warren, P. S., Cilliers, S. S., et al. (2016). Hierarchical filters determine community assembly of urban species pools. Ecology 97, 2952–2963. doi: 10.1002/ecy.1535
Australian National Botanic Gardens. (2021). Habit growth form list – Australian National Herbarium – CANBR [online]. Canberra, Australia. Available at: https://www.anbg.gov.au/cpbr/herbarium/collecting/habit-types.html (Accessed May 10, 2021)
Baker, L. (2004). Tending cultural landscapes and food citizenship in Toronto's community gardens. Geogr. Rev. 94, 305–325. doi: 10.1111/j.1931-0846.2004.tb00175.x
Baldock, K. C. R., Goddard, M. A., Hicks, D. M., Kunin, W. E., Mitschunas, N., Morse, H., et al. (2019). A systems approach reveals urban pollinator hotspots and conservation opportunities. Nat. Ecol. Evol. 3, 363–373. doi: 10.1038/s41559-018-0769-y
Ballare, K. M., Neff, J. L., Ruppel, R., and Jha, S. (2019). Multi-scalar drivers of biodiversity: local management mediates wild bee community response to regional urbanization. Ecol. Appl. 29:e01869. doi: 10.1002/eap.1869
Bar, M., and Shtein, I. (2019). Plant trichomes and the biomechanics of defense in various systems, with Solanaceae as a model. Botany 97, 651–660. doi: 10.1139/cjb-2019-0144
Barton, K. (2012). "MuMin: Multi-model inference. R package version 1.5.2. Available at: http://CRAN.R-project.org/package-MuMin (Accessed May 23, 2023)
Belfrage, K., Bjorklund, J., and Salomonsson, L. (2005). The effects of farm size and organic farming on diversity of birds, pollinators, and plants in a Swedish landscape. Ambio 34, 582–588. doi: 10.1639/0044-7447(2005)034[0582:TEOFSA]2.0.CO;2
Bernholt, H., Kehlenbeck, K., Gebauer, J., and Buerkert, A. (2009). Plant species richness and diversity in urban and peri-urban gardens of Niamey, Niger. Agroforestry Syst. 77, 159–179. doi: 10.1007/s10457-009-9236-8
Bigirimana, J., Bogaert, J., De Cannière, C., Bigendako, M. J., and Parmentier, I. (2012). Domestic garden plant diversity in Bujumbura, Burundi: role of the socio-economical status of the neighborhood and alien species invasion risk. Landsc. Urban Plan. 107, 118–126. doi: 10.1016/j.landurbplan.2012.05.008
Botta-Dukat, Z. (2005). Rao's quadratic entropy as a measure of functional diversity based on multiple traits. J. Veg. Sci. 16, 533–540. doi: 10.1658/1100-9233(2005)16[533:RQEAAM]2.0.CO;2
Brailsford and Dunlavey (2014). Employee housing market study report prepared for University of California, Santa Cruz. Available at: https://mediafiles.ucsc.edu/ppc/studies/EmployeeHousingMarketStudy.pdf (Accessed June 5, 2023)
Breheny, P., and Burchett, W. (2013). Visualization of regression models using visreg. R Journal 9, 56–71. doi: 10.32614/RJ-2017-046
Brown, K., and Jameton, A. (2000). Public health implications of urban agriculture. J. Public Health Policy 21, 20–39. doi: 10.2307/3343472
Burdine, J. D., and Taylor, D. E. (2017). Neighbourhood characteristics and urban gardens in the Toledo metropolitan area: staffing and voluntarism, food production, infrastructure, and sustainability practices. Local Environ. 23, 198–219. doi: 10.1080/13549839.2017.1397614
Byun, Y. (2016). People who garden: A closer look at urban community gardeners in the California central coast region. Undergraduate Thesis. University of California, Santa Cruz.
Calcagno, V., and de Mazancourt, C. (2010). Glmulti: an R package for easy automated model selection with (generalized) linear models. J. Stat. Softw. 34, 1–29. doi: 10.18637/jss.v034.i12
Callis-Duehl, K., Vittoz, P., Defossez, E., and Rasmann, S. (2017). Community-level relaxation of plant defenses against herbivores at high elevation. Plant Ecol. 218, 291–304. doi: 10.1007/s11258-016-0688-4
Cavender-Bares, J., Cubino, J. P., Pearse, W. D., Hobbie, S. E., Lange, A. J., Knapp, S., et al. (2020). Horticultural availability and homeowner preferences drive plant diversity and composition in urban yards. Ecol. Appl. 30:e02082. doi: 10.1002/eap.2082
City of San Jose (2023). Community gardening [online]. San Jose, CA: City of San Jose Parks, Recreation & Neighborhood Services. Available at: https://www.sanjoseca.gov/your-government/departments-offices/parks-recreation-neighborhood-services/ (Accessed March 20, 2023).
Clarke, L. W., and Jenerette, G. D. (2015). Biodiversity and direct ecosystem service regulation in the community gardens of Los Angeles, CA. Lands. Ecol. 30, 637–653. doi: 10.1007/s10980-014-0143-7
Clarke, L. W., Li, L., Jenerette, G. D., and Yu, Z. (2014). Drivers of plant biodiversity and ecosystem service production in home gardens across the Beijing municipality of China. Urban Ecosyst. 17, 741–760. doi: 10.1007/s11252-014-0351-6
Classens, M. (2014). The nature of urban gardens: toward a political ecology of urban agriculture. Agric. Hum. Values 32, 229–239. doi: 10.1007/s10460-014-9540-4
Cornelissen, J. H. C., Lavorel, S., Garnier, E., Diaz, S., Buchmann, N., Gurvich, D. E., et al. (2003). A handbook of protocols for standardised and easy measurement of plant functional traits worldwide. Aust. J. Bot. 51, 335–380. doi: 10.1071/bt02124
Coux, C., Rader, R., Bartomeus, I., and Tylianakis, J. M. (2016). Linking species functional roles to their network roles. Ecol. Lett. 19, 762–770. doi: 10.1111/ele.12612
Czortek, P., and Pielech, R. (2020). Surrounding landscape influences functional diversity of plant species in urban parks. Urban For Urban Gree. 47:126525. doi: 10.1016/j.ufug.2019.12652
Dachaga, W., and de Vries, W. T. (2022). Integrating urban land tenure security in health determinants: the design of indicators for measuring land tenure security and health relationships in developing country contexts. Int. J. Environ. Res. Public Health 19:3080. doi: 10.3390/ijerph19053080
Daniels, G. D., and Kirkpatrick, J. B. (2006). Does variation in garden characteristics influence the conservation of birds in suburbia? Biol. Conserv. 133, 326–335. doi: 10.1016/j.biocon.2006.06.011
Davoren, E., Siebert, S., Cilliers, S., and Du Toit, M. J. (2016). Influence of socioeconomic status on design of Batswana home gardens and associated plant diversity patterns in northern South Africa. Landsc. Ecol. Eng. 12, 129–139. doi: 10.1007/s11355-015-0279-x
de Bello, F., Botta-Dukát, Z., Lepš, J., Fibich, P., and Goslee, S. (2020). Towards a more balanced combination of multiple traits when computing functional differences between species. Methods Ecol. Evol. 12, 443–448. doi: 10.1111/2041-210x.13537
de Bello, F., Lavorel, S., Diaz, S., Harrington, R., Cornelissen, J. H. C., Bardgett, R. D., et al. (2010). Towards an assessment of multiple ecosystem processes and services via functional traits. Biodivers. Conserv. 19, 2873–2893. doi: 10.1007/s10531-010-9850-9
De Caceres, M., and Legendre, P. (2009). Associations between species and groups of sites: indices and statistical inference. Ecology 90, 3566–3574. doi: 10.1890/08-1823.1
DeFelice, M. S. (2004). Prickly pear cactus, Opuntia spp. – a spine-tingling tale. Weed Technol. 18, 869–877. doi: 10.1614/WT-04-134
Diaz, S., and Cabido, M. (2001). Vive la difference: plant functional diversity matters to ecosystem processes. Trends Ecol. Evol. 16, 646–655. doi: 10.1016/s0169-5347(01)02283-2
Egerer, M., and Fairbairn, M. (2018). Gated gardens: effects of urbanization on community formation and commons management in community gardens. Geoforum 96, 61–69. doi: 10.1016/j.geoforum.2018.07.014
Eviner, V. T., and Chapin, F. S. III (2003). Functional matrix: a conceptual framework for predicting multiple plant effects on ecosystem processes. Ann Rev Ecol S. 34, 455–485. doi: 10.1146/annurev.ecolsys.34.011802.132342
Fountain-Jones, N. M., Baker, S. C., and Jordan, G. J. (2015). Moving beyond the guild concept: developing a practical functional trait framework for terrestrial beetles. Ecol. Entomol 40, 1–13. doi: 10.1111/een.12158
Fox, J., and Weisberg, S. (2018). An R companion to applied regression. Newbury Park, CA: SAGE Publications.
Funk, J. L., Larson, J. E., Ames, G. M., Butterfield, B. J., Cavender-Bares, J., Firn, J., et al. (2017). Revisiting the holy grail: using plant functional traits to understand ecological processes. Biol. Rev. Camb. Philos. Soc. 92, 1156–1173. doi: 10.1111/brv.12275
Glaum, P., Simao, M. C., Vaidya, C., Fitch, G., and Iulinao, B. (2017). Big city Bombus: using natural history and land-use history to find significant environmental drivers in bumble-bee declines in urban development. R. Soc. Open Sci. 4:170156. doi: 10.1098/rsos.170156
Glennie, C. (2020). Cultivating place: urban development and the institutionalization of Seattle's P-patch community gardens. City Community 19, 726–746. doi: 10.1111/cico.12464
Glowa, K. M., Egerer, M., and Jones, V. (2018). Agroecologies of displacement: a study of land access, dislocation, and migration in relation to sustainable food production in the beach flats community garden. Agroecol. Sustain. Food Syst. 43, 92–115. doi: 10.1080/21683565.2018.1515143
Goddard, M. A., Dougill, A. J., and Benton, T. G. (2013). Why garden for wildlife? Social and ecological drivers, motivations and barriers for biodiversity management in residential landscapes. Ecol. Econ. 86, 258–273. doi: 10.1016/j.ecolecon.2012.07.016
Google Earth Pro 7.3.6.9345. (2021). California Central Coast gardens. lat 36.965410, long -121.709145, elev 304 m. [Accessed July 15, 2021]
Goulnik, J., Plantureux, S., Thery, M., Baude, M., Delattre, M., van Reeth, C., et al. (2020). Floral trait functional diversity is related to soil characteristics and positively influences pollination function in semi-natural grasslands. Agr. Ecosyst. Environ. 301:107033. doi: 10.1016/j.agee.2020.107033
Gregory, M. M., Leslie, T. W., and Drinkwater, L. E. (2015). Agroecological and social characteristics of New York city community gardens: contributions to urban food security, ecosystem services, and environmental education. Urban Ecosyst. 19, 763–794. doi: 10.1007/s11252-015-0505-1
Grove, J. M., Locke, D. H., and O'Neil-Dunne, J. P. M. (2014). An ecology of prestige in new York City: examining the relationships among population density, socio-economic status, group identity, and residential canopy cover. Environ. Manag. 54, 402–419. doi: 10.1007/s00267-014-0310-2
Harrison, T., and Winfree, R. (2015). Urban drivers of plant-pollinator interactions. Funct. Ecol. 29, 879–888. doi: 10.1111/1365-2435.12486
Hegland, S. J., and Totland, O. (2005). Relationships between species' floral traits and pollinator visitation in a temperate grassland. Oecologia 145, 586–594. doi: 10.1007/s00442-005-0165-6
Hodgson, K., Caton Campbell, M., and Bailkey, M. (2011). Urban agriculture: Growing healthy, sustainable places. Chicago, IL: American Planning Association.
Hooper, D. U., Chapin, F. S., Ewel, J. J., Hector, A., Inchausti, P., Lavorel, S., et al. (2005). Effects of biodiversity on ecosystem functioning: A consensus of current knowledge. Ecol. Monogr. 75, 3–35. doi: 10.1890/04-0922
Hope, D., Gries, C., Zhu, W. X., Fagan, W. F., Redman, C. L., Grimm, N. B., et al. (2003). Socioeconomics drive urban plant diversity. Proc. Natl. Acad. Sci. U. S. A. 100, 8788–8792. doi: 10.1073/pnas.1537557100
Iuliano, B., Markiewicz, A., and Glaum, P. (2017). Socio-economic drivers of community garden location and quality in urban settings and potential effects on native pollinators. Michigan J. Sustain. 5. doi: 10.3998/mjs.12333712.0005.103
Jha, S., Egerer, M., Bichier, P., Cohen, H., Liere, H., Lin, B., et al. (2023). Multiple ecosystem service synergies and landscape mediation of biodiversity within urban agroecosystems. Ecol. Lett. Early View 26, 369–383. doi: 10.1111/ele.14146
Kaplan, R., and Kaplan, S. (1989). The experience of nature: A psychological perspective. Cambridge: Cambridge University Press.
Kinzig, A. P., Warren, P., Martin, C., Hope, D., and Katti, M. (2005). The effects of human socioeconomic status and cultural characteristics on urban patterns of biodiversity. Ecol. Soc. 10:13. doi: 10.5751/ES-01264-100123
Kirkpatrick, J. B., Daniels, G. D., and Zagorski, T. (2007). Explaining variation in front gardens between suburbs of Hobart, Tasmania, Australia. Landsc. Urban Plan. 79, 314–322. doi: 10.1016/j.landurbplan.2006.03.006
Kirkpatrick, J. B., and Davison, A. (2018). Home-grown: gardens, practices, and motivations in urban domestic vegetable production. Landsc. Urban Plan. 170, 24–33. doi: 10.1016/j.landurbplan.2017.09.023
Kuebbing, S. E., Maynard, D. S., and Bradford, M. A. (2018). Linking functional diversity and ecosystem processes: a framework for using functional diversity metrics to predict the ecosystem impact of functionally unique species. J. Ecol. 106, 687–698. doi: 10.1111/1365-2745.12835
Kuras, E. R., Warren, P. S., Zinda, J. A., Aronson, M. F. J., Cilliers, S., Goddard, M. A., et al. (2020). Urban socioeconomic inequality and biodiversity often converge, but not always: a global meta-analysis. Landsc. Urban Plan. 198:103799. doi: 10.1016/j.landurbplan.2020.103799
Laliberté, E., and Legendre, P. (2010). A distance-based framework for measuring functional diversity from multiple traits. Ecology 91, 299–305. doi: 10.1890/08-2244.1
Lavorel, S., and Garnier, E. (2002). Predicting changes in community composition and ecosystem functioning from plant traits: revisiting the holy grail. Funct. Ecol. 16, 545–556. doi: 10.1046/j.1365-2435.2002.00664.x
Lavorel, S., Storkey, J., Bardgett, R. D., de Bello, F., Berg, M. P., Le Roux, X., et al. (2013). A novel framework for linking functional diversity of plants with other trophic levels for the quantification of ecosystem services. J. Veg. Sci. 24, 942–948. doi: 10.1111/jvs.12083
Lawson, L., and Drake, L. (2012). Community gardening organization survey. Commun. Green. Rev. 18, 20–41.
Lázaro, A., and Totland, O. (2014). The influence of floral symmetry, dependence on pollinators and pollination generalization on flower size variation. Ann. Bot. 114, 157–165. doi: 10.1093/aob/mcu083
Leong, M., Dunn, R. R., and Trautwein, M. D. (2018). Biodiversity and socioeconomics in the city: a review of the luxury effect. Biol. Lett. 14:20180082. doi: 10.1098/rsbl.2018.0082
Lin, B. B., Philpott, S. M., and Jha, S. (2015). The future of urban agriculture and biodiversity-ecosystem services: challenges and next steps. Basic Appl. Ecol. 16, 189–201. doi: 10.1016/j.baae.2015.01.005
Locke, D. H., Hall, B., Grove, J. M., Pickett, S. T. A., Ogden, L. A., Aoki, C., et al. (2021). Residential housing segregation and urban tree canopy in 37 US cities. Urban Sustain. 1, 1–9. doi: 10.1038/s42949-021-00022-0
Lovell, S. T. (2010). Multifunctional urban agriculture for sustainable land use planning in the United States. Sustainability 2, 2499–2522. doi: 10.3390/su2082499
Lowe, E. C., Threlfall, C. G., Wilder, S. M., and Hochuli, D. F. (2018). Environmental drivers of spider community composition at multiple scales along an urban gradient. Biodivers. Conserv. 27, 829–852. doi: 10.1007/s10531-017-1466-x
Lubbe, C. S., Siebert, S. J., and Cilliers, S. S. (2010). Political legacy of South Africa affects the plant diversity patterns of urban domestic gardens along a socio-economic gradient. Sci. Res. Essays 5, 2900–2910. doi: 10.5897/SRE.9000741
Lucatero, A. (2023). Ecological complexity and socio-ecological interactions in urban agroecosystems. Doctoral Dissertation. University of California, Santa Cruz.
Marini, L., Fontana, P., Klimek, S., Battisti, A., and Gaston, K. J. (2009). Impact of farm size and topography on plant and insect diversity of managed grasslands in the Alps. Biol. Conserv. 142, 394–403. doi: 10.1016/j.biocon.2008.10.034
Martin, C. A., Warren, P. S., and Kinzig, A. P. (2004). Neighborhood socioeconomic status is a useful predictor of perennial landscape vegetation in residential neighborhoods and embedded small parks of Phoenix, AZ. Landsc. Urban Plan. 69, 355–368. doi: 10.1016/j.landurbplan.2003.10.034
McKinney, M. L. (2002). Urbanization, biodiversity, and conservation. Bioscience 52, 883–890. doi: 10.1641/0006-3568(2002)052[0883:Ubac]2.0.Co;2
Meyberg Guzman, K., and Kathan, J. (2021). Pogonip farm relocation advances in Santa Cruz. Santa Cruz Local 28:2021.
Minkoff-Zern, L. A. (2014). Hunger amidst plenty: farmworker food insecurity and coping strategies in California. Local Environ. 19, 204–219. doi: 10.1080/13549839.2012.729568
Mouillot, D., Graham, N. A. J., Villeger, S., Mason, N. W. H., and Bellwood, D. R. (2013). A functional approach reveals community responses to disturbances. Trends Ecol. Evol. 28, 167–177. doi: 10.1016/j.tree.2012.10.004
Nassauer, J. I. (1995). Culture and changing landscape structure. Landsc. Ecol. 10, 229–237. doi: 10.1007/BF00129257
Nassauer, J. I., Wang, Z. F., and Dayrell, E. (2009). What will the neighbors think? Cultural norms and ecological design. Landsc. Urban Plan. 92, 282–292. doi: 10.1016/j.landurbplan.2009.05.010
Oksanen, J., Blanchet, F., Kindt, R., Legendre, P., Minchin, P., O'Hara, R., et al. (2018). Vegan: community ecology package. R package version 2.3-4. Available at: http://CRAN.R-project.org/package=vegan (Accessed July 8, 2018).
Ollerton, J., Alarcón, R., Waser, N. M., Price, M. V., Watts, S., Cranmer, L., et al. (2009). A global test of the pollination syndrome hypothesis. Ann. Bot-London. 103, 1471–1480. doi: 10.1093/aob/mcp031
Pérez-Harguindeguy, N., Díaz, S., Garnier, E., Lavorel, S., Poorter, H., Jaureguiberry, P., et al. (2013). New handbook for standardised measurement of plant functional traits worldwide. Aust. J. Bot. 61, 167–234. doi: 10.1071/bt12225
Perovič, D. J., Gamez-Virues, S., Landis, D. A., Wackers, F., Gurr, G. M., Wratten, S. D., et al. (2018). Managing biological control services through multi-trophic trait interactions: review and guidelines for implementation at local and landscape scales. Biol. Rev. Camb. Philos. Soc. 93, 306–321. doi: 10.1111/brv.12346
Pfeiffer, A., Silva, E., and Colquhoun, J. (2015). Innovation in urban agricultural practices: responding to diverse production environments. Renew. Agricult. Food Syst. 30, 79–91. doi: 10.1017/s1742170513000537
Philpott, S. M., Egerer, M. H., Bichier, P., Cohen, H., Cohen, R., Liere, H., et al. (2020). Gardener demographics, experience, and motivations drive differences in plant species richness and composition in urban gardens. Ecol. Soc. 25:27. doi: 10.5751/es-11666-250408
Planillo, A., Kramer-Schadt, S., Buchholz, S., Gras, P., von der Lippe, M., and Radchuk, V. (2021). Arthropod abundance modulates bird community responses to urbanization. Divers. Distrib. 27, 34–49. doi: 10.1111/ddi.13169
Quistberg, R. D., Bichier, P., and Philpott, S. M. (2016). Landscape and local correlates of bee abundance and species richness in urban gardens. Environ. Entomol. 45, 592–601. doi: 10.1093/ee/nvw025
R Core Team. (2022). R: A language and environment for statistical computing. R Foundation for Statistical Computing, Vienna, Austria.
Raneng, J., Howes, M., and Pickering, C. M. (2023). Current and future directions in research on community gardens. Urban For. Urban Green. 79:127814. doi: 10.1016/j.ufug.2022.127814
Richardson, E. A., and Mitchell, R. (2010). Gender differences in relationships between urban green space and health in the United Kingdom. Soc. Sci. Med. 71, 568–575. doi: 10.1016/j.socscimed.2010.04.015
Robbins, P. (2012). Lawn people: How grasses, weeds, and chemicals make us who we are. Philadelphia, PA: Temple University Press.
Rosas-Guerrero, V., Aguilar, R., Martén-Rodríguez, S., Ashworth, L., Lopezaraiza-Mikel, M., Bastida, J. M., et al. (2014). A quantitative review of pollination syndromes: do floral traits predict effective pollinators? Ecol. Lett. 17, 388–400. doi: 10.1111/ele.12224
Rosset, P. (2000). The multiple functions and benefits of small farm agriculture in the context of global trade negotiations. Development 43, 77–82. doi: 10.1057/palgrave.development.1110149
Santa Cruz County Parks (2014). “Community garden plots: Information & Guidelines” in Santa Cruz County department of parks. ed. O.S.C.S (Santa Cruz, CA: County of Santa Cruz)
Schell, C. J., Dyson, K., Fuentes, T. L., Des Roches, S., Harris, N. C., Miller, D. S., et al. (2020). The ecological and evolutionary consequences of systemic racism in urban environments. Science 369:eaay4497. doi: 10.1126/science.aay4497
Schlesinger, M. D., Manley, P. N., and Holyoak, M. (2008). Distinguishing stressors acting on land bird communities in an urbanizing environment. Ecology 89, 2302–2314. doi: 10.1890/07-0256.1
Seto, K. C., Guneralp, B., and Hutyra, L. R. (2012). Global forecasts of urban expansion to 2030 and direct impacts on biodiversity and carbon pools. Proc. Natl. Acad. Sci. U. S. A. 109, 16083–16088. doi: 10.1073/pnas.1211658109
Shochat, E., Lerman, S. B., Anderies, J. M., Warren, P. S., Faeth, S. H., and Nilon, C. H. (2010). Invasion, competition, and biodiversity loss in urban ecosystems. Bioscience 60, 199–208. doi: 10.1525/bio.2010.60.3.6
Smit, J., Ratta, A., and Nasr, J. (1996). Urban agriculture: Food, jobs and sustainable cities. New York, NY: United Nations Development Programme.
Suding, K. N., and Goldstein, L. J. (2008). Testing the holy grail framework: using functional traits to predict ecosystem change. New Phytol. 180, 559–562. doi: 10.1111/j.1469-8137.2008.02650.x
Swan, C. M., Pickett, S. T. A., Szlavecz, K., Warren, P., and Willey, K. T. (2011). Biodiversity and community composition in urban ecosystems: Coupled human, spatial, and Metacommunity processes. New York: Oxford Univ Press.
Taylor, J. R., Lovell, S. T., Wortman, S. E., and Chan, M. (2017). Ecosystem services and tradeoffs in the home food gardens of African American, Chinese-origin and Mexican-origin households in Chicago, IL. Renew. Agr. Food Syst. 32, 69–86. doi: 10.1017/S174217051600003X
Thompson, K., Austin, K. C., Smith, R. M., Warren, P. H., Angold, P. G., and Gaston, K. J. (2003). Urban domestic gardens (I): putting small-scale plant diversity in context. J. Veg. Sci. 14, 71–78. doi: 10.1111/j.1654-1103.2003.tb02129.x
Turo, K. J., and Gardiner, M. M. (2019). From potential to practical: conserving bees in urban public green spaces. Front. Ecol. Environ. 17, 167–175. doi: 10.1002/fee.2015
Ulrich, R. S. (1986). Human responses to vegetation and landscapes. Landsc. Urban Plan. 13, 29–44. doi: 10.1016/0169-2046(86)90005-8
United States Census Bureau (2023). American community survey data [online]. Available at: https://www.census.gov/programs-surveys/acs/data.html (Accessed January 19, 2023).
Uwayezu, E., and de Vries, W. (2018). Indicators for measuring spatial justice and land tenure security for poor and low income urban dwellers. Land 7. doi: 10.3390/land7030084
van Heezik, Y., Freeman, C., Porter, S., and Dickinson, K. J. M. (2013). Garden size, householder knowledge, and socio-economic status influence plant and bird diversity at the scale of individual gardens. Ecosystems 16, 1442–1454. doi: 10.1007/s10021-013-9694-8
Villeger, S., Mason, N. W. H., and Mouillot, D. (2008). New multidimensional functional diversity indices for a multifaceted framework in functional ecology. Ecology 89, 2290–2301. doi: 10.1890/07-1206.1
Violle, C., Navas, M. L., Vile, D., Kazakou, E., Fortunel, C., Hummel, I., et al. (2007). Let the concept of trait be functional! Oikos 116, 882–892. doi: 10.1111/j.2007.0030-1299.15559.x
Wakefield, S., Yeudall, F., Taron, C., Reynolds, J., and Skinner, A. (2007). Growing urban health: community gardening in south-East Toronto. Health Promot. Int. 22, 92–101. doi: 10.1093/heapro/dam001
Weber, M., Porturas, L., and Keeler, K. (2015). World list of plants with Extrafloral Nectaries [online]. Available at: http://www.extrafloralnectaries.org/ (Accessed May 10, 2021).
Winfree, R., Reilly, J. R., Bartomeus, I., Cariveau, D. P., Williams, N. M., and Gibbs, J. (2018). Species turnover promotes the importance of bee diversity for crop pollination at regional scales. Science 359, 791–793. doi: 10.1126/science.aao2117
Wood, S. A., Karp, D. S., DeClerck, F., Kremen, C., Naeem, S., and Palm, C. A. (2015). Functional traits in agriculture: agrobiodiversity and ecosystem services. Trends Ecol. Evol. 30, 531–539. doi: 10.1016/j.tree.2015.06.013
Woodcock, B. A., Garratt, M. P. D., Powney, G. D., Shaw, R. F., Osborne, J. L., Soroka, J., et al. (2019). Meta-analysis reveals that pollinator functional diversity and abundance enhance crop pollination and yield. Nat. Commun. 10. doi: 10.1038/s41467-019-09393-6
Yachi, S., and Loreau, M. (1999). Biodiversity and ecosystem productivity in a fluctuating environment: the insurance hypothesis. Proc. Natl. Acad. Sci. U. S. A. 96, 1463–1468. doi: 10.1073/pnas.96.4.1463
Yuen, J. (2012). Hybrid vigor: An analysis of land tenure arrangements in addressing land security for Urban Community gardens. Doctoral Dissertation. New York: Columbia University.
Zezza, A., and Tasciotti, L. (2010). Urban agriculture, poverty, and food security: empirical evidence from a sample of developing countries. Food Policy 35, 265–273. doi: 10.1016/j.foodpol.2010.04.007
Zillow (2023). Zillow United States home values [online]. Available at: https://www.zillow.com/home-values/102001/united-states/ (Accessed January 19, 2023).
Keywords: agroecosystem, diversity, community weighted means, ornamental plant, luxury effect
Citation: Philpott SM, Bichier P, Perez G, Jha S, Liere H and Lin BB (2023) Land tenure security and luxury support plant species and trait diversity in urban community gardens. Front. Sustain. Food Syst. 7:1195737. doi: 10.3389/fsufs.2023.1195737
Edited by:
Helda Morales, The South Border College (ECOSUR), MexicoReviewed by:
Paul Glaum, Waterborne Environmental, Inc., United StatesJoshua Earl Arnold, Warren Wilson College, United States
Copyright © 2023 Philpott, Bichier, Perez, Jha, Liere and Lin. This is an open-access article distributed under the terms of the Creative Commons Attribution License (CC BY). The use, distribution or reproduction in other forums is permitted, provided the original author(s) and the copyright owner(s) are credited and that the original publication in this journal is cited, in accordance with accepted academic practice. No use, distribution or reproduction is permitted which does not comply with these terms.
*Correspondence: Stacy M. Philpott, sphilpot@ucsc.edu
†Present address: Heidi Liere, Department of Biology, Lewis & Clark College, Portland, OR, United States