Stress fusion evaluation modeling and verification based on non-invasive blood glucose biosensors for live fish waterless transportation
 Yongjun Zhang
 Xinqing Xiao
 Huanhuan Feng4
  Xiaoshuan Zhang
 Qinan Zhao
- 1School of Information Engineering, Shandong Youth University of Political Science, Jinan, China
- 2Smart Healthcare Big Data Engineering and Ubiquitous Computing Characteristic Laboratory in Universities of Shandong, Jinan, China
- 3New Technology Research and Development Center of Intelligent Information Controlling in Universities of Shandong, Jinan, China
- 4College of Engineering, Beijing Laboratory of Food Quality and Safety, China Agricultural University, Beijing, China
- 5V.M. Gorbatov Federal Research Center for Foods Systems of RAS, Moscow, Russia
- 6Inner Mongolia Academy of Agricultural and Animal Husbandry Science, Hohhot, China
Non-invasive blood glucose level (BGL) evaluation technology in skin mucus is a wearable stress-detection means to indicate the health status of live fish for compensating the drawbacks using traditional invasive biochemical inspection. Nevertheless, the commonly used methods cannot accurately obtain the BGL variations owing to the influence of an uncertain glucose exudation rate, ambient effects, and individualized differences. Our study proposes a non-invasive multi-sensor-fusion-based method to evaluate the dynamic BGL variations using the enhanced gray wolf-optimized backpropagation network (EGWO-BP) to continuously acquire more accurate trends. Furthermore, the K-means++ (KMPP) algorithm is utilized to further improve the accuracy of BGL acquisition by clustering fish with full consideration of its size features. In the verification test, turbot (Scophthalmus Maximus) was selected as an experimental subject to perform the continuous BGL monitoring in waterless keep-alive transportation by acquiring comprehensive biomarker information from different parts of fish skin mucus, such as fins, body, and tails. The comparison of results indicates that the KMPP-EGWO-BP can effectively acquire more accurate BGL variation than the traditional gray wolf-optimized backpropagation network (GWO-BP), particle swarm-optimized backpropagation network (PSO-BP), backpropagation network (BP), and support vector regression (SVR) by mean absolute percentage error (MAPE), root mean square error (RMSE), and coefficient of determination (R2). Finally, the proposed BGL fusion evaluation model can precisely acquire the live fish's physiological stress states to substantially reduce the potential mortality for the live fish circulation industry.
1. Introduction
Live fish waterless transportation is a newly emerged strategy, which can effectively reduce the logistic cost with less wastage of resources, such as wastewater, oxygen, and maintenance energy (Wang et al., 2020). In this particular condition, fish are constantly exposed to different natural or artificial stressors during and after transportation, such as vibration, hypoxia, temperature anomaly, and package injuries, which may negatively affect fish's physiological status (Vanderzwalmen et al., 2020). Overstress reaction, also known as inappropriate stress, is considered a key influence that can weaken the fish's immune defense and reduce its resistance to pathogens and survival ability (Wang et al., 2021; Li D. et al., 2022). Therefore, continuously tracking the physiological stress transition of fish is of great significance to keep it in healthy condition. However, the continuous detection of the blood stress biomarkers in fish by the direct use of a biosensor is difficult due to blood coagulation and coalescing protein on the sensor. To dynamically and stably acquire the fish stress states, some scholars designed needle-type sensors to dynamically obtain fish stress levels by implanting the electrode in the interstitial fluid (IF) of the fish eye (Wu et al., 2015). These studies also discovered that the BGL in the IF of fish eyes is highly related to the BGL in fish, which reasonably supports the dynamic BGL monitoring in the IF of the fish eye for approximately reflecting the BGL variation in fish (Endo et al., 2009; Wu et al., 2019a). Notwithstanding, such sensing technique intrinsically has many defects for carrying out continuous stress detection, such as it being easy to cause extra stress, its complex operation, and vulnerability to introduce more interference. Furthermore, the in situ implantable monitoring often causes injury to fish bodies, which causes inconsistency with the actual stress state.
At present, some studies have proposed non-invasive detection means to measure the fish stress levels, such as glucose, lactate, or cortisol, as a reflection of the physiological response degree from fish skin mucus, urine, feces, and aquaculture water aiming at the drawbacks of the invasive inspections (Aerts et al., 2018; Fernández-Alacid et al., 2019; Samaras et al., 2021; Feng et al., 2022; Wang et al., 2022). Inspired by the abovementioned research, the different levels of stress indicators, such as glucose and cortisol, in different parts of the fish skin mucus can partially indicate the stress state and trends in fish. In addition, the fish skin mucus glucose vs. plasma glucose shows a highly significant strong positive correlation (Guardiola et al., 2016; Cai et al., 2020). Therefore, using the data fusion method to establish the estimation model by coupling the BGL in fish skin mucus and interstitial fluid of fish eye can more accurately estimate the stress variations of fish. In this study, the non-invasive accurate BGL estimation strategy by multi-sensor-fusion-based technique is urgently demanded to precisely obtain the live fish stress conditions by continuous detections of skin mucus BGL changes on the whole fish (Sadoul and Geffroy, 2019).
Multi-sensor data fusion has been an information processing process that uses computer technology to automatically analyze and synthesize information and data from multi-sensor under specific criteria to complete required estimates and decisions (Wang and Zhang, 2019; Lin et al., 2021; Wu et al., 2021; Li J. et al., 2022). Moreover, more research on dynamic BGL diagnosis happened in the multi-sensor-based fusion detection in human healthcare fields. Song et al. (2015) put forward multi-modal spectrum-integrated circuit assistance by impedance and near-infrared spectroscopy, which fuses the data with the artificial neural network (ANN) for non-invasive BGL measurement. Harman-Boehm et al. (2010) designed a multi-sensor non-invasive BGL sensing device that integrates a heat conduction sensor, an impedance sensor, and an ultrasonic sensor and fuses the monitoring results of the three methods mentioned above by applying the least-squares method. Cho estimates BGL via a linear model of the human body's metabolic parameters using physiological biosensors, such as temperature, relative humidity, and photoelectric sensors (Cho et al., 2004). In addition, the BGL estimation models can be improved by using machine-learning tools, such as ANN, SVR, and Extreme Gradient Boosting (XGBoost), which have demonstrated significantly enhanced results for predicting BGL under multiple inputs (Gupta et al., 2021). Through the above comprehensive discussion of the non-invasive stress detection and the fusion technology, it is applicable and feasible to design multi-sensor-fusion-based monitoring techniques to accurately estimate the live fish stress variations.
The main contribution of this study is to continuously obtain the accurate stress signal of fish by multi-sensor fusion-based BGL estimation techniques and provide a more scientific basis for monitoring fish stress states in adverse conditions. This article is organized as follows: Section 1 introduces BGL fusion research and relevant literature discussion. Section 2 uses the Kalman filtering algorithm against impact interference to preprocess the measured data. Then, the abnormal BGL values are eliminated to improve the anti-interference ability. After that, an enhanced gray wolf optimizer is proposed to optimize the initial threshold, weight, and structures of the BP neural network to improve the fusion performance significantly. In Section 3, the comparison experiments are carried out to verify the effectiveness of the proposed fusion technologies. In the last section, the conclusion is stated to clarify the purpose of this study and its potential application values.
2. Materials and methods
2.1. Non-invasive multi-sensor-fusion-based BGL monitoring system
The NMBGLMS is established for the simultaneous and integrated acquisition of the different parts of skin mucus BGL data. The scenario of live turbot waterless transportation and dynamic stress monitoring is shown in Figure 1. Before testing this system, the experimental subjects should be simulated live fish in waterless transportation (in waterless and low-temperature conditions) to quickly deploy the invasive and non-invasive BGL sensors on fish and perform contrast tests. In this study, the fish were placed in clean seawater (with circulating purification and oxygenation, water temperature 15–20°C) for 1–2 days. Then, cold dormancy treatment began to be carried out. The seawater is cooled by a gradient (2°C per h). When the seawater temperature reaches 4°C, fish generally enter a cold anesthesia stage (no significant response to external interference and stimulation). Afterward, fish are placed on foam trays to prevent the impact of vibration on monitoring. Then, the patch-typed BGL sensors are deployed in the fins, body side, and tails of the fish for non-invasive stress state detection. Meanwhile, the minimally invasive blood glucose sensor is implanted in the interstitial fluid of fish sclera to continuously obtain the BGL trends to evaluate the accuracy of BGL fusion performance. The BGL trends in IF are the standard reference to verify the accuracy of the multi-sensor-fusion-based methods.
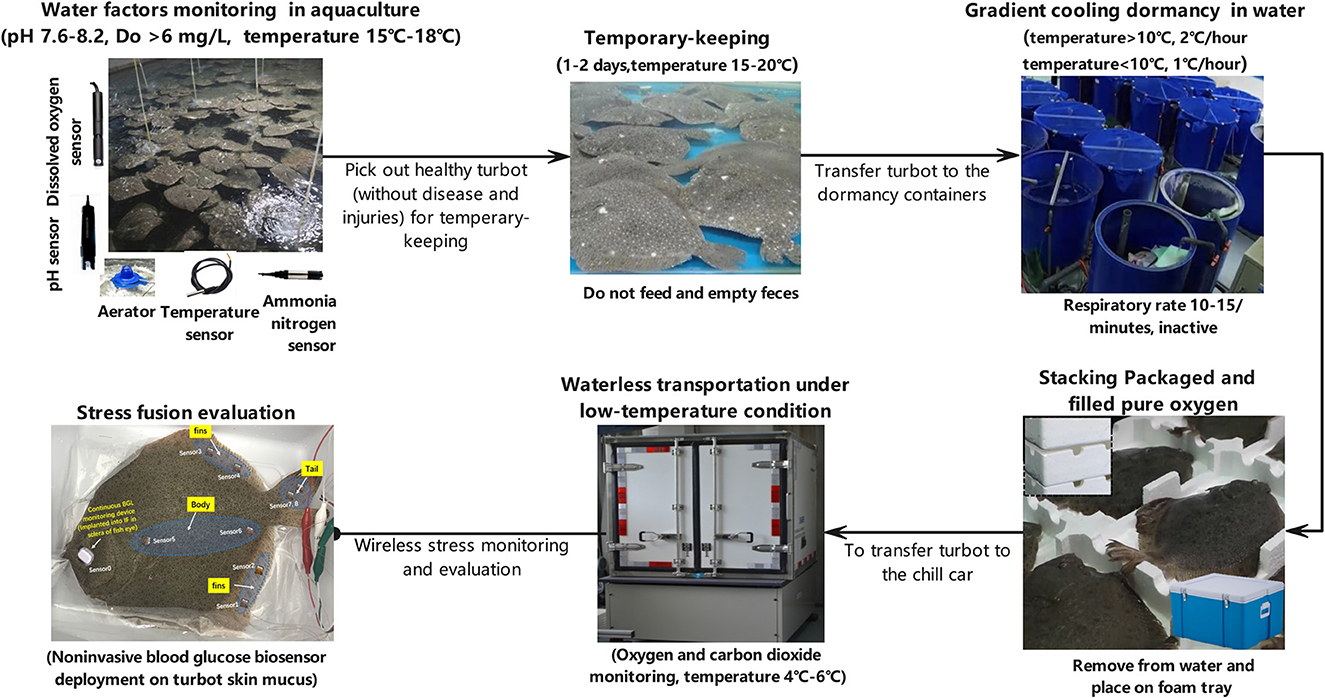
Figure 1. Scenario of live turbot waterless transportation and dynamic stress monitoring.
The portable electrochemical module accurately converts different parts of the BGL current signals from fish skin mucus to the BGL data series. All these processes are under waterless and low-temperature conditions of 4–6°C. Moreover, the deployment tasks should be finished within 10–15 min to minimize the newly introduced stress interference during the sensor deployment. Afterward, the film covers the sensors to keep the skin mucus less influenced by ambient variations. Ambient temperature and relative humidity are monitored for the dynamic temperature compensation and sensitivity calculation of all BGL sensors. The portable workstation has eight channels to harvest the skin mucus BGL trends. These data are collected by container-based MCU (STM32F103, STMicroelectronics, Switzerland) with wireless communication module Lora (SX1278, Ebyte Electronic Technology Co., Ltd, China). Next, it relays and transmits these data to the mobile device (with a built-in Lora transceiver), which is mounted on a refrigerated truck or in low-temperature preservation conditions. The acquired stress data series are continuously sent to the BGL monitoring and fusion modeling server for data persistence storage, dynamic analysis, data fusion estimation, and evaluation. In this study, BGL values in IF are approximately recognized as BGL changes in fish, which merged with the multi-sensors in skin mucus sensing data to establish training and test data sets for the subsequent BGL fusion modeling and verifications. The working procedures of NMBGLMS are illustrated in Figure 2.
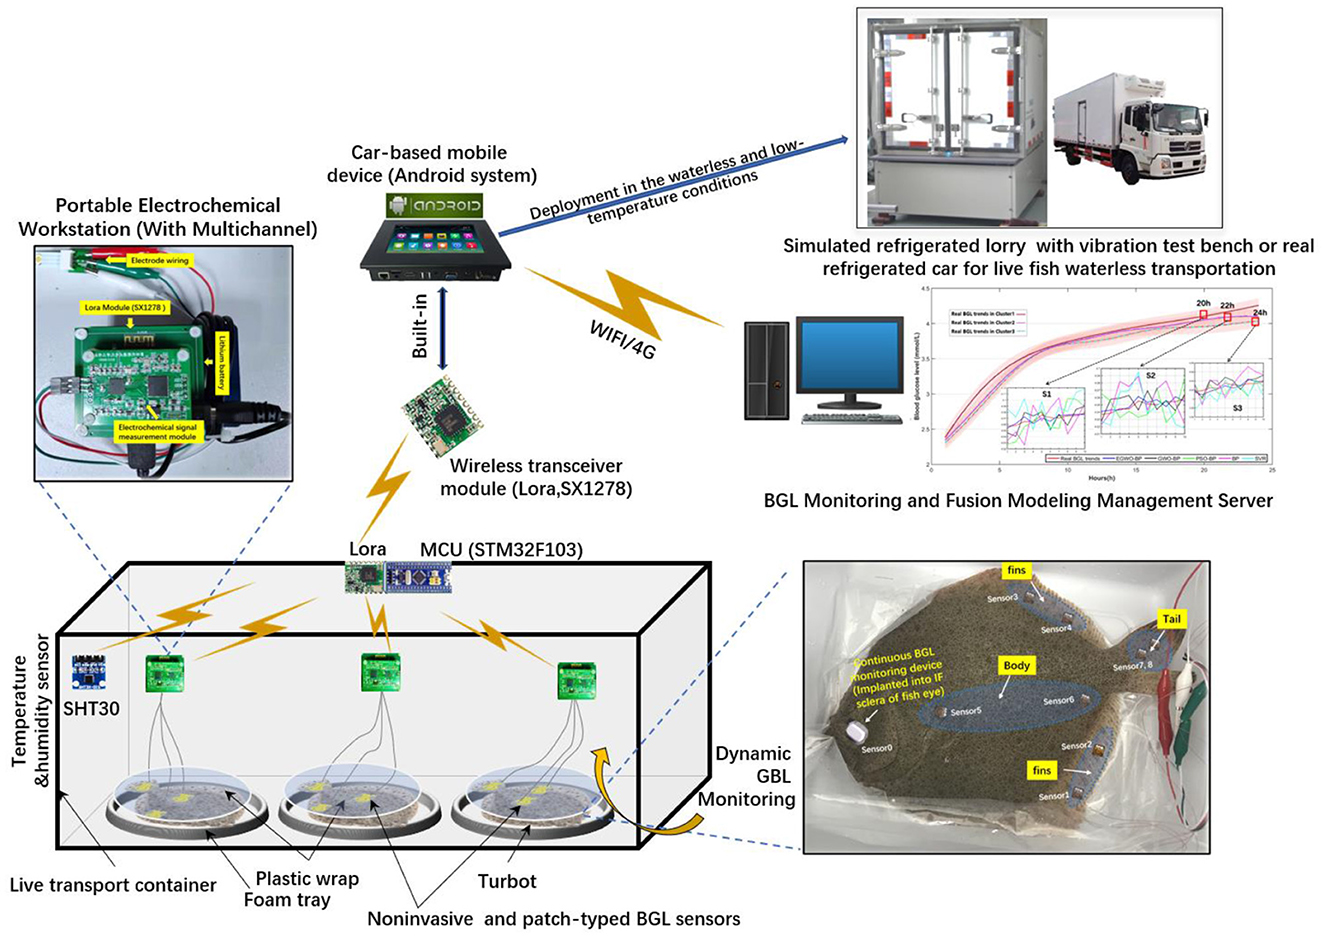
Figure 2. Working procedures of NMFBGLMS for BGL monitoring of fish skin mucus and IF of the fish eye.
2.2. Sensor preparation and calibration
In this study, flexible patch-typed BGL sensors and relevant materials and methods were used according to Wang et al. (2019) and Yu et al. (2021). Three electrodes of the prepared, flexible PET-based (polyethylene terephthalate) gold electrode are the working electrode, the reference electrode, and the auxiliary electrode.
We coated the reference electrode with silver paste, placed it on the heating plate at 50°C, and heated it for 1 h for later treatment to obtain the Ag/AgCl reference electrode. The chitosan/carbon nanotube solution was mixed thoroughly with glucose oxidase solution [20 mg/mL in phosphate-buffered saline (PBS) of pH 5] in a ratio of 2:1 (volume by volume). Then, 1.6 μL of the abovementioned glucose oxidase solution was drop-casted on the Prussian blue-coated PET gold electrode (PGE) surface. After drying the electrode under ambient conditions, 2.5 μL of 0.5 wt% Nafion was drop-casted on the BGL sensor and dried at room temperature. Finally, the PGE glucose sensor was stored at 4°C and ready for BGL monitoring. Figure 3 demonstrates the primary process of preparation of a flexible blood glucose sensor. After each addition of glucose solution, we blow the solution for ~30 s with a pipette gun to make glucose oxidase fully catalyze glucose oxidation and then conduct the i-t method detection and record the linear ranges.
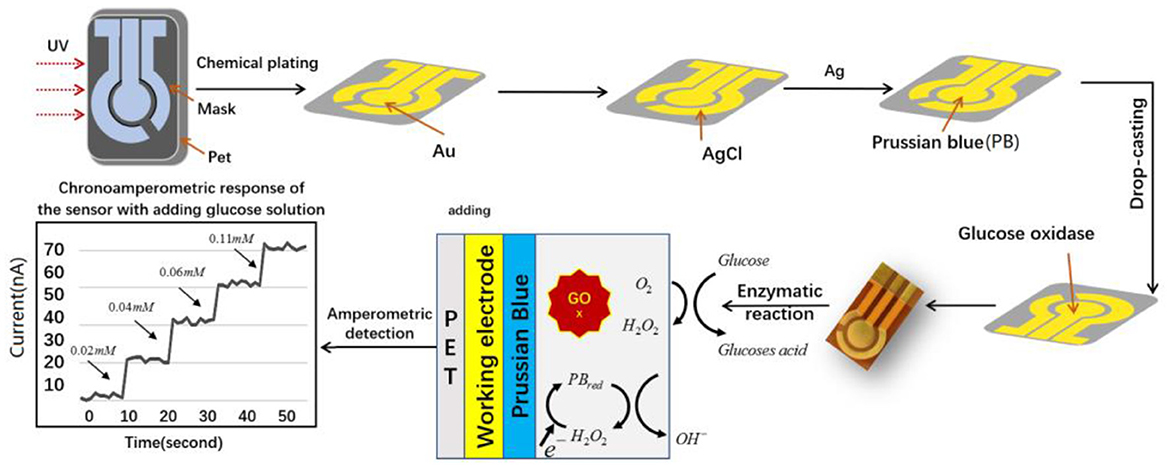
Figure 3. Primary process of preparation of flexible BGL sensor.
In addition, we prepare a batch of glucose sensors and store them in a refrigerator at 4°C. We also take three of these sensors to test the glucose solution (2.2 mmol/L) using the i-t method and record the steady-state current value each time to test the stability for 2 weeks (three times each week). Then, the same sensors are used to measure glucose standard solution (2.2 mmol/L) five times continuously and calculate its reproducibility. The specifications of the flexible BGL sensors are shown in Table 1.
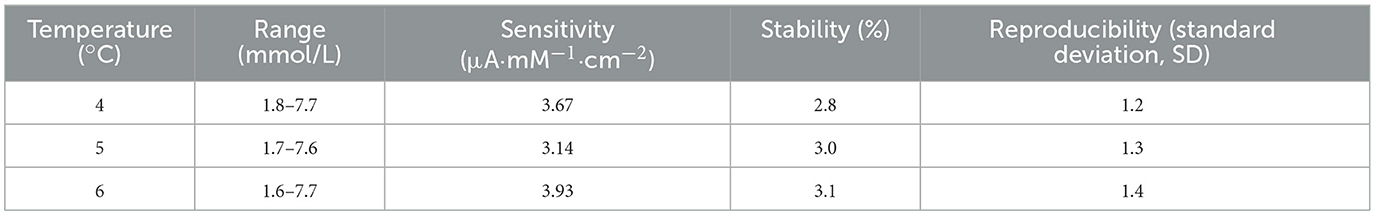
Table 1. Specifications of the flexible BGL sensor in different temperatures.
The calibration process of the BGL sensor is to convert the measured current signal into the estimated BGL values (Wu et al., 2019b). The single-point technology is a popular calibration method expressed in Equation (1).
where S represents the sensitivity of the sensor. Ic and GF are the measuring current and reference BGL at the calibration time t. G(t) and I(t) are the BGL and the output current of the sensor at the time t.
Due to the influence of temperature on the instantaneous concentration of glucose, enzyme catalytic activity, and physiologically stable surroundings, the different temperatures of the fish body will affect the output current value during its stress monitoring. Assuming that the current before temperature compensation is I(t), the current after temperature compensation is İ(t), the monitored temperature changes ΔT°C compared with the standard temperature, and the compensation coefficient is a, the temperature compensation function of the sensor output current is shown in Equation (2).
The BGL sensor calibrated and compensated by the above method is illustrated as shown in Equation (3):
2.3. Data fusion preprocessing
BGL sensors are easily affected by abnormal ambient variations, which may cause particular impact interference. The acquired raw BGL data are usually mixed with measurement noise and various interference signals to hinder the accuracy and effectiveness of fusion calculations. Therefore, fusion data preprocessing is generally divided into two stages to improve the quality of the obtained BGL data series. One is eliminating the large BGL monitoring deviations generated by abnormal sensing acquisitions. Another is to decrease the noise to improve the fusion performance by using a series of advanced signal noise reduction methods (Feng et al., 2022).
2.3.1. Large deviation elimination
Before fusing the original data of multi-sensor measurement, the abnormal data can be found and eliminated by using the data distribution map method in data detection technology (Hubert and Vandervieren, 2008). The main parameters reflecting the data distribution structure in the distribution chart are median TM, upper quantile FU, lower quantile FL, and quantile dispersion dF. N sensors are used to detect the fish BGL variations independently. The monitoring tasks are arranged in the order of measuring parameters from small to large to obtain a group of detection sequences: T1, T2, ⋯ , Tn−1, Tn. Here, T1 is a lower limit of the detection sequence and Tn an upper limit of the detection sequence. The median TM is defined as Equation (4):
The upper quintile FU is the interval median [TM, TN] and the lower quintile FL is the median of [T1, TM]. Quantile dispersion is expressed as Equation (5):
The data whose distance from the median is set to be greater than α·dF are abnormal data; that is, the judgment interval of invalid data is shown in the following Equation (6).
where α is a constant, generally 0.5, 1.0, 2.0, and so on. The value of i is 1, 2, 3, …, n−1, n. When the abnormal data of the detection sequence is detected and eliminated, the remaining data is prepared for further data-level fusion processing.
2.3.2. Kalman filtering
The Kalman filtering algorithm can entirely suppress the noise on actual data and provide more valuable data for more advanced data fusion processing (Guo et al., 2014). In this study, the first level fusion process will use Kalman filtering technology to decrease the noise in the acquired BGL series. The main steps of the Kalman filtering algorithm are as follows:
• The predictive equation of state is expressed as the following equation.
• Where, Xk/k−1 is the current state results predicted at time K-1; Xk−1/k−1 is the time optimal value at t-1. Fk is the state transition matrix; Hk is the control variable matrix; and Rk is the control gain in the current state.
• Update the optimal value equation (output of Kalman filter)
• Kalman gain equation
Kg is the Kalman gain; Hk denotes the prediction matrix; Rk is the covariance of measurement noise.
• Update the optimal value equation (output of Kalman filter)
Xk/k−1 is the optimal estimate of the state variable at time k.
Zk is the measurement matrix of the sensors.
• To enable the Kalman filter algorithm to run iteratively, it is also necessary to update the covariance Xk/k at the current time K during each iteration. I is a unit matrix.
According to the description of the above equation, Kalman filtering can be divided into the prediction process and the correction process. The prediction process is to predict the current state according to the estimated value at the previous time. The correction process is to combine the observations and estimates at the current time to obtain the optimal estimate closer to the actual value.
2.4. Multi-sensor-based BGL fusion estimation modeling
2.4.1. Experimental setup
Without loss of generalization, 50 tails of turbot were used in BGL data harvesting and statistics in this experiment, which was classified according to their size features by using the clustering algorithm K-means++ (Xu et al., 2014). In each group, three tails of fish that size near the center of clusters were selected to evaluate the accuracy of BGL estimations under the conditions 4–6°C. Before the BGL fusion estimation test, the patch-type BGL sensor is calibrated and compensated to acquire the precise BGL trends in different parts of fish skin mucus, body sides, fins, and tails to carry out the BGL acquisitions. Meanwhile, the continuous minimally invasive BGL monitoring device (AiDEX, MicroTech Medical, China) was implanted into the IF of the fish sclera to acquire the BGL data series.
Furthermore, the acquired BGL series is constructed and separated into two parts. One part that counts for 80% is used as the training dataset for fusion algorithms' training and optimization. Another aspect of the BGL data series accounts for 20% of verifying the performances of multi-sensor-based BGL fusion estimation. Figure 4 illustrates the specific conceiving and procedures of the verification experiments.
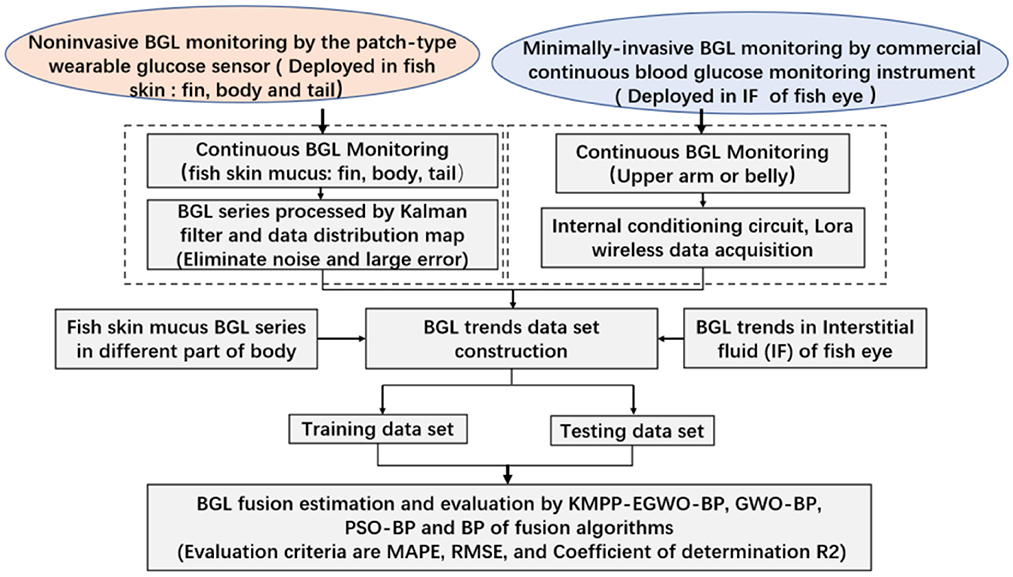
Figure 4. Test design for the non-invasive multi-sensor-fusion-based BGL estimation modeling and verifications.
2.4.2. BP fusion process
This study uses multi-sensors attached to different fish parts for comprehensive and accurate BGL estimation using the backpropagation network (BP) (Wang, 2020). Multi-sensor data fusion technology organically combines the signals collected by sensors in various places to make the indexes more clearly measured, enhancing the reliability and accuracy of the monitored results (Zou et al., 2020). Through training data samples, the weights and thresholds of the network are constantly revised to make the error function decline along the negative gradient direction and approach the expected output. However, the BP network also has shortcomings, such as the slow convergence speed of the network and the training being prone to local minima. For this reason, the enhanced gray wolf optimizer (EGWO) with fast running speed and good global optimization ability is introduced to solve the problems that the BP network is easy to fall into slow convergence speed, and local minima are easy to occur.
The structure of the BP network is optimally configured as per the following rules. The input layer is the BGL data series from different positions, such as fins, bodies, and tails, collected by eight sensors for one fish. The number range of hidden layer neuron nodes can be determined according to the empirical formula (12). The output layer is the BGL series of the interstitial fluid in the fish eye. Figure 5 illustrates the structure of the three-layer BP neural network.
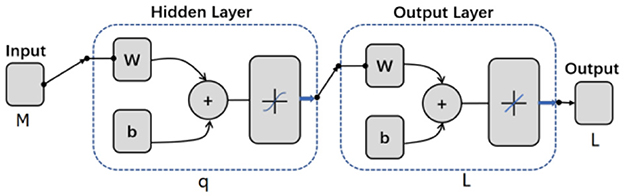
Figure 5. Structure of the three-layer BP neural network.
where q is the number of neurons in the hidden layer; M is the number of neurons in the input layer; L is the number of neurons in the output layer; and a is a fixed constant a∈(0, 10).
The activation function of the hidden layer in the BP neural network is sigmoid, and the transfer function of the output layer is pure line, which is expressed by the following two Equations (13) and (14):
2.4.3. Optimization of BP fusion process
The gray wolf optimizer (GWO) is designed to accurately approach the target by imitating the leadership level of the gray wolf population in nature and the way of group hunting (Liu et al., 2021). Mirjalili verified through a series of standard test functions that GWO has faster convergence speed and stronger stability than particle swarm optimization (PSO) and genetic algorithms (GAs) (Faris et al., 2018). The algorithm divides individuals into four classes according to fitness values: α, β, δ, and ω. α is the optimal solution. β and δ are the second and third optimal solutions, and the candidate solution is ω. The mathematical model of the algorithm is shown in Equation (15):
where D is a distance vector between gray wolf individuals and prey. t is the current iteration number. Xp(t) is the position vector of prey. X(t) is the gray wolf individual position vector. The convergence factor A = 2a·r1−a. C = 2r2 is a random vector of [0,1], and a is the control parameter.
Through the above hunting strategy, the gray wolf population can identify its prey's location and surround it. In the mathematical abstract search space, the position vector of ω is updated by calculating the position vector of α, β, δ, which is expressed in Equation (16).
where X indicates the current position of the gray wolf. C1, C2, and C3 are the random disturbance vector. Xα, Xβ, and Xδ are the positions of α, β, and δ. Dα, Dβ, and Dδ are the distance between the current gray wolf individual and α, β, and γ, respectively. X(t+1) is the final position vector of the wolf ω in this round of updates, which is denoted in Equation (17):
However, the above-average hunting position calculation shows a shortage of search performance. Two strategies are applied to enhance the optimization ability of the original gray wolf algorithm. One is to improve the calculation method of non-linear control parameters. Another is the upgrading of the dynamic weight position update strategy.
• The improved non-linear control parameters.
The GWO algorithm has a self-adaptive convergence factor and control parameter mechanism (Tian et al., 2020; Zhang et al., 2023). The linear decrease causes the convergence factor A to change within the interval [−a, +a]. When |A|>1, the wolves scatter for global search. When |A| < 1, the wolf pack is close to the optimal solution. The control parameter affects the convergence factor A's convergence and then affects the global or local search of the wolf pack. The control parameter decreases linearly from 2 to 0 with the increase a. Because the actual optimization process of GWO is complex and non-linear, the linear reduction cannot wholly balance the searchability of global and local optimization. Therefore, this study proposes a non-linear control parameter strategy based on the exponential function to improve convergence performance. The Equation (18) is as follows:
where tmax is the maximum number of iterations. amax = 2 and amin = 0.
The improved control parameter a becomes non-linear decreasing trends. Compared with the linear reducing strategy, at the beginning of the algorithm, the decreasing speed a is lower, which increases the global search ability. At the later stage of the algorithm, the decreasing speed is more considerable, which improves the algorithm's convergence rate for local optimization problems.
• Dynamic weight position update strategy.
The GWO algorithm updates the position under the leadership of α, β, and δ wolf, but Equation (16) shows that α, β, and δ have the same influence. However, these leader wolves have different characteristics and leadership influences. This study proposes a dynamic weight position update strategy based on fitness value and step Euclidean distance in combination with the dynamic weight update strategy in Equation (19).
where Fα, Fβ, and Fδ are fitness values. W1, W2, and W3 are the learning rates of the gray wolf population for α, β, and δ, respectively. Wolf ω updates the position X(t+1) in each round. By carefully considering fitness weight w and learning rate W, we dynamically adjust the proportion of influence weight on updating individuals. In this way, the ratio of influence of α, β, and δ on gray wolf individuals can be more prominent. At the same time, it can better balance this algorithm's learning and searching ability.
2.4.4. KMPP-EGWO-BP-based BGL fusion estimation
The basic idea in this research is to use EGWO to optimize the BP neural network, which takes the position information of the improved gray wolf algorithm as the weight and threshold of the BP neural network (Zhao et al., 2019; Du et al., 2021). With the continuous change of the gray wolf's position, the weights and thresholds of BP are also constantly adjusted and optimized. Through optimizing the EGWO algorithm, the effect of BP neural network fusion performance is further improved. At the same time, the convergence speed and accuracy of the BP neural network are further enhanced. Figure 6 illustrates the model of the proposed KMPP-EGWO-BP-based BGL fusion calculation's inaccurate BGL estimation. Before BGL data fusion calculation, the subjects are classified into one group. The optimized BP fusion models and key configured parameters are constructed and recorded according to the clustered groups. Afterward, an optimized BP model is specified by fish size features for the forthcoming BGL data fusion estimations. The specific computing process is described and discussed in the following sections.
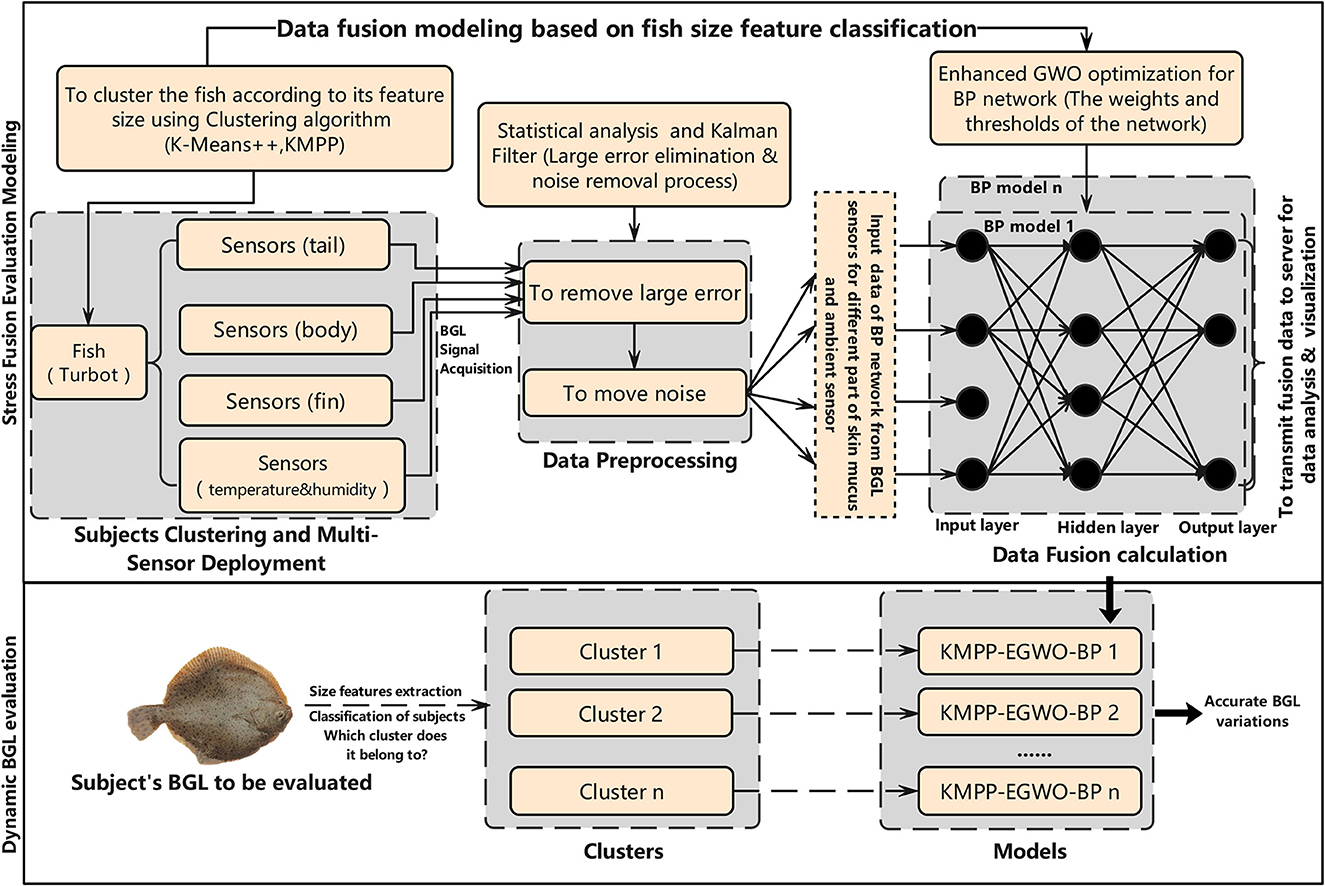
Figure 6. Model of KMPP-EGWO-BP-based BGL fusion estimation.
The specific working steps of the KMPP-EGWO-BP network are described as follows:
Step 1: The experimental subjects are clustered according to their size features. For each cluster, the system constructs the following multi-sensor-fusion-based BGL evaluation model.
Step 2: The first is to set the initial threshold and weight of BP and to determine the number of nodes in the network's hidden layer according to the empirical formula (11).
Step 3: GWO initializes its basic parameters, such as gray wolf population, positions, and population size calculation. It also initializes the critical parameters A, a, and K according to the network structure and determines the maximum number of iterations.
Step 4: BP determines the neural network's fitness and the output node's activation functions.
Step 5: The hybrid fusion method calculates the individual fitness value of the wolf and finds out the optimal solution of the fitness value (the position Xα of the wolf α), the suboptimal solution (the position Xβ of the wolf β), and the third optimal solution (the position Xδ of the wolf δ). It also updates the location information of the remaining gray wolf ω according to Equation (18) and the values of parameters A, C, and a.
Step 6: The training and testing samples for experiments are selected and the error and its corresponding optimal solution (the position of Xα the wolf α) are recorded.
Step 7: Whether the maximum number of iterations has been reached needs to be judged or whether the set error threshold has been satisfied. If the conditions are met, the loop operations need to be terminated; otherwise, step (4) to step (6) need to be repeated.
Step 8: Finally, the returned results are the location of the wolf α, that is, the location of the optimal solution. It also includes the location of α in each iteration of the training process, the minimum error of the location α, and the error of training and test samples.
Through EGWO, feasible initial weights and threshold values of the BP neural network are generated to correctly solve the problems of local minimum and slow convergence problems. Finally, the BGL fusion evaluation models are established and saved for the one clustered fish group with similar size features. The application of the proposed fusion model is to compute the minimum distance of fish size features with one clustered center and use the corresponding model to finish the accurate fusion BGL estimation.
3. Results and discussion
In this study, MATLAB (2020) was used to implement the data filtering preprocessing and multi-sensor-fusion-based KMPP-EGWO-BP algorithm. In the following sections, the BGL data fusion algorithm was validated, analyzed, and evaluated from five aspects: BGL fusion estimation discussion, optimization of neural network structure, data fusion error, and comprehensive evaluation of fusion performance.
Through the experiment schemes, the turbot size was classified according to its body size features (weight, width, and length). Three groups were classified according to their size features by using the K-means++ for comprehensively analyzing the BGL fusion performance. After the clustering process, the centers of the three groups were as follows: cluster 1: (center 1: weight = 970.2 g, length = 35.9 cm, and width = 26.8 cm), cluster 2: (center 2, weight = 973.1 g, length = 36.9 cm, and width = 27.4 cm), and cluster 3: (Center 3, weight = 977.4 g, length = 37.5 cm, and width = 27.9 cm). Three tails of turbot were selected and tested for more accurate BGL estimation modeling and evaluation, which had closed sizes with similar physiological stress variations, such as approximate BGL, heart rate, and respiratory characteristics, to the center in each group. These BGL data series were harvested and fused in the mobile device. In addition, the EGWO-BP fusion model was optimized, and its critical parameters were recorded according to fish size features, which utilized the K-means++ algorithm to classify the fish for upgrading the efficiency of the fusion performance. As can be seen from Figure 7, the established KMPP-EGWO-BP-based BGL fused estimation modeling and assessment were compared to verify the accuracy under waterless and low-temperature transport conditions.
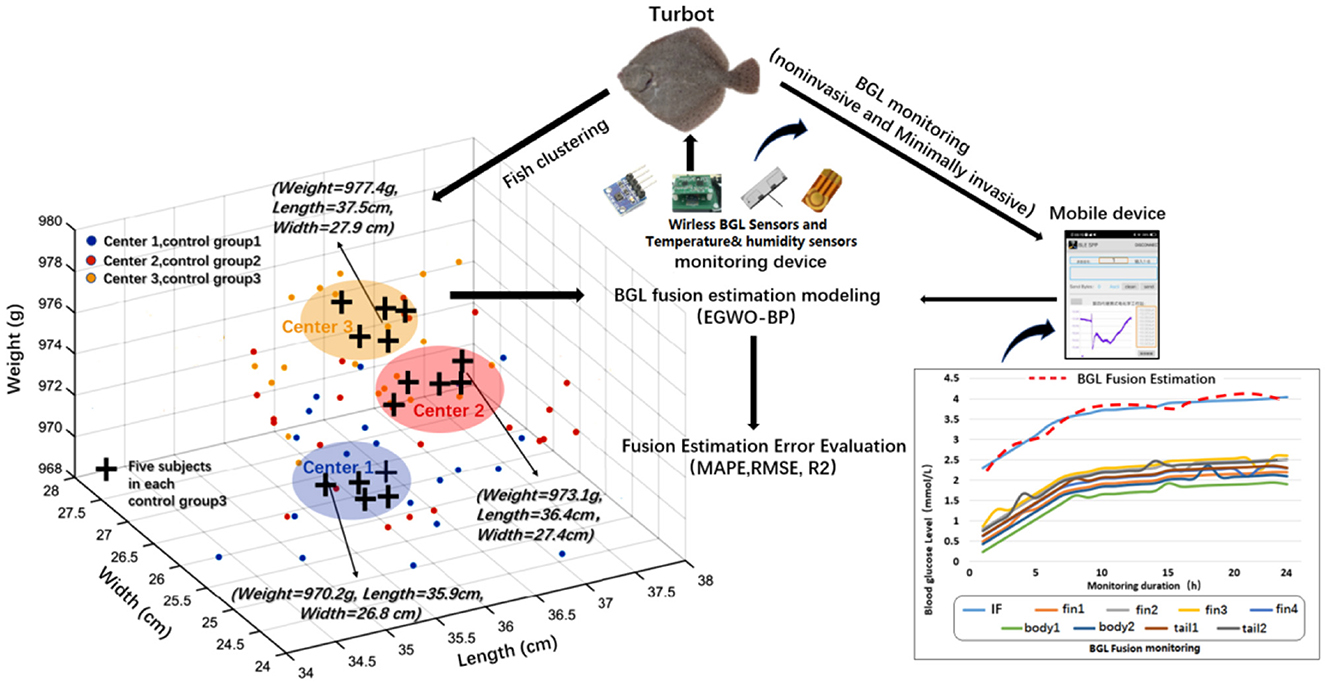
Figure 7. Experiment description of BGL fusion estimation modeling and verification.
3.1. Sensor calibration and data preprocessing
The BGL monitoring error will increase when the non-invasive BGL sensor is exposed to the low temperature and high humidity monitoring environment. Before establishing the well-performed BGL fusion estimation, the large deviations should also be eliminated. Table 2 summarizes the deviations under the film-covered and uncovered BGL monitoring at three low temperatures 4, 5, and 6°C. Additionally, the output current of BGL sensors was recorded as standard output for detecting collected fish skin mucus with BGL 4.8 mmol/L in sealing electrolysis cells. Meanwhile, the output of sensors under film-covered and uncovered conditions was tested at the same BGL concentration of skin mucus in the simulated low-temperature and waterless adverse conditions. The deviation comparison showed that the film-covered sensor can acquire precise BGL variations from fish skin mucus.
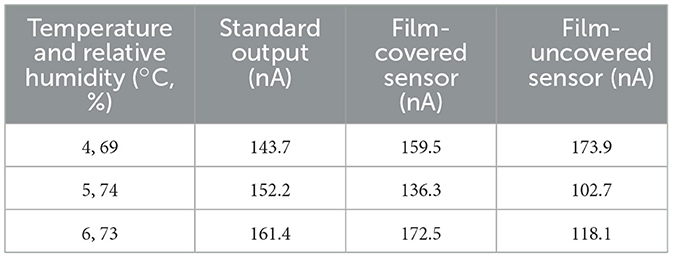
Table 2. Comparison of sensor output current under the film-covered and uncovered conditions.
The linear relationship between the sensors' output current and fish skin mucus BGL within 4–6°C was tested and calculated for precise calibrations. Table 3 illustrates the sensors' output for skin mucus BGL monitoring before and after the sensors' calibration and compensation.
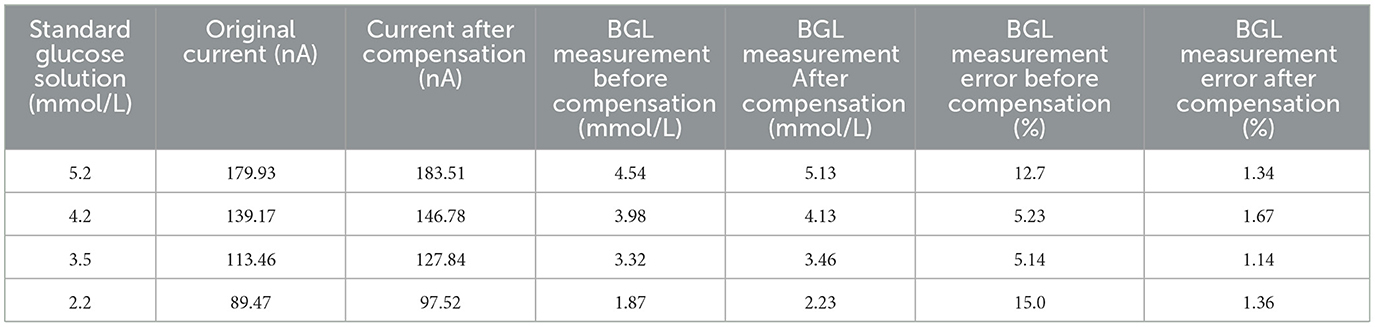
Table 3. Sensors' output for fish skin mucus BGL monitoring before and after sensors' calibration and compensation.
Figure 8 shows the data preprocessing effect after the significant deviation removing process and noise elimination by Kalman filtering. The relevant calibration parameters were solved to improve the data fusion performances. At 4–6°C, the output current of BGL sensors at 4, 5, and 6°C was measured every 5 min, respectively, and the mean value taken to calculate the temperature coefficient a = (0.0304 ± 0.00415). Therefore, the temperature compensation coefficient a = 0.03 was taken to adjust the sensors' output. After compensation, the average BGL measurement deviation decreased by approximately 18.5% within the BGL range from 2.2 to 5.2, which provided a more precise data source for the BGL data series for the following advanced data fusion process.
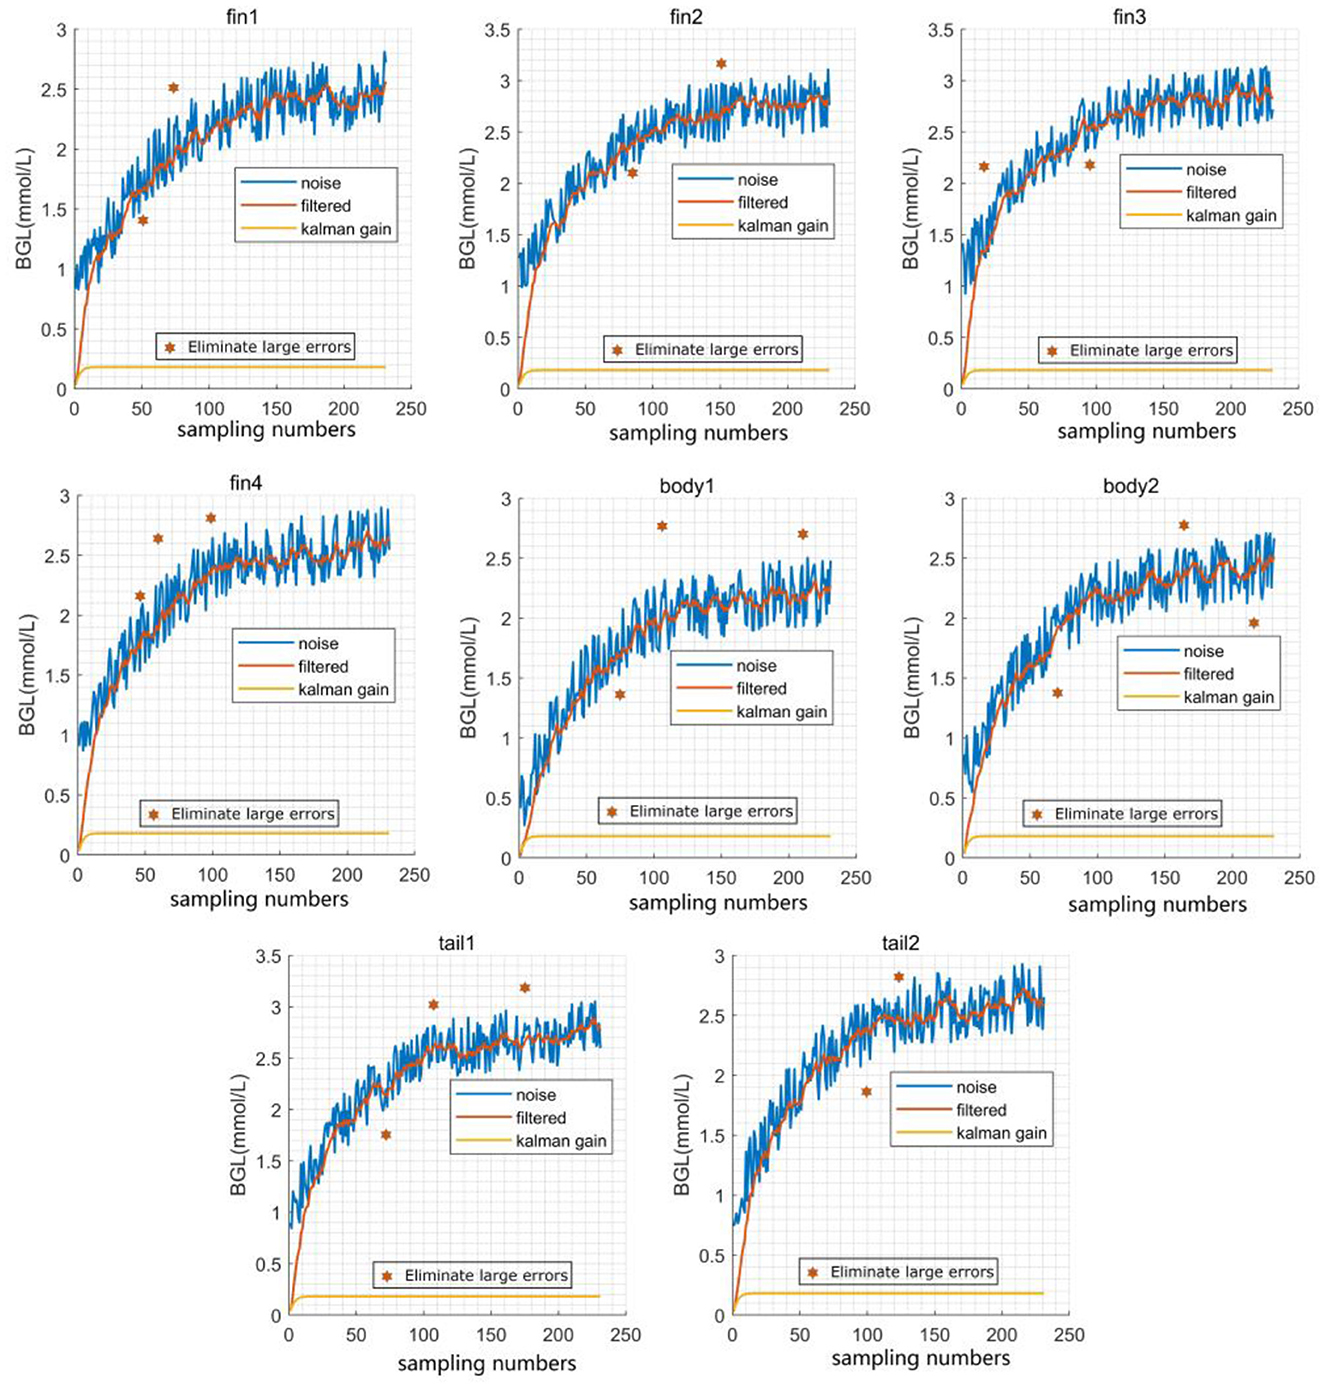
Figure 8. Data preprocessing effect after the significant deviation removal and noise elimination by Kalman filtering (sensor number: fins 1–4; body 1–2; tails 1–2, α = 0.5).
There are three error criteria, variance, range, and coefficient of variation, to measure the original skin mucus BGL signals. Variance measures the degree of dispersion of a group of data. The range represents the statistical data's maximum and minimum variance values. The coefficient of variation is a relative statistic to measure the degree of data dispersion used to compare the distribution of different sample data. Table 4 illustrates the data processing demonstration and evaluation for a different part of the turbot after the significant error removal and Kalman filtering by range, variance, and coefficient of variation. Through data series pretreatment, the BGL fusion results of our proposed algorithm were better than the direct process of the raw data without pretreatment in terms of the criteria mentioned above.
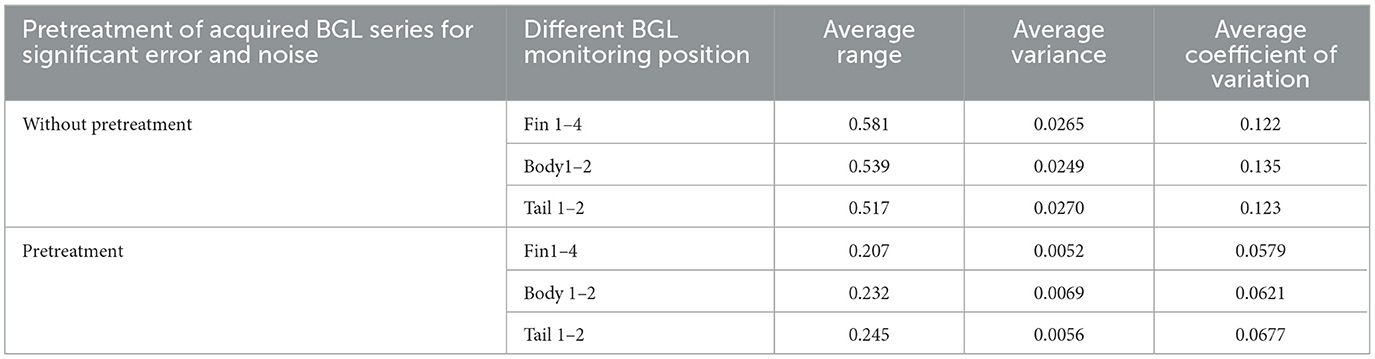
Table 4. Data pretreatment evaluation after the large error removal and Kalman filtering.
3.2. Optimization of EGWO-BP algorithms
The KMPP-EGWO-BP algorithm keeps approaching the optimal fitness value as the number of iterations increases. It converges to the optimal fitness value after about 30 iterations. Through EGWO, feasible initial weights and threshold values of the BP neural network are generated to correctly solve the problems of local minimum and slow convergence problems.
Meanwhile, GWO-BP and PSO-BP algorithms reach the optimal states after 67 and 95 iterations, respectively. The above results show that the KMPP-EGWO-BP algorithm can expand the optimization space, effectively avoid optimal local solutions, and improve the convergence speed of the algorithm when using adaptive control parameters and dynamic position weights. The experimental result of Table 5 shows that when the number of neurons in the hidden layer of the BP neural network is 8 and α = 5, the mean absolute error (MAE) of the BGL value is the minimum. In this research, the structure of the BP neural network was set as 10-8-1 according to Equation (12).
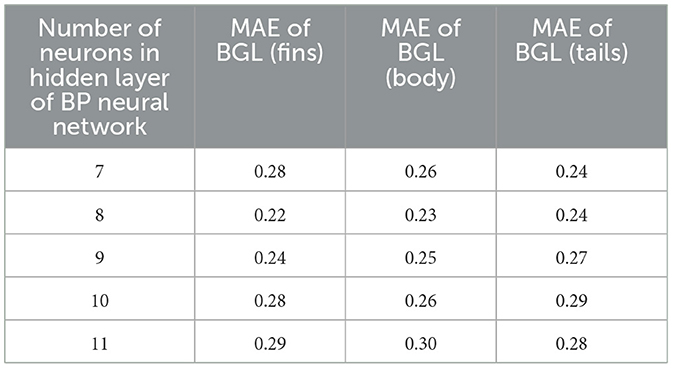
Table 5. Mean absolute error between the output value and the real value of BP with the number of neurons in hidden layers.
3.3. Verification of the EGWO-BP fusion model
This study used MAPE, RMSE, and R2 to evaluate the fusion models of KMPP-EGWO-BP, GWO-BP, PSO-BP, BP, and SVR (Zhang et al., 2020; Yang et al., 2023). The verification criteria were as follows: Equations (20)–(22):
where Yreal and Ypred is the actual value and algorithm model output value of the n-test. is the average value of the real data series and m is the total number of tests.
For a complete evaluation of the fusion effect, the error of BGL fusion estimation was measured in three time points, 20, 22, and 24 h, which were measured by 10 samples at these detection time points to evaluate the BGL fusion accuracy. The indexes of MAPE, RMSE, and R2 were calculated for deviation analysis. Afterward, every control group was marked by the average value of evaluation indexes for a more comprehensive analysis of the fusion efficiency using KMPP-EGWO-BP, GWO-BP, PSO-BP, BP, and SVR. In addition, the three clusters had different sampling points at times. Finally, the samples were calculated in each sampling point to get the average and compare the advantages and disadvantages by applying the different fusion strategies. Figures 9–11 show measurement errors after taking the appropriate fusion methods.
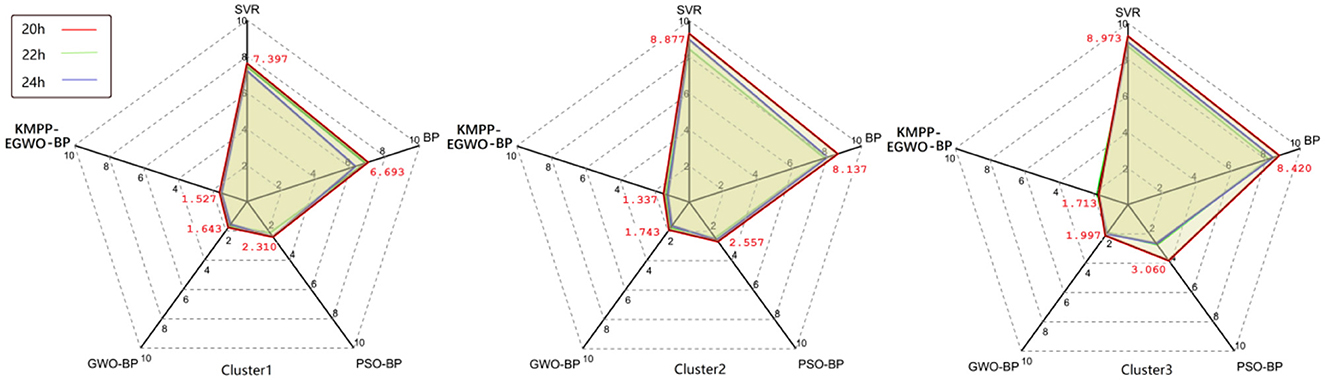
Figure 9. MAPE of BGL fusion estimation.
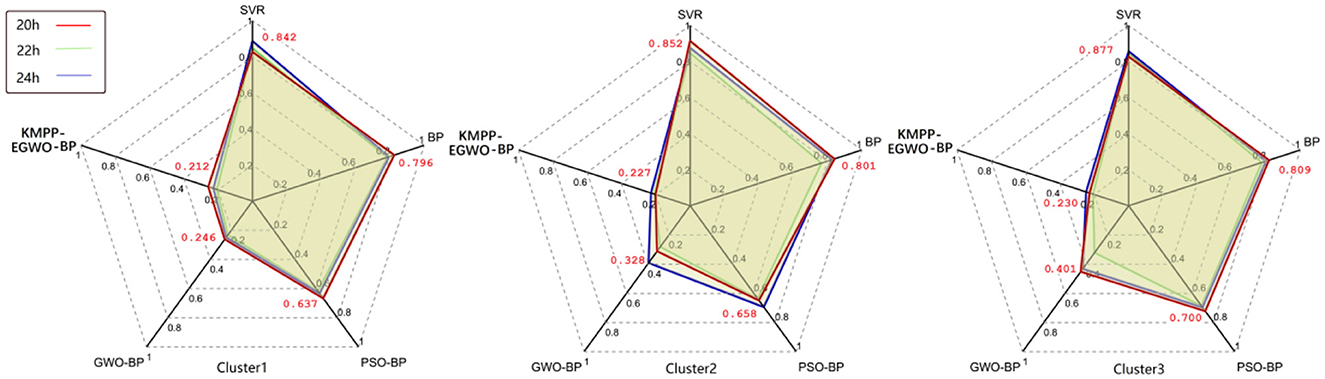
Figure 10. RMSE of BGL fusion estimation.
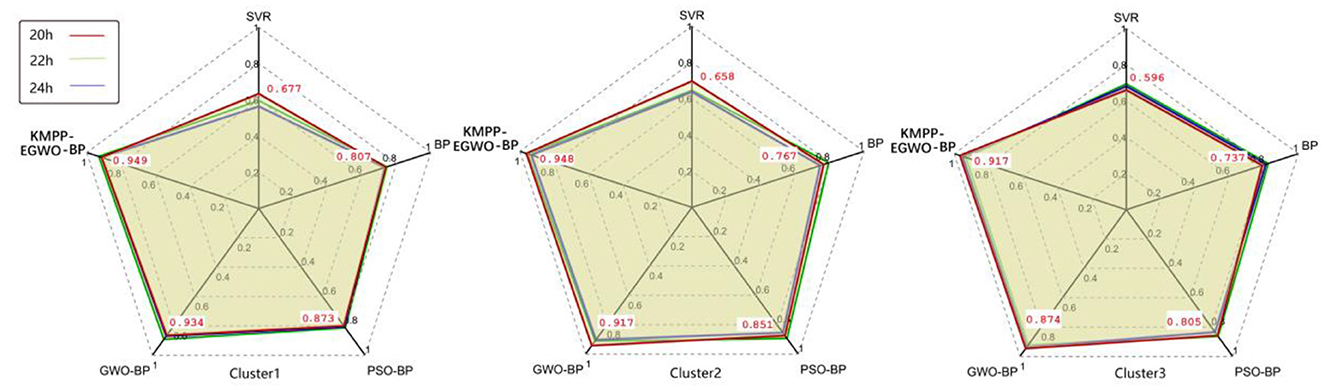
Figure 11. coefficient of determination (R2) of BGL fusion estimation.
As for the BGL fusion estimation in the time points of 20, 22, and 24 h, the average MAPE of KMPP-EGWO-BP was ~1.527%, and such index of GWO-BP was 1.643%, which had more accuracy than 2.31% of PSO-BP, 6.693% of BP, and 7.397% of SVR, respectively. With the increased fish size, the MAPE was generally added by 8.4% in cluster 2 and 12.2% in cluster 3. Consequently, morphological characteristics were the critical factor affecting BGL measurements' accuracy. Figure 12 is the RMSE of the BGL fusion estimation that will illustrate the deviation of turbot BGL measurement in skin mucus from another aspect. In cluster 1, the KMPP-EWGO-BP was about 0.212, while the RMSE was increased to 0.230 in cluster 3. The whole RMSE changes showed an upward tendency in the range from cluster 1 to cluster 3. Similarly, the RMSE of GWO-BP in cluster 3 increased by ~63.1% from cluster 1. As for RMSE of PSO-BP, BP, and SVR, the growth was ~9.9, 1.6, and 4.2%, respectively.
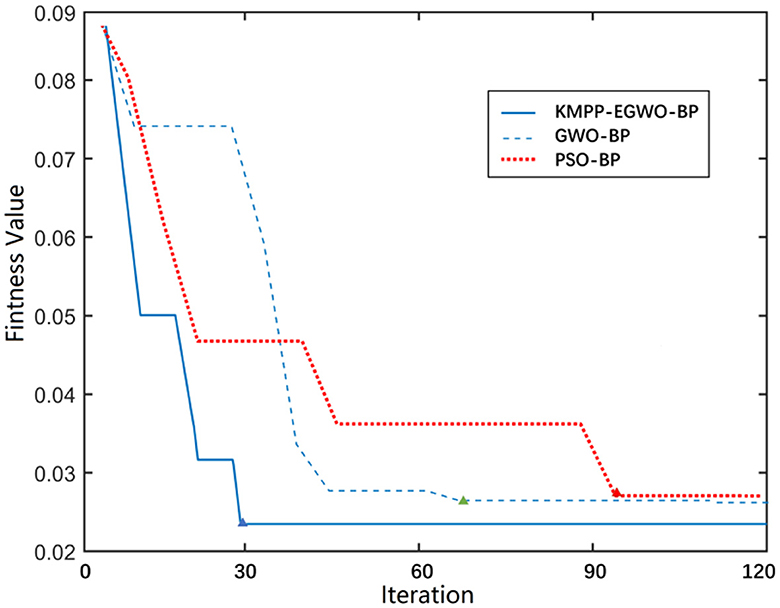
Figure 12. Convergence comparison of the BGL fusion optimization process.
Finally, after verification calculations and analysis, the KMPP-EGWO-BP, GWO-BP, and PSO-BP fusion models showed better performance than BP and SVR from the criteria R2. As for the correlation of the fused BGL series to the real BGL series, R2 of KMPP-EGWO-BP estimation was approximately 0.949 in cluster 1, which was higher than 0.917 in cluster 3. In contrast, the R2 of GWO-BP in cluster 1 was approximately 0.934. It decreased to 0.917 in cluster 2 and 0.874 in cluster 3. Compared with cluster 1, R2 of PSO-BP, BP, and SVR was diminished by ~2.52, 4.96, 2.81% in cluster 2, and ~7.79, 8.67, and 11.96% in cluster 3.
After the BGL deviation assessment and analysis, the BGL trends were classified and collected in fish skin mucus by deploying the patch-typed biosensors for accurate BGL fusion calculation, which is clearly illustrated in Figure 13. From this diagram, the fundamental BGL changes in every cluster are zoomed in by three subplots S1, S2, and S3. The red polyline in every small picture is the actual trend, followed by different fused BGL trends using multi-sensor-based methods (KMPP-EGWO-BP, GWO-BP, PSO-BP, BP, and SVR). Such measurement ranges illustrate that our prepared sensors satisfy fish stress dynamic monitoring requirements. As can be seen from this picture, the EGWO-BP fusion BGL trend is closer to the actual BGL variations than the other fusion methods.
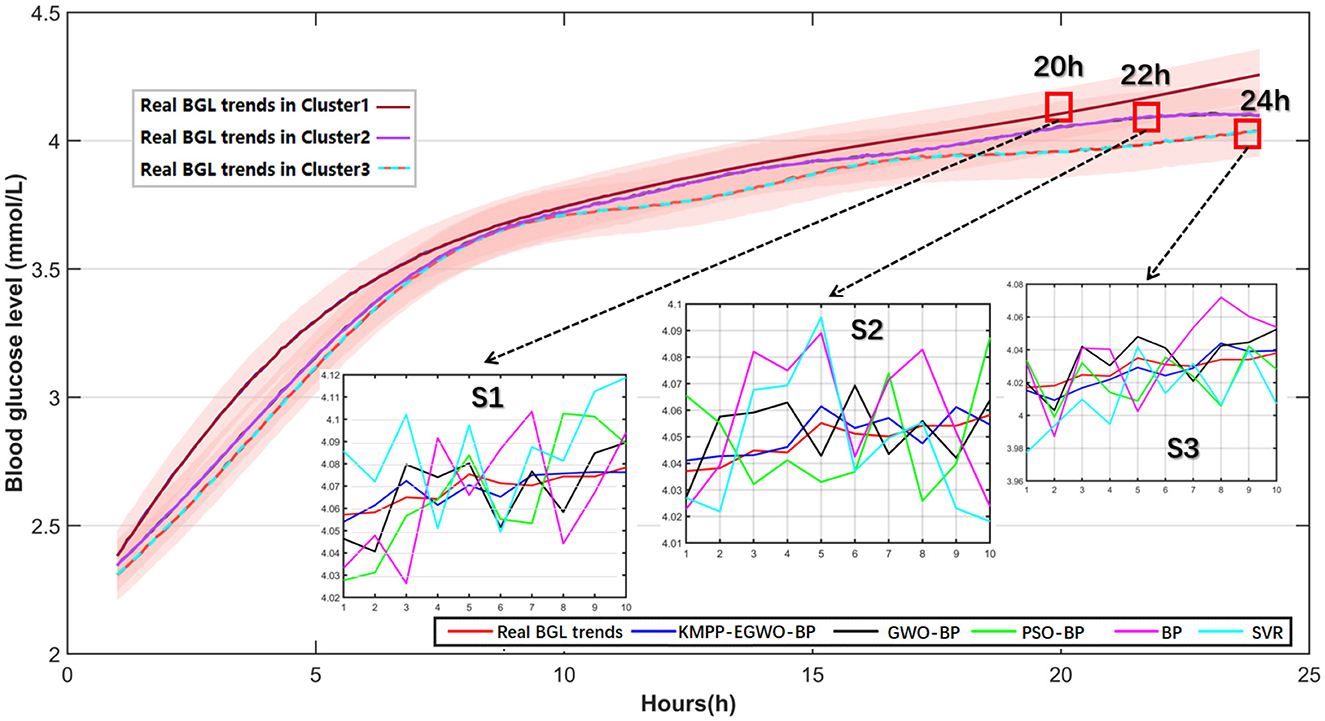
Figure 13. Twenty-four hours BGL detection and evaluation for live turbot skin mucus by different fusion technologies under waterless and low-temperature adverse conditions (S1: time point at 20 h, S2: time point at 22 h, S3: time point at 24 h; Temperature variation of 4–6°C).
Despite the test results discussed above, the BGL concentration in turbot was also sampled in three time points (20, 22, and 24 h) to verify the high relationship of BGL in fish and IF of the fish eyeball. The BGL of fish was obtained and tested by cutting off the tail and taking blood. Meanwhile, the relevant BGL in the IF of the fish eyeball was also acquired by a continuous GBL monitoring device (AiDEX) for measuring the estimation performance by our proposed fusion algorithm (KMPP-EGWO-BP). The average BGL correlations between IF and blood in turbot reached about 93.5%, which is adequate as the standard reference to indicate the BGL trends in fish. Moreover, the average correlations between estimation BGL and blood in fish reached about 93.1% using our proposed KMPP-EGWO-BP model to prove the effectiveness of its evaluation performance. The verification of the proposed BGL fusion model is demonstrated in Table 6.
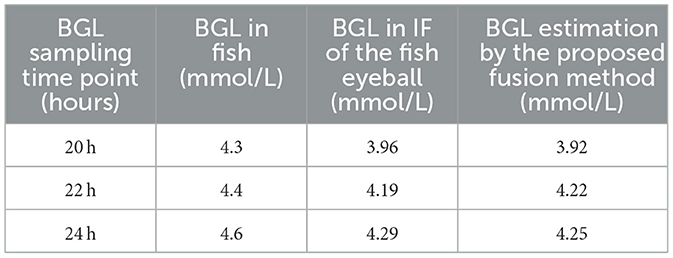
Table 6. Performance verification of the proposed BGL fusion model.
According to the abovementioned non-invasive monitoring performance analysis, our proposed hybrid multi-biosensor fusion technology is advocated for precise BGL detection modeling. Its application provides practical technical support for accurately acquiring the live fish stress variations in adverse conditions.
4. Conclusion
This study proposes a non-invasive multi-sensor-fusion-based BGL estimation model aimed at accurately detecting the live fish stress states after fully considering the problems of individual discrepancy and the intrinsic defects of BGL biosensors. In this research, the newly designed data fusion model, KMPP-EGWO-BP, can precisely estimate fish BGL trends by deploying the non-invasive BGL biosensors. Through the optimization of the BP network structure, such as the number of hidden layers, convergence speed, and the weights and thresholds of the network, the fusion result is reasonably improved to solve problems of imprecise BGL data series acquisitions. Furthermore, the optimized structures and critical parameters of KMPP-EGWO-BP are recorded according to fish morphological features, which utilizes the K-means++ algorithm for further enhancing the model's efficiency and accuracy. Finally, the accurate performance of the KMPP-EGWO-BP fusion model based on different parts of fish skin mucus BGL monitoring is generally evaluated higher than GWO-BP, PSO-BP, BP, and SVR by deviation criteria MAPE, RMSE, and R2.
In conclusion, the experimental results verify that our proposed skin mucus BGL evaluation is suitable and applicable for accurately measuring fish stress states. It significantly provides the non-invasive stress acquisition means to precisely evaluate the live fish stress trends under waterless transport conditions and comprehensively enhance the levels of the live fish circulation industry.
Data availability statement
The original contributions presented in the study are included in the article/Supplementary material, further inquiries can be directed to the corresponding author.
Ethics statement
The animal study was reviewed and approved by the Ethics Committee of Shandong Youth University of Political Science (AE202301-3, 15 January 2023).
Author contributions
YZ and XZ designed the structure of the paper, carried out the data analysis, and led the writing process. All authors contributed to writing and editing.
Funding
This research was supported by the Shandong Provincial Natural Science Foundation (Grant No. ZR2022MF244), the Hainan Project (GHYF2022007), and the Institutional Applied Scientific Research Projects (2021yyx-zd02).
Acknowledgments
We are grateful to the Beijing Laboratory of Food Quality and Safety and the Smart Healthcare Big Data Engineering and Ubiquitous Computing Characteristic Laboratory in the Universities of Shandong for their strong support and help with this study.
Conflict of interest
The authors declare that the research was conducted in the absence of any commercial or financial relationships that could be construed as a potential conflict of interest.
Publisher's note
All claims expressed in this article are solely those of the authors and do not necessarily represent those of their affiliated organizations, or those of the publisher, the editors and the reviewers. Any product that may be evaluated in this article, or claim that may be made by its manufacturer, is not guaranteed or endorsed by the publisher.
Supplementary material
The Supplementary Material for this article can be found online at: https://www.frontiersin.org/articles/10.3389/fsufs.2023.1172522/full#supplementary-material
References
Aerts, J., Schaeck, M., De Swaef, E., Ampe, B., and Decostere, A. (2018). Vibrio lentus as a probiotic candidate lowers glucocorticoid levels in gnotobiotic sea bass larvae. Aquaculture 492, 40–45. doi: 10.1016/j.aquaculture.2018.03.059
Cai, X., Zhang, J., Lin, L., Li, Y., Liu, X., and Wang, Z. (2020). Study of a noninvasive detection method for the high-temperature stress response of the large yellow croaker (Larimichthys crocea). Aquac. Rep. 18, 100514. doi: 10.1016/j.aqrep.2020.100514
Cho, O. K., Kim, Y. O., Mitsumaki, H., and Kuwa, K. (2004). Noninvasive measurement of glucose by metabolic heat conformation method. Clin. Chem. 50,1894–1898. doi: 10.1373/clinchem.2004.036954
Du, B., Lund, P. D., Wang, J., Kolhe, M., and Hu, E. (2021). Comparative study of modelling the thermal efficiency of a novel straight through evacuated tube collector with MLR, SVR, BP and RBF methods. Sustain. Energy Tchnol. Assess. 44, 101029. doi: 10.1016/j.seta.2021.101029
Endo, H., Yonemori, Y., Hibi, K., Ren, H., Hayashi, T., Tsugawa, W., et al. (2009). Wireless enzyme sensor system for real-time monitoring of blood glucose levels in fish. Biosens. Bioelectron. 24, 1417–1423. doi: 10.1016/j.bios.2008.08.038
Faris, H., Aljarah, I., Al-Betar, M. A., and Mirjalili, S. (2018). Grey wolf optimizer: a review of recent variants and applications. Neural Comput. Appl. 30, 413–435. doi: 10.1007/s00521-017-3272-5
Feng, H., Zhang, M., Gecevska, V., Chen, B., Saeed, R., and Zhang, X. (2022). Modeling and evaluation of quality monitoring based on wireless sensor and blockchain technology for live fish waterless transportation. Comp. Electron. Agric. 193, 106642. doi: 10.1016/j.compag.2021.106642
Fernández-Alacid, L., Sanahuja, I., Ordóñez-Grande, B., Sánchez-Nuño, S., Herrera, M., and Ibarz, A. (2019). Skin mucus metabolites and cortisol in meagre fed acute stress-attenuating diets: correlations between plasma and mucus. Aquaculture 499, 185–194. doi: 10.1016/j.aquaculture.2018.09.039
Guardiola, F. A., Cuesta, A., and Esteban, M. Á. (2016). Using skin mucus to evaluate stress in gilthead seabream (Sparus aurata L.). Fish Shellf. Immunol. 59, 323–330. doi: 10.1016/j.fsi.2016.11.005
Guo, J., Huang, W., and Williams, B. M. (2014). Adaptive Kalman filter approach for stochastic short-term traffic flow rate prediction and uncertainty quantification. Transport. Res. Part C Emerg. Technol. 43, 50–64. doi: 10.1016/j.trc.2014.02.00602.006
Gupta, S. S., Kwon, T. H., Hossain, S., and Kim, K. D. (2021). Towards noninvasive blood glucose measurement using machine learning: an all-purpose PPG system design. Biomed. Signal Process. Control 68, 102706. doi: 10.1016/j.bspc.2021.102706
Harman-Boehm, I., Gal, A., Raykhman, A. M., Naidis, E., and Mayzel, Y. (2010). Noninvasive glucose monitoring: increasing accuracy by combination of multi-technology and multi-sensors. J. Diabetes Sci. Technol. 4, 583–595. doi: 10.1177/193229681000400312
Hubert, M., and Vandervieren, E. (2008). An adjusted boxplot for skewed distributions. Comp. Stat. Data Anal. 52, 5186–5201. doi: 10.1016/j.csda.2007.11.008
Li, D., Wang, G., Du, L., Zheng, Y., and Wang, Z. (2022). Recent advances in intelligent recognition methods for fish stress behavior. Aquac. Eng. 96, 102222. doi: 10.1016/j.aquaeng.2021.102222
Li, J., Zhang, X., Zhou, Q., Chan, F. T., and Hu, Z. (2022). A feature-level multi-sensor fusion approach for in-situ quality monitoring of selective laser melting. J. Manuf. Process. 84, 913–926. doi: 10.1016/j.jmapro.2022.10.050
Lin, J., Tsai, H., and Lyu, W. (2021). An integrated wireless multi-sensor system for monitoring the water quality of aquaculture. Sensors 21, 8179. doi: 10.3390/s21248179
Liu, J., Huang, J., Sun, R., Yu, H., and Xiao, R. (2021). Data fusion for multi-source sensors using GA-PSO-BP neural network. IEEE Transact. Intell. Transport. Syst. 22, 6583–6598. doi: 10.1109/TITS.2020.3010296
Sadoul, B., and Geffroy, B. (2019). Measuring cortisol, the major stress hormone in fishes. J. Fish Biol. 94, 540–555. doi: 10.1111/jfb.13904
Samaras, A., Dimitroglou, A., Kollias, S., Skouradakis, G., Papadakis, I. E., and Pavlidis, M. (2021). Cortisol concentration in scales is a valid indicator for the assessment of chronic stress in European sea bass, Dicentrarchus labrax L. Aquaculture 545, 737257. doi: 10.1016/j.aquaculture.2021.737257
Song, K., Ha, U., Park, S., Bae, J., and Yoo, H. J. (2015). An impedance and multi-wavelength near-infrared spectroscopy IC for noninvasive blood glucose estimation. IEEE J. Solid State Circ. 50, 1025–1037. doi: 10.1109/JSSC.2014.2384037
Tian, Y., Yu, J., and Zhao, A. (2020). Predictive model of energy consumption for office building by using improved GWO-BP. Energy Rep. 6, 620–627. doi: 10.1016/j.egyr.2020.03.003
Vanderzwalmen, M., Edmonds, E., Carey, P., Snellgrove, D., and Sloman, K. A. (2020). effect of a water conditioner on ornamental fish behavior during commercial transport. Aquaculture 514, 734486. doi: 10.1016/j.aquaculture.2019.734486
Wang, H., and Zhang, Q. (2019). Dynamic identification of coal-rock interface based on adaptive weight optimization and multi-sensor information fusion. Inf. Fus. 51, 114–128. doi: 10.1016/j.inffus.2018.09.007
Wang, S. (2020). Multi-sensor data fusion of motion monitoring system based on BP neural network. J. Supercomput. 76, 1642–1656. doi: 10.1007/s11227-019-03015-0
Wang, W., Xu, J., Zhang, W., Glamuzina, B., and Zhang, X. (2021). Optimization and validation of the knowledge-based traceability system for quality control in fish waterless live transportation. Food Control 122, 107809. doi: 10.1016/j.foodcont.2020.107809
Wang, W., Zhang, Y., Liu, Y., Adányi, N., and Zhang, X. (2020). Effects of waterless live transportation on survivability, physiological responses and flesh quality in Chinese farmed sturgeon (Acipenser schrenckii). Aquaculture 518, 734834. doi: 10.1016/j.aquaculture.2019.734834
Wang, X., Zhang, M., Zhang, L., Xu, J., Xiao, X., and Zhang, X. (2022). Inkjet-printed flexible sensors: From function materials, manufacture process, and applications perspective. Mater. Today Commun. 31, 103263. doi: 10.1016/j.mtcomm.2022.103263
Wang, Y., Wang, X., Lu, W., Yuan, Q., Zheng, Y., and Yao, B. (2019). A thin film polyethylene terephthalate (PET). Electrochemical sensor for detection of glucose in sweat. Talanta 198, 86–92. doi: 10.1016/j.talanta.2019.01.104
Wu, H., Aoki, A., Arimoto, T., Nakano, T., Ohnuki, H., Murata, M., et al. (2015). Fish stress become visible: a new attempt to use biosensor for real-time monitoring fish stress. Biosens. Bioelectron. 67,503–510. doi: 10.1016/j.bios.2014.09.015
Wu, H., Fujii, Y., Nakano, T., Arimoto, T., Murata, M., Matsumoto, H., et al. (2019a). Development of a novel enhanced biosensor system for real-time monitoring of fish stress using a self-assembled monolayer. Sensors 19, 1518. doi: 10.3390/s19071518
Wu, H., Shinoda, R., Murata, M., Matsumoto, H., Ohnuki, H., and Endo, H. (2019b). Real-time fish stress visualization came true:A novel multi-stage color-switching wireless biosensor system. Biosens. Bioelectron. 130, 360–366. doi: 10.1016/j.bios.2018.09.042
Wu, L., Chen, L., and Hao, X. (2021). Multi-sensor data fusion algorithm for indoor fire early warning based on BP neural network. Information 12, 59. doi: 10.3390/info12020059
Xu, Y., Qu, W., Li, Z., Min, G., Li, K., and Liu, Z. (2014). Efficient k-Means++ Approximation with MapReduce. IEEE Transact. Parallel Distribut. Syst. 25, 3135–3144. doi: 10.1109/TPDS.2014.2306193
Yang, G., Liu, S., Li, Y., and He, L. (2023). Short-term prediction method of blood glucose based on temporal multi-head attention mechanism for diabetic patients. Biomed. Signal Process. Control 82, 104552. doi: 10.1016/j.bspc.2022.104552
Yu, M., Li, Y. T., Hu, Y., Tang, L., Yang, F., Lv, W. L., et al. (2021). Gold nanostructure-programmed flexible electrochemical biosensor for detection of glucose and lactate in sweat. J. Electroanal. Chem. 882, 115029. doi: 10.1016/j.jelechem.2021.115029
Zhang, X., Hou, J., Wang, Z., and Jiang, Y. (2023). Joint SOH-SOC estimation model for lithium-ion batteries based on GWO-BP. Neural Netw. Energ. 16, 132. doi: 10.3390/en16010132
Zhang, Y., Ning, Y., Zhang, X., Glamuzina, B., and Xing, S. (2020). Multi-sensors-based physiological stress monitoring and online survival prediction system for live fish waterless transportation. IEEE Access 8, 40955–40965. doi: 10.1109/ACCESS.2020.2976509
Zhao, X., Zhang, X., Cai, Z., Tian, X., Wang, X., Huang, Y., et al. (2019). Chaos enhanced grey wolf optimization wrapped ELM for diagnosis of paraquat-poisoned patients. Comput. Biol. Chem. 78, 481–490. doi: 10.1016/j.compbiolchem.2018.11.017
Keywords: stress measurement, non-invasive blood glucose detection, data fusion model, live fish waterless transportation, clustering
Citation: Zhang Y, Xiao X, Feng H, Nikitina MA, Zhang X and Zhao Q (2023) Stress fusion evaluation modeling and verification based on non-invasive blood glucose biosensors for live fish waterless transportation. Front. Sustain. Food Syst. 7:1172522. doi: 10.3389/fsufs.2023.1172522
Received: 23 February 2023; Accepted: 11 April 2023;
Published: 12 May 2023.
Edited by:
Matthew Chidozie Ogwu, Appalachian State University, United StatesReviewed by:
Saiful Irwan Zubairi, National University of Malaysia, MalaysiaJose Alberto Gallegos-Infante, Durango Institute of Technology, Mexico
Copyright © 2023 Zhang, Xiao, Feng, Nikitina, Zhang and Zhao. This is an open-access article distributed under the terms of the Creative Commons Attribution License (CC BY). The use, distribution or reproduction in other forums is permitted, provided the original author(s) and the copyright owner(s) are credited and that the original publication in this journal is cited, in accordance with accepted academic practice. No use, distribution or reproduction is permitted which does not comply with these terms.
*Correspondence: Xiaoshuan Zhang, zhxshuan@cau.edu.cn