Recalibration of benchmarks is necessary: even the most basic meal was not affordable for Malawi’s poor between 2017 and 2021
 Mercy Bwanaisa
 Sheryl L. Hendriks
- 1Department of Agricultural Economics, Extension and Rural Development, University of Pretoria, Pretoria, South Africa
- 2Natural Resources Institute, University of Greenwich, Chatham, United Kingdom
Dietary quality has significant implications for health, nutrition and life quality. Yet, most people in developing countries, such as Malawi, consume inadequate diets due to the high cost of healthy and nutritious food. The international community has called for a radical transformation of food systems to ensure access to healthier food options at affordable prices. While the costs and affordability of healthy and nutritious diets have recently been established, little attention has been paid to the economic accessibility of basic nourishment. The most available price data (2017 to 2021) from the National Statistics Office of Malawi (NSO) were used to calculate the cost of the World Food Program’s “basic plate.” Food items were substituted to determine if local substitutes could improve the nutritional value of the plate. The plate cost was compared to the international poverty line and average food expenditure in Malawi. Slight variations in the purchase parity cost and affordability of basic meals were found between 2017 and 2021. However, the basic meal and alternative plates were not affordable to those living at or below the international poverty line over this period. A revision of the poverty line is necessary to ensure that basic nutritional needs can be met. Both revisions of the poverty line and cash-based food assistance should consider that meals using animal-sourced proteins were more expensive than plant-based protein sources, but animal-sourced proteins provide more nutrition than plant-based protein meals.
1. Introduction
Recent global price inflation raises fears of increasing hunger and malnutrition. Since 2020, there has been a sharp increase in global consumer food prices that have increased the average cost of a healthy diet (FAO et al., 2022). Only recently has attention turned to determining the cost and affordability of a basic diet (Darmon and Drewnowski, 2015; Masters et al., 2018; Hirvonen et al., 2019; Bai et al., 2020; FAO et al., 2020; Herforth et al., 2020; HLPE, 2020; Suresh and Ma, 2020; Hendriks et al., 2021; Schneider, 2022).
Over three billion people globally cannot afford a healthy diet that meets dietary recommendations based on national food-based dietary guidelines (FAO et al., 2022). Another 1.5 billion people cannot afford a nutritious diet—one that provides adequate calories and enough of all essential nutrients (FAO et al., 2020; Herforth et al., 2020). The negative repercussions of consuming poor diets are well established [Galler et al., 2012, 2021; Waber et al., 2013; Global Panel on Agriculture and Food Systems for Nutrition (GloPAN), 2016]. We know that the poor are disproportionately affected by malnutrition. We also know that the poor are very sensitive to food and energy inflation because they spend a large proportion of their constrained income on food and the energy to prepare it.
The Food and Agriculture Organization of the United Nations and its partners (FAO et al., 2022) have reported that the average cost of a healthy diet globally in 2020 was USD 3.54 per person per day. This cost way exceeds the per person-per day international poverty line of US$1.9 based on 2015 prices. This raises alarm as the international poverty line is used as a base for determining the eligibility of countries and individuals to development aid and support. It is also commonly used as the base for determining social grants and cash-based food assistance.
With this concern in mind, in 2016 the World Food Program (WFP) investigated the cost and affordability of a basic meal in 33 developing countries compared to the cost of the same plate in the developed world [World Food Programme (WFP), 2017]. The results revealed that the cost of a basic plate of food or meal (not representing an adult’s total required daily intake) exceeded the daily income for countries like South Sudan, Northeast Nigeria and some parts of Syria. Masters et al. (2021) expanded the WFP study to include nationally representative food price data from 168 countries obtained from the 2017 round of the World Bank’s International Comparison Program (IPC; World Bank, 2019). Masters et al. (2021) found that the raw ingredients for a basic plate were unaffordable for the poorest, and the added cost of time and fuel can make such meals prohibitively expensive. Such insights play an important role in determining the underlying reasons for malnourishment, estimating the magnitude of the problem and setting baselines for a range of economic and social indicators and criteria for access to support. Therefore, this study used price data from Malawi to investigate the cost and affordability of a basic meal for the poorest citizens to inform benchmarks and policy change.
While globally much policy attention has focused on improving diets and dietary diversity through nutrition-specific and nutrition-sensitive initiatives, little attention has been paid to considerations of affordability and the role affordability plays in access to sound nutrition. For example, the consumer price index includes a basket of goods for an average household, but do these baskets include the elements necessary for sound nutrition? The poverty line (be it national or international) is used for grant access criteria. The cost of a basic plate is used to determine food aid cash values. Yet, the implications of the unaffordability of basic nourishment on the setting of core baselines at the national level have not been investigated.
More than a third of Malawi’s children are stunted (35.5%—which is higher than the 30.7% average for the Africa region). Wasting is found in 2.6% of Malawian children (Development Initiatives Poverty Research Ltd, 2022). The World Bank (2023) has reported that poverty levels in Malawi are one of the highest globally. The Malawi Vulnerability Assessment Committee (MVAC) has projected that 3.8 million people (about 20% country’s population) will face hunger between November 2022 and March 2023 (Integrated Phase Classificaiton (IPC), 2023). Could the affordability of food be an underlying cause of this suffering? This study seeks to address this question.
2. Methods and procedures
This study adopted World Food Programme (WFP)’s (2017) basic plate analysis approach and used the most recent secondary national data available at the start of the analysis. While it is acknowledged that the content of one meal does not constitute all that an individual requires for an adequate diet, the basic plate is a useful comparison of costs against the international poverty line.
The data used included food price data, food expenditure data and the international poverty line. Food price data was obtained from the National Statistics Office of Malawi (NSO) and was required to determine the cost of the various meals. NSO collects average monthly food price data for purposes of computing the Consumer Price Index (CPI; Schneider, 2022). This data was preferred for its consistency over time but also because it covered a wide range of food items across many markets countrywide (Schneider, 2022). The food price data comprised 20 food items collected across 13 markets from January 2017 to December 2021. The markets from which data was collected included both urban areas (Blantyre, Lilongwe, Mzuzu and Zomba) as well as rural areas (Karonga, Rumphi, Mzimba, Kasungu, Salima, Dedza, Mangochi, Chitakale and Nchalo). All prices were originally in Malawi Kwacha but following Herforth et al. (2020), the prices were converted to US$ Purchasing Power Parity (PPP) exchange rates to enable comparison with the international poverty line. Further, the original prices were per kilogram weight of each food item. During the course of the analysis, prices per kilogram were converted into the respective weights (grams) of plate ingredients.
The data required to evaluate the affordability of basic meals was sourced from the World Bank’s International Comparison Program (ICP). ICP is a statistical initiative used to compare standards of living at the global level (Headey and Alderman, 2019). ICP collects global-level comparative price data and GDP expenditure for the purpose of computing Purchasing Power Parity (PPPs; World Bank, 2019). The latest food expenditure data was available in 2017 PPP hence the costs of ingredients from 2018 to 2021 were converted into 2017 PPP following Herforth et al. (2020).
The international poverty line was another type of data required to compute the affordability of the basic meals. The international poverty line was sourced from the World Bank’s PovcalNet. Povcalnet is an online tool by the World Bank used to calculate and monitor the extent of poverty and inequality in the world (Zhao, 2019).
2.1. Data analysis techniques
Two main data analysis techniques were employed during the analysis of this study including the “basic plate” approach and the Friedman rank sum test.
First, the ‘basic plate’ least-cost approach as set out by Masters et al. (2021) and adapted from the original World Food Programme (WFP) (2017) approach was used. A basic plate only meets one-third of an adult individual’s daily energy needs and thus it is neither nutritious nor healthy. It is typically compiled with least-cost ingredients and includes a starchy staple (75 g), protein source (57.25 g), tomatoes (55 g), onion (16.25 g), and vegetable oil (28.13 g; Masters et al., 2021). In this study, the basic plate ingredients were maize flour, brown beans, tomatoes, onion and vegetable oil. Maize flour would be used to make a paste locally called nsima while brown beans would make stew. Noteworthy, maize flour and brown beans were not the least-cost ingredients based on available data. However, they represent a typical meal that would be consumed in all parts of Malawi. In contrast, if the study had relied on the available data, cassava and pigeon peas would be the least-cost ingredients, but they are not representative of a typical Malawian meal, as their consumption is mainly limited to specific areas of the country (Kambewa, 2010; Orr et al., 2014; Köcke, 2019; Davies, 2022). The basic plate must be representative of the country’s consumption realities (World Food Programme (WFP), 2017), hence the use of maize flour and brown beans. In addition, the choice of nsima and beans corresponds with the basic meal that was compiled by World Food Programme (WFP) (2017).
To assess the cost premiums of improving the nutrient content of the meal by switching from plant-source protein to animal-source protein, several variations of the basic plate were evaluated. These plates maintained the other ingredients of the basic plate but replaced brown beans with animal protein sources. The variations of the basic plate are referred to as ‘alternative plates’. Seven alternative plates were created, which substituted brown beans with four meat types and three different fish. Table 1 provides a summary of the composition of each plate.
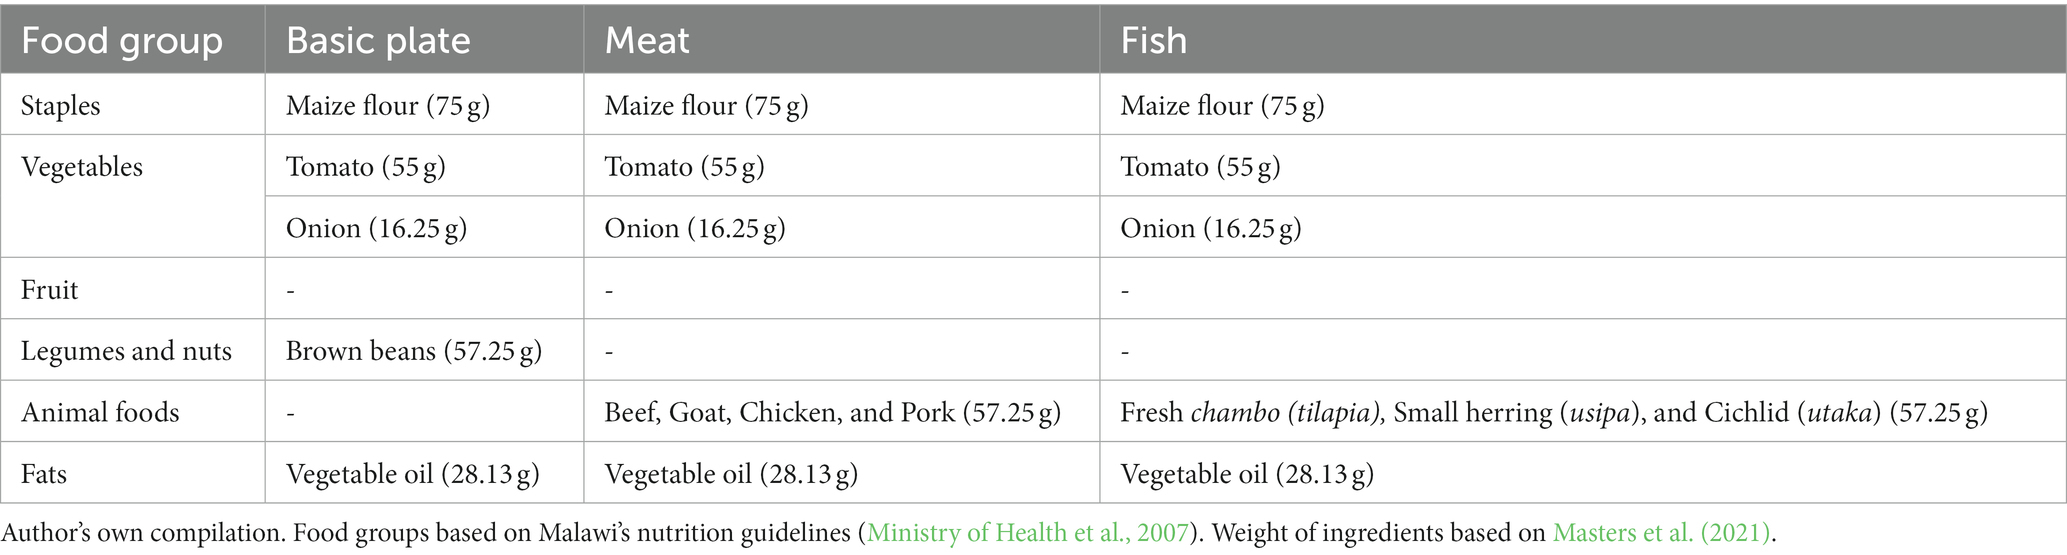
Table 1. Summary of the composition of each plate between 2017 and 2021.
The meat protein sources included beef, chicken, goat and pork while the fish category comprised cichlid (utaka), fresh chambo (tilapia), small herring (usipa; Table 1). Since the consumption of animal protein sources is low in Malawi (Gilbert et al., 2019), an understanding of the costs of consuming different animal protein could provide insights into whether costs could be a hindrance to animal protein intake in Malawi. Animal protein considerations are especially important because animal protein has high nutritional quality, essential for the nutrition status and health of individuals, especially children (Day et al., 2022).
Second, to assess whether there were statistically significant differences in the cost of food items over a five-year period, the study employed the Friedman rank sum test (Friedman, 1937). The Friedman rank sum test was deemed appropriate because of its ability to test for differences in three or more groups when data has equal variance but fails to fulfill the normality assumption (Nahm, 2016). Importantly, the test was chosen because among the many applications of the Friedman rank sum test, is the use of the test to ascertain statistical difference across the same subjects over three or more time periods (Ali and Bhaskar, 2016, Liu and Xu, 2022, p.3)—in this case the years. The test statistic for the Friedman test was performed such that;
Where Q is the Friedman test statistic.
n is the number of subjects (food items/costs of food items).
k is the number of repetitions (number of years).
∑kj = 1 R2j is the sum of the squares of the sum of ranks.
The null hypothesis was, therefore, be rejected if Q was greater than the critical chi-square value (Pereira et al., 2014; Eisinga et al., 2017). Alternatively, the null hypothesis was rejected if the value of p accompanying Q was less than or equal to the α level of significance. When the null hypothesis is rejected, post hoc comparison tests are conducted (Pereira et al., 2014).
Last, the study determined the affordability of each plate over time, which was carried out (after Herforth et al., 2020) in two ways. Firstly, with respect to daily average food expenditure (AFEM) for Malawi. To determine affordability using AFEM, the cost of each plate was compared to daily average food expenditure. From the ICP 2017 food expenditures data, Malawi had an average food expenditure of US$ 298 per annum which translated to US$ 0.82 per day. Affordability with respect to AFEM was, therefore, defined as the proportion of the cost of each meal to AFEM (US$ 0.82).
Secondly, affordability was evaluated with respect to the food share of the international poverty line that can reliably be kept for food expenditures. For low-income countries like Malawi, 52% of the international poverty line is the estimated mean expenditure on food by poor households. In this study, the international poverty line of US$ 1.90 per day was used. Taking 52% as the amount spent on food, the food share of the international poverty line US$ 0.99 (Herforth et al., 2020). In this study, the food share of the international poverty line was abbreviated FSIPL. To this end, affordability was defined as the proportion of the cost of the basic plate and alternative plates to FSIPL (US$ 0.99).
3. Results
Table 2 presents the cost of various food items over 5 years. These food items were the ingredients used to compile the basic plate and alternative plates following WFP’s “basic plate” approach [World Food Programme (WFP), 2017] and the adaptation by Masters et al. (2021). A total of 12 food items were included at different stages of the analysis (Table 2). The foods consisted of a starchy staple, a pulse, animal protein source, vegetables and vegetable oil. There were slight variations in the cost of ingredients across the years. Overall, the cost of maize flour ranged between US$0.09–US$0.17 over time while the cost of brown beans, the different fish and meat types fell in the range of US$0.24–US$0.72.
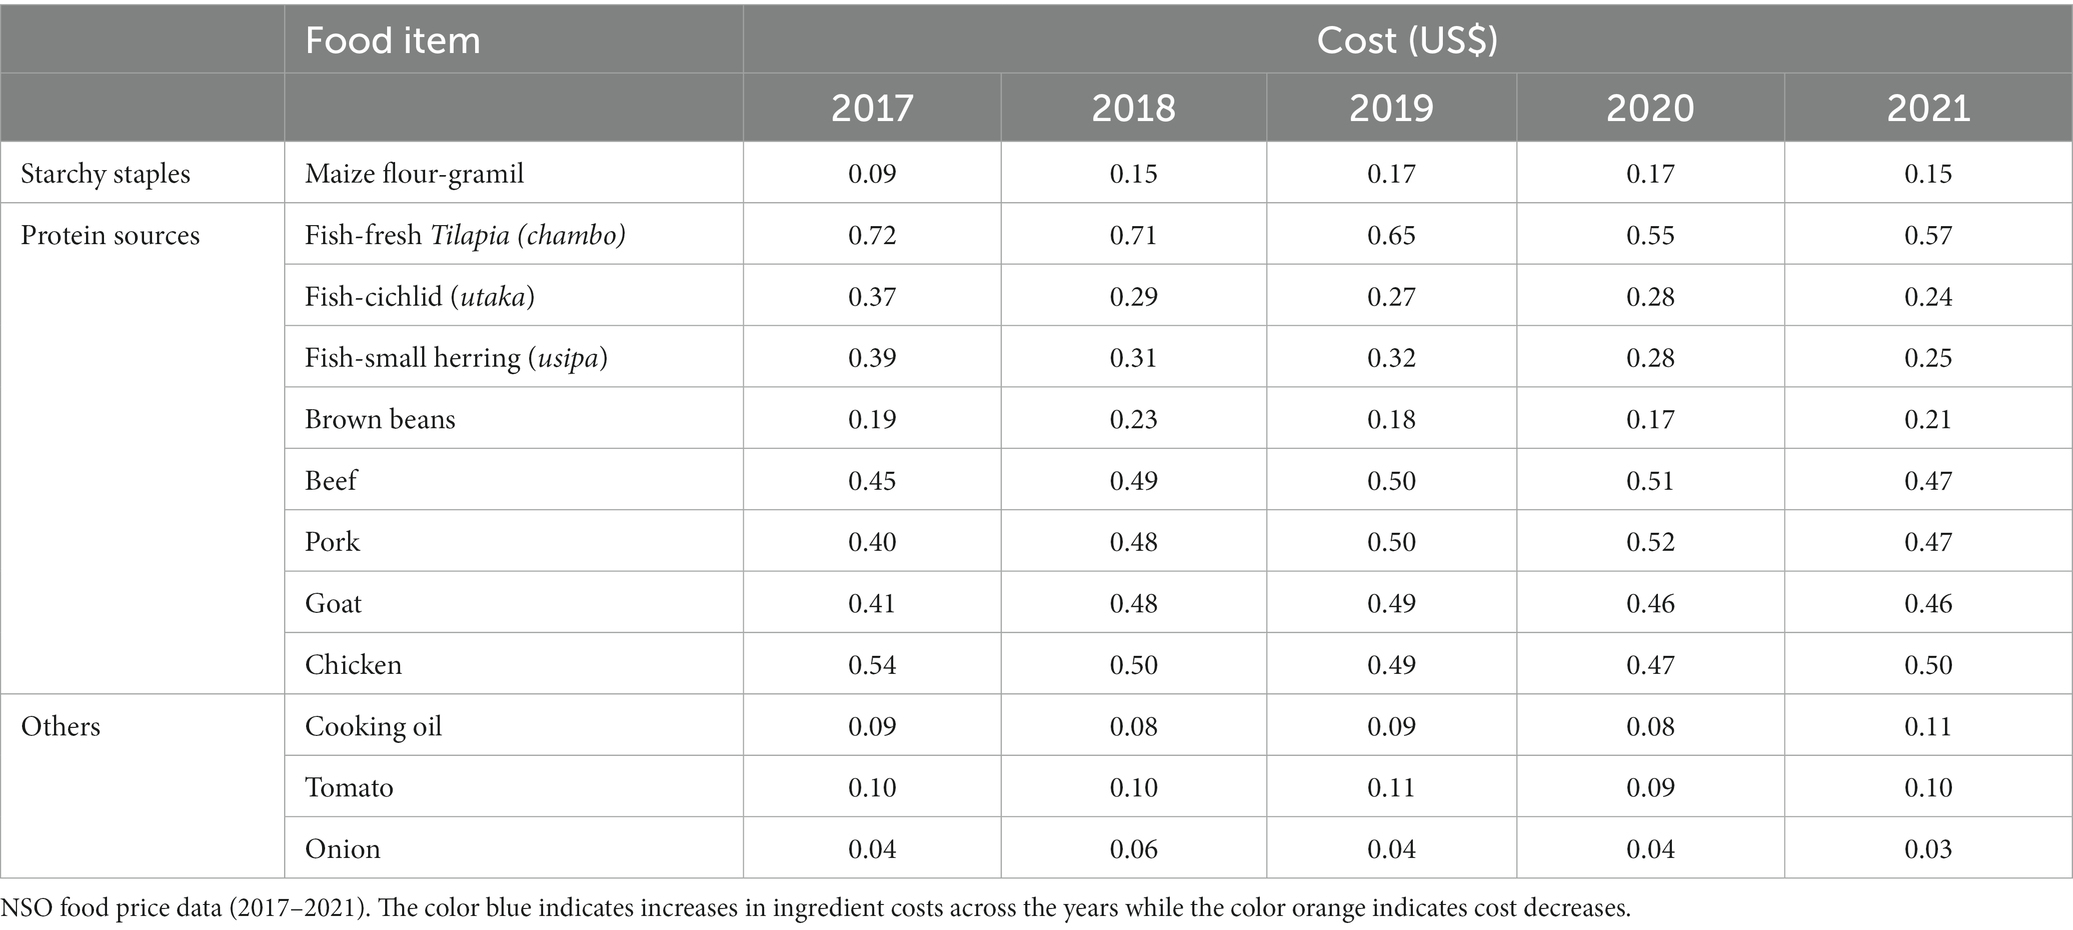
Table 2. The cost of food items.
On average, the cost of most basic plate ingredients was lowest in 2020 and 2021. When the cost of the protein sources was compared per weight, chambo was the most expensive protein source followed by chicken, beef, pork and goat. Brown beans were the cheapest protein source per weight. In general, while the costs of the other protein sources fluctuated over the years, the cost of chambo was highest in 2017 and lowest in 2020 (Table 2).
Table 3 presents the cost of the basic plate across 5 years. The cost of the basic plate varied over time, albeit slightly, ranging from US$0.51–US$0.62 between 2017 and 2021 (Table 4). Overall, the basic plate was relatively costlier in 2018 and lowest in 2017. Notably, the cost of the basic plate was also fairly low in 2020 relative to what could be expected in a period when the Covid-19 pandemic jump-started a rise in global food prices. The Friedman rank sum test was conducted to determine if the observed variation in ingredient prices across the years was statistically significant. Given a Chi-squared statistic of 6.06 with a corresponding value of p of 0.19 (Table 4), the Friedman rank sum test revealed a lack of sufficient evidence to support the existence of statistically significant differences in the cost of the ingredients over time.
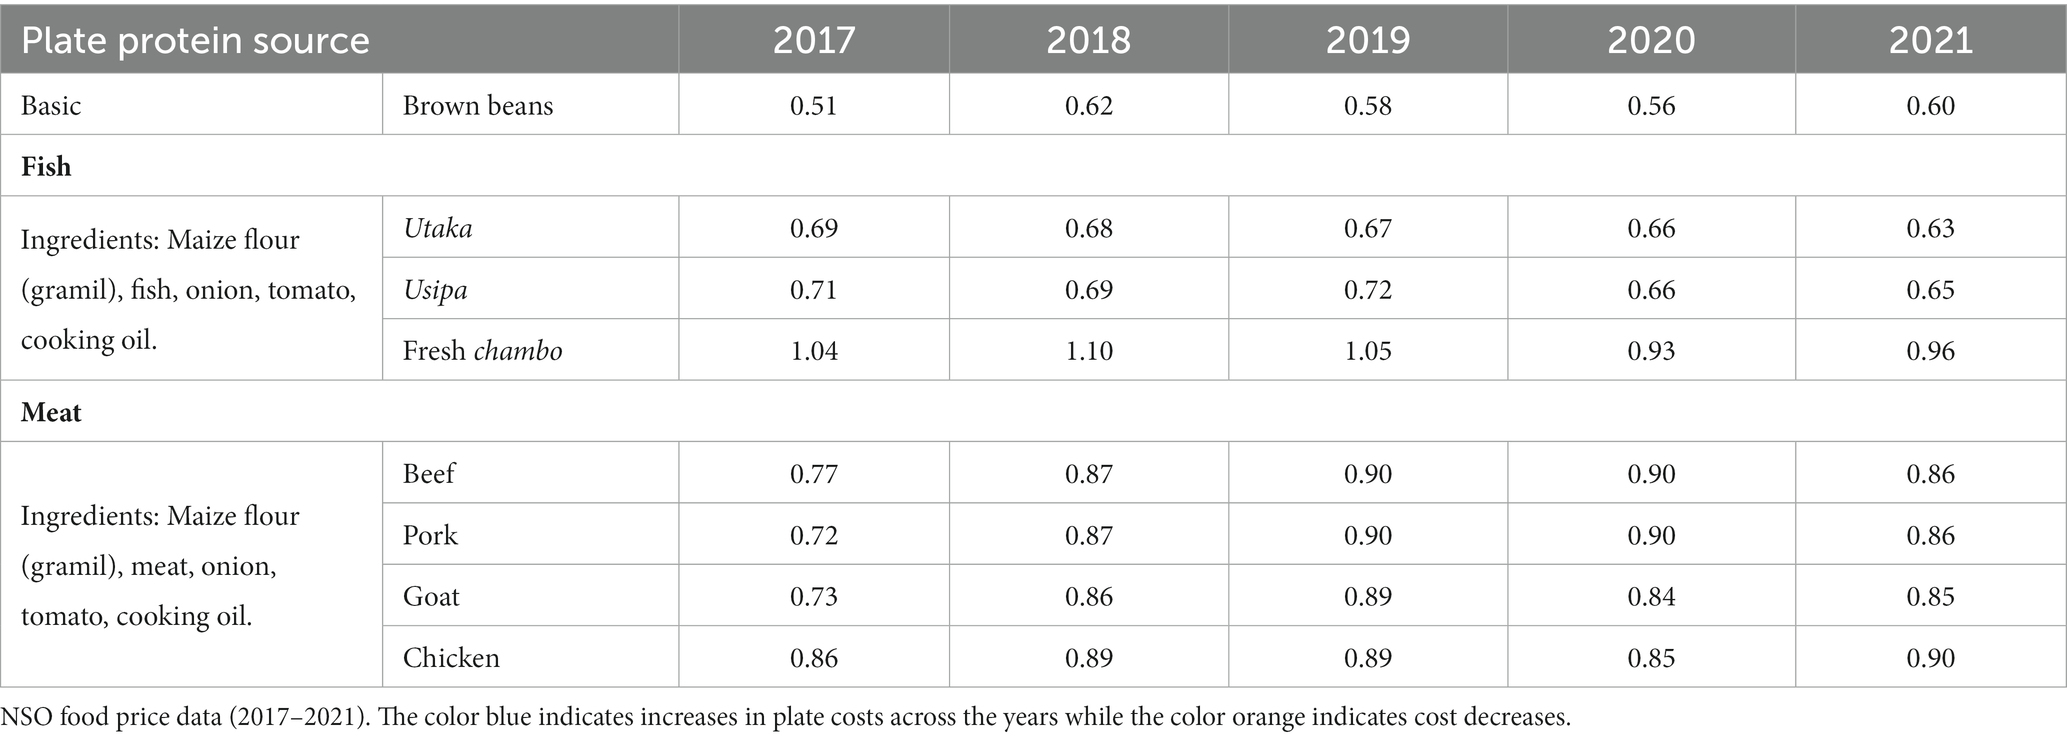
Table 3. The cost of substituting beans with animal protein sources.
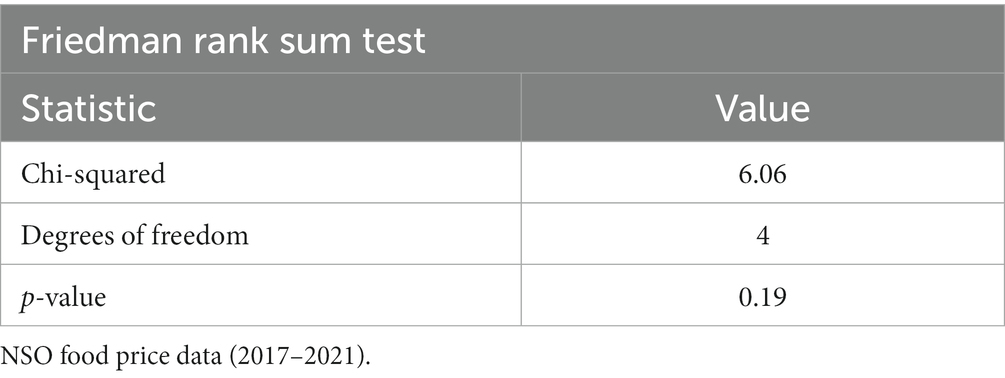
Table 4. Testing for statistical significance of food costs over time.
Generally, switching from beans to animal protein sources raised the cost of the plate in all 5 years (Table 4). However, the cost increments varied across individual protein sources and years of analysis. Within the fish category, substituting brown beans with chambo raised the cost of the basic plate considerably higher by a factor ranging between 1.7 and 2 across the years. At the same time, switching to usipa and utaka raised the cost of the basic plate only slightly.
Similar differences could be observed in the meat category. Substituting brown beans with chicken significantly raised the cost of the plate with a factor of 1.44–1.7. Switching from brown beans to goat was relatively cheaper and the cost of the plate increased by a factor in the range 1.39–1.5. Ultimately, the incremental cost on the basic plate upon switching to animal protein sources was highly dependent on the type of animal protein source. In general, chambo was the most expensive protein source per weight followed by chicken (Table 4). Smaller fish like usipa and utaka were the cheapest animal protein sources per weight.
Generally, there were slight changes in the affordability of the basic plate between 2017 and 2021 (Figure 1). With respect to the international poverty line, the cheapest basic plate over the 5 years was approximately half of the FSIPL while the most expensive plate was more than 63% of the FSIPL. Further, with respect to food expenditures, the cheapest basic plate between 2017 and 2021 was 62% of AFEM while the most expensive plate was 76% of the AFEM.
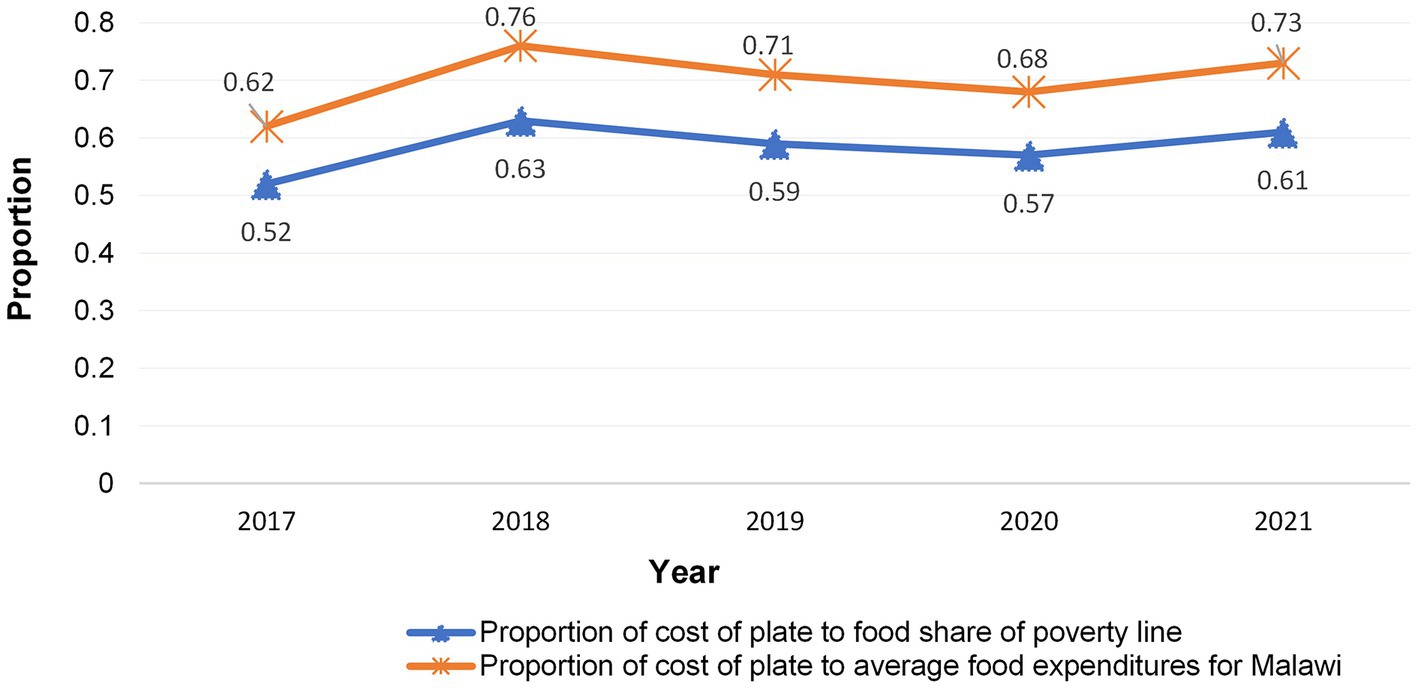
Figure 1. Affordability of the basic plate with respect to daily average food expenditures for Malawi (AFEM) and food share of the poverty line (FSIPL). NSO food price data (2017–2021).
Apart from evaluating the affordability of the basic plate, the study also determined the affordability of alternative plates. The affordability of the alternative plates was determined by the proportion of the cost of the various alternative plates to the FSIPL and AFEM. These results are presented in Figure 2. While the affordability of alternative plates varied from plate to plate and year to year, findings reveal that affordability was better for the utaka plate than the other alternative plates. Utaka plate took the smallest portion of both the FSIPL and AFEM, followed by usipa. In contrast, the least affordable plate with respect to both measures of affordability was chambo in all 5 years. Chambo was followed by chicken as the least affordable plates. This finding is also in line with the high cost of chambo as demonstrated in Tables 2, 4 which made the plates less affordable to the poor.
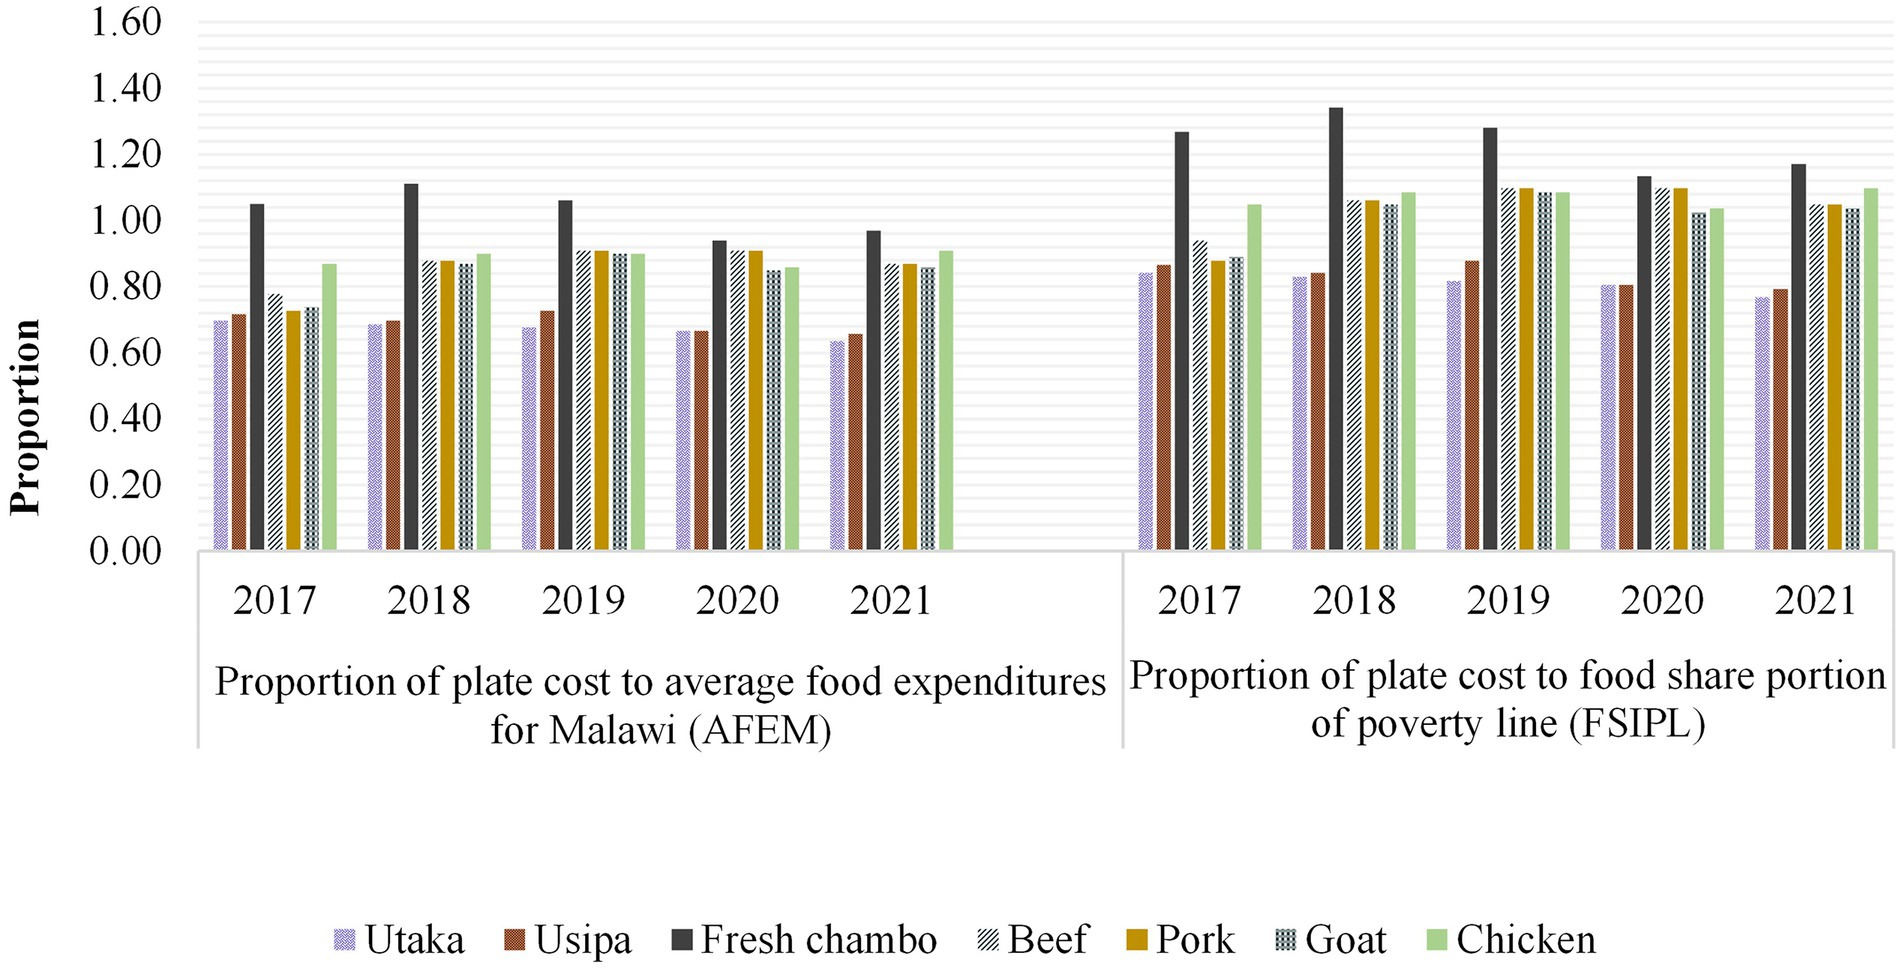
Figure 2. The affordability of alternative plates with respect to daily average food expenditures and food share of international poverty line. NSO food price data (2017–2021).
The results further reveal that the affordability of alternative plates with meat (beef, pork, goat, chicken) was only worse when compared to AFEM between 2018 and 2021 (Figure 2). Notably, the affordability of some meat plates, particularly beef, goat and pork were better in the year 2017 as evidenced by low plates costs in comparison with both measures of affordability. Overall, the alternative plates were less affordable than the basic plate.
4. Discussion
On average, the cost of most basic plate ingredients was lowest in 2020 and 2021. Chambo was the most expensive protein source followed by chicken, beef, pork and goat while brown beans were the cheapest protein source per weight. These findings concurred with Masters et al. (2021), who found that switching from beans to fish significantly raised the cost of the basic plate. Animal and plant proteins differ significantly in their bioavailability, digestibility, nutritional content and quality; making them unequal substitutes (Moughan, 2003, 2021; Lofgren, 2013; Day et al., 2022), especially for children who cannot consume large quantities of food at a time. However, differences in bioavailability between plant protein and animal protein were not factored into the calculations in this study. The same weight of raw ingredient was used but if bioavailability is considered, higher rations of plant-based protein in the plate may need to be included.
Cost increments varied across protein sources and years of analysis. The variation in ingredient costs could mainly be due to food price fluctuations, especially related to the country’s main staple, maize. Maize availability tends to influence food prices in Malawi so much that one could expect a low cost of ingredients in years of bumper maize yields and a higher cost when national maize stocks are low (Ngoleka, 2013). The specific ingredient’s price is determined by a number of factors.
The incremental cost on the basic plate upon switching to animal protein sources was highly dependent on the type of animal protein source. In general, chambo was the most expensive protein source per weight followed by chicken. Smaller fish like usipa and utaka were the cheapest animal protein sources per weight. Usipa and utaka are quite small, cheap and unimportant at the commercial level while chambo is a commercially significant fish and retails for high prices, especially when dried (Singini et al., 2013). Similar differences could be observed in the meat category. The desirability of the meat type influenced the price, affecting total plate cost (Desiere et al., 2018).
In developing countries like Malawi, where poverty rates are high and the consumption of animal-source foods is low (Allen and Dror, 2011), the high cost of animal protein sources could pose a huge obstacle to people’s access to the same, possibly resulting in a substantial proportion of the population unable to consume high-quality protein of which animals and seafood are an excellent source (Day et al., 2022).
The cheapest basic plate between 2017 and 2021 was 62% of AFEM while the most expensive plate was 76% of the AFEM. These findings make the basic plate appear affordable at first glance. However, the basic plate is but a single meal. If the full day’s energy and nutritional needs of adult person are considered, the basic plate quickly becomes unaffordable, especially when compared to the AFEM between 2018 and 2021. All alternative plates would become less affordable if the full day’s energy and nutrient requirements of an adult person were considered.
5. Limitations of the study
The methodological approach employed in this study has several limitations. First, this study examined the cost of basic meals. However, basic nourishment is hardly adequate for an active and healthy life. A human being needs to consume diets that are diverse in macro and micronutrients. By only considering basic nourishment, the study does not cover the costs that could be incurred in accessing nutrient adequacy. Be that as it may, some studies have looked at the cost and affordability of nutritious and healthy diets, like Herforth et al. (2020), albeit at the global level, while Schneider (2022) evaluated the cost of nutrient adequacy in rural Malawi. Second, by analyzing the costs of plates, the study does not consider plates and diets available to households through non-purchase means. For example, the study did not consider the dependency on, among others, own production, food aid, gifts from family, friends, neighbors, or well-wishers. Last, this study is limited to Malawi and reflects the Malawian population’s consumption patterns and food choices, which may not be generalized to other countries. However, countries that present similar characteristics as Malawi may find the findings of this study useful.
6. Conclusions and recommendations
The findings of this study raise alarm of the plight of the poor in Malawi and indicate the need for further investigation of the affordability of even the most basic nutrition more broadly. The analysis determined that the cost of even one basic meal was unaffordable to the poorest in Malawi. Substituting more bioavailable protein sources made the meals less affordable between 2017 and 2021. The cost of substituting cheaper ingredients did not make the meals affordable either. Slight variations in the purchase parity cost and affordability of basic meals were primarily linked to fluctuations in domestic food supply. While the findings of this study are not generalizable to other countries in the region, it is recommended that this study could be replicated in other countries to better inform policy decisions and the design of development programs to address undernutrition and poverty.
Without a significant change in the incomes of the poor, access to a nutritious diet is impossible in Malawi. A radical re-benchmarking exercise is necessary if the country intends making progress on reducing undernutrition and allowing people to escape poverty. Reformulation of the components included in the consumer price index and basic baskets of goods used to estimate national and international benchmarks of poverty are necessary and the recalibration of basic wages and cut-offs determining access to social protection and international development aid (including cash transfers for food) are necessary to ensure access to even the most basic nourishment—one meal a day.
A number of policy interventions could support improved access to affordable and nutritious meals. Apart from a radical recalibration of poverty benchmarks and improvement in the value of social protection payouts, interventions that improve incomes, increase the supply to reduce prices and the provision of social protection to the very poor to increase their purchasing power are essential. Projects to support the production of fish, poultry and other small animals could provide livelihoods, incomes and increase the supply of animal-sourced-protein for communities. Likewise, removing value-added tax (VAT) on foods that provide basic foods could reduce the cost of meals. A redirecting of input and production subsidies could incentive the production of more nutrient-rich foods.
Data availability statement
Publicly available datasets were analyzed in this study. This data can be found at: Food composition data are publicly available at https://dl.tufts.edu/concern/pdfs/d217r336d. Food price data are available upon request from the National Statistics Office of Malawi. Requests to access the food price dataset should be directed toward commissioner@statistics.gov.mw. Food expenditure data are publicly available on the World Bank’s website at https://databank.worldbank.org/source/icp-2017. The international poverty line is also publicly available on the World Bank’s website at https://pip.worldbank.org/poverty-calculator.
Author contributions
MB and SH conceptualized the study. MB conducted the review of literature, analyzed the data, and drafted the initial paper. SH supervised the research and reviewed the drafts. All authors contributed to the article and approved the submitted version.
Funding
This publication was supported by the Economic and Social Research Council (grant number ES/T003871/1) under the ARUA-GCRF UKRI Partnership Program as part of the Capacity Building in Food Security (CaBFoodS-Africa) project.
Acknowledgments
The authors thank the National Statistics Office for permission to use the data, the Mastercard Foundation for providing a postgraduate scholarship (Mastercard Foundation Scholars Program 2021), the Bill and Melinda Gates Foundation for providing a postgraduate bursary (Bursary-AAERD/BMGF 2020) which enabled one of the authors to complete the writing of her Master’s dissertation from which this paper is based. and the Economic and Social Research Council (grant number ES/T003871/1) under the ARUA-GCRF UKRI Partnership Program as part of the Capacity Building in Food Security (CaBFoodS-Africa) project for sponsoring this publication.
Conflict of interest
The authors declare that the research was conducted in the absence of any commercial or financial relationships that could be construed as a potential conflict of interest.
Publisher’s note
All claims expressed in this article are solely those of the authors and do not necessarily represent those of their affiliated organizations, or those of the publisher, the editors and the reviewers. Any product that may be evaluated in this article, or claim that may be made by its manufacturer, is not guaranteed or endorsed by the publisher.
Abbreviations
AFEM, verage Food Expenditures for Malawi; FSIPL, Food Share of International Poverty Line.
References
Ali, Z., and Bhaskar, S. B. (2016). Basic statistical tools in research and data analysis. Indian Journal of Anaesthesia, 60:662. doi: 10.4103/0019-5049.190623
Allen, L. H., and Dror, D. K. (2011). “Effects of animal source foods, with emphasis on milk, in the diet of children in low-income countries” in Milk and milk products in human nutrition. eds. R. A. Clemens, O. Hernell, and K. F. Michaelsen (Nestlé Nutrition Institute Workshop Series: Pediatric Program). 67, 113–130.
Bai, Y., Alemu, R., Block, S., Headey, D., and Masters, W. A. (2020). Cost and affordability of nutritious diets at retail prices: evidence from 177 countries. Food Policy 99:101983. doi: 10.1016/j.foodpol.2020.101983
Darmon, N., and Drewnowski, A. (2015). Contribution of food prices and diet cost to socioeconomic disparities in diet quality and health: a systematic review and analysis. Nutr. Rev. 73, 643–660. doi: 10.1093/nutrit/nuv027
Davies, L. (2022). Cookbook puts pigeon pea on Malawi’s plates to combat food insecurity. Available at: https://www.theguardian.com/global-development/2022/jul/19/cookbook-puts-pigeon-pea-on-malawi-plates-to-combat-food-insecurity (Accessed 17 October 2022).
Day, L., Cakebread, J. A., and Loveday, S. M. (2022). Food proteins from animals and plants: differences in the nutritional and functional properties. Trends Food Sci. Technol. 119, 428–442. doi: 10.1016/j.tifs.2021.12.020
Desiere, S., Hung, Y., Verbeke, W., and D’Haese, M. (2018). Assessing current and future meat and fish consumption in sub-Sahara Africa: learnings from FAO food balance sheets and LSMS household survey data. Glob. Food Sec. 16, 116–126. doi: 10.1016/j.gfs.2017.12.004
Development Initiatives Poverty Research Ltd. (2022). 2022 global nutrition report: The state of global nutrition. Bristol: Development Initiatives Poverty Research Ltd.
Ecker, O., and Qaim, M. (2011). Analyzing nutritional impacts of policies: an empirical study for Malawi. World Dev. 39, 412–428. doi: 10.1016/j.worlddev.2010.08.002
Eisinga, R., Heskes, T., Pelzer, B., and Te Grotenhuis, M. (2017). Exact p-values for pairwise comparison of Friedman rank sums, with application to comparing classifiers. BMC Bioinformatics 18:68. doi: 10.1186/s12859-017-1486-2
FAO, IFAD, UNICEF, WFP and WHO. (2022). The state of food security and nutrition in the world 2022. Repurposing food and agricultural policies to make healthy diets more affordable. Rome, Italy. FAO, pp.30–42.
FAO, WFP, IFAD, WHO, and UNICEF. (2020). The state of food security and nutrition in the world 2020. Transforming food systems for affordable healthy diets. Rome, Italy, pp.3–115.
Friedman, M. (1937). The use of ranks to avoid the assumption of normality implicit in the analysis of variance. J. Am. Stat. Assoc. 32, 674–701.
Galler, J. R., Bringas-Vega, M. L., Tang, Q., Rabinowitz, A. G., Musa, K. I., Chai, W. J., et al. (2021). Neurodevelopmental effects of childhood malnutrition: a neuroimaging perspective. Neuroimage 231:117828. doi: 10.1016/j.neuroimage.2021.117828
Galler, J. R., Bryce, C., Waber, D. P., Zichlin, M. L., Fitzmaurice, G. M., and Eaglesfield, D. (2012). Socioeconomic outcomes in adults malnourished in the first year of life: a 40-year study. Pediatrics 130, e1–e7. doi: 10.1542/peds.2012-0073
Gilbert, R., Benson, T., and Ecker, O. (2019). Are Malawian diets changing? An assessment of nutrient consumption and dietary patterns using household-level evidence from 2010/11 and 2016/17. In: Strategy Support Program Working Paper, Washington, D.C, IFPRI, pp.1–43.
Global Panel on Agriculture and Food Systems for Nutrition (GloPAN) (2016). The cost of malnutrition. Why policy action is urgent. London, UK: GloPAN. pp.3–15.
Headey, D., and Alderman, H. (2019). The high price of healthy food … and the low price of unhealthy food. blogs.worldbank.org. Available at: https://blogs.worldbank.org/opendata/high-price-healthy-food-and-low-price-unhealthy-food (Accessed 12 July 2022).
Hendriks, S., Soussana, J., Cole, M., Kambugu, A., and Zilberman, D. (2021). UNFSS 2021 ensuring access to safe and nutritious food for all through transformation of food systems—a paper on action track 1—updated draft for discussion, pp.1–27.
Herforth, A., Bai, Y., Venkat, A., Mahrt, K., Ebel, A., and Masters, A. W. (2020). Cost and affordability of healthy diets across and within countries. Background paper for the state of food security and nutrition in the world 2020. FAO agricultural development economics technical study no. 9. Rome, FAO, pp.19-30.
Hirvonen, K., Bai, Y., Headey, D., and Masters, W. A. (2019). Affordability of the EAT–lancet reference diet: a global analysis. Lancet Glob. Health 8, e59–e66. doi: 10.1016/S2214-109X(19)30447-4
HLPE (2020). Food security and nutrition: building a global narrative towards 2030. A report by the High Level Panel of Experts on Food Security and Nutrition of the Committee on World Food Security. Rome, Italy 5–16.
Integrated Phase Classificaiton (IPC). (2023). Malawi: acute food insecurity June to September 2022 and projection for October 2022 to march 2023. Available at: https://www.ipcinfo.org/ipc-country-analysis/details-map/en/c/1155839/ (Accessed 29 May 2022).
Kambewa, E. (2010). Cassava commercialization in Malawi. Available at: https://www.canr.msu.edu/resources/cassava-commercialization-in-malawi (Accessed 17 October 2022).
Köcke, S. (2019). The perception of cassava in Malawi. A literature study about a root crop’s implication on food security in the past and the present. Thesis. pp.16–53.
Liu, J., and Xu, Y. (2022). T-Friedman test: a new statistical test for multiple comparison with an adjustable conservativeness measure. Int J Comput Intell Syst 15:8. doi: 10.1007/s44196-022-00083-8
Lofgren, P. A. (2013). “Meat, poultry, and meat products: nutritional value” in Encyclopedia of Human Nutrition. ed. Benjamin Caballero 3rd Cambridge, Massachusetts: Academic Press. 160–167.
Masters, A. W., Bai, Y., Herforth, A., Sarpong, B. D., Mishili, F., Kinabo, J., et al. (2018). Measuring the affordability of nutritious diets in Africa: Price indexes for diet diversity and the cost of nutrient adequacy. Am. J. Agric. Econ. 100, 1285–1301. doi: 10.1093/ajae/aay059
Masters, A. W., Martinez, E. M., Greb, F., Herforth, A., and Sheryl, L. (2021). Cost and affordability of preparing a basic meal around the world. Food Systems Summit brief.
Ministry of Health. WHO. National AIDS Commission and UNICEF (2007). National nutrition guidelines for Malawi. Ministry of Health. Lilongwe, Malawi. 9–10.
Moughan, P. J. (2003). Amino acid availability: aspects of chemical analysis and bioassay methodology. Nutr. Res. Rev. 16, 127–141. doi: 10.1079/nrr200365.
Moughan, P. J. (2021). Population protein intakes and food sustainability indices: the metrics matter. Glob. Food Sec. 29:100548. doi: 10.1016/j.gfs.2021.100548
Nahm, F. S. (2016). Nonparametric statistical tests for the continuous data: the basic concept and the practical use Korean Journal of Anesthesiology, 69:8. doi: 10.4097/kjae.2016.69.1.8.
Ngoleka, S. C. (2013). Modeling effects of maize price increase on rural household welfare: The cases of Mtimaukanena in Dowa and Masumbankhunda in Lilongwe, Malawi. Thesis. pp.1–13.
Orr, A., Kambombo, B., Roth, C., Harris, D., and Doyle, V. (2014). Adoption of integrated food-energy systems: improved cookstoves and pigeon pea in southern Malawi. Exp. Agric. 51, 191–209. doi: 10.1017/s0014479714000222
Pereira, D. G., Afonso, A., and Medeiros, F. M. (2014). Overview of Friedman’s test and post-hoc analysis. Commun. Stat. Simul. Comput. 44, 2636–2653. doi: 10.1080/03610918.2014.931971
Schneider, K. R. (2022). Nationally representative estimates of the cost of adequate diets, nutrient level drivers, and policy options for households in rural Malawi. Food Policy, 113:102275. doi: 10.2139/ssrn.3758543
Singini, W., Kaunda, E., and Jere, W. (2013). Wealth based fisheries management of chambo (Oreochromis spp.) fish stock of lake Malombe in Malawi. Int J Fisher Aquacult 5, 270–277. doi: 10.5897/IJFA2013.0377
Suresh, S. S. G., and Ma, S. A. S. (2020). Income segregation and access to healthy food. Am. J. Prev. Med. 59, e31–e38. doi: 10.1016/j.amepre.2020.02.009
Waber, D. P., Bryce, C. P., Girard, J. M., Zichlin, M., Fitzmaurice, G. M., and Galler, J. R. (2013). Impaired IQ and academic skills in adults who experienced moderate to severe infantile malnutrition: a 40-year study. Nutr. Neurosci. 17, 58–64. doi: 10.1179/1476830513y.0000000061
World Bank. (2019). International comparison program (ICP). Available at: https://www.worldbank.org/en/programs/icp. (Accessed 12 September 2021).
World Bank. (2023). The World Bank in Malawi: overview. Available at: https://www.worldbank.org/en/country/malawi/overview#:~:text=Climate%20shocks%2C%20low%20agricultural%20productivity,one%20of%20the%20highest%20globally (Accessed 29 May 2023).
World Food Programme (WFP). (2017). Counting the beans—the true cost of a plate of food around the world. WFP, Rome, Italy, pp.1–52.
Keywords: food security, nutrition, cost and affordability, basic meals, diet quality
Citation: Bwanaisa M and Hendriks SL (2023) Recalibration of benchmarks is necessary: even the most basic meal was not affordable for Malawi’s poor between 2017 and 2021. Front. Sustain. Food Syst. 7:1155661. doi: 10.3389/fsufs.2023.1155661
Edited by:
Yunyun Gong, University of Leeds, United KingdomReviewed by:
Pamela Matyolo, Food, Agriculture and Natural Resources Policy Analysis Network, South AfricaSally Mackay, The University of Auckland, New Zealand
Copyright © 2023 Bwanaisa and Hendriks. This is an open-access article distributed under the terms of the Creative Commons Attribution License (CC BY). The use, distribution or reproduction in other forums is permitted, provided the original author(s) and the copyright owner(s) are credited and that the original publication in this journal is cited, in accordance with accepted academic practice. No use, distribution or reproduction is permitted which does not comply with these terms.
*Correspondence: Sheryl L. Hendriks, s.l.hendriks@gre.ac.uk