Prediction of chemical indicators for quality of Zanthoxylum spices from multi-regions using hyperspectral imaging combined with chemometrics
 Youyou Wang1
  Jian Yang1
  Shuan Yu2
  Haiyan Fu3
  Song He3
  Bin Yang4
  Tiegui Nan1
  Yuwei Yuan5*
  Luqi Huang1*
- 1State Key Laboratory Breeding Base of Dao-di Herbs, National Resource Center for Chinese Materia Medica, China Academy of Chinese Medical Sciences, Beijing, China
- 2Research Center of Information Technology, Beijing Academy of Agriculture and Forestry Sciences, Beijing, China
- 3The Modernization Engineering Technology Research Center of Ethnic Minority Medicine of Hubei Province, School of Pharmaceutical Sciences, South-Central University for Nationalities, Wuhan, China
- 4Institute of Chinese Materia Medica, China Academy of Chinese Medical Sciences, Beijing, China
- 5Institute of Agro-Product Safety and Nutrition, Zhejiang Academy of Agricultural Sciences, Key Laboratory of Information Traceability for Agricultural Products, Ministry of Agriculture and Rural Affairs of China, Hangzhou, China
Fruits of Zanthoxylum bungeanum Maxim (Red “Huajiao,” RHJ) and Z. schinifolium Sieb. et Zucc. (Green “Huajiao,” GHJ) are famous spices around the world. Antioxidant capability (AOC), total alkylamides content (TALC) and volatile oil content (VOC) in HJ are three important quality indicators and lack rapid and effective methods for detection. Non-destructive, time-saving, and effective technology of hyperspectral imaging (HSI) combined with chemometrics was adopted to improve the indicators prediction in this study. Results showed that the three chemical indexes exhibited significant differences between different regions and varieties (P < 0.05). Specifically, the mass percentages of TALC were 11–22% in RHJ group and 21–36% in GHJ group. The mass percentages of VOC content were 23–31% and 16–24% in RHJ and GHJ groups, respectively. More importantly, these indicators could be well predicted based on the full or effective HSI wavelengths via model adaptive space shrinkage (MASS) and iteratively variable subset optimization (IVSO) selections combined with wavelet transform (WT) method for noise reduction. The best prediction results of AOC, TALC, and VOC indicators were achieved with the highest residual predictive deviation (RPD) values of 7.43, 7.82, and 3.73 for RHJ, respectively, and 6.82, 2.66, and 4.64 for GHJ, respectively. The above results highlight the great potential of HSI assisted with chemometrics in the rapid and effective prediction of chemical indicators of Zanthoxylum spices.
Introduction
“Red Huajiao” (RHJ) and “Green Huajiao” (GHJ) are the fruits of Zanthoxylum bungeanum Maxim and Z. schinifolium Sieb. et Zucc., respectively, and have been widely adopted as famous spices (Yang, 2008). HJ is mainly distributed in east Asian countries, such as Japan, Korea, and China, and more than 70% consumption relies on exports from China (Zhang et al., 2019a). In Chinese food culture, HJ fruits are used in many famous dishes, including spicy hot chafing dish, barbecue, instant noodles, etc. (Sun et al., 2020a). RHJ fruits are usually used for increasing aromatic taste, while GHJ fruits are mainly applied for enhancing numbing taste as a very special seasoning (Ni et al., 2022). The tingling and numbing taste of alkylamides and the fragrance of volatile oil are the unique and attractive features of fruits and oil of Zanthoxylum (Yang, 2008; Jing et al., 2021). Moreover, previous reports have demonstrated that HJ fruits present antioxidant activity (Ma et al., 2019) because of abundant bioactive compounds, such as flavonoids (Jing et al., 2021), phenolics (Ma et al., 2019), and alkaloids (Sun et al., 2020b).
For HJ fruits, volatile oil content (VOC), total alkylamides content (TALC), as well as the antioxidant capability (AOC) are the important quality indicators, and it is of great significance to accurately and efficiently evaluate those indexes. However, all those indexes were often evaluated with conventional methods with destructive, time-consuming, and high-cost characteristics. The examples are ultra-performance liquid chromatography-mass spectrometry/mass spectrometry (UPLC-MS/MS) detection of TALC (Zhang et al., 2019a), gas chromatography-mass spectrometry (GC-MS) evaluation of VOC (Yang, 2008), as well as the analysis of AOC using series of relatively complex biochemical methods (Jing et al., 2021). In view of this, it is very desirable to develop non-destructive, inexpensive, and rapid methods for quality evaluation of HJ spices.
At present, the rapid detection of food products has become a hot research topic for its environmental friendliness, low cost, and uncomplicated procedures. Rapid detection based on the spectral information has been widely used in food quality detection and adulteration prevention, such as terahertz spectroscopy (Liu et al., 2018), Raman spectroscopy (Magdas et al., 2019), fluorescence spectroscopy (Sádecká and Jakubíková, 2020), near-infrared hyperspectral imaging (NIR-HSI) (Ouyang et al., 2021), and nuclear magnetic resonance (NMR) spectroscopy (Godelmann et al., 2013). Among the rapid methods for quality and safety analyses of foods, near-infrared hyperspectral imaging (NIR-HSI) has become increasingly popular due to the high-throughput, non-destructive, and effective characteristics (Gowen et al., 2007; Caporaso et al., 2018). HSI can be applied to the initial samples without further sample preparation, such as grinding, extraction or purification (Pizarro et al., 2004), and can yield both spatial and spectral information from many samples in one batch (Hu et al., 2021).
In HSI research, chemometrics including data noise reduction and prediction regression are usually used. Different noise reduction methods have their own advantages (He et al., 2018; Feng et al., 2019; Wang et al., 2021b). For example, the spectral derivatization noises are suitable for elimination by second derivative (SEC) method, and multiplicative signal correction (MSC) method is commonly used for removing the undesirable scatter effect caused by uneven sample sizes and morphology (Feng et al., 2019). Notably, wavelet transform (WT) method is more suitable for reducing various noises possibly from the instrument or samples (Zhang et al., 2019b). Considering the uncertainty of spectral data in prediction regression, nonlinear or linear models like back-propagation neural network (BPNN) and random forest (RF) as well as the linear model (partial least squares regression, PLSR) are often used and compared in prediction of chemical contents (Gao et al., 2018; Zhang et al., 2019b).
Combined with chemometrics, HSI technology is widely used in chemical quality evaluation for various agricultural products. The method has been applied for oil content of maize (Zhang et al., 2022), total lipid content in coffee beans (Caporaso et al., 2018), phenolics and flavonoids contents in black goji berries (Zhang et al., 2020), as well as caffeine, tea polyphenols, and free amino acids contents in matcha (Ouyang et al., 2021). Selecting effective HSI wavelengths is a vital step to reduce the dimensionality of raw data, thereby eliminating irrelevant variables and improving efficiency. The suitable methods for selecting HSI wavelengths can be equally or more efficient in model prediction when compared with the full wavelengths group (Xie et al., 2014). However, the application potential of HSI assisted with chemometrics for prediction of chemical indicators for quality of Zanthoxylum spices is still underexplored.
This research proposes a method of rapidly and non-destructively predicting chemical quality of HJ spice by using HSI technology combined with chemometrics. The main research goals are as follows: (1) To clarify the differences of quality indicators (VOC, TALC, and AOC) in two varieties of HJ samples cultivated in different regions in China; (2) To compare the prediction effects of different noise reduction methods and regression models based on the hyperspectral dataset for predicting indicator contents; and (3) To evaluate the different effects of selection methods for important wavelengths, thus providing an optimized selection for dealing with high-dimension datasets.
Materials and methods
HJ fruits collection and preparation
Fresh and mature HJ fruits with uniform size and color were harvested from China covering all the main production regions, in August, 2020. RHJ was collected from seven provinces total ten regions (500 subsamples in total), and GHJ was collected from four provinces, total eight regions (400 subsamples in total) (Table 1). In one production region containing ten collection plots, fresh sample of 500 g was treated as one subsample, and five subsamples were collected from one production plot. In total, 50 subsamples from one region were transported to Beijing and dried in the same natural environment. The dried HJ particle of 10 g from one subsample was adopted for HSI analysis, and from each region, 50 parallel HSI data were obtained for further model regression. After data collection, all those corresponding subsamples were ground into 50-mesh powder for further biochemical analysis as a means to assess the prediction effects.
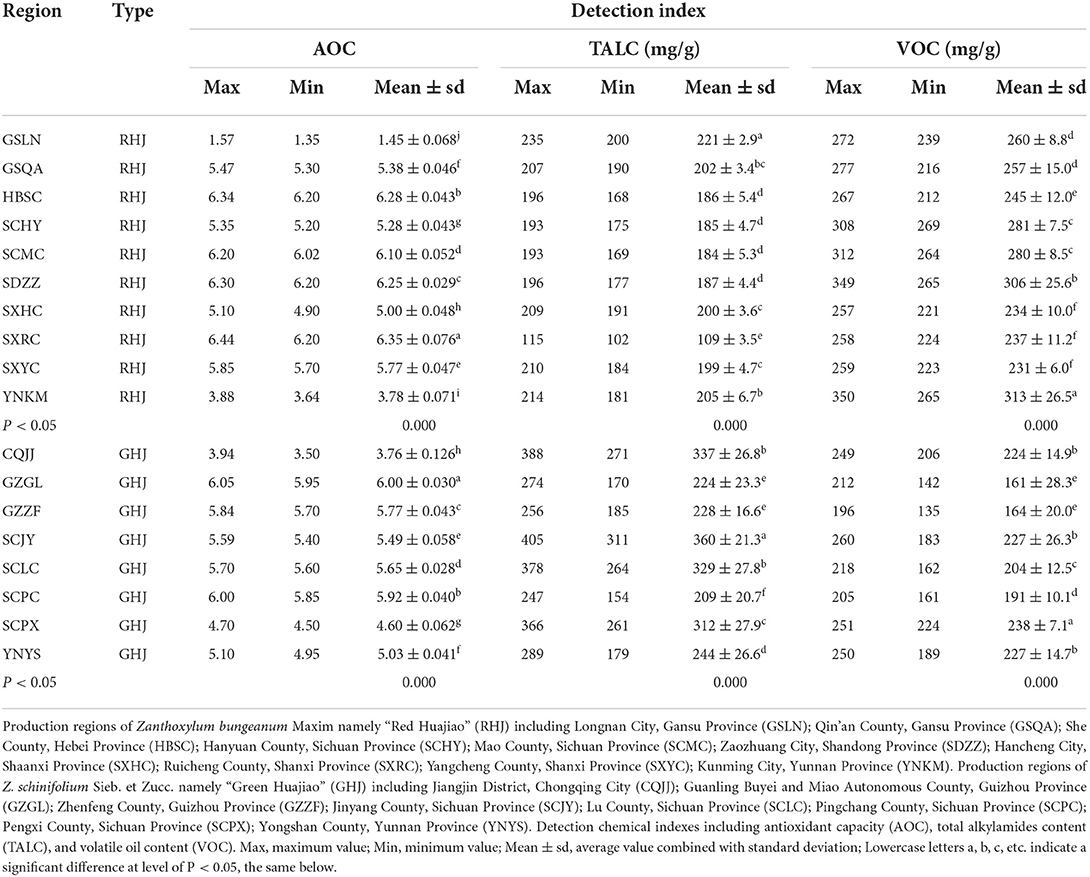
Table 1. Differences of chemical indicators of HJ from different regions.
HSI system and data acquisition
Visible and short-wave/long-wave near infrared hyperspectral imaging spectrometer (HySpex VNIR-1800/HySpex SWIR 384, Norsk Elektro Optikk, Oslo, Norway) was applied to collect HSI data. The main components include two lenses of visible near infrared (VNIR, 350 to 990 nm) and short-wave/long-wave near infrared (SWIR) (900 to 2,550 nm), two tungsten halogen lamps (150 W/12 V), one conveyor belt, and a computer for data acquisition.
Before data acquisition, the instrument was preheated for 30 min, and then 10 g HJ samples were neatly tiled on the conveyor belt through 96 well plates with the outer surface facing the lens to obtain uniform spectral images. To avoid adverse influence of the noise fluctuation at both ends of the wavelengths, bands from 410 to 950 nm and from 950 to 2,500 nm were selected as the effective intervals, including 396 bands with spectral resolution of approximately 5 nm for data collection. The exposure time of VNIR and SWIR was set as 0.0035 s and 0.0045 s, respectively. Two tungsten halogen lamps were used to provide stable light with the incident angle of 45°. The HJ sample was 30 cm away from the lens, and the speed of the conveyor belt was set at 2.5 mm/s to collect spectral information.
Original hyperspectral imaging data were corrected via black-and-white plate correction, and the correction formula is shown in Eq. (1):
where Rc is the corrected hyperspectral image, Ro is the original hyperspectral image, Rw is the white reference image (with 99% reflectivity), and Rb is the black reference image by blocking the camera lens cover. Finally, each subsample (10 g) of HJ fruits was treated as one region of interests (ROI), and data was extracted using ENVI 5.3 software (Research Systems Inc., Boulder, CO, USA), and totally 50 HSI data from one production region (ten plots) was collected.
Measurement of antioxidant capacity, total alkylamides content, and volatile oil content in HJ fruits using reference methods
Detection of antioxidant capability
According to the ABTS [2,2'-azino-bis (3-ethylbenzthiazoline-6-sulfonic acid)] method described in the former report (Hua et al., 2018), total antioxidant capacity assay kit (S0121, Beyotime, Shanghai, China) was used to determine the AOC of HJ samples. The characteristic absorbance at 414 nm was recorded with a microplate spectrophotometer Multiskan SkyHigh-1510 (Thermo fisher, MA, US). The AOC of Trolox (99% in purity, S0121, Beyotime, Shanghai, China) solution, one of analogs of Vitamin E, at 1.0 mM was considered as 1, and the AOC of samples was calculated based on the standard curve with R2 value equal to 0.9993 (y = 1.4877x+0.212) constructed by the Trolox solutions at 1.5, 1.2, 0.9, 0.6, 0.3, 0.15, and 0.075 mM.
M: Absorbance value of Trolox at 1.0 mM
N: Absorbance value of HJ sample at 0.1 mM.
Measurement of total alkylamides content
The TALC was assessed by a microplate spectrophotometer Multiskan SkyHigh-1510 (Thermo fisher, MA, US) at 266 nm (Tao et al., 2017). Solutions of 98% in purity hydroxy-β-sanshool (97465-69-5, Bethealth People Bionedical Technology Co., Ltd., Beijing, China) as standard alkylamide at 0.5, 0.4, 0.3, 0.2, and 0. 1 mg/ml were prepared to construct a standard curve with R2 value equal to 0.9996 (y = 0.8237x+0.0039). The TALC was calculated as follows [Eq. (3)]:
Y: Alkylamides concentration (mg/ml)
W: Weight of sample (g).
Evaluation of volatile oil content
According to the soxhlet extraction method (Yang, 2008), the essential oil yield was obtained after weighing the balance, and the mass ratio was calculated according to the formula [Eq. (4)]:
Y: Volatile oil yield (mg)
W: Weight of HJ sample (g).
Statistical and chemometric analysis
Statistical analysis of chemical indicators of two HJ fruits from different regions
SPSS 22.0 software (IBM Inc., Chicago, USA) was applied for significant differences (P < 0.05) analysis of three indicators with one-way analysis of variance (ANOVA) using Duncan's multiple comparison method. All data in comparison were expressed as mean ± standard deviation of three replicates.
Three noise-reducing methods for spectral pre-processing
Three methods were adopted for eliminating random noises during data collection, including multiplicative signal correction (MSC), second derivative (SEC), and wavelet transform (WT) with wavelet function Daubechies 8 and decomposition level 3 (Zhang et al., 2019b). MSC method is usually used to remove the undesirable scatter effect from the sample itself, such as uneven sample sizes (Feng et al., 2019). SEC method is mainly to eliminate spectral noise caused by instrument itself, such as baseline-offset and light scattering (Wang et al., 2021b). WT method is primarily used to reduce the random noises (many-sided noises) due to the influence of optical path variation, uneven sample size, and difference in color from sample surface (He et al., 2018).
Three regression models for prediction of chemical indicators
Three regression models, including back-propagation neural network (BPNN), partial least squares regression (PLSR), and random forest (RF), were used for chemical indicators prediction. BPNN model is composed of three parts: an input layer, hidden layers, and an output layer. In BPNN model, the node number of hidden layers, the momentum factor, the initial weight, the learning step, the maximum training iteration, and the minimum error were set to 10, 0.3, 0.95, 0.1, 100, and 0.001, respectively. During analysis, the desired learning result can be achieved by the feedback of the learning results to the hidden layers as well as the selection of the suitable weight coefficient matrix (Jia et al., 2021).
PLSR regression is mainly applied in the linear regression. The latent variables of PLSR model can increase the accuracy of prediction by considering the covariance between independent variables and target variables. In this analysis, the leave-one-out method was used for cross validation, and the optimal number of latent variables ranging from 6 to 8 was determined in the different model groups by the minimum root mean square error (RMSE) value in the cross validation set (Wang et al., 2021a).
RF model is an ensemble regression method widely used in chemicals content prediction. RF model introduces two random factors, including the number of decision tree (n tree) and the variable selection number (mtry) for improving prediction accuracy and avoiding overfitting. In this analysis, the number of 500 is suitable for n tree, and mtry is one third of the total number of predictors (p/3). There were six input variables for prediction, and it turned out that mtry = 2 was suitable for balancing the accuracy and the efficiency in our analysis (Liu et al., 2020; Jia et al., 2021).
The regression model performance was assessed by the following statistical indices: the determination coefficient of the calibration set (R) and the prediction set (R), the root mean square error of the calibration set (RMSEC) and the prediction set (RMSEP), and relative percent deviation (RPD) of the prediction set (Liu et al., 2022). R2 values from 0.60 to 0.80 and RPD values between 2.0 and 2.50 indicate that the model can be used for prediction. R2 values between 0.81 and 0.90 and RPD values ranging from 2.51 to 3.0 indicate that the model has a good prediction performance. While R2 values above 0.90 and RPD values larger than 3.0 indicate that the model has excellent prediction ability (Huang et al., 2021a).
Three effective wavelengths selection methods
Three methods of iteratively variable subset optimization (IVSO), model adaptive space shrinkage (MASS), and successive projections algorithm (SPA) for effective wavelengths selection were applied in this study.
IVSO method is based on the theory that the important variables were characterized by the large PLSR coefficients. During iteration, coefficients were obtained from a submodel for evaluating the importance level of each variable. In IVSO, weighted binary matrix sampling and sequential addition procedures were adopted to remove unimportant variables with small weight value and reduce the risk of losing important variables as described (Wang et al., 2021c,a). In this study, two important parameters in variable selection of the group number for cross validation and the number of sampling runs were set as 5 and 8,000, respectively.
MASS algorithm could find a most suitable variable set and delete abnormal samples using a weighted iteration strategy, and the problem of the order of variable selection and outlier detection in this method could be avoided. The best method was selected by comparison of the root mean square error of cross-validation value, and this process was repeated to obtain the optimal variable set (Wen et al., 2016; Li et al., 2019). In MASS algorithm, four parameters, namely the maximum number of latent variables, the group number for cross validation, the number of binary matrix sampling, and the pretreatment method, were selected as 15, 10, 500, and “autoscaling,” respectively.
SPA method was characterized by using a projection operation in a vector space for removing the irrelevant variables to solve the collinear problems, so as to select optimal variables with minimal redundancy and lowest collinearity (Galvão et al., 2008). In SPA, the continuous projection strategy was used to sort the initial wavelengths and obtain a series of wavelengths subsets in different arrangement orders. The optimal variables set was selected by comparing the prediction ability (Xie et al., 2014). In this part, the number of selected variables and the pretreatment method for selection were set as 10 to 50, and “autoscaling,” respectively.
In this study, RHJ of 500 subsamples and GHJ of 400 subsamples were divided into two groups, respectively, in a ratio of 7:3 in number (e.g., 350 subsamples:150 subsamples in RHJ group) using the sample set partitioning based on joint x-y distances (SPXY) algorithm (Galvão et al., 2005) to obtain training and prediction sets. Meanwhile, the model parameters were selected and optimized using 5-fold cross-validation. All above models or algorithms are based on MATLAB R2020a (The MathWorks, Natick, MA, USA) software.
The detailed description of the thorough analytical procedures is summarized in Figure 1.
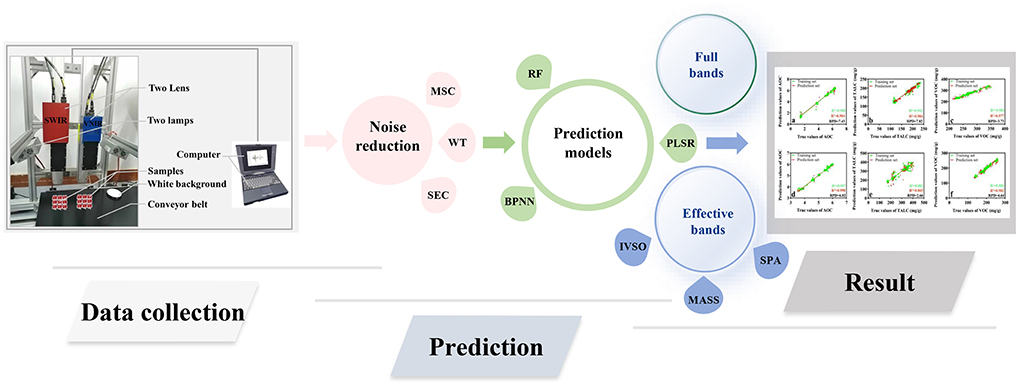
Figure 1. Schematic overview of the analytical flowchart. Three noise reduction methods including multiplicative signal correction (MSC), second derivative (SEC), and wavelet transform (WT). Three prediction models including back-propagation neural network (BPNN), partial least square regression (PLSR), and random forest (RF). Three effective bands selection methods including iteratively variable subset optimization (IVSO), model adaptive space shrinkage (MASS), and successive projections algorithm (SPA).
Results
Significant differences of two HJ fruits in chemical indicators from different regions
The ranges of three chemical indicators, including AOC, TALC and VOC, of RHJ and GHJ from different regions were analyzed (Table 1). In RHJ fruits, the mean values of AOC index ranged from 1.45 ± 0.068 in GSLN to 6.35 ± 0.076 in SXRC. The lowest mean value of TALC content at 109 ± 3.5 mg/g was from SXRC, and the highest mean content of 221 ± 2.9 mg/g was from GSLN. Also, the mean contents of VOC ranged from 231 ± 6.0 mg/g in SXYC to 313 ± 26.5 mg/g in YNKM (Table 1). In GHJ research, the minimum mean value of AOC was 3.76 ± 0.126 from CQJJ, and the maximum mean value of AOC was 6.00 ± 0.030 from GZGL. In addition, the lowest mean value of TALC was 209 ± 20.7 mg/g from SCPC, and the highest mean value of 360 ± 21.3 mg/g was from SCJY. Besides, the minimum and maximum mean contents of VOC were 161 ± 28.3 mg/g in GZGL and 238 ± 7.1 mg/g in SCPX, respectively (Table 1). In general, three indicators of AOC, TALC, and VOC exhibited significant differences between the different production regions of two HJ spices (P < 0.05).
In comparison between two varieties (RHJ and GHJ), the mass percentages of TALC weighted 11–22% (based on the mean value) in RHJ group, and 21–36% in GHJ group (Table 1). On the other hand, the mass percentages of VOC content weighted 23–31% (based on the mean value) in RHJ group, and 16–24% in GHJ group (Table 1). The above results showed that the TALC and VOC had significant differences.
Prediction of chemical indicators based on HSI full wavelengths
In this study, three chemical indicators of HJ were predicted based on full wavelengths using three models including BPNN, PLSR, and RF, each of which was combined with three pretreatment methods of MSC, SEC, and WT. The prediction results from different method combinations are shown in Table 2.
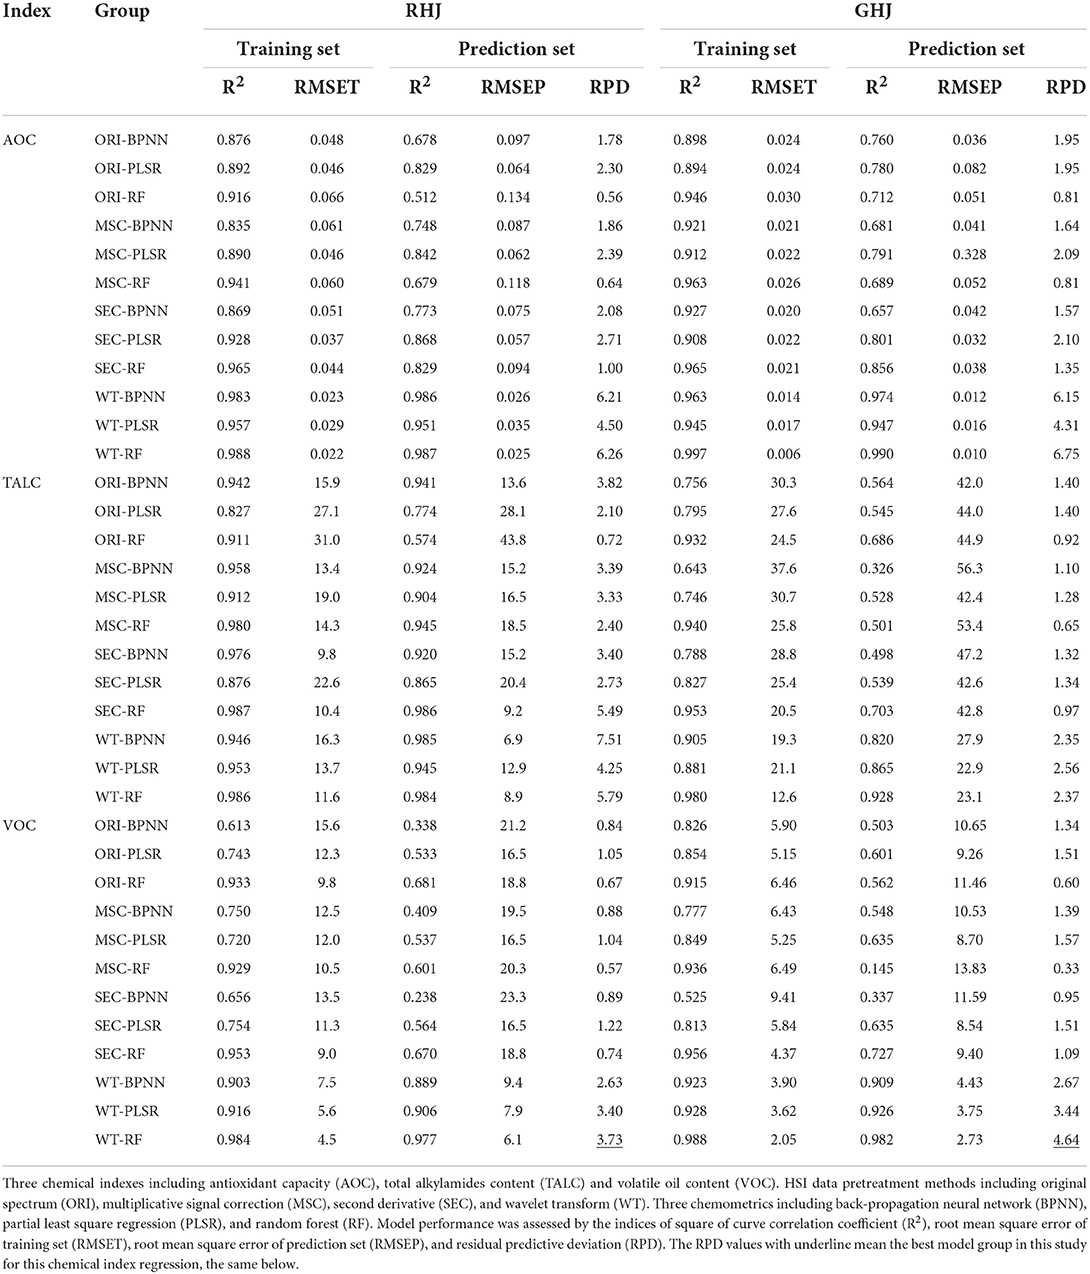
Table 2. Three chemical indicators prediction based on the full wavelengths.
In AOC prediction, all the excellent results of RHJ and GHJ groups were mainly because of the preprocessing model of WT (Table 2). Specifically, in the method combinations of WT-BPNN, WT-PLSR, and WT-RF, RMSE values were all lower than that from the other groups, all the R2 values in both training and prediction sets were all higher than 0.9, and the RPD values were all above 3.0, which represented an excellent ability in prediction (Table 2). In TALC prediction of RHJ (Table 2), all the groups from BPNN model and groups of MSC-PLSR, WT-PLSR, SEC-RF, and WT-RF presented excellent results with relatively lower RMSE values, R2 values in training and prediction sets all above 0.9, and RPD values all above 3.0. In TALC prediction of GHJ, the models were not as good as those in prediction of RHJ, and only one group of WT-PLSR reached a good prediction level with RPD value equal to 2.56 (Table 2). In VOC prediction for RHJ and GHJ groups, all the models with WT pretreatment presented higher RPD values than the other pretreatment groups (Table 2). In detail, with WT method in combination with PLSR and RF models, the RMSE values were all lower than that from the other groups, and the RPD and R2 values in both training and prediction sets were all higher than 3.0 and 0.9, respectively, exhibiting the excellent ability for prediction (RHJ and GHJ). Also, the WT-BPNN group achieved RPD values at 2.63 and 2.67, representing the good ability for prediction in RHJ and GHJ groups, respectively (Table 2).
Prediction of chemical indicators based on HSI effective wavelengths
The prediction based on full wavelengths may have the risk of information redundancy, and redundant data would lead to model problems such as complexity, long running time, and poor performance. The approaches for screening effective wavelengths may solve the above problems (Zhang et al., 2016). Three widely used selection methods of IVSO, MASS, and SPA were compared in this research (Table 3).
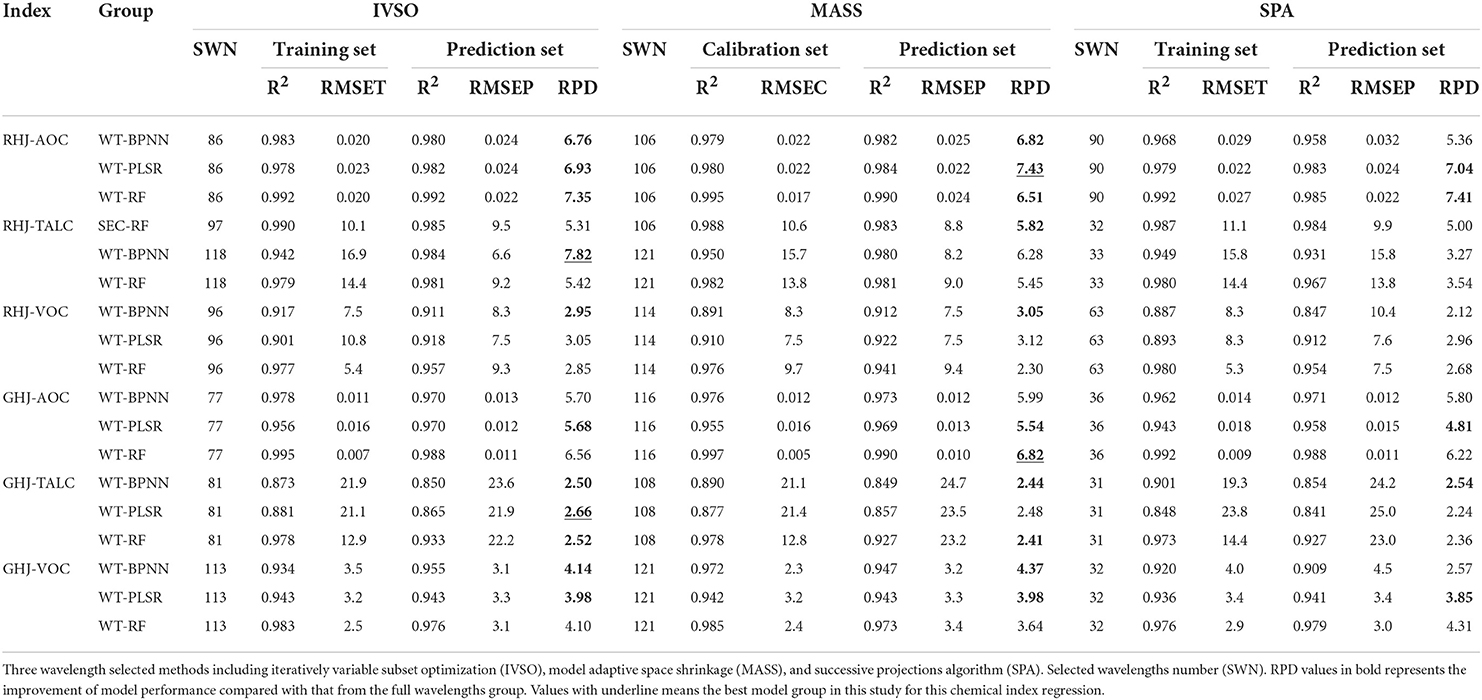
Table 3. Chemical indexes prediction of RHJ and GHJ based on the selected wavelengths.
From RHJ group based on full wavelengths, nine combinations with prominent effects were selected for screening effective wavelength, including WT- (BPNN, PLSR, and RF) models for AOC (RPD > 4.0), SEC-RF and WT- (BPNN and RF) models for TALC (RPD > 5.0), and WT- (BPNN, PLSR, and RF) models for VOC (RPD > 2.5). In AOC research, almost all the selection groups (IVSO, MASS, and SPA) exhibited the same or even better effect than the full wavelength groups, with improved RPD values higher than 5.0 (Table 3). In TALC research, in all the groups from IVSO and MASS selection, the RPD values were higher than 5.0, but the RPD values ranged from 3.0–5.0 in SPA groups. In VOC research, the IVSO-WT-PLSR, MASS-WT-BPNN, and MASS-WT-PLSR groups had the excellent prediction effects with RPD values higher than 3.0. However, in SPA groups, all the RPD values were lower than 3.0. In summary, compared with the full wavelength groups, 5/9, 5/9, and 2/9 groups with IVSO, MASS, and SPA selection, respectively, had increased in RPD values (RPD values in bold), which showed the better suitability of IVSO and MASS for wavelengths selection (Table 3).
Based on the results from GHJ groups by use of full wavelengths, nine combinations with better effects were chosen for chemical prediction with selected wavelengths, including WT- (BPNN, PLSR, and RF) models for AOC (RPD > 4.0), WT- (BPNN, PLSR, and RF) models for TALC (RPD > 2.0), and WT- (BPNN, PLSR, and RF) models for VOC (RPD > 2.5) (Table 3). In AOC research, all the groups in IVSO and MASS methods reached the RPD values higher than 5.0, suggesting the suitability of selection methods. In TALC research, RPD values from all the groups of three selection methods were higher than 2.0, indicating the suitability of selection models for prediction (Table 3). Besides, in the IVSO groups, all the RPD values were higher than 2.5, indicating the good suitability of IVSO selection. The results from all IVSO combination groups reached higher RPD (>2.5) than those obtained with full wavelength groups. In VOC groups, all three selection groups reached the same results or even higher RPD values compared with the full wavelength group, and achieved the RPD improvement of half the groups. In summary of GHJ groups, compared with the full wavelength groups, 6/9, 6/9, and 3/9 groups with IVSO, MASS, and SPA selection, respectively, realized higher RPD values (RPD values in bold), suggesting better suitability of IVSO and MASS for wavelengths selection (Table 3).
In general, the best prediction results of AOC, TALC, and VOC indicators of RHJ were achieved in the groups of MASS-WT-PLSR (Table 3, Figure 2A), IVSO-WT-BPNN (Table 3, Figure 2B), and WT-RF (full wavelengths, Table 2, Figure 2C), with the highest RPD values of 7.43, 7.82, and 3.73, respectively (values with underline). Also, the best prediction results of three indicators of GHJ were obtained in the models of MASS-WT-RF (Table 3, Figure 2D), IVSO-WT-PLSR (Table 3, Figure 2E), and WT-RF (full wavelengths, Table 2, Figure 2F) with the highest RPD values of 6.82, 2.66, and 4.64, respectively (values with underline).
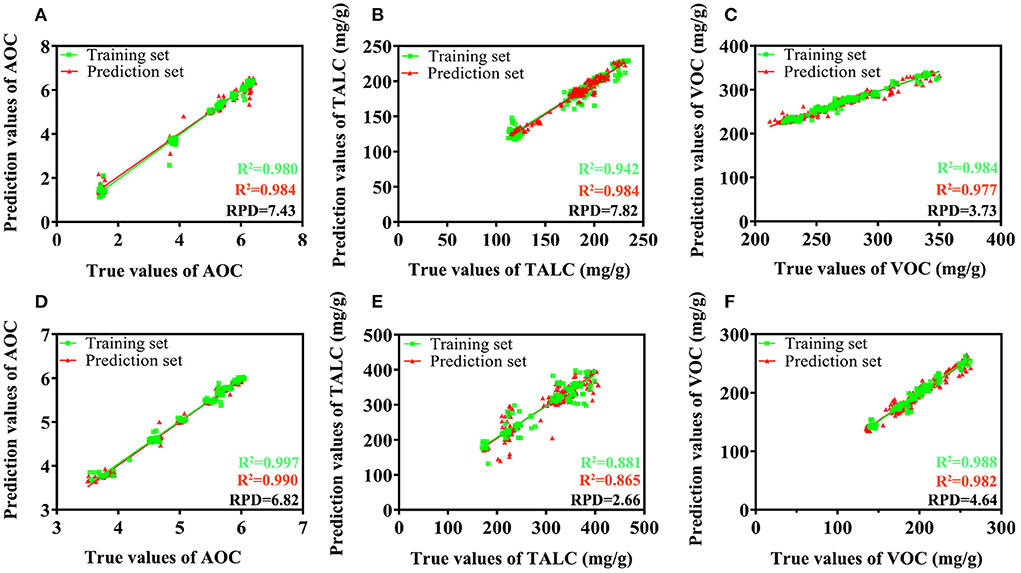
Figure 2. The most suitable models for chemical indicators prediction of HJ samples. (A): AOC prediction of RHJ (MASS-WT-PLSR), (B): TALC prediction of RHJ (IVSO-WT-BPNN), (C): VOC prediction of RHJ (WT-RF based on the full wavelengths), (D): AOC prediction of GHJ (MASS-WT-RF), (E): TALC prediction of GHJ (IVSO-WT-PLSR), (F): VOC prediction of GHJ (WT-RF based on the full wavelengths).
Discussion
Comparison of chemical indicators from HJ fruits between origins or varieties
In this study, AOC, TALC, and VOC exhibited significant differences between the groups from different production regions (P < 0.05). Many former reports have shown the same results of geographical differences in VOC for Z. zanthoxyloides Lam. (Tine et al., 2017) and TALC for Z. bungeanum (RHJ) (Zhang et al., 2019a; Sun et al., 2020b). The result of this research showed that RHJ from regions in SC province, namely SCHY and SCMC, had no significant difference (P > 0.05) in both TALC and VOC. The short spatial distance between these two regions lead to rather similar geographical environment and climate characteristics, and our result implied that the differences of geographical environments may play an important role in the accumulation of quality-indicating components.
Between different varieties such as RHJ and GHJ, former reports have shown that the TALC and VOC have significant differences in component types and contents (Yang, 2008). Also, the VOC and TALC play an important role in quality evaluation of RHJ and GHJ. Consistent with the significant differences between varieties reported by Yang (2008), this study found that mass percentages of TALC and VOC had significant difference in RHJ and GHJ. This result showed that GHJ has more content of TALC than RHJ, which well explains the phenomenon that GHJ is mainly used for increasing numbing taste. On the other hand, the mass percentage of VOC content in RHJ higher than that in GHJ further revealed the reasons why RHJ is famous for aromatic taste and mainly applied for increasing aroma of various food products and Chinese cuisine (Yang, 2008; Jing et al., 2021).
Comparison of noise reduction methods and regression models in indicators prediction
Each of the tested noise reduction methods has its own advantages and emphases (He et al., 2018; Feng et al., 2019; Wang et al., 2021b). As it was difficult to determine which aspects of the noise had the most significant impact on the prediction, we could only choose the best noise-reducing method empirically. In general, the prediction results in this study showed that WT method was more suitable for reducing various noises, which may come from sources such as instrument or sample. The reason may be the diversity of hyperspectral data noises, and WT method is very suitable for dealing with multivariate noises from sources such as environment, instrument or sample itself (He et al., 2018). Researches of total polysaccharides and flavonoids prediction in Chrysanthemum morifolium (He et al., 2018) and the heavy metals content evaluation of cadmium (Cd) and lead (Pb) in lettuce (Zhou et al., 2020) also showed the suitability of WT pretreatment for noise reduction of HSI data.
Meanwhile, as for regression models for prediction of three chemical indexes on full wavelength groups, non-linear and linear models (BPNN and RF) and linear model (PLSR) were applied in this study and the prediction effects did not seem to be dependent on one regression model. In terms of different index prediction, the best prediction model was different (without specific rule to follow), which also showed the complexity of HSI data. Previous reports also showed the applicability of these regression models in the prediction of chemical indexes. In detail, the reducing sugar and amino acid nitrogen contents in wine were accurately predicted using HSI full wavelength combined with BPNN models, with R2 and RPD values all higher than 0.80 and 2.0, respectively (Huang et al., 2021a). For oil content of maize kernel (Zhang et al., 2022), total lipid of green coffee bean (Caporaso et al., 2018) and both moisture and dry matter content of date fruits (Ibrahim et al., 2021), the results showed the suitability of PLSR model based on HSI full wavelength for prediction, with R2 values all higher than 0.80 and RPD values all larger than 2.0. PLSR, BPNN and RF models performed well under some circumstances in this study and all of them had their unique values for regression.
Comparison and analysis of three methods on selection effective wavelengths
Many previous similar reports have shown that effective HSI wavelengths often have the same or better prediction results for chemical indexes compared with those from the full wavelength group. The examples can be studies on starch and water contents prediction in potato (Xiao et al., 2020; Wang et al., 2021a), total caffeine and theanine contents prediction from tea (Wang et al., 2020, 2021c), amylose and amylopectin contents prediction in sorghum (Huang et al., 2021b), and total anthocyanin content and antioxidant activity prediction in mulberry fruit (Huang et al., 2017). The results of this research showed that the prediction effect of selection wavelengths groups was the same as or even better than that from the full wavelengths groups.
In general, the best prediction results of AOC and TALC in RHJ and GHJ samples were achieved by use of the selected bands. In AOC prediction of RHJ (MASS-WT-PLSR, Figure 3A) and GHJ (MASS-WT-RF, Figure 3B) with the best prediction effect, the result showed the close relationship between effective wavelengths and prediction index. Among these, the wavelengths at 1,000 to 1,100 nm and 1,150 to 1,300 nm may be related to the second harmonic of O-H and the first harmonic of C-H combination from the antioxidant substances of polysaccharides, respectively (Liu et al., 2021). Meanwhile, the effective wavelengths of 1,100 to 1,140 nm and 1,650 nm to 1,690 nm may be related to the first overtone region and the second overtone region of –CH3 from the antioxidant substances of polyphenols, respectively (Ouyang et al., 2021). As for TALC prediction from both RHJ (IVSO-WT-BPNN, Figure 3C) and GHJ (IVSO-WT-PLSR, Figure 3D) with the best prediction effect, the close correlation was observed between the effective wavelengths and the prediction index. Among these, effective wavelengths at 1,390 to 1,520 nm and 1,810 to 1,850 nm may be related to the first harmonic of C-H from the most abundant alkylamides compounds. Also, wavelengths in the range from 940 nm to 1,050 nm may be related to the third overtone region of -C-H (CH/CH2/CH3) in alkylamides compounds (Fan et al., 2021).
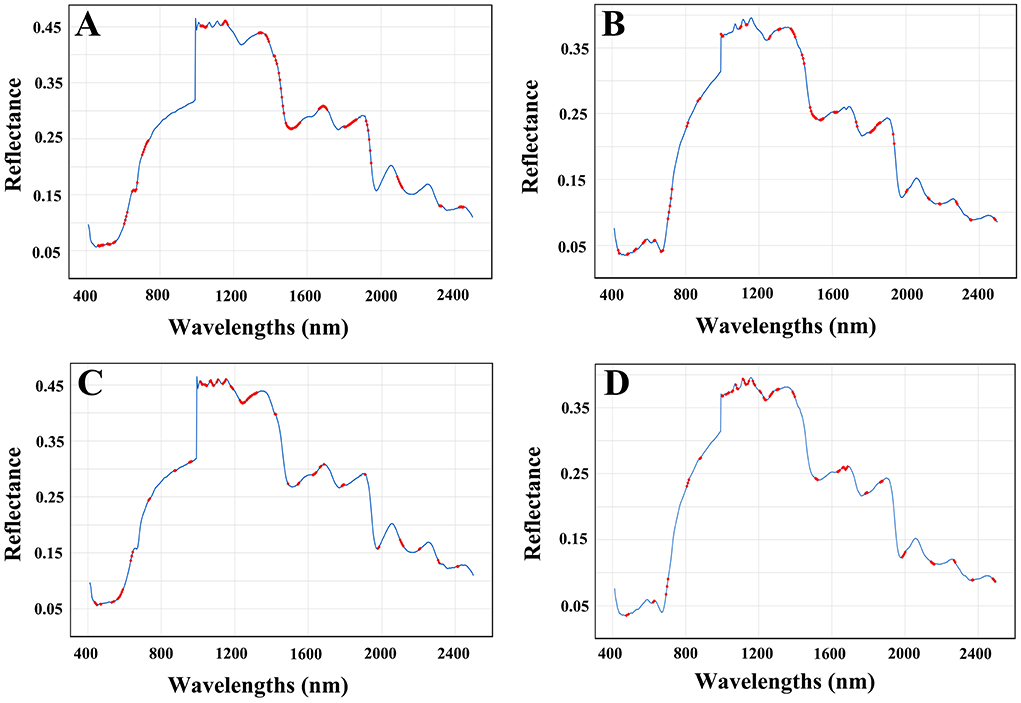
Figure 3. Selected wavelengths for best prediction in chemical indicators of HJ samples. The selected wavelengths were shown in red dots. (A) Selected wavelengths in AOC prediction of RHJ (MASS-WT-PLSR); (B) selected wavelengths in AOC prediction of GHJ (MASS-WT-RF); (C) selected wavelengths in TALC prediction of RHJ (IVSO-WT-BPNN); (D) selected wavelengths in TALC prediction of GHJ (IVSO-WT-PLSR).
Meanwhile, in this study, the significant differences in the prediction results of different screening methods were found, and especially showed the suitability of IVSO and MASS methods and inefficiency of SPA selection for effective wavelengths in prediction of three chemical indexes of HJ samples. Interestingly, the former reports also showed that starch content in potato was well predicted based on effective wavelengths selected via IVSO method, with R2 values > 0.88 in both calibration and prediction sets, and RPD values > 2.0 in almost all groups when combined with regression models (Wang et al., 2021a). Similar to our results, total phenolics, flavonoids, and anthocyanins contents in dry black goji berries (Lycium ruthenicum Murr.) were predicted using effective HSI wavelengths screened by use of SPA, and the SPA method for important band selection fails to yield a better prediction results than those of full HSI wavelengths group (Zhang et al., 2020). However, in moisture and crude fiber contents prediction of fresh tea leaves (Wang et al., 2020) and soluble protein content prediction in oilseed rape leaves (Zhang et al., 2015) using selected spectrum via SPA method, the results showed that SPA method was generally more suitable for effective wavelengths selection with prediction results better than those of full band group. Therefore, the effect of screening effective variables needs further analysis and comparison in different practical application situations.
In addition, the chemical contents prediction based on screening effective variables is also related to the regression model to a certain extent. For example, the reducing sugar and amino acid nitrogen contents of Daqu liquor were predicted using spectra selected by SPA, and compared with the results from the full wavelength group, the RPD values in BPNN and SVM models increased and values from PLSR model declined, indicating the model propensity (Huang et al., 2021a). In addition, IVSO wavelength selection method exhibited the advantages in prediction of catechin content from tea using PLSR model, and the prediction result improved from RPD = 2.81 to 3.19 compared with full HSI group (Wang et al., 2021c). However, in IVSO selection combined with SVM regression, the prediction effect were not particularly satisfactory (Wang et al., 2021c). In this study, the suitability of IVSO and MASS methods for selection effective bands was relatively prominent, but the tendency of three methods to the regression models have no regularity.
Conclusion
Geographical origin and variety may greatly affect quality indicators of HJ fruits, because three important chemicals indexes including VOC, TALC, and AOC have a significant difference (P < 0.05). Meanwhile, in the research field of food, there is an urgent need for a rapid detection technology with time-saving, easy operation, and cost-saving characters for food quality detection. In this study, the promising method of HSI combined with chemometric analysis was applied to the quality evaluation of HJ spices. WT method was successfully used for noise reduction of HSI data. Three chemical indicators were well predicted using HSI full wavelengths, and the effective wavelengths via MASS and IVSO selections. The overall results demonstrated the great potential of HSI technology assisted with chemometrics to predict the quality of HJ spices with the advantage of rapid, non-destructive, and low cost.
Admittedly, our dataset did not involve HJ samples from production regions out of China, and the inclusion of such samples in the future may improve the generalizability of the conclusion. Moreover, the prediction accuracy of the method, especially that for TALC from GHJ group, can be improved in the future studies. Notably, the emergence of the deep learning has brought inspiration for exploring the spatial information including color and texture features of HJ samples. It is worth exploring the possibility of spatial information combined with spectral data for more extensive prediction of indicators such as maturity, storage time, and cultivation practices of HJ samples. Finally, the effective wavelengths selected in this research provide an important potential for the development of convenient small equipment for rapid food quality evaluation in industry.
Data availability statement
The original contributions presented in the study are included in the article/Supplementary material, further inquiries can be directed to the corresponding authors.
Author contributions
YW: investigation, resources, and writing original draft. JY: conceptualization, writing original draft, and supervision. SY: conceptualization and formal analysis. HF: writing review and editing. SH: methodology. BY and LH: conceptualization, supervision, and funding acquisition. TN: data curation and formal analysis. YY: writing review, supervision, and funding acquisition. All authors have read and agreed to the published version of the manuscript.
Funding
This work was supported by the National Key R&D Program of China (Grant No. 2020YFC1712700), the scientific and technological innovation project of China Academy of Chinese Medical Sciences (Grant Nos. CI2021A04005 and CI2021A01809), the Key Project at Central Government Level: The ability establishment of sustainable use for valuable Chinese medicine resources (Grant No. 2060302), the National Natural Science Foundation of China (Grant No. 32122068), and the Shandong Provincial Key Research and Development Program (Major Technological Innovation Project) (Grant No. 2021CXGC010508).
Acknowledgments
The English writing was checked and revised by Q Luo.
Conflict of interest
The authors declare that the research was conducted in the absence of any commercial or financial relationships that could be construed as a potential conflict of interest.
Publisher's note
All claims expressed in this article are solely those of the authors and do not necessarily represent those of their affiliated organizations, or those of the publisher, the editors and the reviewers. Any product that may be evaluated in this article, or claim that may be made by its manufacturer, is not guaranteed or endorsed by the publisher.
Supplementary material
The Supplementary Material for this article can be found online at: https://www.frontiersin.org/articles/10.3389/fsufs.2022.1036892/full#supplementary-material
References
Caporaso, N., Whitworth, M. B., Grebby, S., and Fisk, I. D. (2018). Rapid prediction of single green coffee bean moisture and lipid content by hyperspectral imaging. J. Food Eng. 227, 18–29. doi: 10.1016/j.jfoodeng.2018.01.009
Fan, L., Zhang, C., Zhao, R., He, L., Fan, W., Wu, C., et al. (2021). Rapid and nondestructive determination of origin, volatile oil, sanshoamides and crack rate in the 'Sichuan pepper' based on a novel portable near infrared spectrometer. J Food Compos. Anal. 101, 103942. doi: 10.1016/j.jfca.2021.103942
Feng, L., Zhu, S. S., Liu, F., He, Y., Bao, Y. D., and Zhang, C. (2019). Hyperspectral imaging for seed quality and safety inspection: a review. Plant Methods 15, 91. doi: 10.1186/s13007-019-0476-y
Galvão, R. K. H., Araújo, M. C. U., Fragoso, W. D., Silva, E. C., José, G. E., Soares, S. F. C., et al. (2008). A variable elimination method to improve the parsimony of MLR models using the successive projections algorithm. Chemometr. Intel. Lab. 92, 83–91. doi: 10.1016/j.chemolab.2007.12.004
Galvão, R. K. H., Araújo, M. C. U., José, G. E., Pontes, M. J. C., Silva, E. C., and Saldanha, T. C. B. (2005). A method for calibration and validation subset partitioning. Talanta 67, 736–740. doi: 10.1016/j.talanta.2005.03.025
Gao, J. F., Nuyttens, D., Lootens, P., He, Y., and Pieters, J. G. (2018). Recognising weeds in a maize crop using a random forest machine-learning algorithm and near-infrared snapshot mosaic hyperspectral imagery. Biosyst. Eng. 170, 39–50. doi: 10.1016/j.biosystemseng.2018.03.006
Godelmann, R., Fang, F., Humpfer, E., Schütz, B., Bansbach, M., Schäfer, H., et al. (2013). Targeted and nontargeted wine analysis by 1H NMR spectroscopy combined with multivariate statistical analysis. Differentiation of important parameters: grape variety, geographical origin, year of vintage. J. Agric. Food Chem. 61, 5610–5619. doi: 10.1021/jf400800d
Gowen, A. A., Odonnell, C. P., Cullen, P. J., Downey, G., and Frias, J. M. (2007). Hyperspectral imaging – an emerging process analytical tool for food quality and safety control. Trends Food Sci. Tech.18, 590–598. doi: 10.1016/j.tifs.2007.06.001
He, J., Chen, L. D., Chu, B. Q., and Zhang, C. (2018). Determination of total polysaccharides and total flavonoids in Chrysanthemum morifolium using near-infrared hyperspectral imaging and multivariate analysis. Molecules 23, 2395. doi: 10.3390/molecules23092395
Hu, N. Y., Li, W., Du, C. H., Zhang, Z., Gao, Y. M., Sun, Z. C., et al. (2021). Predicting micronutrients of wheat using hyperspectral imaging. Food Chem. 343, 128473. doi: 10.1016/j.foodchem.2020.128473
Hua, Q. Z., Chen, C. B., Tel Zur, N., Wang, H. C., Wu, J. Y., Chen, J. Y., et al. (2018). Metabolomic characterization of pitaya fruit from three red-skinned cultivars with different pulp colors. Plant Physiol. Biochem. 126, 117–125. doi: 10.1016/j.plaphy.2018.02.027
Huang, H. P., Hu, X. J., Tian, J. P., Jiang, X. N., Luo, H. B., and Huang, D. (2021a). Rapid detection of the reducing sugar and amino acid nitrogen contents of Daqu based on hyperspectral imaging. J. Food Compos. Anal. 101, 103970. doi: 10.1016/j.jfca.2021.103970
Huang, H. P., Hu, X. J., Tian, J. P., Jiang, X. N., Sun, T., Luo, H. B., et al. (2021b). Rapid and nondestructive prediction of amylose and amylopectin contents in sorghum based on hyperspectral imaging. Food Chem. 359, 129954. doi: 10.1016/j.foodchem.2021.129954
Huang, L. X., Zhou, Y. B., Meng, L. W., Wu, D., and He, Y. (2017). Comparison of different CCD detectors and chemometrics for predicting total anthocyanin content and antioxidant activity of mulberry fruit using visible and near infrared hyperspectral imaging technique. Food Chem. 224, 1–10. doi: 10.1016/j.foodchem.2016.12.037
Ibrahim, A., Alghannam, A., Eissa, A., Firtha, F., Kaszab, T., Kovacs, Z., et al. (2021). Preliminary study for inspecting moisture content, dry matter content, and firmness parameters of two date cultivars using an NIR hyperspectral imaging system. Front. Bioeng. Biotechnol. 9, 720630. doi: 10.3389/fbioe.2021.720630
Jia, P. P., Shang, T. H., Zhang, J. H., and Sun, Y. (2021). Inversion of soil pH during the dry and wet seasons in the Yinbei region of Ningxia, China, based on multi-source remote sensing data. Geoderma Reg. 25, e00399. doi: 10.1016/j.geodrs.2021.e00399
Jing, N. A., Wang, M. Y., Gao, M. L., Zhong, Z. X., Ma, Y. P., and Wei, A. Z. (2021). Color sensory characteristics, nutritional components and antioxidant capacity of Zanthoxylum bungeanum Maxim. as affected by different drying methods. Ind. Crop. Prod. 160, 113167. doi: 10.1016/j.indcrop.2020.113167
Li, Y. T., Sun, J., Wu, X. H., Lu, B., Wu, M. M., and Dai, C. X. (2019). Grade identification of Tieguanyin tea using fluorescence hyperspectra and different statistical algorithms. J. Food Sci. 84, 2234–2241. doi: 10.1111/1750-3841.14706
Liu, G., Zhou, X., Li, Q., Shi, Y., Guo, G. L., Zhao, L., et al. (2020). Spatial distribution prediction of soil As in a large-scale arsenic slag contaminated site based on an integrated model and multi-source environmental data. Environ. Pollut. 267, 115631. doi: 10.1016/j.envpol.2020.115631
Liu, S., Huang, W., Lin, L., and Fan, S. (2022). Effects of orientations and regions on performance of online soluble solids content prediction models based on near-infrared spectroscopy for peaches. Foods 11, 1502. doi: 10.3390/foods11101502
Liu, W., Liu, C. H., Yu, J. J., Zhang, Y., Li, J., Chen, Y., et al. (2018). Discrimination of geographical origin of extra virgin olive oils using terahertz spectroscopy combined with chemometrics. Food Chem. 251, 86–92. doi: 10.1016/j.foodchem.2018.01.081
Liu, Y., Long, Y., Liu, H., Lan, Y., Long, T., Kuang, R., et al. (2021). Polysaccharide prediction in Ganoderma lucidum fruiting body by hyperspectral imaging. Food Chem. 13, 100199. doi: 10.1016/j.fochx.2021.100199
Ma, Y., Li, X., Hou, L. X., and Wei, A. Z. (2019). Extraction solvent affects the antioxidant, antimicrobial, cholinesterase and HepG2 human hepatocellular carcinoma cell inhibitory activities of Zanthoxylum bungeanum pericarps and the major chemical components. Ind. Crop. Prod. 142, 111872. doi: 10.1016/j.indcrop.2019.111872
Magdas, D. A., Cozar, B. I., Feher, I., Guyon, F., Dehelean, A., and Cinta Pinzaru, S. (2019). Testing the limits of FT-Raman spectroscopy for wine authentication: cultivar, geographical origin, vintage and terroir effect influence. Sci. Rep. 9, 19954. doi: 10.1038/s41598-019-56467-y
Ni, R., Yan, H., Tian, H., Zhan, P., and Zhang, Y. (2022). Characterization of key odorants in fried red and green huajiao (Zanthoxylum bungeanum maxim. and Zanthoxylum schinifolium sieb. et Zucc.) oils. Food Chem. 377, 131984. doi: 10.1016/j.foodchem.2021.131984
Ouyang, Q., Wang, L., Park, B., Kang, R., and Chen, Q. S. (2021). Simultaneous quantification of chemical constituents in matcha with visible-near infrared hyperspectral imaging technology*. Food Chem. 350, 129141. doi: 10.1016/j.foodchem.2021.129141
Pizarro, C., Esteban-Díez, I., Nistal, A. J., and González-Sáiz, J. M. (2004). Influence of data pre-processing on the quantitative determination of the ash content and lipids in roasted coffee by near infrared spectroscopy. Anal. Chim. Acta. 509, 217–227. doi: 10.1016/j.aca.2003.11.008
Sádecká, J., and Jakubíková, M. (2020). Varietal classification of white wines by fluorescence spectroscopy. J. Food Sci. Technol. 57, 2545–2553. doi: 10.1007/s13197-020-04291-y
Sun, J., Sun, B. G., Ren, F. Z., Chen, H. T., Zhang, N., and Zhang, Y. Y. (2020a). Characterization of key odorants in Hanyuan and Hancheng fried pepper (Zanthoxylum bungeanum) oil. J. Agric. Food Chem. 68, 6403–6411. doi: 10.1021/acs.jafc.0c02026
Sun, X. X., Zhang, D., Zhao, L., Shi, B. L., Xiao, J. B., Liu, X. H., et al. (2020b). Antagonistic interaction of phenols and alkaloids in Sichuan pepper (Zanthoxylum bungeanum) pericarp. Ind. Crop. Prod. 152, 112551. doi: 10.1016/j.indcrop.2020.112551
Tao, X. B., Peng, W., Xie, D. S., Zhao, C. B., and Wu, C. J. (2017). Quality evaluation of Hanyuan Zanthoxylum bungeanum Maxim. Using computer vision system combined with artificial neural network: a novel method. Int. J. Food Prop. 20, 3056–3063. doi: 10.1080/10942912.2016.1271808
Tine, Y., Diop, A., Diatta, W., Desjobert, J. M., Boye, C. S. B., Costa, J., et al. (2017). Chemical diversity and antimicrobial activity of volatile compounds from Zanthoxylum zanthoxyloides Lam. according to compound classes, plant organs and senegalese sample locations. Chem. Biodivers. 14, e1600125. doi: 10.1002/cbdv.201600125
Wang, F. X., Wang, C. G., Song, S. Y., Xie, S. S., and Kang, F. L. (2021a). Study on starch content detection and visualization of potato based on hyperspectral imaging. Food Sci. Nutr. 9, 4420–4430. doi: 10.1002/fsn3.2415
Wang, R., Wei, X., Wang, H. P., Zhao, L. S., Zeng, C. L., Wang, B. R., et al. (2021b). Development of attenuated total reflectance mid-infrared (ATR-MIR) and near-infrared (NIR) spectroscopy for the determination of resistant starch content in wheat grains. J. Anal. Methods Chem. 2021, 5599388. doi: 10.1155/2021/5599388
Wang, Y. J., Li, L. Q., Shen, S. S., Liu, Y., Ning, J. M., and Zhang, Z. Z. (2020). Rapid detection of quality index of postharvest fresh tea leaves using hyperspectral imaging. J. Sci. Food Agric. 100, 3803–3811. doi: 10.1002/jsfa.10393
Wang, Y. J., Li, M. H., Li, L. Q., Ning, J. M., and Zhang, Z. Z. (2021c). Green analytical assay for the quality assessment of tea by using pocket-sized NIR spectrometer. Food Chem. 345, 128816. doi: 10.1016/j.foodchem.2020.128816
Wen, M., Deng, B. C., Cao, D. S., Yun, Y. H., Yang, R. H., Lu, H. M., et al. (2016). The model adaptive space shrinkage (MASS) approach: a new method for simultaneous variable selection and outlier detection based on model population analysis. Analyst 141, 5586–5597. doi: 10.1039/C6AN00764C
Xiao, Q. L., Bai, X. L., and He, Y. (2020). Rapid screen of the color and water content of fresh-cut potato tuber slices using hyperspectral imaging coupled with multivariate analysis. Foods 9, 94. doi: 10.3390/foods9010094
Xie, C. Q., Wang, Q. N., and He, Y. (2014). Identification of different varieties of sesame oil using near-infrared hyperspectral imaging and chemometrics algorithms. PLoS ONE 9, e98522. doi: 10.1371/journal.pone.0098522
Yang, X. G. (2008). Aroma constituents and alkylamides of red and green huajiao (Zanthoxylum bungeanum and Zanthoxylum schinifolium). J. Agric. Food Chem. 56, 1689–1696. doi: 10.1021/jf0728101
Zhang, C., Liu, F., Kong, W. W., and He, Y. (2015). Application of visible and near-infrared hyperspectral imaging to determine soluble protein content in oilseed rape leaves. Sensors 15, 16576–16588. doi: 10.3390/s150716576
Zhang, C., Wu, W. Y., Zhou, L., Cheng, H., Ye, X. Q., and He, Y. (2020). Developing deep learning based regression approaches for determination of chemical compositions in dry black goji berries (Lycium ruthenicum Murr.) using near-infrared hyperspectral imaging. Food Chem. 319, 126536. doi: 10.1016/j.foodchem.2020.126536
Zhang, C., Ye, H., Liu, F., He, Y., Kong, W. W., and Sheng, K. C. (2016). Determination and visualization of pH values in anaerobic digestion of water hyacinth and rice straw mixtures using hyperspectral imaging with wavelet transform denoising and variable selection. Sensors 16, 244. doi: 10.3390/s16020244
Zhang, L., Wang, Y. Q., Wei, Y. G., and An, D. (2022). Near-infrared hyperspectral imaging technology combined with deep convolutional generative adversarial network to predict oil content of single maize kernel. Food Chem. 370, 131047. doi: 10.1016/j.foodchem.2021.131047
Zhang, L. L., Zhao, L., Wang, H. Y., Shi, B. L., Liu, L. Y., and Chen, Z. X. (2019a). The relationship between alkylamide compound content and pungency intensity of Zanthoxylum bungeanum based on sensory evaluation and ultra-performance liquid chromatography-mass spectrometry/mass spectrometry (UPLC-MS/MS) analysis. J. Sci. Food Agric. 99, 1475–1483. doi: 10.1002/jsfa.9319
Zhang, Y. C., Gao, J. F., Cen, H. Y., Lu, Y. L., Yu, X. Y., He, Y., et al. (2019b). Automated spectral feature extraction from hyperspectral images to differentiate weedy rice and barnyard grass from a rice crop. Comput. Electron. Agr. 159, 42–49. doi: 10.1016/j.compag.2019.02.018
Keywords: Zanthoxylum spices, antioxidant, alkylamide, volatile oil, hyperspectral imaging, chemometric
Citation: Wang Y, Yang J, Yu S, Fu H, He S, Yang B, Nan T, Yuan Y and Huang L (2022) Prediction of chemical indicators for quality of Zanthoxylum spices from multi-regions using hyperspectral imaging combined with chemometrics. Front. Sustain. Food Syst. 6:1036892. doi: 10.3389/fsufs.2022.1036892
Received: 05 September 2022; Accepted: 12 October 2022;
Published: 26 October 2022.
Edited by:
Shuxiang Fan, Beijing Research Center for Intelligent Equipment for Agriculture, ChinaReviewed by:
Zheli Wang, China Agricultural University, ChinaJunfeng Gao, University of Lincoln, United Kingdom
Copyright © 2022 Wang, Yang, Yu, Fu, He, Yang, Nan, Yuan and Huang. This is an open-access article distributed under the terms of the Creative Commons Attribution License (CC BY). The use, distribution or reproduction in other forums is permitted, provided the original author(s) and the copyright owner(s) are credited and that the original publication in this journal is cited, in accordance with accepted academic practice. No use, distribution or reproduction is permitted which does not comply with these terms.
*Correspondence: Luqi Huang, huangluqi01@126.com; Yuwei Yuan, ywytea@163.com