Selection of Elite Genotypes of Coffee arabica L. to Produce Specialty Coffees
 Marcelo Ribeiro Malta1*
  Antonio Carlos Baiao Oliveira2
  Gilberto Rodrigues Liska3 Gladyston Rodrigues Carvalho1 Antonio Alves Pereira1 Ackson Dimas Silva1 Laisa Nayara Alvaro1 Diego Menez Mota1
- 1Experimental Field of Lavras, Agronomical Research Institute of Minas Gerais, Belo Horizonte, Brazil
- 2Embrapa Café, Brazilian Agricultural Research Corporation (EMBRAPA), Brasília, Brazil
- 3Department of Agroindustrial Technology and Rural Socioeconomics, Federal University of São Carlos, São Carlos, Brazil
This study aimed to evaluate the cup quality of Coffea arabica elite genotypes submitted to wet processing. C. arabica elite genotypes, which were grouped according to their genealogy: Bourbon, Paraíso Germplasm, and Resistant to Rust. Coffees were sent to wet processing to obtain fully washed coffee. After processing and drying the coffees were subjected to cup quality analysis according to the methodology of the Association of Special Coffees (SCA). To characterize and discriminate the genealogical groups the data were submitted to chemometric analysis, Principal Component Method (PCA) and Partial Least Squares Discriminant Analysis (PLS-DA). The PCA was effective in presenting an overview of the data, demonstrating the variables that most contributed to the analysis response. However, the PCA was not efficient to group genotypes according to their genealogical origin, based on chemometric data, as it is an unsupervised analysis. Even though most of the samples were classified correctly, the PLS-DA model created has not yet managed to correctly classify the genotypes of the Paraíso germplasm group. The C. arabica elite genotypes evaluated have the potential to produce special coffees, especially on the genotypes Paraíso 2, H493-1-2-10 and UFV-7158 with scores equal to or above 90 points.
Introduction
The consumption in the world of specialty coffees has been growing in much greater proportions than the consumption of ordinary coffees, mainly due to changes in the behavior of consumers who seek not only its stimulating effect, but also pleasure and satisfaction when tasting the coffee beverage (Fassio et al., 2019a).
The beverage quality of the coffee is dependent to the intrinsic quality of the coffee beans (Figueiredo et al., 2013), which is expressed by the chemical composition originated from the interaction between genotype x environment x processing (Borém et al., 2016; Fassio et al., 2019a; Malta et al., 2020). These compounds will, after roasting, develop the characteristic aroma and flavor of the beverage, in addition to other important sensory attributes such as body, acidity and sweetness (Figueiredo et al., 2015; Borém et al., 2016).
The genetic component has an important influence on the determination of flavor and aroma of coffee. C. arabica species is the one with the greatest potential to produce coffee of superior quality within the Coffea genus (Teressa et al., 2010; Tessema et al., 2011; Fassio et al., 2019a; Malta et al., 2020). C. arabica is originally from Ethiopia and has been propagated and disseminated worldwide from a small number of plants, which has led to a narrow genetic basis within Arabica coffee cultivars (Scholz et al., 2016). To increase genetic variability, several introductions have been made since 1928 and transferred to germplasm banks around the world, used to produce new, more productive cultivars, adapted to growing regions and resistant to diseases (Kathurima et al., 2009; Tessema et al., 2011; Gimase et al., 2014; Scholz et al., 2016). Within this context, several elite progenies are in the final selection phase and will soon be able to constitute new genetic materials available for cultivation.
Due to the importance of the genetic component as well as the form of processing used to determine the cup quality, the purpose of this investigation was to evaluate the quality potential of 31 elite genotypes of C. arabica from Epamig's improvement program submitted to wet processing and to characterize the sensory profile of the elite genotypes, using multivariate statistical tools in view of the use of a model created by the PLS-DA method to classify and discriminate Arabica coffee genealogical groups Bourbon (GB), Paraiso Germplasm (GP) and Rust-resistant (GR) according to the sensory profile of these genotypes.
Materials and Methods
Sampling, Experiment Location, and Processing
The experiment was carried out in the 2015 and 2016 agricultural years with coffee samples from 31 elite genotypes of C. arabica L. from Epamig's improvement program and partner institutions which were separated into groups according to the genealogical origin (Table 1). The three genealogical groups are formed by genotypes that have stood out in relation to the cup quality according to evaluations where protocols of the Association of Special Coffees—SCA were used.
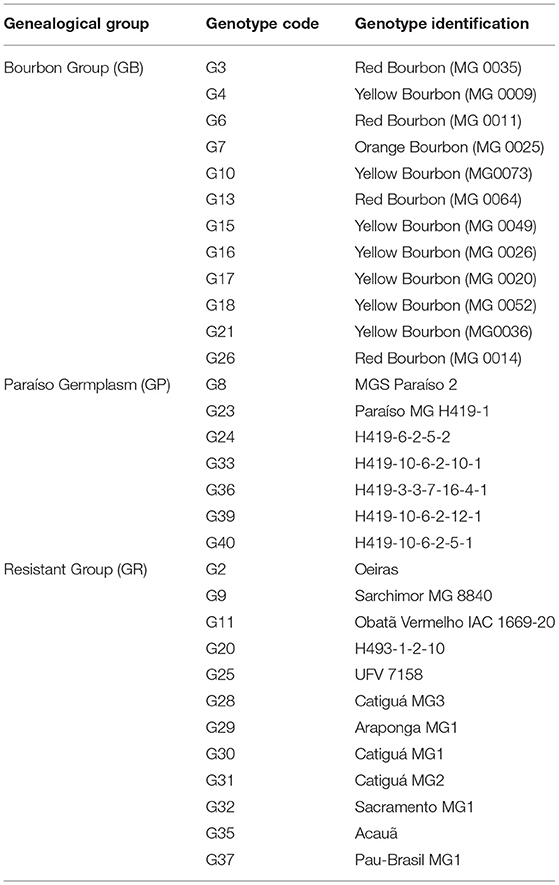
Table 1. Coding and identification of the C. arabica L. elite genotypes evaluated.
The elite genotypes evaluated in this study are implemented in the field, in a randomized block design with two replications and 10 plants per plot, in the Empresa de Pesquisa Agropecuária de Minas Gerais—EPAMIG (Agricultural Research Company), located at 18°59'26” south latitude, 48°58'95” west longitude, and 975 meters altitude, in the Alto Paranaíba region.
The coffee fruits were collected when most were at the ideal maturation point and processed by the wet method to obtain fully washed coffee (Figure 1). The grains were dried in screened bottom sieves and periodically revolved until reaching a water content of 11% (w.b.). After drying, the coffee samples were packed in a Kraft® paper bag and covered with a polyethylene bag. The samples were stored in a cold chamber at ± 18° C for a period of 30 days.
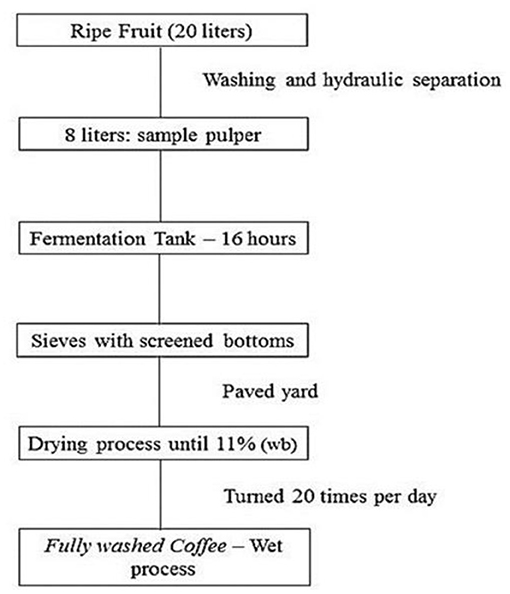
Figure 1. Flowchart of the wet processing method adopted to obtain fully washed coffee.
Sensory Analysis
The sensory analysis of the coffee was carried out according on the protocols described by the Specialty Coffee Association—SCA (Lingle, 2011). One hundred grams of coffee beans were roasted from until they reached the color standard # 65 for whole grains of the Agtron/SCA Color Classification System. For cup quality, a panel of three trained judges (Q-grader) evaluated five cups of each coffee sample in relation to ten sensory attributes: fragrance/aroma, uniformity, absence of defects, sweetness, flavor, acidity, body, balance, completion and overall impression. The final sensory score was generated from the sum of the evaluated attributes, with coffees with a score equal to or >80 points being considered special coffee.
Data Analysis
The sensory evaluation data for the 31 elite genotypes of C. arabica, were analyzed using multivariate statistical tools such as the principal component method (PCA) and partial least squares discriminant analysis (PLS-DA) using the statistical software R (R Development Core Team, 2017).
PCA is an unsupervised multivariate method that aims to find new variables that are not correlated in such a way as to explain the maximum variation of the original data set (X) without referring to any class label (Y). These new variables are the principal components and it is desirable that they be correlated with the original variables, in order to reduce the original dimension of the variables in a smaller dimension of variables, constituted by the principal components (Malta et al., 2020). In this sense, the PCA was used for the purpose of evaluating the similarity between the sensory attributes, formed by matrix X, in the different genotype codes, as mentioned in Sampling, Experiment Location, and Processing.
The partial least squares discriminant analysis (PLS-DA) was used to separate the genotypes in the different genealogical groups. PLS-DA is a supervised method that uses the desired response (Y) to build a model that classifies a sample considering the variables in matrix X and its respective category (Y) for a given group (Fassio et al., 2019b). The method consists of modeling the structure of variance and covariance of latent variables in such a way as to maximize the multidimensional variance of the variables in matrix X in the direction of matrix Y. It should be noted that, due to the existence of a correlation between the sensory attributes, the usual linear regression methods, and conventional discriminant analysis (Linear Discriminant Analysis-LDA) would not be adequate (Taveira et al., 2014).
The PLS-DA model was developed to separate the genealogical groups of elite genotypes of C. arabica submitted to wet processing according to sensory attributes. To assess the model's performance, the classification error rate for each component of the PLS-DA was considered (Rohart et al., 2017). The load of each variable in the component was also used, which provided in a better error rate to indicate the variables in matrix X that presented the greatest contributions to the PLS-DA component.
Results
Multivariate Analysis
In the multivariate analysis, only the sensory attributes of acidity, body, flavor, and aroma were evaluated, together with the final sensory score, as the other attributes didn't show differences in the scores for evaluated genotypes.
Principal Component Analysis (PCA)
PCA was used as a first approach to multivariate analysis to obtain an overview of the data. Figure 2 is a projection of the results obtained in the PCA, regarding the distribution of genotypes according to the sensory attributes analyzed and the final sensory score. The first two principal components explained 97.91% of the response variability (95.88% for PC1 and 2.03% for PC2). The Final Score variable presented the highest loading value for PC1 and, therefore, the greatest influence (0.9981) in the separation of the evaluated genotypes. However, all sensory attributes were important in the formation of PC1. The variables Body and Flavor were determinants for the formation of PC2 (Table 2).
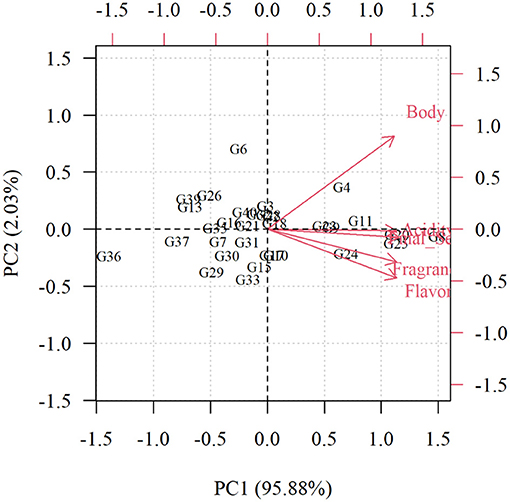
Figure 2. Biplot of the first two main components PC1 (95.88%) and PC2 (2.03%) for data from 31 elite genotypes of C. arabica wet processed according to the sensory attributes and final sensory score.
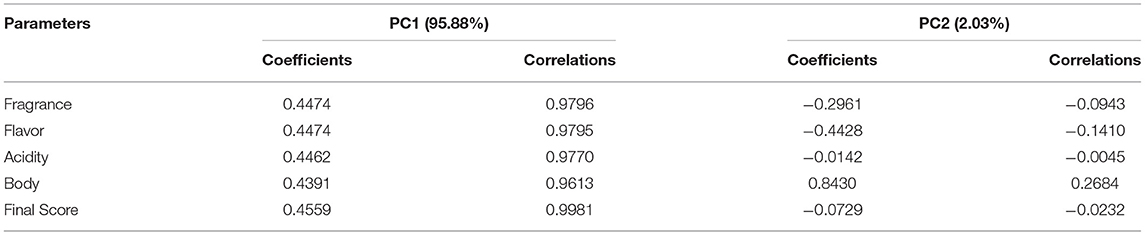
Table 2. Correlations between the evaluated parameters (final score and sensory attributes) with the first two main components and the respective coefficients of each parameter with the main component.
It was observed that the genotypes grouped in the rightmost region of the biplot present greater intensity of the attributes of acidity, flavor, fragrance, and final sensory score (Figure 2). Once the PC1 was determined by all sensory attributes and final score, all of them presenting positive coefficients (Table 2), it is noted that the coffees that are located in the bars in the positive direction of the graph (Figure 3A) are the ones that present highest values of all sensory attributes and final score, with emphasis on the G8, G20, and G25 genotypes. The G8 genotype (MGS Paraíso 2) belongs to the Paraíso germplasm. The G20 genotype (H493-1-2-10) comes from a cross between the cultivar Red Catuaí IAC 144 with Timor Hybrid. The G25 genotype (UFV 7158) belongs to the Catimor germplasm and comes from the crossing between Red Caturra with Timor Hybrid. It should be noted that all the highlighted genotypes have in their ancestry the Timor Hybrid germplasm, which shows that it is possible to obtain specialty coffees when using this germplasm as a source of resistance to rust. On the other hand, coffees with bars in the negative direction of the graph are those with the lowest values of sensory attributes, with emphasis on the genotype G36 (H419-3-3-7-16-4-1), which belongs to the Paraíso Germplasm.
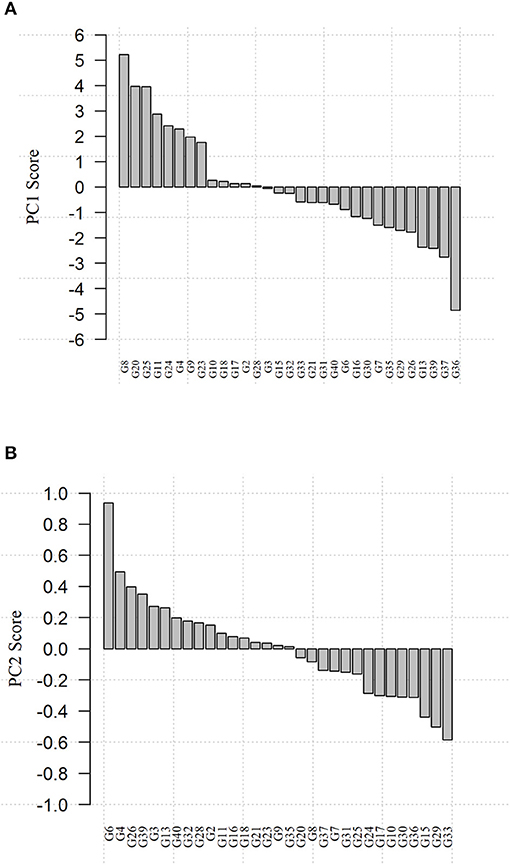
Figure 3. Scores of PC1 (A) and PC2 (B) for data from 31 Coffea arabica elite genotypes processed by wet process according to the scores of sensory attributes and the final score.
The second principal component (PC2) can be understood as a comparison between the sensory attributes of flavor and body, that is, low values of the first imply in high values of the second, according to the adjusted coefficients of the PC2 (Table 2). Thus, according to PC2, the G6 genotypes (Red Bourbon) and G4 (Yellow Bourbon) have higher scores for the body attribute and lower scores for the flavor attribute. In contrast, the G33 genotype (H419-10-6-2-10-1) has higher scores for the flavor attribute and lower scores for the body attribute (Figure 3B).
Applying the PLS-DA Model
Through the principal component analysis, it was possible to establish a relationship between the genealogical groups and the sensory attributes and the final score. However, such an analysis does not quantify the relationship of a specific sensory attribute with that group. In this sense, PLS-DA analysis was used.
The scores obtained by the PLS-DA show the similarity between the genotype codes (Figure 4A), so that most of the genealogical groups are included in the ellipses of 95% confidence. It is observed that there are genealogical groups that are overlapped by the confidence ellipses of other groups, which can make it difficult to discriminate by the model. Supposedly, the GP group has similar characteristics to the GB and GR groups, which justifies the high error rate in the classification of genotype codes in the genealogic groups (Table 3).
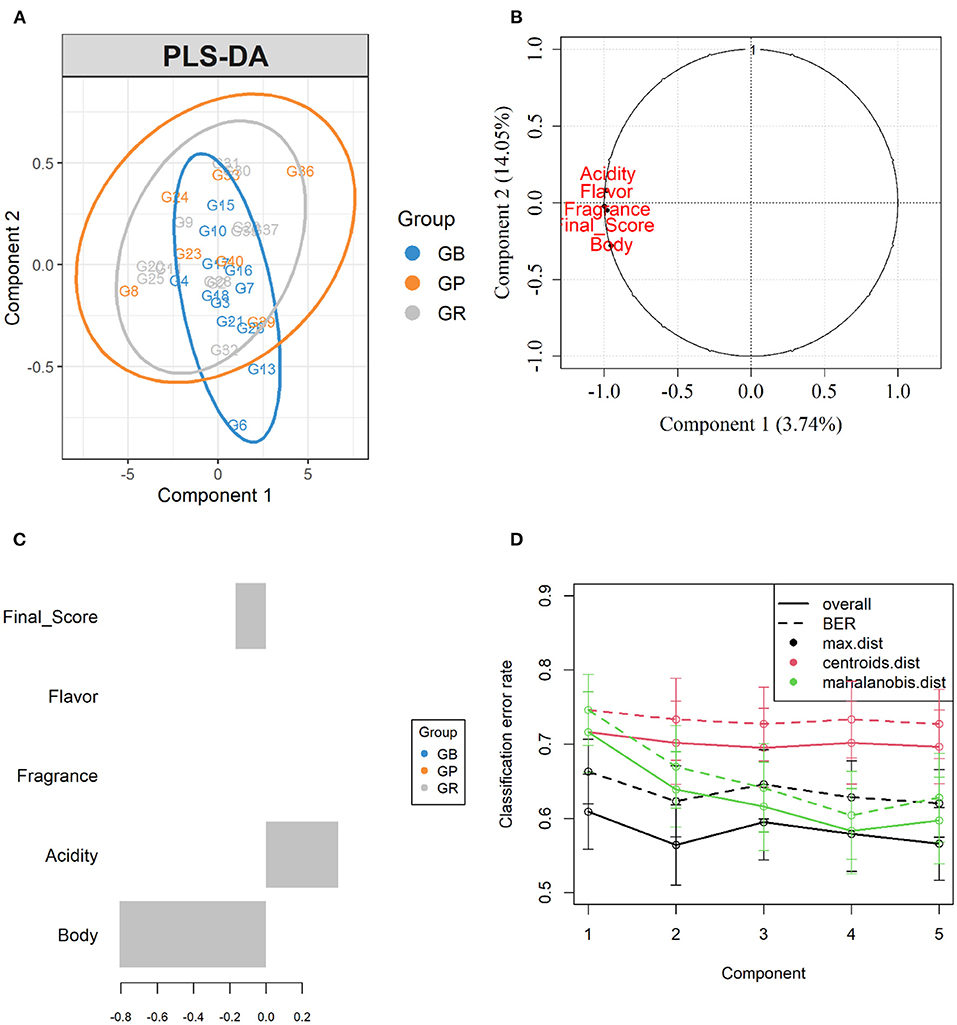
Figure 4. (A) Graph of the PLS-DA scores of two components for sensory analysis differentiating the genealogical groups. ( ) GB—Bourbon Group, (
 ) GP—Paraíso Germplasm, (
 ) GR—Resistant Cultivars Group. (B) Correlation Graph of sensory attributes with components 1 and 2 with classes GB, GP and GR. (C) Loads of component 2 of the PLS-DA model of sensory attributes for each genealogical group. (D) Classification error rate generated for the components of the PLS-DA model through a cross-validation procedure using five parts (5-fold) of the data set to adjust the model and the rest to test it in 100 simulations.
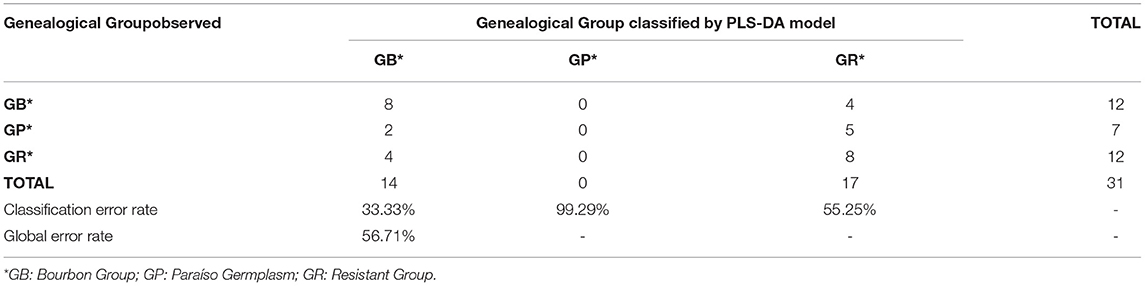
Table 3. Counting false positives and negatives in reference to the classification of genealogical groups by the PLS-DA model and their respective error rates obtained through a cross-validation procedure using 5 parts (5-fold) of the data set to adjust the model and the rest to test the same in 100 simulations.
Figures 4B,C (graph of the correlation circle and variable loads in component 2 of the PLS-DA) show the variables that most influenced the classification of genotypes in the groups. The attributes body, acidity, and final sensory score further influenced the classification of the group of cultivars resistant to rust (GR).
Through cross-validation, the performance of the PLS-DA model was assessed, returning an overall error rate of 56.71% (Table 3). The genotype codes data set were divided into five parts through 100 Monte Carlo simulations and one part was used to obtain the error rates. In this sense due to the similarity of the GP genealogical group with the other groups, the model did not correctly classify these samples and most of them were classified as belonging to the resistant group (GR). The ideal number of components in the model is 2 (Figure 4D) and the sensory attribute Body has the greatest contribution to the classification of genealogical groups, followed by Acidity (Figure 4D).
In each group, it is possible to identify the highlighted genotypes for these variables, such as the G20 and G25 genotypes for the rust resistant group (GR) and the G6 and G13 genotypes for the Bourbon group (GB), properly classified by the PLS-DA, according to the Figures 4A, 5.
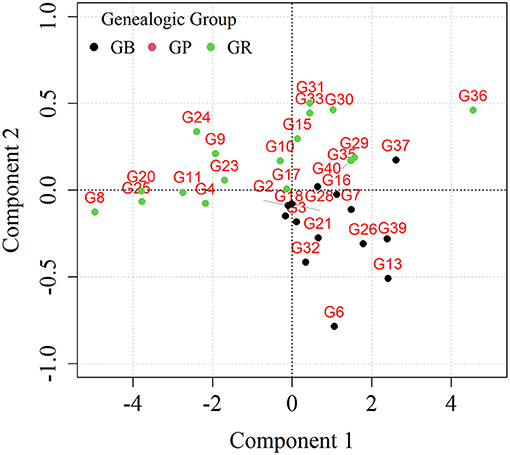
Figure 5. Graph of the PLS-DA scores of two components for the sensory attributes with the classifications of the genealogical groups. ( ) GB-Bourbon Group, (
 ) GR—Resistant Group (
 ) GP—Paraíso Germplasm.
According to the results presented in Table 3, it appears that two samples with genotype code from the GP were classified by the PLS-DA model as being from the GB genealogical group and five samples as being from the GR group. Therefore, of the seven total samples in the GP group, none were classified correctly. Then, the diagonal formed by the numbers 8, 0, 8 are the correct classifications of the PLS-DA model created.
Even though most of the samples were classified correctly, the model created still failed to correctly classify the genotypes of the Paraíso Germplasm (GP) group. It is important to point out that the accesses belonging to the Paraíso Germplasm group come from crossings between Yellow Catuaí and Timor Hybrid. Therefore, it appears that just like the group of cultivars resistant to rust (GR), the Paraíso germplasm group presents in its ancestry the germplasm Timor Hybrid, which may have made it difficult to separate these two groups.
Discussion
In this investigation, two multivariate analysis were employed to evaluate and discriminate elite genotypes, processed by the wet method (fully washed), for the sensory analysis of coffees, the PCA method and the PLS-DA method. These methods were applied together for the separation of C. arabica genealogical groups regarding the quality of the coffee beverage.
The PCA method identified the behavior of most of the genotypes with respect to analyzed variables. It is known that the chemical compounds of the raw coffee beans are important precursors of the aroma and flavor of roasted coffee (Fassio et al., 2019b). In addition, genetic variability influences both the chemical composition and the physical properties of coffee beans, and these, in turn, directly affects the cup quality (Scholz et al., 2013; Borém et al., 2016). In that regard, studying the trends of coffee genotypes in terms of beverage quality becomes essential for the development of cultivars with the most potential to produce specialty coffees (Fassio et al., 2019b).
The PCA was efficient in demonstrating an overview of the data, identifying the variables that most contributed to the analysis response. However, the PCA was not efficient to group genotypes according to their genealogical origin, based on chemometric data, as it is an unsupervised analysis. In a similar work, Malta et al. (2020), also observed that the PCA didn't presented detailed information about the differences between the group's accessions. Thus, PLS-DA method was requested as a useful tool for this proposal.
Through the PCA scores, it was possible to identify patterns between genotypes codes in relation to sensory attributes and, as reported by Borém et al. (2016) and Scholz et al. (2013), the chemical compounds from raw coffee beans are important precursors of other compounds formed in the roasting process that are relevant to the cup quality.
Since PCA is an unsupervised procedure, which does not imply the prior knowledge of genealogical groups, the PLS-DA procedure becomes a useful tool when one is interested in incorporating genealogical groups in the analysis. Figures 4, 5; Table 3 corroborate the efficiency of the method and similar discussions are raised by Malta et al. (2020).
The PLS-DA created model managed to correctly classify most genotypes of the Bourbon groups (GB) and Resistant group (GR). The GB was the one with the best classification by the PLS-DA created model; what denotes the stability of this germplasm to produce specialty coffees (Fassio et al., 2019b). It appears that although Bourbon cultivars are recognized for their potential for producing specialty coffees, there is variability within the GB to produce superior quality coffees, with genotypes having greater potential for this characteristic than others. The Bourbon cultivar is traditionally known for the production of specialty coffees, especially in conditions of high altitude and low temperature (Ferreira et al., 2012; Figueiredo et al., 2013; Borém et al., 2016). However, it is possible to observe that under the same edaphoclimatic conditions, other materials have the same potential, or higher, than Bourbon cultivars to produce specialty coffees, which can be used in breeding programs aimed at obtaining new cultivars with high quality potential.
Within the Bourbon group there are two important variations, Red Bourbon and Yellow Bourbon. Red Bourbon was introduced in Brazil because it is more productive than the Typica cultivar and is of good quality (Ferreira et al., 2012). The xanthocarpa form (yellow fruits) has its most probable origin by the mutation of Red Bourbon or by the recombination of the natural crossing between Red Bourbon and Botucatu Yellow (Carvalho, 2008). The Bourbon cultivar is recognized worldwide for its high potential in producing specialty coffees, for its sweet taste and characteristic aroma. It is relevant to observe that the good quality of new, more modern cultivars is often attributed, in part, to the very genetic makeup of the Bourbon cultivar, as it enters directly or indirectly into the genetic makeup of new cultivars (Malta et al., 2014).
Most of the improved, rust-resistant cultivars currently in cultivation have as their source of resistance the germplasm called the Timor Hybrid, selected by the Coffee Rust Research Center (CIFC), Oeiras-Portugal. The Timor Hybrid has its origin, possibly, in a natural cross between C. arabica x C. canephora (Setotaw et al., 2010). Due to its characteristics of similarity with the cultivars of C. arabica and, mainly, for its resistance to rust, the Timor Hybrid has always been seen as very promising for the improvement of coffee and, therefore, it is widely used to obtain rust-resistant coffee populations, such as Catimor, Sarchimor, Cavimor, Cachimor, Blumor, and others. Several investigations corroborate that the Timor Hybrid can also be used as a source of genes to improve other relevant characteristics, such as the coffee beverage quality (Carvalho, 2008; Setotaw et al., 2010; Sobreira et al., 2015; Fassio et al., 2019a; Malta et al., 2020).
Even though most of the samples were classified correctly, the model created has not yet managed to correctly classify the genotypes of the Paraíso germplasm group (GP). The accessions belonging to the Paraíso germplasm group come from crossings between Yellow Catuai and Timor Hybrid (Malta et al., 2014). Therefore, it appears that just like the group of cultivars resistant to rust (GR), the Paraíso germplasm group has in its ancestry the Timor Hybrid germplasm, which may have made it difficult to separate these two groups (Sobreira et al., 2015). The Paraíso Germplasm gave rise to the cultivars Paraíso MG H419-1 and more recently MGS Paraíso 2, recently launched by Epamig. The cultivar MGS Paraíso 2 has a high percentage of flat grains in the highest sieves, having, on average, four harvests, 67.9% in sieves 16 and above. The high quality of beverage in this cultivar has also aroused interest in coffee growers who are dedicated to the production of specialty coffees. The aroma is sweet, with red fruit flavor, pleasant acidity, velvety body, with great sweetness (Malta et al., 2014).
Conclusion
The PCA was effective in presenting an overview of the data, demonstrating the variables that most contributed to the analysis response. However, the PCA was not efficient to group genotypes according to their genealogical origin, based on chemometric data, as it is an unsupervised analysis. Even though most of the samples were classified correctly, the PLS-DA model created has not yet managed to correctly classify the genotypes of the Paraíso germplasm group (GP). The C. arabica L. elite genotypes evaluated have the potential to produce specialty coffees, especially on the genotypes Paraíso 2, H493-1-2-10 and UFV-7158, which presented final scores equal to or >90 points.
Data Availability Statement
The raw data supporting the conclusions of this article will be made available by the authors, without undue reservation.
Author Contributions
MM, AO, and GC contributed to conception and design of the study. AP, AS, LA, and GC organized the database. GL performed the statistical analysis. MM, AO, and GC wrote the first draft of the manuscript. MM, LA, AS, and DM wrote sections of the manuscript. All authors contributed to manuscript revision, read, and approved the submitted version.
Conflict of Interest
The authors declare that the research was conducted in the absence of any commercial or financial relationships that could be construed as a potential conflict of interest.
Acknowledgments
The authors would like to thank the Agricultural Research Agency of the State of Minas Gerais (EPAMIG), the Federal University of Lavras (UFLA), the Consórcio Pesquisa Café, the Foundation for Supporting Research of the State of Minas Gerais (FAPEMIG), the National Council for Scientific and Technological Development (CNPq) and the Coffee Innovation Agency (INOVACAFÉ).
References
Borém, F. M., Figueiredo, L. P., Ribeiro, F. C., Taveira, J. H. S., Giomo, G. S., and Salva, T. J. G. (2016). The relationship between organic acids, sucrose and the quality of specialty coffees. Afr. J. Agric. Res. 11, 709–717. doi: 10.5897/AJAR2015.10569
Carvalho, C. H. S. (2008). Cultivares de café: origem, características e recomendações. Brazilia: Embrapa.
Fassio, L. O., Malta, M. R.;, Carvalho, G. R., Pereira, A. A., Silva, A. D., Liska, G. R.;, Pedrosa, A. W.;, Ferraz, V. P., and Pereira, R. G. F. A. (2019b). Discrimination of genealogical groups of arabica coffee by the chemical composition of the beans. J. Agric. Sci. 11, 141–150. doi: 10.5539/jas.v11n16p141
Fassio, L. O., Pereira, R. G. F. A., Malta, M. R., Liska, G. R., Sousa, M. M. M., Carvalho, G. R., et al. (2019a). Sensory profile of arabica coffee accesses of the germplasm collection of Minas Gerais - Brazil. Coffee Sci. 14, 382–393. doi: 10.25186/cs.v14i3.1597
Ferreira, A. D., Mendes, A. N. G., Carvalho, G. R., Botelho, C. E., Gonçalves, F. M. A., and Malta, M. R. (2012). Análise sensorial de diferenets genótipos de cafeeiros bourbon. Interciencia 37, 390–394.
Figueiredo, L. P., Borém, F. M., Cirillo, M. Â., Ribeiro, F. C., Giomo, G. S., and Salva, T. J. G. (2013). The potential for high quality bourbon coffees from different environments. J. Agric. Sci. 5, 87–98. doi: 10.5539/jas.v5n10p87
Figueiredo, L. P., Borém, F. M., Ribeiro, F. C., Giomo, G. S., Taveira, J. H., da, S., et al. (2015). Fatty acid profiles and parameters of quality of specialty coffees produced in different Brazilian regions. Afr. J. Agric. Res. 10, 3484–3493. doi: 10.5897/AJAR2015.9697
Gimase, J. M., Thagana, W. M., Kirubi, D. T., Gichuru, E. K., and Kathurima, C. W. (2014). Beverage quality and biochemical attributes of arabusta coffee (C. arabica L. x C. canephora Pierre) and their parental genotypes. Afr. J. Food Sci. 8, 456–464. doi: 10.5897/AJFS2014.1132
Kathurima, C., Gichimu, B. M., Kenji, G. M., Muhoho, S. M., and Boulanger, R. (2009). Evaluation of beverage quality and green bean physical characteristics of selected Arabica coffee genotypes in Kenya. Afr. J. Food Sci. 3, 365–371.
Lingle, T. R. (2011). The Coffee Cupper's Handbook: A Systematic Guide to the Sensory Evaluation of Coffee's Flavor, 4th Edn. Long Beach, CA: Specialty Coffee Association of America.
Malta, M. R., Carvalho, G. R., Pereira, A. A., de Oliveira, A. C. B., Botelho, C. E., Fassio, L., et al. (2014). Potencial das novas cultivares de café Arábica para produção de cafés especiais. Informe Agropecuário 35, 84–90.
Malta, M. R., Fassio, L., de, O., Liska, G. R., Carvalho, G. R., Pereira, A. A., et al. (2020). Discrimination of genotypes coffee by chemical composition of the beans: potential markers in natural coffees. Food Res. Int. 134:109219. doi: 10.1016/j.foodres.2020.109219
R Development Core Team (2017). R. A Language and Environment for Statistical Computing. Available online at: http://www.r-project.org/ (accessed May 26, 2017).
Rohart, F., Gautier, B., Singh, A., Lê, and Cao, K. A. (2017). mixOmics: an R package for omics feature selection and multiple data integration. PLoS Comput. Biol. 13:e1005752. doi: 10.1371/journal.pcbi.1005752
Scholz, M. B., dos, S., de Figueiredo, V. R. G., da Silva, J. V. N., and Kitzberger, C. S. G. (2013). Sensory atributes and physico-chemical characteristics of the coffee beverage from the IAPAR cultivars. Coffee Sci. 8, 6–16. doi: 10.25186/CS.V8I1.297
Scholz, M. B. dos S., Kitzberger, C. S. G., Pagiatto, N. F., Pereira, L. F. P., Davrieux, F., Pot, D., et al. (2016). Chemical composition in wild ethiopian Arabica coffee accessions. Euphytica 209, 429–438. doi: 10.1007/s10681-016-1653-y
Setotaw, T. A., Caixeta, E. T., Pena, G. F., Zambolim, E. M., Pereira, A. A., and Sakiyama, N. S. (2010). Breeding potential and genetic diversity of “Híbrido do Timor” coffee evaluated by molecular markers. Crop Breed. Appl. Biotechnol. 10, 298–304. doi: 10.1590/S1984-70332010000400003
Sobreira, F. M., de Oliveira, A. C. B., Pereira, A. A., and Sakyiama, N. S. (2015). Potential of Híbrido de Timor germplasm and its derived progenies for coffee quality improvement. Aust. J. Crop Sci. 9, 289–295.
Taveira, J. H. S., Borém, F. M., Figueiredo, L. P., Reis, N., Franca, A. S., Harding, S. A., et al. (2014). Potential markers of coffee genotypes grown in different Brazilian regions: a metabolomics approach. Food Res. Int. 61, 75–82. doi: 10.1016/j.foodres.2014.02.048
Teressa, A., Crouzillat, D., Petiard, V., and Brouhan, P. (2010). Genetic diversity of Arabica coffee (Coffea arabica L.) collections. Ejast 1, 63–79.
Keywords: coffee breeding, coffee quality, post-harvest, multivariate analysis, chemometric analysis
Citation: Malta MR, Oliveira ACB, Liska GR, Carvalho GR, Pereira AA, Silva AD, Alvaro LN and Mota DM (2021) Selection of Elite Genotypes of Coffee arabica L. to Produce Specialty Coffees. Front. Sustain. Food Syst. 5:715385. doi: 10.3389/fsufs.2021.715385
Received: 26 May 2021; Accepted: 18 June 2021;
Published: 16 July 2021.
Edited by:
Herminia Prieto Martinez, Universidade Federal de Viçosa, BrazilReviewed by:
Adriana Silva Franca, Federal University of Minas Gerais, BrazilClaudio Horst Bruckner, Universidade Federal de Viçosa, Brazil
Copyright © 2021 Malta, Oliveira, Liska, Carvalho, Pereira, Silva, Alvaro and Mota. This is an open-access article distributed under the terms of the Creative Commons Attribution License (CC BY). The use, distribution or reproduction in other forums is permitted, provided the original author(s) and the copyright owner(s) are credited and that the original publication in this journal is cited, in accordance with accepted academic practice. No use, distribution or reproduction is permitted which does not comply with these terms.
*Correspondence: Marcelo Ribeiro Malta, marcelomalta.epamig@gmail.com