Associations between load-velocity profiling and race parameters of elite swimmers in the 100 and 200m freestyle events
 Yannis Raineteau
 Guillaume Nicolas
 Benoit Bideau
 Nicolas Bideau
 Robin Pla
- 1M2S Laboratory—Laboratoire Mouvement Sport Santé, Université Rennes 2, Rennes, France
- 2Optimization service, Fédération Française de Natation, Clichy, France
- 3MIMETIC-Team, INRIA Rennes Bretagne Atlantique, Rennes, France
Introduction: Improving swimming performance involves assessments of biomechanical variables of the stroke, and it can be achieved using semi-tethered swimming tests. The aim of this study was thus to investigate the associations between load-velocity (L-V) profiles, from a semi-tethered swimming protocol and race variables in the 100 m and 200 m freestyle events.
Methods: Eight swimmers completed a L-V profiling protocol consisting of four sprints (25 m, 25 m, 20 m, 15 m) against increasing loads (0.1, 2.0, 4.0, 6.0 kg respectively) with complete recovery between repetitions (>5 min). The L-V linear regression was used to estimate maximal velocity (V0) and body mass normalized load (rL0). Race variables such as clean swimming speed (V), stroke rate (SR), distance per cycle (SL) and stroke index (SI) were assessed from video analysis of 100 m and 200 m freestyle events taking place 3–4 days after the L-V protocol.
Results: L-V results showed high levels of speed (mean ± SD: 1.87 ± 0.04 m/s) and heavy maximal relative loads (mean ± SD: 38.5 ± 6.51 as % of body mass). Swimmers also achieved high-level performances in the 100 m (mean ± SD time: 51.95 ± 0.75 s) and the 200 m (mean ± SD time: 113.85 ± 2.67 s). For the 100 m events, the maximal relative load showed strong correlation with performance (r = 0.63) whereas trivial correlation was observed for the 200 m events (r = 0.12). SR on the 100 m and the 200 m also showed very strong association with rL0 (r = 0.83) and a strong association with V0 (r = 0.68) respectively.
Conclusion: The relationships between L-V variables and race variables depend on the distance of the event. However, L-V variables seem to be less related to SR and SL evolutions for the 100 m than in the 200 m event. Moreover, L-V profiles tend to be more related to the 100 m than 200 m freestyle performance. L-V profile should be interpreted taking into consideration the specific physiological and biomechanical constraints of the main events of the swimmer.
1. Introduction
For several years now, with the help of the development of new technologies, the number of studies related to the analysis of competitive swimming performance has increased (1). Some of the variables most commonly used to assess swimming performance include stroke variables such as stroke rate (SR) and distance per cycle (SL) (2–4). However, it is difficult for coaches to have additional monitoring tools during competition. That is why some testing evaluations are needed to assess swimming technique before competition (5).
Among the monitoring tools commonly used in swimming, semi-tethered methods represent a good way to assess biomechanical skills of the swimmers (6–8). Besides, the semi-tethered protocol allows to better understand propulsion (9) and active drag (10). More recently, with the help of technologies (i.e., speedometer and force transducer) resulting in the development of new devices (e.g., SwimOne; Sportmetrics S.L., Spain; 1080 Sprint, 1080 Motion, Lidingö, Sweden), some studies highlighted the possibilities of assessing dynamic variables with an easy and rapid feedback on the field (11–13). Other variables such as the intra-cycle velocity variations (IVV), which is associated to dynamic variables and especially to drag, can also be measured using such devices, providing important additional information (14, 15). Some other studies also investigated the relationships between both propulsive and resistive force, and swimming performance (16, 17). Load-velocity (L-V) profiles can provide information on these aspects of propulsive and resistive forces (9), mainly highlighted by variables such as estimated maximal tethered load (L0) and maximal velocity (V0). These variables correspond to the endpoints of the L-V linear regressions obtained from velocity measurements recorded on sprints against different resistances called “load” and applied with specific devices. Additionally, recent literature demonstrated the strong relationships of L-V profiles with dryland variables (18), and sprint performance (19, 20). Those same authors pointed out the importance of assessing drag and propelling efficiency, to have a complete profile of the swimmer technique. However, the relationships between L-V profile and performance in competition remain unclear.
In other sports such as running, rugby and soccer, force-velocity profiles are one of the major tools to monitor and guide training. By using force-velocity profiles, coaches can design more precise and individualized training programs for each athlete, following a fine-tune methodology (21). This interaction has already been described in other sports such as running and team sports (22–24). Such an individualized approach already demonstrated its efficacy in high level rugby athletes, who improved their capacities after a specific training guided by force-velocity profiles, with resisted or overspeed training (25). Although several studies have described some of these aspects, L-V profiling in swimming is a different concept and it seems important to study it in more detail on very high-level swimmers. The aim of this study was thus to investigate relationships between L-V profiles, evaluated using semi-tethered swimming, with 100 m and 200 m freestyle performances and stroke variables.
2. Methods
2.1. Participants
Eight male swimmers (18.6 ± 1.9 years, 74.5 ± 5.9 kg of body mass, 182.0 ± 2.9 cm of height) who were part of the same training group voluntarily participated in this study. They swam 1,844 km in the season during which the study was conducted. 62.5% of the annual swimming volume was performed at low intensity [blood lactate (La)b < 2 mmol·L−1], 20.5% at moderate intensity [(La)b between 2 and 4 mmol·L−1], and 17% at [La]b > 4 mmol·L−1 (26). The swimmers had at least 9 years of experience as competitive swimmers and their performance characteristics are presented in Table 1. Based on their personal best performances, seven swimmers can be classified as “level 2” and one as “level 1” (27). The study was conducted in agreement with the Declaration of Helsinki. After a comprehensive oral explanation, all participants signed an informed consent form to participate.
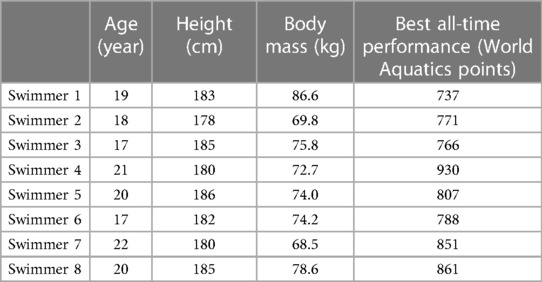
Table 1. Information and performance characteristics of the swimmers.
2.2. Experimental overview
The testing session took place before an international meeting. The L-V profiling was performed in a 25-m indoor swimming pool (air temperature: 25.1°C, water temperature: 28.5°C). Swimmers were equipped with their usual training suit. The testing session was conducted between 7:00 and 9:00 am on the same day for every swimmer. They performed an individualized warm-up of 20 min including 600 m at low intensity, 200 m of specific drills and three repetitions of short distances (20 m) at maximal speed. The competition took place 3 days (for the 100 m) and 4 days (for the 200 m) after the testing session. One swimmer did not take part in the 100 m freestyle event, and another swimmer did not take part in the 200 m freestyle event.
2.3. Testing session
The swimmers performed a resisted sprint protocol, using the 1080 motion (Lidingö, Sweden) allowing to complete a L-V profiling. The testing procedure was already described in a previous study (19). The protocol consisted of four all-out sprints: 25 m, 25 m, 20 m, and 15 m against increasing loads (0.1, 2.0, 4.0 and 6.0 kg respectively) with complete recovery (>5 min). Instantaneous speed was collected directly via the device for each imposed load. Regarding post-session data processing, average swimming velocities were computed using three cycles in the middle of the sprints. Maximum values of velocity (V0), body mass normalized load (rL0) and the Slope were computed using the L-V linear regression. Arm stroke Froude efficiency (ηF) was calculated using the following equation (28), assuming that the arm stroke contributed to 90% of the speed in a 25 m all-out sprint, as previously suggested (29, 30):
where v is the speed of the swimmer and vhand is the effective hand speed calculated according to a model proposed in a previous study (31). Finally, Intracycle Velocity Variation (IVV) was computed using this equation (32):
2.4. Video recording
During the competition, all the events were recorded with one fixed 1080p camera (Sony FDR AX700) in panoramic mode, which was positioned at the 25 m mark on the top of the stands and perpendicularly to the long axis of the pool. The sampling rate was 50 Hz. As described in a previous study (33), the video was then analyzed frame by frame using a dedicated software to calculate speed and stroke variables for the swimmer.
2.5. Data processing and analysis
Race analysis software (Actriss, Brest, France) was used for calibration and image processing as already described (4). Using manual digitalization with the lane markers located every five meters (34), the video analyst annotated the time when the head of the swimmer crossed each lane marker, and at the beginning of each cycle. To measure all stroke variables, the time, and points of the first and last arm entry for each lap was calculated, giving the beginning and the end of each “free-swimming” period, and allowing to compute clean swimming speed (V; swimming speed excluding underwater parts) as depicted in (33). This clean swimming speed (m/s) was determined by dividing the total distance covered during the free-swimming period per the time spent during that free-swimming period. SC is the total number of arm entries on the water surface. SL is calculated dividing the free-swimming distance by SC. SR is calculated dividing the free-swimming time by SC. SI is the product of the swimming speed (lap distance divided by lap time) and SL. We collected those stroke variables for each lap (one value per lap for each stroke parameter). For statistical analysis, we calculated an overall mean for the race for each stroke variable (using the mean of the two laps for the 100 m and the four laps for the 200 m). All analysis were conducted by the same experienced analyst who worked for the French swimming federation.
2.6. Statistical analyses
For all variables, descriptive statistics (mean, standard deviation, minimum, maximum and variation coefficient) were performed. Shapiro–Wilk test was used to verify the normality of the data. R coefficients of Pearson correlations were computed between L-V and race variables. We considered correlation threshold values of 0.1, 0.3, 0.5, 0.7, and 0.9 corresponding to small, moderate, strong, very strong, and nearly perfect correlations, respectively (35). Statistical significance of the data was assessed using the Student's t-test. Null hypothesis was rejected at p < 0.05. Statistical analyses were undertaken using the Rstudio software package (PBC, Boston, Massachusetts, USA).
3. Results
Swimmers performed an average time of 51.95 s (minimum: 50.89 s; maximum: 52.47 s) in the 100 m freestyle and 113.85 s (minimum: 109.55 s; maximum: 117.73 s) in the 200 m freestyle, corresponding to 90.3% and 89.6% to the current world records respectively.
Despite homogeneous results in competition, swimmers showed a wide range of L-V profiles (Figure 1). For a small range of V0 (between 1.80 m/s and 1.93 m/s), we observed a wide range of rL0 (from 0.30 to 0.50 kg/kg of body weight). V0 and IVV were the variables with the lowest coefficient of variation, reflecting more homogeneous results (Table 2). All stroke variables are presented for the 100 m and 200 m freestyle (Table 2). The values are the intra-individual averages of these variables over the whole race. We observed more variations of SL than SR during both the 100 m and 200 m freestyle events.
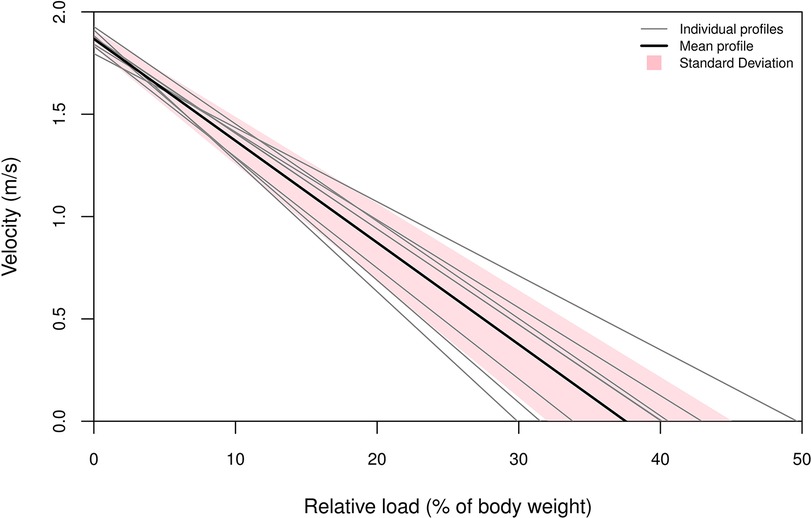
Figure 1. Results of individual load−velocity linear regressions, presenting also the inter-individual mean and standard deviation of the load-velocity group results.
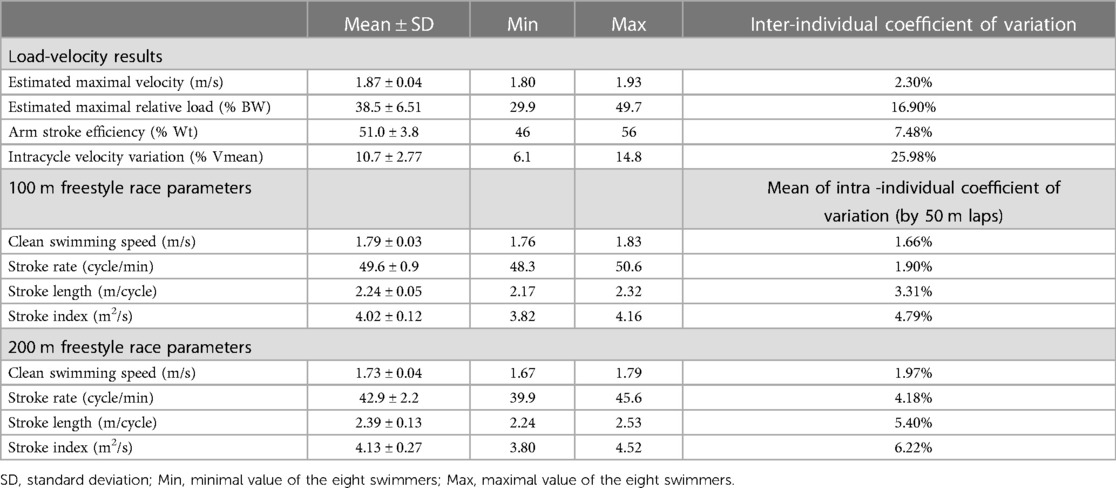
Table 2. Load-velocity results and race parameters.
Matrix of correlation (Figures 2A,B) described the relationships between L-V profiles and stroke variables for 100 m and 200 m freestyle respectively. V0 had a very strong correlation with SL on the 200 m but only small or moderate correlations were found between V0 and race variables on the 100 m. On another hand, rL0 had a very strong correlation with SR and a strong correlation with the clean swimming speed on the 100 m but only small or moderate correlations were found between rL0 and race variables on the 200 m. Figure 3 represented the profiles of two different swimmers with similar 100 m performances but with different hydrodynamic profiles.
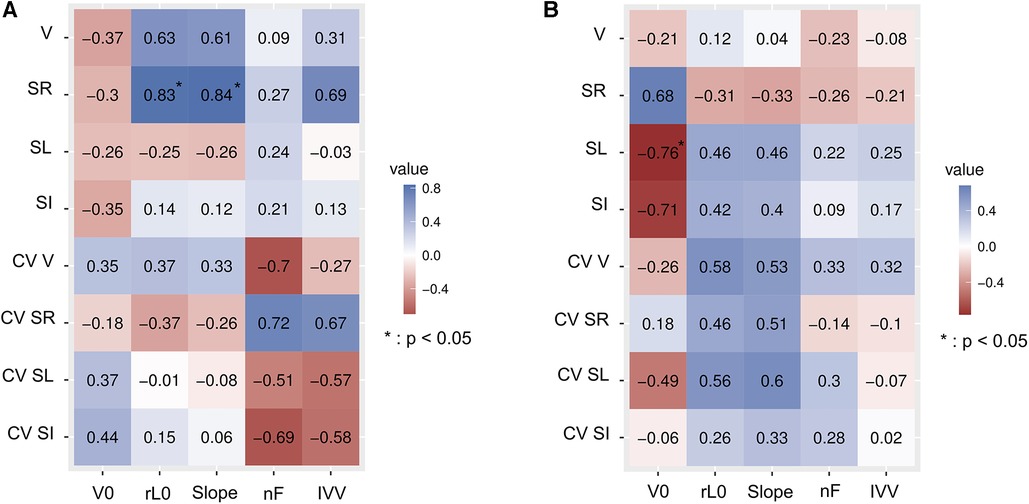
Figure 2. (A) R coefficients of Pearson correlations between 100 m race parameters and parameters obtained from the testing session. V, clean swimming speed; SR, stroke rate; SL, stroke length; SI, stroke index; CV, intra-individual coefficient of variation (for V, SR, SL and SI variables); V0, estimated maximal velocity; rL0, estimated maximal relative load; Slope, slope of the L-V linear regression; nF, arm stroke efficiency; IVV, intracycle velocity variation. (B) R coefficients of Pearson correlations between 200 m race parameters and parameters obtained from the testing session. V, clean swimming speed; SR, stroke rate; SL, stroke length; SI, stroke index; CV, intra-individual coefficient of variation (for V, SR, SL and SI variables); V0, estimated maximal velocity; rL0, estimated maximal relative load; Slope, slope of the L-V linear regression; nF, arm stroke efficiency; IVV, intracycle velocity variation.
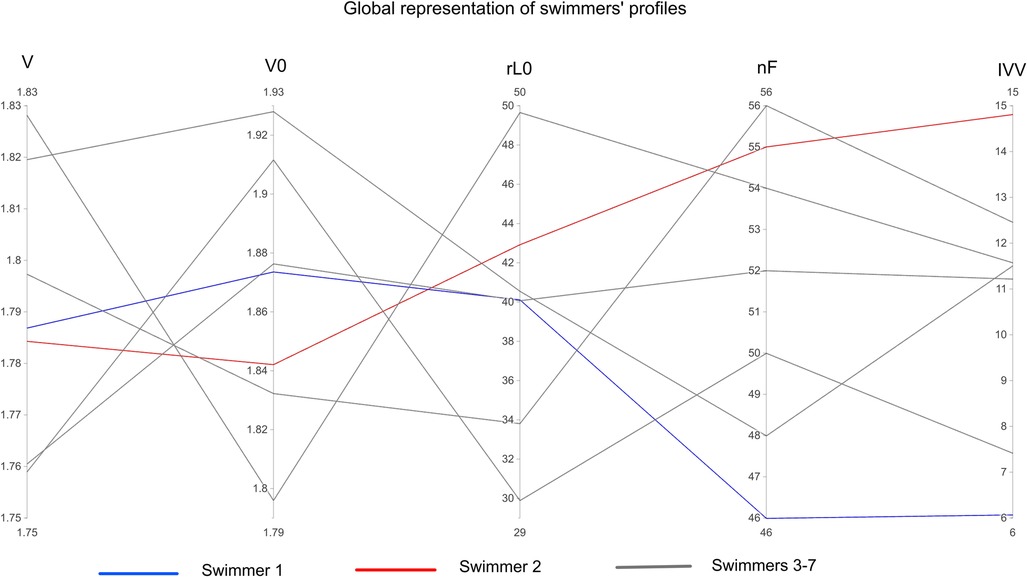
Figure 3. Global representation of swimmers’ profiles, considering the speed variable during the 100 m freestyle event and other variables from the testing session. Each line represents one swimmer. V, clean swimming speed during the 100 m (m/s); V0, estimation of maximal speed (m/s); rL0, estimation of maximal relative load (as % of body mass); ηF, arm stroke efficiency (as % of total arm stroke power production); IVV, intracycle velocity variation (as % of mean velocity).
4. Discussion
4.1. Originality of the study
This study is the first to describe associations between in-water L-V profiles and race variables of elite swimmers. The main findings suggest that V0 was not a good determinant of 100 m nor 200 m performance but was strongly related to race kinematics (SL, SR, and SI) whereas rL0 was strongly correlated with the performance on the 100 m. This study is also the first to present L-V profiles of swimmers of such level. Indeed, our results showed higher values of V0 and rL0, compared to previous work on elite swimmers (20). Moreover, these results highlighted a more homogeneous group with a lower CV for V0 and rL0 variables. We also observed different findings regarding the correlations between L-V results and the swimming speed compared to the above-mentioned study, both rL0 and V0 showing lower association with performance in the present study. The expression of performance (i.e., clean swimming speed vs. total mean speed) and the distance evaluated (i.e., 100 & 200 m vs. 50 m) differed between the two studies [i.e., the present one and (20) respectively] which could explain the different results.
4.2. Relationships between load-velocity results and race variables
Correlations between L-V results and race variables also differed between the two distances evaluated in the present study. The greater the distance, the more stroke variables are associated with V0 (Figure 2). This can be explained by the fact that both distances require specific physiological and biomechanical abilities (1). However, V0 was not correlated with 100 m and 200 m performance. For 100 m, we observed a strong correlation between V and rL0 and a very strong correlation between SR and rL0. This in line with a previous study (36) which showed similar results, highlighting a strong correlation between mean force values during 30 s tethered swimming and 100 m performance (r = 0.72). Moreover, the association between rL0 and SR in the 100 m could be explained by the ability of short-distance swimmers to produce more force and power, and probably to maintain a higher SR (37). Other studies also showed that an improvement of SR and velocity could occur after a strength training program (38). Moreover, we already know that elite swimmers demonstrate a higher SR than the others, and it is associated with high propulsive phase and by the stability of these values during the race (39).
4.3. Relationships between race variables changes and load-velocity results
Correlations between the different biomechanical variables and variations of speed and stroke variables over races support this observation. We observed that ηF in the testing session presented a negative correlation with variations of speed in the 100 m, while it was positively correlated with variations of SR in the same event. We can then deduce that the most efficient swimmers seem to maintain their speed all along the 100 m distance using the ability to adjust their SR. For comparison, a previous study showed that the fastest swimmers in the 100 m freestyle were characterized by the capacity to maintain their stroke variables throughout the race (40). The results of this study differ slightly from ours, but it should be noted that the considered variables are not the same (i.e., efficiency vs. velocity). Indeed, ideally the ability to swim fast arises from the capacity: (i) to produce a high mechanical power output enabling the generation of high propulsive force; (ii) to reduce drag; (iii) to perform at a high efficiency (41). Moreover, some studies showed most efficient swimmers are also more economical (42) which may be beneficial to maintain speed throughout 200 m but also 100 m.
The relationships between evolutions of speed and stroke variables with biomechanical variables such as the tethered force were also investigated by some authors (43) who have shown a strong correlation (r = 0.62) between the peak force (Fpeak) and the relative changes in velocity during the 100 m freestyle. We found a lower association between rL0 and velocity variations over the 100 m. We speculate that the difference in results is given to the different dynamic parameters measured in both our study (rL0) and the above-mentioned study (Fpeak), suggesting that rL0 would reflect different qualities compared to Fpeak.
4.4. Profile overview
This hypothesis may be supported by the case study of two swimmers who achieved similar 100 m freestyle performances (i.e., 49.04 and 49.37 s, cf. Figure 3). They also had similar L-V results, yet each had very different hydrodynamic profiles representing for some variables the opposite extreme values measured on this group. Indeed, we can see that swimmer 1 is able to compensate for its lower propulsive efficiency with lower IVV and therefore lower active drag as assumed (15). This highlights the importance of combining measurements, to assess kinematic and dynamic variables in swimming.
4.5. Limitations
These results must be considered acknowledging the potential shortcomings of this study. First, the number of participants was limited, and the population included only male swimmers, for which we have only analyzed their races in front crawl. Moreover, the evaluation and the competition occur at a time of their season when they were not in their best shape, and the group's coach had not tapered them to perform at this competition. All these reasons may have counterbalanced some conclusions of this study.
5. Practical applications
The findings of this study propose implications for coaches who are sensitive to the assessment of swimmers' technique during training periods. L-V profiling, and the biomechanical variables derived from it, can help to evaluate technique, track changes for stroke variables and identify areas for improvement in both propulsion and technical aspects of front crawl. Then, profiling the swimmer through this semi-tethered sprint protocol provides a comprehensive swimmer's identity card. Furthermore, maximal relative load representing high degree of resistive swimming and being associated with performance on several distances could justify the use of in-water resistance workouts.
6. Conclusion
This study shows associations between L-V profiles and race spatio-temporal variables on a small group of swimmers. Those insights revealed the importance to consider a wide range of biomechanical variables when assessing a swimmer's profile. This study also highlighted the diversity of each race distance in many aspects, which seems to have an impact on the relationship between L-V profiling results and race variables.
Data availability statement
The raw data supporting the conclusions of this article will be made available by the authors, without undue reservation.
Ethics statement
The studies involving humans were approved by Comité de Protection des Personnes—Sud Méditerrané 1. The studies were conducted in accordance with the local legislation and institutional requirements. Written informed consent for participation in this study was provided by the participants’ legal guardians/next of kin.
Author contributions
YR: Formal analysis, Investigation, Methodology, Visualization, Writing – original draft. GN: Methodology, Funding acquisition, Writing – review & editing. BB: Funding acquisition, Writing – review & editing. NB: Methodology, Funding acquisition, Writing – review & editing. RP: Formal analysis, Investigation, Methodology, Resources, Writing – original draft.
Funding
The author(s) declare financial support was received for the research, authorship, and/or publication of this article.
This work was supported by the ANR within the framework of the PIA EUR DIGISPORT project (ANR-18-EURE-0022) and the Neptune project (ANR-19-STPH-004).
Acknowledgments
We would like to thank the swimmers who took part in this study and the coach who made the measurements possible. We would also like to thank the French swimming federation, EUR Digisport and the NePTUNE Project for the support.
Conflict of interest
The authors declare that the research was conducted in the absence of any commercial or financial relationships that could be construed as a potential conflict of interest.
Publisher's note
All claims expressed in this article are solely those of the authors and do not necessarily represent those of their affiliated organizations, or those of the publisher, the editors and the reviewers. Any product that may be evaluated in this article, or claim that may be made by its manufacturer, is not guaranteed or endorsed by the publisher.
References
1. Gonjo T, Olstad BH. Race analysis in competitive swimming: a narrative review. Int J Environ Res Public Health. (2020) 18(1):69. doi: 10.3390/ijerph18010069
2. Craig AB, Skehan PL, Pawelczyk JA, Boomer WL. Velocity, stroke rate, and distance per stroke during elite swimming competition. Med Sci Sports Exerc. (1985) 17(6):625–34. doi: 10.1249/00005768-198512000-00001
3. Huot-Marchand F, Nesi X, Sidney M, Alberty M, Pelayo P. Swimming: variations of stroking parameters associated with 200m competitive performance improvement in top-standard front crawl swimmers. Sports Biomech. (2005) 4(1):89–100. doi: 10.1080/14763140508522854
4. Hellard P, Dekerle J, Avalos M, Caudal N, Knopp M, Hausswirth C. Kinematic measures and stroke rate variability in elite female 200-m swimmers in the four swimming techniques: athens 2004 Olympic semi-finalists and French national 2004 championship semi-finalists. J Sports Sci. (2008) 26(1):35–46. doi: 10.1080/02640410701332515
5. Barbosa TM, Barbosa AC, Simbaña Escobar D, Mullen GJ, Cossor JM, Hodierne R, et al. The role of the biomechanics analyst in swimming training and competition analysis. Sports Biomech. (2021) 1–18:1. doi: 10.1080/14763141.2021.1960417
6. Clarys JP. The Brussels swimming EMG project. In: Ungerechts BE, Wilke K, Reischle K, Hrsg. Swimming science V. Human kinetics books. Champaign: Human Kinetics (1988). p. 157–72. (International Series of Sport Sciences; vol. 18).
7. Shionoya A. Development of ergometer attachment for power and maximum anaerobic power measurement in swimming. Appl Human Sci. (1999) 18(1):13–21. doi: 10.2114/jpa.18.13
8. Klauck JM, Ungerechts BE. Swimming power output measurement in a flume vs. power transfer in swimming using external weights—a comparison of devices. Proceedings XII FINA World Congress on Sports Medicine; April 1997; Göteborg, Sweden (1997). p. 291–7.
9. Dominguez-Castells R, Arellano R. Effect of different loads on stroke and coordination parameters during freestyle semi-tethered swimming. J Hum Kinet. (2012) 32(2012):33–41. doi: 10.2478/v10078-012-0021-9
10. Gonjo T, Olstad BH. Reliability of the active drag assessment using an isotonic resisted sprint protocol in human swimming. Sci Rep. (2022) 12(1):13085. doi: 10.1038/s41598-022-17415-5
11. Hermosilla F, Corral-Gómez L, González-Ravé JM, Juárez Santos-García D, Rodríguez-Rosa D, Juárez-Pérez S, et al. Swimone. New device for determining instantaneous power and propulsive forces in swimming. Sensors. (2020) 20(24):7169. doi: 10.3390/s20247169
12. Dominguez-Castells R, Izquierdo M, Arellano R. An updated protocol to assess arm swimming power in front crawl. Int J Sports Med. (2012) 34(04):324–9. doi: 10.1055/s-0032-1323721
13. Olstad BH, Gonjo T, Njøs N, Abächerli K, Eriksrud O. Reliability of load-velocity profiling in front crawl swimming. Front Physiol. (2020) 11:574306. doi: 10.3389/fphys.2020.574306
14. Fernandes A, Afonso J, Noronha F, Mezêncio B, Vilas-Boas JP, Fernandes RJ. Intracycle velocity variation in swimming: a systematic scoping review. Bioengineering. (2023) 10(3):308. doi: 10.3390/bioengineering10030308
15. Barbosa TM, Costa MJ, Morais JE, Morouço P, Moreira M, Garrido ND, et al. Characterization of speed fluctuation and drag force in young swimmers: a gender comparison. Hum Mov Sci. (2013) 32(6):1214–25. doi: 10.1016/j.humov.2012.07.009
16. Schreven S, Smeets JBJ, Beek PJ. Sprint performance in arms-only front crawl swimming is strongly associated with the power-to-drag ratio. Front Sports Act Living. (2022) 4:758095. doi: 10.3389/fspor.2022.758095
17. Kolmogorov SV, Duplishcheva OA. Active drag, useful mechanical power output and hydrodynamic force coefficient in different swimming strokes at maximal velocity. J Biomech. (1992) 25(3):311–8. doi: 10.1016/0021-9290(92)90028-Y
18. Cuenca-Fernández F, Gay A, Ruiz-Navarro JJ, Arellano R. The effect of different loads on semi-tethered swimming and its relationship with dry-land performance variables. Int J Perform Anal Sport. (2020) 20(1):90–106. doi: 10.1080/24748668.2020.1714413
19. Gonjo T, Eriksrud O, Papoutsis F, Olstad BH. Relationships between a load-velocity profile and sprint performance in butterfly swimming. Int J Sports Med. (2020) 41(07):461–7. doi: 10.1055/a-1103-2114
20. Gonjo T, Njøs N, Eriksrud O, Olstad BH. The relationship between selected load-velocity profile parameters and 50m front crawl swimming performance. Front Physiol. (2021) 12:625411. doi: 10.3389/fphys.2021.625411
21. Balsalobre-Fernández C, Torres-Ronda L. The implementation of velocity-based training paradigm for team sports: framework, technologies. Practical recommendations and challenges. Sports. (2021) 9(4):47. doi: 10.3390/sports9040047
22. Jiménez-Reyes P, Cross M, Ross A, Samozino P, Brughelli M, Gill N, et al. Changes in mechanical properties of sprinting during repeated sprint in elite rugby sevens athletes. Eur J Sport Sci. (2019) 19(5):585–94. doi: 10.1080/17461391.2018.1542032
23. Jiménez-Reyes P, Garcia-Ramos A, Párraga-Montilla JA, Morcillo-Losa JA, Cuadrado-Peñafiel V, Castaño-Zambudio A, et al. Seasonal changes in the sprint acceleration force-velocity profile of elite male soccer players. J Strength Cond Res. (2022) 36(1):70–4. doi: 10.1519/JSC.0000000000003513
24. Cross MR, Lahti J, Brown SR, Chedati M, Jimenez-Reyes P, Samozino P, et al. Training at maximal power in resisted sprinting: optimal load determination methodology and pilot results in team sport athletes. PLoS One. (2018) 13(4):e0195477. (Sandbakk Ø, editor). doi: 10.1371/journal.pone.0195477
25. Lahti J, Jiménez-Reyes P, Cross MR, Samozino P, Chassaing P, Simond-Cote B, et al. Individual sprint force-velocity profile adaptations to in-season assisted and resisted velocity-based training in professional rugby. Sports. (2020) 8(5):74. doi: 10.3390/sports8050074
26. Hellard P, Avalos-Fernandes M, Lefort G, Pla R, Mujika I, Toussaint JF, et al. Elite swimmers’ training patterns in the 25 weeks prior to their season’s best performances: insights into periodization from a 20-years cohort. Front Physiol. (2019) 10:363. doi: 10.3389/fphys.2019.00363
27. Ruiz-Navarro JJ, López-Belmonte Ó, Gay A, Cuenca-Fernández F, Arellano R. A new model of performance classification to standardize the research results in swimming. Eur J Sport Sci. (2023) 23(4):478–88. doi: 10.1080/17461391.2022.2046174
28. Peterson Silveira R, Soares SM, Zacca R, Alves FB, Fernandes RJ, De Souza Castro FA, et al. A biophysical analysis on the arm stroke efficiency in front crawl swimming: comparing methods and determining the main performance predictors. Int J Environ Res Public Health. (2019) 16(23):4715. doi: 10.3390/ijerph16234715
29. Deschodt VJ, Arsac LM, Rouard AH. Relative contribution of arms and legs in humans to propulsion in 25-m sprint front-crawl swimming. Eur J Appl Physiol. (1999) 80(3):192–9. doi: 10.1007/s004210050581
30. Peterson Silveira R, De Souza Castro FA, Figueiredo P, Vilas-Boas JP, Zamparo P. The effects of leg kick on swimming speed and arm-stroke efficiency in the front crawl. Int J Sports Physiol Perform. (2017) 12(6):728–35. doi: 10.1123/ijspp.2016-0232
31. Martin RB, Yeater RA, White MK. A simple analytical model for the crawl stroke. J Biomech. (1981) 14(8):539–48. doi: 10.1016/0021-9290(81)90003-8
32. Schnitzler C, Seifert L, Alberty M, Chollet D. Hip velocity and arm coordination in front crawl swimming. Int J Sports Med. (2010) 31(12):875–81. doi: 10.1055/s-0030-1265149
33. Pla R, Poszalczyk G, Souaissia C, Joulia F, Guimard A. Underwater and surface swimming parameters reflect performance level in elite swimmers. Front Physiol. (2021) 12:712652. doi: 10.3389/fphys.2021.712652
34. Veiga S, Roig A. Underwater and surface strategies of 200m world level swimmers. J Sports Sci. (2016) 34(8):766–71. doi: 10.1080/02640414.2015.1069382
35. Hopkins WG, Marshall SW, Batterham AM, Hanin J. Progressive statistics for studies in sports medicine and exercise science. Med Sci Sports Exerc. (2009) 41(1):3–12. doi: 10.1249/MSS.0b013e31818cb278
36. Morouço PG, Vilas-Boas JP, Fernandes RJ. Evaluation of adolescent swimmers through a 30-s tethered test. Pediatr Exerc Sci. (2012) 24(2):312–21. doi: 10.1123/pes.24.2.312
37. Carvalho DD, Soares S, Zacca R, Marinho DA, Silva AJ, Pyne DB, et al. In-water and on-land swimmers’ symmetry and force production. Int J Environ Res Public Health. (2019) 16(24):5018. doi: 10.3390/ijerph16245018
38. Lopes TJ, Neiva HP, Gonçalves CA, Nunes C, Marinho DA. The effects of dry-land strength training on competitive sprinter swimmers. J Exerc Sci Fit. (2021) 19(1):32–9. doi: 10.1016/j.jesf.2020.06.005
39. Seifert L, Chollet D, Chatard JC. Kinematic changes during a 100-m front crawl: effects of performance level and gender. Med Sci Sports Exerc. (2007) 39(10):1784–93. doi: 10.1249/mss.0b013e3180f62f38
40. Chollet D, Delaplace C, Pelayo P, Tourny C, Sidney M. Stroking characteristic variations in the 100-M freestyle for male swimmers of differing skill. Percept Mot Skills. (1997) 85(1):167–77. doi: 10.2466/pms.1997.85.1.167
41. Toussaint HM, Hollander P, Berg C, Vorontsov A. Biomechanics of swimming. Exercise and sport science. Philadelphia, USA: W. E. Garrett & D. T. Kirkendall (2000). 639–60.
42. Prampero PE, Pendergast D, Zamparo P. Swimming economy (energy cost) and efficiency. In: Seifert L, Chollet D, Mujika I, editors. World book of swimming: From science to performance. New York, USA: Nova Science Publishers Inc (2011). p. 297–312.
Keywords: swimming technique, propulsion, stroke regulation, load-velocity profiles, competitive swimming
Citation: Raineteau Y, Nicolas G, Bideau B, Bideau N and Pla R (2023) Associations between load-velocity profiling and race parameters of elite swimmers in the 100 and 200m freestyle events. Front. Sports Act. Living 5:1326106. doi: 10.3389/fspor.2023.1326106
Received: 22 October 2023; Accepted: 30 November 2023;
Published: 14 December 2023.
Edited by:
Ricardo J. Fernandes, University of Porto, PortugalReviewed by:
Daniel J. Daly, KU Leuven, BelgiumAna Gay, University of Granada, Spain
Guilherme Tucher, Federal University of Rio de Janeiro, Brazil
© 2023 Raineteau, Nicolas, Bideau, Bideau and Pla. This is an open-access article distributed under the terms of the Creative Commons Attribution License (CC BY). The use, distribution or reproduction in other forums is permitted, provided the original author(s) and the copyright owner(s) are credited and that the original publication in this journal is cited, in accordance with accepted academic practice. No use, distribution or reproduction is permitted which does not comply with these terms.
*Correspondence: Yannis Raineteau yannis.raineteau@outlook.fr
†These authors have contributed equally to this work