Phosphorus Stock Depletion and Soil C:N:P Stoichiometry Under Annual Crop Rotations and Grassland Management Systems Over 13 Years
 André Somavilla1,2
  Laurent Caner2
  Isley Cristiellem Bicalho da Silva1 Danilo dos Santos Rheinheimer1
  Abad Chabbi3,4*
- 1Department of Soil Science, Universidade Federal de Santa Maria, Santa Maria, Brazil
- 2IC2MP-HydrASA UMR 7285, Université de Poitiers, Poitiers, France
- 3INRAE, Versailles-Grignon, UMR ECOSYS, Bâtiment EGER, Thiverval-Grignon, France
- 4INRAE, Centre de recherche Nouvelle-Aquitaine-Poitiers, URP3F, Lusignan, France
Phosphorus (P) nutrition is essential to both plant yield and soil organic matter (SOM) input. However, continuous extraction of P by plants and biomass harvesting can lead to soil P stock depletion, a reduction in crop yields and ultimately a reduction in organic matter input to the soil. In this work, we analysed P, C and N stock trends in the 0-30 cm topsoil layer cultivated with permanent cropland (CC) and mowed permanent grassland (GG) for 13 years. In addition, we characterized the changes in P organic forms by using 31P-NMR. The results showed that the amount of P exported within 13 years was 10% greater in GG than in CC (295 and 268 kg ha-1, respectively). The total P stocks decreased under both the CC and GG management systems (0.30 and 0.25 Mg ha-1, respectively). This depletion was mainly observed in total Pi forms, which recorded reductions of 0.75 and 0.29 Mg ha-1 in GG and CC, respectively. The total Po stock increased by 42.6% in GG; these results were consistent with the increase in C and N stocks in GG (2.6 and 0.19 Mg ha-1, respectively) and their reduction in CC (-4.2 and -0.38 Mg ha-1, respectively). Although P depletion mainly affected the P pool presenting the highest lability (labile P), this depletion did not have a negative effect on plant yield after 13 years due to the buffering capacity of P pools presenting less lability (moderately labile P). Mowing permanent grasslands led to a change in the pool of labile P from inorganic to organic forms and an increase in soil C and N stocks. Based on the 31P-NMR technique, permanent grasslands significantly reduced α-glycerophosphate and increased myo-IHP and adenosine monophosphate more than the permanent cropland. Although there was no significant decrease in productivity, the depletion of available P should be monitored over time, especially in mown permanent grassland crops, to prevent potential nutrient stress.
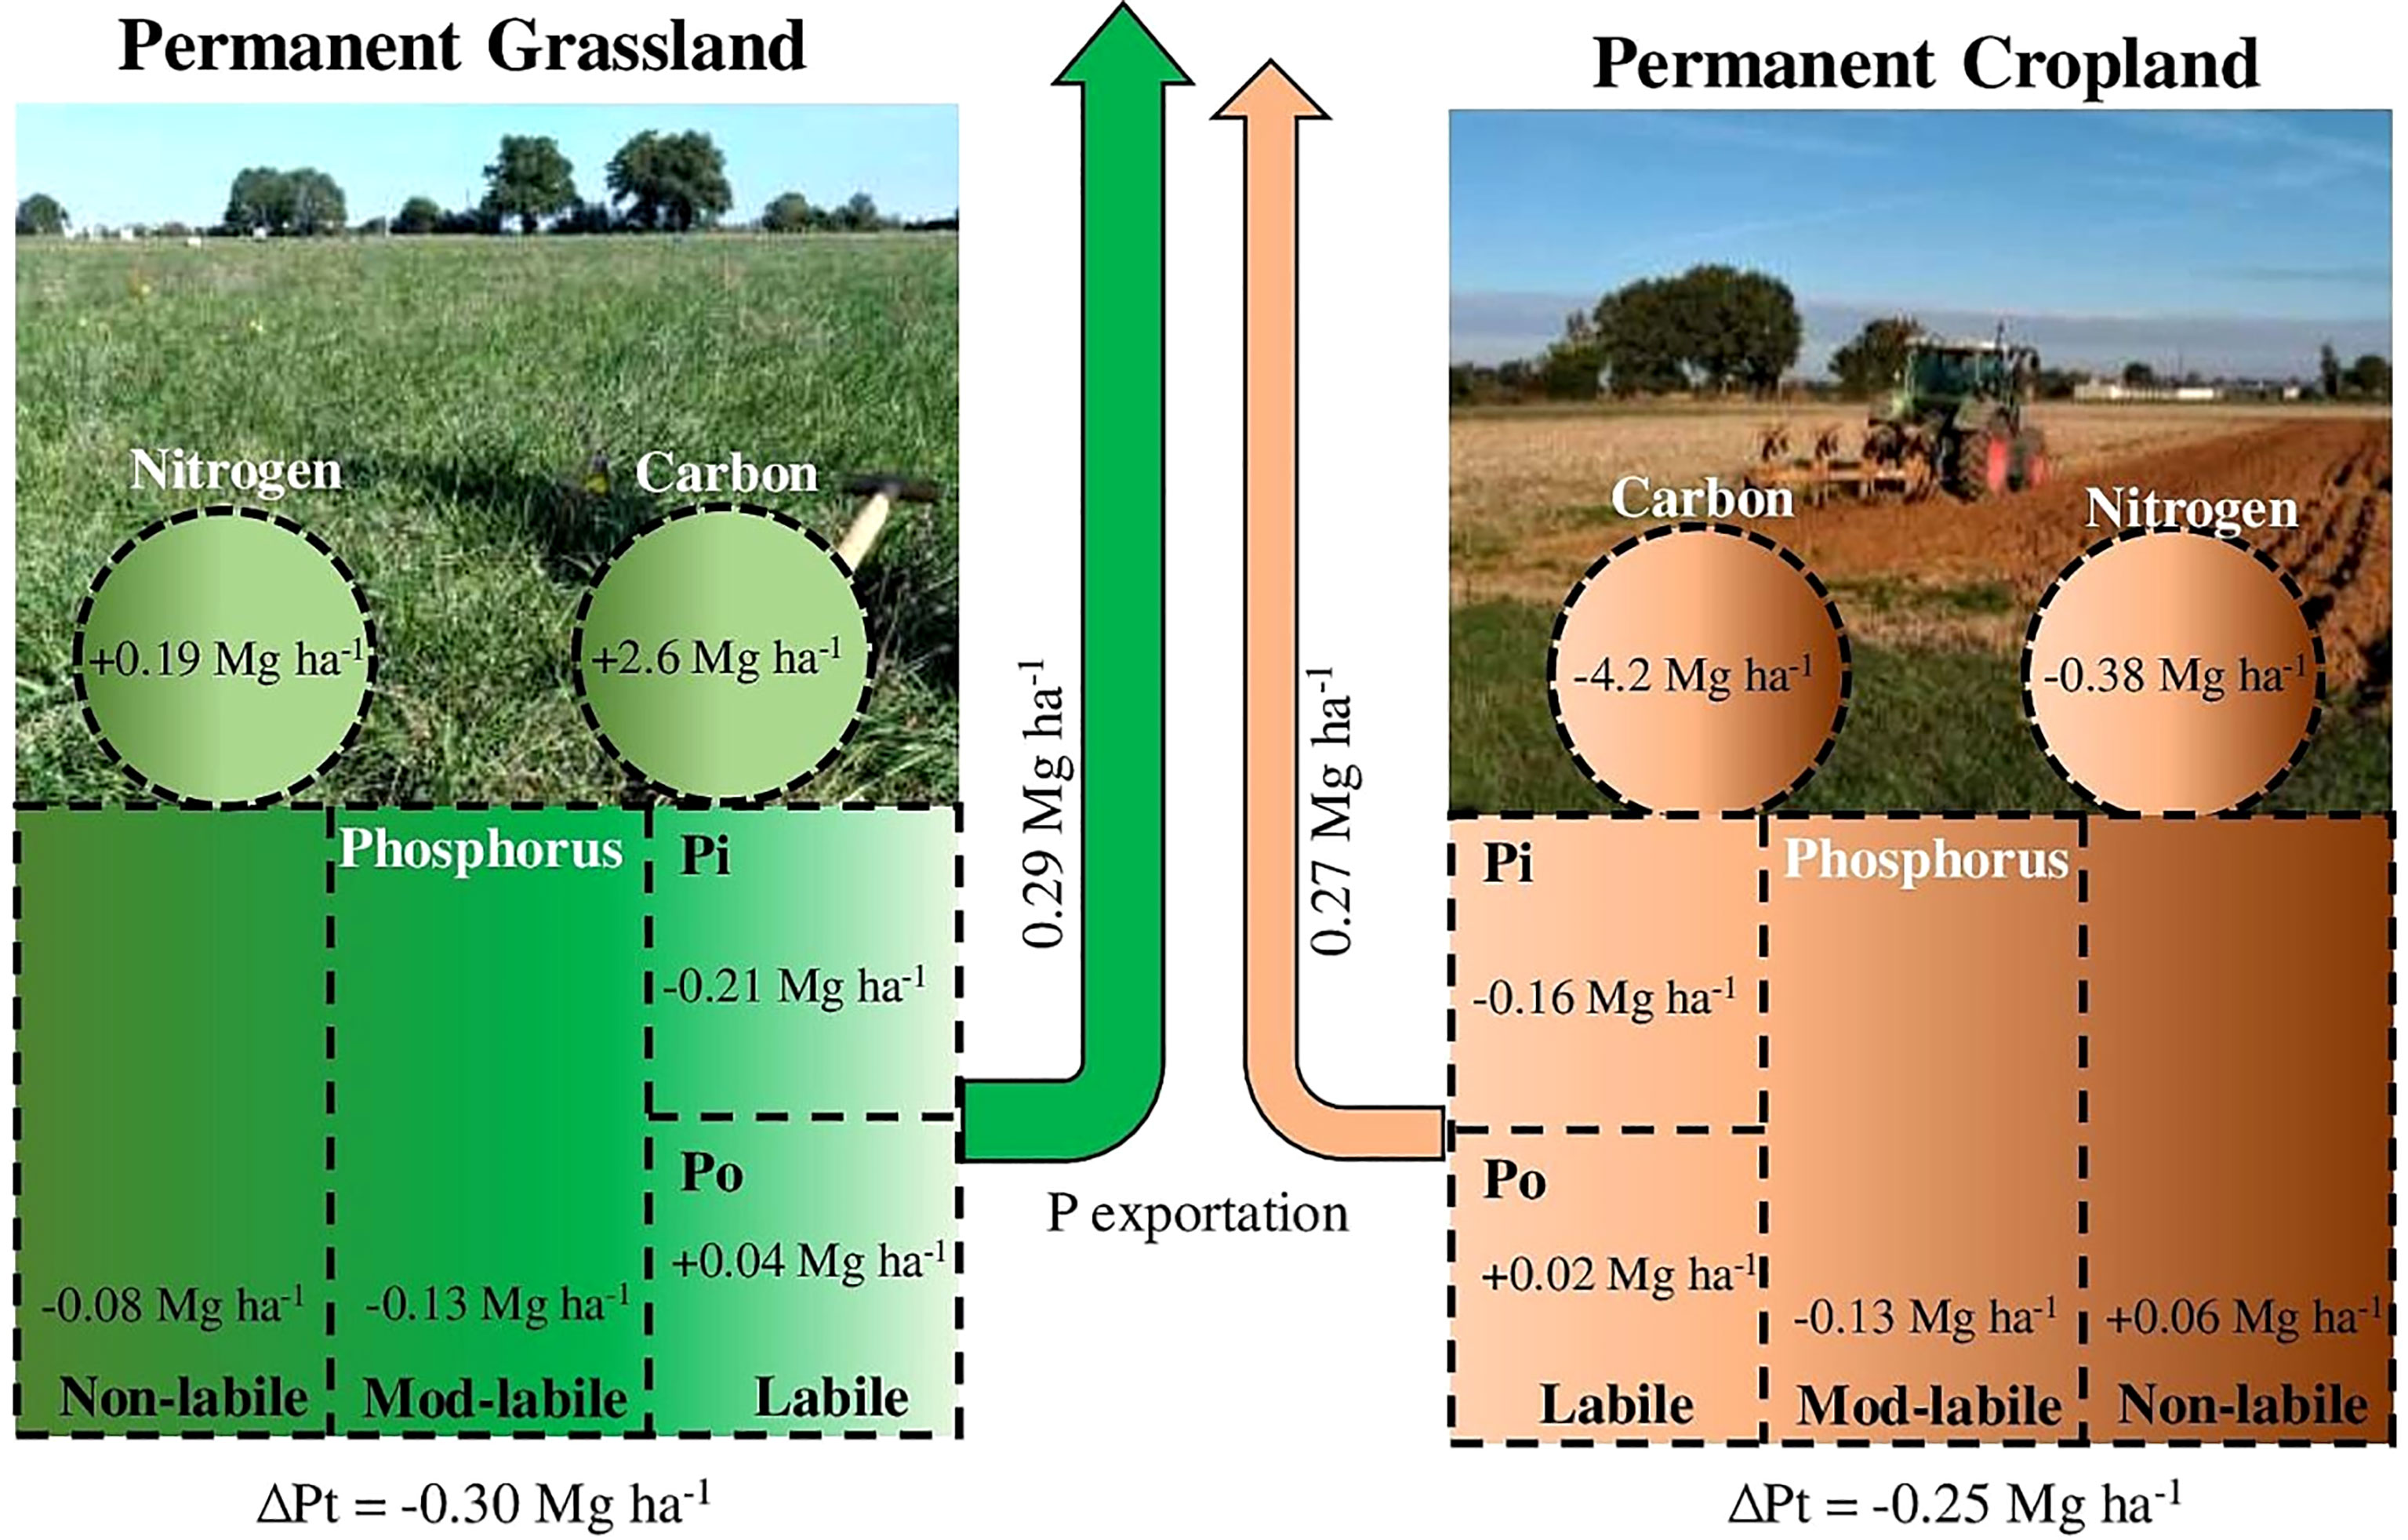
Graphical Abstract
Introduction
Phosphorus (P) is a key element in all life cycles (1); it comprises approximately 0.2% of plant dry matter (2) and is a constituent of proteins and nucleic acids, in addition to participating in energy transfer in plants and animals (1, 3). Consequently, P nutrition is essential for enabling plants to incorporate carbon (C), produce dry matter and increase soil C stocks (i.e., soil organic matter (SOM)). P uptake occurs through the root system; therefore, satisfactory maintenance of soil P availability is essential for plant growth (4, 5). Soil P is found in inorganic (Pi) and organic (Po) forms. Inorganic P forms include the orthophosphates and in soil solution. They bind to cations, such as calcium, and form geogenic or anthropogenic calcium phosphates. Furthermore, they are adsorbed by the inner sphere of functional groups of clay minerals and of Fe and Al oxyhydroxides (6, 7). Organic P binds to two different carbon atoms to primarily form orthophosphate monoesters (e.g., inositol phosphates and adenosine monophosphate) and orthophosphate diesters (e.g., nucleic acids and phospholipids) that constitute soil organic matter and soil microbial biomass (8–10).
Both P forms are simultaneously found in the soil, but they have different availabilities for plant uptake (P lability). P availability quantification is commonly assessed through sequential extractions with chemical reagents that have increasing extraction force (e.g., sequential extraction proposed by Hedley (11)) and through grouping into P pools, namely, labile P, moderately labile P and nonlabile P. Plants uptake P coming from the most available P pool (labile), which is buffered by that presenting less lability (12). In addition, the turnover of each P pool decreases as P lability decreases, which can take from minutes to hundreds of years (13). Thus, soil P depletion due to agricultural activity is expected to be noticeable in most labile pools in the short term, and in the medium to long term in less labile pools. Available P buffering varies depending on the soil type and the adopted management system (14). Soils from tropical regions, which present high weathering intensity, may present high legacy P but low P availability to plants due to high P adsorption to the soil minerals (15, 16). However, P availability in temperate soils is facilitated by soil mineralogy resulting from lower pedogenic evolution compared to tropical soils.
Although P is mainly absorbed by plants in its orthophosphate ion form (2), the presence of Po in the soil is remarkably important to reduce P inner-sphere adsorption to clay minerals and oxides and to mobilize recalcitrant P (15, 17–19). Pi transformation into Po occurs when plants and microorganisms mobilize Pi into their tissues. Some plant species (e.g., Lolium sp. and Lupinus sp.) can mine and remobilize P by incorporating it into their tissues when grown in soil with a high P stock where most P is adsorbed to the inorganic constituent by inner-sphere complexation (20, 21). P returns to the soil after plant death, mainly when its organic form returns to SOM. Therefore, the presence of Pi or Po in the soil is determined by the SOM content, which can be changed depending on the adopted soil management system (22, 23). The cultivation of annual crops based on soil ploughing decreases SOM (24, 25), even with NPK fertilization (22, 26). However, varying the species of cultivated plants, such as the introduction of legume plants in the production system, favours SOM and coupling processes involving P, C and N cycles (22, 27, 28). Moreover, soils cultivated for pasture that are NPK fertilized can increase, or preserve, SOM stocks over time (29); consequently, they tend to preserve the Po content and the coupling of the C:N:P ratio. Changes in the stoichiometry C:N:P can be indicative of nutrient restriction and the disbalance of the system equilibrium (30).
SOM dynamics are a key factor driving cycles and balancing C, N and P and are directly dependent on the adopted soil management system. The Po mineralization step before P uptake by plants is necessary, but this process changes depending on the recalcitrance of the organic compound. Accordingly, orthophosphate monoesters have lower turnover than orthophosphate diesters due to their chemical bonding to soil colloids (19, 31). This behaviour may induce higher accumulation of the Po form of monoesters than the diesters form in SOM. Quantifying the organic natural P is not possible using the common P fractionation methods (i.e., Hedley method). For this purpose, the use of the 31P-NMR technique is necessary and allows an analysis of the potential of soil P organic compound degradation.
Overall, soil with a high P stock due to fertilization input or soil parent material may fulfil plant demand and help the plants maintain their yields for longer periods, even without P fertilization. However, a lack of phosphate fertilization in association with constant P export leads to a negative soil P balance, leading to a decrease in P stocks and availability (32, 33). This process can cause a significant reduction in plant yield; consequently, it affects SOM accumulation and maintenance on a time scale that depends on P export and the level of initial P stock availability in plants.
Thus, understanding P depletion in soil subjected to different management systems (grassland or cropland systems) is one of the main strategies for avoiding the negative effects of P deficiency on plant growth and yield. The main scientific questions of the present study are as follows: How does the soil P stock change over time in forage and annual crop soil management systems, without any P fertilization, in a temperate climate agroecosystem? What are the changes observed in the relationships between P, C and N cycles and stocks under such a management system? On the basis of these questions, we hypothesized that: 1) soil under mowed permanent grassland would show higher P stock depletion than soil cultivated under crop rotation due to P export through dry matter and; 2) there would be a significant soil organic P pool increase in permanent grassland because it couples with C and N in SOM. Thus, we analysed a 13-year long-term field trial carried out based on contrasting soil management systems for SOM and P dynamics.
Materials and methods
Experimental Field
The experimental site is part of the long-term Agro-ecosystems, Biogeochemical Cycles and Biodiversity Observatory on Environmental Research (SOERE ACBB), which is managed by the French National Institute of Agricultural Research and Environment (INRAE), in Lusignan, France (46°25′12.91″ N; 0°07′29.35″ E) (Figure 1). The area was under managed grassland, grain cropping or ley arable rotations for at least 70 years before the experimental site was implemented in 2005 (INRAE archive). The climate in the region is characterized by a mean annual temperature of 12°C and by a mean annual rainfall of 750-800 mm. The soil profile is characterized by two main horizons: upper soil horizons, characterized by loamy texture and classified as Cambisol, and lower soil horizons, characterized by rubified clayey horizons rich in kaolinite and iron oxides and classified as Paleo-Ferralsol (34–36).
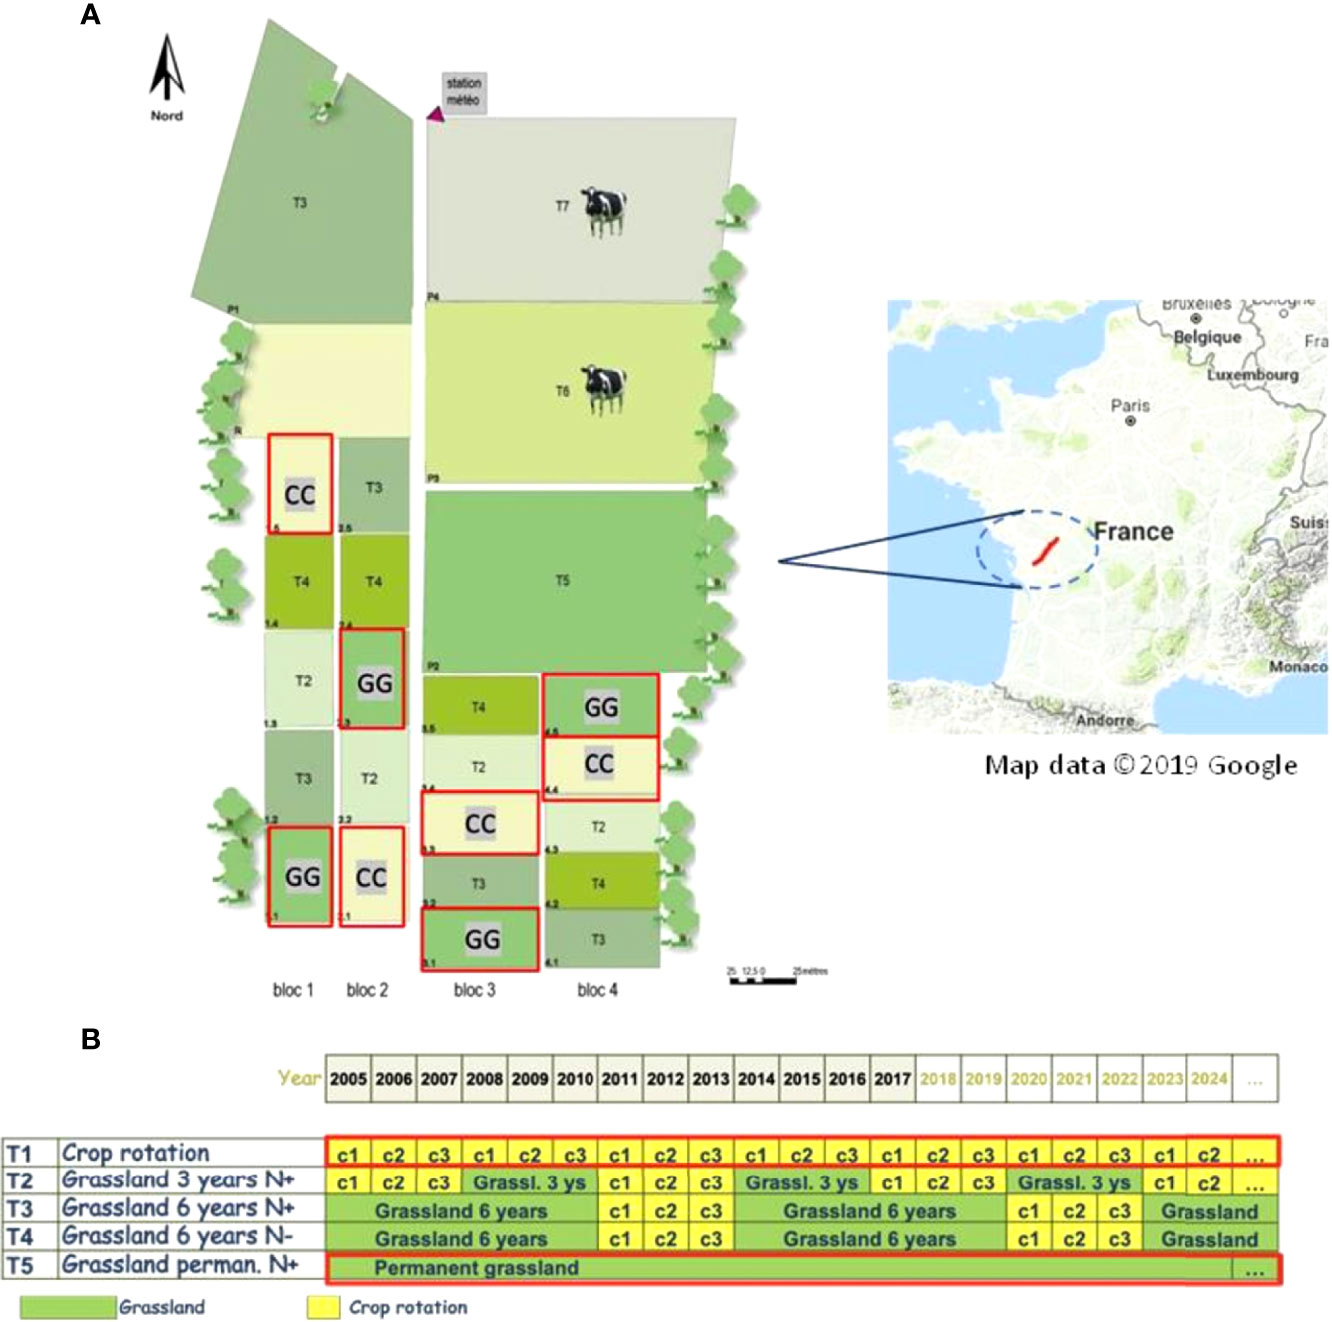
Figure 1 Lusignan National Long-Term Observatory at Nouvelle-Aquitaine Region, France (A) target treatments from 2005-2017 used in the current study (B) are shown in the red frame.
The experiment started in 2005 and followed a completely randomized block design with four repetitions. The treatments analysed included permanent cropland (CC) with maize–wheat-barley rotation and permanent grassland (GG) (Figure 1). Zea mays L. (maize) was sown at a density of 8.5 seeds m−2 in the permanent cropland, Triticum aestivum L. (wheat) was sown at a density of 150 seeds m−2, and Hordeum vulgare L. (barley) was sown at a density of 165 seeds m−2. A mix of Dactylis glomerata L. (cocksfoot), Festuca arundinacea Schreb (tall fescue) and Lolium perenne L. (ryegrass) was used in the permanent grassland.
The soil was conventionally ploughed and subsequently planted in CC treatments after each crop harvest. No P and K fertilization was applied over time, and N application followed plant demand and the growing season (37). Grasslands (GG) were mowed 3 to 5 times a year with a tractor mower in GG treatments, depending on climatic conditions; all aboveground plant biomass was removed. No animal grazing was carried out on the mowed grassland since the experiment was implemented in 2005. No P or K fertilization was applied over time. N fertilization was only carried out based on the amount of shoot biomass N exported at each mowing event. In addition, the timing and rate of N fertilization were guided by the nitrogen nutrition index (NNI) – between 0.9 and 1.0 – to provide the lowest N limits for potential plant production (38).
Phosphorus and Vegetation Outputs
Plant biomass was assessed shortly before harvest (once a year for cereals and 3-5 times a year for grasslands) in an area of 7.5 m2. Biomass was oven-dried at 60°C for dry matter quantification. Thereafter, the P concentration was determined according to the procedure described by Masson et al. (39). Briefly, 0.5 g of plant powder dry matter was calcined at 450°C for 4 h. Then, the ash was heated in 5 ml of concentrated HNO3 (at 65%) on a hot plate until near evaporation. The ash was then filtered through P-free filter paper and placed in 50 ml vials, and total P was determined by a radial targeting inductively coupled plasma emission spectrometer (ICP–AES). To ensure the quality of the results, the introduction of blanks and 3 replicates of certified plant powder samples in the analytical run was applied. P export was computed based on the product of the element concentration and dry matter production.
Soil Sampling
Soil samples were collected in 2005, 2011, 2014, and 2017, when maize was present in the system (i.e., at the beginning of the experiment and 6, 9, and 12 years later, respectively) from the 0-30 cm layer to quantify C and N. For the P analysis, samples from 2005, 2011, 2014 and 2018 (i.e., at the beginning of the experiment and 6, 9 and 13 years later) were taken in a 0-30 cm topsoil layer. Five samples were randomly collected per field repetition; they were mixed to determine the composite sample representative of the field per plot. In total, four truly representative field replications were utilized. Samples were oven-dried at 60°C, sieved to 2 mm, and stored for chemical analysis after soil sampling.
The bulk density of the topsoil (0-30 cm) was determined in 2005, 2010 and 2016 through soil sampling with the aid of a cylinder of known volume. The soil was weighed after drying at 105°C for 24 h, and the density was determined based on the soil mass:cylinder volume ratio.
Soil Chemical Analyses
Total P (Pt) was determined through the ignition method at 550°C for 2 h (40), followed by extraction with 1 mol L-1 H2SO4 for 24 h. EnviroMAT SS-2 standard soil (No. 140-025-002) was used as a reference for the method, and 96% recovery of total P was found. Total organic P (Po) was measured as follows: two subsamples were weighed; one subsample was ignited at 550°C for 2 h; and the other subsample was unignited. P was extracted into both subsamples with 10 mL of 0.5 mol L-1 H2SO4 after the subsample was stirred for 24 h. Po represents the difference in P concentration in the two subsamples. Total inorganic P (Pi) was quantified as the difference between Pt and Po.
P-lability was assessed through five-step sequential extraction (11) modified by (41). Briefly, 0.5 g of soil was weighed in a Falcon tube, and P was sequentially extracted by a) an anion exchange resin (AER) membrane (AR 103 Plate 434 QDP); b) 10 mL of 0.5 mol L-1 NaHCO3 through shaking for 16 h; c) 10 mL of 0.1 mol L-1 NaOH through shaking for 16 h; d) 10 mL of 1 mol L-1 HCl through shaking for 16 h; and e) 10 mL of 0.5 mol L-1 NaOH through shaking for 16 h. Pi was quantified by means of the molybdate colorimetry method at 700 nm in alkaline extracts (NaHCO3 and NaOH) (42), and Pt was determined after mineralization with ammonium persulfate (7.5%) + H2SO4 (1:1; v/v) in an autoclave at 121°C for two hours (43). Po was determined based on the difference between Pt and Pi. The Pt of mineralized alkaline extractions and Pi in acid reagents were measured by means of colorimetry at 882 nm after acid phosphomolybdate complex formation (44).
P lability analyses considered include:
The total soil C and N contents were determined through elementary analyses carried out in an elemental analyser (CHN NA 1500, Carlo Erba) after milling the soil samples at 100 μm. All C was considered organic C since there was no carbonate in the soil (25).
P, C and N were analysed as soil stocks; they were determined by considering the concentration and bulk density of the 0-30 cm soil layer. The following soil atomic ratios (C:Po and N:Po) were determined through an equation described by Xue et al. (45):
based on the following atomic weights: C: 12.0107, N: 14.0067 and P: 30.9738 g mol-1.
31P Nuclear Magnetic Resonance (31P NMR)
One composite sample per treatment was used to perform 31P-NMR spectroscopy to investigate the structure of the alkali-soluble P form in samples from 2005 (initial state) and 2018, i.e., 13 years after the experiments were installed. To do so, suspensions with 1 g of soil from each repetition of treatments and 10 mL of 0.25 mol L-1 NaOH + 0.05 mol L-1 EDTA were prepared in centrifuge tubes. These tubes were shaken for 4 hours and centrifuged at 3,000 x g for 15 min. The extracts of the four repetitions were homogenized; Pt, Po and Pi contents in the extract were quantified based on the aforementioned methods and freeze-dried. Lyophilized extracts were redissolved in 2.7 mL 0.25 mol L-1 NaOH + 0.05 mol L-1 EDTA and 0.3 mL D2O and stirred in a vortex for 5 min to perform the 31P-NMR analyses. The supernatant was separated by centrifugation (3000 x g for 15 min) after 120 min of contact, filtered (<45 µm) and transferred into a 10 mm NMR tube. The 31P-NMR spectrum was determined utilizing a Bruker Advance DPX 400 spectrometer operating at a frequency of 162 MHz with proton decoupling, a pulse angle of 90°, a temperature of 20°C, an acquisition time of 0.5 seconds and a relaxation time of 2 seconds. The number of scans ranged from 27,000 to 32,000. Peak area integration was performed electronically at a baseline of 10 Hz in Bruker TopSpin 3.6.2 software. The following phosphate compounds were identified: orthophosphate (7.10 ppm), monoester (6.33 to 5.09 ppm), diester (2.00 to -1.00 ppm), pyrophosphate (-3.14 to -3.58 ppm) and adenosine diphosphate (-9.36 to -9.41 ppm). The hydrolysis of diester compounds was not considered in the peak area integration. The monoester compounds were separated into myo-inositol hexakisphosphate (myo-IHP), scyllo-inositol hexakisphosphate (scyllo-IHP), α–glycerophosphate, β–glycerophosphate and adenosine monophosphate (46–49).
Statistical Analyses
The variables were analysed based on a randomized complete block design, with split plots in time and four repetitions. Soil management was taken as the main factor (plot), and management time was used as the secondary factor (split plot). The adopted statistical model was described through Equation 5.
where Y is the observation; µ is the overall experimental average; B is the blocks (i = 1, 2, 3, 4); T is the soil management (j = 1 and 2); R is the management time (k = 1, 2, 3, 4); and error is the experimental error.
The soil management effects were tested by the Scott–Knott test (p ≤ 0.05) based on complex variance. Variables were subjected to regression analysis to test the time effects (p ≤ 0.05). The statistical analyses were carried out in SISVAR 5.6 software.
Results
Yield and Nutrient Export
The mean dry matter export reached 8.0 and 7.9 Mg ha-1 year-1 in CC and GG, respectively. This led to cumulative exports of 112 and 110 Mg ha-1 (for CC and GG, respectively) at the end of the assessed period (2005-2018).
The dry matter exported by GG during the early experimental years (2005-2008) was 40% higher than that recorded for CC in the same period. However, after this time, it was possible to observe a shift in the weight of the exported dry matter. A yield decrease was observed in both treatments, mainly in GG, over time (Figure 2). The mean P exportation rates were 19.1 and 21.0 kg ha-1 yr-1 for CC and GG, respectively. Consequently, the accumulated amount of exported P was 10% higher in GG than in CC (295 and 268 kg ha-1, respectively) (Figure 2). However, there was no trend of P concentration reduction in the dry matter; the mean P concentration reached 0.23% and 0.28% in CC and GG, respectively.
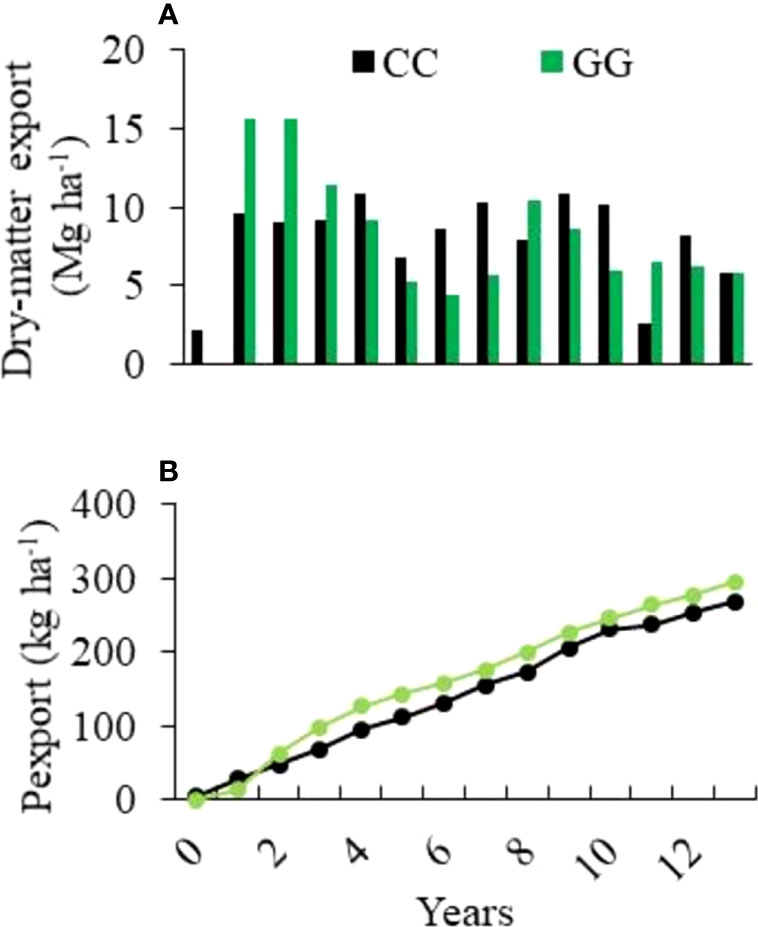
Figure 2 Exportation of (A) annual dry matter and (B) accumulated phosphorus from the experimental field over 13 years of cultivation. CC-permanent conventional crop rotations and GG-permanent grassland.
Total Carbon, Nitrogen and Phosphorus Stocks
The temporal pattern observed for the C and N stocks in GG and CC can be seen in Figure 3. GG enhanced the C stock by 5.5% (an increase of 2.6 Mg ha-1 within 12 years), whereas CC promoted a reduction of 8.5% in the C stock (a decrease of 4.2 Mg ha-1 within 13 years). GG increased N by 3.7% (0.19 Mg ha-1), and CC reduced N by 7.4% (0.38 Mg ha-1) in the stocks.
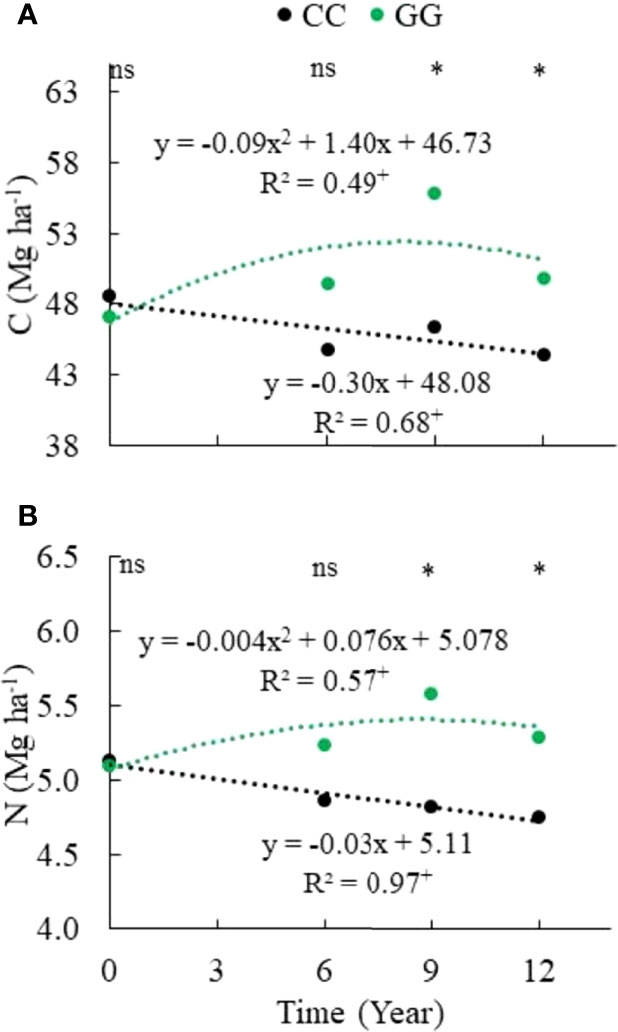
Figure 3 Temporal change in (A) carbon and (B) nitrogen stocks in the 0-30 cm topsoil layer. CC– permanent conventional crop rotations (corn, winter wheat, and barley crops) and GG-permanent grassland. nsNot significant. *Significant in the Scott–Knott test (p ≤ 0.05). + Significant at p ≤ 0.01.
There was a total P stock decrease in both CC and GG. A linear decrease of 0.0217 and 0.0159 Mg ha-1 yr-1 was identified in GG and CC, respectively (Figure 4). The accumulated depletion of the total soil P stock reached 0.30 Mg ha-1 (9.4%) and 0.25 Mg ha-1 (8.0%) in GG and CC, respectively, after 13 years. In addition, the total Pi stock was more aggressively (2.3 times) depleted in GG than in CC (Figure 4). This depletion represented -0.75 and -0.29 Mg ha-1 in both treatments, respectively, at the end of 13 years. However, the Po stock increased by 42.6% in GG at a rate of 32 kg ha-1 yr-1; it did not change in CC (Figure 4).
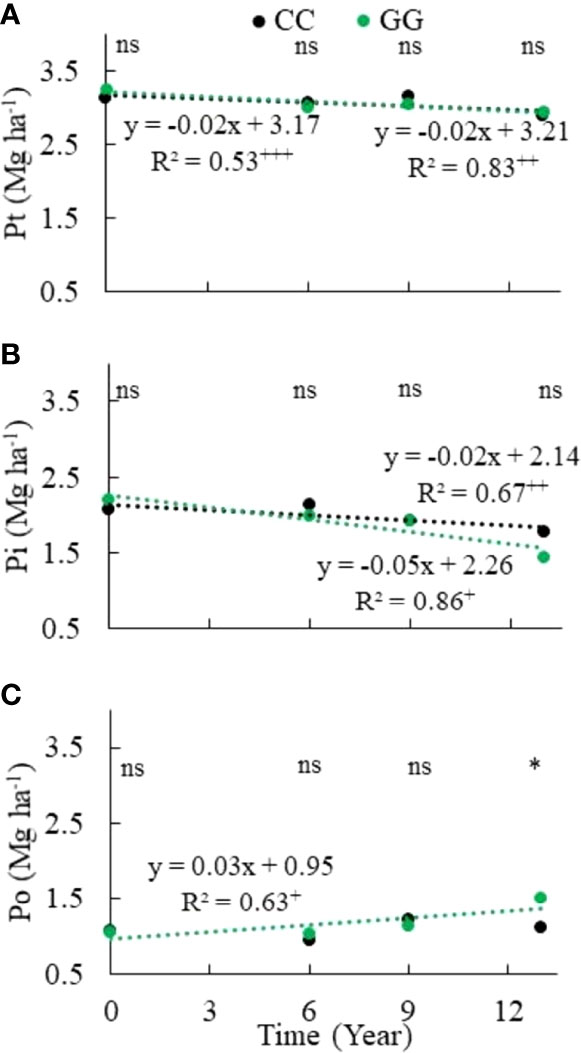
Figure 4 Trends of (A) total phosphorus, (B) total inorganic phosphorus and (C) total organic phosphorus stocks in the 0-30 cm topsoil layer of soil subjected to different soil management systems. CC– permanent conventional crop rotations (corn, winter wheat, and barley crops) and GG-permanent grassland. nsNot significant. *Significant in the Scott–Knott test (p ≤ 0.05). +Significant at p ≤ 0.01. ++Significant at p ≤ 0.05. +++Significant at p ≤ 0.10.
Phosphorus Lability
A significant reduction in the labile P fraction was observed in both GG and CC over time (Figure 5). However, the moderately labile P (Figure 5) and nonlabile P (Figure 5) fractions were not changed by the adopted soil management systems. Moderately labile P represented 44% of the total P stock in the 0-30 cm topsoil layer, on average, although it was not statistically significant. There was a mean of 0.13 Mg ha-1 decrease in both treatments, representing a 47% decrease in the total P stocks. However, nonlabile P, assessed based on the 0.5 mol L-1 NaOH extraction product, represented 22% of the total P stock in the 0-30 cm topsoil layer on average. Labile P depletion was 0.13 and 0.17 Mg ha-1 in CC and GG, respectively; it represented a 23% and 32% reduction of its initial content and 53% and 56% of the total P stock depletion in CC and GG, respectively. Labile Pi and labile Po showed opposing trends over time. There was a labile Pi depletion of 0.16 and 0.21 Mg ha-1 at rates of 0.012 and 0.016 Mg ha-1 y-1 in CC and GG, respectively (Figure 6), whereas labile Po stocks increased by 49% (from 27 to 69 kg ha-1) under the GG soil management system, but they did not significantly change in CC (Figure 6).
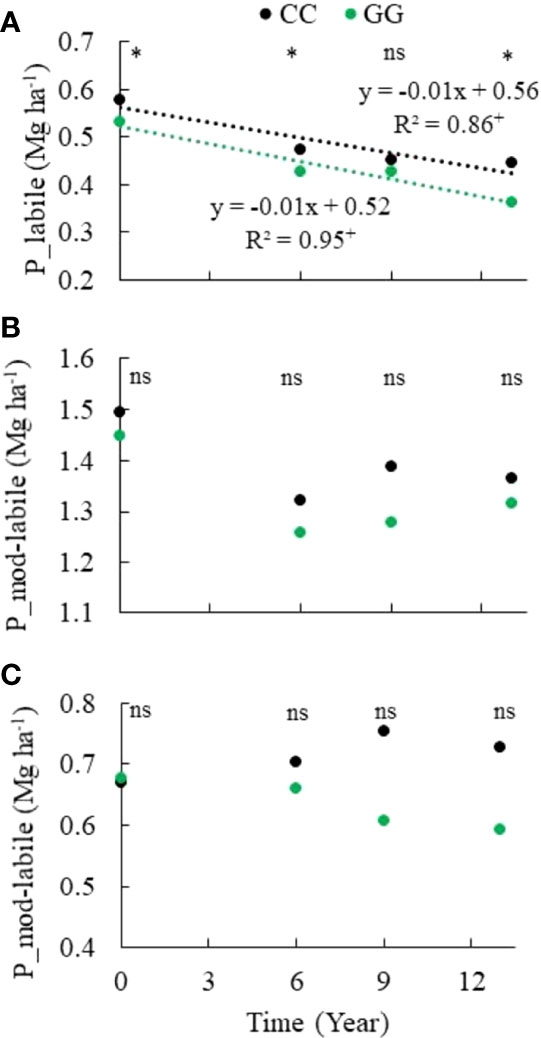
Figure 5 Trends of (A) labile, (B) moderately labile, and (C) nonlabile phosphorus in the 0-30 cm topsoil layer under different soil management systems. CC– permanent conventional crop rotations (corn, winter wheat, and barley crops) and GG-permanent grassland. nsNot significant. *Significant in the Scott–Knott test (p ≤ 0.05). +Significant at p ≤ 0.01.

Figure 6 Trends of (A) inorganic labile P and (B) organic labile P in the 0-30 cm topsoil layer under different soil management systems. CC– permanent conventional crop rotations (corn, winter wheat, and barley crops) and GG-permanent grassland. nsNot significant. *Significant in the Scott–Knott test (p ≤ 0.05). +Significant at p ≤ 0.01.
C:N:Po Stoichiometry
C, N and Po stoichiometry changed depending on the management systems due to changes in C and Po stocks (Figure 7). There was a significant reduction in the C:Po atomic ratio in the GG (from 116 to 86) and CC (from 117 to 104) systems over time. The N:Po atomic ratio decreased from 11 to 8 in GG and from 11 to 10 in CC. The C:N:Po atomic ratios were 117:11:1 and 116:10:1 in CC and GG, respectively, at the beginning of the experiment; they were 104:10:1 and 86:8:1 in CC and GG, respectively, 13 years later.
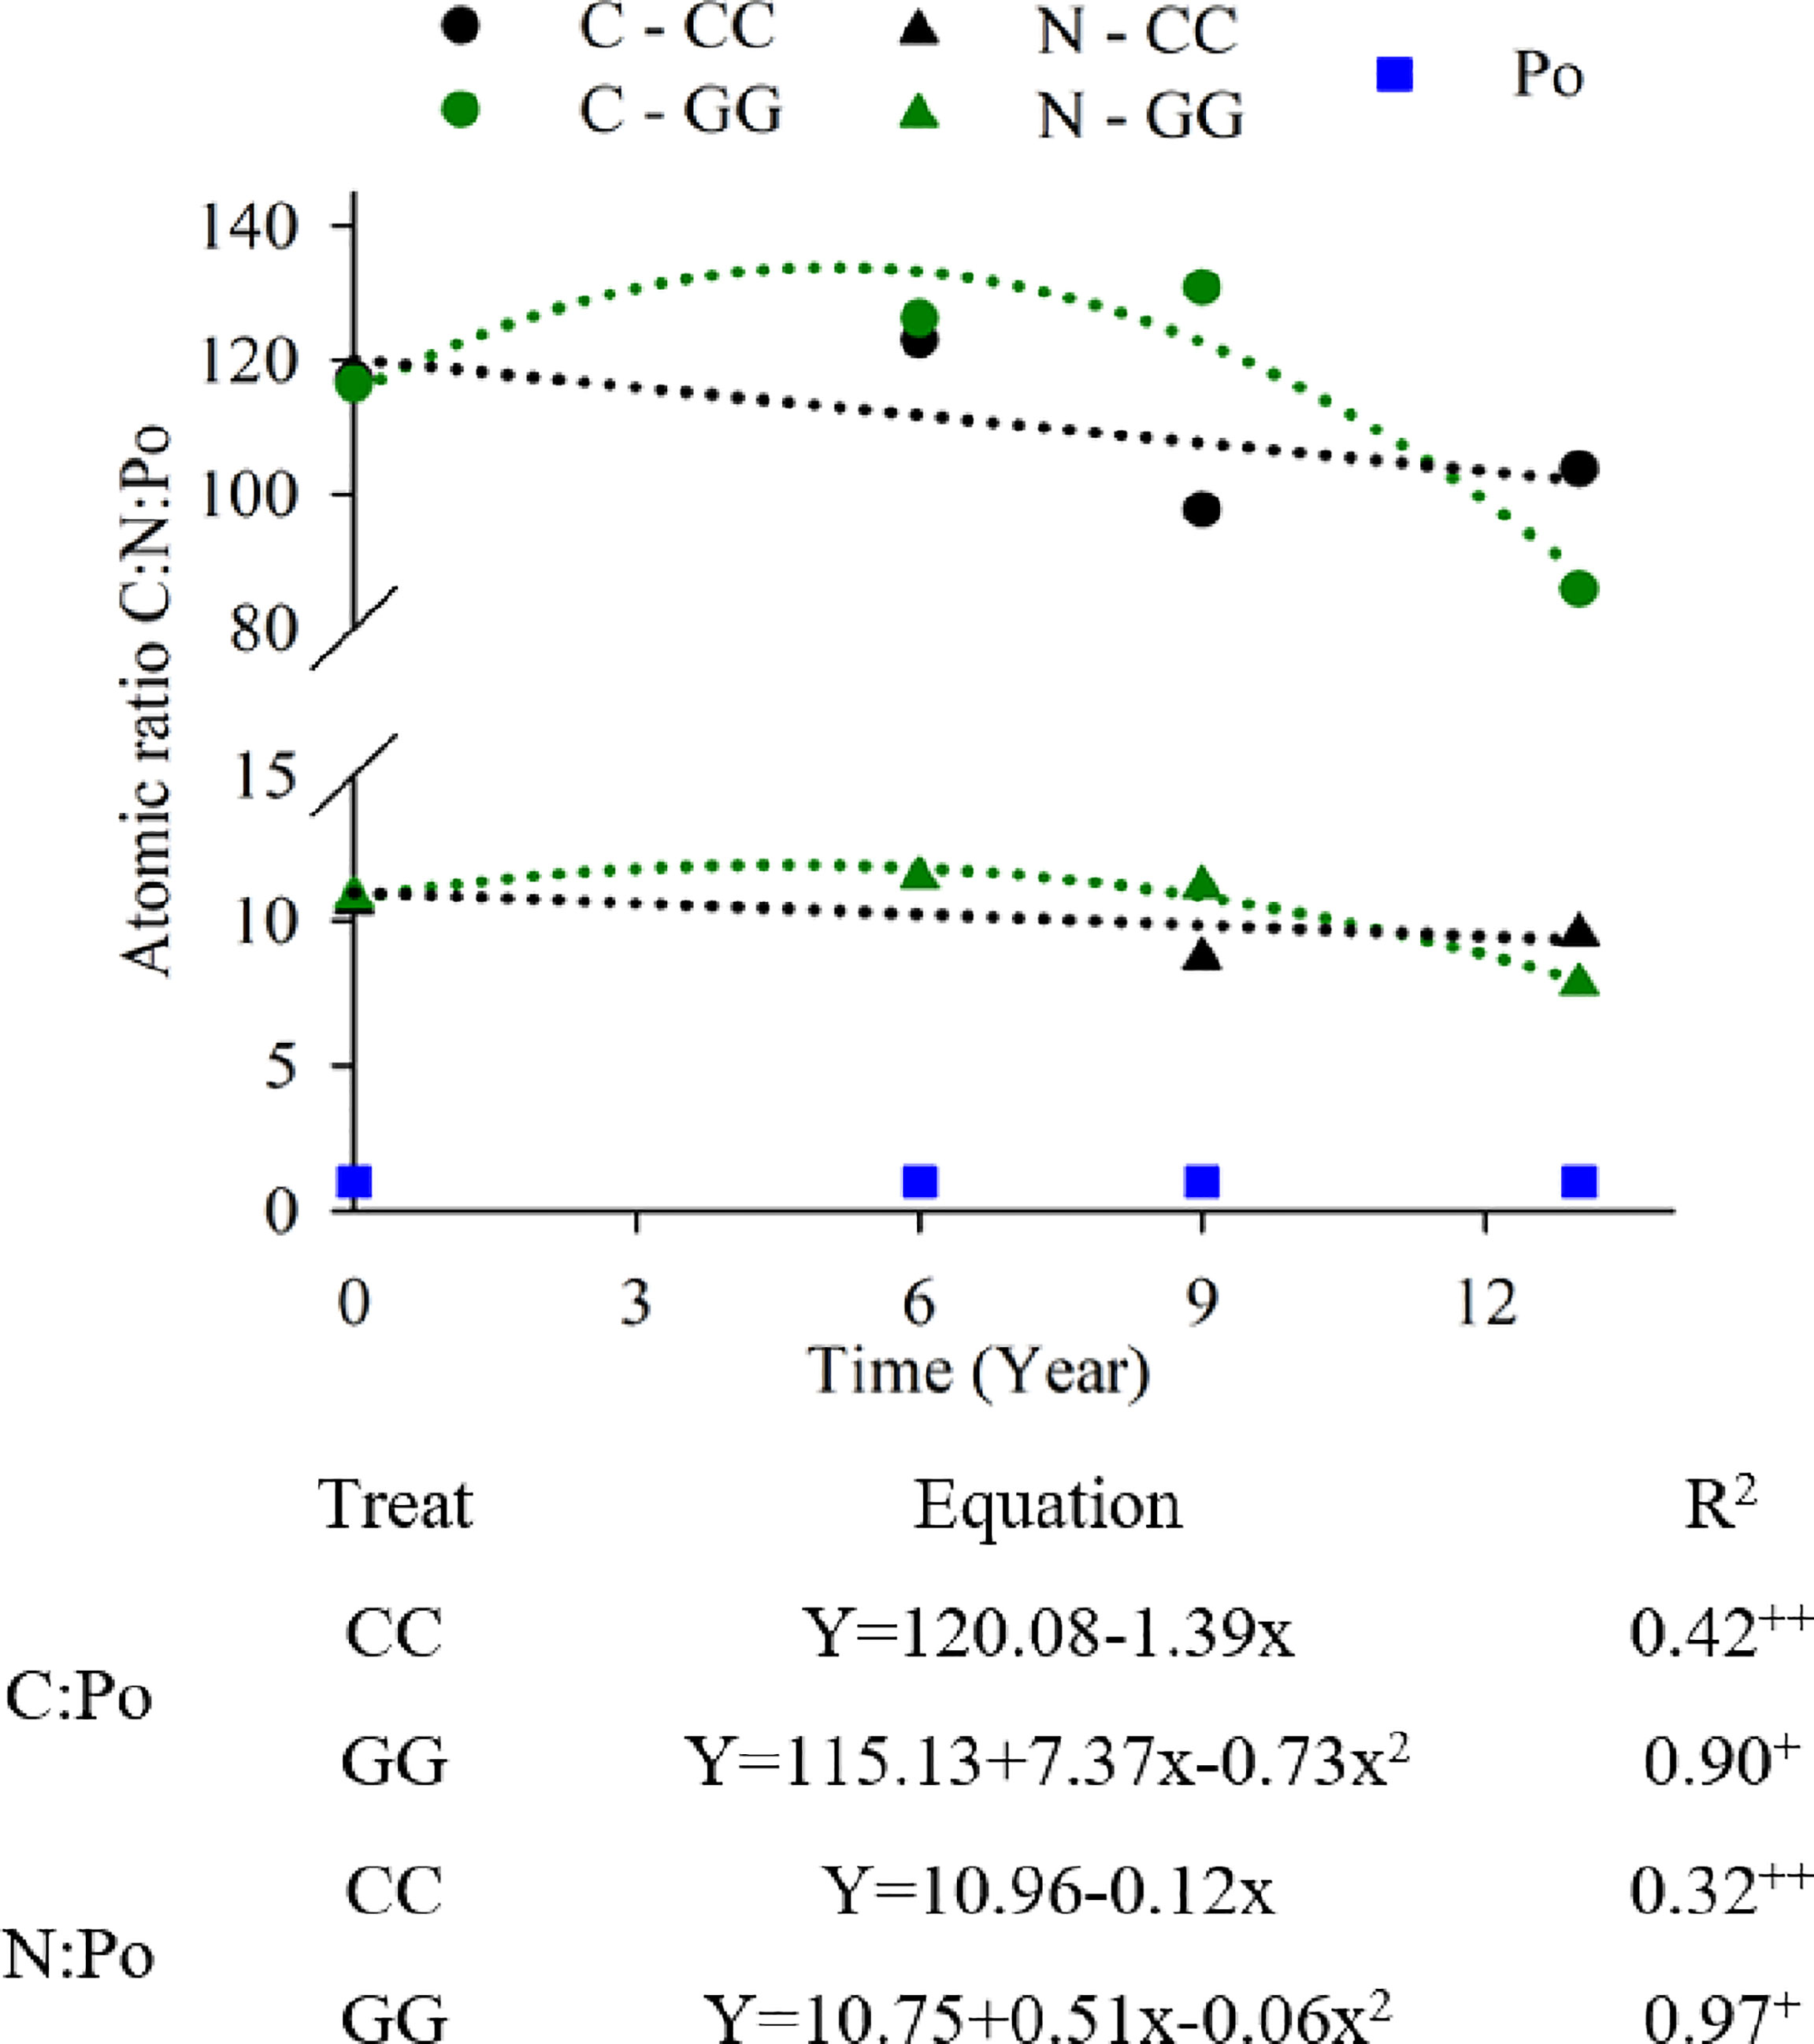
Figure 7 Trends in the C:N:Po atomic ratio in the 0-30 cm topsoil layer under different soil management systems. +Significant at p ≤ 0.01. ++Significant at p ≤ 0.05.
P Characterization by 31P-NMR
Soil Po and Pi forms at the beginning of the experiment (2005 - initial) and, after 13 years of cultivation (2018) under different soil management systems, were assessed after extraction with a solution containing 0.25 mol L-1 NaOH + 0.05 mol L-1 EDTA and a thorough 31P-NMR analysis. This solution extracted 57%, 54% and 51% of the total soil P at Pi/Po ratios of 2.7, 2.7 and 2.8 in the initial, CC and GG management systems, respectively (Table 1). The Pi/Po ratio in the extraction solution was higher than the rate in the soil (2.0, 1.6 and 1.0 in the initial, CC and GG management systems, respectively); this finding indicates greater Pi extraction than Po extraction.
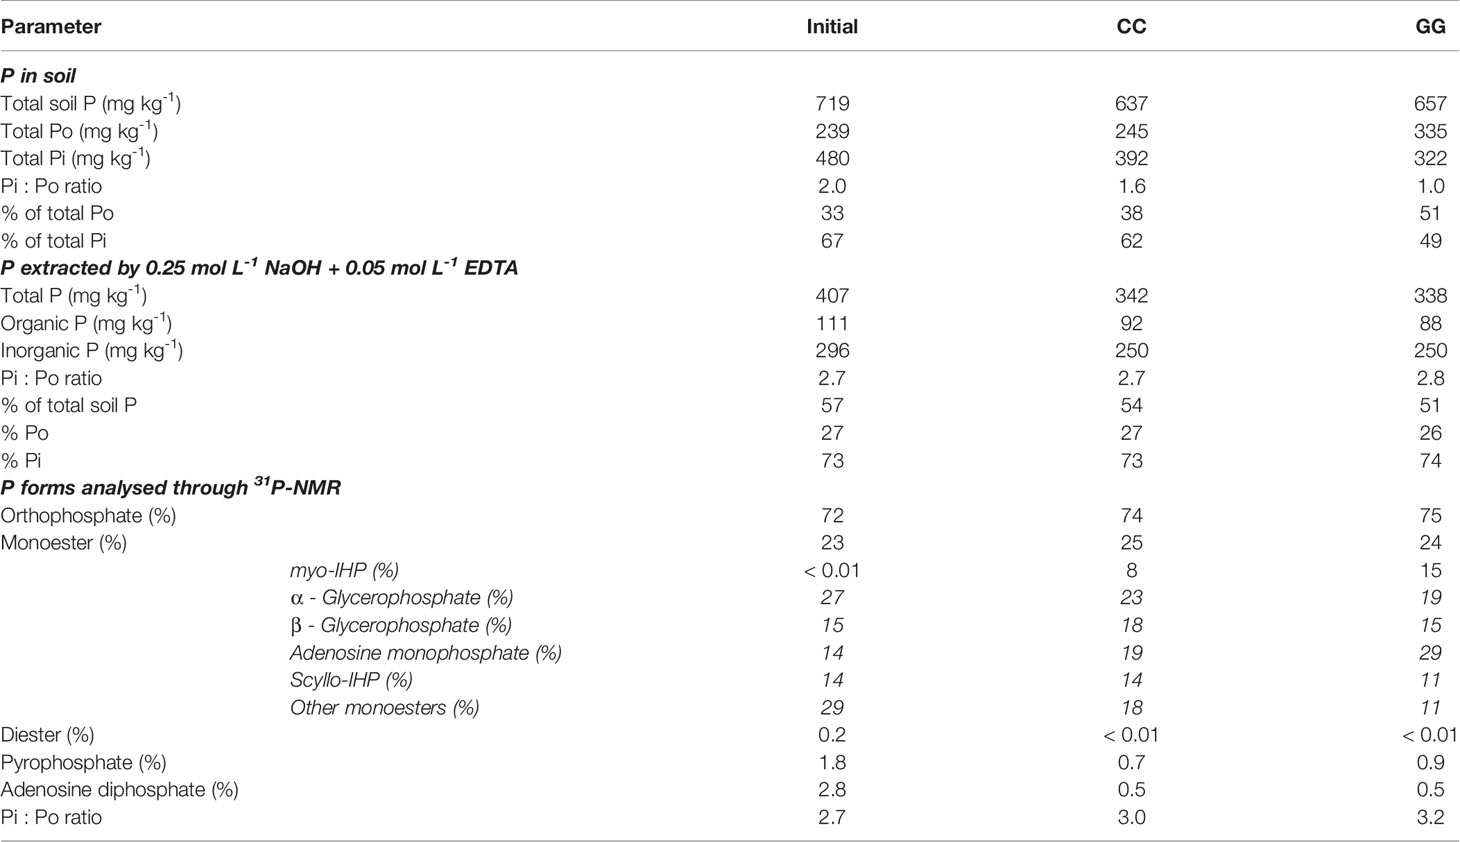
Table 1 Total organic and inorganic P extracted by NaOH + EDTA and P forms analysed through 31P-NMR in Cambisol managed under permanent cropland (CC) and permanent grassland (GG) for 13 years under a temperate climate.
Orthophosphate, orthophosphate monoesters, orthophosphate diester, pyrophosphate and adenosine diphosphate were identified through 31P-NMR (Figure 8). Although there was a slight indication in the spectra, peaks assigned to diester compounds (2 to -1 ppm) in CC and GG samples were below the detection limit available in the device. Orthophosphate (296, 250 and 250 mg kg-1 at 72, 74 and 75%, respectively) prevailed in all spectra, followed by monoester (111, 92 and 88 mg kg-1 at 23, 25 and 24%, respectively) in the initial, CC and GG management systems, respectively. Pyrophosphate and adenosine diphosphate accounted for lower contributions in the three samples (Table 1). myo-IHP, scyllo-IHP, α-glycerophosphate, β-glycerophosphate and adenosine monophosphate were identified in the monoester region (Table 1 and Figure 8). The contribution of the last three represented 56%, 61% and 62% of the phosphate monoester, respectively.
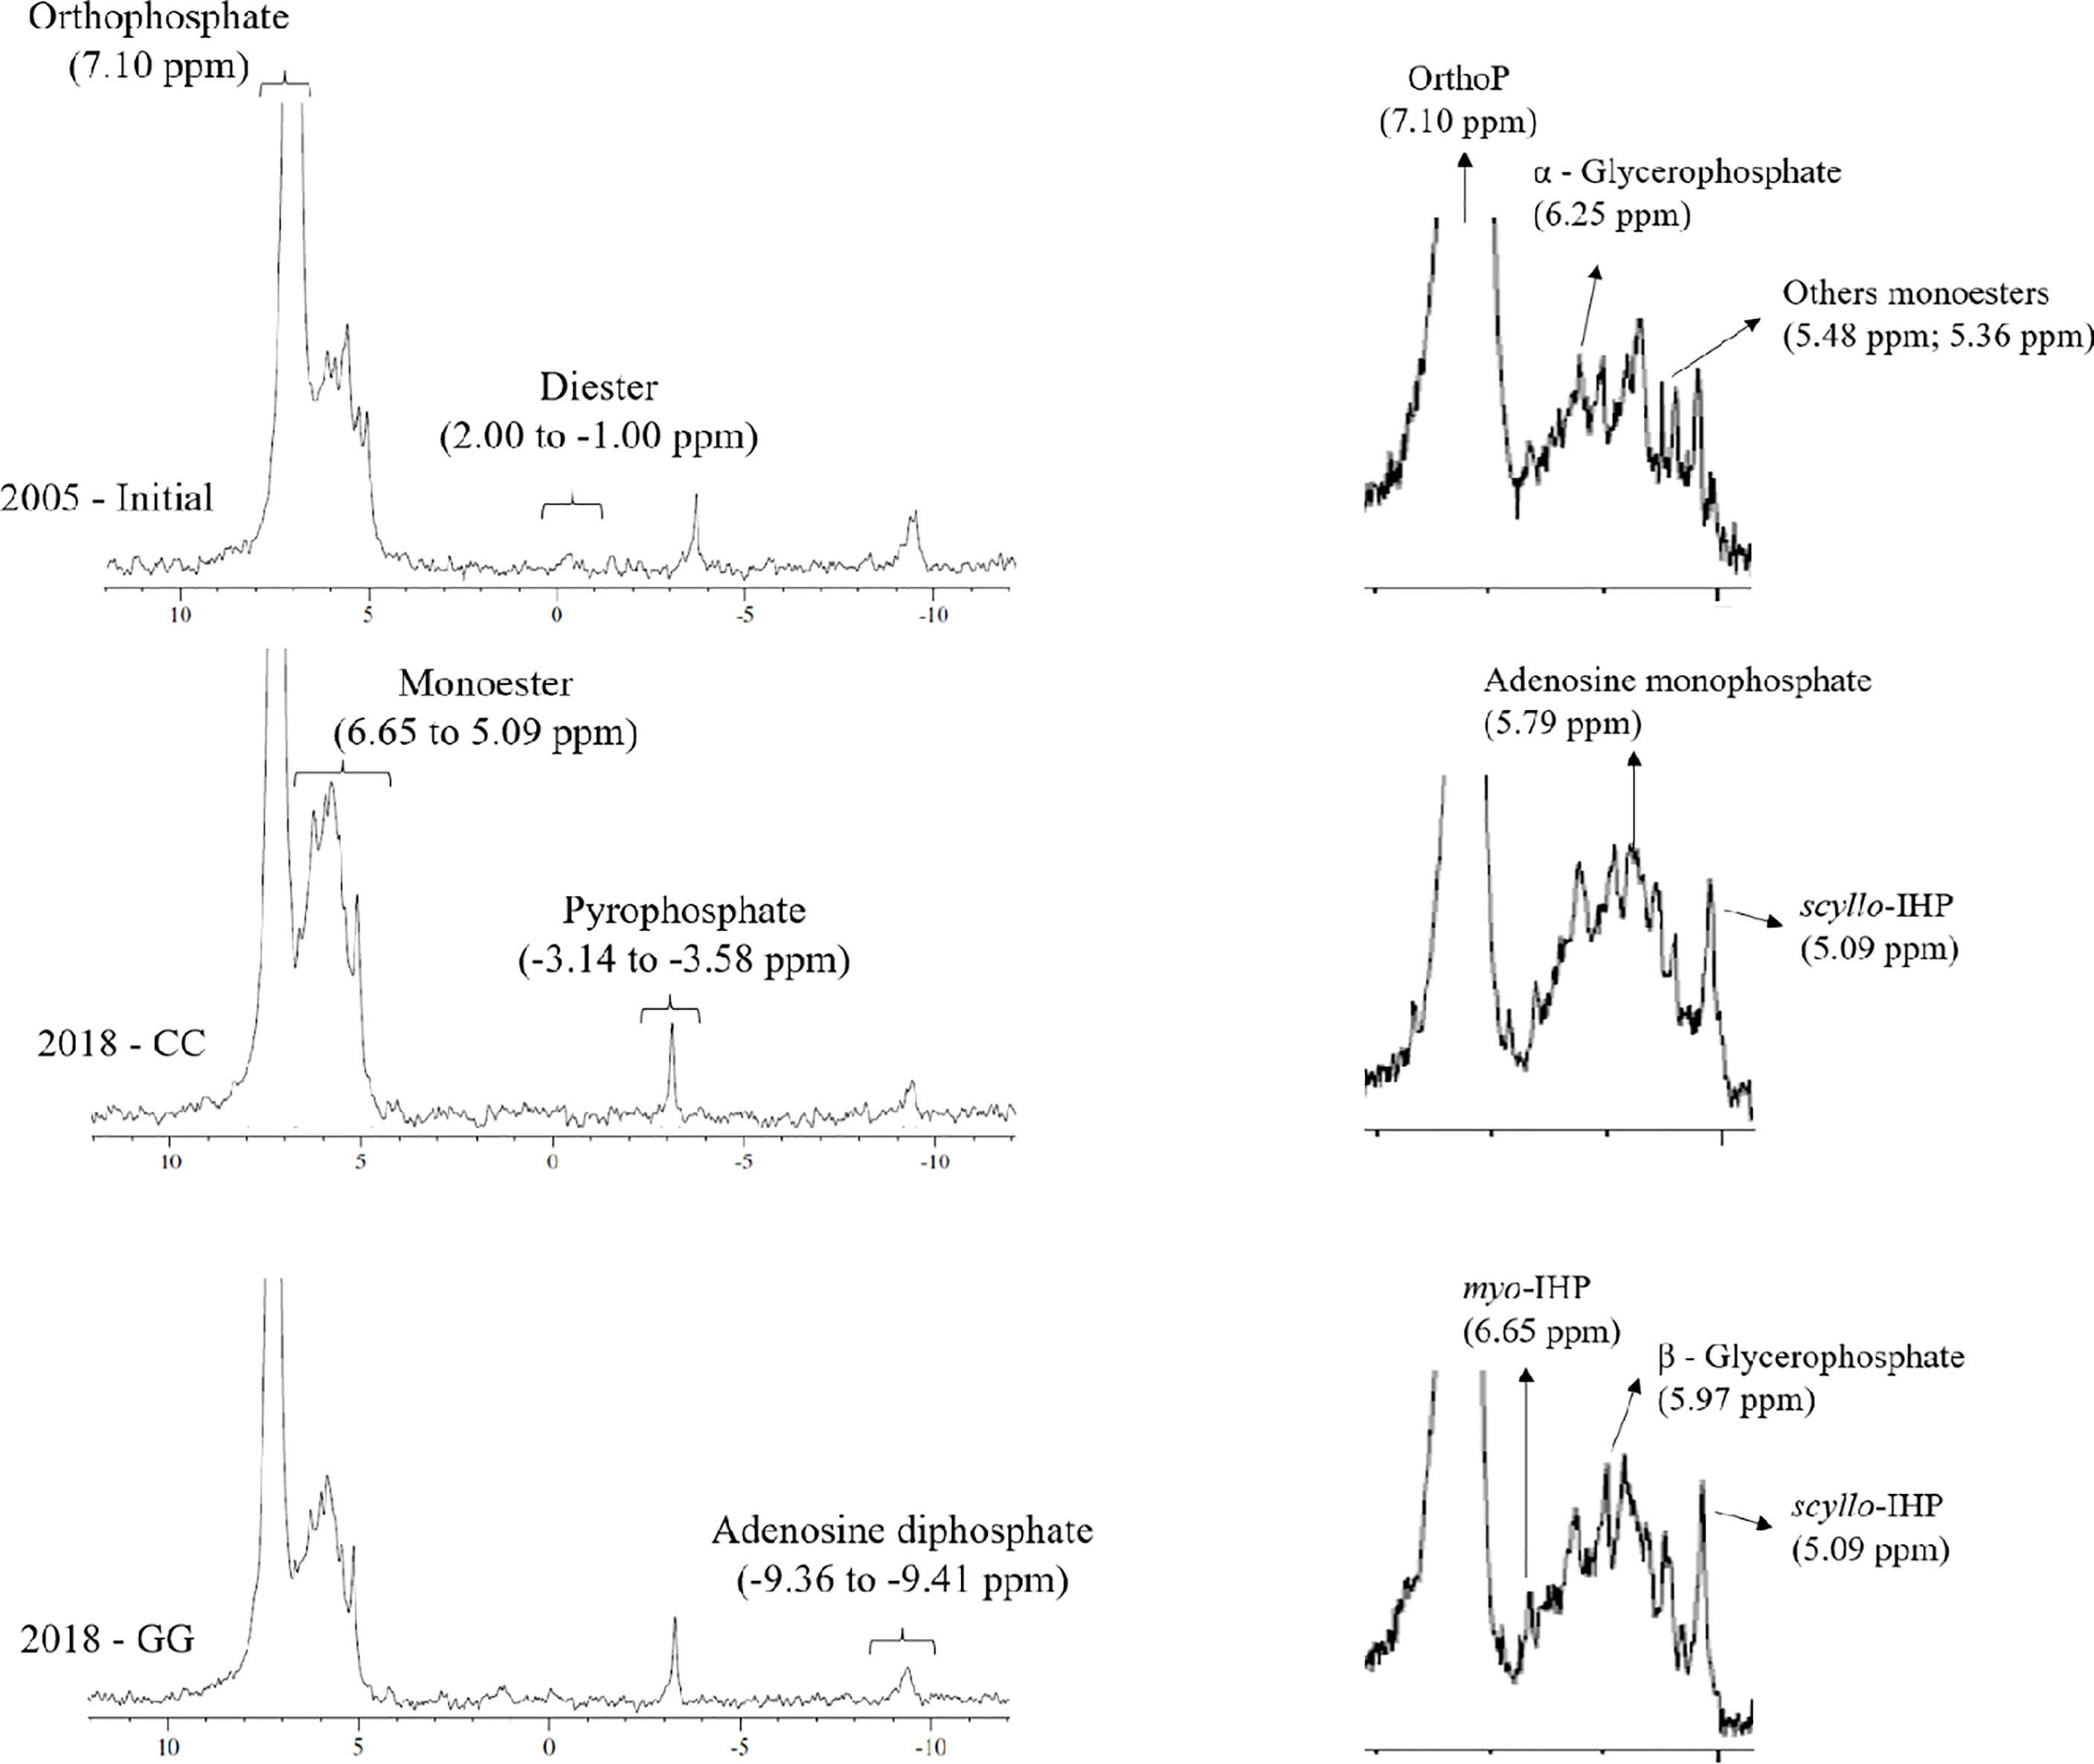
Figure 8 31P-NMR spectrum of a representative composite of soil samples at the beginning (2005) and after 13 years of CC and GG soil management practices. CC-permanent cropland and GG-permanent grassland.
Discussion
C, N and P Stock Trends
C, N and P stocks were analysed by focusing on changes in soil P lability observed over 13 years of cultivation (2005-2018) under contrasting soil management systems in soil presenting a high initial P stock (3.2 Mg ha-1, on average), without supplementary P fertilization. The C and N stocks in the 0-30 cm topsoil layer were differentiated by management systems: the C and N stocks increased in GG and decreased in CC. The constant input of plant residues (leaves, stems and roots) and lack of soil disturbance were fundamental factors for the increase in C and N stocks under GG. Similar results were recorded for the 0-10 cm layer in the same experiment (25, 50). Soil ploughing in surface soil layers under tillage management favours SOM mineralization and C and N losses to the atmosphere by potentiating microbial activity through greater residue-soil contact, system aeration and SOM physical protection reduction (22, 26, 51, 52). In addition, grassland-managed soils have significant organic matter input, mainly through underground rhizodeposition, which changes the soil C stock (53, 54).
The total P stock decreased in both treatments because of P export by plants (forage or grain) without P input due to fertilization (Figure 4). This long-term negative balance can lead to great P stock reduction, mainly in P available in the soil, which may constrain plant nutrition (32, 55, 56). Despite the total amount of exported dry matter was similar in the two management systems (112 and 110 Mg ha-1 for CC and GG, respectively), the amount of exported P differed between treatments due to the nature of the exported plant material. Grains were harvested (maize–wheat-barley) at a mean P concentration of 0.23% in CC, whereas leaves and stems of grasses (D. glomerata, F. arundinacea and L. perenne) were exported as forage at a mean P concentration of 0.28% in GG. This finding partly explains the difference of 27 kg ha-1 in the total exported P and the subsequent reduction by 0.3 Mg ha-1 in soil P in GG after 13 years.
Although total P stock depletion was more evident in the system managed with perennial pasture (GG), it was slow in both systems because annual dry matter export was low; it was 19.1 and 21.0 kg ha-1 y-1 in CC and GG, respectively, despite the 3-4 mowings per year and plant shoot material removal from the perennial pasture. However, according to the literature, nutrient export by plants in grazed systems (e.g., not studied here), tended to be lower, as some of the nutrients exported by plants were returned to the soil through animal urine and dung (57, 58), which is not the case in mowed grasslands. Although P exportation was low overall, it had a stronger impact on soils presenting low P stock, mainly due to low P stock availability.
The Pi stock decreased in both treatments simultaneously with the total P stock reduction. This process resulted from plant uptake of inorganic P and from further P export (2) or return to soil organic P forms. The Pi stock decrease in GG stood out (Figure 4) because, in addition to Pi exportation, there was Pi transformation and accumulation into Po. The increase of 42% in Po indicates the high potential of grassland to transform Pi into Po. This transformation occurs when P is absorbed by plants; incorporated into essential plant metabolism; returned to the soil through leaves, stems and roots; and remains in the soil as organic matter (59).
Po accumulation in grassland is the consequence of an increase in SOM due to organic matter input to the soil and to nonploughing during the experimental period (25). Overall, pasture soils have increased organic P forms and C and N due to SOM accumulation (27, 29). SOM represents the coupling of P, C and N cycles in the soil organic phase (Rumpel et al., 2015). Moreover, Pi incorporation into organic molecules in rangelands or croplands can be larger if mining plants are used (e.g., Lolium sp. and Lupinus sp.), as well as a mix of plants or rotation, with more nutritionally demanding plants (i.e., leguminous crops) (60; Crème et al., 2016; 55).
The C:N:Po atomic ratio was also changed by the management systems because of changes in C and Po stocks (Figure 7). The stoichiometry values (104:10:1 and 86:8:1 for CC and GG, respectively) were below the means of 166:14:1 (61) and 169:11:1 (62) recorded for pasture and above the mean of 64:5:1 (62) observed for cropland values reported in the literature for bulk soil at a global scale. The lower values observed in the present study were mainly caused by high soil Po contents, which resulted from the history of P input before the experiment and from the soil Po stock increase caused by permanent grassland cultivation. The temporal reduction in the C:N:P stoichiometry reveals that there is no decrease in OM input and thus in the amount of P even after 13 years without P fertilization, suggesting that there is internal P turnover (see below). Alternatively, a limitation of N in the SOM can be addressed when there is a reduction in the atomic N:P ratio. However, this likely did not occur in our treatments, as there were increases in N stocks over time.
P Depletion and Dynamics
A decrease in total P stocks was first observed through changes in labile and moderately labile P stocks, since turnover in these fractions can last from minutes to months (13). Moreover, labile P is the most available P fraction for plant uptake. Based on the current results, decreases of 0.13 and 0.17 Mg ha-1 in labile P recorded for CC and GG, respectively, represented most of the reduction in total P stocks (mean of 55%); P was higher in GG due to greater P export under this soil management system. With respect to the total Pi and Po stocks, labile Pi and Po presented opposite patterns. Labile Pi decreased in both treatments due to the absorption of inorganic P forms (i.e., and ) (2). On the other hand, labile Po significantly increased under the GG treatment due to SOM accumulation in the soil. These results are consistent with the total C, N and Po soil stock increases (Figures 3, 4) and indicate an increase in C, N and Po coupling in the P pool, which showed greater availability. Labile Po corresponding to P from organic compounds was changed as a result of soil management systems (and thus via soil microbial biomass, soluble organic molecules, and organic orthophosphates less adsorbed by soil colloids). Therefore, it was possible to identify more significant changes in the labile P pool over the analysed period (13 years).
The mean decrease observed in the moderately labile P (0.13 Mg ha-1) represented the remaining fraction of the total P stock reduction (47%, on average). This behaviour was similar in both soil management systems and showed the buffering effect of moderately labile P on labile P (12). These authors highlighted that Po presenting moderate lability (extracted by 0.1 mol L-1 NaOH) in cropping systems with tillage accounts for a higher contribution (94%) to labile Pi buffering as ploughing enhances mineralization. However, this effect was not observed in the current research, since moderately labile P reduction was similar in both treatments and moderately labile P reduction was not significant in the CC treatment (data not shown).
The nonlabile P stock was not changed by the soil management systems throughout the evaluated 13-year period. Nonlabile P extracted with 0.5 mol L-1 NaOH represented a more recalcitrant organic (inside soil aggregates) and inorganic P pool (inner sphere absorbed through iron oxihydroxides and clay minerals) (63). Therefore, there was low sensitivity and minor P pool turnover, regardless of the adopted soil and management system (13). Furthermore, the high labile and moderately labile P stocks that had a history of fertilization were able to fulfil crop demand without the need to access the nonlabile P pool.
Chemical Nature of Soil Organic Phosphorus
The extraction solution NaOH + EDTA extracted more than 50% of the total P from the soil. This observation is common in soils from temperate regions, given soil mineralogy and moderate pedogenic evolution. The soil in the present study was classified as Cambisol with loamy texture in the upper soil horizon with high P content, mainly Pi (67%, 62% and 49% of total P in Pi in the initial, CC, and GG management systems, respectively), due to the history of phosphate fertilization used prior to the beginning of the experiment. Doolette et al. (64) extracted 21% to 89% of the total soil P by using the same NaOH + EDTA solution (with prevalence > 60%) in a study carried out with soils presenting different uses and textural characteristics in New South Wales, South Australia and Tasmania. Abdi et al. (65) extracted 51% of the total soil P, on average, from soils collected in Canada (from temperate regions), presenting clayey texture and cultivated with grassland. On the other hand, Rheinheimer et al. (66) found much lower P recovery (15.1%, on average) in subtropical soil. These authors attributed the P recovery rate recorded for subtropical to its clayey texture and a mineralogy dominated by soil kaolinite and iron oxides.
Similar to other current studies, and in compliance with all previously reported cases, in this study there was a prevalence of orthophosphate and monoesters and a small contribution of diesters and pyrophosphate in the analysed extract. More complex organic compounds, such as myo-IHP, scyllo-IHP, α-glycerophosphate, β-glycerophosphate and adenosine monophosphate, were identified in the spectrum shift attributed to the monoester. These compounds have also been identified in soils cultivated with annual crops and grassland in temperate regions (65, 67, 68). The present study stands out for its evaluation of the temporal effect of the conventional crop rotation system and permanently mowed grassland on the chemical nature of soil organic P. This approach contemplated the need to analyse the temporal change in organic P forms, as evidenced by Cade-Menun (68).
The permanent cultivation of cropland and grassland for 13 years did not significantly change the orthophosphate concentration. The total Pi stock was identified, despite the decrease in the total P stock (Figure 4). Likewise, no relevant temporal increase in organic P forms in GG was observed through 31P-NMR (extracted by NaOH + EDTA), most likely because of the high initial total Po stock and C and N contents. Moreover, no relevant changes in Po forms between GG and CC were identified, mainly because the Po rate in the NaOH + EDTA extract was similar between treatments (GG and CC - 27%, on average). Pi extraction selectivity was observed for the initial, CC and GG samples. Lower Pi rates (67%, 62%, 49% of Pi in the initial, CC and GG samples, respectively) were observed in the soil than in the analysed NaOH+EDTA extract (73%, 73%, 74% of Pi in the initial, CC and GG samples, respectively). Selectivity for Po compounds was more often observed with the use of the NaOH + EDTA extraction solution; this was also reported by Rheinheimer et al. (66) for soils from subtropical regions.
Dry matter was removed annually on the order of 7.9 Mg ha-1 y-1 in the GG treatment; this reached 110 Mg ha-1 within 13 years. Dry matter export from pasture tends to reduce Po content in the soil in the long term, mainly the monoester forms detectable through 31P-NMR. Boitt et al. (32) found decreased rates of monoester compounds in the NaOH+EDTA extract when they simulated pasture dry matter grazing and exporting for 20 years in temperate pastures in New Zealand. Similarly, Deiss et al. (67) observed decreased monoester compounds in NaOH+EDTA extract due to animal grazing in experiments that lasted 7 to 12 years in winter forage under a subtropical climate in Brazil.
The main changes resulting from soil cultivation with different management systems were decreased α-glycerophosphate, diesters, pyrophosphate and adenosine diphosphate forms and increased myo-IHP and adenosine monophosphate forms in both treatments (Table 1). Significant differentiation between treatments was observed only in monoester compounds (Table 1). Therefore, cultivation with grassland had the strongest effect on α-glycerophosphate reduction and on myo-IHP and adenosine monophosphate increases. Higher values of α-glycerophosphate and lower values of myo-IHP and adenosine monophosphate in permanent crop rotation are linked to greater availability of substrate in the soil for microbiological development (69). In this case, soil rotation favours the contribution of organic material and its incorporation into the soil; consequently, the microbial activity is high. In this case, there is marked production of α-glycerophosphate, with temporal accumulation of myo-IHP and adenosine monophosphate.
Conclusion
The aims of the current study were to analyse soil organic matter and P stock depletion trends and the chemical nature of soil organic P and C:N:Po stoichiometry in long-term field experiments based on contrasting soil management systems, namely, permanent crop rotation and permanent grassland, over 13 years. Based on the present results, there was greater P export and, consequently, greater total P stock depletion in the treatment with permanent grasslands. P depletion mainly affected the P pool, presenting the highest lability (P-labile). However, the depletion observed 13 years after experimental installation was not high enough to cause an apparent reduction in plant yield due to the buffering capacity of less labile P pools (moderately labile P).
There was a change in inorganic P into organic P in the most labile reservoir in the permanent grasslands and an increase in soil C and N stocks. This process led to a reduction in the C:N:P atomic ratio value and, consequently, to C, N and P cycle coupling in the soil. This means that due to the conversion of Pi to Po, there is tighter coupling as all elements are in SOM, compared to a system with organic C and N but mainly inorganic P. Based on the 31P-NMR technique, permanent mowed grasslands significantly reduced α-glycerophosphate and increased myo-IHP and adenosine monophosphate contents in comparison to the permanent cropland.
Although productivity was not significantly affected, depletion of available P due to a lack of P fertilization in the soil should be monitored over time, especially in mowed permanent grasslands, to avoid possible nutrient limitation. Moreover, in soil with less available and total P stock, it is expected that crop P supply constraints will be felt in a shorter time frame and should require more attention from farmers. Avoiding nutrient depletion is essential for maintaining productivity and increasing C and N stocks in agricultural soils, in both arable and grassland systems.
Data Availability Statement
The raw data supporting the conclusions of this article will be made available by the authors, without undue reservation.
Author Contributions
AS: Conceptualization, Methodology, Writing - original draft. LC: Writing - review and editing. IC: Methodology, review and editing. DR: - review and editing. AC: conceptualization of the experimental design, Methodology, Writing - review and editing. All authors contributed to the article and approved the submitted version.
Funding
The research leading to these results was funded by “AnaEE France (ANR-11-INBS-0001)”, “AllEnvi” and “CNRS-INSU”, and the National Council for Scientific and Technological Development – CNPq-Brazil (Projects PVE 400887/2014-2; AS fellowship: GM/GD140270/2019-1; DR fellowship: 309515/2015-7; and ECB fellowship: 304676/2019-5).
Conflict of Interest
The authors declare that the research was conducted in the absence of any commercial or financial relationships that could be construed as a potential conflict of interest.
Publisher’s Note
All claims expressed in this article are solely those of the authors and do not necessarily represent those of their affiliated organizations, or those of the publisher, the editors and the reviewers. Any product that may be evaluated in this article, or claim that may be made by its manufacturer, is not guaranteed or endorsed by the publisher.
Acknowledgments
We would like to thank the National Research Infrastructure “Agro-écosystèmes, Cycles Biogéochimique et Biodiversité” (ACBB -Lusignan site; http://www.soere-acbb) for its support of the field experiment and database. We are deeply grateful to Dr. Marie-Laure Decau and to the observatory staff for their substantial technical assistance.
References
1. Elser JJ. Phosphorus: A Limiting Nutrient for Humanity? Curr Opin Biotechnol (2012) 23:833–8. doi: 10.1016/j.copbio.2012.03.001
2. Schachtman DP, Reid RJ, Ayling SM. Phosphorus Uptake by Plants: From Soil to Cell. Plant Physiol (1998) 116:447–53. doi: 10.1104/pp.116.2.447
3. Wang D, Lv S, Jiang P, Li Y. Roles, Regulation and Agricultural Application of Plant Phosphate Transporters. (2017) 8:1–14. doi: 10.3389/fpls.2017.00817
4. Lun F, Liu J, Ciais P, Nesme T., Chang J., Wang R, et al. Global and Regional Phosphorus Budgets in Agricultural Systems and Their Implications for Phosphorus-Use Efficiency. Earth Syst Sci Data (2018) 10:1–18. doi: 10.5194/essd-10-1-2018
5. Tian J, Boitt G, Black A, Wakelin S, Chen L, Cai K, et al. Mass Balance Assessment of Phosphorus Dynamics in a Fertilizer Trial With 57 Years of Superphosphate Application Under Irrigated Grazed Pasture. Nutr Cycl Agroecosyst (2019) 114:33–44. doi: 10.1007/s10705-019-09992-1
6. Walker TW, Syers JK. The Fate of Phosphorus During Pedogenesis. Geoderma (1976) 15:1–19. doi: 10.1016/0016-7061(76)90066-5
7. Helfenstein J, Tamburini F, von Sperber C, Massey MS, Pistocchi C, Chadwick OA, et al. Combining Spectroscopic and Isotopic Techniques Gives a Dynamic View of Phosphorus Cycling in Soil. Nat Commun (2018) 9:3226. doi: 10.1038/s41467-018-05731-2
8. George TS, Giles CD, Menezes-Blackburn D, Condron LM, Gama-Rodrigues AC, Jaisi D, et al. Organic Phosphorus in the Terrestrial Environment: A Perspective on the State of the Art and Future Priorities. Plant Soil (2018) 427:191–208. doi: 10.1007/s11104-017-3391-x
9. Li M, Cozzolino V, Mazzei P, Drosos M, Monda H, Hu Z, et al. Effects of Microbial Bioeffectors and P Amendements on P Forms in a Maize Cropped Soil as Evaluated by 31P–NMR Spectroscopy. Plant Soil (2018) 427:87–104. doi: 10.1007/s11104-017-3405-8
10. Liu J, Cade-Menun BJ, Yang J, Hu Y, Liu CW, Tremblay J, et al. Long-Term Land Use Affects Phosphorus Speciation and the Composition of Phosphorus Cycling Genes in Agricultural Soils. Front Microbiol (2018) 9:1643. doi: 10.3389/fmicb.2018.01643
11. Hedley MJ, Stewart JWB, Chauhan BS. Changes in Inorganic and Organic Soil Phosphorus Fractions Induced by Cultivation Practices and by Laboratory Incubations. Soil Sci Soc Am J (1982) 46:970–6. doi: 10.2136/sssaj1982.03615995004600050017x
12. Tiecher T, Gomes MV, Ambrosini VG, Amorim MB, Bayer C. Assessing Linkage Between Soil Phosphorus Forms in Contrasting Tillage Systems by Path Analysis. Soil Tillag Res (2018) 175:276–80. doi: 10.1016/j.still.2017.09.015
13. Helfenstein J, Pistocchi C, Oberson A, Tamburini F, Goll DS, Frossard E, et al. Estimates of Mean Residence Times of Phosphorus in Commonly Considered Inorganic Soil Phosphorus Pools. Biogeosciences (2020) 17:441–54. doi: 10.5194/bg-17-441-2020
14. Fink JR, Inda AV, Bavaresco J, Barrón V, Torrent J, Bayer C, et al. Adsorption and Desorption of Phosphorus in Subtropical Soils as Affected by Management System and Mineralogy. Soil Tillag Res (2016) 155:62–8. doi: 10.1016/j.still.2015.07.017
15. Rodrigues M, Pavinato PS, Withers PJA, Teles APB, Herrera WFB. Legacy Phosphorus and No Tillage Agriculture in Tropical Oxisols of the Brazilian Savanna. Sci Total Environ (2016) 542:1050–61. doi: 10.1016/j.scitotenv.2015.08.118
16. Withers PJA, Rodrigues M, Soltangheisi A, de Carvalho TS, Guilherme LRG, Benites VM, et al. Transitions to Sustainable Management of Phosphorus in Brazilian Agriculture. Sci Rep (2018) 8:1–13. doi: 10.1038/s41598-018-20887-z
17. Guppy CN, Menzies NW, Moody PW, Blamey FPC. Competitive Sorption Reactions Between Phosphorus and Organic Matter in Soil: A Review. Aust J Soil Res (2005) 43:189–202. doi: 10.1071/SR04049
18. Chassé AW, Ohno T. Higher Molecular Mass Organic Matter Molecules Compete With Orthophosphate for Adsorption to Iron (Oxy) Hydroxide. Environ Sci Technol (2016) 50:7461–9. doi: 10.1021/acs.est.6b01582
19. Menezes-Blackburn D, Giles C, Darch T, George TS, Blackwell M, Stutter M, et al. Opportunities for Mobilizing Recalcitrant Phosphorus From Agricultural Soils: A Review. Plant Soil (2018) 427:5–16. doi: 10.1007/s11104-017-3362-2
20. Kamh M, Horst WJ, Amer F, Mostafa H, Maier P. Mobilization of Soil and Fertilizer Phosphate by Cover Crops. Plant Soil (1999) 211:19–27. doi: 10.1023/A:1004543716488
21. Richardson AE, Hocking PJ, Simpson RJ, George TS. Plant Mechanisms to Optimise Access to Soil Phosphorus. Crop Pasture Sci (2009) 60:124–43. doi: 10.1071/CP07125
22. Abbas F, Hammad HM, Ishaq W, et al. A Review of Soil Carbon Dynamics Resulting From Agricultural Practices. J Environ Manag (2020) 268:110319. doi: 10.1016/j.jenvman.2020.110319
23. Rosset JS, Guareschi RF, Da Silva Rodrigues Pinto LA, Pereira MG, Do Carmo Lana M. Phosphorus Fractions and Correlation With Soil Attributes in a Chronosequence of Agricultural Under No-Tillage. Sem: Cienc Agrar (2016) 37(6):3915–26. doi: 10.5433/1679-0359.2016v37n6p3915
24. Bayer C, Mielniczuk J, Martin-Neto L, Ernani PR. Stocks and Humification Degree of Organic Matter Fractions as Affected by No-Tillage on a Subtropical Soil. Plant Soil (2002) 238:133–40. doi: 10.1023/A:1014284329618
25. Crème A, Rumpel C, Le Roux X, Romian A, Lan T, Chabbi A, et al. Ley Grassland Under Temperate Climate had a Legacy Effect on Soil Organic Matter Quantity, Biogeochemical Signature and Microbial Activities. Soil Biol Biochem (2018) 122:203–10. doi: 10.1016/j.soilbio.2018.04.018
26. Mathew RP, Feng Y, Githinji L, Ankumah R, Balkcom KS. Impact of No-Tillage and Conventional Tillage Systems on Soil Microbial Communities. Appl Environ Soil Sci (2012) 548620. doi: 10.1155/2012/548620
27. Rumpel C, Crème A, Ngo PT, Velásquez G, Mora ML, Chabbi A, et al. The Impact of Grassland Management on Biogeochemical Cycles Involving Carbon, Nitrogen and Phosphorus. J Soil Sci Plant Nutr (2015) 15:353–71. doi: 10.4067/s0718-95162015005000034
28. Crème A, Rumpel C, Gastal F, et al. Effects of Grasses and a Legume Grown in Monoculture or Mixture on Soil Organic Matter and Phosphorus Forms. Plant Soil (2016) 402:117–28. doi: 10.1007/s11104-015-2740-x
29. Poeplau C, Zopf D, Greiner B, Geerts R, Korvaar H, Thumm U, et al. Why Does Mineral Fertilization Increase Soil Carbon Stocks in Temperate Grasslands? Agric Ecosyst Environ (2018) 265:144–55. doi: 10.1016/j.agee.2018.06.003
30. Elser JJ, Fagan WF, Kerkhoff AJ, Swenson NG, Enquist BJ. Biological Stoichiometry of Plant Production: Metabolism, Scaling and Ecological Response to Global Change. N Phytol (2010) 186(3):593–608. doi: 10.1111/j.1469-8137.2010.03214.x
31. Turner BL, Cade-Menun BJ, Condron LM, Newman S. Extraction of Soil Organic Phosphorus. Talanta (2005) 66:294–306. doi: 10.1016/j.talanta.2004.11.012
32. Boitt G, Black A, Wakelin SA, McDowell RW, Condron LM. Impacts of Long-Term Plant Biomass Management on Soil Phosphorus Under Temperate Grassland. Plant Soil (2018) 427:163–74. doi: 10.1007/s11104-017-3429-0
33. Tyson J, Corkrey R, Burkitt L, Dougherty W. Modelling Changes in Soil Phosphorus When Phosphorus Fertiliser Is Reduced or Ceases. Front Environ Sci (2020) 8:93. doi: 10.3389/fenvs.2020.00093
34. Chabbi A, Kögel-Knabner I, Rumpel C. Stabilised Carbon in Subsoil Horizons Is Located in Spatially Distinct Parts of the Soil Profile. Soil Biology & Biochemistry (2009) 41:256–61. doi: 10.1016/j.soilbio.2008.10.033
35. Moni C, Chabbi A, Nunan N, Rumpel C, Chenu C. Spatial Dependance of Organic Carbon-Metal Relationships. A Multiscale Statistical Analysis, From Horizon to Field. Geoderma (2010) 158:120–7. doi: 10.1016/j.geoderma.2010.04.014
36. Hubert F, Caner L, Meunier A, Ferrag E. Unraveling Complex <2 μm Clay Mineralogy From Soils Using X-ray Diffraction Profile Modeling on Particle-Size Sub-Fractions: Implications for Soil Pedogenesis and Reactivity. American Mineralogist (2012) 97:2–3. doi: 10.2138/am.2012.3900
37. Hu T, Chabbi A. Does the Higher Root Carbon Contribution to Soil Under Cropping Cycles Following Grassland Conversion Also Increase Shoot Biomass? Sci Total Environ (2021) 752:141684. doi: 10.1016/j.scitotenv.2020.141684
38. Lemaire G, Jeuffroy MH, Gastal F. Diagnosis Tool for Plant and Crop N Status in Vegetative Stage: Theory and Practices for Crop N Management. Eur J Agron (2008) 28:614–24. doi: 10.1016/j.eja.2008.01.005
39. Masson P, Dalix T, Bussiere S. Determination of Major and Trace Elements in Plant Samples by Inductively Coupled Plasma-Mass Spectrometry. Commun Soil Sci Plant Anal (2010) 41:231–43. doi: 10.1080/00103620903460757
40. Walker TW, Adams AFR. Studies on Soil Organic Matter: I. Influence of Phos- Phorus Content of Parent Materials on Accumulations of Carbon, Nitrogen, Sulfur, and Organic Phosphorus in Grassland Soils. Soil Sci (1958) 85:307–18. doi: 10.1097/00010694-195806000-00004
41. Rheinheimer DS, Anghinoni I, Conte E. Fósforo Da Biomassa Microbiana Em Solos Sob Diferentes Sistemas De Manejo. Rev Bras Ciec Do Solo (2000) 24(3):589–97. doi: 10.1590/s0100-06832000000300012
42. Dick WA, Tabatabai MA. Determination of Orthophosphate in Aqueous Solutions Containing Labile Organic and Inorganic Phosphorus Compounds1. J Environ Qual (1977) 6:82. doi: 10.2134/jeq1977.00472425000600010018x
43. USEPA. Methods of Chemical Analysis for Water and Wastes. Cincinnati (1971) 491. EPA 600 4 79 020.
44. Murphy J, Riley JP. A Modified Single Solution Method for the Determination of Phosphate in Natural Waters. Anal Chem Acta (1962) 27:31–6. doi: 10.1016/S0003-2670(00)88444-5
45. Xue H, Lan X, Liang H, Zhang Q. Characteristics and Environmental Factors of Stoichiometric Homeostasis of Soil Microbial Biomass Carbon, Nitrogen and Phosphorus in China. Sustain (2019) 11:2804. doi: 10.3390/su11102804
46. Turner BL, Mahieu N, Condron LM. Phosphorus-31 Nuclear Magnetic Resonance Spectral Assignments of Phosphorus Compounds in Soil NaOH–EDTA Extracts. Soil Sci Soc Am J (2003) 67:497. doi: 10.2136/sssaj2003.0497
47. Turner BL, Richardson AE. Identification of Scyllo -Inositol Phosphates in Soil by Solution Phosphorus-31 Nuclear Magnetic Resonance Spectroscopy. Soil Sci Soc Am J (2004) 68:802–8. doi: 10.2136/sssaj2004.8020
48. Doolette AL, Smernik RJ, Dougherty WJ. Spiking Improved Solution Phosphorus-31 Nuclear Magnetic Resonance Identification of Soil Phosphorus Compounds. Soil Sci Soc Am J (2009) 73:919–27. doi: 10.2136/sssaj2008.0192
49. Cade-Menun BJ. Improved Peak Identification in 31P-NMR Spectra of Environmental Samples With a Standardized Method and Peak Library. Geoderma (2015) 257–258:102–14. doi: 10.1016/j.geoderma.2014.12.016
50. Hu T, Chabbi A. Grassland Management and Integration During Crop Rotation Impact Soil Carbon Changes and Grass-Crop Production. Agricult Ecosyst Environ (2022) 324:107703. doi: 10.1016/j.agee.2021.107703
51. Six J, Elliott ET, Paustian K, Doran JW. Aggregation and Soil Organic Matter Accumulation in Cultivated and Native Grassland Soils. Soil Sci Soc Am J (1998) 62:1367–77. doi: 10.2136/sssaj1998.03615995006200050032x
52. Balesdent J, Chenu C, Balabane M. Academic Entrepreneurial Orientation. Empirical Evidence From Life Sciences. Soil Tillag Res (2000) 53:215–30. doi: 10.1016/S0167-1987(99)00107-5
53. Rasse DP, Rumpel C, Dignac MF. Is Soil Carbon Mostly Root Carbon? Mechanisms for a Specific Stabilisation. Plant Soil (2005) 269:341–56. doi: 10.1007/s11104-004-0907-y
54. Henneron L, Cros C, Picon-Cochard C, Rahimian V, Fontaine S. Plant Economic Strategies of Grassland Species Control Soil Carbon Dynamics Through Rhizodeposition. J Ecol (2020) 108:528–45. doi: 10.1111/1365-2745.13276
55. Soltangheisi A, Rodrigues M, Coelho MJA, Gasperini AM, Sartor LR, Pavinato PS, et al. Changes in Soil Phosphorus Lability Promoted by Phosphate Sources and Cover Crops. Soil Tillag Res (2018) 179:20–8. doi: 10.1016/j.still.2018.01.006
56. Azeez MO, Rubæk GH, Pedersen IF, Christensen BT. Depletion, Accumulation and Availability of Soil Phosphorus in the Askov Long-Term Field Experiment. Soil Res (2020) 58:117–24. doi: 10.1071/SR19203
57. Kayser M, Isselstein J. Potassium Cycling and Losses in Grassland Systems: A Review. Grass Forag Sci (2005) 60:213–24. doi: 10.1111/j.1365-2494.2005.00478.x
58. Dubeux J. C. B., Sollenberger L. E. Nutrient Cycling in Grazed Pastures Elsevier Inc. In: Rouquette, M., Aiken, G. E. Management Strategies for Sustainable Cattle Production in Southern Pastures (2019) 59–75ISBN 9780128144749. doi: 10.1016/B978-0-12-814474-9.00004-9.
59. Rheinheimer DS, Somavilla A, Oliveira LB, Tiecher; T. Ciclo Biogeoquímico do Fósforo, Diagnóstico De Disponibilidade E Adubação Fosfatada. Porto Alegre (2020). Available at: https://www.researchgate.net/publication/345729958_Ciclo_biogeoquimico_do_fosforo_diagnostico_de_disponibilidade_e_adubacao_fosfatada.
60. Tiecher T, dos SDR, Kaminski J, Calegari A. Forms of Inorganic Phosphorus in Soil Under Different Long Term Soil Tillage Systems and Winter Crops. Rev Bras Ciec Do Solo (2012) 36:271–82. doi: 10.1590/s0100-06832012000100028
61. Cleveland CC, Liptzin D. C: N: P Stoichiometry in Soil: Is There a “Redfield Ratio” for the Microbial Biomass? Biogeochemistry (2007) 85:235–52. doi: 10.1007/s10533-007-9132-0
62. Xu X, Thornton PE, Post WM. A Global Analysis of Soil Microbial Biomass Carbon, Nitrogen and Phosphorus in Terrestrial Ecosystems. (2013), 737–49. doi: 10.1111/geb.12029
63. Condron LM, Goh KM, Newman RH. Nature and Distribution of Soil Phosphorus as Revealed by a Sequential Extraction Method Followed by 31P Nuclear Magnetic Resonance Analysis. J Soil Sci (1985) 36:199–207. doi: 10.1111/j.1365-2389.1985.tb00324.x
64. Doolette AL, Smernik RJ, Dougherty WJ. A Quantitative Assessment of Phosphorus Forms in Some Australian Soils. Soil Res (2011) 49:152–65. doi: 10.1071/SR10092
65. Abdi D, Cade-Menun BJ, Ziadi N, Shi Y, Bélanger G, Lajeunesse J, et al. A31 P-NMR Spectroscopic Study of Phosphorus Forms in Two Phosphorus-Fertilized Grassland Soils in Eastern Canada. Can J Soil Sci (2019) 99:161–72. doi: 10.1139/cjss-2018-0125
66. Rheinheimer DS, Fornari MR, Bastos MC, Fernandes G, Santanna MA, Calegari A, et al. Phosphorus Distribution After Three Decades of Different Soil Management and Cover Crops in Subtropical Region. Soil Tillag Res (2019) 192:33–41. doi: 10.1016/j.still.2019.04.018
67. Deiss L, de Moraes A, Dieckow J, Franzluebbers AJ, Gatiboni LC, Sassaki Glanzi, et al. Soil Phosphorus Compounds in Integrated Crop-Livestock Systems of Subtropical Brazil. Geoderma (2016) 274:88–96. doi: 10.1016/j.geoderma.2016.03.028
68. Cade-Menun BJ. Characterizing Phosphorus Forms in Cropland Soils With Solution 31P-NMR: Past Studies and Future Research Needs. Chem Biol Technol Agric (2017) 4:1–12. doi: 10.1186/s40538-017-0098-4
Keywords: forage, 31P-NMR, P export, P pools, C and N stocks, SOM, long-term
Citation: Somavilla A, Caner L, da Silva ICB, Rheinheimer DdS and Chabbi A (2022) Phosphorus Stock Depletion and Soil C:N:P Stoichiometry Under Annual Crop Rotations and Grassland Management Systems Over 13 Years. Front. Soil Sci. 2:863122. doi: 10.3389/fsoil.2022.863122
Received: 26 January 2022; Accepted: 22 June 2022;
Published: 22 July 2022.
Edited by:
Xiaogang Yin, China Agricultural University, ChinaReviewed by:
Sara L. Bauke, University of Bonn, GermanyXin Zhao, China Agricultural University, China
Copyright © 2022 Somavilla, Caner, da Silva, Rheinheimer and Chabbi. This is an open-access article distributed under the terms of the Creative Commons Attribution License (CC BY). The use, distribution or reproduction in other forums is permitted, provided the original author(s) and the copyright owner(s) are credited and that the original publication in this journal is cited, in accordance with accepted academic practice. No use, distribution or reproduction is permitted which does not comply with these terms.
*Correspondence: Abad Chabbi, abad.chabbi@inrae.fr