MagnEtophoretic Slider Assay (MeSA): A simple platform for point-of-care diagnostics
 Zachary D. Call1
  Charles S. Henry
- 1Department of Chemistry, Colorado State University, Fort Collins, CO, United States
- 2Department of Chemical and Biological Engineering, Colorado State University, Fort Collins, CO, United States
- 3School of Biomedical Engineering, Colorado State University, Fort Collins, CO, United States
Infectious diseases account for millions of deaths each year. To reduce the number of infectious disease related deaths, diagnostic testing needs to be more accessible to patients in low-income countries as well as developed countries. Current diagnostic methods involve centralized laboratories, trained personnel, and are time-intensive, limiting translation to the point-of-care (POC). Microfluidic devices are a popular alternative for diagnostics due to reduced assay times, reduced sample volume, and lower cost. Microfluidic devices are small (<10 cm) and can perform complex assays. Microfluidic paper-based analytical devices (µPADs) are a popular approach to help translate diagnostics to the POC but historically suffer from poor sensitivity when compared to established laboratory methods. Magnetically labeling analytes allows samples to be sorted resulting in improved sensitivity and specificity. Microfluidic magnetophoresis is the process of manipulating magnetic particles in a magnetic field and offers the ability to wash and concentrate a sample during flow. However, until recently, magnetophoresis has not been used in conjunction with µPADs because magnetophoresis requires complex and expensive instrumentation to control flow. Coupling magnetophoresis with µPADs enables pump-free flow control, simple operation, and low cost. Early magnetophoresis µPADs showed detection limits similar to traditional methods but higher than targets for clinical use. In this work, we demonstrate a novel, simple MagnEtophoretic Slider Assay (MeSA) that is free of any external instrumentation and offers a new platform for POC diagnostics. We demonstrate the assay’s capability through biotin competitive assays and a sandwich immunoassay for E. coli detection. The calculated limit of detection for E. coli was 1.62 × 10³ Colony Forming Units per mL (CFU/ml). The work described is a novel and simple microfluidic platform that has potential for a wide range of future applications.
1 Introduction
Infectious diseases account for millions of deaths each year globally, and approximately one-third of all annual deaths (Michaud, 2009). In 2020 alone 10 million people were diagnosed with tuberculosis and 1.5 million people died from their infection (World Health Organization, 2022). The World Health Organization (WHO) states that Point-of-Care (POC) diagnostics are critical to reducing the number of infectious disease related deaths each year (Yager et al., 2008; World Helath Organization, 2019). POC testing is performed at or near the site of the patient, reducing the time needed to obtain a result (Drain et al., 2014). However, current diagnostics are not accessible to all patients at the point of care, especially for those in low income countries (Bissonnette and Bergeron, 2010; Dye, 2014). To make current diagnostics more accessible to patients in need, assays need to be rapid, simple, and field-deployable (Yager et al., 2008). The COVID-19 pandemic demonstrated the need for accessible diagnostics effective for pathogen detection (Weissleder et al., 2020). Coupling existing laboratory techniques with microfluidic technology is a popular approach to improve sensitivity, specificity, and ease of use while making diagnostic testing more accessible (Nasseri et al., 2018).
Microfluidic devices can handle small sample volumes precisely without tedious user intervention making them ideal for POC testing (Yager et al., 2008; Nasseri et al., 2018). Microfluidic devices have been developed to detect bacteria, viruses, heavy metals in water, and other infectious agents (Yager et al., 2008; Chin et al., 2012; Lin et al., 2016; Bhardwaj et al., 2017; Nasseri et al., 2018). Traditional microfluidic devices have been fabricated using photolithography with silicon wafers, glass, quartz, and/or poly (dimethylsiloxane) (PDMS) using methods that are expensive, time intensive, and use harsh chemicals (Lei, 2012; Carrell et al., 2019a; Fu and Tokeshi, 2019; Oliveira et al., 2019). An alternative to traditional microfluidics is microfluidic paper-based analytical devices (µPADs). µPADs are paper-based microfluidic devices with patterned hydrophobic barriers to define fluid channels. There are several techniques to fabricate hydrophobic channels including; wax printing/dipping, photoresist, parafilm stamping, or as simple as drawing with a crayon (Noviana et al., 2021). µPADs are cheap, portable, and easy to fabricate in resource-limited settings (Ahmed et al., 2016; Carrell et al., 2019a). However, µPADs historically suffer from poor sensitivity and specificity when compared to traditional microfluidic techniques and established laboratory practices such as PCR and ELISA (Jokerst et al., 2012; Gong and Sinton, 2017). To improve sensitivity and specificity of µPADs, sample washing and concentration steps are needed (Aimeida et al., 2018; Akyazi et al., 2018; Carrell et al., 2019a).
Magnetophoresis is the process of manipulating magnetic particles in a magnetic field. Magnetophoresis allows magnetic particles to be pulled out of a sample matrix where the species can be concentrated and pulled through wash buffers to remove any non-specifically bound substances, improving assay sensitivity and specificity (Pamme and Manz, 2004; Alnaimat et al., 2018). The Pamme group pioneered the field of magnetophoresis using PDMS and glass chip systems using pumps to drive flow (Pamme and Manz, 2004; Pamme and Wilhelm, 2006; Phurimsak et al., 2014). They have demonstrated the ability to conjugate magnetic particles during flow, detect multiple analytes such as C-reactive protein, E. coli and Salmonella, and multiplex assays. Their work demonstrates the ability of magnetophoresis to simplify tedious laboratory techniques. However, traditional magnetophoresis is difficult to translate to the POC because of the need for external pumps, limiting portability (Pamme and Manz, 2004; Pamme and Wilhelm, 2006; Phurimsak et al., 2014; Ngamsom et al., 2016; Alnaimat et al., 2018). Immiscible filtration assisted by surface tension (IFAST) is a magnetophoresis technique that eliminates the need for external pumps. IFAST is a process to wash a magnetic complex by using a permanent magnet to drag the complex through an immiscible phase (Berry et al., 2011). While these methods address some of the problems with magnetophoresis, they still require complex fabrication and/or use of external pumps.
Recent work by the Henry group demonstrated the first example of magnetophoresis in µPADs without the need for external pumps for the detection of E. coli (Call et al., 2020). The limit of detection (LOD) was 105 CFU/ml of E. coli with no need for external pumps (Call et al., 2020). Even though this work demonstrated a proof of concept for magnetophoretic µPADs, several improvements are needed to make the method viable for POC work. First, the reported LOD in human pooled urine is at the upper limits of clinical levels. Second, several manual pipetting steps were required. Third, along with the motivation to transfer away from wax printing, magnetic particles can become trapped in the cellulose fibers, making magnetophoresis difficult (Mettakoonpitak et al., 2021).
In this work, we report a hybrid magnetophoresis µPAD building off the previous magnetophoresis and IFAST work to simplify user manipulation without the need for external pumps. In this assay, a solution containing magnetic particles is added to the center of a capillary flow microfluidic device. A magnet under the inlet traps particles but allows solution to flow to the outlets where reagents are rehydrated. To perform the assay, particles are pulled between reservoirs by sliding a permanent magnet along the device channels. We refer to the assay as the MagnEtophoretic Slider Assay (MeSA) based on the manipulation of particles by sliding the device. As proof of principle, we demonstrate a competitive assay for biotin and sandwich immunoassay for E. coli. To our knowledge this is the first example of this type of system coupled with µPADs. The MeSA described is a novel and simple platform that shows potential for a wide range of applications that can advance the microfluidic diagnostics.
2 Materials and methods
2.1 Materials
Hydrophilic transparency 9984 sheets were purchased from 3M. 467 and 468 Double-sided adhesive (DSA) sheets (467-MP-ND/468-MP-ND) were purchased through DigiKey. Glass fiber membrane (GFDX203000) was purchased Millipore Sigma (Burlington, MA). A cylindrical ¼” × ¼” Neodymium Iron Boron (NdFeB) permanent magnet, grade N52 (K&J Magnetics, INC.) was used to create an external magnetic field. Other magnet types and shapes were investigated; however, the cylindrical magnet was chosen because of the smaller size while maintaining strong field lines. The DynaMag Magnet was used for magnetic separations and purchased from Thermo Fisher Scientific (Waltham, MA). Streptavidin-coated paramagnetic beads (SVM-05-5H) were purchased from Spherotech Inc (Lake Forest, Illinois). Biotin-HRP (29139) and 1-step Ultra TMB-ELISA (34028) were purchased from Thermo Fisher Scientific. Biotin (58-85-5) and 55K Polyvinylpyrrolidone (PVP) were purchased from Sigma-Aldrich (St. Louis, MO). E. coli antibodies (bs-2033R/bs-2033R-A555) were purchased from Bioss Antibodies (Woburn, MA). The buffers used in this work were 0.1 M phosphate-buffered saline (PBS), a 0.1 M PBS with 0.1% Tween-20 (PBST), and a 1x stable peroxide buffer purchased from Thermo Fisher Scientific. The two antibodies were diluted in PBS before use. Human pooled urine was purchased from Lee BioSolutions (Maryland Heights, MO) and was not subject to IRB approval.
2.2 Device construction
The optimized device consists of five alternating layers of 9984 transparency and 468 DSA with a reagent glass fiber pad on each end of the device. The device was first assembled with a bottom layer of transparency film, followed by the first DSA layer outlining the fluid channel. The third layer of transparency was placed on top of layer two and was used to seal the fluid channel. Reagent pads were then loaded into the end wells. The following layer of DSA was then placed on top of the reagent pads followed by a final transparency layer to seal the whole device with vent holes on each end. Each layer has a hole in the middle of the device to allow sample to flow down to the bottom fluid channel. Devices were assembled in sets of three and then cut into singular devices before running the assay.
2.3 Glass fiber membrane preparation
Glass fiber membrane was first cut into 6 cm × 6 cm squares and loaded into a Petri dish. Excess 1% PVP prepared in DI water was added to the Petri dish and the glass fiber membrane was soaked for 10 min to fully coat the membrane. Excess PVP was then discarded into waste and membranes were placed onto a mesh for drying. Each membrane square was then dried overnight at 37°C. Following drying, the membrane was cut into circles using a 4 mm biopsy punch. Membrane circles were then stored in a sealed container with silica packets until use.
2.4 Imaging process
Images of each device were taken with a smartphone and imported into ImageJ for data analysis. A white background was used for each image and the smartphone was focused on same part of the TMB reagent pad before each image. Devices were placed in precisely the same spot under a light to control the consistency of the images.
2.5 Immunomagnetic separation (IMS)
Before binding steps, the streptavidin magnetic beads were aliquoted from a stock solution and washed with PBS to remove excess streptavidin not bound to the beads. The DynaMag Magnet was used to remove the magnetic beads from solution to remove the supernatant. The beads were then resuspended in PBS at the desired concentration for each assay.
2.5.1 Biotin competitive assay
The 3,3’,5,5’ - Tetremethylbenzidine (TMB) reagent pad was loaded with 30 µL and dried at 37°C in an oven for 1 h. The Biotin-HRP reagent pad was loaded with 10 μL at 1 mg/ml and dried at 37°C for 1 h. Biotin solutions (0.5 mg/ml—10 mg/ml) were prepared in PBS and incubated with 1 mg/ml of 0.4 µm streptavidin magnetic beads for 30 min while rotating at room temperature. A magnetic separation was conducted after conjugation to remove any unbound biotin and the resulting solution was washed with PBS-Tween (0.1%) and then resuspended into PBS at 1 mg/ml 60 µL of resulting solutions were then loaded into each device and the device was ran following established protocols.
2.5.2 Sandwich E. coli immunoassay
The TMB reagent pad was loaded with 30 µL and dried at 37°C for 1 h. 10 µL of the secondary anti-E. coli- HRP antibody was loaded onto the second reagent pad at 40 μg/ml and dried at 37°C for 1 h. First, 100 µL of 2.5 mg/ml 0.47 µm streptavidin magnetic beads were vortexed for 30 s at room temperature. Second, the beads were conjugated to 5 μg/ml of biotinylated anti-E. coli in a microcentrifuge tube for 20 min on a rotator. Third, IMS was performed using a magnet (DynaMag) to isolate and concentrate the magnetic bead-antibody complex by removing the supernatant and resuspending the content in 100 µL of PBS. Fourth, the bead-antibody complex was added to 1 ml of various concentrations of E. coli diluted in PBS and incubated on a rotator for 30 min. Another IMS step was performed to isolate and concentrate the sample, and to remove the supernatant. The complex was washed twice with PBS-Tween (0.1%) to remove any unbound species and blocked with 5% bovine serum albumin (BSA). Finally, 60 µL of the magnetic bead complex at varying concentrations of E. coli was then loaded into the device.
For requirements for a specific article type please refer to the Article Types on any Frontiers journal page. Please also refer to Author Guidelines for further information on how to organize your manuscript in the required sections or their equivalents for your field (Michaud, 2009).
3 Results and discussion
3.1 Device design and assembly
Traditional microfluidic magnetophoresis has demonstrated the ability to perform complex assays. However, it is difficult to use in resource limited settings because of the need for external pumps. IFAST offers the advantages of magnetophoresis without the need for external pumps but involves the complicated fabrication of a PDMS-glass microchip. We wanted to combine the advantages of IFAST with hybrid capillary devices to improve magnetophoresis µPADs. Previous works have shown the ability to rehydrate stored reagents on diagnostic membranes to then be sequentially bound (Martorell et al., 1999; Link et al., 2020). In this work, we have created a simple diagnostic platform, MeSA, that replaces the need for an external pump while also eliminating multiple pipetting steps by implementing a simple sliding a magnet operation. We have created a hybrid µPAD that operates by manually sliding a magnet to sequentially bind and wash magnetic complexes. The device is free of any external instrumentation, pumps, or complex fabrication. The devices are small (80 mm × 20 mm) and easily portable, making them ideal for POC testing.
The device assembly is shown in Figure 1A with blue arrows denoting how the fluid flows through the device. First, sample is added into the inlet and fluid flows down through the device until it reaches the bottom fluid channel. In this device, the channels are outlined by the laser cut DSA creating microfluidic channels. Second, capillary action initiates and fills the fluid channel. Third, after the channels are filled, the fluid flows upward to rehydrate the reagent pads. The reagents dried onto the glass fiber pads stay localized at the pad because after rehydration there is an excess sample in the inlet, allowing hydrostatic pressure to prevent fluid flow back toward the inlet (Simon et al., 2012; RobertChannon et al., 2019). Additionally, this keeps the fluid in the channel free of reagents and allows it to act as a wash buffer during the sliding operation. During the sliding operation, the labeled magnetic beads are allowed to move through the filled microfluidic channels left and right to each reagent pad. The ability to slide the streptavidin magnetic beads to reagent pads allows for simple and efficient labeling of the complex. Vent holes are cut into the top layer of transparency to allow air to escape, preventing air bubbles from forming in the fluid channel1.
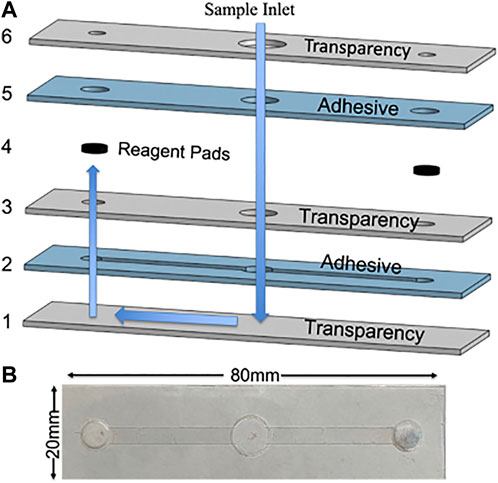
FIGURE 1. (A) CAD rendering of device assembly with alternating transparency and double-sided adhesive layers with blue arrows to indicate the operation of the fluid flow through the device. (B) Photograph.
3.2 Flow rate optimization
In 2018, Channon et al. (2018) reported the ability to control flow rate in multi-layer µPADs by varying the channel height (RobertChannon et al., 2019). For the MeSA, optimal channel height and flow rate are critical variables to produce consistent flow and elution of reagents from the reagent pads. Two DSA types were investigated to control flow rate, 3M-467 and 3M-468. 467 DSA has a 60 µm thickness while 468 DSA has a 120 µm thickness. Two measurements were taken to determine the optimal channel height and consistency of flow with varying fluid amounts from 40 to 100 µL. First, the time elapsed until fluid reached the reagent pad was measured and then the time elapsed until the pads were fully rehydrated. Yellow and blue food dye was dried on the reagent pads to visualize the flow and the time to rehydrate (Supplementary Material S1) Devices assembled with 467 DSA with a 60 µm channel height displayed high variability and slower flow to reach/rehydrate the pad. Devices assembled with 468 DSA, however, displayed smaller error and a decrease in time to reach/rehydrate the pad (Figure 2). We hypothesize this is due to the lower surface area to volume ratio with higher channel heights. Following this optimization, devices were assembled using 468 DSA. 60µL was chosen as the sample volume moving forward for the smallest sample volume with the shortest time to rehydrate the pad to reduce the time of the total assay. However, we demonstrate a wide range of sample volumes are compatible with this device.
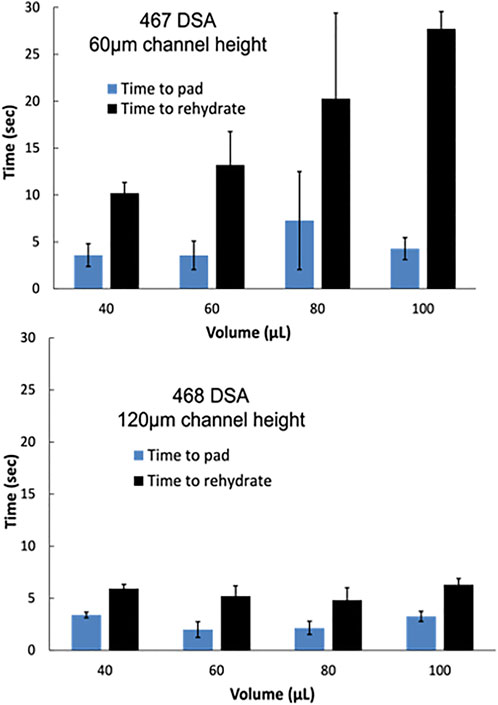
FIGURE 2. Flow rate optimization of varying device channel height with varying sample volume.
3.3 MeSA operation
The MeSA was first demonstrated using the four simple user steps displayed in Figure 3 using a competitive biotin assay. First, 60 µL of 1 mg/ml of streptavidin magnetic beads were loaded into the device sample inlet with a ×1 peroxide buffer where a permanent magnet was held stationary underneath the device to allow for the magnetic beads to be held at the magnetic field. 15 s was allotted for flow to initiate via capillary action and to rehydrate each of the reagent pads. Second, the magnet was then slid to the first reagent pad loaded with biotin-horseradish peroxidase (HRP). When sliding the magnet over the beads, they are held at the high magnetic field of the magnet. The magnet and beads were moved to under the reagent pad to allow for the most contact between the beads and the biotin-HRP. Third, the magnetic beads underwent a 1-min incubation to allow conjugation of the biotin-HRP to the streptavidin magnetic beads. Fourth, the magnet and conjugated beads were then moved back across the device to the TMB reagent pad to allow for the enzymatic reaction to occur (Figure 3). The speed at which the user can slide the magnet over to the TMB pad was investigated and found to be consistent when more than 4s was allotted when sliding the magnet (Supplementary Material S2). Once the magnetic beads with conjugated biotin-HRP reached the TMB pad, the oxidation of TMB began with the presence of H2O2 from the peroxide buffer. TMB oxidized to a blue diimine product; the blue color intensity is dependent to the amount of peroxidase present which can then be correlated to concentration using ImageJ software (Busa et al., 2016a). After 10 minutes, images were taken for data analysis for the optimizations and following assays.

FIGURE 3. Assay operation following four steps. (1) Sample was inserted and within 15s the pads are rehydrated. (2) Magnetic beads were then slid from the inlet to Biotin-HRP reagent pad. (3) A 1-min incubation was then allotted for biotin-streptavidin.
3.3.1 Data evaluation
For each test condition (n of 3), the TMB-HRP enzymatic reaction was timed, and images were taken using a smartphone in a controlled light environment. Images were imported into ImageJ, inverted, transferred to 8-bit, and split into RBG channels as described in the experimental section. Mean grey scale intensity measurements were taken following published protocols (Link et al., 2020). The placement of bead complexes under the TMB pad varied slightly, so a consistent circular area was measured in each image where the highest intensity blue diimine TMB color forms. Mean grey scale intensity plots were created for the optimization, biotin, and E. coli assay experiments. We found that the red channel provided the largest signal to background difference for the measurement. Quantification of the intensity of the blue formation is then calculated using the equation below. The mean grey scale intensity, IM, is calculated by dividing the test intensity, It, by a control intensity, Ic. The control intensity is the same measured area of the blank background (Busa et al., 2016a; Busa et al., 2016b).
3.3.2 Biotin assay optimization
To improve the function of the assay, several parameters were optimized including PVP, biotin-HRP, and TMB concentrations and incubation time. Previous works demonstrated the ability of PVP to provide sufficient blocking of membranes while allowing for recovery of reagents (Martorell et al., 1999; Miller-Jaster et al., 2012). 1% PVP blocker of reagent pads yielded the highest blue color intensity and was adopted for subsequent studies (Figure 4A). Biotin-HRP optimization demonstrated the ability to show a concentration dependence of peroxidase (Figure 4B). Varying volumes of TMB were investigated and 30 µL of TMB was determined to give the strongest blue TMB diimine intensity (Figure 4C). Finally, the incubation time of the streptavidin magnetic beads with biotin-HRP was investigated. Incubation times longer than 60 s did not increase signal so 60 s incubation time was used for following assays.
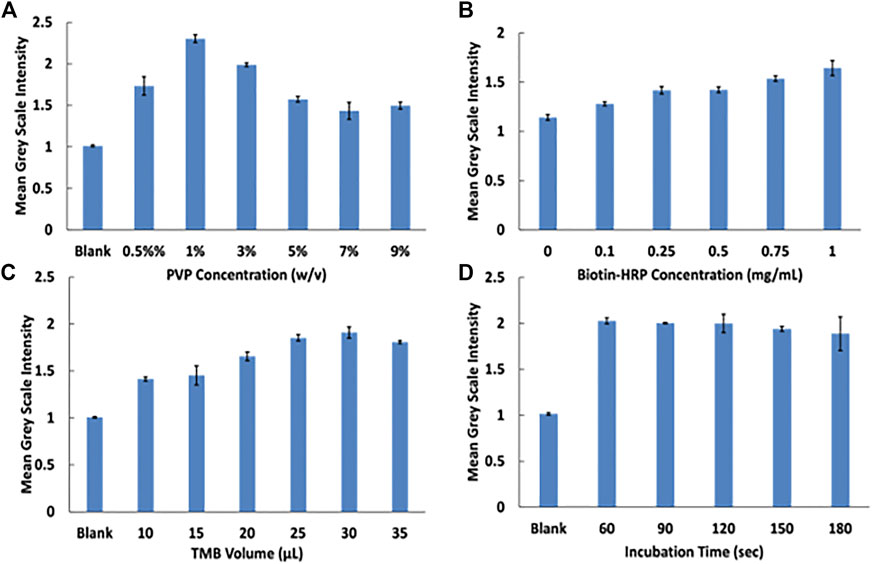
FIGURE 4. Assay optimization experiments. (A) PVP optimization at varying concentrations. (B) Biotin-HRP concentration optimization. (C) TMB volume optimization. (D) Magnetie beads with biotin-HRP incubation time.
3.4 Biotin competitive assay
A biotin competitive assay was performed as a proof-of-principle demonstration. Competitive assays are widely popular for the detection of small molecules and a common format for at home drug testing kits. Competitive assays are based off the competitive binding between target analytes present in the sample and immobilized antigens that are labeled to detection antibodies. Competitive assays are ideal for the detection of small molecules because there is typically only one epitope available on the antigen to bind (Zettner, 1973). Here, concentrations from 0 to 10 mg/ml of unbound biotin was reacted with 1 mg/ml streptavidin magnetic beads in a microcentrifuge tube for 30 min while rotating. Upon mixing, the streptavidin coated magnetic beads binds to the free biotin. A magnetic separation was then performed to remove any remaining unbound biotin. As the sample is introduced into the device, the sample is carried via capillary action to the reagent pads where the biotinylated horseradish peroxidase is immobilized.
The competitive biotin MeSA was then completed to determine a linear range where the blue diimine TMB formation (Figure 5). Figure 5 shows the relative colorimetric intensity versus the biotin concentration added to the streptavidin magnetic beads. Here we demonstrate the competitive assay in PBS and human pooled urine with spiked peroxide buffer to provide H2O2 for the enzymatic reaction to occur. Each curve was fit to a four-parameter logistic curve (4 PL). A 4 PL logistic curve is commonly used for immunoassays because of limiting binding kinetics (Gottschalk and Dunn, 2005). Limits of detection (LOD) was calculated for each assay at the low concentration/high-signal end of the curve as the concentration that produced signal two-standard deviations of the zero biotin signal below the zero biotin signal (Murphy et al., 2008). The LOD was calculated to be 1.3 mg/ml for the assay in PBS and 0.91 mg/ml for the assay in human pooled urine.
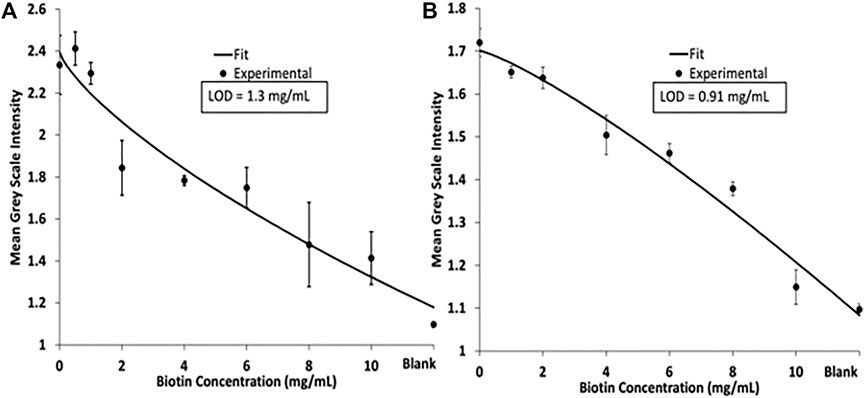
FIGURE 5. (A) 4 PL logistic curve of a biotin competitive assay performed in PBS. (B) 4 PL logistic curve of biotin competitive assay in human pooled urine.
For successful operation of this MeSA, magnetic beads need to be visualized to ensure successful transfer of beads across the device. Due to this, a higher concentration of streptavidin magnetic beads is needed. The high concentrations of biotin needed to see a hinderance of signal intensity is due to each streptavidin molecule having four identical binding sites for biotin. To improve sensitivity of this assay, future iterations will focus on starting with biotinylated magnetic beads rather than streptavidin coated magnetic beads. We will create competition between biotinylated magnetic beads and streptavidin-HRP. Varying concentrations of free biotin and streptavidin-HRP will be premixed and then immobilized onto the reagent pad. The free biotin will block binding sites for the biotin magnetic beads on the streptavidin-HRP. By using this format for future experiments, it will allow us to still use a high concentration of magnetic beads to visualize bead transfer and improve sensitivity for this competitive biotin assay Figure 6.
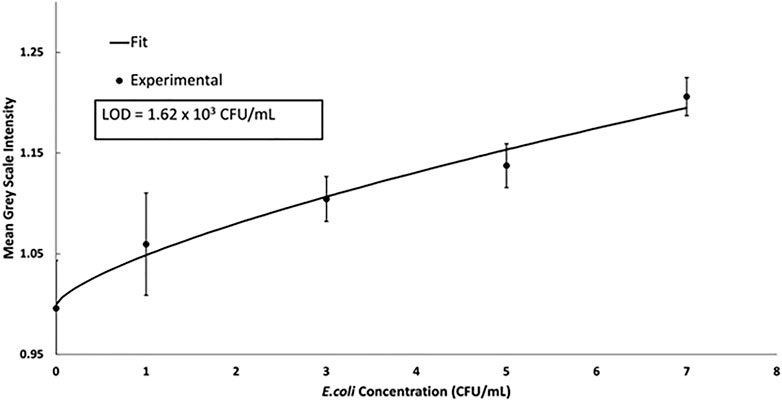
FIGURE 6. 4PL logistic curve of the sandwich E. coli assay at varying concentrations.
3.5 Sandwich immunoassay for E. coli detection
Sandwich immunoassays are also commonly used for the detection of small molecules and pathogens. In a sandwich immunoassay, the target analyte is sandwiched between a capture and detection antibody. The signal intensity is proportional to the concentration of the analyte. Detection of DH5-alpha E. coli was conducted using a magnetic sandwich immunoassay to show the versatility of the device described. A biotinylated-E. coli antibody was conjugated to the streptavidin magnetic beads in a microcentrifuge tube. Varying concentrations of E. coli were then conjugated to the magnetic bead complex. Clinical ranges for E. coli in urinary tract infection diagnostic tests are commonly found to be in the range of 105 CFU/ml. The data was fit to a 4 PL logistic curve and the LOD of 1.62 × 10³ CFU/ml was calculated using the 4 PL (
4 Conclusion and future work
Current diagnostic tests are performed in centralized laboratories, require trained personnel, and are time intensive. POC diagnostic testing such as µPADs has historically been critiqued for low sensitivity however, recent advancements in microfluidics coupled with magnetophoresis has showed promise to improve diagnostics. Here, we have described a novel platform for diagnostic assays using the MeSA. A biotin competitive assay and sandwich immunoassay for E. coli detection were completed to demonstrate versatility and functionality. The MeSA is a user-friendly, rapid, and portable platform that we envision to be used for a wide range of POC diagnostics. Future iterations of this device will focus on device optimization to reduce reagent concentrations and improve sensitivity through the integration of electrochemical sensors (Santhiago et al., 2013; Adkins et al., 2017).
Data availability statement
The original contributions presented in the study are included in the article/Supplementary Material, further inquiries can be directed to the corresponding author.
Author contributions
All experiments described in this work were conducted by ZC with the assistance of AD and JB. ZC is the primary author of this work with final edit contributions from AD, JB, and CH.
Funding
The Funding was provided by Colorado State University.
Acknowledgments
We would like to thank Colorado State University for providing funding for this project.
Conflict of interest
The authors declare that the research was conducted in the absence of any commercial or financial relationships that could be construed as a potential conflict of interest.
Publisher’s note
All claims expressed in this article are solely those of the authors and do not necessarily represent those of their affiliated organizations, or those of the publisher, the editors and the reviewers. Any product that may be evaluated in this article, or claim that may be made by its manufacturer, is not guaranteed or endorsed by the publisher.
Supplementary material
The Supplementary Material for this article can be found online at: https://www.frontiersin.org/articles/10.3389/fsens.2022.1080037/full#supplementary-material
Footnotes
1For Original Research articles, please note that the Material and Methods section can be placed in any of the following ways: before Results, before Discussion or after Discussion.
References
Adkins, J. A., Boehle, K., Friend, C., Chamberlain, B., Bisha, B., and Henry, C. S. (2017). Colorimetric and electrochemical bacteria detection using printed paper- and transparency-based analytic devices. Anal. Chem. 89 (6), 3613–3621. doi:10.1021/acs.analchem.6b05009
Ahmed, S., Bui, M. P. N., and Abbas, A. (2016). Paper-based chemical and biological sensors: Engineering aspects. Biosens. Bioelectron. 77, 249–263. doi:10.1016/j.bios.2015.09.038
Aimeida, M. I. G. S., Jayawardane, B. M., Kolev, S. D., and McKelvie, I. D. (2018). Developments of microfluidic paper-based analytical devices (mu PADs) for water analysis: A review. Talanta 177, 176–190. doi:10.1016/j.talanta.2017.08.072
Akyazi, T., Basabe-Desmonts, L., and Benito-Lopez, F. (2018). Review on microfluidic paper-based analytical devices towards commercialisation. Anal. Chim. Acta 1001, 1–17. doi:10.1016/j.aca.2017.11.010
Alnaimat, F., Dagher, S., Mathew, B., Hilal-Alnqbi, A., and Khashan, S. (2018). Microfluidics based magnetophoresis: A review. Chem. Rec. 18 (11), 1596–1612. doi:10.1002/tcr.201800018
Berry, S. M., Alarid, E. T., and Beebe, D. J. (2011). One-step purification of nucleic acid for gene expression analysis via Immiscible Filtration Assisted by Surface Tension (IFAST). Lab a Chip 11 (10), 1747–1753. doi:10.1039/c1lc00004g
Bhardwaj, J., Devarakonda, S., Kumar, S., and Jang, J. (2017). Development of a paper-based electrochemical immunosensor using an antibody-single walled carbon nanotubes bio-conjugate modified electrode for label-free detection of foodborne pathogens. Sensors Actuators B Chem. 253, 115–123. doi:10.1016/j.snb.2017.06.108
Bissonnette, L., and Bergeron, M. G. (2010). Diagnosing infections--current and anticipated technologies for point-of-care diagnostics and home-based testing. Clin. Microbiol. Infect. 16 (8), 1044–1053. doi:10.1111/j.1469-0691.2010.03282.x
Busa, L. S. A., Maeki, M., Ishida, A., Tani, H., and Tokeshi, M. (2016). Simple and sensitive colorimetric assay system for horseradish peroxidase using microfluidic paper-based devices. Sensors Actuators B Chem. 236, 433–441. doi:10.1016/j.snb.2016.06.013
Busa, L. S. A., Mohammadi, S., Maeki, M., Ishida, A., Tani, H., and Tokeshi, M. (2016). A competitive immunoassay system for microfluidic paper-based analytical detection of small size molecules. Analyst 141 (24), 6598–6603. doi:10.1039/c6an01475e
Call, Z. D., Carrell, C. S., Jang, I., Geiss, B. J., Dandy, D. S., and Henry, C. S. (2020). Paper-based pump-free magnetophoresis. Anal. Methods 12 (43), 5177–5185. doi:10.1039/d0ay01523g
Carrell, C., Kava, A., Nguyen, M., Menger, R., Munshi, Z., Call, Z., et al. (2019). Beyond the lateral flow assay: A review of paper-based microfluidics. Microelectron. Eng. 206, 45–54. doi:10.1016/j.mee.2018.12.002
Carrell, C. S., Wydallis, R. M., Bontha, M., Boehle, K. E., Beveridge, J. R., Geiss, B. J., et al. (2019). Rotary manifold for automating a paper-based Salmonella immunoassay. RSC Adv. 9 (50), 29078–29086. doi:10.1039/c9ra07106g
Channon, R. B., Nguyen, M. P., Scorzelli, A. G., Henry, E. M., Volckens, J., Dandy, D. S., et al. (2018). Rapid flow in multilayer microfluidic paper-based analytical devices. Lab a Chip 18 (5), 793–802. doi:10.1039/c7lc01300k
Chin, C. D., Linder, V., and Sia, S. K. (2012). Commercialization of microfluidic point-of-care diagnostic devices. Lab a Chip 12 (12), 2118–2134. doi:10.1039/c2lc21204h
Drain, P. K., Hyle, E. P., Noubary, F., Freedberg, K. A., Wilson, D., Bishai, W. R., et al. (2014). Diagnostic point-of-care tests in resource-limited settings. Lancet Infect. Dis. 14 (3), 239–249. doi:10.1016/s1473-3099(13)70250-0
Dye, C. (2014). After 2015: Infectious diseases in a new era of health and development. Philosophical Trans. R. Soc. B-Biological Sci. 369 (1645), 20130426. doi:10.1098/rstb.2013.0426
Fu, E. (2019). “Paper microfluidics for POC testing in low-resource settings,” in Applications of microfluidic systems in biology and medicine. Editor M. Tokeshi (Singapore: Springer Singapore), 325–352.
Gong, M. M., and Sinton, D. (2017). Turning the page: Advancing paper-based microfluidics for broad diagnostic application. Chem. Rev. 117 (12), 8447–8480. doi:10.1021/acs.chemrev.7b00024
Gottschalk, P. G., and Dunn, J. R. (2005). The five-parameter logistic: A characterization and comparison with the four-parameter logistic. Anal. Biochem. 343 (1), 54–65. doi:10.1016/j.ab.2005.04.035
Jokerst, J. C., Emory, J. M., and Henry, C. S. (2012). Advances in microfluidics for environmental analysis. Analyst 137 (1), 24–34. doi:10.1039/c1an15368d
Lei, K. F. (2012). Microfluidic systems for diagnostic applications: A review. J. laboratory automation 17 (5), 330–347. doi:10.1177/2211068212454853
Lin, Y., Gritsenko, D., Feng, S., Teh, Y. C., Lu, X., and Xu, J. (2016). Detection of heavy metal by paper-based microfluidics. Biosens. Bioelectron. 83, 256–266. doi:10.1016/j.bios.2016.04.061
Link, J., Carrell, C., Jang, I., Panraksa, Y., Sánchez-Cano, A., Call, Z., et al. (2020). Power-free automated capillary flow assay for SARS-CoV-2 detection. MicroTAS-Int. Conf. Miniaturized Syst. Chem. Life Sci. 2020, 536–537.
Martorell, D., Siebert, S. T. A., and Durst, R. A. (1999). Liposome dehydration on nitrocellulose and its application in a biotin immunoassay. Anal. Biochem. 271 (2), 177–185. doi:10.1006/abio.1999.4134
Mettakoonpitak, J., Khongsoun, K., Wongwan, N., Kaewbutdee, S., Siripinyanond, A., Kuharuk, A., et al. (2021). Simple biodegradable plastic screen-printing for microfluidic paper-based analytical devices. Sensors Actuators B Chem. 331, 129463. doi:10.1016/j.snb.2021.129463
Michaud, C. (2009). Global burden of infectious diseases. Encycl. Microbiol. 444, 444–454. doi:10.1016/b978-012373944-5.00185-1
Miller-Jaster, K. N., Petrie Aronin, C. E., and Guilford, W. H. (2012). A quantitative comparison of blocking agents in the in vitro motility assay. Cell. Mol. Bioeng. 5 (1), 44–51. doi:10.1007/s12195-011-0202-y
Murphy, B. M., He, X., Dandy, D., and Henry, C. S. (2008). Competitive immunoassays for simultaneous detection of metabolites and proteins using micromosaic patterning. Anal. Chem. 80 (2), 444–450. doi:10.1021/ac7019046
Nasseri, B., Soleimani, N., Rabiee, N., Kalbasi, A., Karimi, M., and Hamblin, M. R. (2018). Point-of-care microfluidic devices for pathogen detection. Biosens. Bioelectron. 117, 112–128. doi:10.1016/j.bios.2018.05.050
Ngamsom, B., Esfahani, M. M., Phurimsak, C., Lopez-Martinez, M. J., Raymond, J. C., Broyer, P., et al. (2016). Multiplex sorting of foodborne pathogens by on-chip free-flow magnetophoresis. Anal. Chim. Acta 918, 69–76. doi:10.1016/j.aca.2016.03.014
Noviana, E., Ozer, T., Carrell, C. S., Link, J. S., McMahon, C., Jang, I., et al. (2021). Microfluidic paper-based analytical devices: From design to applications. Chem. Rev. 121 (19), 11835–11885. doi:10.1021/acs.chemrev.0c01335
Oliveira, N. M., Vilabril, S., Oliveira, M. B., Reis, R. L., and Mano, J. F. (2019). Recent advances on open fluidic systems for biomedical applications: A review. Mater. Sci. Eng. C 97, 851–863. doi:10.1016/j.msec.2018.12.040
Pamme, N., and Manz, A. (2004). On-chip free-flow magnetophoresis: Continuous flow separation of magnetic particles and agglomerates. Anal. Chem. 76 (24), 7250–7256. doi:10.1021/ac049183o
Pamme, N., and Wilhelm, C. (2006). Continuous sorting of magnetic cells via on-chip free-flow magnetophoresis. Lab a Chip 6 (8), 974–980. doi:10.1039/b604542a
Phurimsak, C., Tarn, M. D., Peyman, S. A., Greenman, J., and Pamme, N. (2014). On-chip determination of C-reactive protein using magnetic particles in continuous flow. Anal. Chem. 86 (21), 10552–10559. doi:10.1021/ac5023265
RobertChannon, B., Henry, C. S., and Dandy, D. S. (2019). Multilayered microfluidic paper-based devices: Characterization, modeling, and perspectives. Anal. Chem. 91, 8966–8972. doi:10.1021/acs.analchem.9b01112
Santhiago, M., Wydallis, J. B., Kubota, L. T., and Henry, C. S. (2013). Construction and electrochemical characterization of microelectrodes for improved sensitivity in paper-based analytical devices. Anal. Chem. 85 (10), 5233–5239. doi:10.1021/ac400728y
Simon, M. G., Lin, R., Fisher, J. S., and Lee, A. P. (2012). A Laplace pressure based microfluidic trap for passive droplet trapping and controlled release. Biomicrofluidics 6 (1), 014110. doi:10.1063/1.3687400
Weissleder, R., Lee, H., Ko, J., and Pittet, M. J. (2020). COVID-19 diagnostics in context. Sci. Transl. Med. 12 (546), eabc1931. doi:10.1126/scitranslmed.abc1931
World Helath Organization (2019). WHO model list of essential in vitro diagnostics. World Health Organization. AvaliableAt: https://www.who.int/publications/i/item/WHO-MVP-EMP-2019.05
World Health Organization (2022). Tuberculosis. AvaliableAt: https://www.who.int/news-room/fact-sheets/detail/tuberculosis#:∼:text=A%20total%20of%201.5%20million,(above%20HIV%2FAIDS.
Yager, P., Domingo, G. J., and Gerdes, J. (2008). Point-of-care diagnostics for global health. Annu. Rev. Biomed. Eng. 10, 107–144. doi:10.1146/annurev.bioeng.10.061807.160524
Keywords: microfluidics, immunoassay, point-of-care, diagnostics, bacteria, magnetic particles
Citation: Call ZD, Dolence A, Boes J and Henry CS (2023) MagnEtophoretic Slider Assay (MeSA): A simple platform for point-of-care diagnostics. Front. Sens. 3:1080037. doi: 10.3389/fsens.2022.1080037
Received: 25 October 2022; Accepted: 23 December 2022;
Published: 10 January 2023.
Edited by:
Fabiana Arduini, University of Rome Tor Vergata, ItalyReviewed by:
Ronaldo Censi Faria, Federal University of São Carlos, BrazilJunseop Lee, Gachon University, Republic of Korea
Copyright © 2023 Call, Dolence, Boes and Henry. This is an open-access article distributed under the terms of the Creative Commons Attribution License (CC BY). The use, distribution or reproduction in other forums is permitted, provided the original author(s) and the copyright owner(s) are credited and that the original publication in this journal is cited, in accordance with accepted academic practice. No use, distribution or reproduction is permitted which does not comply with these terms.
*Correspondence: Charles S. Henry, Chuck.Henry@colostate.edu
†ORCID: Charles S. Henry, orcid.org/0000-0002-8671