Nanoparticle-Based FM-MCF LSPR Biosensor With Open Air-Hole
 Chuanhao Yang
 Shiyan Xiao
  Dagong Jia
- Key Laboratory of Micro Opto-Electro Mechanical System Technology, Key Laboratory of Opto-electronics Information Technology Ministry of Education, School of Precision Instrument and Opto-electronics Engineering, Tianjin University, Tianjin, China
A nanoparticle-based few-mode multi-core fiber (FM-MCF) localized surface plasmon resonance (LSPR) biosensor is proposed and analyzed using the finite element method (FEM). It’s critical to narrow the loss spectrum and improve the coupling efficiency, which makes it have high resolution and high sensitivity. With the aid of open air holes, the gold nanoparticles are easily assembled on the surface of this FM-MCF LSPR biosensor. Through multiple investigations, the performance of the sensor can be improved by properly setting gold nanoparticle configurations, such as radius, positions, shapes, and nanoparticle arrays. The simulation results show that when three circular gold nanoparticles with a radius of 150 nm are placed symmetrically in the open air hole and the angle between adjacent nanoparticles is 5°, the maximum sensitivity of 7,351.6 nm/RIU (LP02y mode na = 1.38) can be obtained in the sensing range of 1.33–1.38, which covers the refractive index (RI) of biological fluids, such as bovine serum albumin (BSA) solution and human Immunoglobulin G.
Introduction
Optical biosensors have shown good performance in detecting biological systems and have promoted major advances in clinical diagnosis, drug discovery, food safety, and environmental monitoring (Chiavaioli et al., 2017a; Zanchetta et al., 2017; Sinibaldi et al., 2018; Min Y, 2020) This is due to the high sensitivity, anti-interference, stability, low noise, and other advantages of optical signals. Localized surface plasmon resonance (LSPR) biosensors are extensively employed because they show many significant advantages over conventional optical biosensors, including high refractive index (RI) sensitivity, fast sensor response, real-time detection, and a label-free technique (Chen and Ming, 2012; Cao et al., 2014). With the development of nanotechnology, biosensors based on LSPR have attracted more attention from researchers (Chen et al., 2020; Li et al., 2020; Wang et al., 2020), LSPR phenomenon exists in metal nanoparticles (MNP) rather than bulk metals, the collective oscillation occurs when the conduction electrons in the nanoparticles have the same frequency as the incident photons. When LSPR is excited, the absorption and scattering of photons are greatly enhanced, and a resonance peak appears in the wide spectral range.
Nanoparticles play a vital role in LSPR excitation, when metal particles are in nanoscale size and smaller than the light wavelength, their physical properties change dramatically (Willets and Van Duyne, 2007). Because of the high specific surface area, nanoparticles can be used to overcome the limitations of SPR sensor performance. Moreover, the localized surface plasmon is distributed in a small region near the particle surface, so the LSPR can be controlled by changing the particle properties, such as particle size, shape, and composition (Chen et al., 2008). Size and shape dependence allows the resonance peak to be adjusted along the entire visible and near-infrared spectrum, meanwhile, it is useful for optimizing surface enhancement, heat treatment, and enhancing the biosensor response of nanoparticles. In addition, LSPR is highly responsive to RI variation around the MNPs, and the resonance peak shift can be used to monitor the local RI changes caused by the interactions of biomolecules around nanoparticles, so LSPR biosensors are suitable for observing very low concentration of biological liquid analytes and molecules of small weight (Cottat et al., 2013).
Optical fiber offers great advantages for LSPR sensor design. It has been confirmed that expanding the area of LSPR is the key to designing efficient biosensors since the size of the LSPR area is directly proportional to sensing abilities of RI variations in the biological liquid analyte (He, 2019). Therefore, fiber sensor with open structure is more feasible, in which the groove channels can be easily covered or coated with nanoparticles. In such design, the LSPR region is enlarged and the contact of the biological liquid analyte with the nanoparticles is unimpeded. Several open structure sensors have been developed. Liu et al. proposed a mid-infrared SPR sensor with two open-ring channels based on PCF, a thin gold film is deposited on the wall of the open-rings and the liquid analyte can penetrate the channels (Liu et al., 2017). Since the core mode simultaneously activates the SPR at two open-ring channels, the sensing channel cannot be selected. Yang et al. presented a concave-shaped PCF combined with square-channel using indium tin oxide (ITO) for SPR sensing (Yang et al., 2019). Although the role of the groove sensing channel is not mentioned and emphasized in the two papers, the distribution of sensing channels provides useful insight for addressing the problems in the detection of liquid biological substances.
To solve the above problems, we propose nanoparticle-based few-mode multi-core fiber (FM-MCF) LSPR biosensor with open air holes. Due to the air holes distribution of the FM-MCF, the six outer open air holes allow the gold nanoparticles to be easily assembled on the surface of the sensor and enlarge the LSPR area. FM-MCF combines the advantages of multi-core fibers (MCFs) and few-mode fibers (FMFs) that aims to narrow the loss spectrum and improve the coupling efficiency (Dong et al., 2019). which make the sensors have high resolution and high sensitivity (Mollah and Islam, 2020; Singh et al., 2020). Furthermore, MCFs are beneficial to realize multi-channel sensing (Wei et al., 2017). Although FM-MCF sensors have been studied (Yang et al., 2017; Wang et al., 2018; Yao et al., 2019), the application in biochemical has been rarely reported. The LSPR biosensor we propose exhibits high sensitivity in liquid analyte detection, and therefore has potential in chemical and biological sensing (Chiavaioli et al., 2018; Zheng et al., 2018; Zubiate et al., 2019).
Preparation Sensing Model and Simulation
Figure 1A is a schematic diagram of the FM-MCF LSPR sensor system device; the entire system includes light source (Ocean Optics HL-2000), seven-core fiber fan-in/fan-out modules (FAN 7–42,YOFC), FM-MCF sensor, glass tank and spectrometer (Ocean Optics HR4000CG-UV-NIR). The FM-MCF is connected to the light source and the spectrometer through single-mode seven-core optical fibers (SM-SCF). It’s a part of a fan-in/fan-out module as shown in Figure 1B, and the other end of this module is composed of seven single mode fibers (SMFs). The area with a length of 1cm in the middle of the FM-MCF is made as the sensing area, Figure 1C is the cross section of the sensing area, where the seven cores are arranged in a hexagonal shape and each core is surrounded by six air holes to form a hexagon. As seen in Figure 1D, the cladding diameter of the FM-MCF without the coating layer is 192 μm, the core diameter is 13.1 μm, the air hole diameter is 9.4 μm, the core pitch is 40 μm, and the air hole pitch is 13.3 μm. In order to fabricate the groove sensing channels which can be seen in Figure 1C, the six outermost air holes of FM-MCF are etched to be tangent to the cores using hydrofluoric acid. Then, the six open air holes are used to assemble nanoparticles and hold biological liquid analytes. When gold nanoparticles are filled into these groove sensing channels, our biosensor can detect many kinds of biological liquid analytes.
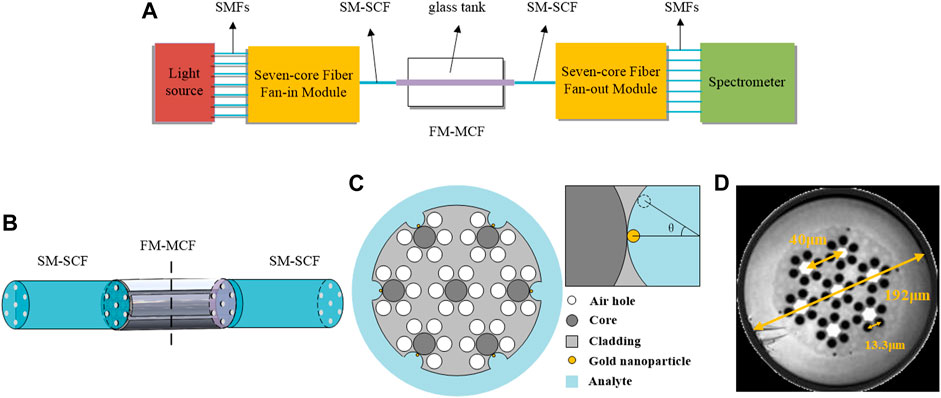
FIGURE 1. (A) Schematic diagram of the FM-MCF LSPR sensor system device; (B) Connection between the seven-core fiber fan-in/fan-out module and the FM-MCF; (C) Geometric model of the FM-MCF LSPR sensor’s sensing area and the structure of gold nanoparticles; (D) Cross-section of the FM-MCF. Inset in Figure 1 depicts the placement of gold nanoparticles.
In order to find the optimized parameters for the FM-MCF LSPR sensor, the finite element method (FEM) software COMSOL Multiphysics is used to numerically simulate the performance. In the model wizard window, we select Frequency Domain (ewfd) in Electromagnetic Waves module and Mode Analysis in Select Study. The simulation model in COMSOL is illustrated in Figure 2A. Due to the geometric symmetry and low core-to-core crosstalk (Van Uden et al., 2014), each fiber core is considered to transmit light independently. Hence, only one-sixth of the whole fiber needs to be calculated. As FEM mesh shows, orange lines are periodic boundary conditions, and perfectly matched layer (PML) is set on the outmost layer. Besides, the free triangular mesh is used to segment the computation area. The computational region contains 22,161 domain elements and the number of degrees of freedom is 155,738. Figure 2B is the zoom-in of the red square which depicts a gold nanoparticle with a radius of 150 nm attached to the etched open air-hole.
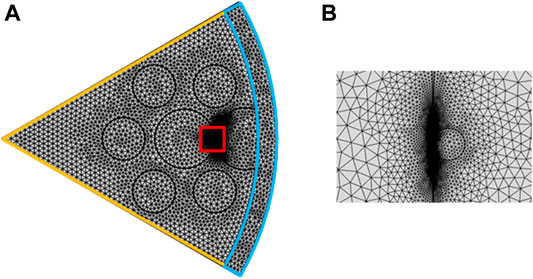
FIGURE 2. (A) Simulation model in COMSOL; (B) Gold nanoparticle is attached to the etched air hole which is the zoom-in of the red square.
During the simulation, The refractive index of pure silica can be described by Sellmeier equation (Sellmeier, 1871). The dielectric constant of gold in the visible and near-IR region is given by the Drude-Lorentz model and written as follows (Rakić et al., 1998)
where
Similarly, confinement loss is a crucial parameter for the FM-MCF LSPR sensor, which expresses the excitation of the LSPR. Confinement loss is mainly determined by the imaginary part of the core mode effective RI (Im(neff)) and it can be calculated by (Yang et al., 2021)
where λ is the incident wavelength. Therefore, we can discover and discuss the LSPR effect in some loss spectrums and the electric field of Au nano-particles.
The resonant wavelength of FM-MCF LSPR sensor will shift when the biological liquid analyte RI changes slightly. In consequence, the shift of the resonant wavelength can be used for the detection of the RI change of biological liquid analytes. Sensitivity is an important parameter to measure sensor performance. Spectral sensitivity is described as (Yang et al., 2021)
where is the resonant wavelength shift of the loss peak, is the change of the biological liquid analyte RI.
Results and Discussion
Our FM-MCF is originally designed to use for transmission of optical signals in telecommunication, so it only supports LP01 and LP11 two modes in each core at the communication band. Loss spectra of the FM-MCF LSPR sensor excited by fundamental mode (LP01y and LP01x) are presented in Figure 3, while biological liquid analyte RI (na) is 1.33 and the radius of the gold nanoparticle is 110 nm. Optical field distribution of LP01y and LP01x (two polarization direction of LP01) and corresponding plasmon mode are illustrated in insets (a), (b), (c), and (d), respectively, where the red arrows in the insets (a) and (b) indicate the direction of the electric field. As shown in Figure 3, not only LP01x but also LP01y mode in the FM-MCF core can excite the LSPR effect. Besides, the resonant wavelength of LP01y is shorter than LP01x, though the spectral loss is higher than it. Since the resonant wavelength of plasmon mode is around 700 nm, there are many modes transmitted in the optical fiber core. Similar to LP01 mode, two polarization directions (x and y) of LP11, LP21, and LP02 mode are also able to excite LSPR. Consequently, the influence of transmission modes in the fiber on our biosensor is analyzed in detail, as well as the radius of gold nanoparticle, nanoparticle positions, shapes of nanoparticle, and nanoparticle arrays.
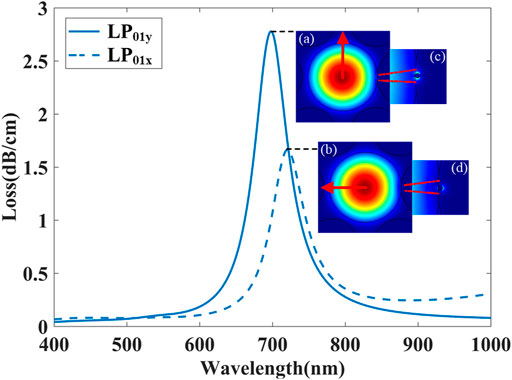
FIGURE 3. Loss spectra excited by LP01y and LP01x mode and corresponding optical field distribution while na = 1.33. Insets (a), (b), (c) and (d) show the optical field distribution of the core modes and plasmon modes at different resonant wavelengths.
Effects of the Gold Nanoparticle’s Radius
The radius of the nanoparticle plays an important role in the performance of the biosensor. Figure 4 shows the effect of the nanoparticle’s radius rg on the resonant wavelength, spectral loss, and spectral sensitivity. Figure 4A shows the relationship between the resonant wavelength and rg when na is 1.33. With the increase of rg, the resonant wavelength of the FM-MCF LSPR sensor exhibits a red shift, this is because the nanoparticle’s radius affects the maximum light coupling between the fiber mode and gold nanoparticle. Although resonant wavelength has a red shift, the change of adjacent resonance peaks gradually decreases. The relationship between rg and spectral loss when na = 1.33 is shown in Figure 4B. In Figure 4B, the peak loss of LP01x mode increases with the radius of the nanoparticle initially, when rg = 90 nm, at this moment LP01x has the maximum loss, and then peak loss begins to decrease. However, the peak loss of LP01y mode always increases as the radius increases, when rg = 150 nm, LP01y has the maximum loss. When na varies from 1.33 to 1.34, the spectral sensitivity of FM-MCF LSPR biosensor for different nanoparticle’s radius is presented in Figure 4C. As the radius increases, the sensitivity continues to increase, reaching its maximum when the radius is 150 nm. Therefore, by changing the radius of the gold nanoparticle, we can adjust the resonant wavelength, spectral loss, and the spectral sensitivity of the biosensor.
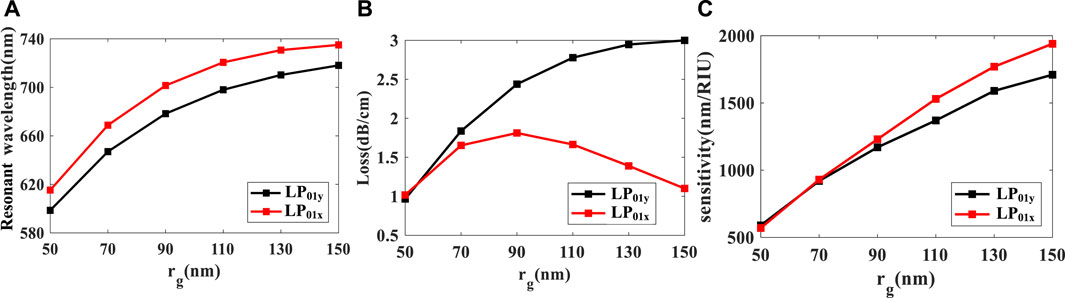
FIGURE 4. (A) Relationship between rg and resonant wavelength when na = 1.33; (B) Effect of rg on spectral loss when na = 1.33; (C) spectral sensitivity of the FM-MCF LSPR biosensor at different rg when na is from 1.33 to 1.34.
The Influence of Nanoparticle Positions
Meanwhile, the influence of nanoparticle positions on FM-MCF LSPR biosensor performance is also analyzed in this paper. The gold nanoparticle is initially placed tangent to the core, as illustrated in Figure 1A. When the nanoparticle rotates clockwise around the center of the open air-hole to the next position, the angle between the original position and the next position is described by θ.
Figure 5 depicts fundamental mode loss spectra of na = 1.33 when θ is 0°, 5°, 10°, and 15°, respectively. We found that as θ increases, the peak losses of the two polarizations gradually decrease but the resonant wavelength remains almost the same. The reason is that the evanescent wave has a certain penetration depth, and its amplitude decreases exponentially with the increase of the distance from the interface so peak loss varies when the nanoparticle is placed at different angles (Chiavaioli et al., 2017b).
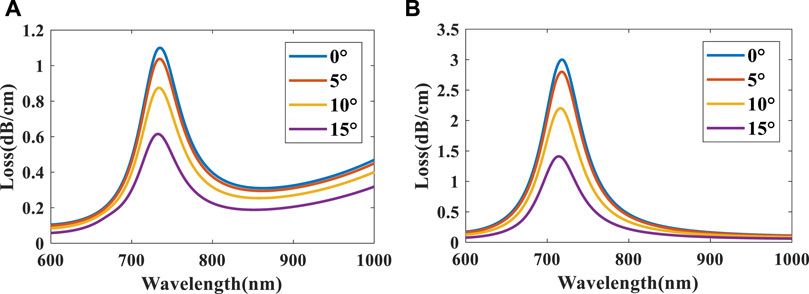
FIGURE 5. Loss spectra excited by gold nanoparticle at different positions. (A) LP01x; (B) LP01y.
Effect of Transmission Modes
The FM-MCF we use only supports two modes (LP01 and LP11) at the communication band. At visible wavelengths, plenty of high order modes can be transmitted in the fiber core. Transmission mode in the fiber is also a significant factor that affects the performance of the presented biosensor. As mentioned above, we fix the radius of the gold nanoparticle to 150 nm and the best position to θ = 0°. Loss spectra of different modes when biological liquid analyte RI ranges from 1.33 to 1.39 with a step of 0.01 is shown in Figure 6, where the dash lines represent the loss spectra of the x polarization while the solid lines represent the y polarization. It can be seen that loss spectra excited by y polarization have higher losses than x polarization in the same mode and the resonant wavelength of x polarization is also longer than that of y. When using high order modes to excite LSPR, high order modes usually have higher losses than the fundamental mode, and hence their LSPR loss curves are steeper than that of the fundamental mode, the narrower the loss curve, the better the resolution of the sensor. Therefore, the performance of LSPR biosensor excited by the high order mode is better than the fundamental mode.
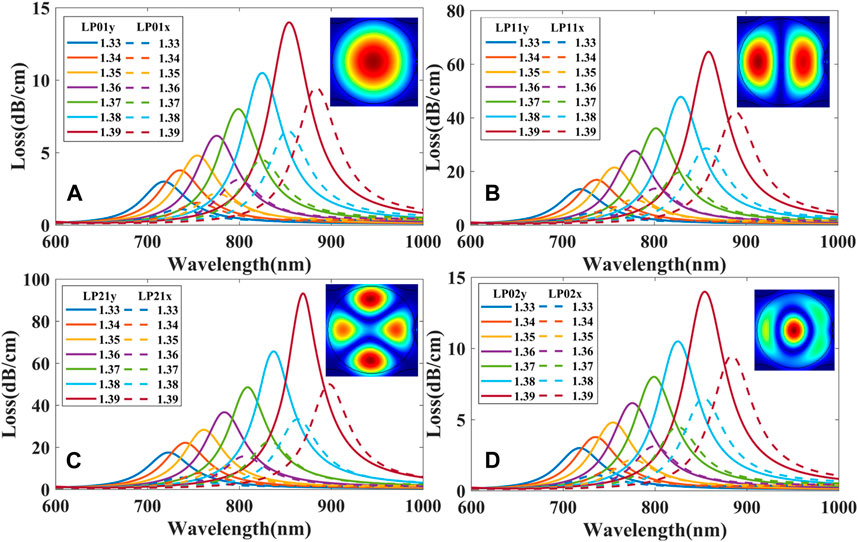
FIGURE 6. Loss spectra excited by different modes: (A) LP01x and LP01y; (B) LP11x and LP11y; (C) LP21x and LP21y; (D) LP02x and LP02y.
Figure 7 shows the relations between na and the resonant wavelength. The average sensitivity and highest sensitivity can be obtained according to (3). The average sensitivity of the LP01x, LP01y, LP11x, LP11y, LP21x, LP21y, LP02x, and LP02y mode is 2467.9, 2257.9, 2528.2, 2310, 2640, 2428.6, 2557.1, and 2313.9 nm/RIU, respectively. The LP21x mode has the maximum highest sensitivity of 3478.28 nm/RIU among all modes when na = 1.39. It can be seen that x polarization has a higher sensitivity than y polarization in the same mode. In addition, high order modes have higher sensitivity than fundamental mode in the same polarization state. Therefore, using high order mode to excite LSPR can improve the sensitivity of the sensor.

FIGURE 7. Relations between na and resonant wavelength. (A) LP01x and LP01y; (B) LP11x and LP11y; (C) LP21x and LP21y; (D) LP02x and LP02y.
Effect of Nanoparticle Shapes
It has been shown experimentally that the shape of the gold nanoparticle plays a vital role in determining the sensitivity (Mayer and Hafner, 2011). Several gold nanoparticles with different geometric shapes are illustrated in Figures 8A–D, all the nanoparticles are filled in the air hole of the FM-MCF and are tangent to the core. From the previous discussion, when the radius of the circumferential circle is 150 nm, the LSPR excited by gold nanoparticles has the highest sensitivity. When biological liquid analyte RI is set as 1.33, the loss spectra of LSPR excited by four different shapes of gold nanoparticle are shown in Figure 8E.
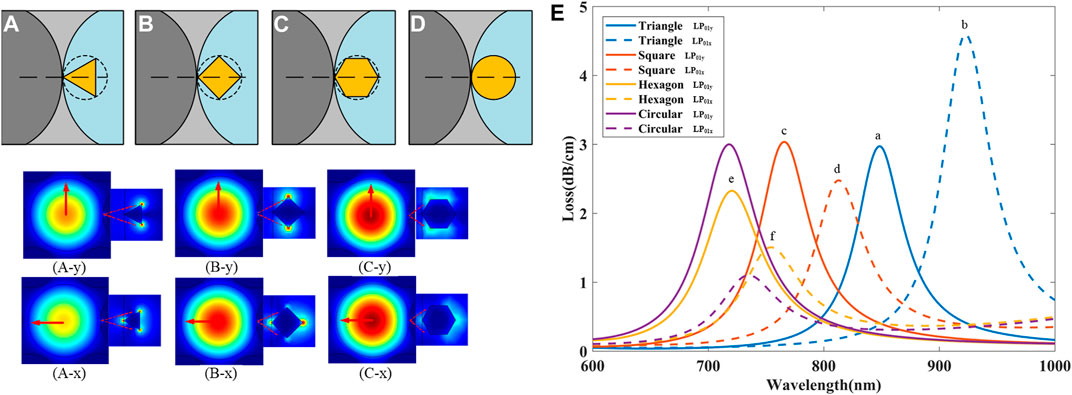
FIGURE 8. Several gold nanoparticles with different geometric shapes. (A) triangle nanoparticle; (B) square nanoparticle; (C) hexagon nanoparticle; (D) circular nanoparticle. Optical field distribution of LSPR excited by different shapes of nanoparticle. (A-y) triangle nanoparticle excited by LP01y mode; (A-x) triangle nanoparticle excited by LP01x mode; (B-y) and (B-x) square nanoparticle excited by LP01y mode, LP01x mode, respectively; (C-y) and (C-x) hexagon nanoparticle excited by LP01y mode, LP01x mode, respectively; (E) Loss spectra excited by nanoparticle in different shapes for LP01x and LP01y mode.
It can be seen that the loss spectra exhibit a red shift as nanoparticle gets sharper in Figure 8E. The resonant wavelength of hexagon nanoparticle is close to that of the circular nanoparticle, and the triangle nanoparticle’s resonant wavelength is in the near-infrared while circular is in the visible light range. By using different shapes of nanoparticle, we can adjust the resonant wavelength of the FM-MCF LSPR biosensor. Figure 8 shows the optical field distribution of LSPR excited by different shapes of nanoparticle at the peak of a, b, c, d, e and f in Figure 8E, the red arrows represent the direction of the electric field. When nanoparticles have sharp tips or features, the LSPR energy is mainly concentrated at the tip position. The coupling between LP01 mode and SP mode excited by triangle nanoparticle is the best, then square, and finally hexagon nanoparticles. This is because of the sharper the angle, the greater the density of the free electrons at the tip, and the stronger the electric field that can be excited. The strong electric field enhancement at the sharp tips makes it possible to excite surface plasmon resonance with only a small amount of incident light energy, so the sharper the nanoparticle, the longer the resonant wavelength.
In the arrangement shown in Figures 8A–D, only one corner of the nanoparticle is in contact with the air hole. For the first three shapes in Figures 8A–D, we rotate the nanoparticles 60°, 45°, and 30° counterclockwise along the center as shown in Figures 9A–C such that two corners of these nanoparticles are in contact with the air hole. Loss spectra of LP01x and LP01y when different shapes of gold nanoparticles excite LSPR after rotation and moving are shown in Figure 9D.
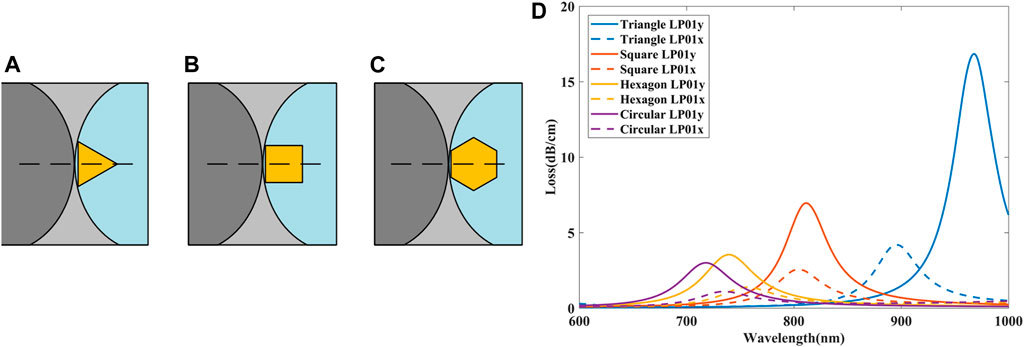
FIGURE 9. Nanoparticles after rotation and moving. (A) triangle nanoparticle; (B) square nanoparticle; (C) hexagon nanoparticle. (D) Loss spectra of LP01x and LP01y when different shapes of gold nanoparticles excite LSPR after rotation and moving.
Compare Figure 9D with Figure 8E, it can be seen that the loss spectra of all shape nanoparticles have changed after rotation and moving. Since the hexagon is closest to the circle, its loss curve does not change significantly after rotation, however, the difference between the triangle and the circle is the largest, so the loss spectra vary obviously. After the triangle nanoparticle rotates 60°, the resonance peak of LP01y moves from 850 to 963 nm (red shift), while the resonance peak of LP01x moves from 950 to 895 nm (blue shift).
Effect of Nanoparticle Arrays
Nanoparticle arrays also affect the performance of the FM-MCF LSPR biosensor. In Figure 10 gold nanoparticles with a radius of 150 nm are filled symmetrically in the air hole, the angle between adjacent nanoparticles is represented by δ and the minimum value is 2.7°, which means that two adjacent nanoparticles are tangent at this time. When δ = 2.7°, the entire air hole can be filled with 81 gold nanoparticles.
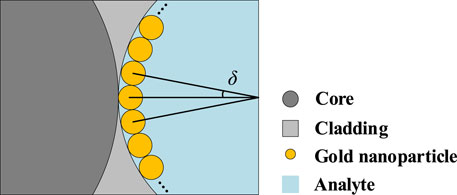
FIGURE 10. Gold nanoparticle arrays excited LSPR at the same time.
Since the air hole range has been determined, the number of nanoparticles n and the angle between adjacent nanoparticles δ simultaneously affect the property of the gold nanoparticle arrays. The influence of n has been studied at first, the loss curves excited by LP01y mode when δ = 2.7°, na = 1.33, and n are set as 81, 41, 21, 11, 9, 7, 5, and 3, respectively are shown in Figure 14. Because the loss curves of n = 41 and 21 are very close to n = 81, so they are not given in Figure 11A. It can be found that compared with single nanoparticle, nanoparticle array has many resonance peaks. When n = 81, the resonant wavelength locates in 680 nm, as n decreases to 11 the loss curves begin to show two peaks, and the resonance peaks at longer wavelength have higher confinement loss. When n = 3, there is an ultra-high loss peak at 1042.4 nm, and the confinement loss can reach 13.5 dB/cm, far exceeding the peak loss at other nanoparticle numbers.
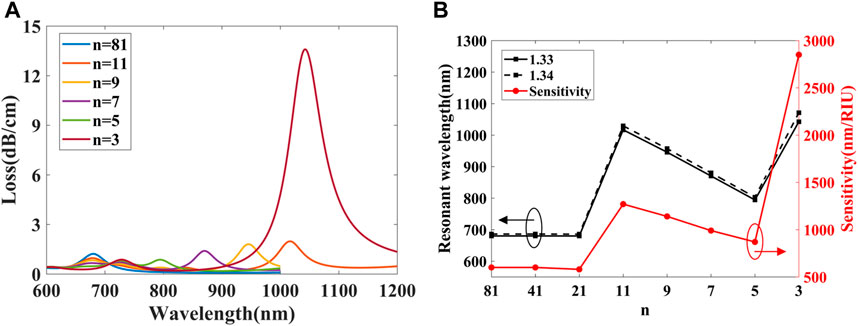
FIGURE 11. (A) spectra of LP01y excited by nanoparticle arrays with different n. (B) Resonant wavelength and sensitivity vary with different n.
In addition, the loss curves when na = 1.34 have also been calculated, the resonant wavelength and sensitivity vary with different n, as shown in Figure 11B. For the same na, when n decreases from 81 to 21, the resonance wavelength remains basically unchanged, and as n continues to decrease, the second resonance peak begin to appear at longer wavelength, so the resonant wavelength of n = 11 have a significant red shift. However, as n decrease to 5, the second resonance peak gradually blue shifts so the resonant wavelength decreases. The average sensitivity can be calculated by Eq. 3, it can be found that initially when the n decreases, the sensitivity is basically unchanged, when n = 11, the second resonance peak has higher sensitivity but as n continues to decrease the sensitivity decreases. When n = 3, the sensitivity can reach 2850 nm/RIU, which is higher than the sensitivity of other number of nanoparticles. Therefore, the number of nanoparticles n is set to 3.
Secondly, the influence of δ has been studied. The loss curves for different δ are shown in Figure 12 where δ = 3°, 5°, 7°, 9°, and 11°. When δ varies from 11° to 3°, the resonance peaks have an obvious red shift and the confinement loss gradually increases. It can be interpreted as when δ is large, each gold nanoparticle can independently excite the LSPR without coupling to each other. With the decrease of δ, the local surface plasmon waves excited by each gold nanoparticle begins to show weak coupling and lead to the red shift of resonance peak. When the distance between gold nanoparticles is close to their own size, the local surface plasmon waves show strong coupling, so the confinement loss gradually increases.
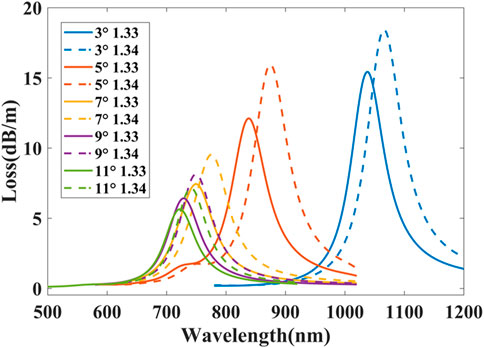
FIGURE 12. Loss spectra of LP01y excited by nanoparticle arrays with different δ.
The variation of resonant wavelength and sensitivity with δ is plotted in Figure 13. When na = 1.33 and δ increases from 3° to 5°, the resonant wavelength declines from 1037.7 to 838.2 nm while δ increases from 9° to 11°, the resonant wavelength declines from 728.7 to 722 nm. It can be found that although changing δ can adjust he resonance wavelength’s position, the adjustment effect is limited. The sensitivity change with δ can also be obtained from Figure 13. When δ = 5°, it reaches the sensitivity of 3610 nm/RIU, which is the largest of all δ. Therefore, the angle between adjacent nanoparticles δ = 5°.
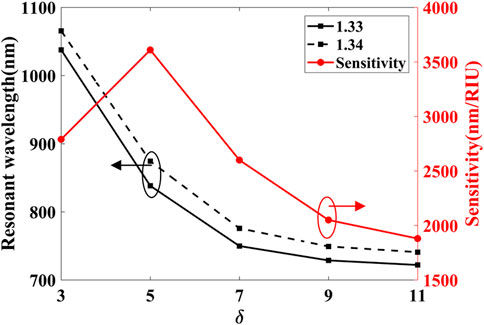
FIGURE 13. Resonant wavelength and sensitivity vary with different δ.
The FM-MCF LSPR sensor can work in the RI range of 1.33–1.39 which covers the RI of the BSA solution and human Immunoglobulin G. Therefore, the sensor can be used as a biosensor to detect the biological liquid analytes. The loss curves excited by LP01y and LP11y mode when n = 3, δ = 5° and biological liquid analyte RI is from 1.33 to 1.39 and loss curves excited of LP21y and LP02y mode and biological liquid analyte RI is from 1.33 to 1.38 is shown in Figure 14. With the increase of biological liquid analyte RI, the resonance peaks have a red shift and at the same RI, the loss curves of LP11y have a more obvious red shift than that of LP01y. Figure 15 illustrates the relationships between na and resonant wavelengths for LP01y mode and LP11y mode when na = 1.33–1.39. The average sensitivity of LP01y and LP11y mode when na is from 1.33 to 1.39 is 4497.1 and 4704.6 nm/RIU, respectively, while the highest sensitivity for each mode is 5732.1 nm/RIU and 6055.36 nm/RIU when na = 1.39, respectively. In addition, when the wavelength of incident light along the core is 800–1300 nm, LP21y and LP02y modes can also be transmitted stably, and the RI range at this time is 1.33–1.38. In Figures 14C,D, the loss spectra become not smooth, this is mainly because LP21y and LP02y are more likely to resonate with the core mode, and the energy is basically coupled to the plasmon mode. However, when the wavelength has a slight change, the phase matching condition is no longer satisfied. Therefore, the average sensitivity of LP21y and LP02y mode when na = 1.33–1.38 is 4888 nm/RIU and 5114 nm/RIU, respectively, and the highest sensitivity for each mode is 6209.6 nm/RIU and 7,351.6 nm/RIU when na = 1.38. It is demonstrated that the FM-MCF LSPR biosensor has high sensitivity and is ideal for real-time detection of biological substances.
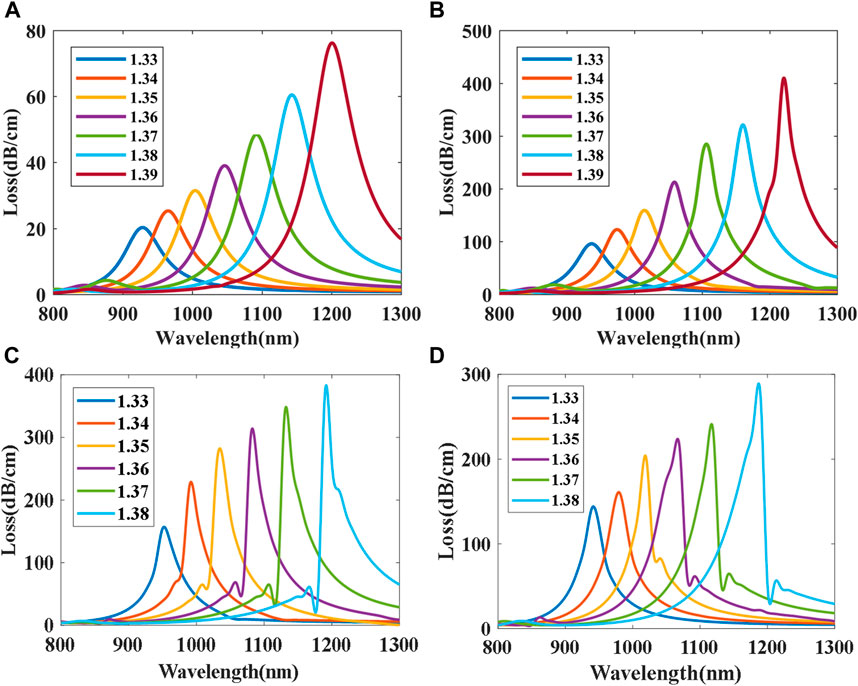
FIGURE 14. Loss curves excited by four different modes. (A) LP01y; (B) LP11y; (C) LP21y; (D) LP02y.
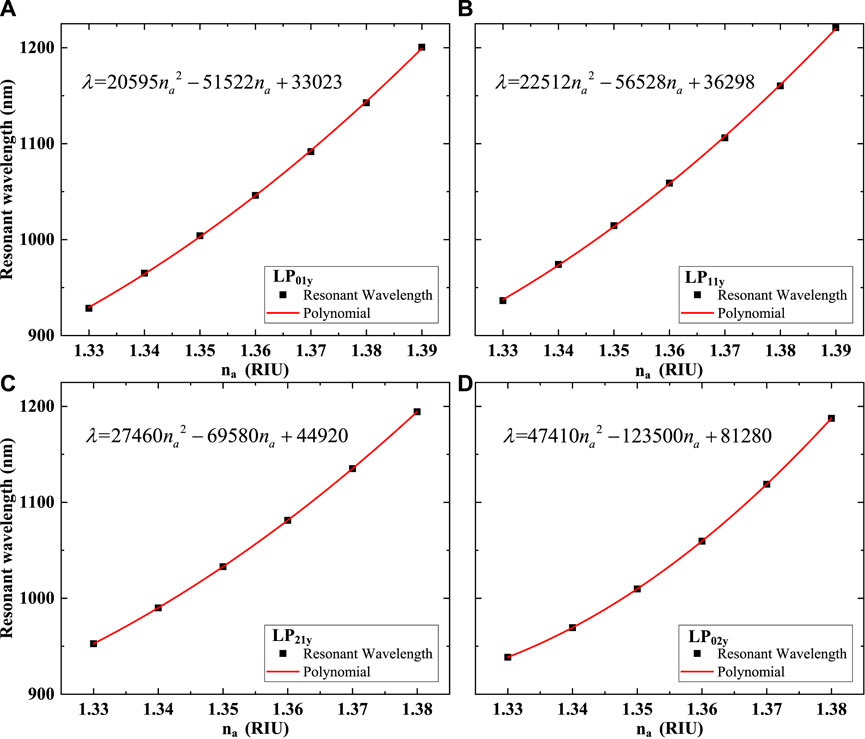
FIGURE 15. Relations between na and resonant wavelength. (A) LP01y; (B) LP11y; (C) LP21y; (D) LP02y.
Conclusion
In this paper, we presented an FM-MCF LSPR biosensor filled with gold nanoparticles in the open air holes. The effect of nanoparticles on the performance of the FM-MCF LSPR biosensor is investigated by using the FEM. The results show that the performance of the sensor can be improved by changing the nanoparticles’ configuration. When the radius of gold nanoparticles is 150 nm, three identical gold circular nanoparticles are placed symmetrically in the air hole, and the angle between adjacent nanoparticles is 5°, an average wavelength sensitivity of 4497.1 nm/RIU can be obtained in the sensing range of 1.33–1.39, and the highest sensitivity of LP01y mode is 5732.1 nm/RIU when na = 1.39. The FM-MCF can also transmit high order mode stably when the wavelength of incident light is 600–1300 nm. The average sensitivity of LP02y when RI of the biological liquid analyte is 1.33–1.38 is 5114 nm/RIU and the highest sensitivity is 7,351.6 nm/RIU when na = 1.38, which is higher than that of the LP01y. The proposed sensor can be used in chemical and biological sensing for its excellent properties.
Data Availability Statement
The original contributions presented in the study are included in the article/supplementary material, further inquiries can be directed to the corresponding author/s.
Author Contributions
All authors listed have made a substantial, direct and intellectual contribution to the work, and approved it for publication.
Funding
This work was supported in part by the National Natural Science Foundation of China (Grant number: U1813207, 61875152) and Key Projects in the Tianjin Science and Technology Pillar Program (Grant number: 20YFZCSY00390).
Conflict of Interest
The authors declare that the research was conducted in the absence of any commercial or financial relationships that could be construed as a potential conflict of interest.
Publisher’s Note
All claims expressed in this article are solely those of the authors and do not necessarily represent those of their affiliated organizations, or those of the publisher, the editors and the reviewers. Any product that may be evaluated in this article, or claim that may be made by its manufacturer, is not guaranteed or endorsed by the publisher.
Acknowledgments
The authors would like to thank Prof. Guifang Li from the University of Central Florida for providing the few-mode seven-core fiber, Ruihang Wang and Jing Zhao for revising the paper.
References
Cao, J., Sun, T., and Grattan, K. T. V. (2014). Gold Nanorod-Based Localized Surface Plasmon Resonance Biosensors: A Review. Sensors Actuators B Chem. 195, 332–351. doi:10.1016/j.snb.2014.01.056
Chen, H., Kou, X., Yang, Z., Ni, W., and Wang, J. (2008). Shape- and Size-Dependent Refractive Index Sensitivity of Gold Nanoparticles. Langmuir 24, 5233–5237. doi:10.1021/la800305j
Chen, S., Liu, Y., Yu, Q., and Peng, W. (2020). Microcapillary-based Integrated LSPR Device for Refractive index Detection and Biosensing. J. Lightwave Technol. 38, 2485–2492. doi:10.1109/jlt.2020.2969016
Chen, Y., and Ming, H. (2012). Review of Surface Plasmon Resonance and Localized Surface Plasmon Resonance Sensor. Photonic Sens. 2, 37–49. doi:10.1007/s13320-011-0051-2
Chiavaioli, F., Baldini, F., Tombelli, S., Trono, C., and Giannetti, A. (2017). Biosensing with Optical Fiber Gratings. Nanophotonics 6, 663–679. doi:10.1515/nanoph-2016-0178
Chiavaioli, F., Gouveia, C., Jorge, P., and Baldini, F. (2017). Towards a Uniform Metrological Assessment of Grating-Based Optical Fiber Sensors: From Refractometers to Biosensors. Biosensors 7, 23. doi:10.3390/bios7020023
Chiavaioli, F., Zubiate, P., Del Villar, I., Zamarreño, C. R., Giannetti, A., Tombelli, S., et al. (2018). Femtomolar Detection by Nanocoated Fiber Label-free Biosensors. ACS Sens. 3, 936–943. doi:10.1021/acssensors.7b00918
Cottat, M., Thioune, N., Gabudean, A.-M., Lidgi-Guigui, N., Focsan, M., Astilean, S., et al. (2013). Localized Surface Plasmon Resonance (LSPR) Biosensor for the Protein Detection. Plasmonics 8, 699–704. doi:10.1007/s11468-012-9460-3
Dong, J., Zhang, Y., Wang, Y., Yang, F., Hu, S., Chen, Y., et al. (2019). Side-polished Few-Mode Fiber Based Surface Plasmon Resonance Biosensor. Opt. Express 27, 11348–11360. doi:10.1364/oe.27.011348
He, Y.-J. (2019). Biochemical Sensor Simulation for Rectangular Metal Nanoparticles. Optik 195, 163162. doi:10.1016/j.ijleo.2019.163162
Li, C., Li, Z., Li, S., Zhang, Y., Sun, B., Yu, Y., et al. (2020). LSPR Optical Fiber Biosensor Based on a 3D Composite Structure of Gold Nanoparticles and Multilayer Graphene Films. Opt. Express 28, 6071–6083. doi:10.1364/oe.385128
Liu, C., Yang, L., Lu, X., Liu, Q., Wang, F., Lv, J., et al. (2017). Mid-infrared Surface Plasmon Resonance Sensor Based on Photonic crystal Fibers. Opt. Express 25, 14227–14237. doi:10.1364/oe.25.014227
Mayer, K. M., and Hafner, J. H. (2011). Localized Surface Plasmon Resonance Sensors. Chem. Rev. 111, 3828–3857. doi:10.1021/cr100313v
Min Y, W. Y. (2020). Manipulating Bimetallic Nanostructures with Tunable Localized Surface Plasmon Resonance and Their Applications for Sensing. Front. Chem. 8, 411. doi:10.3389/fchem.2020.00411
Mollah, M. A., and Islam, M. S. (2020). Novel Single Hole Exposed-Suspended Core Localized Surface Plasmon Resonance Sensor. IEEE Sensors J. 21, 2813–2820. doi:10.1109/jsen.2020.3023975
Rakić, A. D., Djurišić, A. B., Elazar, J. M., and Majewski, M. L. (1998). Optical Properties of Metallic Films for Vertical-Cavity Optoelectronic Devices. Appl. Opt. 37, 5271–5283.
Sellmeier, W. (1871). Zur Erklärung der abnormen Farbenfolge im Spectrum einiger Substanzen. Ann. Phys. Chem. 219, 272–282. doi:10.1002/andp.18712190612
Singh, R., Kumar, S., Liu, F.-Z., Shuang, C., Zhang, B., Jha, R., et al. (2020). Etched Multicore Fiber Sensor Using Copper Oxide and Gold Nanoparticles Decorated Graphene Oxide Structure for Cancer Cells Detection. Biosens. Bioelectron. 168, 112557. doi:10.1016/j.bios.2020.112557
Sinibaldi, A., Montaño-Machado, V., Danz, N., Munzert, P., Chiavaioli, F., Michelotti, F., et al. (2018). Real-Time Study of the Adsorption and Grafting Process of Biomolecules by Means of Bloch Surface Wave Biosensors. ACS Appl. Mater. Inter. 10 (39), 33611–33618. doi:10.1021/acsami.8b08335
Van Uden, R. G. H., Correa, R. A., Lopez, E. A., Huijskens, F. M., Xia, C., Li, G., et al. (2014). Ultra-high-density Spatial Division Multiplexing with a Few-Mode Multicore Fibre. Nat. Photon. 8, 865–870. doi:10.1038/nphoton.2014.243
Wang, Q., Wang, X.-Z., Song, H., Zhao, W.-M., and Jing, J.-Y. (2020). A Dual Channel Self-Compensation Optical Fiber Biosensor Based on Coupling of Surface Plasmon Polariton. Opt. Laser Techn. 124, 106002. doi:10.1016/j.optlastec.2019.106002
Wang, R., Jia, D., Zhao, J., Zhang, H., and Liu, T. (2018). Experimental and Analytical Investigation of LP01-LP11 Mode Interference. Opt. Fiber Techn. 46, 258–264. doi:10.1016/j.yofte.2018.11.003
Wei, Y., Su, Y., Liu, C., Zhang, Y., Nie, X., Liu, Z., et al. (2017). Segmented Detection SPR Sensor Based on Seven-Core Fiber. Opt. Express 25, 21841–21850. doi:10.1364/oe.25.021841
Willets, K. A., and Van Duyne, R. P. (2007). Localized Surface Plasmon Resonance Spectroscopy and Sensing. Annu. Rev. Phys. Chem. 58, 267–297. doi:10.1146/annurev.physchem.58.032806.104607
Yang, H., Wang, G., Lu, Y., and Yao, J. (2021). Highly Sensitive Refractive index Sensor Based on SPR with Silver and Titanium Dioxide Coating. Opt. Quan. Electron. 53, 1–13. doi:10.1007/s11082-021-02981-1
Yang, K., He, J., Liao, C., Wang, Y., Liu, S., Guo, K., et al. (2017). Femtosecond Laser Inscription of Fiber Bragg Grating in Twin-Core Few-Mode Fiber for Directional bend Sensing. J. Lightwave Technol. 35, 4670–4676. doi:10.1109/jlt.2017.2750407
Yang, Z., Xia, L., Li, C., Chen, X., and Liu, D. (2019). A Surface Plasmon Resonance Sensor Based on Concave-Shaped Photonic crystal Fiber for Low Refractive index Detection. Opt. Commun. 430, 195–203. doi:10.1016/j.optcom.2018.08.049
Yao, S., Shen, Y., Wu, Y., Jin, W., and Jian, S. (2019). Strain-insensitive Temperature Sensor Based on a Few-Mode Dual-Concentric-Core Fiber. Opt. Laser Techn. 111, 95–99. doi:10.1016/j.optlastec.2018.09.046
Zanchetta, G., Lanfranco, R., Giavazzi, F., Bellini, T., and Buscaglia, M. (2017). Emerging Applications of Label-free Optical Biosensors. Nanophotonics 6, 627–645. doi:10.1515/nanoph-2016-0158
Zheng, Y., Lang, T., Cao, B., Jin, J., Dong, R., and Feng, H. (2018). Fiber Optic SPR Sensor for Human Immunoglobulin G Measurement Based on the MMF-NCF-MMF Structure. Opt. Fiber Techn. 46, 179–185. doi:10.1016/j.yofte.2018.10.015
Keywords: biosensor, nanoparticle, localized surface plasmon resonance, few-mode multicore fiber sensor, open air-hole
Citation: Yang C, Xiao S, Wang Q, Zhang H, Yu H and Jia D (2021) Nanoparticle-Based FM-MCF LSPR Biosensor With Open Air-Hole. Front. Sens. 2:751952. doi: 10.3389/fsens.2021.751952
Received: 02 August 2021; Accepted: 30 August 2021;
Published: 13 September 2021.
Edited by:
Santosh Kumar, Liaocheng University, ChinaReviewed by:
Kuldeep Choudhary, DIT University, IndiaKobra–Omidfar, Tehran University of Medical Sciences, Iran
Copyright © 2021 Yang, Xiao, Wang, Zhang, Yu and Jia. This is an open-access article distributed under the terms of the Creative Commons Attribution License (CC BY). The use, distribution or reproduction in other forums is permitted, provided the original author(s) and the copyright owner(s) are credited and that the original publication in this journal is cited, in accordance with accepted academic practice. No use, distribution or reproduction is permitted which does not comply with these terms.
*Correspondence: Hui Yu, yuhui@tju.edu.cn; Dagong Jia, dagongjia@tju.edu.cn