 Sharon Indasi Lubembe1,2*†
 Jacques R. Walumona3†
 Béni Lwikitcha Hyangya3†
 Benjamin N. Kondowe4†
 Jean-Diste M. Kulimushi3Giséle A. Shamamba3Alain M. Kulimushi3Belinda H. R. Hounsounou1Mulongaibalu Mbalassa1
 Frank O. Masese2†
 Mulungula Pascal Masilya3,5†
- 1Département de Biologie, Section: Hydrobiologie, Université Officielle de Bukavu, Bukavu, Democratic Republic of Congo
- 2Department of Fisheries and Aquatic Science, University of Eldoret, Eldoret, Kenya
- 3Unité d'Enseignement et de Recherche en Hydrobiologie Appliquée (UERHA), Département de Biologie-Chimie, Institut Supérieur Pédagogique de Bukavu (ISP), Bukavu, Democratic Republic of Congo
- 4Department of Fisheries and Aquatic Sciences, Mzuzu University, Mzuzu, Malawi
- 5Départment de Biologie, Centre de Recherche en Hydrobiologie (CRH) Uvira, Uvira, Sud-Kivu, Democratic Republic of Congo
In Africa, cage aquaculture has been growing due to its potential to address food insecurity concerns, provide livelihoods, and contribute to local economies. However, there is a need for continued research on the sustainability and potential ecological effects of cage aquaculture in African lakes and reservoirs. Even with an adequate amount of water, lakes and reservoirs cannot provide ecosystem services if their water quality is not properly managed. The current study on Lake Kivu, DRC focuses on understanding the effects of tilapia cage aquaculture on selected water quality physico-chemical parameters in the Bukavu sub-basin, DRC. The research was conducted in both caged and uncaged sampling stations, on the spatial and temporal scale from April to September 2023 at three bays serving as sampling stations: two caged (Ndendere, Honga) and one non-caged (Nyofu). Some physico-chemical parameters were measured in situ, whereas chlorophyll a and nutrients analysis were performed at the Institut Supérieur Pédagogique (I.S.P) laboratory in Bukavu. The parameters were used to calculate three indices water quality indices: the water quality index (WQI) to classify the water quality at the stations, the organic pollution index (OPI) to determine the level of organic pollution, the Carlson's Trophic Status Index (CTSI) to classify the trophic state of the stations. Chlorophyll a concentration was a measure of algal biomass. All physico-chemical parameters, apart from DO, ammonium and temperature showed no significant differences among stations and depths. Interaction between stations and between seasons was only observed on turbidity. The WQI for all the sampling stations ranged from medium to good quality (51–90). The OPI for all stations showed minimal level of pollution (4.6–5.0) hence lake's water still organically unpolluted. CTSI results indicated the sampling stations are in a eutrophic state (50 to 70). Fish cage aquaculture does not yet pose harm to the water quality of the two Lake Kivu stations under consideration, according to the study's findings. However with the anticipated growth of cage fish farming activities to meet the rising fish demand, continuous monitoring of water quality in the Lake should be done to inform management decisions and for sustainable aquaculture.
Introduction
Fish cage farming has become the most popular aquaculture method of bridging the gap between diminishing wild fish output and increased consumer demand (Obiero et al., 2019; FAO, 2020). Expanding fish production in existing water bodies such as lakes, oceans, dams, reservoirs, and large rivers has been used to ensure this is achieved (Tacon and Halwart, 2007; Garcia de Souza et al., 2015). Curbing food insecurity issues has become less difficult in most places due to the ability to raise fish in cages at high densities for high production, which makes it possible to feed the growing human population driven by urbanization, increased awareness of the nutritional and health benefits of fish, and increases in income (Tacon and Halwart, 2007; Msangi and Batka, 2015; Musinguzi et al., 2019; Musa et al., 2021). African inland waters have embraced tilapia fish cage culture operations broadly, and more will do so as the advantages per unit volume of water become more apparent (Njiru et al., 2018; Hamilton et al., 2020; FAO, 2022). In addition, the low investment cost, convenience of installation and maintenance are also contributing to the expansion of cage activities (Gentry et al., 2017; Musinguzi et al., 2019). This is evident in Lake Victoria, where a rise in cage numbers from 1,663 to 4,537 between 2016 and 2019 and to 6,000 in 2021 is a glaring sign of sustained acceptance of cage aquaculture (Hamilton et al., 2020; Nyakeya et al., 2022). World inland aquaculture production as of 2021 was at 50% of the total fisheries production whereas in Africa, aquaculture contribution was at 18% with inland aquaculture constituting 92% of the total aquaculture production (FAO, 2022). According to FAO (2022), inland aquaculture in Democratic Republic of the Congo (DRC) has been on a slow but gradual rise. For instance, in 1984 only 81 metric tons were recorded and the amount kept on rising until 2011 when it was 3,030 mt. Thereafter, it dropped to 2,929 metric tons in 2012 and started rising gradually again from 2013 to 2020 when it was reached 3,590 metric tons (FAO, 2022). In 2014, 150 cages were reported in Lake Kivu on the Rwanda side and in 2021, some cages were recognized in the DRC side (Rurangwa and Kabagambe, 2018; FAO, 2022).
Regardless of the significance of cages for fish production, concerns about the environmental impact of cage aquaculture have been highlighted in different water systems (Boyd et al., 2008; Kashindye et al., 2015; Nyakeya et al., 2022; Okechi et al., 2022). However, the impacts are determined by the intensity of production, water volume or depth, water exchange rate, and geology of the area (Price et al., 2015). According to Wu (1995), the effects of cage aquaculture on physico-chemical properties are depths-specific. Freshwater systems, for example, are more vulnerable to nutrient loads than marine systems due to their smaller size and frequently poorer biological carrying capacity (Wu, 1995). Fish cages have a high potential for degrading water quality due to the release of particulate and dissolved nutrients like uneaten feeds, metabolites and wastes directly introduced to the lake, potentially causing eutrophication, which is the main concern of African inland water systems (Garcia de Souza et al., 2015; Dauda et al., 2019). For instance, approximately 132 kg of nitrogen and 25 kg of phosphorus are discharged with each ton of fish produced at the end of each culture period (Islam et al., 2016). Furthermore, Gondwe et al. (2011) found that (81–90)% of organic waste released during tilapia cage culture is discharged into the water body, which may have deleterious effects on the cultured fish and the environment (Effendie et al., 2005). The enrichment of organic matter and nutrients in the sediment, on the other hand, supports the growth of microorganisms and can ultimately lead to increased greenhouse gas emissions from fish culture areas (Gondwe et al., 2011; FAO, 2017; Rutegwa et al., 2019; Yuan et al., 2019; Huang et al., 2020; Kosten et al., 2020). Cages are also characterized by the release of nitrogen, phosphorus and organic matter whose over-enrichment in water fastens the rate of primary production leading to eutrophication (Pitta et al., 2006; Gondwe et al., 2011; Aura C. M. et al., 2018; Aura M. C. et al., 2018). Cases of depletion of oxygen levels due to respiration in the cages and degradation of organic wastes end up increasing biochemical oxygen demand (BOD) and chemical oxygen demand (COD). Furthermore, cases of algal bloom, ammonium buildup, increased level of suspended solids, and decreased water clarity (increased turbidity) and pH have been reported (Pitta et al., 2006; Degefu et al., 2011; Verdegem, 2013; Karikari et al., 2016; Aura C. M. et al., 2018; Aura M. C. et al., 2018). The water quality status of various African lakes has been sufficiently studied, with most studies showing that these waters are increasingly organically polluted over the years (Helmer and Hespanhol, 1997; Odada et al., 2003; Branchu et al., 2005; UNEP, 2010; Ouma et al., 2016; Britton et al., 2019). Among other causes of this pollution, floating cages have been mentioned mainly in Lakes Volta (Clottey et al., 2016; Osei et al., 2019), Victoria (Nyakeya et al., 2022) and Kariba (Mhlanga et al., 2014).
Lake Kivu's ecological functioning and services are gradually declining, and it has received less attention in terms of anthropogenic disturbance documentation (Muvundja et al., 2009; Lina, 2016). The catchment region has been related to instability by environmental changes in its littoral zone and deterioration of water quality (Basima et al., 2006; Muvundja et al., 2009; Lina, 2016). Several anthropogenic activities, including the rapid urbanization of sizable towns built along the lake, the development of navigation ports, and high human population growth, are directly linked to changes in water quality, both in the Democratic Republic of the Congo (DRC) and Rwanda (Kaningini et al., 1999; Basima et al., 2006; Muvundja et al., 2009; Lina, 2016). Despite the propensity of cage aquaculture in its littoral waters, the effects of these cages on the lake's water quality and ecological condition are virtually undocumented. This study assessed the potential influence of tilapia cage culture on the spatio-temporal dynamics of physico-chemical water quality parameters in Lake Kivu. The specific objective of the study was to determine the spatio-temporal dynamics in water quality and trophic status of Lake Kivu in the Bukavu sub-basin at vertical profiling scale. We hypothesized that there are both spatial and temporal (monthly) changes in water quality and trophic status as a result of the physical location of the cages.
Materials and methods
Study area
Lake Kivu is located south of the equator between 1°34′-2°30′S and 28°50′-29°23′E, with an area of 2,370 km2 (World Atlas, 2020). It has a maximum depth of 475 m and an average depth of 240 m making it the world's twentieth's deepest lake by maximum depth and thirteenth deepest by mean depth (Scheffel and Wernet, 1980). It forms a natural border between the DRC and the Republic of Rwanda (Marshall, 1993; Descy et al., 2012) with 58% of the waters in the DRC and the remaining 42% in Rwanda (World Atlas, 2020). This mountainous lake is located between very high peaks near the equator in the center of a very wet region (Beadle, 1981). In the DRC, the hot season runs from June to August, and the rainy season lasts from September to May. The rainy season is protracted, with both short and extended periods of rainfall (22 to 33°C). The temperatures in the southern highlands are colder and drier, whilst those in the eastern highlands are cooler and wetter. The central region experiences hot and humid weather (Ministry of Foreign Affairs, 2018).
The lake is 161 km from Lake Tanganyika which is its mouth via the Ruzizi River at 1,500 m above sea level, the highest point of the East African Rift Valley (Snoeks et al., 1997). The lake is bordered by a lot of volcanic mountains that are active, and among them the most active ones are Nyamulagira and Nyiragongo (Vilimumbalo, 1993; Snoeks et al., 1997).
The surface temperature of Lake Kivu varies very little during the year at an average of about 23.0°C and 24.5°C with uniform thermal profile in the different water layers. According to Degens et al. (1973), the lake is meromictic, with oxygenated waters restricted to the upper 60 m and permanently isolated from the deep waters by a number of high salinity gradients. The lake is separated into four large basins: the North Basin, the South Basin, the East Basin of Idjwi Island, and the West Basin (Degens et al., 1973; Tietze et al., 1980). The 108 km2 southern basin of the lake, comprises the sub-basins of Bukavu and Ishungu. The sub-basin of Bukavu was of interest for this study because of the presence of fish cage aquaculture in its bays. The Bukavu sub-basin is situated between 28° 2′ 24″ and 28° 3′ 0″ South latitude, 1′57 2° 1′ 44.4″ and 2° 1′ 58.8″ East longitude (Kaningini, 1995). The Ruzizi River and the Rwandan ridge in the east, the Mitumba Mountains in the southwest, and the western basin of Lake Kivu in the north encircle it (Masilya et al., 2005). Five bays make up the Bukavu sub-basin, which is located in the extreme southern basin: Bukavu, Ndendere, Nyofu, Nyalukemba, and “Société Nationale des Chemins de Fer du Congo (SNCC)” bays. It is bordered to the northwest by the Isthmus of Birava and to the northeast by the islands of Nkombo and Ibindja. It has a surface area of 0.96 km2 and a maximum depth of 105 m (Kaningini, 1995). The sub-basin has a maximum depth of 100 m hence during dry season complete mixing takes place, therefore not meromictic (Tietze et al., 1980). In its watershed, which spans 45 km2 and has an elevation between 1,500 and 2,194 m, a number of socio-economic activities are carried out, including agriculture, slaughterhouses, fisheries, breweries and pharmaceutical plants (Bisimwa, 2009). Most of these socio-economic activities release their waste into the lake's littoral zone, either directly or indirectly (Lina, 2016).
Study stations
Three stations, Ndendere, Honga, and Nyofu (Figure 1) were selected in the Bukavu sub-basin for the current study. The two cage stations, Ndendere and Honga, were chosen because they have been having tilapia cage aquaculture activities for a long time (at least 1 year of operation). On the other hand, Nyofu was chosen as the control station because there were relatively few anthropogenic disturbances and it didn't have cages. Each station had a total of five measures which were represented by the depths sampled (0 m, 5 m, 10 m, 15 m, and 20 m). The geographical coordinates of each sampling station (Table 1) were taken by a handheld GPS navigational unit (Garmin II unit).
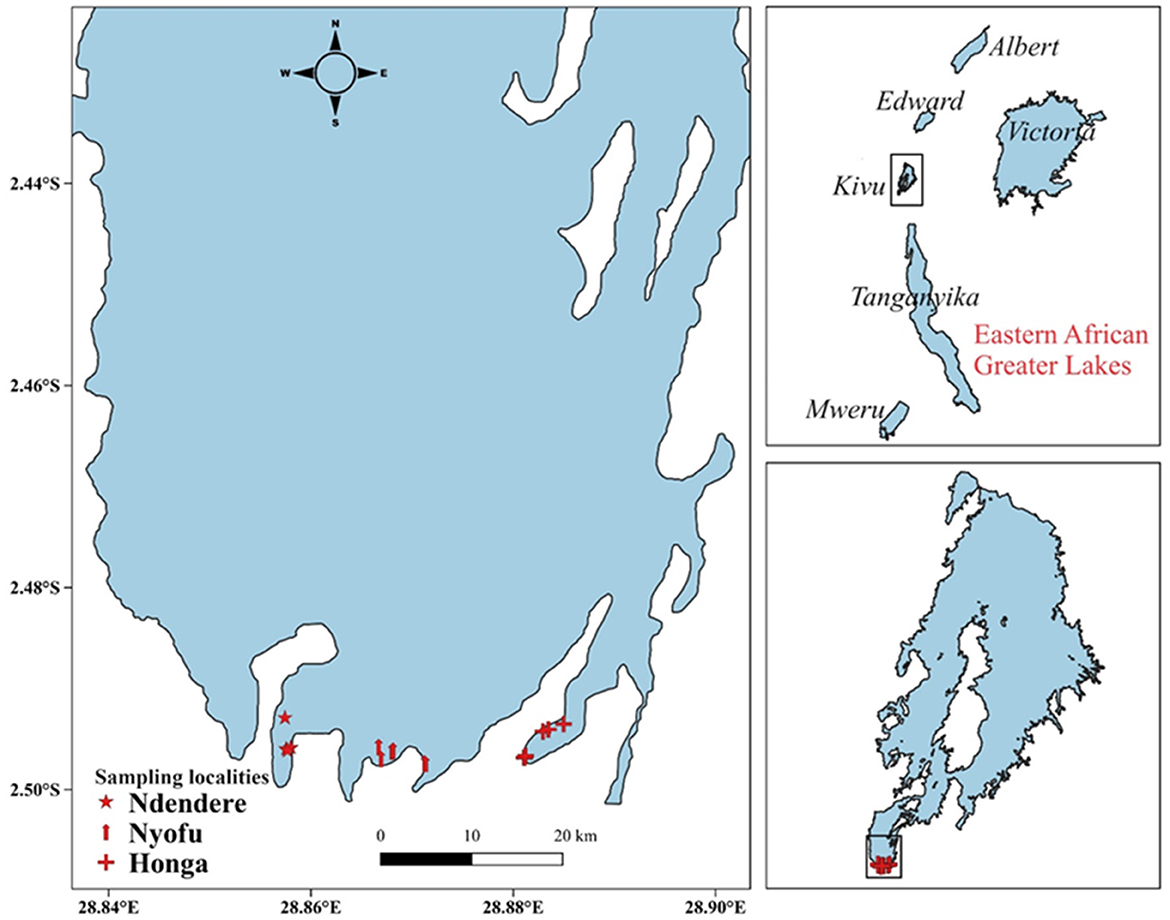
Figure 1. Map of the study area showing the sampling stations in Lake Kivu, Bukavu sub-basin, Democratic Republic of Congo.
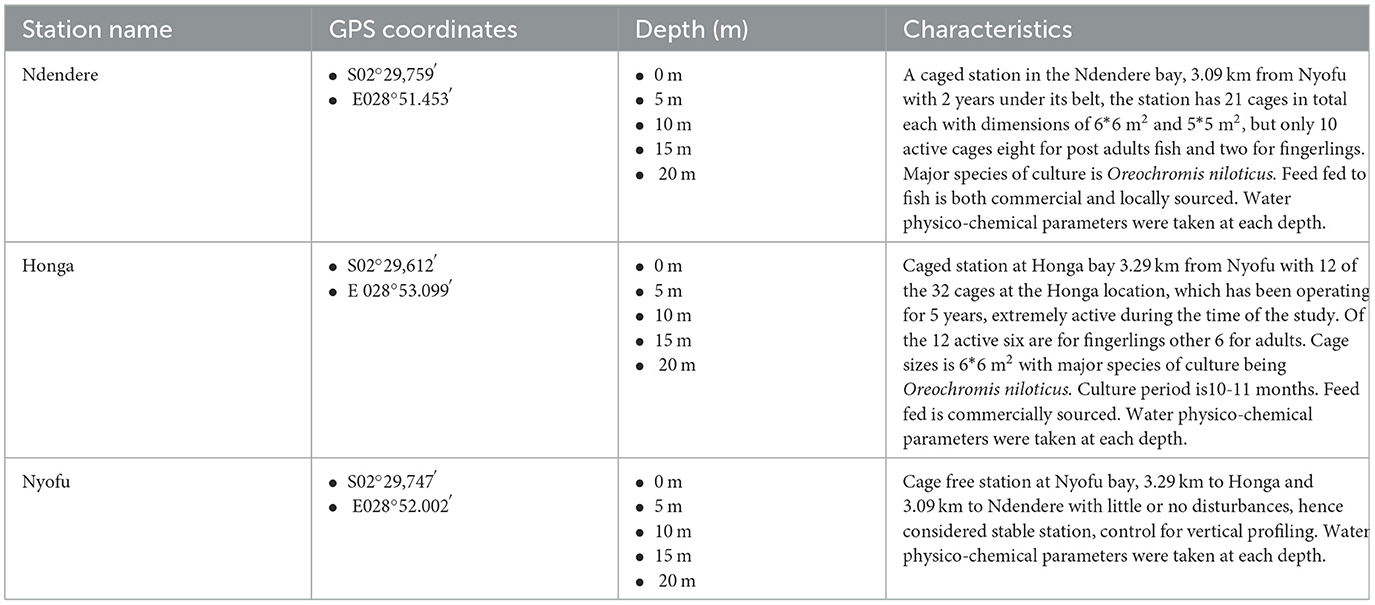
Table 1. Location and characteristics of sampling stations considered for this study.
Measurement and analysis of water quality parameters
A monthly sampling activity was done for 6 months (April to September 2023) covering the dry (June, July, and August) and wet (April, May, and September) seasons. Water temperature, pH, electrical conductivity and dissolved oxygen concentration (DO) were measured in situ using a Plus multi-parametric Field Probe (YSI 550) from different depths (0 m, 5 m, 10 m, 15 m, and 20 m). Turbidity measurements were done in situ by a portable turbidimeter probe (HACH 21000Q) following APHA et al. (2017). Water transparency and depth were determined by a Secchi disk and hand- held echo sounder (Plastimo Echotest II, 59588 made in France) respectively. To determine the physico-chemical parameters of the water from the deeper depths, the Van Dorn bottle sampler, 6L capacity, was used. Water was transferred into distinct, well-labeled, acid-washed polyethylene 4L bottles, which were then packed in a cooler box for transportation to the laboratory.
Extraction and determination of chlorophyll-a concentration
In Unité d'Enseignement et de Recherche en Hydrobiologie Appliquée (UERHA) laboratory, the water samples collected in the 4L bottles from different depths (0 m, 5 m, 10 m, 15 m, and 20 m) in the field were filtered through Macherey-Nägel GF/5 filters with 0.7 m porosity using a vacuum pump.
For the extraction of chlorophyll-a, the filter papers were stored in labeled vials with 90% acetone. The extract in acetone was ultrasonically processed twice, with the first one being stored at 4°C and shielded from light for 12 h before the second sonication. The Lorenzen (Equation 1) was used to calculate the algal biomass present (Rodier et al., 2009; APHA et al., 2017). This was determined by the chlorophyll-a extract absorbance values, which were measured both before and after acidification with 0.1 N HCl:
where Db and Da represent the optical densities before and after acidification, respectively, as well as the volume of the solvent (acetone) (in ml) and the cuvette thickness, respectively. The absorbance was transformed into concentrations using the Beer-Lambert method (Bartram and Balance, 1996; APHA et al., 2017).
Nutrient analysis
Ammonium (, nitrite (), soluble reactive phosphate () and silicate (SiO2) were determined with respect to standard colorimetric methods of UV-visible spectrophotometric analysis of water samples in the laboratory (APHA et al., 2017). The process involved converting the analyzing ion into a colored complex with a UV-visible range for its absorption peak. While soluble reactive phosphate (SRP) was tested using the molybdenum blue method, soluble reactive silica (SRSi) was determined using the molybdate complex method. Using the dichloroisocyanurate-salicylate method, ammonium () was produced, whereas nitrite () was produced by making an azo-dye combination (Rodier et al., 2009; APHA et al., 2017). Ascorbic acid, ammonium heptamolybdate, potassium antimonyl tartrate, sodium salicylate, trisodium citrate, and sodium nitroprusside were added in the proper quantities to convert the absorbance (A) measured at a particular wavelength to the concentration (C) of the complex using the Beer Lambert's law (Muvundja et al., 2009). Utilizing a Spectronic Spectrophotometer (GENESYS ®20 UV/VIS), absorbance of each nutrient were measured.
Water quality index estimation
Indicators of water pollution, such as water quality index (WQI), organic pollution index (OPI) and Carlson trophic state index (CTSI) were estimated in accordance with Debels et al. (2005), Kannel et al. (2007), and Sánchez et al. (2007) methods. Two steps were followed for its calculation. Raw analytical findings for the chosen water quality parameters that originally contained different units of measurement were then converted into sub-index values with no units of measurement (Cude, 2001). On a scale of 0–100, each parameter was transformed (Pesce and Wunderlin, 2000). With the help of appropriate weighting factors that consider how important each variable is as a gauge of water quality for aquatic life, sub-indices were averaged to get a WQI value (Sarkar and Abbasi, 2006). In the case of our study and in keeping with the literature, our study closely utilized relative weights and normalization factors to calculate this index using the following parameters: temperature, pH, electrical conductivity (EC), dissolved oxygen (DO), turbidity (Tur), SRSi, SRP, ammonium, and nitrite values (Pesce and Wunderlin, 2000; Cude, 2001; Jonnalagadda and Mhere, 2001; Debels et al., 2005; Kannel et al., 2007; Sánchez et al., 2007). The equation for subjective WQI Rodriguez de Bassoon Equations 2 and 3 (Pesce and Wunderlin, 2000) is:
Where k is an arbitrary constant with a range of 0–25 (for water that has been extensively contaminated as evidenced by its dark color, strong odor, visible fermentation, etc.) and 1 (apparent contamination, clear or with natural suspended solids). The total number of parameters is n, where Ci is the value given to each parameter after normalization, and Pi is the relative weight given to each parameter with a value between 1 and 4, with 4 being given to the parameter that is most crucial for the preservation of aquatic life (such as dissolved oxygen) and 1 being given to the parameter that has a less significant influence (e.g., temperature and pH). The given values of Ci and Pi utilized in the calculation have been adopted from various publications (Davies, 2006; Kannel et al., 2007; Sánchez et al., 2007; Yan et al., 2014; Tian et al., 2019) and have their origin in the US (USEPA, 1993, 1995) and Canadian (CCME, 1999) water quality criteria for maintenance of aquatic organisms. The introduction of a subjective constant that is not always connected with the measured parameters has been found to cause WQIsub to overstate the decline of water quality (Tambuk-Giljanovic, 1999; Hernández-Romero et al., 2004). In order to only take into consideration fluctuations caused by the factors observed in situ, the objective WQI was therefore calculated using k = 1 in all circumstances in this work and other reported research Equation 3 (Kannel et al., 2007; Sánchez et al., 2007).
The system for categorizing water quality that was used in this case was developed by Jonnalagadda and Mhere (2001) and Hernández-Romero et al. (2004). It states that water should be classified as “very poor” when its WQI value is between 0 and 25, “poor” when it is between 25 and 50, “medium” when it is between 51 and 70, “good” between 71–90, and “excellent” when between 91–100.
Organic pollution index
Following Bahroun and Bousnoubra (2011), an assessment of organic load (organic pollution index, OPI) was calculated for each station. The OPI is normally calculated using the average of four parameters (Bartram and Balance, 1996), but only three were used: ammonium, nitrite and SRP content leaving BOD which was not determined in this study. By correlating the concentrations with the standard limits, parameter class numbers were calculated (Rodier et al., 2009). The OPI was determined as the average of the class numbers of the three parameters used in the study (Bahroun and Bousnoubra, 2011; Walumona et al., 2021) and categories of water pollution based on OPI index and color of water referred to Leclercq and Maquet (1987).
Trophic status index determination
To estimate the trophic status of Lake Kivu, three metrics are used: total phosphorus, chlorophyll-a, and transparency (Secchi depth) however only two (chlorophyll a and Secchi depth) were used as they were the only the ones determined in this study (Carlson, 1977; Istvanovics, 2010). The productivity is estimated as a function of algal biomass, and this information was used to describe the water quality conditions at each station. The three metrics: total phosphorus (gL−1), chlorophyll-a (gL−1), and transparency (Secchi depth) (m) were computed differently Equations 4 and 5, with the overall Carlson's trophic state index (CTSI) for each station being generated from the average of the two separate values Equation 6 (Carlson, 1977).
The CTSI (Carlson and Simpson, 1996) was also utilized to evaluate the lake's trophic status. The accepted standard limits for evaluating the lake trophic status were adopted from the Organization for Economic Cooperation and Development (OECD) for the individual parameters (chlorophyll-a, Secchi depth) (Carlson and Simpson, 1996). The trophic status of a lake ecosystem (TSI) based on the individual parameters with a scale of 0–100, was used in this analysis. The calculated TSI value facilitates a qualitative description of a lakes trophic status. The TSI is split into five groups (0–20; 20–40; 40–60; 60–80; and 80–100) corresponding to five lake trophic states: hyper oligotrophic, oligotrophic, meso-trophic, eutrophic and hyper-eutrophic (Likens et al., 1977).
The CTSI (Carlson, 1977) was calculated on the basis of the individual parameter values, using the following formulae (Equations 4–6):
with SD: Secchi depth
with Chl-a: Chlorophyll a
Data analysis
The various types of data obtained during this study were processed and compared according to station and/or season. For these comparisons, depending on the case, the Kruskal-Wallis test, the one and two way ANOVA tests and their post hoc tests (Tukey test) with softwares: Microsoft Excel, PAST 4.11 and MINITAB version 17.
Results
Spatio-temporal variation of physico-chemical parameters
Physico-chemical parameters and nutrient concentrations in water varied significantly from one sampling station to another and from one season to another within the same station as well as from one depth to another (Table 2). With respect to the vertical profiling (depths) (0–20 m), (Tables 2–4) all parameters except DO in Ndendere, temperature in Nyofu, showed no significant differences (p > 0.05) in the depths at each station for the spatial factor. Furthermore, in the vertical profile (depths) results, apart from EC (1,077.0 ± 222.1–1,164.83 ± 9.95), (0.1 ± 0.19–0.87 ± 0.09 mgL−1), (0.01 ± 0.004–0.02 ± 0.01 mg/l) in Ndendere station; pH (9.35 ± 0.05–9.36 ± 0.03), turbidity (0.21 ± 0.19–0.51 ± 0.28), NH4 +(0.2 ± 0.0.09–0.09 ± 0.08 mg/l) (0.92 ± 0.14–1.16 ± 0.54 mg/l), Si02 4−(3.29 ± 2.1–5.38 ± 3.54 mg/l), (0 ± 0.0–0.01 ± 0.0 mg/l) in Honga station; turbidity (0.12 ± 0.15–0.20 ± 0.31), NH4 +(0.04 ± 0.04–0.20 ± 0.19 mg/l), (1.13 ± 0.42–1.16 ± 0.63 mg/l), and Si02 4−(1.94 ± 2.3–3.82 ± 4.87 mg/l) in Nyofu (control) station, the others showed a decrease in the values of the parameters from 0–20 m. Only DO (p = 0.017, F = 2.22 for station, p = 0.022, F = 5.56 for seasons), temperature (p = 0.024, F = 2.11 for station; p = 0.00 F = 30.83 for seasons), (p = 0.023 F = 5.476 for season), and Chl-a (p = 0.00, F = 13.96) showed significant differences (Supplementary Table 1). Except turbidity (p = 0.023, F = 2.13) there was no other variable with significant effect on interaction in all stations between depths and seasons. One way ANOVA results however showed the three stations are indeed different with respective parameters (p < 0.05). Turbidity (F = 17.27, p = 0.0) was higher in the caged stations of Ndendere (1.54 ± 2.28) and Honga (0.34 ± 0.3) compared to Nyofu the control station (0.17 ± 0.22) (Table 5). The same with temperature (F = 6.5, p = 0.042) where Ndendere had the highest (23.77 ± 0.58°C) values compared to Honga (23.46 ± 0.38°C) and Nyofu (23.71 ± 0.50°C). Transparency (F = 5.36, p = 0.0) had high values in Honga (2.8 ± 0.68) then Nyofu (2.5 ± 0.28) and low in Ndendere (2.3 ± 0.3). pH (F = 3.5, p = 0.04) had high value in Honga (9.36 ± 0.33) compared to Ndendere (9.33 ± 0.04) and Nyofu (9.33 ± 0.04) (Table 5). In the seasonal scale, temperature (p = 0.22, F = 5.41) had high values in the dry season than wet season whereas DO (F = 26.48, p = 0.0), (F = 3.7, p = 0.017), and Chl-a (F = 14.98, p = 0.00) had high values in wet season than they were in the dry season.
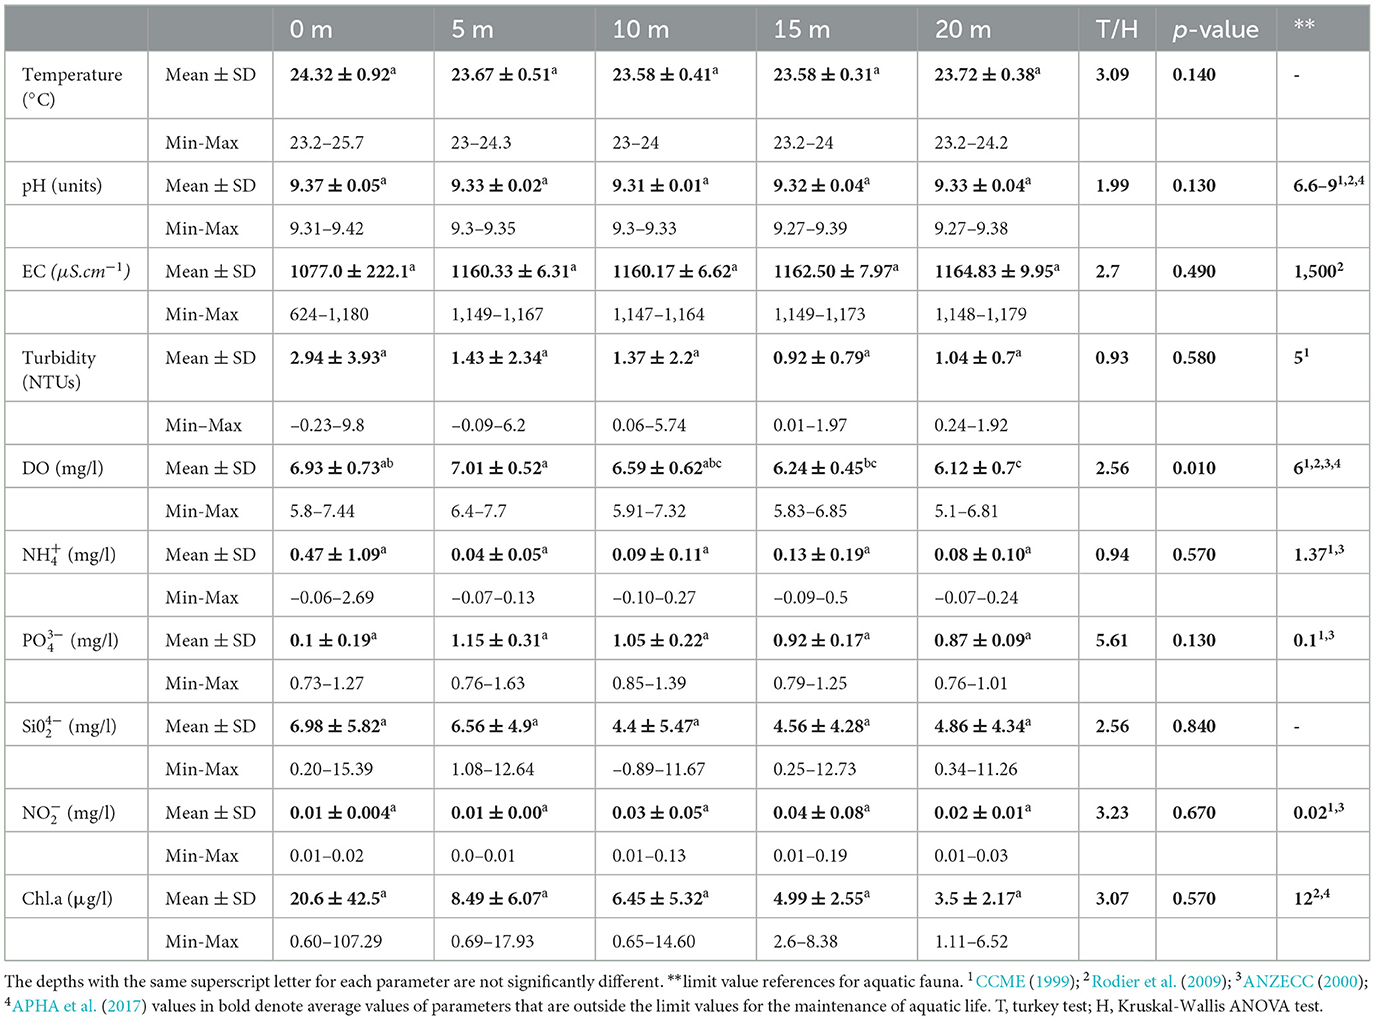
Table 2. Mean (±SD) and ranges (Min-Max) of physico-chemical parameters (N = 10) and standard limit values of parameters per depth at the Ndendere station.
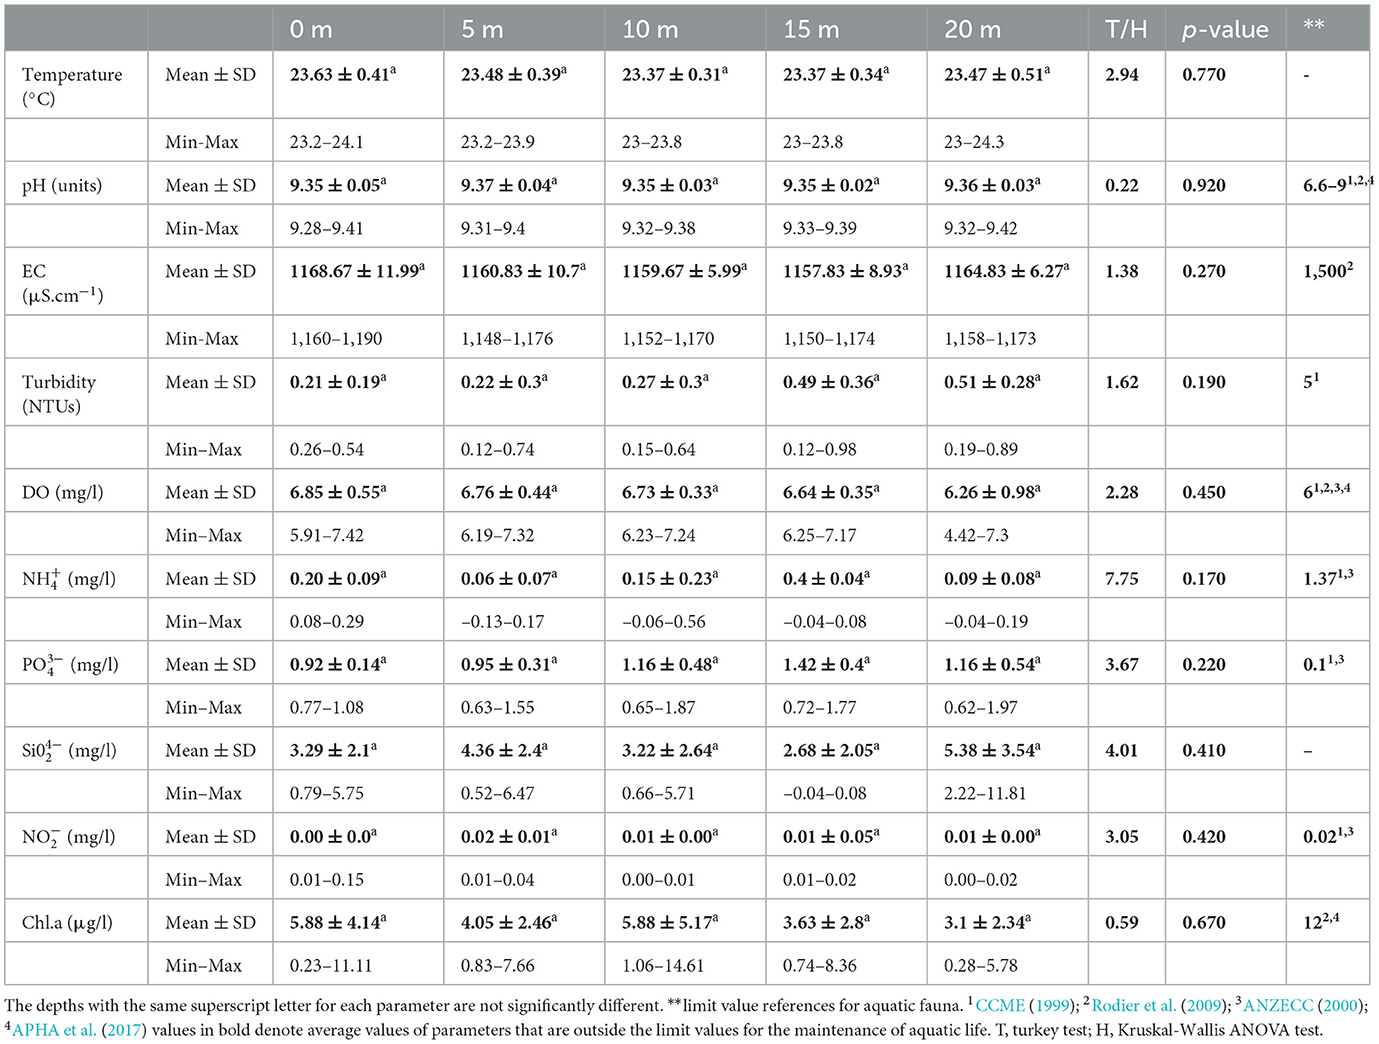
Table 3. Mean (±SD) and ranges (Min-Max) of physico-chemical parameters (N = 10) and standard limit pr depth at the Honga station.
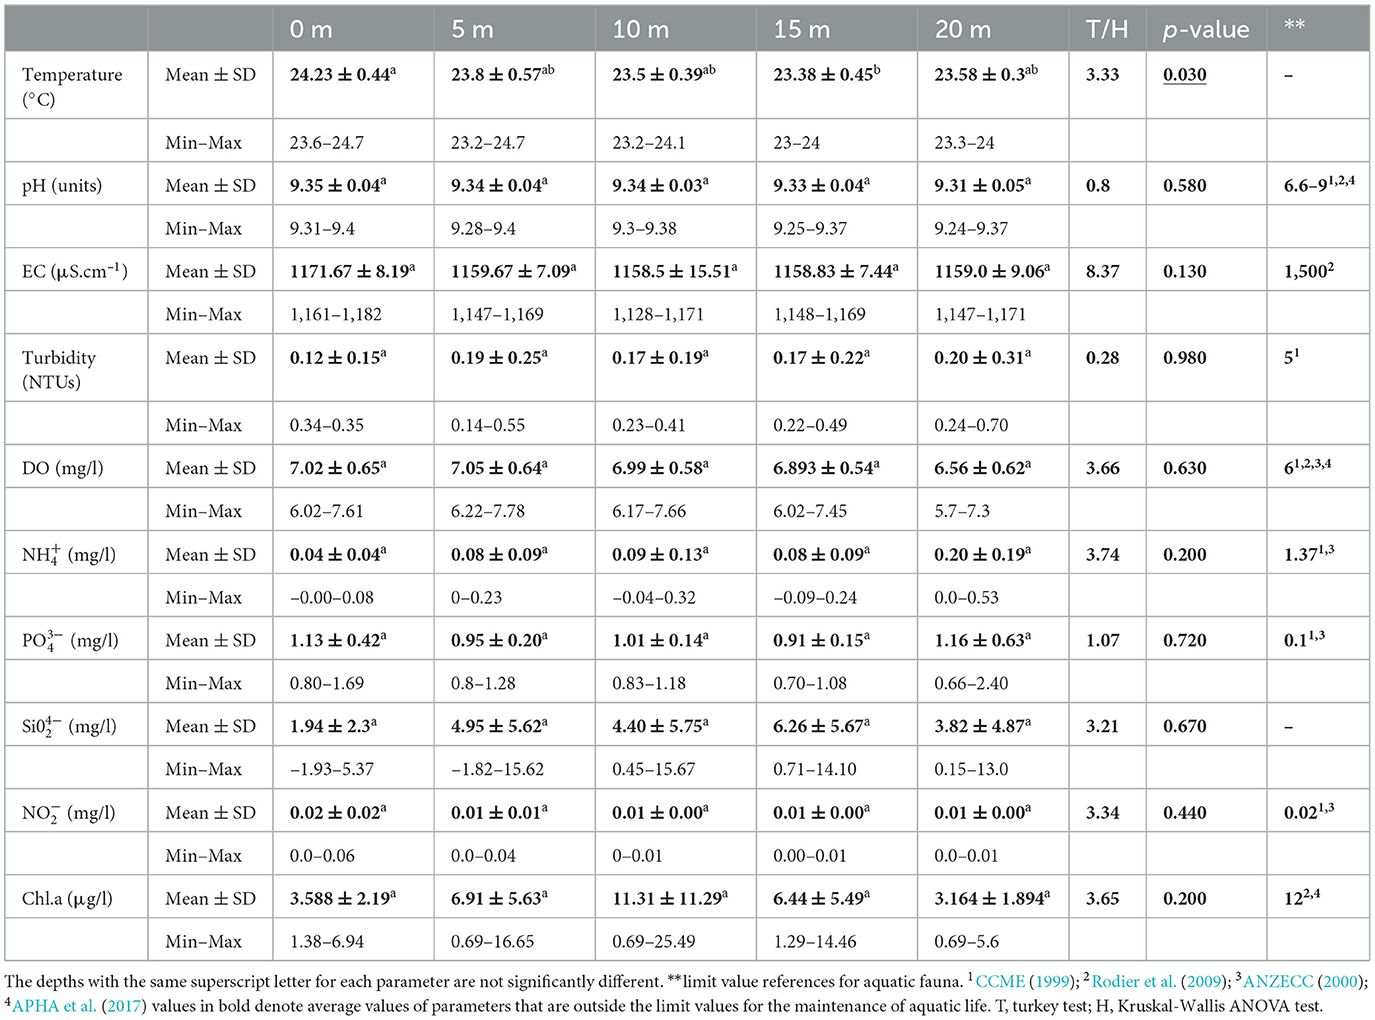
Table 4. Mean (±SD) and ranges (Min–Max) of physico-chemical parameters (n = 10) and standard limit values of parameters per depth at the Nyofu (control) station.
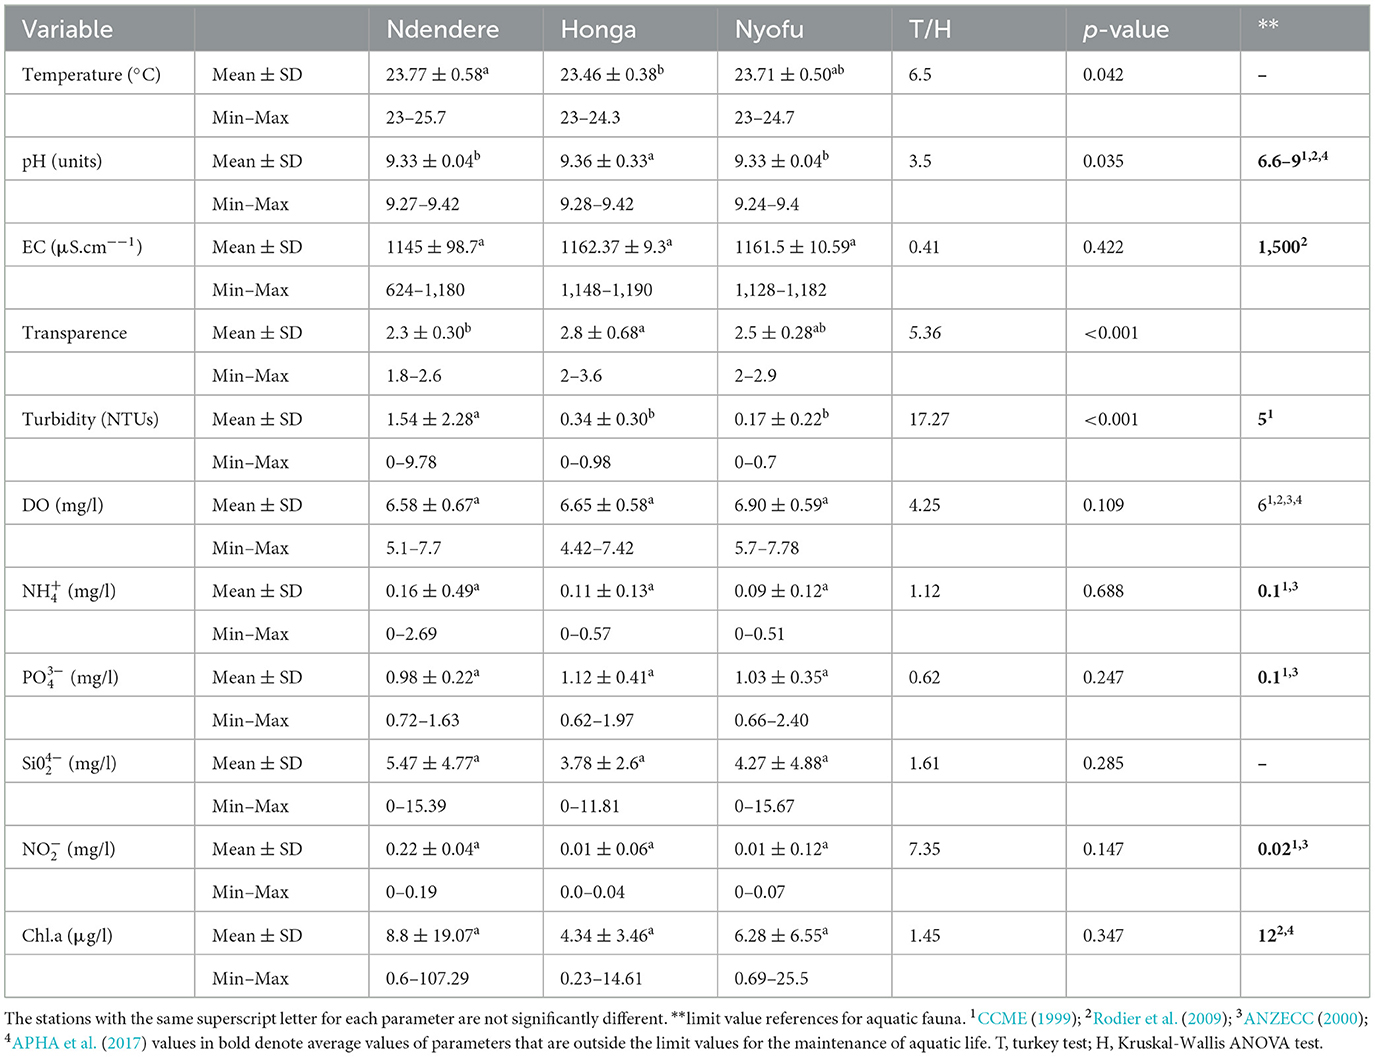
Table 5. Mean (±SD) and ranges (Min–Max) of physico-chemical parameters (n = 11) and standard limit values of parameters for the maintenance of aquatic life according to the guidelines of four reference agencies.
Station wise apart from temperature, electrical conductivity, (mg/l) in Ndendere (Table 6), temperature, Electrical conductivity, (mg/l) in Honga (Table 7) and temperature, (mg/l), (mg/l), and (mg/l) in Nyofu (Table 8), others had high values in wet the season than dry season. Pooling together all the stations in regards to seasons (wet and dry) (Table 9); all parameters except temperature (23.53 ± 0.48, 23.77 ± 0.52), turbidity (1.14 ± 1.9, 0.23 ± 0.49), and DO (7.03 ± 0.61, 6.38 ± 0.46) showed no significant differences (p > 0.05). Furthermore, except for temperature, the other parameters had high values in the wet than the dry season.
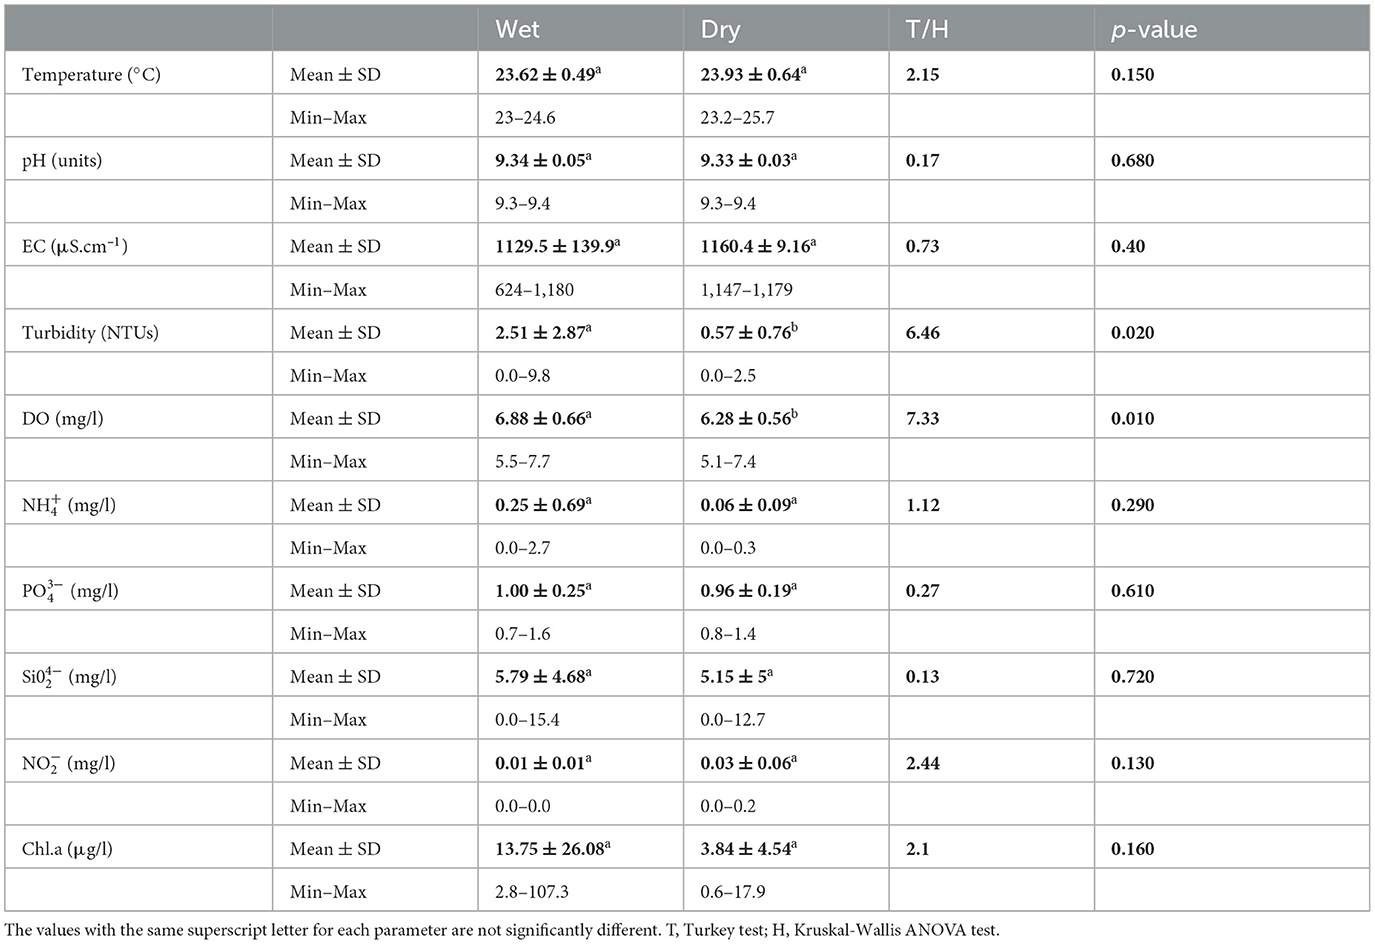
Table 6. Mean (±SD) and ranges (Min–Max) of of physico-chemical parameters (n = 10) on a temporal scale at Ndendere station.
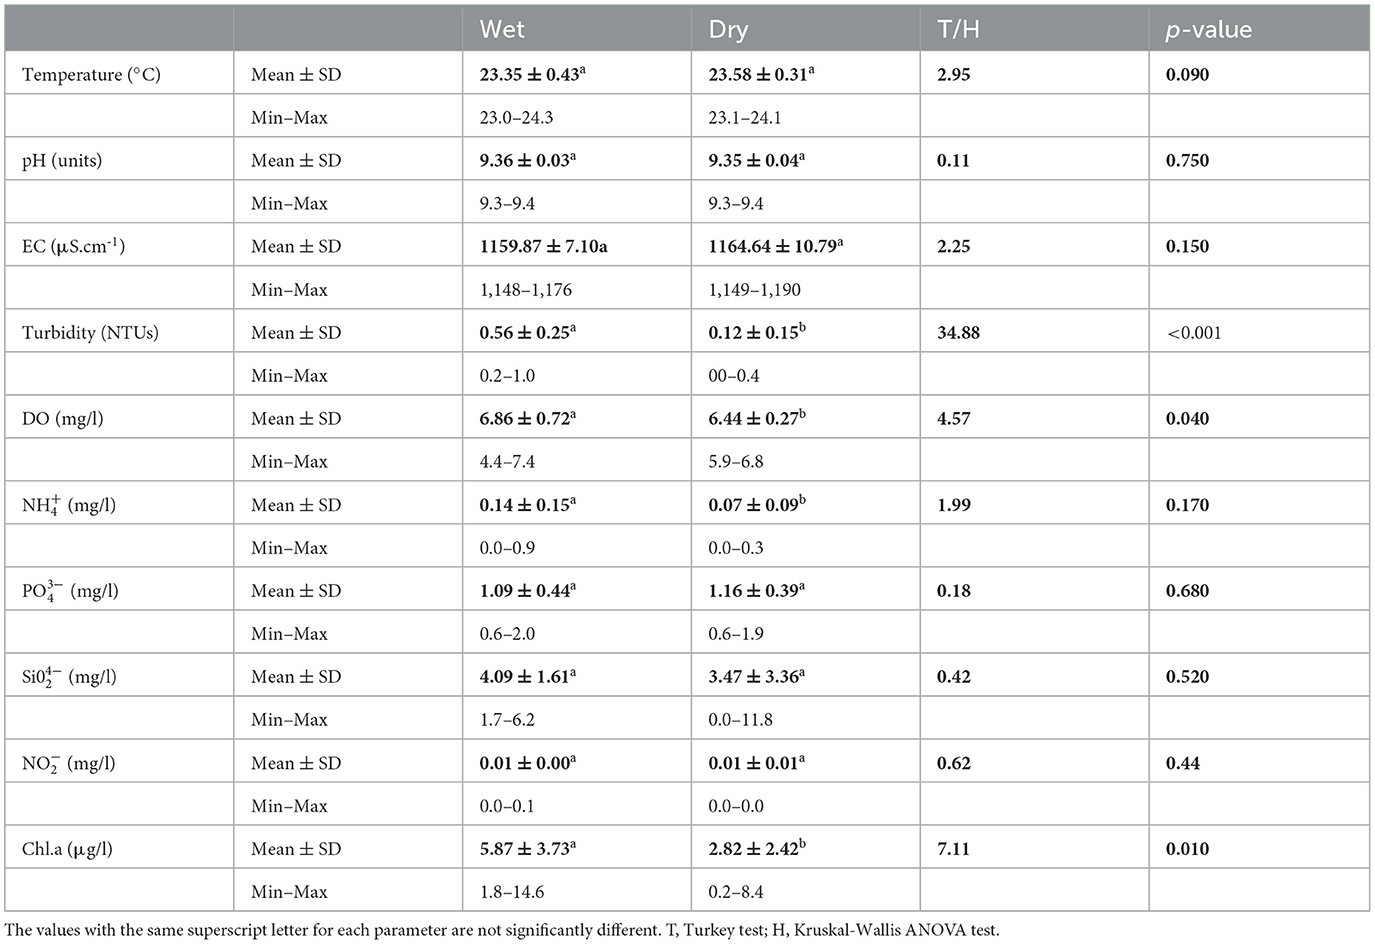
Table 7. Mean (±SD) and ranges (Min–Max) of physico-chemical parameters (n = 10) on a temporal scale at Honga station.
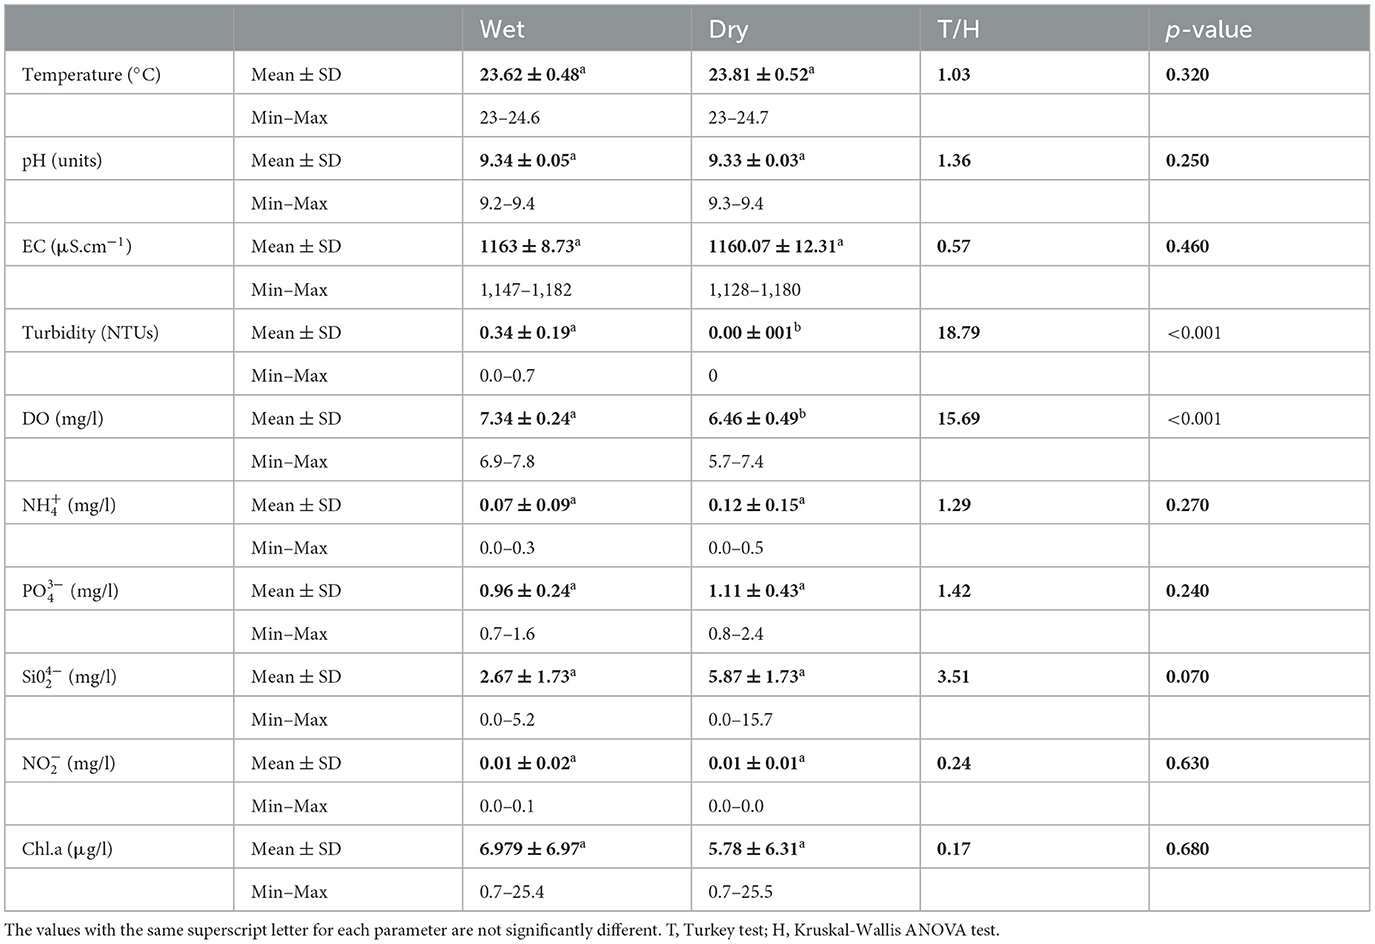
Table 8. Mean (±SD) and ranges (Min-Max) of physico-chemical parameters (n = 10) on a temporal scale at Nyofu (control) station.
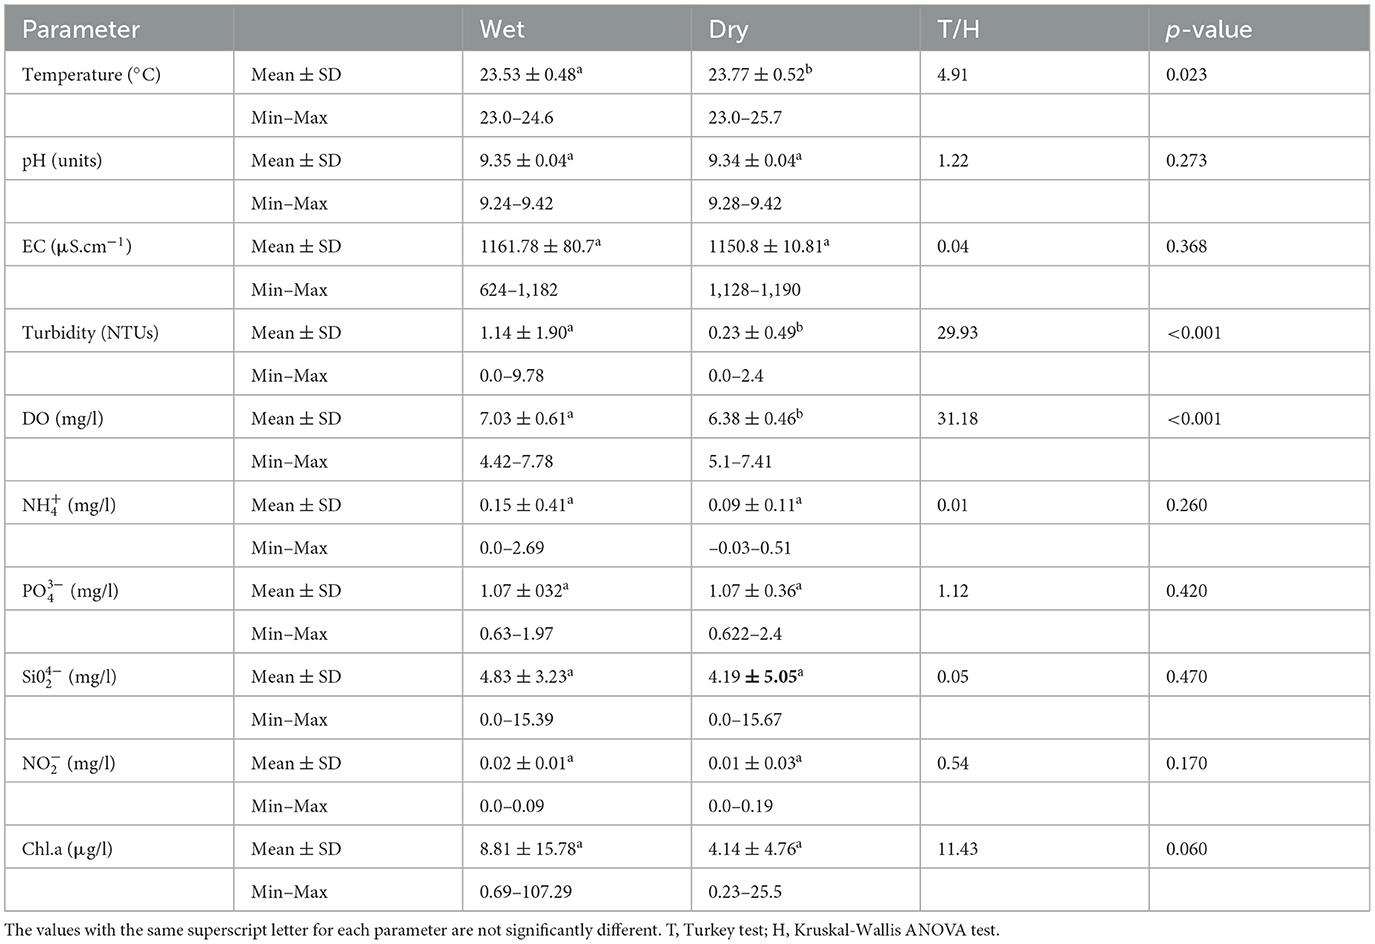
Table 9. Mean (±SD) and ranges (Min–Max) of physico-chemical parameters (n = 11) on a seasonal scale.
With respect to the standard limit for aquatic life on physico-chemical parameters (Tables 2–5), pH values exceeded the upper limit of 9 (CCME, 1999; Rodier et al., 2009; APHA et al., 2017) in all the stations (caged and non-caged stations). (mgL−1) at Ndendere station at depths (0 m, 5 m, and 10 m) and Honga station at depths (10 m, 15 m, and 20 m) exceeded the 0.1 (mgL−1) limit (CCME, 1999; ANZECC, 2000). Equally, the upper limit of 0.02 mg/l (CCME, 1999; ANZECC, 2000) for was exceeded at the Ndendere station at 10 m depth, Honga station at 5 m depth. On the other hand, electrical conductivity, turbidity, , Chl-a values are within the allowable upper limits ranges 1,500 μS.cm−, 5 NTUs, 1.37 mgL−1 and 12 respectively. Furthermore, DO values were above the lower limit of 6 mg/l (CCME, 1999; ANZECC, 2000; Rodier et al., 2009; APHA et al., 2017).
Cage impact on water quality Indices
The various water quality indices calculated showed intra- station variations from average to excellent water quality (Table 10). The water quality index (WQI) (Table 10) in the vertical profiling at Ndendere ranged from 95.15 (excellent quality) at 0 m to 66.24 at 20 m (medium quality) hence decreasing as you go down the depths. Contrary to Honga station where the WQI values increased going down the depths (0–20 m) ranging from 56.12–65.21 (medium quality). In Nyofu, each depth had distinct behavior of the WQI but ranged from 59.86 at 15 m to 73.10 at 20 m (medium to good quality). When each station value is pooled together with respect to vertical profiling, the stations are significantly different (p = 0.001, F = 8.66) with Ndendere (80.88 ± 11.13, excellent quality) being different and Honga and Nyofu showing some similarities-medium quality (61.06 ± 4.45, 59.89 ± 4.40 respectively).
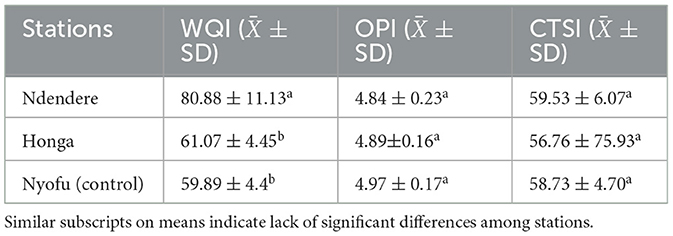
Table 10. Mean (±SD) water quality indices per station.
The Organic Pollution Index (OPI) values (Table 10) for the vertical profiling at each station show no differences between the depths with values ranging from 4.72–4.89, 4.78–5.0 and 4.78–5.0; Ndendere, Honga, and Nyofu respectively hence indicating null pollution. When depths in stations are pooled together for a general view of the station, the vertical profiling, OPI values in (4.84 ± 0.23, 4.89 ± 0.16, and 4.87 ± 0.17) Ndendere, Honga, and Nyofu had no significant difference (p = 0.656, F = 0.42). Carlson's Trophic Status Index (CTSI) (Table 10) at each depth in all stations was with no significant difference (p = 0.147, F = 1.96). The ranges of CTSI were 57.77–61.09 (mild to medium eutrophic), 54.98–58.36 (mild eutrophic), and 56.63–60.84 (mild to medium eutrophic) for Ndendere, Honga, and Nyofu respectively. When the values are pooled for the stations, they showed no significant difference between stations with all showing mild eutrophic state; 58.73 ± 4.69, 56.76 ± 5.93, and 59.53 ± 6.07 for Ndendere, Honga, and Nyofu respectively.
Discussion
Physico-chemical parameters, nutrients and chlorophyll a
The current study sought to provide guidelines for the long-term sustainability of aquaculture production and development in Lake Kivu by assessing water quality indicators, nutrients, and chlorophyll a attributable to fish cages in the Bukavu sub-basin. According to Bascinar et al. (2014), fish cage farming has possibilities of negatively impacting the water quality depending on factors like the type of species in culture, stocking density, the feed used, hydrology of the water and the management plan in the farm. Most physico-chemical parameters in the stations showed no significant differences spatially and temporally. The results from the control station which was at recommendable distance from the cage stations did not show any significant difference with values in the stations with cages. This is in line with the study done by Pitta et al. (2006) and Varol (2019) who reported distance from the cage had no significant effects on changes in parameters in its vicinity. The Bukavu sub-basin of size 96.5 km2 and maximum depth of 105 m (Capart, 1960) with little aquaculture practices being carried out gives time for dilution and recycling of any pollutants in the water and hence effects are less felt (Varol, 2019).
In water, pH is one of the important water quality parameters that affect life conditions by influencing other aquatic parameters when it fluctuates (ANZECC, 2000). Surface water pH values from the current study are in agreement with Kaningini (1995) who stated that the pH ranges of Lake Kivu are between 9.1 and 9.5. The values reflect high fluctuation with the highly alkaline nature of the waters of Lake Kivu which has origin dating back from the large quantities of alkaline carbonates and bicarbonates contained in the water (Degens et al., 1971, 1972; Muvundja et al., 2014). Kashindye et al. (2015) found no significant differences between the pH values of the caged stations and the control station and they were within the limits (6.6–9) (CCME, 1999; Rodier et al., 2009; APHA et al., 2017). On the other hand, there was a significant seasonal change in DO at all stations, in the caged and control stations, with the rainy season having higher DO values than the dry season. According to Sarmento et al. (2006) and Wüest et al. (2009), this is due to the deep mixing of the mixolimnion waters of Lake Kivu induced by the strong south-easterly trade winds that blow during the wet season. This supports research by Hecky and Kling (1987) in Lake Victoria, which documented temporal variations with low DO content (< 1 mgL−1) in the deep water column during stratification. The EC of Ndendere and Honga stations was slightly higher in the in the dry season than in the wet season. According to Murakaru (2010), it was probably due to the dilution effect of feeder Rivers, rainfall falling directly in the lake and seepage whereas the dry season, solutes are concentrated by evaporation resulting to the high values.
Turbidity showed an influence on the interaction between the stations and seasons. Seasonal variations in turbidity are also not attributable to the effects of cage activity, but rather to the heavy rainy season (April, May, and September) inflows from rivers to the lake together with high deposition of materials from the catchment area. This agrees with studies done in Lake Victoria, Kenya where the rainy seasons with high turbidity levels and it was not attributed to caging activities but to river inflows leading to high total suspended solids as both the control station and caged stations had high turbidity values at the same periods (Mwamburi et al., 2020). Mwamburi et al. (2020) went on to clarify that the presence of low turbidity in the open waters is due to enhanced settling of depositions of particle matter and the dilution effect of the deep off-shore waters. Results on turbidity values in the control station of our study which was in open waters are in support of this. However, the slightly high turbidity values at caged stations than there was at the control can be as a result of excess feed, fish wastes e.g., feces, fouling and debris on the cage nets (Nyanti et al., 2012). This results were in agreement with Ameworwor (2014), Asmah et al. (2014), and Clottey et al. (2016) who found slightly high values at caged stations.
Nutrients such as , , , and and Chl-a showed no significant difference spatially but , and Chl-a showed significant differences in the temporal scale. This was in agreement with Gowen and Bradbury (1987) who explained that cage effects may not sometimes be observed in their vicinity due to the highly dynamic physical environment of fish cage farms. In line with this, Soto and Norambuena (2004) recommended that elevated nutrient concentrations do not frequently occur in the area of fish cages, not only due to the dilution process, but also because they transit extremely quickly up the food chain, from phytoplankton to higher levels, as also shown by Mwebaza-Ndawula et al. (2013) on a study done at SON fish farm near headwaters of River Nile. However, this is contrary to Pitta et al. (2006) reported varied values between fish cage farm locations which he linked to differences in organic matter inputs from wastes of each farm. Therefore, the current study shows no influence of cage farms on physico-chemical water parameters. However, slightly higher Chl-a values at the caged station showed possibilities of fish excretion and excess feed which produce necessary nutrients of nitrogen and phosphorus for algal bloom (Demirak et al., 2006; Nyanti et al., 2012; Ameworwor, 2014).
The WQI values calculated for each station in the three stations ranged between medium to good water quality. This shows that water quality is suitable for the maintenance of aquatic life (USEPA, 1995; CCME, 1999) No variations in water quality were observed during the wet and dry seasons, which points to the putative external disturbance sources' potential for permanence. This would result from the fact that none of the parameters that have been investigated and used in the WQI computation had seasonal differences or interactions across stations and sample seasons (Hyangya et al., 2021). Comparison between these stations shows that water quality at caged stations Ndendere and Honga stations were of good and medium quality just like the control station at Nyofu which had equally good quality. The OPI values (4.6–5) were far below the recommended limits for lakes showing the lake to still be organically unpolluted (Leclercq and Maquet, 1987). This therefore indicates that caging activity has had no pollution impact on the lake since their installation.
The obtained CTSI values showed that the lake had mild to medium eutrophication in both the caged and control stations. Chl- a concentration had a higher proportion to the calculated CTSI values showing heavy eutrophic status than Secchi depth showing medium eutrophic status on average. This implied that the water turbidity in the Lake has originated from algal biomass (Ndungu et al., 2013; Opiyo et al., 2019). According to studies done in lentic water systems, the stressors of the lake that can cause changes in its trophic status include increased agricultural activities, urbanization, climate change, eutrophication, sedimentation and habitat degradation (Harper et al., 2011; Al-Haidarey et al., 2016; Njiru et al., 2017; Yongo et al., 2021). In the present study both the control and caged stations are within the same ranges of trophic status, probably indicating tilapia fish cage culture did not influence the trophic status of the lake during the study period. Conversely, the lake's watershed has been occupied with different activities like agriculture, abattoirs, fishing and landing sites, shipyards and ports, hospitals, markets, breweries, coffee, and pharmaceutical industries whose wastes end up leaking in the lake water without proper treatment hence the effects (Lina, 2016; Hyangya et al., 2021). Also with the active cage culture activities in the other bays near the control station Nyofu in the same lake, the level of pollution might have been standardized such that the effects are not over felt in one area but spread the whole stretch hence the results in the study. However for the sustainability of aquaculture and ecosystem functioning in the long term more should be done as far as monitoring is concerned with the indices (Masser, 2008; Aura et al., 2020).
With respect to the standard limit for aquatic life on physico-chemical parameters, pH values exceeded the upper limit of 9 (CCME, 1999; Rodier et al., 2009; APHA et al., 2017) in all the stations (caged and non-caged stations) but were within the stated limit of surface pH ranging between 9.1 and 9.5 (Kaningini, 1995). This is in line with the observation that Lake Kivu waters are highly alkaline due to the large quantities of alkaline carbonates and bicarbonates contained in its waters (Degens et al., 1971, 1972; Muvundja et al., 2014). (mgL−1) at all the stations caged (Ndendere and Honga) and non-caged (Nyofu) exceeded the 0.1 (mg/l) limit (CCME, 1999; ANZECC, 2000). Equally, the upper limit of 0.02 mgL−1 (CCME, 1999; ANZECC, 2000) for NO2 was exceeded at caged stations (Ndendere and Honga). High values of and in the caged stations is related to the general activities around the cages like feeding (Islam et al., 2016). Also, reduction in water movement caused by the presence of the fish cages which Iwama (1991) registered a reduction of current velocity by 65% inside the fish cage mainly due to physical water obstruction by nets and organisms attached to them. Additionally, agricultural activities among others in the riparian region have also been linked to nitrogen and phosphorus loading in the lake (Guildford and Hecky, 2000; Scheren et al., 2000; Ngupula et al., 2012; Lina, 2016). On the other hand, EC, turbidity, , Chl-a values are within the allowable upper limits ranges 1,500 μS.cm−, 5 NTU, 1.37 mgL−1, and 12 respectively (Rodier et al., 2009; APHA et al., 2017). This was an indication that aquaculture activities had actually a little effect on the water's ionic composition and, as a result, on the sub-basin's ecological health. This concurs with research by Kashindye et al. (2015) who associated cage fish farming on the Tanzanian side of Lake Victoria with water movements and hence an indication of less conduction of cage culture to salinity enrichment in the water. However, the marginally higher turbidity and Chl-a readings in the caged stations may be attributable to fish waste, including excrement, overfeeding, fouling, and debris removed from the cage nets with the water movements-waves coming with water (Nyanti et al., 2012; Asmah et al., 2014). Electrical conductivity values were high but did not surpass the limit of 1,500 μS cm−1 but were high with respect to the limit interval of 200 μS cm−1. The values were in line with those from Degens et al. (1973) and Schmid et al. (2005) who reported a range of 1,140–1,200 μS cm−1 hence showing cages did not affect the high conductivity of the lake water. A range of 1,140–1,200 μS cm−1 was reported for EC on the Lake waters rendering the lake generally unfavorable for the growth of aquatic life (Degens et al., 1973; Schmid et al., 2005). According to Degens et al. (1971), the Lake Kivu waters are highly salinized and have a high concentration of dissolved ions, primarily Mg++ (50%) and Na+ (44%) with a relatively low level of Ca++ (2%) hence the reason for high electrical conductivity values. The fact that the DO values were above the lower limit of 6 mgL−1 for maintaining aquatic life (CCME, 1999; ANZECC, 2000; Rodier et al., 2009; APHA et al., 2017) shows that cage activities like feed decomposition had minimal effect on DO levels. Furthermore, DO values were above the lower limit of 6 mg/l hence suitable for supporting aquatic life (CCME, 1999; ANZECC, 2000; Rodier et al., 2009; APHA et al., 2017). Temperature was below 270C the optimum range for good growth of tilapia growth causing damages to its welfare and hence economic loss. Tilapias are tropical fish that find thermal comfort between 27–320C, with temperatures below or above this range affecting their growth rate by reducing their appetite (Pandit and Nakamura, 2010).
Conclusions
Aquaculture has become an important method of global fish production with cage farming being one of the most commonly used methods. However, the expansion of cage farming has raised concerns about potential environmental impacts on freshwater ecosystems. The objective of this study was to elucidate the interactions between cage aquaculture and water quality in the littoral zone of Lake Kivu, Bukavu Basin. Overall, the results of the analyses of the physico-chemical parameters did not show any evidence of a significant deterioration of the water quality as a result of cage aquaculture activities.
All physico-chemical parameters and Chl-a values showed little to no variation vertically 0 m to 20 m depth and among the stations (Ndendere, Honga, and Nyofu). Caged and uncaged stations shared the same patterns in the parameters. Most parameters apart from Secchi Disk, pH, Turbidity did not vary both spatially and temporally hence the lack of significant influence of the tilapia fish cages on water quality in the lake. Most of the physico-chemical parameters except pH, , and were within the standard limits for aquatic life an indication that water quality is currently not a challenge from the fish cage culture. Based on the calculated CTSI results, the depths in the stations ranged from mild to medium eutrophic status. Similarly, the OPI showed little pollution and the WQI showed that the water quality state ranged from medium to good, indicating that cage culture had no significant effect on water quality parameters in the respective stations. Based on these results, fish cage culture is not a current threat to the water quality of the two bays in question. However, with the expected increase in cage farming activities in the African Great Lakes region, continuous monitoring continuous environmental monitoring is required.
To ensure the sustainability of cage farming in Lake Kivu a comprehensive approach that considers both local and systemic factors is needed.
Some potential management strategies include implementing zoning regulations for selecting sites suitable for aquaculture, taking into account parameters such as water depth, flow rates and proximity to sensitive habitats. Also, it is advisable to implement rotation schemes for aquaculture sites to provide recuperation periods for the ecosystem and prevent localized environmental strain. Furthermore, monitoring of feeds administered to fish should be done to ensure high quality nutrient rich feeds are used to reduce potential-negative effect on water quality. Lastly, regulatory measures on cage design, stocking density and waste management and above all regular monitoring programs should be implemented to assess compliance of aquaculture operations with environmental standards, with penalties for non-compliance.
By utilizing these strategies, it will be possible to foresee how aquaculture on Lake Kivu would affect the environment and encourage a balance between the ecosystem's preservation and the expanding demand for aquaculture products. For these strategies to be sustainable over the long term, they must be evaluated and modified continuously in accordance with scientific and technical developments.
Data availability statement
The raw data supporting the conclusions of this article will be made available by the authors, without undue reservation.
Ethics statement
Ethical approval was not required for the study involving animals in accordance with the local legislation and institutional requirements because the study did not deal with live animals or specimens.
Author contributions
SL: Conceptualization, Data curation, Methodology, Writing—original draft, Formal analysis. JW: Data curation, Formal analysis, Methodology, Supervision, Validation, Writing—review & editing. BLH: Conceptualization, Data curation, Methodology, Supervision, Validation, Writing—review & editing. BK: Conceptualization, Supervision, Visualization, Writing—review & editing. J-DK: Data curation, Formal analysis, Writing—review & editing. GS: Formal Analysis, Methodology, Writing—review & editing. AK: Data curation, Formal analysis, Writing—review & editing. BHRH: Conceptualization, Data curation, Formal Analysis, Methodology, Writing—review & editing. MM: Conceptualization, Data curation, Methodology, Supervision, Writing—review & editing. FM: Conceptualization, Data curation, Formal analysis, Funding acquisition, Methodology, Supervision, Writing—review & editing. MPM: Conceptualization, Data curation, Formal analysis, Methodology, Supervision, Writing—review & editing.
Funding
The author(s) declare financial support was received for the research, authorship, and/or publication of this article. Financial assistance offered by the EU through the COTRA Project (Cooperative Training in Fisheries and Aquaculture in Eastern, Central and Southern Africa). Field work and laboratory work was partly supported by UERHA laboratory.
Conflict of interest
The authors declare that the research was conducted in the absence of any commercial or financial relationships that could be construed as a potential conflict of interest.
Publisher's note
All claims expressed in this article are solely those of the authors and do not necessarily represent those of their affiliated organizations, or those of the publisher, the editors and the reviewers. Any product that may be evaluated in this article, or claim that may be made by its manufacturer, is not guaranteed or endorsed by the publisher.
Supplementary material
The Supplementary Material for this article can be found online at: https://www.frontiersin.org/articles/10.3389/frwa.2024.1325967/full#supplementary-material
References
Al-Haidarey, M. J. S., Ibtihal, A. A., Muhson, A. C. A., and Al-Ansari, N. (2016). The trophic state index of bahral-najaf depression reservoir, Iraq. J. Hydro-Environ. Res. 24: 1–10.
Ameworwor, M. (2014). Impacts of Fish Cage Culture on Water Quality and Selected Commercially Important Fish Stocks in Volta Lake (Stratum II) (thesis). Department of Marine and Fisheries Sciences, University of Ghana, Accra, Legon.
ANZECC (2000). “Australian and New Zealand guidelines for fresh and marine water quality,” in Australian and New Zealand Environment and Conservation Council and Agriculture and Resource Management Council of Australia and New Zealand, Canberra 1–103.
APHA AWWA and WEF. (2017). Standard methods for the examination of water and wastewater, 23rd Edition. Washington. DC: American Public Health Association, American Water Works Association and Water Environment Federation.
Asmah, R., Karikari, A. Y., Abban, E. K., Ofori, J. K., and Awity, L. K. (2014). Cage fish farming in the Volta Lake and the Lower Volta: practices and potential impacts on water quality. Ghana J. Sci. 54, 33–47.
Aura, C. M., Nyamweya, C., Njiru, J. M., Musa, S., Ogari, Z., and Wakwabi, E. (2018). Exploring the demarcation requirements of fish breeding and nursery sites to balance the exploitation, management and conservation needs of Lake Victoria ecosystem. Fish. Manag. Ecol. 26, 451–459. doi: 10.1111/fme.12311
Aura, C. M., Nyamweya, C. S., Odoli, C. O., Owiti, H., Njiru, J. M., Otuo, P. W., et al. (2020). Consequences of calamities and their management: the case of COVID-19 pandemic and flooding on inland capture fisheries in Kenya. J. Great Lakes Res. 46, 1767–1775. doi: 10.1016/j.jglr.2020.09.007
Aura, M. C., Musa, S., Yongo, E., Okechi, J., Njiru, J. M., Ogari, Z., et al. (2018). Integration of mapping and socio-economic status of cage culture: towards balancing lake-use and culture fisheries in Lake Victoria, Kenya. Aquac. Res. 49, 532–545. doi: 10.1111/are.13484
Bahroun, S., and Bousnoubra, H. K. (2011). Evaluation de l'indice de pollution organique dans les eaux naturelles cas de la région d'El Tarf (Nord-Est Algérien). Larhyss J. 2521–9782.
Bartram, J., and Balance, R. (1996). Water quality monitoring: A practical guide to the design and implementation of freshwater quality studies and monitoring programmes. UNEP/UNESCO.
Bascinar, N. S., Gozler, A. M., Sahin, C., Eruz, Ç, Tolun, L., Agirbas, E., Mantikci, M., et al. (2014). The impact assessment of cage aquaculture on benthic communities along the south eastern Black Sea. Iran. J. Fish. Sci 13, 720–739.
Basima, L. B., Mbalassa, M., Muhigwa, B., and Nshombo, M. (2006). Anthropogenic influences on the littoral zone biota of Lake Kivu, Bukavu Basin, DR Congo Verh. - Int. Ver. Theor. Angew. Limnol. 29, 2283–2288. doi: 10.1080/03680770.2006.11903100
Beadle, L. C. (1981). The Inland Waters of Tropical Africa: an Introduction to Tropical Limnology, 2nd edn. Longman, London.
Bisimwa, M. (2009). Water quality management in Lake Kivu basin: A case study of Bukavu sub-basin, DR Congo (thesis). University of Dar-es-salaam, Dar-es-salaam, Tanzania.
Boyd, C. E., Lim, C., Queiroz, J., Salie, K., and de Wet, L. (2008). Best Management Practices For Responsible Aquaculture. Washington, DC: USAID. doi: 10.1002/9780813818672.ch3
Branchu, P., Bergonzini, L., Benedetti Ambrosi, J.-P., and et Klerkx, J. (2005). Sensibilité à la pollution méthanique de deux grands lacs africains (Tanganyika et Malawi). Rev. Sci. Eau. 18, 161–180. doi: 10.7202/705582ar
Britton, A. W., Murrell, D. J., McGill, R. A., Doble, C. J., Ramage, C. I., and Day, J. J. (2019). The effects of land use disturbance vary with trophic position in littoral cichlid fish communities from Lake Tanganyika. Freshw. Biol. 64, 1114–1130. doi: 10.1111/fwb.13287
Carlson, R. E. (1977). A trophic state index for lakes. Limnol. Oceanogr. 22, 361–369. doi: 10.4319/lo.1977.22.2.0361
Carlson, R. E., and Simpson, J. (1996). A coordinator's guide to volunteer lake monitoring methods. NALMS 96, 305.
CCME (1999). Canadian Environmental Qualities Guidelines, Canadian Council of Ministers of the environment. Manitoba Statuary Publications, Winnipeg, Canada.
Clottey, M. N. K., Asmah, R., Ofori-Danson, P. K., Ameworwor, M. Y., and Karikari, A. Y. (2016). Impacts of cage culture on physico-chemical and bacteriological water quality in Lake Volta, Ghana, Afr. J. Aquat. Sci. 41, 473–480. doi: 10.2989/16085914.2016.1255587
Cude, C. G. (2001). Oregon water quality index a tool for evaluating water quality management effectiveness 1. JAWRA 37, 125–137. doi: 10.1111/j.1752-1688.2001.tb05480.x
Dauda, A. B., Ajadi, A., Tola-Fabunmi, A. S., and Akinwole, A. O. (2019). Waste production in aquaculture: Sources, components and managements in different culture systems. Fish. Aquac. J. 4, 81–88. doi: 10.1016/j.aaf.2018.10.002
Davies, J. M. (2006). Application and tests of the Canadian water quality index for assessing changes in water quality in lakes and rivers of central North America. LRM 22, 308–320 doi: 10.1080/07438140609354365
Debels, P., Figueroa, R., Urrutia, R., Barra, R., and Niell, X. (2005). Evaluation of water quality in the Chillán River (Central Chile) using physicochemical parameters and a modified water quality index. Environ. Monit. Assess. 110, 301–322. doi: 10.1007/s10661-005-8064-1
Degefu, F., Mengistu, S., and Schagerl, M. (2011). Influence of fish cage farming on water quality and plankton in fish ponds: a case study in the Rift Valley and North Shoa reservoirs. Ethiop. J. Agric. Sci. 316, 129–135. doi: 10.1016/j.aquaculture.2011.03.010
Degens, E. T., Okada, H., Honjo, S., and Hathaway, J. C. (1972). Microcrystalline sphalerite in resin globules suspended in Lake Kivu, East Africa. Miner Deposita 7, 1–12. doi: 10.1007/BF00206891
Degens, E. T., Von Herzen, R. P., and Wong, H. K. (1971). Lake Tanganyika: water chemistry, sediments, geological structure. Sci. Nat. 58, 229–241. doi: 10.1007/BF00602986
Degens, E. T., von Herzen, R. P., Wong, H. K., Deuser, W. G., and Jannasch, H. W. (1973). Lake Kivu: structure, chemistry and biology of an East African rift lake. Geol Rundsch. 62, 245–277. doi: 10.1007/BF01826830
Demirak, A., Balci, A., and Tüfekçi, M. (2006). Environmental impact of the marine aquaculture in GüLLük Bay Turkey. Environ. Monit Assess 123, 1–12. doi: 10.1007/s10661-005-9063-y
Descy, J. P., Darchambeau, F., and Schmid, M. (2012). Lake Kivu: Limnology and Biogeochemistry of a Tropical Great Lake. Cham: Springer. doi: 10.1007/978-94-007-4243-7
Effendie, I., Nirmala, K., Hasan Saputra, U., Sudrajat, A. O., Zairin, M., and Kurokura, H. (2005). Water quality fluctuations under floating net cages for fish culture in Lake Cirata and its impact on fish survival. Fisher. Sci. 71, 972–977. doi: 10.1111/j.1444-2906.2005.01053.x
FAO (2017). Greenhouse gas emissions from aquaculture - a life cycle assessment of three asian systems. FAO Fisheries and Aquaculture Technical Paper.
FAO (2020). The State of World Fisheries and Aquaculture 2020: Sustainable Science. Rome, Italy: FAO, 200.
FAO (2022). The State of World Fisheries and Aquaculture 2022: Towards Blue Transformation. Rome: FAO, 1–11.
Garcia de Souza, J. R., Solimano, P. J., Maiztegui, T., Baigun, C. R. M., and Colautti, D. C. (2015). Effects of stocking density and natural food availability on the extensive cage culture of pejerrey (Odontesthes bonariensis) in a shallow Pampean lake in Argentina. Aquac. Res. 46, 1332–1344. doi: 10.1111/are.12286
Gentry, R. R., Froehlich, H. E., Grimm, D., Kareiva, R., Parke, M., Rust, M., et al. (2017). Mapping the global potential for marine aquaculture. Nat. Ecol. Evol. 1:1317. doi: 10.1038/s41559-017-0257-9
Gondwe, M. J. S., Guildford, S. J., and Hecky, R. E. (2011). Physical-chemical measurements in the water column along a transect through a tilapia cage fish farm in Lake Malawi, Africa. J. Great Lakes Res. 37, 102–113. doi: 10.1016/j.jglr.2010.10.001
Gowen, R. J., and Bradbury, N. B. (1987). The ecological impact of salmonid farming in coastal waters-a review. Oceanogr. Mar. Biol. Annu. Rev. 25, 563–575.
Guildford, S. J., and Hecky, R. E. (2000). Total nitrogen, total phosphorus and nutrient limitation in lakes and oceans: is there a common relationship? Limnol. Oceanogr. 45, 1213–1223. doi: 10.4319/lo.2000.45.6.1213
Hamilton, S. E., Gallo, S. M., Krach, N., Nyamwea, C. S., Okechi, J. K., Aura, C. M., et al. (2020). The use of unmanned aircraft systems and high resolution satellite imagery to monitor tilapia fish cage aquaculture expansion in Lake Victoria, Kenya. Bull. Mar. Sci. 96, 71–93. doi: 10.5343/bms.2019.0063
Harper, M. D, Morrison, E. H. J., Macharia, M. M., Mavuti, K. M., and Upton, C. (2011). Lake Naivasha, Kenya: ecology, society and future. Freshwater Rev. 4, 89–114. doi: 10.1608/FRJ-4.2.149
Hecky, R. E., and Kling, H. J. (1987). Phytoplankton ecology and the great lakes in the rift valley of Central Africa. Ergeb. Limnol. 25, 197–228.
Helmer, R., and Hespanhol, I. (1997). Water Pollution Control-a Guide to the Use of Water Quality Management Principles. Published on behalf of the United Nations Environment Programme, the Water Supply and Sanitation Collaborative Council and the World Health Organization by E and F Spon. London: Thomaon Professional. 435–441.
Hernández-Romero, A. H., Tovilla-Hernández, C., Malo, E. A., and Bello-Mendoza, R. (2004). Water quality and presence of pesticides in a tropical coastal wetland in southern Mexico. Mar. Pollut. Bull. 48, 1130–1141. doi: 10.1016/j.marpolbul.2004.01.003
Huang, Y., Ciais, P., Goll, D. S., Sardans, J., Peñuelas, J., Cresto-Aleina, F., et al. (2020). The shift of phosphorus transfers in global fisheries and aquaculture. Nat. Commun. 11:355. doi: 10.1038/s41467-019-14242-7
Hyangya, B. L., Riziki, J. W., Masilya, P. M., Zabene, F. Z., Alunga, G. L., Kaningini, B. M., et al. (2021). Physico-chemical characterization of littoral water of Lake Kivu (Southern basin, Central Africa) and use of water quality index to assess their anthropogenic disturbances. World Water Policy 1–28. doi: 10.1002/wwp2.12059
Islam, G. M. N., Tai, S. Y., and Kusairi, M. N. (2016). A stochastic frontier analysis of technical efficiency of fish cage culture in Peninsular Malaysia. Springer Plus 5:1127. doi: 10.1186/s40064-016-2775-3
Istvanovics, V. (2010). “Eutrophication of lakes and reservoirs,” in Journal of Freshwater Ecology, ed. G. Likens (New York: Academic Press, Inc).
Iwama, G. I. (1991). Interactions between aquaculture and the environment. Crit Rev Env Control. 21, 177–216. doi: 10.1080/10643389109388413
Jonnalagadda, S. B., and Mhere, G. (2001). Water quality of the odzi river in the eastern highlands of zimbabwe. Water Res. 35, 2371–2376. doi: 10.1016/S0043-1354(00)00533-9
Kaningini, B. (1995). Etude de la croissance, de la reproduction et de l'exploitation de Limnothrissa miodon au lac Kivu, bassin de Bukavu (Zaïre). PhD thesis, University of Namur, Belgium.
Kaningini, M., Micha, J.-C., Vandenhaute, J., Platteau, J.-P., Watongola, H., Melard, C., et al. (1999). Pêche du Sambaza au filet maillant dans le lac Kivu. Rapport final du projet ONG/219/92/Zaïre. Presses Universitaires de Namur, ETEC, 187.
Kannel, P. R., Lee, S., Lee, Y. S., Kanel, S. R., and Pelletier, G. J. (2007). Application of automated QUAL2Kw for water quality modeling and management in the Bagmati River, Nepal. Ecol. Modell. 202, 503–517. doi: 10.1016/j.ecolmodel.2006.12.033
Karikari, A. Y., Asmah, R., Ofori, J. K., Agbo, N. W., and Amisah, S. (2016). Characteristics of cage aquaculture in Ghana: a case study of Lake Volta at Asuogyaman District. J. Ghana Sci. Assoc. 1:77.
Kashindye, B. B., Nsinda, P., Kayanda, R., Ngupula, G. W., Mashaf, C. A., and Ezekiel, C. N. (2015). Environmental impacts of cage culture in Lake Victoria: the case of Shirati Bay-Sota, Tanzania. SpringerPlus 4, 1–15. doi: 10.1186/s40064-015-1241-y
Kosten, S., Almeida, R. M., Barbosa, I., Mendonca, R.„, Muzitano, I. S., Oliveira-Junior, E. S., et al. (2020). Better assessments of greenhouse gas emissions from global fish ponds needed to adequately evaluate aquaculture footprint. Sci. Total Environ. 748:141247. doi: 10.1016/j.scitotenv.2020.141247
Leclercq, L., and Maquet, B. (1987). Deux nouveaux indices chimique et diatomique de qualitéd'eau courante. Application au Samson et à sesaffluents (Bassin de la Meuse belge). Comparaison avec d'autres indices chimiques biocénotique set diatomiques, Editions. IRSNB, 1–113.
Likens, G. E., Bormann, F. H., Pierce, R. S., Eaton, J. S., and Johnson, N. M. (1977). Biogeochemistry of a Forested Ecosystem. New York: Springer Science & Business Media. doi: 10.1007/978-1-4615-9993-7
Lina, A. A. (2016). Evaluation des charges polluantes (domestiques et industriels) arrivant au lac Kivu dans la ville de Bukavu, RDCongo. Thèse de doctorat, Faculté des Sciences, Université de Liège, 241.
Marshall, B. E. (1993). Biology of the African clupeid Limnothrissa miodon with reference to its small size in artificial lakes. Rev. Fish Biol. Fish 3, 17–38. doi: 10.1007/BF00043296
Masilya, P., Kaningini, B., Isumbisho, P., Micha, J.-C., and Ntakimazi, G. (2005). “Food and feeding activity of Limnothrissa miodon (Boulenger, 1906) in the southern part of Lake Kivu, Central Africa,” in International Conference Africa's Great Rift: Diversity and Unity. Royal Academy for Overseas Sciences, RMCA, 83–93.
Mhlanga, L., Phiri, C., and Chifamba, P. (2014). Challenges surrounding water management within Lake Kariba.
Ministry of Foreign Affairs (2018). Climate Change Profile – Democratic Republic of the Congo. Available online at: https://reliefweb.int/sites/reliefweb.int/files/resources/DRC%2B%28east%29.pdf (accessed October 14, 2023).
Msangi, S., and Batka, M. (2015). “The rise of aquaculture: the role of fish in global food security,” in 2014–2015 Global Food Policy Report, chapter 8 (International Food Policy Research Institute (IFPRI)), 61–72.
Murakaru, J. M. (2010). Seasonal Changes in Physico–Chemical Status and Algal Biomass of Lake Naivasha, Kenya Kenyatta University. Doctoral dissertation, Msc. Thesis, AquaDocs.
Musa, S., Aura, M. C., and Okechi, K. J. (2021). Economic analysis of tilapia cage culture in Lake Victoria using different cage volumes. J. Appl. Aquac. 34, 674–692. doi: 10.1080/10454438.2021.1884632
Musinguzi, L., Lugya, J., Rwezaula, P., Kamya, A., Nuwahereza, C., Halafo, J., et al. (2019). The extent of cage aquaculture, adherence to best practices and reflections for sustainable aquaculture on African inland waters. J. Great Lakes Res. 45, 1340–1347. doi: 10.1016/j.jglr.2019.09.011
Muvundja, F. A., Munini, M., Kisekelwa, T., Masilya, M., Isumbisho, M., and Kaningini, M. (2014). Hydrologie et qualité physico-chimique des eaux des réservoirs des barrages hydroélectriques de la Rivière Ruzizi, Sud-Kivu, RDC. Cahiers du CERUKI/Nouvelle Série, Numéro spécial Prof. Alphonse Byamungu Nakahazi (1961–2002): 29–42.
Muvundja, F. A., Pasche, N., Bugenyi, F. W., Isumbisho, M., Müller, B., Namugize, J. N., et al. (2009). Balancing nutrient inputs to Lake Kivu. J. Great Lakes Res. 35, 406–418. doi: 10.1016/j.jglr.2009.06.002
Mwamburi, J., Basweti, G., Owili, M., Babu, J., and Wawiye, P. (2020). Spatio-temporal trends of nutrients and physico-chemical parameters on lake ecosystem and fisheries prior to onset of cage farming and re-opening of the Mbita passage in the Nyanza gulf of Lake Victoria Lakes Reserv. Res. Manag. 25, 292–313. doi: 10.1111/lre.12329 Kling, G. (2009). A lakeful of trouble. Nature 460:16.
Mwebaza-Ndawula, L., Kiggundu, V., Magezi, G., Naluwayiro, J., Gandi-Pabire, W., and Ochaya, H. (2013). Effects of cage fish culture on water quality and selected biological communities in northern Lake Victoria, Uganda. Uganda J. Agricult. Sci. 14, 61–75.
Ndungu, J., Augustijn, D. C., Hulscher, S. J., Kitaka, N., and Mathooko, J. (2013). Spatio-temporal variations in the trophic status of Lake Naivasha, Kenya. Lakes Reserv. 18, 317–328. doi: 10.1111/lre.12043
Ngupula, G. W., Ezekiel, C. N., Kimirei, I. A., Mboni, E., and Kashindye, B. B. (2012). Physical and chemical characteristics of the Tanzanian inshore and offshore waters of Lake Victoria in 2005–2008. Afr. J. Aquat Sci. 37, 339–345. doi: 10.2989/16085914.2012.712503
Njiru, J., Waithaka, E., and Aloo, P. A. (2017). An overview of the current status of Lake Naivasha fishery: challenges and management strategies. Open J. Fish. 10, 1–11. doi: 10.2174/1874401X01710010001
Njiru, J. M., Aura, C. M., and Okechi, J. K. (2018). Cage fishing culture in Lake Victoria: a boon or disaster in waiting? Fish. Manag. Ecol. 26, 426–433. doi: 10.1111/fme.12283
Nyakeya, K., Masese, F. O., Gichana, Z., Nyamora, J. M., Getabu, A., Onchieku, J., et al. (2022). Cage farming in the environmental mix of Lake Victoria: an analysis of its status, potential environmental and ecological effects, and a call for sustainability. Aquat Ecosyst. Health Manag. 25, 37–52. doi: 10.14321/aehm.025.04.37
Nyanti, L., Hii, K. M., Sow, A., Norhadi, I., and Ling, T. Y. (2012). Impacts of aquaculture different depths and distances from cage culture sites in Batang Ai Hydro-electric Dam Reservoir, Sarawak, Malaysia. World Appl. Sci. J. 19, 451–156. doi: 10.5555/20123346564
Obiero, K. O., Waidbacher, H., Nyawanda, B. O., Munguti, J. M., Manyala, J. O., and Kaunda-Arara, B. (2019). Predicting uptake of aquaculture technologies among smallholder fish farmers in Kenya. Aquac. Int. 27, 1689–1707. doi: 10.1007/s10499-019-00423-0
Odada, E. O., Olago, D. O., Bugenyi, F., Kulindwa, K., Karimumuryango, J., West, K., et al. (2003). Environmental assessment of the east African rift valley lakes. Aquat. Sci. 65, 254–271. doi: 10.1007/s00027-003-0638-9
Okechi, J. K., Peoples, N., Nyamweya, C. S., Glaser, S., and Kaufman, L. (2022). The ecological health of Lake Victoria (Kenya) in the face of growing cage aquaculture. Conserv. Sci. Pract. 4:e12826. doi: 10.1111/csp2.12826
Opiyo, S., Getabu, A. M., Sitoki, L. M., Shitandi, A., and Ogendi, G. M. (2019). Application of the Carlson's trophic state index for the assessment of trophic status of lake Simbi ecosystem, a deep alkaline-saline lake in Kenya. Int. J. Fish. 7, 327–333. doi: 10.2139/ssrn.3451145
Osei, L. K., Asmah, R., Aikins, S., and Karikari, A. Y. (2019). Effects of fish cage culture on water and sediment quality in the gorge area of lake Volta in Ghana: a case study of lee fish cage farm. Ghana J. Sci. 60, 1–16. doi: 10.4314/gjs.v60i1.1
Ouma, S. O., Ngeranwa, J. N., Juma, K. K., and Mburu, D. N. (2016). Seasonal variation of the physicochemical and bacteriological quality of water from five rural catchment areas of lake victoria basin in Kenya. J. Environ. Anal. Chem. 3, 2380–2391. doi: 10.4172/2380-2391.1000170
Pandit, N. P., and Nakamura, M. (2010). Effect of high temperature on survival, growth and feed conversion ratio of nile tilapia, Oreochromis niloticus. Our Nat. 8, 219–224. doi: 10.3126/on.v8i1.4331
Pesce, S. F., and Wunderlin, D. A. (2000). Use of water quality indices to verify the impact of Córdoba City (Argentina) on Suqui? River. Water Res. 34, 2915–2926. doi: 10.1016/S0043-1354(00)00036-1
Pitta, P., Apostolaki, E. T., Tsagaraki, T., Tsapakis, M., and Karakassis, I. (2006). Fish farming effects on chemical and microbial variables of the water column:a spatio-temporal study along the Mediterranean Sea. Hydrobiologia 563, 99–108. doi: 10.1007/s10750-005-1593-3
Price, C., Black, K. D., Hargrave, B. T., and Morris, J. A. (2015). Marine cage culture and the environment: effects on water quality and primary production. Aquac. Environ. Interact. 6, 151–174. doi: 10.3354/aei00122
Rodier, J., Legube, B., and Merlet, N. (2009). L'analyse de l'eau. 9th edition. London: Dunod, 1530.
Rurangwa, E., and Kabagambe, J. B. (2018). Review and Analysis of Small-Scale Aquaculture Production in East Africa; Part 2. RWANDA. Wageningen: Wageningen Centre for Development Innovation, Wageningen University and Research. Report WCDI-18-022.
Rutegwa, M., Gebauer, R., Vesel,ý, L., Regenda, J., Struneck,ý, O., Hejzlar, J., et al. (2019). Diffusive methane emissions from temperate semi-intensive carp ponds. Aquac. Environ. Interact. 11, 19–30. doi: 10.3354/aei00296
Sánchez, E., Colmenarejo, M. F., Vicente, J., Rubio, A., García, M. G., Travieso, L., et al. (2007). Use of the water quality index and dissolved oxygen deficit as simple indicators of watersheds pollution. Ecol. Indic. 7, 315–328. doi: 10.1016/j.ecolind.2006.02.005
Sarkar, C., and Abbasi, S. A. (2006). QUALIDEX–a new software for generating water quality indice. Environ. Monit. Assess. 119, 201–231. doi: 10.1007/s10661-005-9023-6
Sarmento, H., Isumbisho, M., and Descy, J.-P. (2006). Phytoplankton ecology of Lake Kivu (Eastern Africa). J. Plankton Res. 28, 815–829. doi: 10.1093/plankt/fbl017
Scheffel, R. L., and Wernet, S. J. (1980). Natural Wonders of the World United States of America. New York: Reader's Digest Association, Inc., 206–207.
Scheren, P. A. G. M., Zanting, H. A., and Lemmens, A. M. C. (2000). Estimation of water pollution sources in Lake Victoria, East Africa: application and elaboration of the rapid assessment methodology. J. Environ. Manage. 58, 235–248. doi: 10.1006/jema.2000.0322
Schmid, M., Halbwachs, M., Wehrli, B., and Wüest, A. (2005). Weak mixing in Lake Kivu: New insights indicate increasing risk of uncontrolled gas eruption. Geochem. Geophys. 6:892. doi: 10.1029/2004GC000892
Snoeks, J., De Vos, L., and Van den Audenaerde, D. T. (1997). The ichthyogeography of Lake Kivu. South Afr. J. Sci. 93, 579–584.
Soto, D., and Norambuena, F. (2004). Evaluation of salmon farming effects on marine systems in the inner seas of southern Chile: a large-scale mensurative experiment. J. Appl. Ichthyol. 20, 493–501. doi: 10.1111/j.1439-0426.2004.00602.x
Tacon, A. G. J., and Halwart, M. (2007). “Cage aquaculture: a global overview,” in Cage aquaculture: Regional reviews and global overview, eds. M. Halwart, D. Soto, and J. R. Arthur (Rome, Italy: FAO), 1–6.
Tambuk-Giljanovic, N. (1999). Water quality evaluation by index in Dalmatia. Water Res. 33, 3423–3440. doi: 10.1016/S0043-1354(99)00063-9
Tian, Y., Jiang, Y., Liu, Q., Dong, M., Xu, D., Liu, Y., et al. (2019). Using a water quality index to assess the water quality of the upper and middle streams of the Luanhe River, northern China. Sci. Total Environ. 667, 142–151. doi: 10.1016/j.scitotenv.2019.02.356
Tietze, K., Geyh, M., Müller, H., Schröder, L., Stahl, W., and Wehner, H. (1980). The genesis of the methane in Lake Kivu (Central Africa). Geol. Rundsch. 69, 452–472. doi: 10.1007/BF02104549
UNEP (2010). Africa water atlas (Vol. 1). Division of Early Warning, Assessment, African Ministers' Council on Water, African Union. Commission, United States. Department of State, and European Union. UNEP/Earthprint
USEPA (1993). Guide to Environmental Issues, Doc. Washington, DC: United States Environmental Protection Agency, No 520/B-94-01
USEPA (1995). Draft Method for the Measurement of Toxic PCB Congeners by Isotope Dilution HRGC/HRMS, October 4, 1995 Draft version. Washington, DC: USEPA.
Varol, M. (2019). Impacts of cage fish farms in a large reservoir and sediment chemistry. Environ. Pollut. 252, 1448–1454. doi: 10.1016/j.envpol.2019.06.090
Verdegem, M. C. J. (2013). Nutrient Discharge from aquaculture operations in function of system design and production enviorment. HJFRT 5, 158–171. doi: 10.1111/raq.12011
Vilimumbalo, S. (1993). Paléoenvironnements et interpretations paléoclimatiques des dépôts palustres du pléistocène supérieur et de l'holocène du rift centrafricain au sud du lac Kivu (Zaïre). Thèse du Doctorat, Analyses palynologiques et sédimentologiques. Faculté des Sciences, ULg 212p.
Walumona, J. R., Odoli, C. O., Raburu, P., Amisi, F. M., Murakaru, M. J., Kondowe, B. N., et al. (2021). Spatio-temporal variations in selected water quality parameters and trophic status of Lake Baringo, Kenya. Lakes Reserv. Res. Manage. 26, 1–16. doi: 10.1111/lre.12367
Wu, R. S. S. (1995). The environmental impact of marine fish culture: towards a sustainable future. Mar. Pollut. Bull. 31, 159–166. doi: 10.1016/0025-326X(95)00100-2
Wüest, A. I., Lukas, J., and Schmid, M. (2009). Modelling the reinjection of deepwater after methane extraction in Lake Kivu. EAWAG and BTC for the Governments of Rwanda and DR Congo 141.
Yan, J., Liu, J., and Ma, M. (2014). In situ variations and relationships of water quality index with periphyton function and diversity metrics in Baiyangdian Lake of China. Ecotoxicology 23, 495–505. doi: 10.1007/s10646-014-1199-5
Yongo, E., Cishahayo, L., Mutethya, E., Alkamoi, B. M., Costa, K., and Bosco, N. J. (2021). A review of the populations of tilapiine species in lakes Victoria and Naivasha, East Africa. Afr. J. Aquat. Sci. 46, 293–303. doi: 10.2989/16085914.2021.1887804
Keywords: fish cage aquaculture, human impacts, organic pollution, physico-chemical, trophic status, water quality
Citation: Lubembe SI, Walumona JR, Hyangya BL, Kondowe BN, Kulimushi J-DM, Shamamba GA, Kulimushi AM, Hounsounou BHR, Mbalassa M, Masese FO and Masilya MP (2024) Environmental impacts of tilapia fish cage aquaculture on water physico-chemical parameters of Lake Kivu, Democratic Republic of the Congo. Front. Water 6:1325967. doi: 10.3389/frwa.2024.1325967
Received: 22 October 2023; Accepted: 06 February 2024;
Published: 29 February 2024.
Edited by:
Wen-Cheng Liu, National United University, TaiwanReviewed by:
Temitope O. Sogbanmu, University of Lagos, NigeriaAugustine Ovie Edegbene, Federal University of Health Sciences Otukpo, Nigeria
Copyright © 2024 Lubembe, Walumona, Hyangya, Kondowe, Kulimushi, Shamamba, Kulimushi, Hounsounou, Mbalassa, Masese and Masilya. This is an open-access article distributed under the terms of the Creative Commons Attribution License (CC BY). The use, distribution or reproduction in other forums is permitted, provided the original author(s) and the copyright owner(s) are credited and that the original publication in this journal is cited, in accordance with accepted academic practice. No use, distribution or reproduction is permitted which does not comply with these terms.
*Correspondence: Sharon Indasi Lubembe, shalubembe97@gmail.com
†ORCID: Sharon Indasi Lubembe orcid.org/0000-0002-1517-8798
Jacques R. Walumona orcid.org/0000-0003-1054-3925
Béni Lwikitcha Hyangya orcid.org/0000-0003-4284-4730
Benjamin N. Kondowe orcid.org/0000-0002-7763-2642
Frank O. Masese orcid.org/0000-0002-5912-5049
Mulungula Pascal Masilya orcid.org/0000-0002-6205-2004