 Vikram Kumar*
 Sumit Sen
- Department of Hydrology, Indian Institute of Technology, Roorkee, India
Accurate measurement of continuous stream discharge poses both excitement and challenges for hydrologists and water resource planners, particularly in mountainous watersheds. This study centers on the development of rating curves utilizing the power law at three headwaters of the lesser Himalayas—Aglar, Paligaad, and Balganga—through the installation of water level recorders for stage measurement and salt dilution for discharge measurement from 2014 to 2016. The stream stage–discharge relationship, crucially known as the rating curve, is susceptible to numerous factors in mountainous watersheds that are often challenging to comprehend or quantify. Despite significant errors introduced during the rating curve development, such as stemming from observations, modeling, and parameterization, they are frequently overlooked. In this study, acknowledging the inherent uncertainty, we employ the maximum-likelihood method to assess uncertainty in the developed rating curve. Our findings reveal substantial inconsistency in the stage–discharge relationship, particularly during high flows. A novel contribution of this study is introducing a weighing factor concept that correlates uncertainty with the morphological parameters of the watershed. The higher value of the weighting factor in Paligaad (0.37) as compared to Balganga (0.35) and less in the case of Aglar (0.27) will have more uncertainty. The authors contend that precise rating curves and comprehensive uncertainty analyses can mitigate construction costs, foster robust decision-making, and enhance the perceived credibility of decisions in hydrology and water resource management.
Introduction
Appropriate quantification of stream discharge is, arguably, essential for designing canals, dams, and other hydraulic structures and effectively managing water resources, which thus affects economic returns. Discharge is a crucial variable and challenging to continuously monitor along many major streams to manage flood and high flow (Kumar and Sen, 2023). Understanding discharge variation during low flow conditions is equally important to state the environmental flow requirement and cope with water quality or pollutant releases (Najafzadeh et al., 2023). Alteration in stream discharge may result from adequate rainfall and aquifer recharge, which may also be affected by the intensity and duration of precipitation, seasonality, and timing of flow (Beavis et al., 2010; Kumar and Shanu, 2017; Kumar and Sen, 2018; Kumar and Paramanik, 2020). In mountains, quantification is rarely done due to sparse field-based measurements in rugged terrain, and instrumentation safety threatens public health, food production, regional water resources policy, and security (Kumar and Sen, 2023). Despite the importance of mountainous catchments in providing freshwater, little is known about understanding discharge variation and hydrological processes (Scanlon et al., 2006; Viviroli et al., 2007; Nanda et al., 2018). Since mountains are also called water towers for human beings and are equally crucial for the ecosystem, it becomes essential to monitor them at the regional and national levels (United Nations, 2011; Kumar and Sen, 2020; Najafzadeh et al., 2021). To develop a scientifically based plan or policy for any stream, it is essential to quantify the discharge dynamics at ungauged streams by setting up a rating curve (RC) and ascertaining the presence of uncertainty in the rating curve (RC). Quantification of discharge and development of rating curve (RC) are gradually growing because of their extensive use in predicting the impact of land use/land cover (LULC), flood forecasting, climate change studies, operation of the dam, and other hydraulic structures and finding out the discharge of adjacent or similar ungauged watersheds.
To create a rating curve (RC) for an ungauged stream, it is necessary to establish an empirical relationship between the discharge of the stream (Q) and the corresponding gauge height (H). Appropriate site selection for gauging and discharge measurement is an essential predictor for developing and maintaining rating curves (RCs). The straightforward exercise is to monitor multiple paired measurements of stream discharge and gauge height (Q, H) to develop a relationship and estimate the parameters. While establishing the rating curve (RC) parameters, the fundamental hypothesis of best fitting of the curve is that stream discharge and gauge height (Q, H) are mutually independent and have the same probability distribution. Most of the time, this hypothesis is invariably false while developing a rating curve (RC). Access to gauging location can often impact the frequency, timing, and accuracy of (Q, H) measurements (Najafzadeh and Anvari, 2023). In addition to the location of gauging, sometimes during the monsoon season (July–September), there is intense rainfall or long rainfall spells which restrict access to field sites and discharge of measurements. Currently, a rating curve (RC) is being developed based on stream profile without measuring stream discharge and gauge height (Q, H) (Szilagyi et al., 2005; Perumal et al., 2007, 2010; Christopher et al., 2010), using additional parameters other than the stage (H) (Sahoo and Ray, 2006), based on the capabilities of remote sensing (Birkhead and James, 1998) and uncertainty present in rating curves (Clarke, 1999; Jalbert et al., 2011). According to United States Geological Survey (USGS) guidelines, the difference between measured and predicted discharges should be < 10% to accept the estimated discharge at the site. When an error in modeled discharge is < 30% of the observed discharge, the generic rating curve (GRC) could be used (Kevin, 2012). The main objective for developing the GRC is to generate a rating curve (RC) with some minor adjustments in the parameters to reduce the stream discharge and gauge height (Q, H) measurement.
Understanding the dynamic stream system in mountains poses numerous challenges and causes many problems while measuring the stream discharge and gauge height (Q, H). Thus, it becomes very challenging to measure the stage and stochastic nature of discharge preciously. Therefore, stream discharge (Q) not only depends on the stage (H) but also depends on the profile (geometry and slope) and roughness of the stream with morphometry of the watershed. The relationship between stream discharge and gauge height (Q, H) for a stream cross section is not always the same because stream discharge is often influenced by many parameters that are not easy to measure (Sefe, 1996). Hence, power law Q = a(h + ho)c to develop a rating curve for a particular cross section is not exact but an approximation (Henderson, 1966). The rating curve (RC) changes shape from a parabolic to a different form, influencing the parameters over the specific limit (Guven and Aytek, 2009), which are difficult to find and sometimes impossible to obtain the correct values. Imprecise or inaccurate estimation of rating curve (RC) parameters leads to overestimation or underestimation of a design flood with higher failure risks and costs. If the presence of error or uncertainty in the rating curve (RC) is quantified well, it could enhance the discharge assessment and ensure positive decision-making. Quantifying the uncertainty in the rating curve (RC) as a standard protocol can indirectly protect money and increase decision-making credibility. Representative confidence bound for uncertainty measurement relies on gauge location and stream profile (Westerberg et al., 2011).
Broadly, uncertainty in the rating curve (RC) can be classified as follows:
i) Observational uncertainty is associated with the primary observation used (e.g., stage and discharge) for developing rating curves, which usually involves errors due to both as well as instrumental errors.
ii) Model uncertainty is linked with the formulation of power law for rating curve development with approximations involved in mathematical equations.
iii) Parameter uncertainty is caused by failure to decide input parameters involved in model development due to insufficient data.
To analyze the above-described uncertainty in stream discharge measurement, Domeneghetti et al. (2012) proposed an outline and showed uncertainty effects on the calibration of the model. Pappenberger et al. (2006) developed a decision tree model to represent different uncertainty causes. According to Montanari (2007), other uncertainty methods can be categorized into (a) analytical methods (Tung, 1996), (b) approximation methods (Melching, 1992), (c) methods based on the analysis of model errors (Montanari and Brath, 2004), (d) Monte Carlo methods (Kuczera and Parent, 1998), (e) Bayesian methods (Beven and Binley, 1992), and (f) methods based on fuzzy set concept (Maskey et al., 2004).
The stage measurement, recorded using a water level recorder placed in a stilling well, usually causes fewer errors than stream discharge, which involves calculating clearance by measuring the velocity of the whole stream cross section (Pelletier, 1988; Clarke, 1999). Inadequate temporal measurement of stream stage (H) for an average daily discharge poses additional doubt and error (Petersen-Overleir et al., 2009). During peak stream discharge, it is hard to monitor flashy and uncontrolled turbulent flows, which are often challenging to accurately measure and are also the source of uncertainty (Leonard et al., 2000; Shrestha et al., 2007). Among the traditional methods for discharge measurement, evaluating stream discharge by the salt dilution method proves better, especially in mountainous or remote areas where it is not easy to find a suitable hydrologic profile (Radulovic et al., 2008). Additionally, the stream discharge (Q) measurements using salt dilution can be accurate at ~±5 % (Day, 1976). The objective of this study was threefold: (1) to develop a rating curve for three different headwater streams (Aglar, Paligaad, and Balganga) in the lesser Himalayas. The developed stage–discharge relationship can later be used for computing stream discharge by monitoring the stage alone (2) to estimate the uncertainty involved in the developed stage–discharge relationship. Uncertainty measurement was applied using the evaluation of codes that state the uncertainty of each gauging at 95% confidence intervals and (3) to develop a concept of weighing factor to correlate the uncertainty with the morphometry of watershed, which governs the flow behavior with the sensitive parameter. The detailed rating curve and uncertainty analysis of mountains, especially in the Himalayas, which are considered water towers, play a crucial role in better quantifying water availability for agriculture, optimal planning, and managing water resources. The authors believe that the above analysis delivers a suitable method for hydrology and water resource practitioners to evaluate the rating curve and stream discharge uncertainty.
Methodology and data
The three headwaters in the lesser Himalayas, viz., Aglar, Paligaad, and Balganga, have been instrumented since April 2014 to collect continuous rainfall and stage measurements. Stream discharge is also measured from time to time to develop a rating curve (RC). Basic statistical characteristics, such as minimum and maximum, for these three sites are represented in Table 1. A detailed description of the study methodology is described subsequently below.
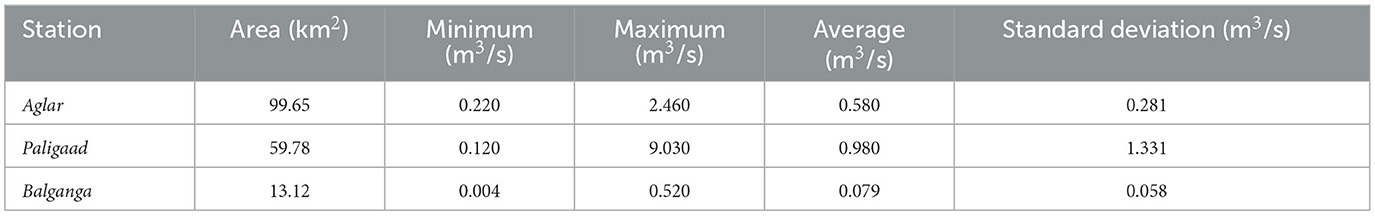
Table 1. Statistical characteristics of daily discharge for the study area.
Measurement of stage and discharge
Stage measurements of the streams have been monitored with an automatic water level sensor (AWLS) placed in a stilling well made up of perforated pipes (Figure 1). The AWLS is a capacitance-based water level recorder with a data logger (Odyssey, Ltd). It has been recording the water depth in a stream from the stream bed at a 15-min interval since April 2014 at Aglar and Paligaad and since June 2014 at Balganga.
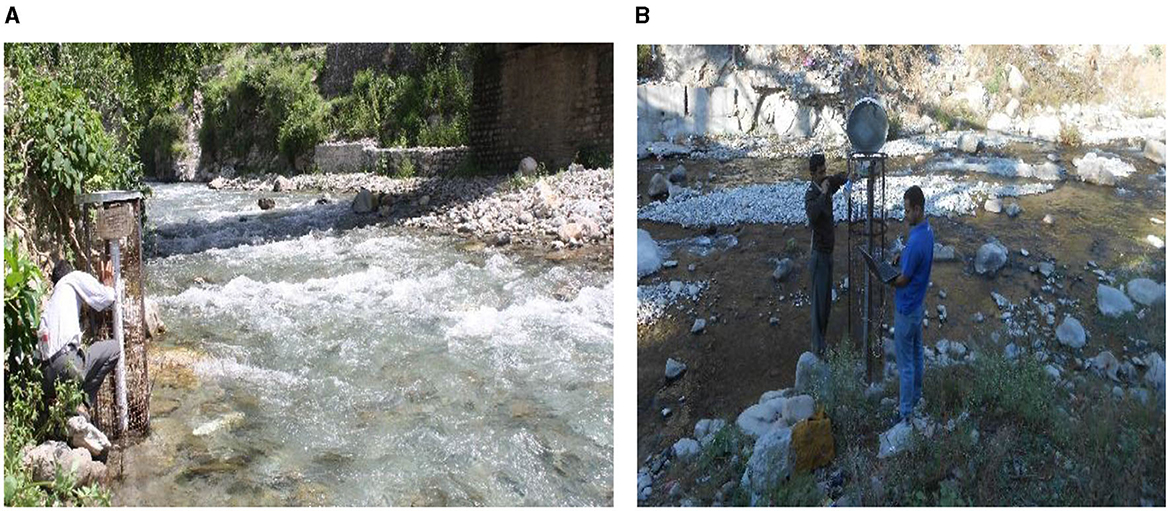
Figure 1. (A) Medium flow condition and AWLS in a PVC pipe. (B) Data downloading from the Odyssey data logger.
The recorded stream depth from the sensors was downloaded every once or twice a month to avoid data loss. Recorded data are verified with visual measurements on the data's downloading. With the increase in stream discharge, the surplus water in the stream leads the stream to expand laterally and the stream's depth to increase. Discharge in all the streams is being measured by salt dilution, which is a well-known method for mountainous catchment and where current metering may be inaccurate. In this method, a known amount of sodium chloride solution (NaCl) is injected into the stream, concurrently measuring the electrical conductivity (EC) at regular intervals downstream. Using the concept of mass conservation, the discharge Q (m3/S) from the stream is estimated using Equation (1):
where Ms is the weight of sodium chloride injected in kg, T is the time of passage of the salt slug in seconds, and Co and Ct are the concentration of sodium chloride at time zero and time t in kg/m3, respectively. NaCl was chosen as a tracer because of its low cost, non-toxic nature, and ready availability at the site, and because it can be precisely measured by an EC meter. In the mountainous region, discharge measurement using slug injection can be precise within ~± 5%. The use of salt dilution technique for discharge measurement is restricted up to 15 m3/s due to environmental considerations (Church, 1973).
Rating curve development
To address the issues of cost, time constraints, and the impracticality of continuous stream discharge monitoring during high flows, an alternative approach involving continuously observing the stage, which is relatively easier to monitor, has been suggested. Subsequently, the stage data can be converted to stream discharge using the stage–discharge power equation, commonly referred to as the rating curve. The observed value of the stream stages and corresponding discharges were plotted on arithmetic and logarithmic graphs. The plotted graph represents the combined consequence of a wide range of depth and discharge parameters. If the stage–discharge relationship for a gauging section does not change with time, the control is said to be “permanent.” If it changes with respect to time, it is called “shifting control.” The ideal control channel situation is when the energy gradient line is parallel to the water surface gradient and to the bed gradient line. Hydraulics formulas for the control section and channel can be represented as a power law (ISO 1100, 2010; World Meteorological Organization, 2010), and the power law parameters are assumed to be constant (Subramanya, 2006),
where Q is the discharge of the stream, h is the water depth in the stream, usually says stage, “a” is a power law coefficient that relates to the features of the controlling section or channel, ho is an offset, and “c” is an exponent related to the type of hydraulic control (Le Coz et al., 2014).
The best-fit curve, which governs the value of a, ho, and c in Equation (2) for a given depth range, can be obtained using the least square error method. For this, considering the logarithmic scale, Equation (2) becomes
A linear trend line equation between “log Q” (Y-axis) and “log (h – ho)” (X-axis) was well fitted in MATLAB, the slope of this line gives “b,” and Y-intercept gives “log a” (and thereby “a”). Thus, the stage–discharge relationship is developed in Equation (3). This developed relationship for all three gauging locations is considered an epitome of all the channel characteristics. Occasionally, the stage–discharge curve is in a parabolic shape, which changes to a composite curve and vice versa, and the parameters vary through the limit (Guven and Aytek, 2009). Thus, it is not simple to estimate the rating curve parameters (a, ho, and c) for all cases, and it is occasionally challenging to obtain the actual values. Generally, at least 15 sets of stage-discharge are needed to develop a rating curve, including low to high flows.
Assessment of uncertainty in rating curves
Estimating uncertainty in the rating curve (RC) initiated from false measurement or the method described in the earlier section built from less stage–discharge pair measurements is significant to understand. On considering that an error (ε) in power law, Equation (2) can be written as
The basic assumption in Equation (4) is that ε is generally distributed with zero mean value and constant variance (σ2). No correlated errors are assumed (cov[εi, εj] =0) for different samples of stage discharge. On log transformation, Equation (4) becomes Equation (5)
On minimizing the ε term (Equation 6), which is our objective,
The following equations can be used for assessing power model rating curve relationship uncertainty in estimated discharges for a specific level (H = b), calculating variance (Equations 7–10)
To get the value of var(θ*), first, the (I) has to be solved, which is the Fischer information matrix, translated by Venetis (1970), using Equations (11) and (12)
Then, the value of variance, Equation (13) is estimated using the standard error of regression (se) relation
The process of analyzing uncertainty in the rating curve holds considerable importance in investigations involving risks and the overall consistency of water and hydrology-related projects. By taking uncertainty into consideration, it provides valuable support to hydraulic design modelers. These professionals can then use this information to plan and design operational models, helping them anticipate and forecast potential deficiencies in the future. In essence, considering uncertainty enhances the reliability and effectiveness of hydraulic design and risk management in water-related projects.
Result and discussion
Rating curve development
The link between stream water level (stage) and stream discharge (Q, H) is influenced by the character of the stream channel and its bank. With the increase in stream discharge, the excess water causes the stream to expand, leading to the rise in stream depth and the widening of stream banks. Multiple data points of stage and discharge (Q, H) were highly correlated after the quality control was used to obtain a rating curve (RC). The river stage and corresponding discharge value of all these gauging stations were measured from September 2014 to December 2015. A non-linear curve fitting algorithm in MATLAB using the function “nlinfit” and the power equation shown in Equation (3) has been used to develop the rating curve (RC).
The developed stage–discharge relationship with the coefficient of determination is shown in Figure 2, and the rating curve power law coefficients are shown in Table 2. In our understanding, developed (Q, H) can be considered the best approximation of stage and discharge data series for the best fit of the curve. The shape of the (Q, H) curve is inhibited by analyzing constraints based on field collected data. Extrapolation of the curve other than the calibrated range should be realistic and sustained by accompanying evidence.
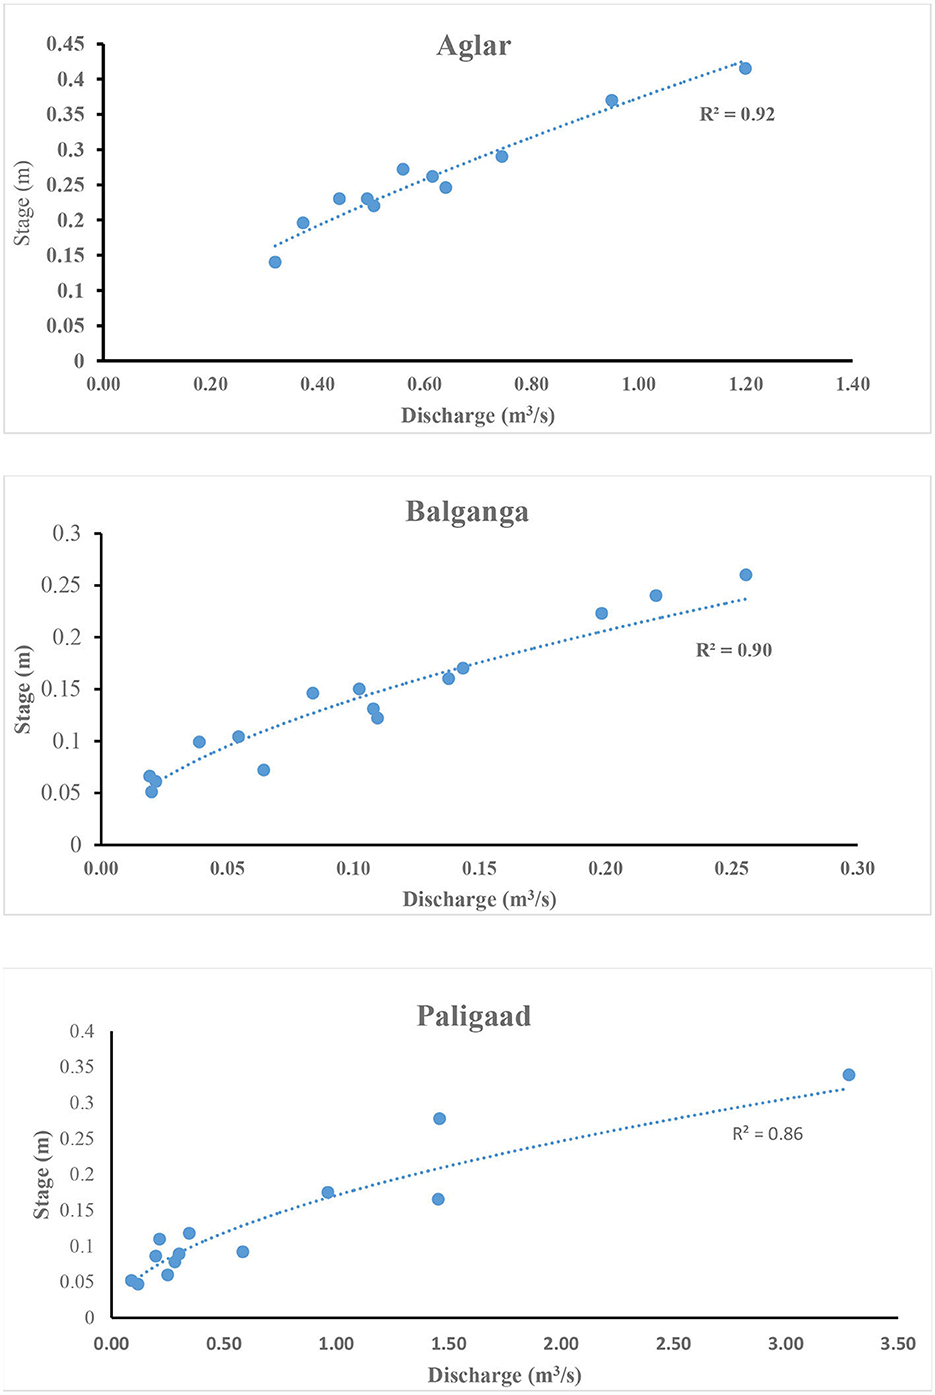
Figure 2. Stage–discharge relationship for different ungauged streams of the Aglar watershed.
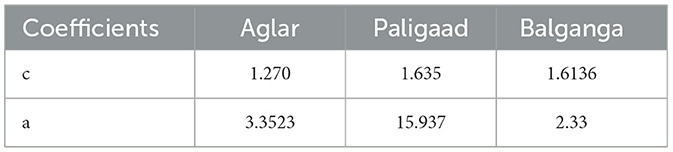
Table 2. Rating curve coefficients of the Aglar sub-watersheds.
From the monitored (Q, H) data for three streams, the non-linear relationships between stage and discharge were similar for Aglar and Paligaad, which have relatively lower relief ratio (0.002 and 0.004) as compared to Balganga, which has relief ratio (0.007), and the rating curve (RC) parameters are different for the three gauging stations. For unconfined bedrock streams (Aglar and Paligaad), the coefficients of determination (R2) are 0.92 and 0.86, whereas the Balganga is confined between the control section with R2 = 0.90. Understanding the channel geometry that governs the (Q, H) relationship is fundamental in developing stage–discharge relationships. The rating curve for the Balganga, where the flow is low compared to Aglar and Paligaad, is usually influenced by section control. High flow in the Paligaad is influenced by channel control, whereas the combination of section and channel control influences Aglar. As the depth of water increases in Paligaad, the control section gets submerged because of these higher flows and no longer controls the relationship between the stage and discharge (Q, H). The flow in streams is then controlled either by an additional downstream control section or by the channel profile and Manning's roughness (i.e., channel control). In addition, the channel's control dimension will differ, subject to the stream discharge. Usually, the coefficients of power law “a” and “c” are explicit to some stream channel characteristics, which can be correlated with the physical features of the river. “a” is a scaling factor that embraces the river width and the Manning coefficient. As it can be inferred from Table 2, the value of “a” is higher for Paligaad (15.93), followed by Aglar (3.35) and Balganga (0.0014). “c” embraces the stream geometry and displays the type of control in the relationship between the stage and discharge (Q, H). A higher value of “c” (1.63) in the case of Balganga indicates a section control, and a lower value of “c” (1.2) in the case of Aglar indicates channel control.
Furthermore, the point of zero flow (H0) is challenging to determine in deep rivers and mountainous watersheds where rocky profiles exist. The observed discharge was not fixed for all gauging sites for a specific stage and showed differing discharge trends. There is variability in the rating parameters at different stages and stations. The presence of seasonal components at all gauging sites has been observed; it is primarily noticeable at the Aglar and Paligaad gauging sites. The discharge from the stream for a particular water height may change by more than one factor. To validate the computed stream discharge by the salt dilution method at Aglar, Balganga, and Paligaad, the cross-sectional details at these gauging stations were plotted, and the stream velocities were precisely measured by a current meter to obtain the discharge values (Figure 3). Riverbed configurations of all these rivers have different flow resistances; therefore, all these have other (Q, H) associations. The resistance to flow commonly increases with an increase in discharge, with noticeable discontinuities in the course of transitions between channel profiles.
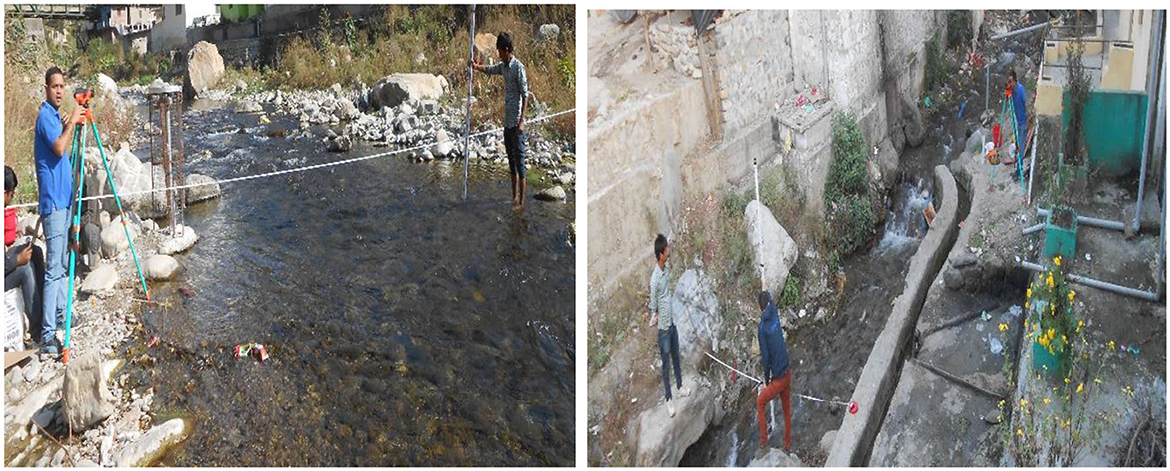
Figure 3. Cross-sectional plotting and discharge measurement using the current meter.
This well-developed relationship between the stage and discharge (Q, H) and its effectiveness with respect to changes in the river behavior must be an issue for future investigation. With limited observation, it is challenging to identify a particular cause for the variability in future. The interchange of scour and fill sequences in the riverbed, with deposition throughout the non-rainy season and rate of erosion and subsequent deposition during the rainy season, has the ability to alter the river channel's conveyance and, consequently, its hydraulic properties. On the other hand, vegetation changes could also play an essential role by yielding a modified friction slope as it might mature on the side of the river throughout the non-rainy season. In the case of steep-slope mountainous rivers, the effect of backwater can be much less, and one can ignore this. In this study, an attempt has not been made to elucidate the different processes or grouping techniques that contribute to the inconsistency in the stage and discharge relationship (Q, H). Instead, a relationship has been developed that was not available. Continuous monitoring of the gauging stations will reveal the variability in (Q, H) in the future.
Uncertainty analysis
The stream discharge evaluations from the developed rating curve (RC) in the present study were subjected to some uncertainties because of any of the sources of errors mentioned in the introduction. The inconsistency in these rating curves (RC) was more pronounced than what present estimation methods permit for. It is generally advised to adjust the parameters of the rating curve (RC) if the resulting developed rating curve (RC) shows a change of more than 5% compared to the observed discharge.
For systematically designed section controls, the actual gauge height of zero flow (Q = 0) will be nearly the same as the exact gauge height of zero discharge (Q = 0). Even though caution has been taken for data recording as described in the methodology, recorded data contain sets with few outliers. A depth of stream that deviates by more than 2 cm is considered an outlier and hence not used in this analysis. The daily fluctuations in the recorded stage variation exhibited that the maximum depth in stream flow commonly occurred between midnight and morning (10:00 AM) in the wet period. In contrast, the pattern is different in the dry period, with less depth between late night and morning (10:00 AM) compared to the wet period. This diurnal discrepancy in stage (depth) recording highlighted the prerequisite for considering the uncertainty in discharge measurement at different times with only a few stage measures during the day.
In the absence of any past uncertainty data of discharge in the mountainous watershed or any evidence about the sources of uncertainty in the rating curve (RC) in the Aglar watershed, the uncertainty in discharge measurement was estimated to be 11.9% in Aglar, 28% in Balganga, and 43% in Paligaad (Figure 4). Paligaad stream is flashy compared to Balganga and Aglar, so the promising discharge measurement consists of only a few measurements, and the error is as much as 43%. Our outcome from the uncertainty analysis is that uncertainty in the stage–discharge relationship will be greater where fewer data (pairs of Q and H) are observed for rating curve generation during the high flows. Additionally, in the case of the Paligaad, the 95% uncertainty prediction interval (bound) is much more comprehensive for larger stage measurement values than Aglar and Balganga (Figure 4) due to less observation during high and flashy stream flow.
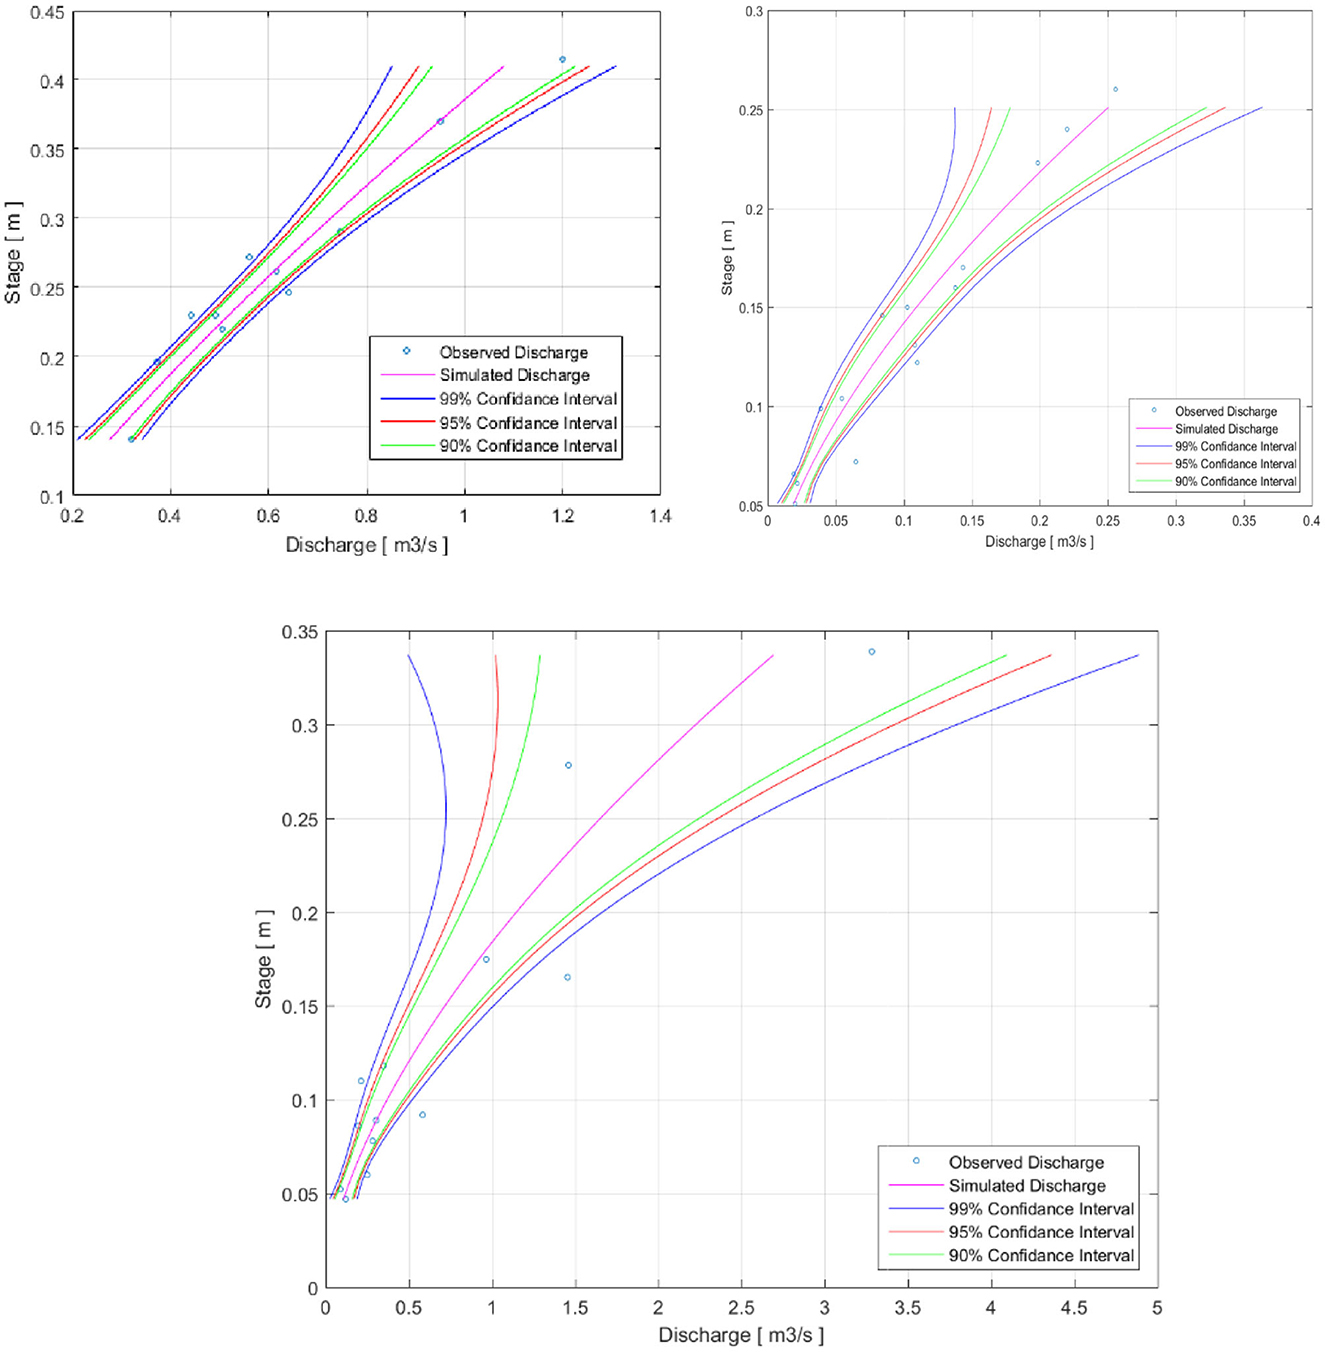
Figure 4. Uncertainty in different confidence intervals for Aglar sub-watersheds.
The magnitude of the errors in the rating curve is measured by a pair of (Q, H) that is bound between the uncertainties. For the determination of the confidence intervals band of uncertainty, it is presumed that the residuals around the developed relationship have a normal distribution with fixed variance value; Figure 4 represents the overall uncertainty in different confidence intervals. The error arising from a lack of sufficient stage–discharge measurements, resulting in the inability to accurately differentiate between high and low discharge levels, can have significant implications. This study sheds light on the effectiveness of measures in various streams, each characterized by its unique parameters, in discerning how high or low flow measurements can impact our comprehension of water availability. Such limitations in measurement precision could potentially lead to misconceptions about critical hydrological processes that are crucial for converting
The geomorphology of the watershed has a significant role in the transformation of rainfall to stream discharge and associated processes. For example, the reaction from a poor drainage network with good vegetation cover will be slower than that of a well-developed drainage network with less vegetation cover. From the geomorphology point of view, the average width/depth ratio for all the monitoring stations is < 12; therefore, according to cross-sectional and plan view, these streams are either of A, E, and G categories as per Rosgen (1996) Classification. “A” types of river are initiated within the valley. Due to intrinsic channel gradient, this type of river has a great sediment transport potential and relatively less sediment storage capability. Although “A” type streams follow low-order streams, which can range from first order to fifth order or larger, located at the upper catchment, the “E” stream type characterizes the developmental “end-point” of stream channel stability for specific alluvial streams undergoing a natural dynamic order of system evolution. This stream type exhibits very low channel width/depth ratios and very high channel sinuosity, resulting in a significant meander width ratio. The other type “G” is entrenched with a low-to-moderate channel sinuosity. Channel gradients are generally steeper than 0.02, with very high bank erosion rates and sediment delivery ratios. In conclusion, Aglar shows low sensitivity to disturbance, excellent recovery potential, low sediment delivery, less erosion possibility, and reasonable influence of vegetation. In contrast, Paligaad is highly sensitive to disruption and has good recovery potential, moderate stream bank potential, and very high leverage of vegetation.
A weighting factor is developed in the present study to understand the influence of catchment geomorphology on uncertainty. The geomorphological parameters considered are area of watershed (A), drainage density (D), relief ratio (R), form factor (F), and elongation ratio (E), and its corresponding values for each watershed are summarized in Table 3. The weighting factors for the calculation are given in Equations (14) and (15)
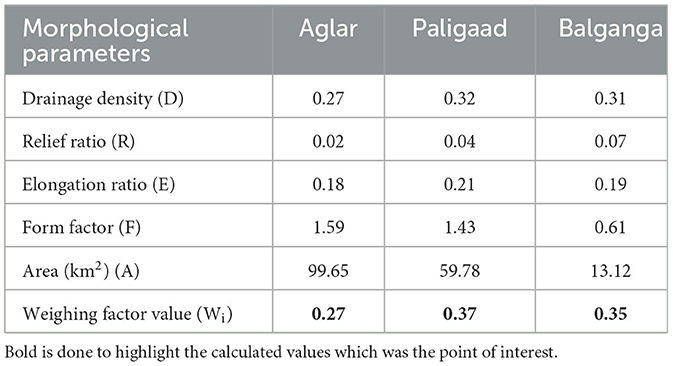
Table 3. Morphological parameters of the Aglar sub-watershed.
where I is the number of sub-catchments (3 in the present case).
The higher the value of Wi, the more the uncertainty will be; thus, there is a chance of more error in Paligaad (0.37) as compared to Balganga (0.35) and less in the case of Aglar (0.27). The confirmation presented by developing the weighing factor in this study supports the degree of uncertainty in the estimation of stage–discharge data. It could be further reduced by investments in hydrometric field instrumentations, particularly by generating more and more data and developing new methods based on data, technologies, and techniques for high flow measurements and winter stream flow monitoring. The above findings also meant that the monitored number of stage–discharge measures for rating curve generation should be more than 25 to compensate for the large uncertainty requirements.
This study mainly aimed at estimating uncertainty propagated into instant discharge values obtained from rating curves built from low-density discharge measurements. Further research envisages revising the rating curve with discharge measurement during high flows and reducing the uncertainty propagation in daily and monthly discharge values. The improved rating curve with less error will result in better hydrological modeling and calculations, such as water scarcity indexes or flood designs used for hydraulic structure dimensioning.
Conclusion
Assessing the relationship between stage and discharge data and errors in the developed relationship should be considered a significant step in quantifying water resources in any watershed. As the vital parameter, i.e., discharge in the Aglar watershed or lesser Himalayan rivers, is derived from the stage–discharge relationships only (rating curves), this hydrometric data collection (stage and discharge) is one of the most reliable, consistent, and attractive for unraveling and understanding the hydrological process and quantifying water availability.
Thus, the present study focuses on rating curve development using power law at three headwaters of lesser Himalayas (Aglar, Paligaad, and Balganga) by means of installing a water level recorder for stage measurement and salt dilution for discharge measurement between 2014 and 2016.
• In the presence of uncertainty as inherent, an attempt has also been made to ascertain uncertainty in developed rating curves using the maximum-likelihood method.
• Analysis of the monitored (Q, H) data for three streams, the non-linear relationships between stage and discharge were similar for Aglar and Paligaad, which have relatively lower relief ratios (0.002 and 0.004) as compared to Balganga, which has a relief ratio (0.007), and the rating curve (RC) parameters are different for the three gauging stations.
• For unconfined bedrock streams (Aglar and Paligaad), the coefficients of determination (R2) are 0.92 and 0.86, whereas the Balganga is confined between the control section with R2 = 0.90. A comparatively higher value of the power law coefficient “c” (1.63) in the case of Balganga indicates a section control, and a lower value of “c” (1.2) in the case of Aglar indicates channel control.
• The diurnal fluctuations in the recorded stage variation exhibited uncertainty in the rating curve, which highlights the uncertainty analysis in the rating curve. Furthermore, a weighting factor is developed to understand the influence of catchment geomorphology on uncertainty. The higher value of the weighting factor will be the uncertainty; thus, there are chances of more error in Paligaad (0.37) as compared to Balganga (0.35) and less in the case of Aglar (0.27).
• The extent of uncertainty due to high flow remains indeterminate because no field data were collected due to the flashy nature of the flow.
The above rating curve development and uncertainty analysis are expected to inspire the design of forthcoming research required to overcome this scarcity of data at high flows. This preliminary study would become the benchmark for further research and help policy creators and watershed administrators to improve planning and management related to water in rural parts of the lesser Himalayas or other mountainous catchments.
Data availability statement
The raw data supporting the conclusions of this article will be made available by the authors, without undue reservation.
Ethics statement
Written informed consent was obtained from the individual(s) for the publication of any identifiable images or data included in this article.
Author contributions
VK: Writing—original draft. SS: Conceptualization, Project administration, Supervision, Validation, Writing—review & editing.
Funding
The author(s) declare financial support was received for the research, authorship, and/or publication of this article. The authors would like to acknowledge the Indian Institute of Technology, Roorkee, for funding under grant # F.I.G-100582 and the Department of Science and Technology under grant # SER-776 toward field visits and instrumentation.
Acknowledgments
The authors thank Mr. Sumer Panwar, Aliva Nanda, and Vijay Jirwan for their field support.
Conflict of interest
The authors declare that the research was conducted in the absence of any commercial or financial relationships that could be construed as a potential conflict of interest.
Publisher's note
All claims expressed in this article are solely those of the authors and do not necessarily represent those of their affiliated organizations, or those of the publisher, the editors and the reviewers. Any product that may be evaluated in this article, or claim that may be made by its manufacturer, is not guaranteed or endorsed by the publisher.
References
Beavis, S. G., Roberts, J., and Ellis, D. J. (2010). Water-dependent ecosystems: the ecological consequences of irrigation infrastructure refurbishment. Waterlines Report Series No 33.
Beven, K., and Binley, A. (1992). The future of distributed models: model calibration and uncertainty prediction. Hydrol. Proces. 6, 279–298. doi: 10.1002/hyp.3360060305
Birkhead, A. L., and James, C. S. (1998). Synthesis of rating curves from local stage and remote discharge monitoring using non-linear muskingum routing. J. Hydrol. 205, 52–65. doi: 10.1016/S0022-1694(97)00131-5
Christopher, F. S., Jeffrey, T. C., and Stephen, M. W. (2010). The Continuous Slope-Area Method for Computing Event Hydrographs, Scientific Investigations Report, U. S. Geological Survey. Available online at: https://pubs.usgs.gov/sir/2010/5241/sir2010-5241
Church, M. (1973). Some tracer techniques for streamflow measurements. Tech. Bull. Br. Geornorphol. Res. Group. 12, 72.
Clarke, R. T. (1999). Uncertainty in the estimation of mean annual flood due to rating-curve in definition. J. Hydrol. 222, 185–190. doi: 10.1016/S0022-1694(99)00097-9
Day, T. J. (1976). On the precision of salt dilution gauging. J. Hydrol. 31, 293–306. doi: 10.1016/0022-1694(76)90130-X
Domeneghetti, A., Castellarin, A., and Brath, A. (2012). Assessing rating-curve uncertainty and its effects on hydraulic model calibration. Hydrol. Earth Syst. Sci. 16, 1191–1202. doi: 10.5194/hess-16-1191-2012
Guven, A., and Aytek, A. (2009). New approach for stage-discharge relationship: gene-expression programming. J. Hydrol. Eng. 14, 812–820. doi: 10.1061/(ASCE)HE.1943-5584.0000044
ISO 1100 (2010). Hydrometry - Measurement of Liquid Flow in Open Channels Part 2: Determination of the Stage-Discharge Relationship. Geneva: ISO, 20.
Jalbert, J., Mathevet, T., and Favre, A. C. (2011). Temporal uncertainty estimation of discharges from rating curves using a variographic analysis. J. Hydrol. 397, 83. doi: 10.1016/j.jhydrol.2010.11.031
Kevin, S. (2012). “Developing rating curves for bedrock step-pool rivers using sparse data,” in Proceedings of The National Conference On Undergraduate Research (NCUR) 2012. Ogden Utah: Weber State University.
Kuczera, G., and Parent, E. (1998). Monte Carlo assessment of parameter uncertainty in conceptual catchment models: the Metropolis algorithm. J. Hydrol. 211, 69–68. doi: 10.1016/S0022-1694(98)00198-X
Kumar, V., and Paramanik, S. (2020). Application of high-frequency spring discharge data: a case study of Mathamali spring rejuvenation in the Garhwal Himalaya. Water Supply 20, 3380–3392. doi: 10.2166/ws.2020.223
Kumar, V., and Sen, S. (2018). Evaluation of spring discharge dynamics using recession curve analysis: a case study in data-scarce region, Lesser Himalayas, India. Sust. Water Resour. Manage. 4, 539–557. doi: 10.1007/s40899-017-0138-z
Kumar, V., and Sen, S. (2020). Assessment of spring potential for sustainable agriculture: a case study in lesser Himalayas. Appl. Eng. Agric. 36, 11–24. doi: 10.13031/aea.13520
Kumar, V., and Sen, S. (2023). Hydrometeorological field instrumentation in Lesser Himalaya to advance research for future water and food security. Environ. Monitor. Assess. 195, 1162. doi: 10.1007/s10661-023-11625-8
Kumar, V., and Shanu, Jahangeer. (2017). Statistical distribution of rainfall in Uttarakhand, India. Appl. Water Sci. 7, 4765–4776. doi: 10.1007/s13201-017-0586-5
Le Coz, J., Renard, B., Bonnifait, L., Branger, F., and Boursicaud, R. (2014). Combining hydraulic knowledge and uncertain gaugings in the estimation of hydrometric rating curves: a Bayesian approach. J. Hydrol. 509, 573–587. doi: 10.1016/j.jhydrol.2013.11.016
Leonard, J., Mietton, M., Najib, H., and Gourbesville, P. (2000). Rating curve modelling with Manning's equation to manage instability and improve extrapolation. Hydrol. Sci. J. 45, 739–750. doi: 10.1080/02626660009492374
Maskey, S., Guinot, V., and Price, R. K. (2004). Treatment of precipitation uncertainty in rainfall runoff modelling: a fuzzy set approach. Adv. Water Resour. 27, 889–898. doi: 10.1016/j.advwatres.2004.07.001
Melching, C. S. (1992). An improved first-order reliability approach for assessing uncertainties in hydrological modelling. J. Hydrol. 132, 157–177. doi: 10.1016/0022-1694(92)90177-W
Montanari, A. (2007). What do we mean by ‘uncertainty'? The need for a consistent wording about uncertainty assessment in hydrology. Hydrol. Process. 21, 841–845. doi: 10.1002/hyp.6623
Montanari, A., and Brath, A. (2004). A stochastic approach for assessing the uncertainty of rainfall-runoff simulations. Water Resour. Res. 40, W01106. doi: 10.1029/2003WR002540
Najafzadeh, M., Ahmadi-Rad, E. S., and Gebler, D. (2023). Ecological states of watercourses regarding water quality parameters and hydromorphological parameters: deriving empirical equations by machine learning models. Stochastic Environ. Res. Risk Assess. 8, 1–24. doi: 10.1007/s00477-023-02593-z
Najafzadeh, M., and Anvari, S. (2023). Long-lead streamflow forecasting using computational intelligence methods while considering uncertainty issue. Environ. Sci. Pollut. Res. 30, 84474–84490. doi: 10.1007/s11356-023-28236-y
Najafzadeh, M., Noori, R., Afroozi, D., Ghiasi, B., Hosseini-Moghari, S. M., Mirchi, A., et al. (2021). A comprehensive uncertainty analysis of model-estimated longitudinal and lateral dispersion coefficients in open channels. J. Hydrol. 603, 126850. doi: 10.1016/j.jhydrol.2021.126850
Nanda, A., Sen, S., Jirwan, V., Sharma, A., and Kumar, V. (2018). Understanding plot-scale hydrology of lesser himalayan watershed—a field study and HYDRUS-2D modelling approach. Hydrol. Proc. 32, 1254–1266. doi: 10.1002/hyp.11499
Pappenberger, F., Matgen, P., Beven, K. J., Henry, J. B., Pfister, L., Fraipont, P., et al. (2006). Influence of uncertain boundary conditions and model structure on flood inundation predictions. Adv. Water Resour. 29, 1430–1449. doi: 10.1016/j.advwatres.2005.11.012
Pelletier, P. (1988). Uncertainties in the single determination of river discharge: a literature review. Can. J. Civil Eng. 15, 834–850. doi: 10.1139/l88-109
Perumal, M., Moramarco, T., Sahoo, B., and Barbetta, S. (2007). A methodology for discharge estimation and rating curve development at ungauged river sites. Water Resour. Res. 43. doi: 10.1029/2005WR004609
Perumal, M., Moramarco, T., Sahoo, B., and Barbetta, S. (2010). On the practical applicability of the VPMS routing method for rating curve development at ungauged river sites. Water Resour. Res. 46. doi: 10.1029/2009WR008103
Petersen-Overleir, A., Soot, A., and Reitan, T. (2009). Bayesian rating curve inference as a streamflow data quality assessment tool. Water Resour. Manage. 23, 1835–1842. doi: 10.1007/s11269-008-9354-5
Radulovic, M., Radojevic, D., Devic, D., and Blecic, M. (2008). Discharge Calculation of the Spring Using Salt Dilution Method – Application Site Bolje Sestre Spring (Montenegro). Available online at: http://balwois.com/balwois/administration/full_paper/ffp-1257.pdf (accessed July 24, 2013).
Rosgen, D. L. (1996). A classification of natural rivers: reply to the comments by JR Miller and JB Ritter. Catena 27, 301–307. doi: 10.1016/0341-8162(96)00018-5
Sahoo, G. B., and Ray, C. (2006). Flow forecasting for a Hawaii stream using rating curves and neural networks. J. Hydrol. 317, 63–80. doi: 10.1016/j.jhydrol.2005.05.008
Scanlon, B. R., Keese, K. E., Flint, A. L., Flint, L. E., Gaye, C. B., Edmunds, W. M., et al. (2006). Global synthesis of groundwater recharge in semiarid and arid regions. Hydrol. Proc. 20, 3335–3370. doi: 10.1002/hyp.6335
Sefe, F. T. K. (1996). A study of the stage-discharge relationship of the Okavango River at Mohembo, Botswana. Hydrol. Sci. J. 41, 97–116. doi: 10.1080/02626669609491481
Shrestha, R. R., Bardossy, A., and Nestmann, F. (2007). Analysis and propagation of uncertainties due to the stage-discharge relationship: a fuzzy set approach. Hydrol. Sci. J. 52, 595–610 doi: 10.1623/hysj.52.4.595
Szilagyi, J., Balint, G., Gauzer, B., and Bartha, P. (2005). Flow routing with unknown rating curves using a state-space reservoir-cascade-type formulation. J. Hydrol. 311, 219. doi: 10.1016/j.jhydrol.2005.01.017
Tung, Y. K. (1996). “Uncertainty and reliability analysis,” in Water Resources Handbook, ed L. W. Mays (New York, NY: McGraw-Hill), 7.1–7.65.
United Nations (2011). Challenges and Opportunities for Water in the Transition to a Green Economy International UN-water Conference Water in the Green Economy in Practice: Towards Rio 20, 3–5. Available online at: https://www.un.org/waterforlifedecade/green_economy_2011/
Venetis, C. (1970). A note on the estimation of the parameters in logarithmic stage-discharge relationships with estimates of their error. Int. Assoc. Sci. Hydrol.. Bulletin 15, 105. doi: 10.1080/02626667009493957
Viviroli, D., Durr, H. H., Messerli, B., Meybeck, M., and Weingartner, R. (2007). Mountains of the world, water towers for humanity: typology, mapping, and global significance. Water Resour. Res. 43, 5653. doi: 10.1029/2006WR005653
Westerberg, I. K., Guerrero, J. L., Younger, P. M., Beven, K. J., Seibert, J., Halldin, S., et al. (2011). Calibration of hydrological models using flow duration curves. Hydrol. Earth Syst. Sci. 152205–2227. doi: 10.5194/hess-15-2205-2011
Keywords: rating curve, Himalayas, uncertainty, weighing factor, water resource management
Citation: Kumar V and Sen S (2024) Rating curve development and uncertainty analysis in mountainous watersheds for informed hydrology and resource management. Front. Water 5:1323139. doi: 10.3389/frwa.2023.1323139
Received: 17 October 2023; Accepted: 08 December 2023;
Published: 08 January 2024.
Edited by:
Hafzullah Aksoy, Istanbul Technical University, TürkiyeReviewed by:
Aldo Fiori, Roma Tre University, ItalyMohammad Najafzadeh, Graduate University of Advanced Technology, Iran
Copyright © 2024 Kumar and Sen. This is an open-access article distributed under the terms of the Creative Commons Attribution License (CC BY). The use, distribution or reproduction in other forums is permitted, provided the original author(s) and the copyright owner(s) are credited and that the original publication in this journal is cited, in accordance with accepted academic practice. No use, distribution or reproduction is permitted which does not comply with these terms.
*Correspondence: Vikram Kumar, 25.vikram@gmail.com