 Cuthbert Taguta1,2*
 Luxon Nhamo2,3*
 Zolo Kiala2,4
 Tsitsi Bangira2Tinashe Lindel Dirwai2,4
 Aidan Senzanje1,5Hodson Makurira6
 Graham P. W. Jewitt5,7Sylvester Mpandeli3,8
 Tafadzwanashe Mabhaudhi2,4,9
- 1School of Engineering, University of KwaZulu-Natal, Pietermaritzburg, South Africa
- 2Centre for Transformative Agriculture and Food Systems (CTAFS), University of KwaZulu-Natal, Pietermaritzburg, South Africa
- 3Water Research Commission (WRC), Lynnwood Manor, Pretoria, South Africa
- 4International Water Management Institute (IWMI), Pretoria, South Africa
- 5Centre for Water Resources Research (CWRR), School of Engineering, University of KwaZulu-Natal, Pietermaritzburg, South Africa
- 6Department of Construction and Civil Engineering, University of Zimbabwe, Mt Pleasant. Harare, Zimbabwe
- 7WRE Department, IHE Delft Institute for Water Education, Delft, Netherlands
- 8Faculty of Science, Engineering and Agriculture, University of Venda, Thohoyandou, South Africa
- 9Centre on Climate Change and Planetary Health, London School of Hygiene and Tropical Medicine (LSHTM), London, United Kingdom
Introduction: The water-energy-food (WEF) nexus has evolved into an important transformative approach for facilitating the timely identification of trade-offs and synergies between interlinked sectors for informed intervention and decision-making. However, there is a growing need for a WEF nexus tool to support decision-making on integrated resources management toward sustainable development.
Methods: This study developed a geospatial web-based integrative analytical tool for the WEF nexus (the iWEF) to support integrated assessment of WEF resources to support resilience building and adaptation initiatives and strategies. The tool uses the Analytic Hierarchy Process (AHP) to establish numerical correlations among WEF nexus indicators and pillars, mainly availability, productivity, accessibility, and sufficiency. The tool was calibrated and validated with existing tools and data at varying spatio-temporal scales.
Results: The results indicate the applicability of the tool at any spatial scale, highlighting the moderate sustainability in the management of WEF resources at various scales. The developed iWEF tool has improved the existing integrative WEF nexus analytical tool in terms of processing time and providing geospatial capabilities.
Discussion: The iWEF tool is a digital platform that automatically guides policy and decision-making in managing risk from trade-offs and enhancing synergies holistically. It is developed to support policy and decision-making on timely interventions in priority areas that could be showing signs of stress.
1 Introduction
Water, energy and food are strategic resources that sustain livelihoods and are catalysts for economic development. However, apart from being highly sensitive to climate change, the three resources have been subjected to overexploitation due to the increasing demand from a growing global population (Mabhaudhi et al., 2016; SADC, 2016). At the global level, projections for 2030 and 2050 suggested increased demand of between 40 and 50% for water, 50 and 100% for energy, 50 and 60% for food, and 20% for agricultural land (WEC, 2013; IRENA, 2015; FAO, 2022; UNESCO, 2022). There is, therefore, a need to produce more with limited resources and continue meeting the increasing demand for essential resources from a growing population.
Current water, energy, and food sector-based policies and management practices tend to overlook the intricate interlinkages between the three resources, a scenario that undermines their security as each sector pursues its goals at the expense of the others (IRENA, 2015; Leck et al., 2015). Mabhaudhi et al. (2016) highlighted that there is a wealth of WEF nexus information produced in southern Africa, creating opportunities to adopt transformative approaches in sustainable resource management in the region. Current approaches to integrated resources management, while progressive, remain sectoral as they pursue sector policies. For example, integrated water resources management (IWRM) has been criticized for being water-centric (Benson et al., 2015; Grigg, 2019). The IWRM considers water as the entry point, which may lead to trade-offs in other linked sectors, thus triggering inefficiencies of WEF resources utilization and compromised resource security (Stucki and Smith, 2011; De Loë and Patterson, 2017). This led to the pursuit of alternative approaches that strive for holistic and equitable management (Leck et al., 2015; Schull et al., 2020).
The spectrum of nexus planning includes the water-energy-food (WEF) nexus approach and its various iterations such as food-energy-water (FEW) and energy–food–water (EFW) which inextricably links water, energy and food resources and sectors at multiple scales (Hoff, 2011; Flammini et al., 2014; IRENA, 2015). Although WEF is the most popular iteration, other nexus dimensions linked to these three dimensions and in focus include environment, human health, and human health (Saundry and Ruddell, 2020). However, successful implementation of integrative approaches such as nexus planning will rely, to an extent, on the availability of tools to analyse and quantify cross-sectoral interactions and identify trade-offs. This requires decision-support tools that support both quantitative and qualitative data as informed by the analysis under consideration, as well as data availability and accessibility (Bazilian et al., 2011; IRENA, 2015). Such decision-support tools include models, and they are useful in informing integrated planning, policy and decision-making.
Previous WEF nexus tools found in the literature are generally complex as they require extensive data input, are selective of spatial scale and geographic scope, and lack feedback analysis, optimisation and visualization (IRENA, 2015; Kaddoura and El Khatib, 2017; Albrecht et al., 2018; Dargin et al., 2019; Rosales-Asensio et al., 2020). Taguta et al. (2022c) provide an updated inventory of existing WEF nexus tools, and they found that at least forty-six WEF nexus tools were developed worldwide between 2009 and 2021. However, most of these tools are unavailable (61%), of unknown format (48%), applicable to large scales (70%), lacking in geospatial analytic capabilities (70%), and are relatively unpopular (61%) in application case studies (Taguta et al., 2022c). For those claimed to be deployed in the public web domain (43%), including web applications (18%) and desktop applications (15%), about 20% were confirmed to be dead links (Taguta et al., 2022c). Some current versions of web-based WEF nexus tools were found to be restricted to specific users (e.g., project partners), spatial scales and scopes for which they were originally developed, thus limiting their universal applicability (Taguta et al., 2022c). Availability and accessibility are necessary prerequisites for users' broad use of WEF nexus approaches and tools that inform coherent decisions (IRENA, 2015). WEF nexus tools must be applicable at the local level to tailor appropriate solutions for local conditions that leverage synergistic techno-ecological interactions. Preferably, WEF nexus tools should have special attributes that include multi-scalar, flexibility and adaptability in spatial scale and geographic scope. To bridge the science-policy-practice gap, the WEF nexus approach and tools should be adopted and used by policy and decision-makers to address service delivery, food, energy and water securities, poverty, inequality, and high unemployment, inter alia (Mpandeli et al., 2018; Nhamo et al., 2018; Naidoo et al., 2021).
Since 2015, when the WEF nexus became more pronounced (Liphadzi et al., 2021), various attempts have been made to develop a cost and time-effective integrated model to drive the management of the three resources holistically (Albrecht et al., 2018; Botai et al., 2021). The development of such a model that provides numerical relationships is complex as the three resources have different units of measurements (Nhamo et al., 2020a). Thus, a WEF nexus model should provide a mathematical construct of relationships between food, energy, and water systems that simplify complex relationships between interlinked sectors and represent management realities by capturing the spatial and/or temporal dynamics and feedback between them. WEF nexus models, therefore, should describe the cross-cutting and integrated relations of the interconnected resources of water, energy and food resources, including the structure and functions to provide an understanding of inherent attributes that impact socio-ecological economic and physical dimensions (EPA, 2009; Saundry and Ruddell, 2020). However, most nexus tools focus on quantitative and qualitative attributes of the linkages, but lacking in spatial attributes that include mapping, and visualization. The lack of geospatial elements in existing WEF nexus tools needs to be addressed as WEF resources are spatially distributed (Shannak et al., 2018; Ravar et al., 2020). Thus, Geographic Information Systems (GIS) provide a solid platform for WEF nexus tools and can be integrated to simultaneously compute, analyse and map interactions between WEF resources (Eftelioglu et al., 2017).
Although previous studies that include the work of Mabhaudhi et al. (2019) and Nhamo et al. (2020a,b) developed a novel and dynamic approach that established quantitative relationships between the WEF resources, the tool is Excel-based and lacks a spatial analysis component. It is also unavailable in the public domain as the user needs to develop their own. This study addresses this gap by developing a user-friendly Graphical User Interface (GUI) with geospatial analytic capabilities. Thus, we developed a geospatial and web-based integrative WEF nexus tool, called the iWEF, to enhance the analytical tool developed by Mabhaudhi et al. (2019) and Nhamo et al. (2020a,b). As a digital and web-based tool, the iWEF is meant to improve the operational time of the existing Excel-based WEF nexus integrative model. Therefore, the study provides a user-friendly digital WEF nexus tool (the iWEF) that improves the operational time and cost of the existing integrative analytical model.
2 Materials and methods
The iWEF tool was developed using model building, programming and web development tools, integrating a GIS module that facilitates geospatial analytic capabilities by providing quantitative and qualitative spatial information about the WEF nexus. This section provides the background information on the integrative WEF nexus analytical model and the stepwise model development.
2.1 Description of the WEF nexus integrative analytical model
The integrative WEF nexus analytical model was developed by Nhamo et al. (2020a) as a spreadsheet based on the Analytic Hierarchy Process (AHP). The model establishes quantitative relationships among WEF resources. Its main strength is the capability to indicate resource utilization and performance over time and inform policy and decision-making on priority areas for immediate intervention. The key feature of the tool is, therefore, its capability to provide a holistic assessment of synergies and trad-offs to improve the management, efficiency, and productivity of resources for sustainable development (Nhamo et al., 2020a). The model computes composite indices using WEF nexus sustainability indicators, including water availability, water productivity, energy accessibility, energy productivity, food self-sufficiency and cereal productivity (Figure 1).

Figure 1. Pillars, indicators, and goal in the conceptual framework for iWEF model development.
These six indicators are compared against each other in a pairwise comparison matrix (PCM) based on the hierarchy established through the Saaty process and scale, and sometimes supported by, if available, expert opinion, literature, or recognized databases (e.g., national statistics, World Bank, Aquastat). All indicators and their characteristics (definitions and polarity) were adopted as in Nhamo et al. (2020a), except for energy productivity (EP) and food self-sufficiency (FSF).
2.2 The conceptual model for the iWEF modeling tool
The iWEF model (Figure 1) is based on the AHP, a multi-criteria decision-making (MCDM) approach, which is composed of indicators and their pillars as already alluded to. The conceptual model (Figure 2) highlights the flow of data for the iWEF tool between the four major sub-modules which form the model: the database, user interface, computations and results (Figure 2).
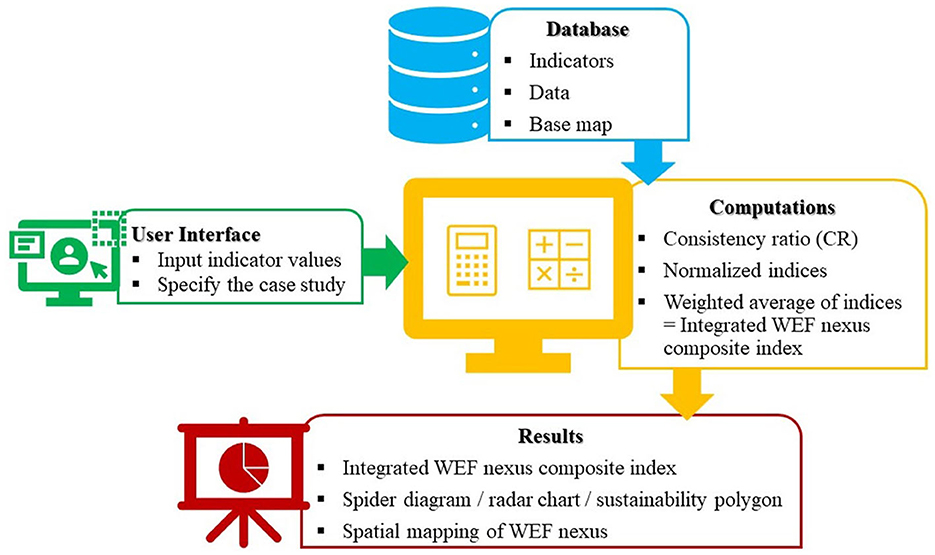
Figure 2. The mode of operation for iWEF using the modeling tool's sub-modules.
The four modules indicated in Figure 2 are established in such a way that they work harmoniously to facilitate the tool to produce the desired results. Generally, the graphic user interface (GUI) facilitates users to interrelate with the tool's database and specify the WEF resources input data from the indicators. The analysis module converts the data from the indicators into useful quantitative relationships which can be displayed in the form of tables, graphs, and maps for easy interpretation. The iWEF model automatically determines the consistency of a provided input pairwise comparison matrix (PCM) and either accepts if the consistency ratio (CR) value is <0.1 (or 10%) or rejects it if the CR value is above 0.1 (Saaty and Vargas, 2012). A key feature in the iWEF model is the comparison and visualization of results for several case studies using spider diagrams (or radar chart or sustainability polygon) and WEF nexus maps plotted on the same axes and scale.
2.3 Mathematical (quantitative) model for iWEF
2.3.1 Determining the consistency of the PCM
Like the Excel-based tool, the iWEF integrates the indicators (Brunelli, 2015) by normalizing WEF indicators data to establish composite indices. The composite indices are then used to calculate the weighted average, which is then considered as the integrated WEF nexus composite index. According to Saaty (1987), the AHP is a measurement theory for deriving ratio scales from discrete and continuous paired comparisons to set priorities and make the best decisions. The AHP comparison matrix is determined by comparing two indicators simultaneously using Saaty's scale, which ranges between one and nine (Saaty, 1987), as indicated in the iWEF user manual (Taguta et al., 2022b).
Based on the AHP method, the iWEF model computes the consistency ratio (CR), which measures the randomness and consistency of the pairwise judgements from the ratio of the consistency index to the randomness index (SM1). The CR value is calculated as in Mu and Pereyra-Rojas (2017) as a function of the consistency index (CI), and the random index (RI) which depends on the order n of the matrix (Saaty and Vargas, 2012). CI depends on the principal or maximum eigenvalue which is estimated by Teknomo (2006), Bunruamkaew (2012), and Mu and Pereyra-Rojas (2017). According to Saaty and Vargas (2012), a CR value of <0.1 or 10% is acceptable for the CR. A higher value (CR > 0.1 or 10%) is unacceptable due to implied inconsistency in the pairwise comparison judgements (Saaty and Vargas, 2012).
2.3.2 Calculation and normalization of indices by AHP-MCDM technique
The AHP calculates the indices from indicators by taking the eigenvector corresponding to the largest eigenvalue of the matrix and then normalizing the sum of the components (SM1) (Saaty, 1990; Saaty and Vargas, 2012). The overall importance of each indicator is then determined (Nhamo et al., 2020a). The iWEF model, therefore, determines the integrated WEF nexus composite index as a weighted average whose values, in our case, range from 0.048 to 0.286 and can be interpreted on its level or class of sustainability (Table 1) (Nhamo et al., 2020a).
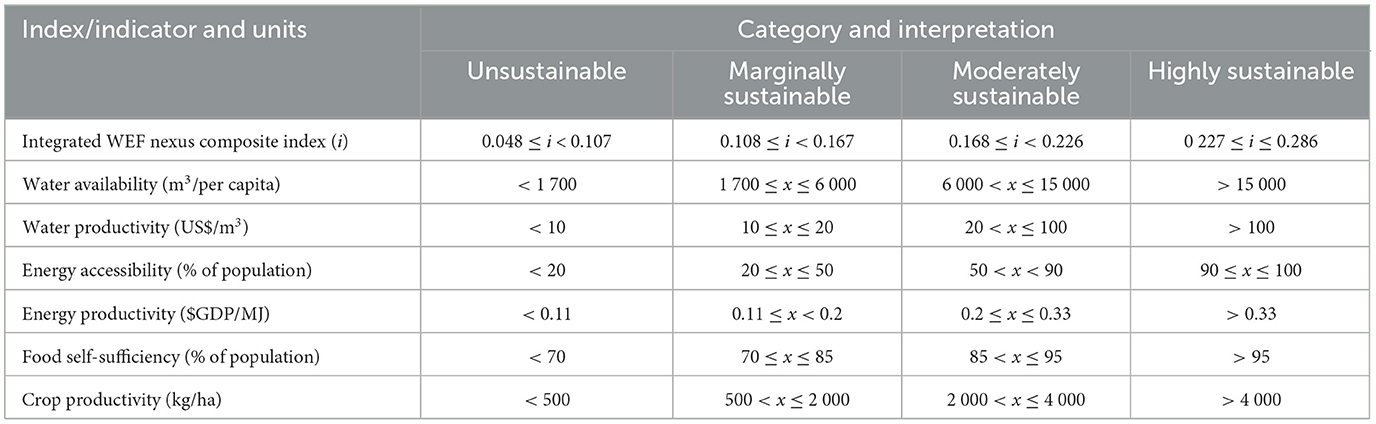
Table 1. WEF nexus indices performance classification categories (Nhamo et al., 2020a).
The value of the integrated WEF nexus composite index represents the overall performance of resource development, utilization, and management (Nhamo et al., 2020a). Similarly, indices performance classification categories for the six indicators were adopted from Nhamo et al. (2020a), except for energy productivity and food self-sufficiency. Based on their definitions presented earlier (Section 2.1) in this work, the sustainability category scale for these two indicators (energy productivity and food self-sufficiency) changed in values and polarity from the ones provided in Nhamo et al. (2020a).
2.4 Development of the iWEF web-based and GIS-linked tool
The development of a life-cycle for the iWEF modeling tool was an adaptation of the Environmental Protection Agency (US-EPA) modeling life-cycle (EPA, 2009) and the Modified Waterfall model (Conrad et al., 2016), which allows developers to return to a previous phase ideally confined to connecting steps. The development of the iWEF application followed this non-linear and bottom-up development life-cycle which offered the possibility and flexibility of iterating to the previous stage(s) for correction, verification, validation and improvement. This development life-cycle was also useful for keeping the web application development project's progress in order, straightforward, simple, and easy to understand. The life cycle analysis provides essential feedback that is critical for making informed decisions. It's a process that is used to timely identify key sources of environmental burdens in a system and therefore, the trade-offs between the environmental and economic performance of systems.
The iWEF tool and its modules were developed with programming, web framework and visualization tools, including Python, Django, PostgreSQL, Visual Studio Code, Git, JavaScript and Dash-Plotly. The GIS module was integrated into iWEF through Leaflet, an open-source JavaScript library for building web mapping applications using an OpenStreetMap as a base map. The Visual Studio Code editor was used for writing codes, while GitHub was used for version control, backup and spinning the server to test the application before public deployment. The web-based and GIS-enabled iWEF model was developed with two common tasks: the back-end and the front-end.
2.4.1 The iWEF back-end
The back end comprises Django, a Python framework for web development, and Dash-Plotly, a Python framework for data visualization. GeoDjango, a Django module, was used to extend Django's capability to store and work with geographic/spatial data. The database technologies included the PostgreSQL database management system. PostgreSQL and its spatial extender, PostGIS, which adds spatial functionalities, are both Open Geospatial Consortium (OGC) Web Map Services standards-compliant. PostGIS allows PostgreSQL to augment support for geographic objects, thus understanding coordinate systems, projections and transformations (MacEachren et al., 2008). The model's computation component consists of the codes and algorithms from governing equations for reciprocity of indicator values, calculating CR values, sums, weights, indices of indicators, and the overall index (integrated WEF nexus composite index) as the weighted average. Dash-Plotly was used for creating graphs and maps of the iWEF model outputs.
2.4.2 The iWEF front-end
The HyperText Markup Language (HTML) markup language, Cascading Style Sheets (CSS) language, and JavaScript programming language were used for developing the front-end (including the user interface). The languages proved efficient in the interaction between the user and the system. The Balsamiq Wireframes software was used to draw the wireframes of iWEF. The front-end components and functions are explained in detail in the iWEF user manual (Taguta et al., 2022b). The final outputs include a weighted average index (the integrated WEF nexus composite nexus), a spider diagram showing WEF trade-offs and synergies (Flammini et al., 2014; FAO, 2021), and maps showing the spatial variation of the WEF nexus. The spider graph and its shape illustrate and compare sectors' performance regarding sustainable or unsustainable management (Mabhaudhi et al., 2019; Nhamo et al., 2020a,b).
2.4.3 Coupling GIS and iWEF model
GIS can be coupled to WEF tools in various ways, including “soft-linked” and “hard-linked” (Eldrandaly, 2007). The major difference between soft-linked and hard-linked integration of WEF nexus tools and GIS is the manual and automated exchange of information, respectively (Figure 3).
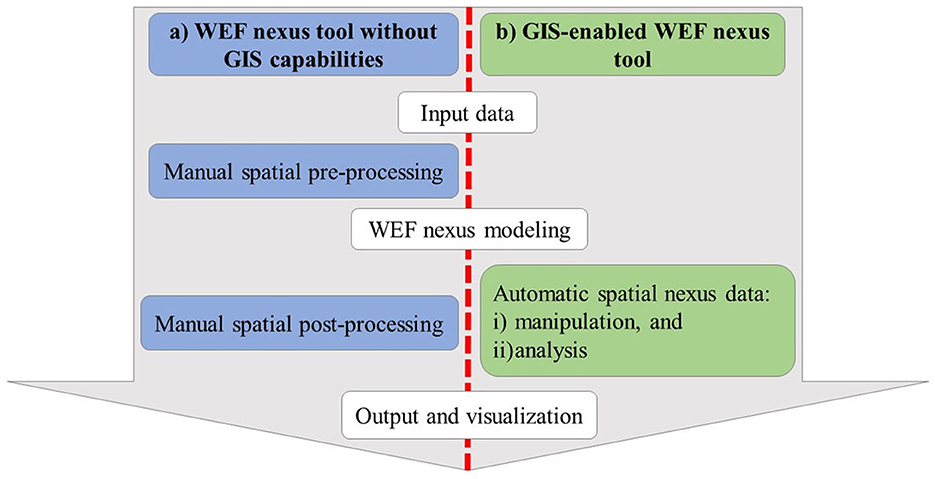
Figure 3. Differences in WEF nexus spatial analysis using a typical (a) left side – WEF nexus tool that uses soft-linked integration with GIS, and (b) right side – GIS-enabled hard-linked WEF nexus tool (Adapted from Burger, 2018; Burger and Abraham, 2020).
The iWEF model was integrated into GIS by hard-linking to an open-source base map so that users can locate their case studies, spatially analyse and visualize their results. Hard-linking was chosen over soft-linking because hard-linked integration is automatic, simple and user-friendly in exchanging input/output information between the WEF nexus tool and GIS. The base maps commonly used in web-based applications include those available in ArcGIS Online, Google Maps, OpenGIS and OpenStreetMap. Base maps are used as foundation layers to support a range of web maps or web mapping applications. Using open-source base maps reduces the overall cost and time of developing and implementing the GIS-enabled WEF nexus model. The iWEF model was geospatially enabled through a “hard-linked” GIS integration of the WEF nexus model with open-source base maps displayed on the front-end using the JavaScript library, Leaflet. The leaflet can be used with several plugins that provide open-source base maps. Dash-Plotly allows users to choose different study areas under study, interactively, and display and contrast WEF nexus results.
2.4.4 Online deployment and dissemination of the iWEF modeling tool
The iWEF modeling tool (Taguta et al., 2022a) was deployed on the internet on a dedicated website (https://www.iWEF.app/) with a Secure Sockets Layer after considering pertinent factors such as costs and the security and privacy of the tool and its users. To promote its applicability by prospective users, the iWEF modeling tool is accessible freely as an open-source web application. Dedicated accounts and channels were created for the iWEF model to facilitate its dissemination to interested users in wide audiences on online media and communication platforms such as LinkedIn, SlideShare, Facebook, YouTube, Twitter, Instagram, and Scribd.
2.4.5 Operating procedure and key outputs for the iWEF modeling tool
To operate iWEF, users must chronologically follow the steps presented in Figure 4. Before modeling in iWEF the user (i) identifies the spatial boundaries for their case study, and (ii) engages experts and stakeholders to collect and prepare input data for the iWEF model through pairwise comparison of indicators using a scale from 1/9 (the lowest and most insignificant relationship) through 1 (equal importance) to 9 (the highest and most significant relationship).
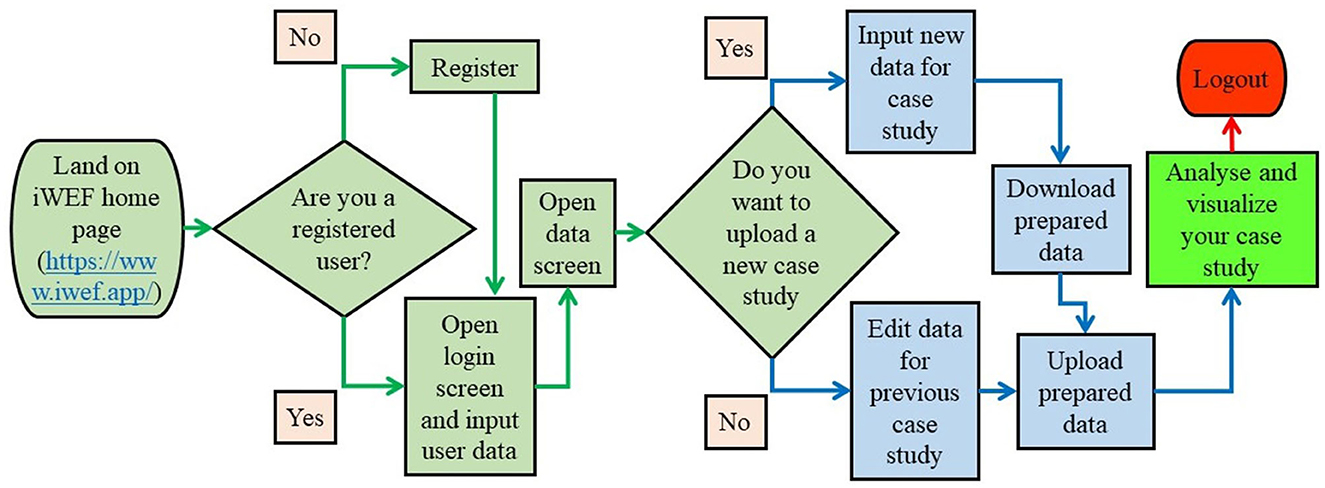
Figure 4. The user flowchart for the iWEF modeling tool.
The key outputs in the iWEF model are quantitative, graphical and spatial. The spider diagrams (or radar charts or sustainability polygons) display normalized indices of relative performance and interrelationships between WEF sectors. A deformed amoeba shape is symptomatic of an unbalanced WEF system, while a circular shape signifies balanced management of WEF resources. The maps show the location of the case study and spatially visualize the integrated WEF nexus composite index as a measure of WEF nexus performance. The lower value (close to 0.048) of the composite WEF nexus index, the more unsustainable the WEF resource management is, while a higher value (closer to 0.286) signifies highly sustainable WEF resource management (Table 1). The same applies to indices of performance of the sector indices of indicators. If available, the values of and sustainability classification categories for the six as presented in Table 1 are used for interpreting and reporting the relative performances of the sectors and indicators, as well as proposing potential WEF nexus solutions for improving the sustainability of the case study.
2.5 Testing and trial runs for the iWEF modeling tool
The iWEF tool was tested to ascertain its compatibility with common browsers and devices, on top of accuracy and reliability in computing the CR value and the integrated WEF nexus composite index. The iWEF modeling tool was tested for loading and execution in common web browsers. The modeling tool was also tested for compatibility with common electronic gadgets. Two pairwise comparison matrix datasets were randomly generated to test the accuracy of the iWEF modeling in calculating the CR value; (i) within an acceptable range of <0.1 (or 10%), and (ii) at unacceptable values of 0.1 (or 10%) and above (Teknomo, 2006; Bunruamkaew, 2012; Mu and Pereyra-Rojas, 2017). The typical inconsistent and consistent pairwise comparison judgement datasets are presented in SM3. The two different PCMs were run in the iWEF modeling tool, and the results were compared with those from the simple web-based AHP Priority Calculator (AHP Online System – AHP-OS) by Goepel (2022).
The initial version of the web-based and GIS-enabled iWEF modeling tool was tested with input PCM data from three case studies that previously applied iWEF's predecessor, i.e., the spreadsheet-based tool (Mabhaudhi et al., 2019; Nhamo et al., 2020a,b). The results were visually and quantitatively compared with those from the original case studies in which the spreadsheet-based tool was previously used. All three case studies were run and analyzed simultaneously in iWEF to test the modeling tool's ability to plan and analyse WEF nexus scenarios.
3 Results and discussion
3.1 Browser compatibility and screen resolutions
The iWEF modeling tool was successfully loaded and executed in Microsoft Edge (v99.0.1150.36), Google Chrome (v99.0.4844.51) and Mozilla Firefox (97.0.1). The modeling tool was also successfully loaded and executed on laptops, desktop computers, smartphones, and tablets at good resolutions. This shows that the iWEF modeling tool is compatible with common web browsers, electronic devices, and gadgets.
3.2 Calibration of iWEF modeling tool for CR value
The results from running inconsistent and consistent pairwise matrix (PCM) data sets in the iWEF modeling tool to test its accuracy and reliability in determining the consistency and randomness of input data are presented in SM4. Similar to the AHP Priority Calculator (AHP Online System – AHP-OS) by Goepel (2022), iWEF was able to reproduce CR values of 0.31 for the inconsistent dataset and 0.07 for the consistent dataset. This shows that the iWEF modeling tool is accurate and reliable in determining the CR value. Thus, the iWEF modeling tool can reliably inform and guide users in ensuring the randomness and consistency of their pairwise comparison matrix judgements. This is crucial in the sound determination of integrated WEF nexus indices that represent WEF interconnections in their case studies.
3.3 Validation of iWEF tool
The integrated WEF nexus composite index (0.200) from the iWEF modeling tool and its predecessor were similar to the southern Africa regional case study by Mabhaudhi et al. (2019) for 2017, as illustrated in Figure 5. The value-add of the iWEF tool is that it provides a spatial component (Figure 5C) to the analysis. The iWEF modeling tool, therefore, offers the extra benefit of locating the case study area and spatially mapping and visualizing the WEF nexus (Figure 5C), features that are absent in the original spreadsheet-based tool. Therefore, the tool provides an extra spatiotemporal analysis of the integrated management of the interlinked resources. Detailed analysis and interpretation of the normalized indices and the integrative WEF nexus composite index are available in Mabhaudhi et al. (2019). The results show that managing the WEF nexus is moderately sustainable.
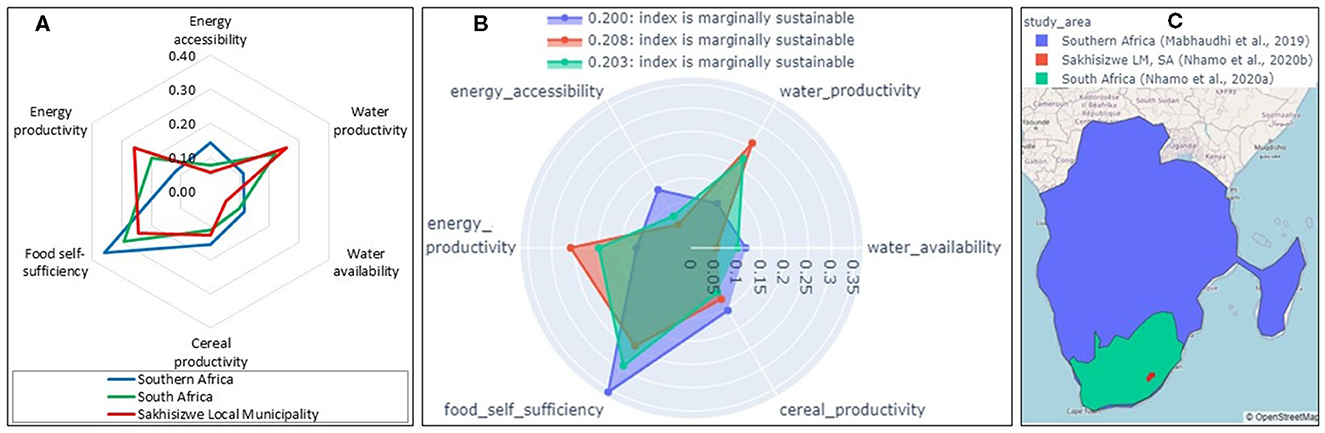
Figure 5. Multiple case study WEF nexus analysis results at regional (Southern Africa), local municipal (Sakhisizwe), and national (South Africa) scales (A) quantitatively using the spreadsheet-based tool (Mabhaudhi et al., 2019; Nhamo et al., 2020a,b), (B) quantitatively using the iWEF modeling tool, and (C) spatially using the iWEF modeling tool.
For the South African national case study by Nhamo et al. (2020a) for 2015, the iWEF modeling tool reproduced the quantitative (integrative WEF nexus composite index = 0.203), visual and graphical results similar to the spreadsheet-based tool (Figure 5). Additionally, the iWEF modeling tool spatially characterized the WEF nexus (Figure 5C), a characteristic absent in the original spreadsheet-based tool. Detailed analysis and interpretation of the normalized indices and the integrative WEF nexus composite index are available in Nhamo et al. (2020a). The management of the WEF nexus in South Africa is moderately sustainable, with room for improving citizens' access to energy, water availability and cereals' productivity.
The iWEF modeling tool produced results (integrative WEF nexus composite index = 0.208; the similar shape of radar chart) similar to the original spreadsheet-based tool for the local scale Sakhisizwe Local Municipality (South Africa) case study using 2018 data by Nhamo et al. (2020b), as shown in Figure 5. Unlike the spreadsheet-based tool, the iWEF modeling tool managed to spatially map and visualize the WEF nexus (Figure 5C). Detailed analysis and interpretation of the normalized indices and the integrative WEF nexus composite index are available (Nhamo et al., 2020b). At this local scale, management of the WEF nexus is moderately sustainable. The municipality needs to explore nexus-relevant interventions that improve water availability, energy accessibility and cereal productivity.
The iWEF modeling tool was also able to simultaneously analyse and quantitatively and spatially visualize the WEF nexus for multiple (three) but individual case studies across scales on the same axis and map background, as shown in Figure 5. This is testimony that the iWEF tool is and applicable at different spatio-temporal scales. Simultaneous visualization of results from multiple case studies at different spatio-temporal scales in the iWEF tool allows users to develop, analyse and compare different states of the WEF nexus for different time slices or locations, a key feature in analyzing and planning WEF nexus scenarios. For example, as illustrated in Figure 5, the potential exists to use the current version of the iWEF modeling tool to explore how WEF systems will likely unfold with time, testing possible adaptation and their impacts, which can aid in planning for sustainable and balanced development.
From the testing, verification and validation instances, the geospatial web-based iWEF tool is trustworthy in computing and presenting the WEF nexus at multiple scales. It automatically checks the consistency and randomness of pairwise comparison judgements and thus informs users on the quality of their input data. The tool visualizes outputs quantitatively, graphically and spatially for users to identify and appreciate cross-sectoral linkages and performances. The iWEF modeling tool can confidently be used in other case study areas of interest to characterize the WEF nexus and identify areas that need intervention for implementing the WEF nexus approach. The tool is valuable in the day-to-day operations of policy- and decision-makers to bring together water, energy and agriculture sectors. It provides informed policy and investment decisions by indicating priority areas for strategic intervention, closing the gap between the WEF nexus theory and actual practice.
3.4 Limitations of the iWEF model (version 1.0)
The current version of the iWEF model is fixed by its operating principle (AHP) to only six indicators. Work is needed to extend the number of indicators in the iWEF model, which is currently limited to a maximum of nine indicators as restricted by the AHP MCDM technique. Alternatively, the operating principle for the iWEF model may be changed from AHP to another MCDM technique that can accommodate more than nine indicators or criteria such as fuzzy AHP. In the same vein, there is a need to make customisable the naming and number of indicators for flexibility and adaptability according to user needs and context. The iWEF 1.0 can advise the consistency of PCM judgements, however, future efforts will be made for the tool to pinpoint the outlier judgements so that they can be systematically reconsidered with relative ease. As the current version is only available online, future efforts need to develop a desktop version and open-source codes, with the latter format promoting transparency and opportunities for improvement, customization, and integration.
4 Conclusions
This study introduced a user-friendly, freely accessible, geospatial and web-based integrative WEF nexus analytical modeling tool, the iWEF with open-source base maps. The web-based version is a freely available, easy-to-use and open-source tool. Users have a ready-made tool to accurately determine the CR values, the normalized indices and the integrated WEF nexus composite indices, with an additional ability to spatially map and visualize the WEF nexus relationships. The current version of the tool is descriptive, indicative, and diagnostic, and thus requires further enhancing its abilities toward being prescriptive and predictive for WEF nexus scenario planning. Further studies should include the development of (i) iWEF plugins for off-the-shelf free and commercial GIS software such as ArcGIS and QGIS, and (ii) desktop PC and Android application versions of the iWEF modeling tool that can work offline for compatibility and convenience with various users and devices (gadgets). Other recommended improvements for the iWEF modeling tool include (i) increasing the number of criteria (i.e., indicators), (ii) making it adequately flexible such that users can specify their WEF sectors/dimensions and indicators according to context, and (iii) developing sub-modules for WEF nexus scenario planning.
Data availability statement
The raw data supporting the conclusions of this article will be made available by the authors, without undue reservation.
Author contributions
CT: Conceptualization, Formal analysis, Writing—original draft, Data curation, Methodology, Software. LN: Conceptualization, Formal analysis, Writing—original draft, Writing—review & editing. ZK: Investigation, Methodology, Software, Writing—review & editing. TB: Conceptualization, Data curation, Formal analysis, Methodology, Resources, Software, Writing—review & editing. TD: Formal analysis, Investigation, Methodology, Validation, Writing—review & editing. AS: Investigation, Project administration, Resources, Validation, Visualization, Writing—review & editing. HM: Conceptualization, Resources, Supervision, Validation, Visualization, Writing—review & editing. GJ: Project administration, Resources, Supervision, Validation, Visualization, Writing—review & editing. SM: Conceptualization, Investigation, Methodology, Supervision, Validation, Writing—review & editing. TM: Conceptualization, Funding acquisition, Investigation, Methodology, Project administration, Resources, Validation, Writing—review & editing.
Funding
The author(s) declare financial support was received for the research, authorship, and/or publication of this article. This study was funded by the Water Research Commission of South Africa (WRC) under Projects C2019/2020-00007 titled From theory to practice: developing a case study and guidelines for water-energy-food (WEF) nexus implementation in southern Africa and C2020/2021-00462 Developing a web-based and GIS-enabled WEF nexus integrative model. The authors acknowledge support from the project Water-Energy-Food Nexus Toolkit (WEF-Tools) to support sustainable and inclusive socio-economic development in water-scarce regions led by IHE Delft and supported by the IHE Delft Partnership Programme for Water and Development (DUPC2). This work formed part of the Nexus Gains Initiative, which is grateful for the support of CGIAR Trust Fund contributors: www.cgiar.org/funders. The role of all funding sources was solely financial support.
Acknowledgments
The authors would like to thank Jeremiah Taguta for assisting with programming during the development of the iWEF model.
Conflict of interest
The authors declare that the research was conducted in the absence of any commercial or financial relationships that could be construed as a potential conflict of interest.
The author(s) declared that they were an editorial board member of Frontiers, at the time of submission. This had no impact on the peer review process and the final decision.
Publisher's note
All claims expressed in this article are solely those of the authors and do not necessarily represent those of their affiliated organizations, or those of the publisher, the editors and the reviewers. Any product that may be evaluated in this article, or claim that may be made by its manufacturer, is not guaranteed or endorsed by the publisher.
References
Albrecht, T. R., Crootof, A., and Scott, C. A. (2018). The water-energy-food nexus: A systematic review of methods for nexus assessment. Environ. Res. Lett. 13, 043002. doi: 10.1088/1748-9326/aaa9c6
Bazilian, M., Rogner, H., Howells, M., Hermann, S., Arent, D., Gielen, D., et al. (2011). Considering the energy, water and food nexus: towards an integrated modelling approach. Energ. Policy 39, 7896–7906. doi: 10.1016/j.enpol.2011.09.039
Benson, D., Gain, A. K., and Rouillard, J. (2015). Water governance in a comparative perspective: from IWRM to a 'nexus' approach? Water Alternatives 8, 756–773.
Botai, J. O., Botai, C. M., Ncongwane, K. P., Mpandeli, S., Nhamo, L., Masinde, M., et al. (2021). A review of the water–energy–food nexus research in Africa. Sustainability 13, 1762. doi: 10.3390/su13041762
Bunruamkaew, K. (2012). How to do AHP Analysis in Excel. Tsukuba: Division of Spatial Information Science, Graduate School of Life and Environmental Sciences, University of Tsukuba.
Burger, R. E. A. (2018). MAXUS - Synergizing Water, Food and Energy Policy [Unpublished thesis, Civil Engineering and Geosciences]. Delft: Delft University of Technology.
Burger, R. E. A., and Abraham, E. (2020). “Maximizing water–food–energy nexus synergies at basin scale,” in Frontiers in Water-Energy-Nexus—Nature-Based Solutions, Advanced Technologies and Best Practices for Environmental Sustainability (Proceedings of the 2nd WaterEnergyNEXUS Conference, November 2018, Salerno, Italy). Advances in Science, Technology and Innovation (IEREK Interdisciplinary Series for Sustainable Development). Cham: Springer.
Conrad, E., Misenar, S., and Feldman, J. (2016). “Chapter 9 - Domain 8: software development security (understanding, applying, and enforcing software security),” in CISSP Study Guide, 3rd Edn, eds E. Conrad, S. Misenar, J. Feldman (Boston, MA: Syngress).
Dargin, J., Daher, B., and Mohtar, R. H. (2019). Complexity versus simplicity in water energy food nexus (WEF) assessment tools. Sci. Total Environ. 650, 1566–1575. doi: 10.1016/j.scitotenv.2018.09.080
De Loë, D., and Patterson, R. C. (2017). Rethinking water governance: moving beyond water-centric perspectives in a connected and changing world. Nat. Res. J. 57, 75–99.
Eftelioglu, E., Jiang, Z., Tang, X., and Shekhar, S. (2017). The Nexus of Food, Energy, and Water Resources: Visions and Challenges in Spatial Computing. Cham: Springer International Publishing, 5–20.
Eldrandaly, K. (2007). “Expert systems, GIS, and spatial decision making: Current practices and new trends,” in Expert Systems Research Trends, ed. A. R. Tyler (New York, NY: Nova Science Pub Inc).
EPA (2009). Guidance on the Development, Evaluation, and Application of Environmental Models. Washington, DC: United States Environmental Protection Agency (U.S. EPA).
FAO (2021). Synergies and Trade-Offs in Climate-Smart Agriculture – An Approach to Systematic Assessment. Rome: Food and Agriculture Organization of the United Nations.
FAO (2022). The State of the World's Land and Water Resources for Food and Agriculture – Systems at Breaking Point. Main Report. Rome: Food and Agriculture Organization of the United Nations (FAO).
Flammini, A., Puri, M., Pluschke, L., and Dubois, O. (2014). Walking the Nexus Talk: Assessing the Water-Energy-Food Nexus in the Context of the Sustainable Energy for All Initiative. Rome: Food and Agriculture Organization of the United Nations (FAO).
Goepel, K. D. (2022). AHP Priority Calculator (AHP Online System - AHP-OS). Business Performance Management Singapore (BPMSG). Available online at: https://bpmsg.com/ahp/ahp-calc.php; https://github.com/bpmsg/ahp-os (accessed March 1, 2022).
Grigg, N. S. (2019). IWRM and the nexus approach: versatile concepts for water resources education. J. Contemp. Water Res. Educ. 166, 24–34. doi: 10.1111/j.1936-704X.2019.03299.x
Hoff, H. (2011). Understanding the Nexus. Background Paper for the Bonn 2011 Conference: The Water, Energy and Food Security Nexus. Stockholm: Stockholm Environment Institute (SEI).
IRENA (2015). Renewable Energy in the Water, Energy and Food Nexus. Abu Dhabi: International Renewable Energy Agency (IRENA).
Kaddoura, S., and El Khatib, S. (2017). Review of water-energy-food Nexus tools to improve the Nexus modelling approach for integrated policy making. Environ. Sci. Policy 77, 114–121. doi: 10.1016/j.envsci.2017.07.007
Leck, H., Conway, D., Bradshaw, M., and Rees, J. (2015). Tracing the water–energy–food nexus: description, theory and practice. Geography Compass 9, 445–460. doi: 10.1111/gec3.12222
Liphadzi, S., Mpandeli, S., Mabhaudhi, T., Naidoo, D., and Nhamo, L. (2021). “The evolution of the water-energy-food nexus as a transformative approach for sustainable development in south africa,” in The Water-Energy-Food Nexus: Concept and Assessments, ed S. Muthu (Kowloon: Springer), 35–67.
Mabhaudhi, T., Mpandeli, S., Madhlopa, A., Modi, A. T., Backeberg, G., Nhamo, L., et al. (2016). Southern Africa's water–energy nexus: towards regional integration and development. Water 8, 235. doi: 10.3390/w8060235
Mabhaudhi, T., Nhamo, L., Mpandeli, S., Nhemachena, C., Senzanje, A., Sobratee, N., et al. (2019). The water–energy–food nexus as a tool to transform rural livelihoods and well-being in Southern Africa. Int. J. Environ. Res. Pub. Health 16, 2970. doi: 10.3390/ijerph16162970
MacEachren, A. M., Crawford, S., Akella, M., and Lengerich, G. (2008). Design and implementation of a model, web-based, GIS-enabled cancer atlas. Cartograph. J. 45, 246–260. doi: 10.1179/174327708X347755
Mpandeli, S., Naidoo, D., Mabhaudhi, T., Nhemachena, C., Nhamo, L., Liphadzi, S., et al. (2018). Climate change adaptation through the water-energy-food nexus in Southern Africa. Int. J. Environ. Res. Pub. Health 15, 2306. doi: 10.3390/ijerph15102306
Mu, E., and Pereyra-Rojas, M. (2017). Understanding the Analytic Hierarchy Process. Practical Decision Making. Springer Briefs in Operations Research. Cham: Springer.
Naidoo, D., Nhamo, L., Mpandeli, S., Sobratee, N., Senzanje, A., Liphadzi, S., et al. (2021). Operationalising the water-energy-food nexus through the theory of change. Renew. Sust. Energ. Rev. 149, 111416. doi: 10.1016/j.rser.2021.111416
Nhamo, L., Mabhaudhi, T., Mpandeli, S., Dickens, C., Nhemachena, C., Senzanje, A., et al. (2020a). An integrative analytical model for the water-energy-food nexus: South Africa case study. Environ. Sci. Policy 109, 15–24. doi: 10.1016/j.envsci.2020.04.010
Nhamo, L., Ndlela, B., Mpandeli, S., and Mabhaudhi, T. (2020b). The water-energy-food nexus as an adaptation strategy for achieving sustainable livelihoods at a local level. Sustainability 12, 1–16. doi: 10.3390/su12208582
Nhamo, L., Ndlela, B., Nhemachena, C., Mabhaudhi, T., Mpandeli, S., Matchaya, G., et al. (2018). The water-energy-food nexus: climate risks and opportunities in Southern Africa. Water 10, 567. doi: 10.3390/w10050567
Ravar, Z., Zahraie, B., Sharifinejad, A., Gozini, H., and Jafari, S. (2020). System dynamics modeling for assessment of water–food–energy resources security and nexus in Gavkhuni basin in Iran. Ecol. Indic. 108 105682. doi: 10.1016/j.ecolind.2019.105682
Rosales-Asensio, E., de la Puente-Gil, Á., García-Moya, F.-J., Blanes-Peiró, J., and de Simón-Martín, M. (2020). Decision-making tools for sustainable planning and conceptual framework for the energy–water–food nexus. Energ. Rep. 6 4–15. doi: 10.1016/j.egyr.2020.08.020
Saaty, R. W. (1987). The analytic hierarchy process-what it is and how it is used. Mathematic. Modell. 9, 161–176. doi: 10.1016/0270-0255(87)90473-8
Saaty, T. L. (1990). Eigenvector and logarithmic least squares. Eur. J. Operational Res. 48, 156–160. doi: 10.1016/0377-2217(90)90073-K
Saaty, T. L., and Vargas, L. G. (2012). Models, Methods, Concepts and Applications of the Analytic Hierarchy Process. New York, NY: Springer.
SADC (2016). Regional Strategic Action Plan on Integrated Water Resources Development and Management Phase IV, RSAP IV. Gaborone: Southern African Development Community (SADC).
Schull, V. Z., Daher, B., Gitau, M. W., Mehan, S., and Flanagan, D. C. (2020). Analyzing FEW nexus modeling tools for water resources decision-making and management applications. Food Bioprod. Proc. 119, 108–124. doi: 10.1016/j.fbp.2019.10.011
Shannak, S. D., Mabrey, D., and Vittorio, M. (2018). Moving from theory to practice in the water–energy–food nexus: an evaluation of existing models and frameworks. Water-Energy Nexus 1, 17–25. doi: 10.1016/j.wen.2018.04.001
Stucki, V., and Smith, M. (2011). Integrated approaches to natural resources management in practice: the catalyzing role of national adaptation programmes for action. Ambio 40, 351–360. doi: 10.1007/s13280-010-0097-1
Taguta, C., Kiala, Z., Bangira, T., Nhamo, L., Senzanje, A., Tafadzwanashe, M., et al. (2022a). iWEF 1, 0. A Web-Based and GIS-Enabled Integrative Water-Energy-Food (WEF) Nexus Analytical Model. Centre for Transformative Agriculture and Food Systems (CTAFS), University of KwaZulu-Natal (UKZN). Available online at: https://iwef.app (accessed December 23, 2022).
Taguta, C., Kiala, Z., Bangira, T., Nhamo, L., Senzanje, A., Tafadzwanashe, M., et al. (2022b). iWEF 1, 0. A Web-Based and GIS-Enabled Integrative Water-Energy-Food (WEF) Nexus Analytical Model: User Manual. Centre for Transformative Agriculture and Food Systems (CTAFS), Pietermaritzburg. Available online at: https://www.iwef.app/static/dashboard/images/manual.pdf (accessed December 23, 2022).
Taguta, C., Senzanje, A., Kiala, Z., Malota, M., and Mabhaudhi, T. (2022c). Water-energy-food nexus tools in theory and practice: a systematic review. Front. Water 4, 837316. doi: 10.3389/frwa.2022.837316
UNESCO (2022). Groundwater: Making the Invisible Visible (The United Nations World Water Development Report 2022). Paris: UNESCO.
Keywords: resilience building, modeling, spatial analysis, sustainable development, resource management
Citation: Taguta C, Nhamo L, Kiala Z, Bangira T, Dirwai TL, Senzanje A, Makurira H, Jewitt GPW, Mpandeli S and Mabhaudhi T (2023) A geospatial web-based integrative analytical tool for the water-energy-food nexus: the iWEF 1.0. Front. Water 5:1305373. doi: 10.3389/frwa.2023.1305373
Received: 01 October 2023; Accepted: 23 November 2023;
Published: 14 December 2023.
Edited by:
Alessandro Pagano, Istituto di Ricerca Sulle Acque IRSA-CNR, ItalyReviewed by:
Bassel Daher, Texas A&M Energy Institute, United StatesChristopher A. Scott, Penn State Berks, United States
Copyright © 2023 Taguta, Nhamo, Kiala, Bangira, Dirwai, Senzanje, Makurira, Jewitt, Mpandeli and Mabhaudhi. This is an open-access article distributed under the terms of the Creative Commons Attribution License (CC BY). The use, distribution or reproduction in other forums is permitted, provided the original author(s) and the copyright owner(s) are credited and that the original publication in this journal is cited, in accordance with accepted academic practice. No use, distribution or reproduction is permitted which does not comply with these terms.
*Correspondence: Cuthbert Taguta, ctaguta@gmail.com; Luxon Nhamo, luxonn@wrc.org.za