 Caleb B. Fogel
 Katherine B. Lininger
- Department of Geography, University of Colorado Boulder, Boulder, CO, United States
Coarse particulate organic matter (CPOM; organic matter 1–100 mm in diameter, excluding small wood) stored in streams provides an important energy source for aquatic ecosystems, and CPOM transport provides downstream energy subsidies and is a pathway for watershed carbon export. However, we lack understanding of the magnitude of and processes influencing CPOM storage and transport in headwater streams. We assessed how geomorphic complexity and hydrologic regime influence CPOM transport and storage in the Colorado Front Range, USA. We compared CPOM transport during snowmelt in a stream reach with high retentive feature (e.g., wood, cobbles, and other features) frequency to a reach with low retentive feature frequency, assessing how within-a-reach geomorphic context influences CPOM transport. We also compared CPOM transport in reaches with differing valley geometry (two confined reaches versus a wide, multi-thread river bead) to assess the influence of geomorphic variations occurring over larger spatial extents. Additionally, we compared CPOM storage in accumulations in reaches (n = 14) with flowing water or dry conditions in late summer and investigated how small pieces of organic matter [e.g., woody CPOM and small wood (>1 min length and 0.05–1 min diameter or 0.5–1 min length and >0.1 min diameter)] influence CPOM storage. We found that within-a-reach retentive feature frequency did not influence CPOM transport. However, valley geometry influenced CPOM transport, with a higher CPOM transport rate (median: 1.53 g min−1) downstream of a confined stream reach and a lower CPOM transport rate (median: 0.13 g min−1) downstream of a low gradient, multi-thread river bead. Additionally, we found that particulate organic carbon (POC) export (0.063 Mg C) in the form of CPOM was substantially lower than dissolved organic carbon (DOC) export (12.3 Mg C) in one of these headwater streams during the 2022 water year. Dry reaches stored a higher volume of CPOM (mean = 29.18 m3 ha−1) compared to reaches with flowing water (15.75 m3 ha−1), and woody CPOM pieces trapped 37% of CPOM accumulations. Our results demonstrate that the influence of geomorphic context on CPOM transport depends on the scale and type of geomorphic complexity, POC may be lower than DOC export in some headwater streams, and small woody organic material is important for trapping CPOM small streams.
1. Introduction
Coarse particulate organic matter (CPOM) is an important component of stream ecosystems (Fisher and Likens, 1973; Vannote et al., 1980) and watershed carbon cycling (Turowski et al., 2016). The composition and origin of CPOM varies, with CPOM particles ranging from autochthonous algal and plant fragments to allochthonous woody material (e.g., very small wood pieces, twigs), leaves, fruits, and coniferous needles and cones (Bunte et al., 2016; Iroumé et al., 2020; Gaillard et al., 2021; Marshall et al., 2021). Here, we define CPOM as organic matter 1–100 mm in diameter that does not meet the criteria of small wood, as defined by Galia et al. (2018). Freshwater ecosystems in headwater streams are highly dependent on stored CPOM as a food and energy source (Fisher and Likens, 1973; Bilby and Likens, 1980; Vannote et al., 1980). In many headwater streams, the majority of CPOM is terrestrial in origin; therefore, CPOM represents an important subsidy of organic matter and carbon to aquatic systems (Wallace et al., 1995; Turowski et al., 2016). The nature of this subsidy depends in part upon the mobility of CPOM particles within the stream network. Riverine CPOM transport provides a major pathway for watershed carbon export (Turowski et al., 2016) and downstream organic matter export (Vannote et al., 1980). However, we lack understanding of the magnitude of and processes influencing CPOM export in headwater streams, particularly across differing hydrologic regimes (e.g., intermittent or ephemeral systems compared to perennial streams) (Bunte et al., 2016; Turowski et al., 2016; Shumilova et al., 2019). In addition, the role of geomorphic complexity, including variations in valley geometry and the frequency of instream retentive features (e.g., wood), in mediating CPOM transport has only rarely been studied [see Jochner et al. (2015), Marshall et al. (2021)]. Here, we investigate how geomorphic and hydrologic setting influence CPOM transport and storage in headwater streams.
The magnitude and frequency of high flow events can determine the likelihood that stored CPOM will be mobilized (Small et al., 2008), but how geomorphic complexity modifies CPOM transport rates during high flow events is unclear. The vast majority of CPOM transport occurs during periods of high flow, particularly on the rising limb of higher flows such as peak snowmelt discharge (Bunte et al., 2016; Gaillard et al., 2021; Marshall et al., 2021). Features associated with CPOM retention (e.g., channel-spanning logjams) may in some cases limit local CPOM transport (Jochner et al., 2015), but among the few studies that exist, some have found that the opposite is true, and that logjams do not influence local CPOM transport (Marshall et al., 2021). In addition, the influence of broader-scale geomorphic context (e.g., valley bottom geometry) on CPOM transport has not yet been investigated. Features that create geomorphic complexity and heterogeneity, such as logjams, are often associated with retention and longitudinal discontinuity (i.e., the reduced downstream transport of water, sediment, and organic matter at the reach scale) (Sear et al., 2010; Wohl and Beckman, 2014; Poeppl et al., 2020). Additionally, river beads, defined as wide, low-gradient sections of rivers (Stanford et al., 1996; Wohl et al., 2018) can attenuate dissolved organic carbon (DOC) transport rates compared to steep, narrow reaches (Wegener et al., 2017), and beads can be sites of enhanced storage of large wood (Wohl and Cadol, 2011; Sutfin et al., 2021) and reduced longitudinal connectivity (Wohl and Beckman, 2014; Wohl et al., 2019a). To our knowledge, no studies have evaluated the effect of river beads on particulate organic carbon (POC) or CPOM transport rates, although a study in the Salmon River, Idaho did find that CPOM travel distance was limited in river beads compared to confined reaches (Bellmore and Baxter, 2014). Further investigation of how geomorphic variation both within a reach (i.e., the frequency of wood, coarse grains, and pools within the stream channel), and between reaches (i.e., river beads versus confined, narrow valley bottoms) influences CPOM transport would be beneficial to understanding longitudinal and lateral CPOM connectivity and disconnectivity across scales.
CPOM storage can increase with increased frequency of features such as large wood (>1 min length and >0.1 min diameter) and small wood (>1 min length and 0.05–1 min diameter or 0.5–1 min length and >0.1 min diameter, defined in Galia et al., 2018), coarse sediment, and low-velocity depositional zones (e.g., backwaters and pools) (Benfield et al., 2000; Lepori et al., 2005; Small et al., 2008; Jochner et al., 2015; Pfeiffer and Wohl, 2018; Bovill et al., 2020). Large and small wood pieces can effectively trap CPOM, and the size of wood pieces can influence the likelihood of long-term retention of CPOM accumulations (Small et al., 2008). However, large wood has historically received much more attention than any other wood size category. Although small wood pieces may be important to CPOM storage (Small et al., 2008), the role of smaller woody material such as woody CPOM pieces (<the dimensions of small wood and > 0.2 min length) in trapping and storing other CPOM particles has not been explored.
Understanding CPOM dynamics is also important for constraining watershed carbon budgets (Turowski et al., 2016). Freshwater systems influence carbon cycling through their ability to transport, export, and store a substantial quantity of terrestrially derived carbon such as CPOM (Vannote et al., 1980; Gomez et al., 2003; Cole et al., 2007; Hilton et al., 2011; Keith et al., 2014). Carbon within freshwater systems can be returned to the atmosphere as CO2 through outgassing or respiration, sequestered in sediments, or transported to oceans (Cole et al., 2007; Wohl et al., 2017; Battin et al., 2023). Estimates indicate that the global export of DOC to the oceans is greater than that of POC (Battin et al., 2008; Wohl et al., 2017), however, POC export may be of greater relative importance in small mountainous streams (Hilton et al., 2008; Turowski et al., 2016; Bright et al., 2020). Several studies have shown that CPOM and large wood can contribute significantly to POC and total organic carbon (OC) export. For example, Seo et al. (2008) found that large wood can account for as much as 36.8% of POC export, and Turowski et al. (2016) found that POC in the form of CPOM and large wood could account for ~36–80% of the total decadal organic carbon (OC) export in some watersheds. Still, data quantifying POC export, and the relative importance of POC versus DOC, in small mountainous rivers, are limited (Goñi et al., 2013; Turowski et al., 2016).
Understanding CPOM processes in small headwater and intermittent or ephemeral streams will be of increasing importance, as climate models project an increase in the number of intermittent streams in headwater regions worldwide (Larned et al., 2010). Small headwater streams comprise a large percentage of the total channel length of river networks (Wohl, 2017; Fritz et al., 2019), and the cumulative effects of small stream processes can exert a substantial influence on overall watershed processes (Vannote et al., 1980). CPOM storage in perennial streams is often spatially concentrated and driven by obstacles that trap and retain CPOM (Benfield et al., 2000; Small et al., 2008; Jochner et al., 2015; Pfeiffer and Wohl, 2018; Bovill et al., 2020). In contrast, although CPOM storage in ephemeral or intermittent streams is likely still driven by retentive features, limited transport capacity during periods of minimal to no flow can result in additional CPOM storage in more spatially extensive mats (Wohl and Scamardo, 2022). Limited streamflow in ephemeral or intermittent streams can also increase the residence time of CPOM stored within stream channels (Fritz et al., 2019; Wohl and Scamardo, 2022), and in turn, impact processes reliant on CPOM transport and storage (e.g., carbon export and ecosystem energy levels).
In this study, we quantify CPOM transport in stream reaches with differing geomorphic complexity to increase our understanding of how geomorphic conditions influence CPOM transport. We also assess CPOM storage in reaches that become dry and reaches with flowing water. We address three primary questions related to CPOM transport and storage in small headwater streams. First, what is the relative magnitude of POC export compared to DOC export in headwater streams (Q1)? Second, how do geomorphic characteristics (i.e., within-a-reach retentive feature frequency and valley context) impact CPOM transport rates (Figure 1) (Q2)? We hypothesize that reaches with high within-a-reach retentive feature frequency (e.g., a high abundance of wood within the stream) will have greater CPOM transport rates at the upstream end compared to the downstream end due to within-reach trapping during transport (Figure 1B), and that reaches with lower densities of retentive features will have more longitudinally homogenous CPOM transport rates (Figure 1A) (H2a). Additionally, we hypothesize that CPOM transport rates downstream of wide valley bottom reaches with abundant lateral connectivity (i.e., river beads) will be lower than CPOM transport rates downstream of more confined reaches (H2b) (Figure 1C), assessing the influence of longitudinal variation in valley geometry across a larger spatial extent on CPOM transport. Finally, what factors (e.g., presence and frequency of retentive features, stream flow conditions, and other geomorphic and forest stand characteristics) influence CPOM storage (Q3)? We expect that reaches with higher retentive feature frequency will have higher CPOM storage (H3a). Additionally, we expect that wood, especially small wood and woody CPOM, will store more CPOM than any other type of retentive feature (H3b). Given the importance of both CPOM transport and storage to ecosystem functioning and carbon storage and export, understanding CPOM transport and storage within streams allows for more effective management of aquatic ecosystem functioning and better constraints on watershed carbon budgets. In addition, studies of CPOM under varying hydrological conditions, including intermittent streams, will inform scientists and watershed managers on how CPOM dynamics in small headwater streams may evolve in a changing climate.
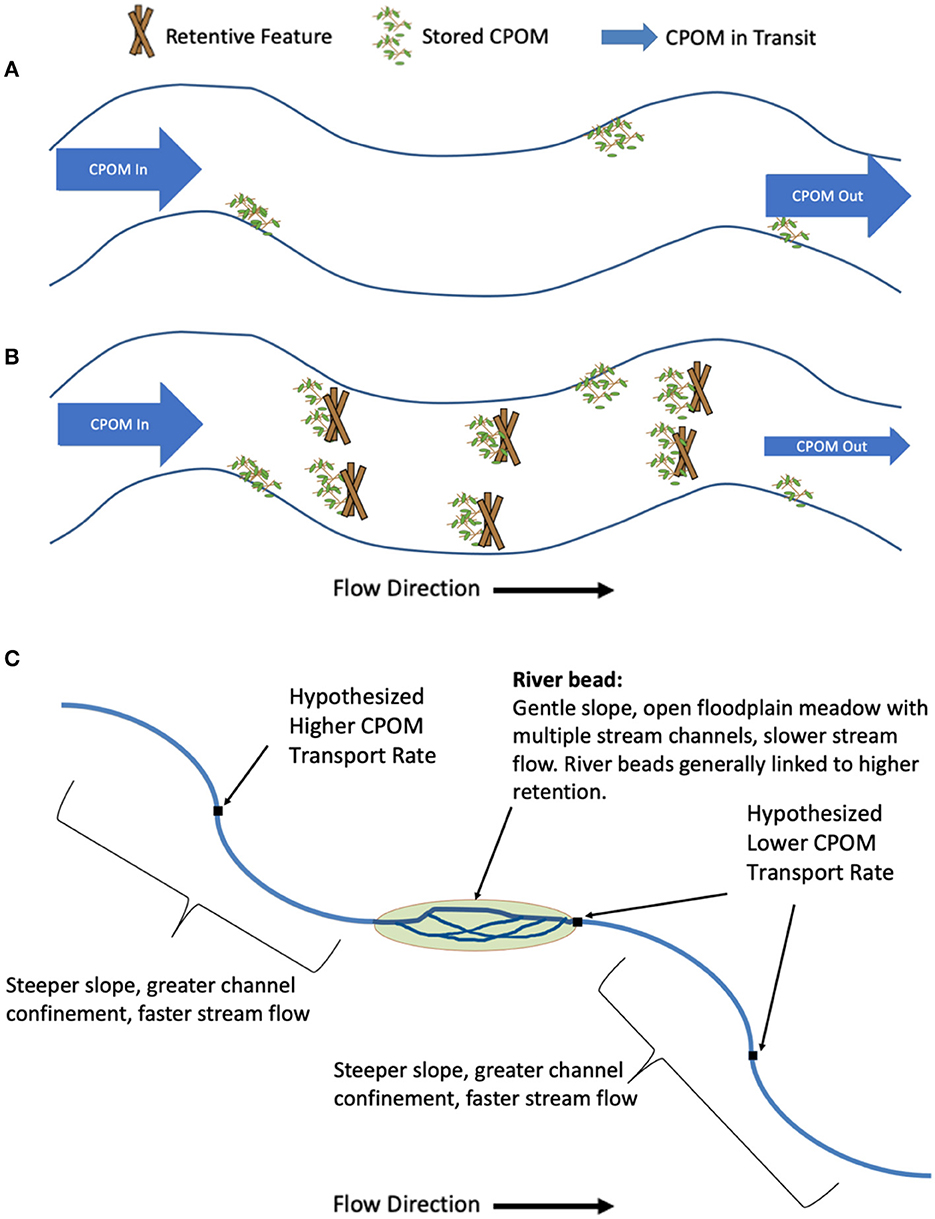
Figure 1. Conceptual model of H2a in reaches with (A) low and (B) high retentive feature frequency, indicating expected lower CPOM transport rate at the downstream end of (A) due to within reach trapping. CPOM arrow size shows predicted CPOM transport rate relative magnitude. (C) Conceptual model of H2b, indicated expected reduction in CPOM transport rate due to between reach differences in valley geometry (e.g., the presence of a river bead).
2. Methods
2.1. Study area
We conducted our study in Gordon Gulch and Como Creek, two headwater streams within the Boulder Creek Watershed on the eastern slope of the Colorado Front Range Mountains, USA (Figure 2). Particular attention has been paid to critical zone processes in both watersheds in recent years [e.g., Anderson et al. (2011, 2014, 2021), Hinckley et al. (2014), Dethier et al. (2022)]; however, studies of CPOM dynamics at these sites have not been conducted.
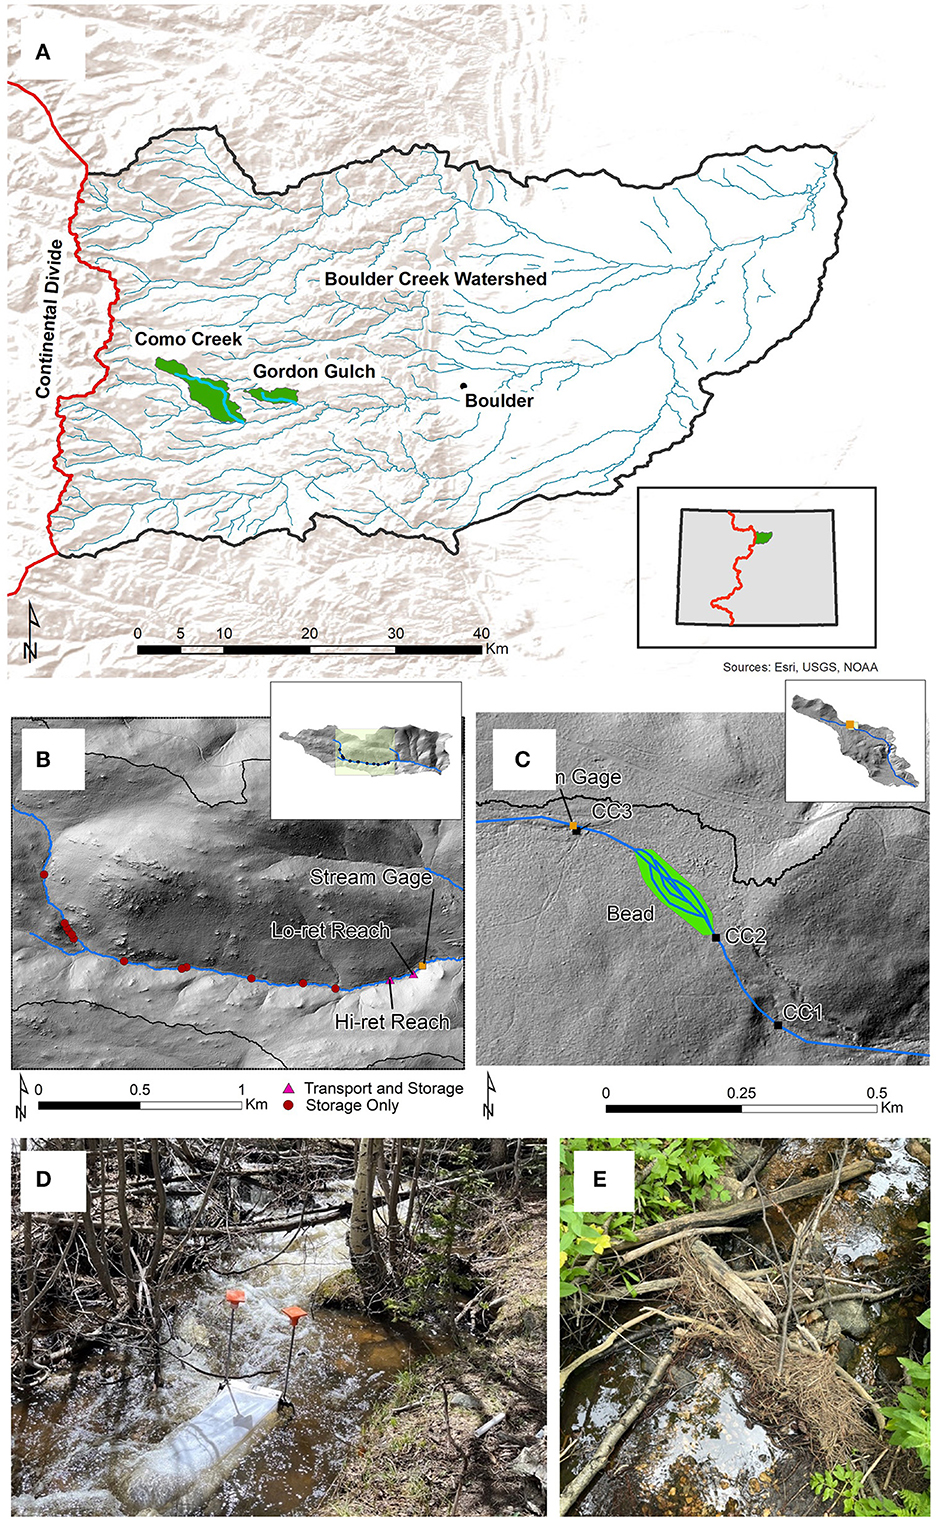
Figure 2. (A) Boulder Creek Watershed, Colorado, USA. Study watersheds highlighted in green. Inset in (A) shows the location of Boulder Creek Watershed (green) within the state of Colorado (gray). (B) Gordon Gulch study reaches. Hi-ret reach is a reach with a high frequency of instream retentive features, and Lo-ret is a reach with a lower frequency of instream retentive features. (C) Como Creek study reaches and river bead. Inset maps in (B) and (C) show locations of study reaches within each watershed. Green rectangles show the extent of sampling locations within each watershed. In (B), reaches where both CPOM transport and storage were measured are indicated with triangles, and reaches where only storage was measured are indicated with circles. (D) CPOM transport sampling at CC1. (E) CPOM storage in an accumulation in Gordon Gulch.
Gordon Gulch (Figure 2B) drains ~2.6 km2 within the montane elevational zone (~1,707–2,896 m) and ranges 2,440–2,730 min elevation. Winter (December-March) snow cover is intermittent, with higher quantities of persistent snow residing on north-facing slopes (Anderson et al., 2014). Peak snowmelt and discharge both typically occur between April and June, and peak rainfall occurs throughout the spring (March-June) and summer (June-September) (Anderson et al., 2014; Anderson and Ragar, 2021; Barnard et al., 2023). Streamflow is perennial throughout much of the basin, however, portions of Gordon Gulch are characterized by intermittent flow during summer. Vegetation in Gordon Gulch is comprised of a mixed pine forest with dense cover of lodgepole pines (Pinus contorta) on the north-facing slopes and an open ponderosa pine (Pinus ponderosa) canopy on the south-facing slopes (Adams et al., 2014; Anderson et al., 2014). Broadleaf deciduous tree species such as aspen (Populus tremuloides), alder (Alnus spp.), and willow (Salix spp.) also grow near the stream channel.
Como Creek (Figure 2C) spans the subalpine (~2,743–3,353 m) and alpine (>~3353 m) elevational zones, ranging from ~3,000 to nearly 4,000 min elevation, and drains ~4.9 km2. Persistent snow cover is present from October to June, and peak streamflow driven by snowmelt occurs in late spring to early summer (May-June) [National Ecological Observatory Network (NEON), 2022]. Streamflow declines sharply in the late summer and remains low throughout the winter. Forests within the Como Creek watershed are dominated by mixed conifers including lodgepole and limber pines (Pinus flexilis), subalpine fir (Abies lasiocarpa) and Engelmann spruce (Picea engelmannii), although broadleaf deciduous species such as aspen are also present.
2.2. Field data collection
We identified 14 study reaches at Gordon Gulch: two in which we measured CPOM transport and storage, and 12 in which we measured CPOM storage only. We selected the two CPOM transport and storage study reaches based on their proximity to the lower stream gage at Gordon Gulch (Figure 2B), as well as the number of wood pieces or accumulations and pools documented in each reach during an initial survey. The high retentive feature (Hi-ret) reach (65 m length) had a higher frequency of retentive features than the low retentive feature (Lo-ret) reach (23 m length) (Figure 2B), allowing us to test the hypothesis that within-a-reach retentive feature density would influence CPOM transport. We randomly selected the 12 additional reaches for storage measurement only (GG1-GG12) (Figure 2B) after stratifying potential reaches by stream slope (low slope/high slope), channel type (single-/multi-threaded), and late summer flow conditions (flowing water versus dry) through a combination of geospatial analysis of a digital elevation model and field investigations. Given that we only sampled one field season, we categorized flow conditions as either dry or flowing water because we did not continuously monitor flow conditions over multiple years to determine whether reaches were consistently perennial or intermittent over longer time periods. The stratified random sampling approach ensured that a mix of different slope, channel type, and streamflow categories were included.
At Como Creek, we identified three reaches in which we measured CPOM transport; we did not measure CPOM storage at Como Creek. We selected the three reaches based on their proximity to a river bead ~150 m long (Figure 2C). These reaches were located 190 m downstream (CC1; 27 m length), immediately downstream (CC2; 21 m length), and 90 m upstream (CC3; 38 m length) of the river bead (Figure 2C), allowing us to test the hypothesis that valley geometry influences CPOM transport. There are no tributary additions of discharge between the study reaches on Como Creek and the Como Creek discharge gage just upstream of CC3 (Figure 2C).
We surveyed geomorphic and forest stand characteristics along transects perpendicular to the stream at each study reach. We measured bankfull and valley bottom width (m) and stream slope (%) using a laser rangefinder (TruPulse 360), canopy density (%) using a densiometer, basal area (m ha−1) using a Panama angle gage, and median (D50) and 84th percentile (D84) grain size (mm) through Wolman pebble counts (Wolman, 1954). The number of transects (3 to 5) varied by reach depending on reach length. Reach lengths differed so that the geomorphic context did not vary significantly within a reach (e.g., slope was relatively consistent and reaches did not contain both single and multi-threaded channels). In multithreaded reaches, we averaged measurements of bankfull width across the multiple threads. Additionally, we measured retentive feature frequency (number of retentive features per m) in Gordon Gulch. Retentive features included wood pieces and accumulations, woody CPOM pieces, coarse grains protruding above the water's surface, live vegetation, pools, stream banks and bars, and low velocity zones. We surveyed woody organic material within each study reach, and categorized pieces as large wood (>1 min length and > 0.1 min diameter) (Ruiz-Villanueva et al., 2016; Wohl et al., 2019b); small wood (>1 min length and 0.05–0.1 min diameter or 0.5–1 min length and > 0.1 min diameter, from Galia et al. (2018); woody CPOM (<the dimensions of small wood and > 0.2 min length); and small woody CPOM (twigs) (<0.2 min length) (Figure 3). We used existing classifications for large and small wood to align with previous studies, and added two new categories, woody CPOM and small woody CPOM, to assess the influence of smaller woody material on CPOM dynamics. We measured the dimensions (length, diameter) of all large, small, and woody CPOM pieces, but did not measure the dimensions of small woody CPOM.
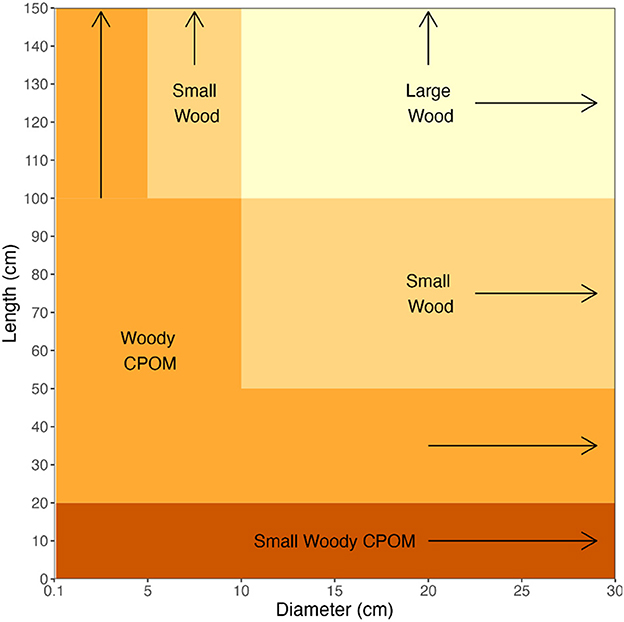
Figure 3. Diagram of woody organic material size classes used, including large wood (>1 min length and > 0.1 min diameter), small wood (>1 min length and 0.05-0.1 min diameter or 0.5-1 min length and > 0.1 min diameter), woody CPOM (<the dimensions of small wood and > 0.2 min length); and small woody CPOM (<0.2 min length).
We measured CPOM transport at the Gordon Gulch Lo-ret and Hi-ret reaches and the Como Creek reaches using modified bedload samplers [see Bunte et al. (2007, 2016), Turowski et al. (2013, 2016), Iroumé et al. (2020)] consisting of a 1 mm diameter mesh net, with an opening ~30 × 20 cm, held in place by a metal box (Bunte et al., 2007) (Figure 2D). Although previous studies have used larger mesh (3.4–6 mm diameter) to avoid CPOM clogging the mesh (Bunte et al., 2016; Turowski et al., 2016), we chose to use a 1 mm diameter mesh because CPOM particles transported in our study reaches were often smaller than 3.4 mm and would have been missed by a larger diameter mesh. On the rare occasions when we anticipated CPOM transport could be high enough to clog the netting, we used a shorter sampling period to avoid clogging. We did not notice a ballooning of the net from water flowing through the mesh during our sampling (Bunte et al., 2015), and thus the small diameter mesh size likely did not bias our measured sampling rates. We deployed the bedload samplers on the streambed for periods ranging from ~15 mins to one hour depending on streamflow. Although previous studies have deployed multiple bedload traps at once per reach (Bunte et al., 2016), we deployed a single trap at each reach during each sampling period due to the smaller wetted widths of the stream channels. We placed each bedload trap in the thalweg of the stream; therefore, our estimates of CPOM transport rates that take into account the entire width of the stream (see section 2.3) may represent a maximum CPOM transport rate for each stream. We intentionally placed traps in a straight portion of each reach that was absent of immediately adjacent retentive features (e.g., wood, pools, etc.) to limit bias introduced by differences in trap placement across sites. We separated CPOM from any inorganic sediment collected in the traps in the field; inorganic sediment was minimal. We used stream discharge measurements collected immediately downstream of the Lo-ret reach at Gordon Gulch (Figure 2B) (Barnard et al., 2023) and upstream of CC3 at Como Creek (Figure 2C) [National Ecological Observatory Network (NEON), 2022] to relate stream flow to CPOM transport rate. We did not sample CPOM transport rate overnight in either stream because after assessing discharge trends at each site, we found relatively little 24-h variability in flow. In addition, other studies have found that the diurnal cycle does not significantly impact CPOM transport (Marshall et al., 2021).
To assess how reach-level variations in retentive feature frequency influenced CPOM transport, we measured CPOM transport at the upstream and downstream ends of the Gordon Gulch Hi-ret and Lo-ret reaches. We proceeded from downstream to upstream when sampling CPOM transport so as not to impact downstream transport measurements. We measured CPOM transport at Gordon Gulch 1–2 times per week between late April and mid-July. After mid-July, stream flow was low, and we visually observed little to no CPOM transport. Although late summer CPOM transport may have been elevated during potential higher flow periods during summer storms, we did not survey CPOM transport during and following summer storms at Gordon Gulch. However, analysis of the measured discharge during storms confirmed that snowmelt was the highest discharge for the 2022 water year (defined as October 1 through September 30) that we sampled.
To assess how variations in valley bottom geometry (i.e., a river bead) influenced CPOM transport, we collected CPOM at the downstream end of each reach at Como Creek ~1–2 times per week between mid-May and mid-July 2022. We sampled CC1 first, and proceeded upstream to avoid impacting CPOM transport sampling downstream of a given sampling location. During high flows, we stacked two bedload samplers to sample the entire water column.
To investigate the controls on CPOM storage, we estimated CPOM storage within the bankfull channel of all 14 study reaches at Gordon Gulch under low-flow conditions following peak flow (early August). We measured the surface area (m2) and thickness (m) of each CPOM accumulation, and used visual porosity estimates (%) (Livers et al., 2020) to calculate the CPOM volume of each accumulation, taking into account pore spaces present in most CPOM accumulations. We took samples of a known volume at approximately every tenth accumulation, which we used to estimate the bulk density of CPOM accumulations. We then burned seven samples at 550°C for 8 h to estimate ash free dry mass (AFDM) of CPOM samples, calculated the AFDM per volume for each sample, and converted CPOM volume to CPOM mass using the mean of the AFDM samples. Because the AFDM of samples did not vary significantly by CPOM composition, we applied a mean conversion of all samples to determine AFDM in g m−2. We report results in CPOM volume per ha, but use the AFDM conversion to compare to other studies of CPOM storage. For each accumulation, we noted the mechanisms responsible for retaining the accumulation and the primary composition of the CPOM stored (i.e., leaves, needles, cones, etc.). Retention mechanisms, or features which may induce CPOM storage over time (Bovill et al., 2020), were categorized as wood (large and small), woody CPOM, small woody CPOM (see Figure 3), coarse sediment, pools, live vegetation, and other, a category that included CPOM trapped by areas of low velocity or flow or stream banks. We used the CPOM storage measurements to assess the influence of reach-scale retentive feature frequency and wood and woody CPOM frequency on CPOM storage.
2.3. Data and laboratory analysis
To provide context for the hydrologic conditions during the 2022 water year, we compared streamflow magnitude during the 2022 water year to previous years using 10 years of discharge data from Gordon Gulch (2012–2019 and 2021–2022) (Anderson and Ragar, 2021; Barnard et al., 2023), and 6 years of discharge data from Como Creek (2017–2022) [National Ecological Observatory Network (NEON), 2022]. Discharge data were available at 10 min intervals from a gage just downstream of the Lo-ret reach at Gordon Gulch (Barnard et al., 2023), and at 1 min intervals from a gage just upstream of CC3 at Como Creek [National Ecological Observatory Network (NEON), 2022]. We filled two data gaps in the 2022 Como Creek discharge dataset using stage-discharge relationships and water surface elevation datasets from two locations at Como Creek prior to our analysis (See Supplementary material S1). To determine the mass of CPOM transported during each sampling interval, we then dried the CPOM samples collected in the field at 105°C for 24 h and measured the dry mass. We used the following equation from Bunte et al. (2007), which accounts for the fact that the bedload samplers do not cover the entire stream channel, to calculate the CPOM transport rate for a given sampling period:
where m is the CPOM dry mass from a given sampling period, wc is the stream channel width, ws is the width of the bedload sampler, and t is the sampling duration.
We developed rating curves for CPOM transport in relation to discharge at each reach by fitting a linear regression in log-transformed space, regressing log-transformed CPOM transport rate (g min−1) against log-transformed discharge data at the time of sampling at each reach. The relationship was then explained by a power function. Given the relatively short reach lengths at Gordon Gulch, we developed reach-level rating curves for Hi-ret (65 m) ~ and Lo-ret (23 m) by including the upstream and downstream CPOM transport measurements for Hi-ret to create the Hi-ret rating curve, and the upstream and downstream transport measurements for Lo-ret to create the Lo-ret rating curve. We estimated the annual CPOM yield (kg yr−1) at each site for the 2022 water year using the rating curve developed for each site. We then applied the same rating curve to discharge data from previous years to estimate CPOM yield over multiple years (n = 10 at Gordon Gulch; n = 6 at Como Creek). To assess the relative contributions of POC and DOC to total carbon export in headwater streams, we compared DOC concentration data collected at Como Creek [National Ecological Observatory Network (NEON), 2023] with our CPOM export results from CC3. DOC data were collected near the upstream end of CC3. We converted CPOM mass export to OC mass export using a conversion factor of 50% (Intergovernmental Panel on Climate Change, 2006; Turowski et al., 2016), assuming that approximately half the mass of CPOM is OC.
We compared CPOM transport rates at the upstream and downstream ends of both transport reaches at Gordon Gulch to determine whether within-a-reach geomorphic context influences CPOM transport rate, and tested for statistical significance of differences between upstream and downstream transport rates using paired Wilcoxon rank sum tests. Additionally, we compared CPOM transport rates across study reaches at Como Creek to determine whether valley context influences CPOM transport rate.
We performed statistical analyses in R (R Core Team, 2022) to identify relationships between CPOM load (m3 ha−1) and frequency (# m−1) and reach-level geomorphic and forest stand characteristics. First, we performed Wilcoxon rank sum tests to assess differences in CPOM load and frequency between reaches classified as dry versus flowing in late summer, and single versus multi-thread. We also performed multiple linear regression analyses, using a model selection approach, to assess controls on CPOM load and frequency, using numeric geomorphic and forest stand characteristics as potential predictor variables. To begin, we assessed correlations between response and potential predictor variables and multicollinearity of potential predictor variables using the Kendall's tau and removed any strongly correlated variables (τ> 0.8) from our multiple linear regression analysis. Additionally, we performed Variance Inflation Factor (VIF) tests in R, sequentially removing the variable with the highest VIF value until all values were less than 10 (Craney and Surles, 2002; Thompson et al., 2017). Following correlation and VIF tests, potential predictor variables for the CPOM load model included stream slope (%), basal area (m2 ha−1), canopy density (%), bankfull width (m), pool area (m2), wood load (including large and small wood; m3 per ha), and retentive feature frequency (# per m). Retentive feature frequency includes the number per meter of large and small wood, woody CPOM, small woody CPOM, coarse sediment, and pools. Potential predictor variables for the CPOM frequency model included slope, basal area, canopy density, bankfull width, pool frequency (# per meter), number of wood pieces or jams (including large and small wood; # per m), wood load, and retentive feature frequency. We then conducted all-subsets regression with potential predictor variables using the dredge function from the MuMIn package in R (Bartoń, 2022). We considered all models within a two-unit range of the lowest AICc (Akaike Information Criterion corrected for small sample sizes) (Wagenmakers and Farrell, 2004), and chose a top model for each response variable as the model with the lowest AICc with the fewest number of predictor variables. We also ranked the importance of model predictor variables by summing the Akaike weights (Wagenmakers and Farrell, 2004). We checked the residuals of all models for homoscedasticity and normality to ensure the models met model assumptions. We compared p values to a significance level of α = 0.05 and report p values less than α = 0.10 to assess weaker patterns and trends in the data.
3. Results
3.1. Geomorphic and forest stand characteristics of study reaches
Retentive feature frequency at Gordon Gulch study reaches ranged from 1.80 features per min GG8 to 4.29 features per min GG11 (Table 1). The frequency of wood pieces or accumulations ranged from 0.26 per min GG7 to 1.54 in GG9. Retentive feature frequencies between the Hi-ret and Lo-ret site differed by 0.12 features per m (1.91 in Lo-ret, 2.03 in Hi-ret), whereas the frequency of wood pieces or accumulations differed by 0.55 pieces per m between the two reaches (0.35 in Lo-ret, 0.89 in Hi-ret). Small wood, woody CPOM, and small woody CPOM were more common than large wood across all study reaches at both Gordon Gulch and Como Creek. Stream slope, bankfull width, and channel type varied across the three study reaches at Como Creek (Table 1). CC1 and CC3 contained slightly wider, single channels, whereas CC2 was multi-threaded with multiple narrow channels and a lower slope. At CC2, lateral connectivity between the stream channel and floodplain was apparent, as areas of the floodplain were saturated, in contrast to CC1 and CC3.
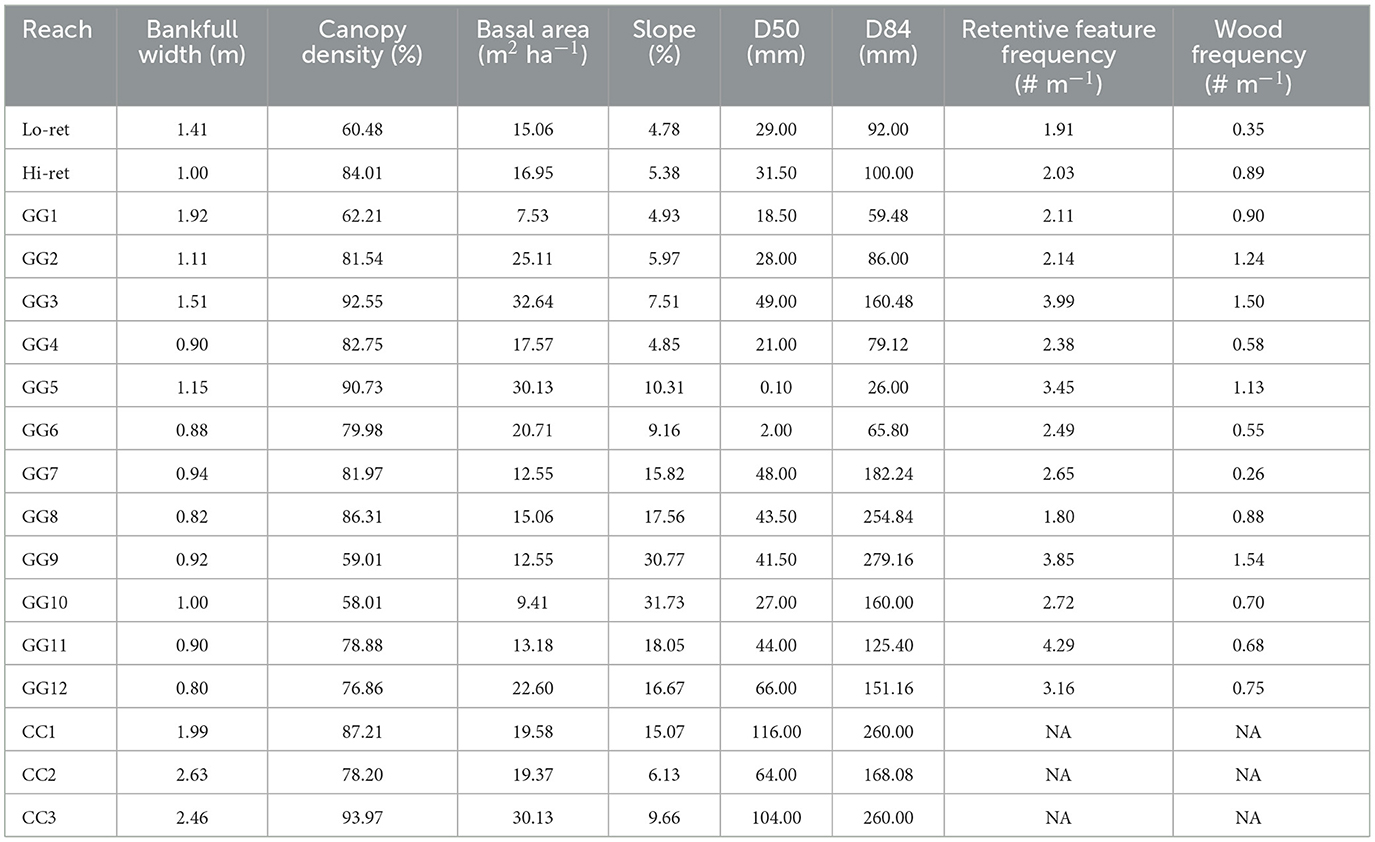
Table 1. Geomorphic and forest stand characteristics of study reaches.
3.2. CPOM transport during snowmelt: transport rate-discharge rating curve and annual CPOM yield
Peak discharge for the 2022 water year at Gordon Gulch was 31.90 liters per second (l s−1) and occurred on May 31. The highest peak annual flow over the 10-year discharge record at Gordon Gulch was 117.02 l s−1 on May 8, 2021, whereas the lowest peak annual flow was 19.07 l s−1 on April 25, 2018, and the mean peak annual flow was 42.82 l s−1. The Gordon Gulch discharge record excludes an extreme rainfall event that occurred across the Colorado Front Range in September 2013 (Gochis et al., 2015), causing significant flooding. Although discharge during the September 2013 flood exceeded the 117.02 l s−1 recorded in 2021, the gage at Gordon Gulch was lost during the flood; therefore, discharge data are unavailable for this period (Anderson and Ragar, 2021). Peak annual discharge at Gordon Gulch occurred during snowmelt rather summer convective storms in water year 2022 and for every water year on record except for 2012 and 2013.
Peak discharge for the 2022 water year at Como Creek was 405.14 l s−1 and occurred on June 12. The highest peak annual flow during the 6 years of discharge sampling at Como Creek was 1792.71 l s−1 on June 10, 2017, whereas the lowest peak annual flow was 357.26 l s−1 on June 18, 2018. The mean peak annual flow over the 6-year period of discharge sampling was 743.42 l s−1. Peak annual discharge in water year 2022 and for each water year on record occurred during snowmelt.
CPOM transport rate (g min−1) was highest on the rising limb at all sampling locations, and both CPOM transport rate and stream discharge were considerably higher at Como Creek than at Gordon Gulch during our study (Figure 4). Exceptionally high CPOM transport occurred at Como Creek CC3 on June 6, 2022, prior to peak flow (Figure 4E). Hysteresis of CPOM transport rate (higher on the rising limb compared to the same discharge on the falling limb) was evident at Lo-ret, CC1, and CC3 (Figure 5), and less evident at Hi-ret and CC2 (See Supplementary material S2), but the relatively low CPOM transport rate at Hi-ret may have resulted in an inability to detect hysteresis.
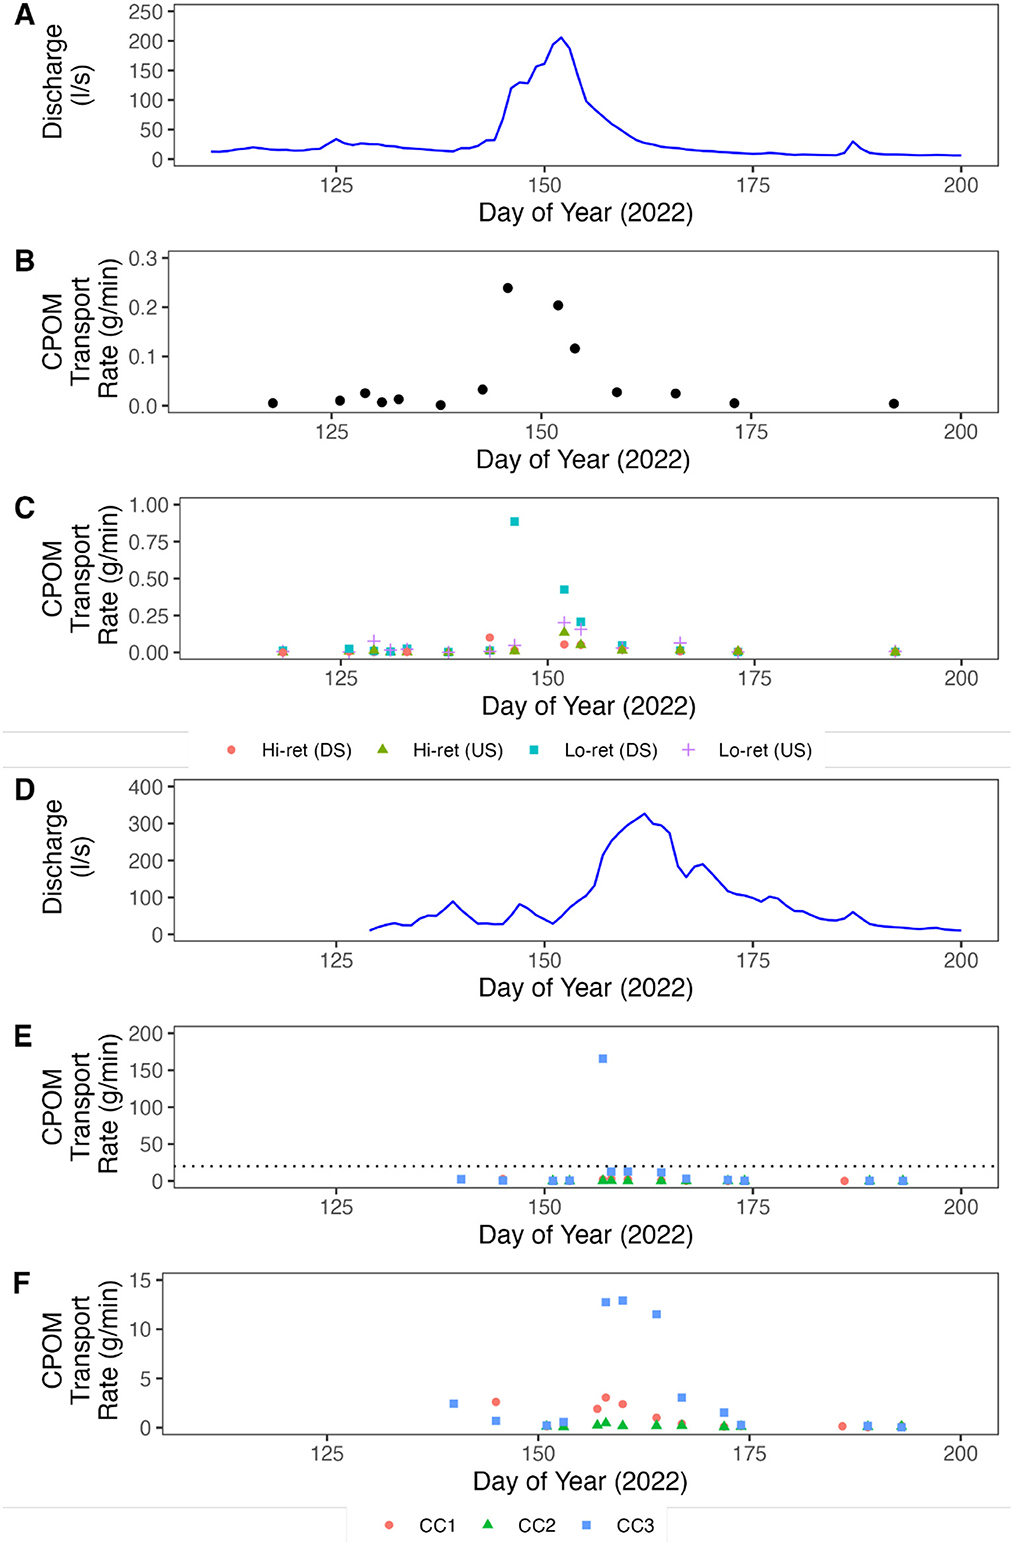
Figure 4. CPOM transport under varying flow conditions. (A) Mean daily discharge at Gordon Gulch. (B) CPOM transport rates for Gordon Gulch. Points represent the mean transport rate across all four locations (upstream and downstream for Lo-ret and Hi-ret) for a given day. (C) CPOM transport rates for Gordon Gulch showing measurements at individual sampling locations. (D) Mean daily discharge at Como Creek. (E) CPOM transport rates for Como Creek. Dotted line indicates y-axis limit for subsequent plot (F). (F) CPOM transport rates for Como Creek with the high measurement at CC3 on day 157 removed to highlight lower magnitude trends during peak flow period.
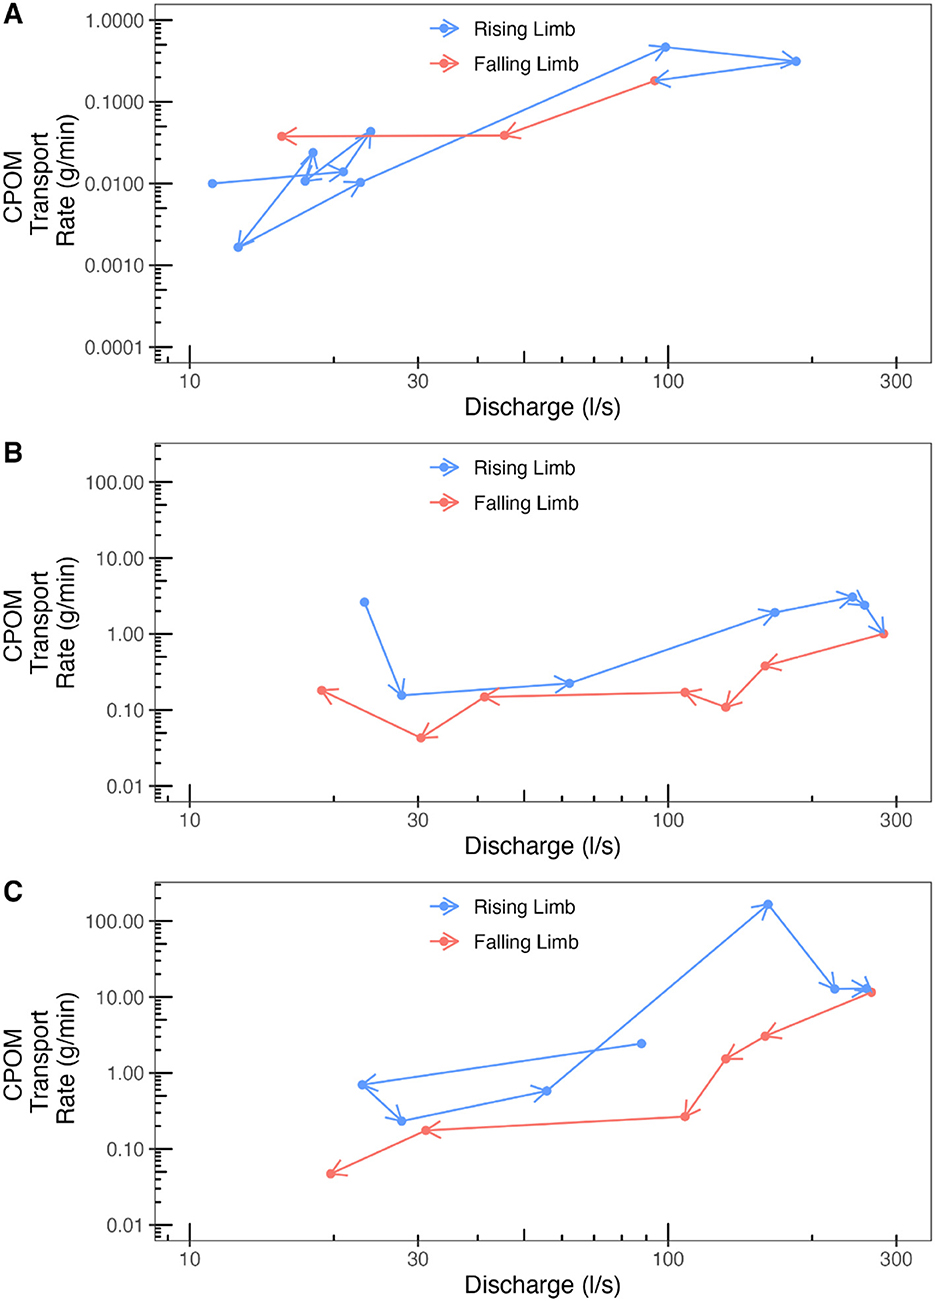
Figure 5. CPOM transport rate-discharge relationship through time, demonstrating hysteresis, at (A) Lo-ret reach, (B) CC1, and (C) CC3. Arrows show the forward progression of time. Axes are on a log scale. Note different y-axis scales for Gordon Gulch and Como Creek study reaches.
We found statistically significant power law rating curves between CPOM transport rate and stream discharge on both the rising and falling limbs in the Lo-ret, Hi-ret and CC3 reaches (Figure 6). Given the relatively short lengths of the Hi-ret and Lo-ret reaches, and the small difference in transport rate between the upstream and downstream ends of the two reaches (see section 3.3 below), we included CPOM transport rate data points from both the upstream and downstream sampling locations within each reach to develop reach-level rating curves for Gordon Gulch (Figures 6A, B). We were unable to develop statistically significant rating curves between CPOM transport rate and discharge at several of the four Gordon Gulch sampling locations (See Supplementary material S2) and at both CC1 and CC2, the two sites located downstream of the river bead at Como Creek (See Supplementary material S2).
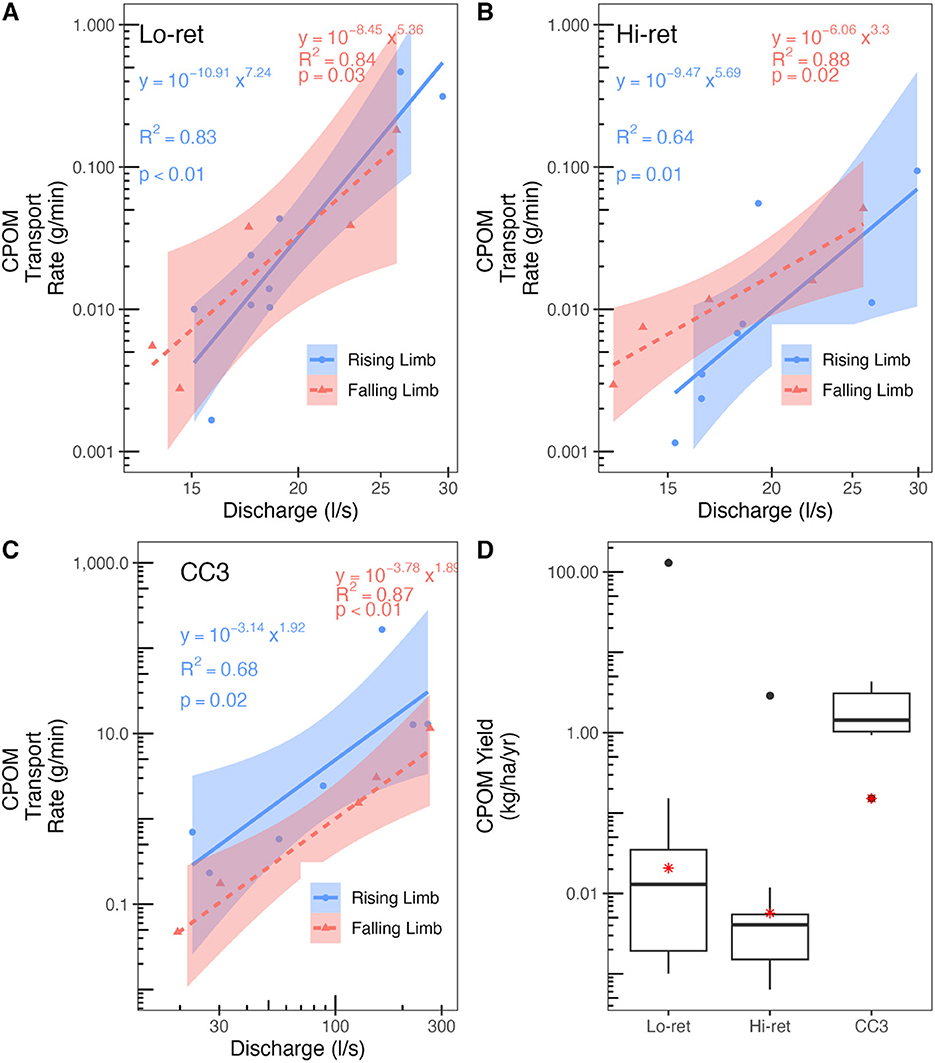
Figure 6. Power law rating curves for CPOM transport vs discharge at (A) Lo-ret (exponent β = 7.24 ± 1.25 on rising limb; β = 5.36 ± 1.37 on falling limb) (± standard error), (B) Hi-ret (β = 5.69 ± 1.63 on rising limb; β = 3.30 ± 0.70 on falling limb), and (C) CC3 (β = 1.92 ± 0.59 on rising limb; β = 1.89 ± 0.36 on falling limb). Axes are on a log scale. Shaded area in panels A, B, and C shows 95% confidence interval. (D) Range in annual CPOM yield over 10-year period in Gordon Gulch (Lo-ret, Hi-ret), and 6-year period in Como Creek (CC3). Red stars represent CPOM yields during the 2022 water year, the solid line within the box represents the median value, the top and bottom of the box represent the upper and lower quartiles respectively, and the whiskers show the 10th and 90th percentiles. The y-axis is on a log scale.
We used the rating curves shown in Figure 6 and discharge data for both Gordon Gulch and Como Creek to calculate the annual CPOM yield (kg ha−1 yr−1) at Lo-ret, Hi-ret, and CC3 (Figure 6D). The annual CPOM yield for the 2022 water year was 2.07 × 10⁻² at Lo-ret, and 5.69 × 10⁻³ kg ha−1 yr−1 at Hi-ret. The mean annual yield at Lo-ret calculated using 10 years of discharge data and our CPOM-discharge rating curve was 13.00 kg ha−1 yr−1 (median = 0.013 kg ha−1 yr−1). In Hi-ret, the mean annual yield over that same 10-year time period was 0.29 kg ha−1 yr−1 (median = 0.004 kg ha−1 yr−1). The annual CPOM yield for the 2022 water year at CC3 was 0.15 kg ha−1 yr−1. The mean annual yield calculated using 6 years of discharge data and our CPOM-discharge rating curve for Como Creek was 2.04 kg ha−1 yr−1 (median = 1.43 kg ha−1 yr−1) (Figure 6D). For Como Creek, DOC export over the 2022 water year at CC3 was 12.3 Mg C, whereas POC export from CPOM over the same time period was 0.063 Mg C.
3.3. Geomorphic controls on CPOM transport
CPOM transport rate at Gordon Gulch was generally slightly higher in Lo-ret compared to Hi-ret during the summer 2022 sampling period (Figure 4). Mean CPOM transport rate over the entire summer was highest at the upstream end of Lo-ret (0.12 g min−1), followed by the downstream end of Lo-ret (0.05 g min−1), the downstream end of Hi-ret (0.02 g min−1), and finally, the upstream end of Hi-ret (0.02 g min−1). However, there was no significant difference between upstream and downstream sampling locations for either Hi-ret (p = 0.22) or Lo-ret (p = 0.76) when comparing measurements taken on the same sampling date (Figure 7). Como Creek CPOM transport rate was highest at CC3 and lowest at CC2 on the vast majority of our sampling dates (Figures 4E, F). Differences in CPOM transport rate between sampling locations at Como Creek were most apparent at higher flows between June 6 and June 21 (Figures 4E, F). During this time, CPOM transport rates at CC3, the most upstream site, were 14.5–694.8 times that of CC2 (just downstream of the bead), and 4.2–86.5 times that of CC1 (furthest downstream).
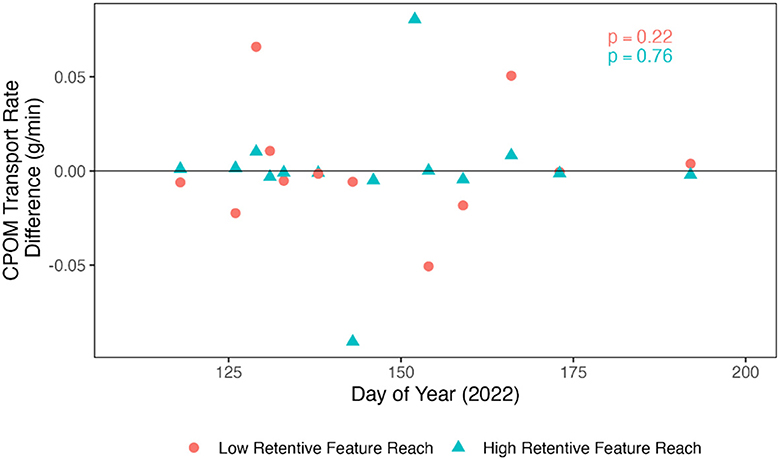
Figure 7. Difference in CPOM transport rate at the upstream versus downstream end of each reach at Gordon Gulch (Lo-ret and Hi-ret) on each sampling date. P-values were calculated using the paired Wilcoxon rank sum test to determine whether upstream transport rate was significantly different than downstream transport rate (paired by sampling date) at each reach.
3.4. Controls on CPOM storage at Gordon Gulch
CPOM load was higher in dry (n = 5) reaches compared to those with flowing water (n = 9) (p= 0.08; Figure 8B), but there was no difference in CPOM accumulation frequency when comparing dry and flowing water reaches (p = 0.52; Figure 8D). Similarly, there was no difference between multi-thread and single thread reaches in CPOM load (p = 0.17; Figure 8A) or frequency (p = 0.37; Figure 8C), although the sample size for multi-thread reaches was extremely small (n = 3). Converting volume per area of CPOM accumulations to mass per area, reach-level AFDM at Gordon Gulch ranged from 2.40 to 9.23 g m−2, with a mean of 5.55 g m−2.
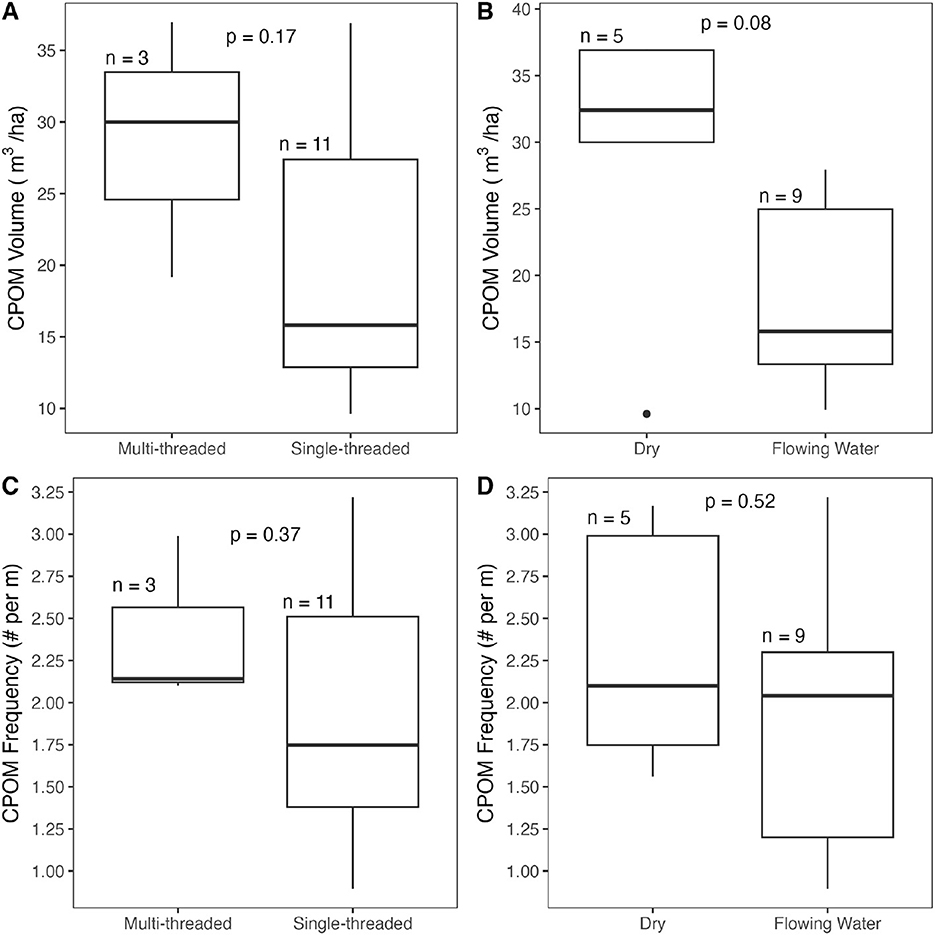
Figure 8. Plots of CPOM load and frequency at Gordon Gulch, including (A) CPOM volume per hectare in single- and multi-threaded reaches, (B) CPOM volume per hectare in dry reaches and reaches with flowing water, (C) CPOM accumulations per meter in single- and multi-threaded reaches, and (D) CPOM accumulations per meter in dry reaches and reaches with flowing water. The solid line within the box represents the median value, the top and bottom of the box represent the upper and lower quartiles respectively, and the whiskers show the 10th and 90th percentiles.
The selected models of CPOM load (volume per area) and CPOM frequency (number of accumulations per m), chosen as the models with the lowest AICc value and fewest predictor variables, are shown in Table 2. The model of CPOM load included bankfull width as the only predictor variable (Figure 9A, Table 2), whereas the model of CPOM accumulation frequency included retentive feature frequency as the only predictor variable (Figure 9B, Table 2). Additional models with AICc within two units of the lowest AICc value are presented in Supplementary material S3 and Table 2 also shows the three variables with the highest relative ranked importance across all models using the sum of the Akaike weights, indicating that bankfull width is an important variable for CPOM load and that retentive feature frequency is an important variable for CPOM frequency. We found a significant positive correlation between CPOM accumulation frequency and retentive feature frequency (τ = 0.80, p < 0.001) (Figure 9B), but no other variables were significantly correlated with either CPOM load or CPOM accumulation frequency (Figures 9C–F). Additional correlations between all variables are provided in Supplementary material S4.
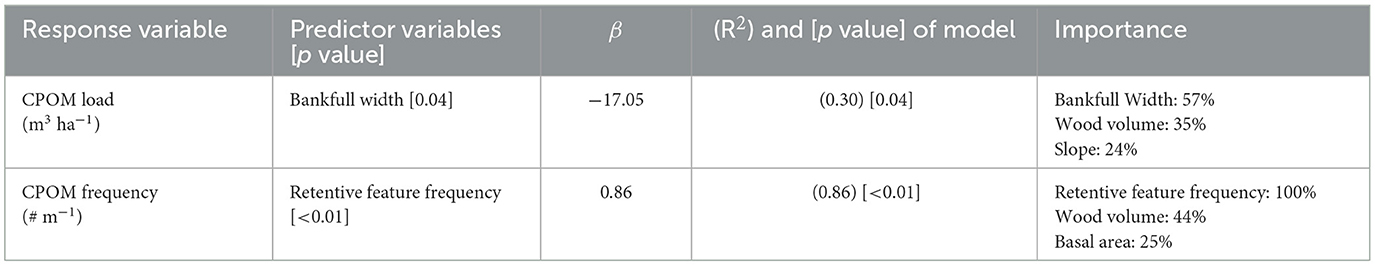
Table 2. Top model for CPOM load and frequency, chosen as the model with the lowest AICc and fewest predictor variables.
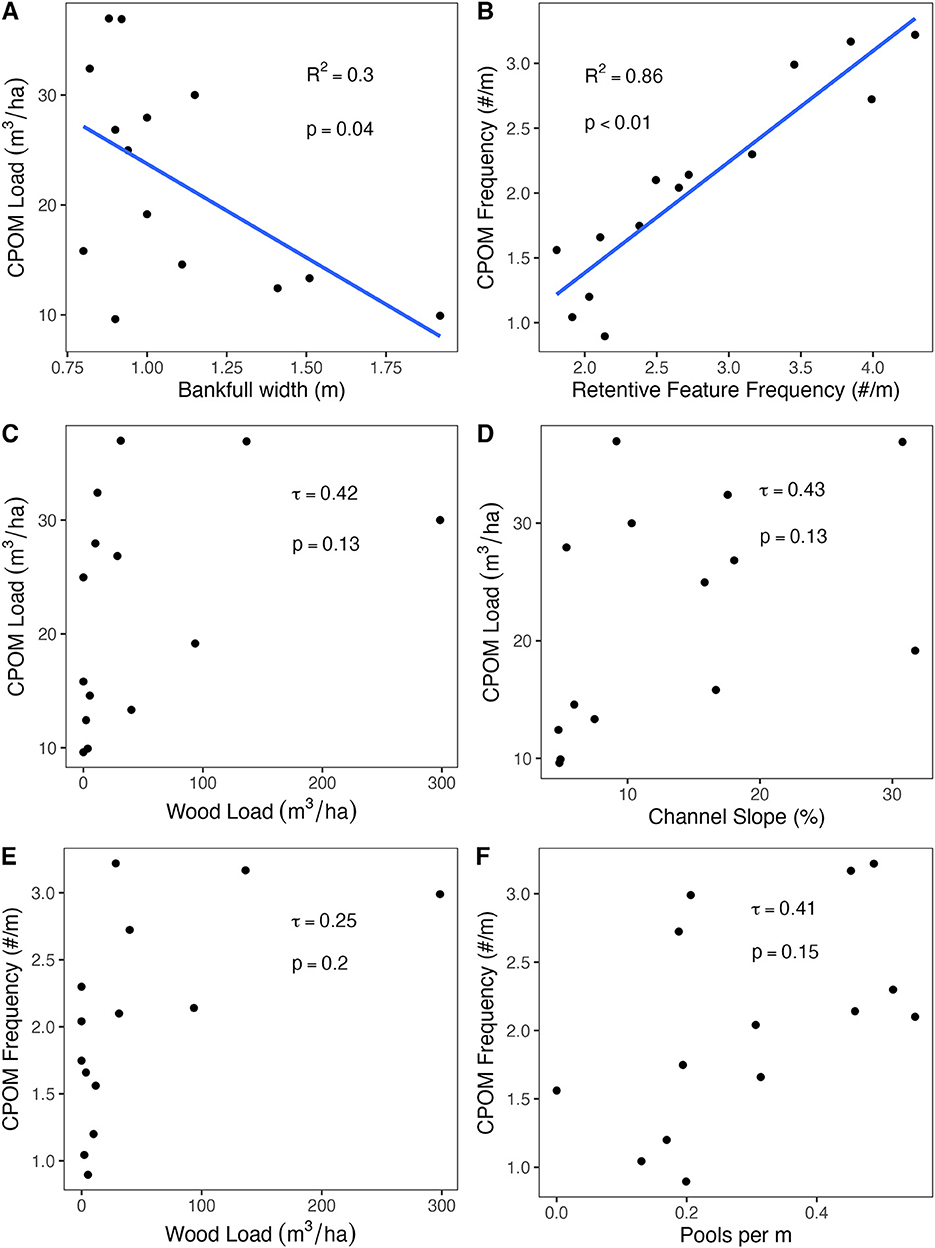
Figure 9. Scatter plots of (A) CPOM load versus bankfull width with linear regression line included (see Table 2), (B) CPOM frequency versus retentive feature frequency with linear regression line included (see Table 2), (C) CPOM load versus wood load, (D) CPOM load versus stream slope, (E) CPOM frequency versus wood load, (F) CPOM frequency versus pool frequency.
Woody CPOM pieces stored a higher proportion of the total number of CPOM accumulations than any other retention mechanism at Gordon Gulch (Figure 10A). Woody CPOM pieces also stored the highest proportion of the total volume of CPOM across the surveyed reaches of Gordon Gulch (Figure 10B), followed by live vegetation. Woody CPOM key pieces responsible for trapping and storing CPOM accumulations were excluded from estimates of CPOM load in the proportion analysis shown in Figure 10A so as to avoid double counting woody CPOM as both a retention mechanism and stored CPOM.
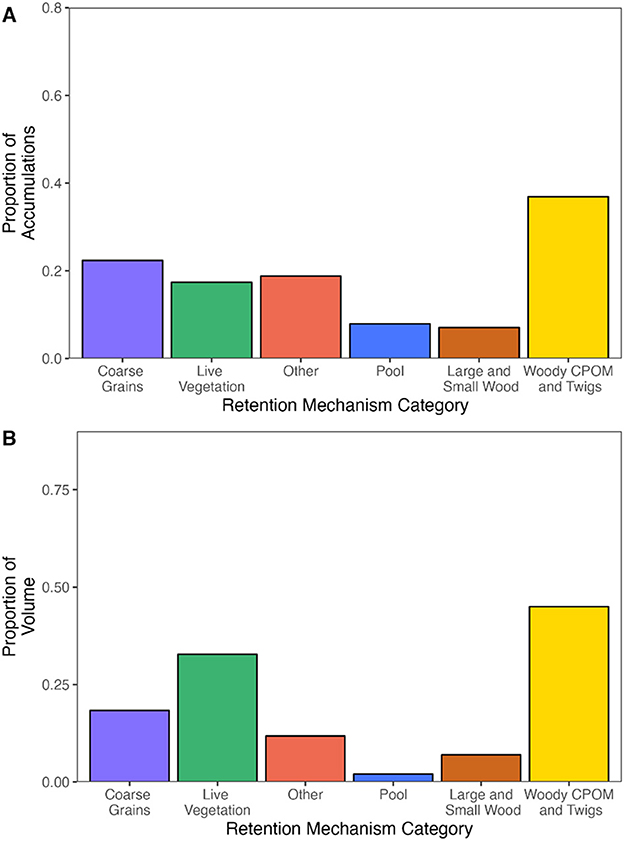
Figure 10. (A) Proportion of the number of CPOM accumulations stored by each retention mechanism class. (B) Proportion of CPOM volume (m3) stored by each retention mechanism class. Size classes include large wood: >1m in length by >0.1 m in diameter; small wood: >1 m in length by 0.05–0.1 m in diameter or 0.5–1 m in length by >0.1 m in diameter; woody CPOM: smaller than small wood category and > 0.2 m in length; small woody CPOM (twigs): <0.2 m length. Note that accumulations may be stored by more than one category, and therefore, total proportions may be greater than 1. Key woody CPOM pieces responsible for storing CPOM accumulations were removed from estimates of CPOM load in Figure 10 so as to avoid double counting woody CPOM pieces as contributing to both retention and total volume.
4. Discussion
4.1. CPOM transport rate-discharge relationships, multi-year CPOM yield, and POC export
Our results indicate discharge is a primary control on CPOM transport rate, since there were significant positive relationships between CPOM transport rate and stream discharge at our study sites (Figure 6). Similar relationships have been observed previously in the Rocky Mountains (Bunte et al., 2016; Marshall et al., 2021), Swiss Alps (Turowski et al., 2013, 2016), and Chilean Coastal Mountain Range (Iroumé et al., 2020). We also observed clear clockwise hysteresis in CPOM transport rate at Como Creek, and weaker clockwise hysteresis at Gordon Gulch (Figure 5), indicating that flows of similar magnitude were associated with higher CPOM transport rates on the rising limb than the falling limb (Figure 4). Clockwise hysteresis has been observed in several other streams in the Rocky Mountains (Bunte et al., 2016; Marshall et al., 2021). Hysteresis may be evidence that the stream is CPOM transport limited prior to peak flow and supply limited following peak flow, as has been hypothesized for other Rocky Mountain streams (Bunte et al., 2016). This assumes that high quantities of CPOM are stored in the stream channel and mobilized on the rising limb of snowmelt discharge. On the falling limb, much of the potentially mobile CPOM likely has already been mobilized, leading to reduced CPOM transport rates, unless stocks of CPOM are replenished by litterfall or from upstream sources (e.g., mobilized CPOM from logjam or other retentive feature failure). Previous studies have shown that considerable quantities of CPOM are deposited into river channels during fall when riparian vegetation sheds leaves and needles (Minshall et al., 1992; Wallace et al., 1995; Benfield et al., 2000), and we also observed this at our field sites, although we did not quantify fall (September-December) CPOM loads. CPOM deposited in the fall is likely not subjected to mobilizing streamflow until the following spring or summer in our snowmelt-dominated study sites. When snowmelt is high enough to increase discharge, CPOM is mobilized on the rising limb of the snowmelt peak (Figure 5), indicating a seasonal pattern of CPOM transport rates. However, this seasonal pattern is likely quite different in other regions; for example, in rainfall-dominated deciduous forests, large spikes in CPOM transport have been observed following leaf abscission in the fall and winter (Wallace et al., 1995).
Because there is a strong seasonal pattern of CPOM transport rates, expected reductions in mountain snowpack and snowmelt streamflow magnitude due to climate change (Mote et al., 2018; Musselman et al., 2021; Hale et al., 2022) may modify the relationship between discharge and CPOM transport rates. Climate change impacts may reduce the CPOM transport capacity of many small headwater streams in snowmelt dominated systems or modify the timing of significant CPOM export from snowmelt peaks to peaks driven by summer convective storms. For example, increased precipitation in the form of rain following leaf abscission could shift the timing of CPOM transport toward the fall and winter, shifting previously snowmelt dominated systems toward patterns observed in deciduous, rainfall-dominated watersheds (Wallace et al., 1995).
Peak CPOM transport rates preceded peak discharge at both Gordon Gulch and Como Creek (Figure 4), suggesting that a critical discharge threshold for CPOM transport may exist, above which the majority of CPOM stored in a stream is mobilized. The threshold for CPOM mobility likely depends on the retentiveness of features storing CPOM (i.e., the ability of a feature to store CPOM for longer periods of time), and the mobility of CPOM particles has been shown to vary due to composition and size of stored CPOM particles (Webster et al., 1994; Wallace et al., 1995). Future research into critical discharge thresholds (or critical shear stresses) for a range of CPOM particles under a range of retentive feature types could help identify this threshold for a wider range of rivers with different geomorphic settings.
When comparing CPOM yields at Como Creek and Gordon Gulch to CPOM yields at other sites from previous studies, there is not a clear pattern in CPOM yield between climate regions (Table 3). Annual CPOM yields for the 2022 water year at our study sites, calculated using our CPOM transport rate-discharge rating curves, were lower than those estimated elsewhere in previous studies (Table 3) (Bilby and Likens, 1980; Bunte et al., 2016; Turowski et al., 2016; Iroumé et al., 2020). Although the 2022 water year CPOM yield was lower than published estimates from other studies, the multi-year average CPOM transport rates for our study reaches were similar to previous studies, with the exception of lower average yield calculated for the Hi-ret reach (Table 3). The one study in which CPOM yield is much greater than our study sites is the Erlenbach Torrent in Switzerland (Turowski et al., 2016). Although the contribution of large wood to CPOM yield in the Erlenbach was negligible, their definition of CPOM varied from ours in that it included what we consider small wood in our study, but the high CPOM yield in the Erlenbach indicates there are likely substantial variations in CPOM yield between watersheds (Table 3). It is important to note that our multi-year average CPOM yield was based on a single year of CPOM transport rate sampling and then applying a rating curve from one year to multiple years highlighting the need for continued, multi-year sampling of CPOM transport at Gordon Gulch, Como Creek, and other locations. Additionally, given the low background levels of CPOM transport at Gordon Gulch, small increases in CPOM transport rate—for example the addition of a single intact leaf or stick fragment falling into the stream—would have resulted in significant spikes in CPOM, adding further uncertainty to our CPOM transport rate-discharge rating curves. Rating curves produced through least squares regression can also contain biases which can significantly affect annual and multi-year yields. In their study, Ferguson (1986) found that rating curves using log-log scales can underestimate river sediment, solute, and pollutant loads by as much 50%. Published estimates of CPOM yield in wetter climates with higher mean annual precipitation, and thus likely more aboveground biomass and potential CPOM inputs to stream, do not appear to have consistently higher CPOM yields compared to drier climates. We also note that published studies of CPOM yield use differing sampling durations, ranging from several minutes to several days (Turowski et al., 2013; Bunte et al., 2016; Iroumé et al., 2020). The lack of patterns across climate regions highlights the need for additional data and standardization of CPOM sampling procedures across studies including sampling equipment, timing, and duration, to constrain CPOM transport drivers and processes, and may point to CPOM transport as a stochastic process.
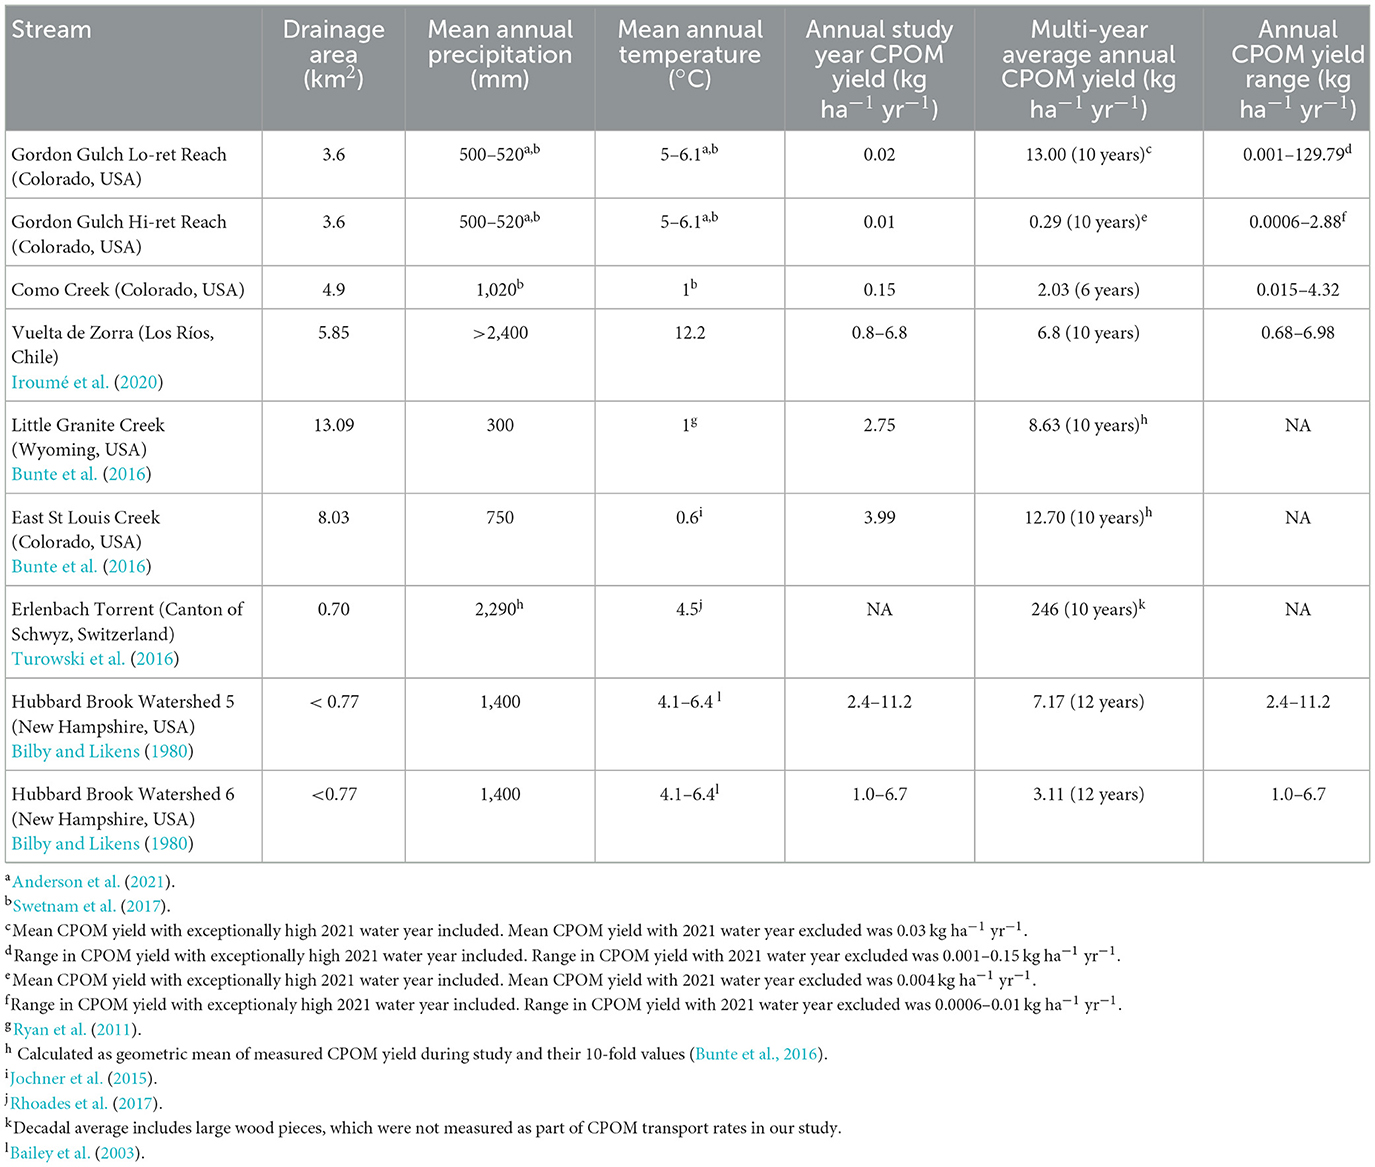
Table 3. Comparison of annual CPOM yield with results from previous studies.
Our comparison of DOC versus POC export demonstrated that DOC export from CC3 (12.3 Mg C) during the 2022 water year was substantially higher than our estimate of POC export in the form of CPOM (0.063 Mg C). In comparison to other studies, DOC export at CC3 was nearly 1.5 times the estimated DOC export of the Erlenbach Torrent, Switzerland (7.9 Mg C) (Turowski et al., 2016). CPOM and large wood accounted for a substantial percentage (~80%) of the total carbon export in the Erlenbach Torrent (Turowski et al., 2016). However, we did not measure large wood transport in our OC export estimate, and given the flow magnitudes observed in our study basins and stream size, we do not expect significant large wood transport. Furthermore, our study was conducted during a relatively low water year. Given that CPOM transport is associated with flow magnitude (Figures 4, 6), CPOM transport may constitute a greater proportion of total carbon export at our study sites during higher flow years. In addition, measurement during a higher flow year may result in different rating curves compared to the rating curves developed for the 2022 water year. Additional studies under different flow conditions would help improve our understanding of how CPOM transport rates influence total OC export from small headwater streams.
4.2. The impact of geomorphic characteristics on CPOM transport rates
Our results from Gordon Gulch did not support our hypothesis that within-a-reach retentive feature frequency would significantly impact local CPOM transport (H2a). We expected that high retentive feature frequency in Hi-ret would reduce longitudinal connectivity of CPOM, resulting in lower CPOM transport rates at the downstream end of Hi-ret. However, there was no significant difference between CPOM transport rates at the upstream and downstream ends of either Hi-ret or Lo-ret (Figures 4, 7). This suggests that retentive feature frequency within a reach may not significantly impact downstream CPOM transport. It also suggests that our study reaches may be close to a steady state in terms of CPOM transport, where the amount of CPOM entering the reach is relatively equal to the amount of CPOM leaving the reach, despite the difference in retentive feature frequency between Lo-ret and Hi-ret. In another study in the Colorado Rocky Mountains, Marshall et al. (2021) found that CPOM transport was not impacted by an upstream channel-spanning log jam (i.e., accumulation) compared to a site without a log jam just upstream, demonstrating that a single retentive instream feature likely does not modify localized CPOM transport rates. Our study design differed in that our Hi-ret site contained many retentive features rather than a single feature, but our results also indicate that within-a-reach retention does not have a measurable impact on CPOM transport rates. However, it is possible that factors such as the low peak streamflow magnitude during the year of our study may have limited our ability to test hypothesis H2a. CPOM stored behind some retentive features, such as stable log jams, may require flows of exceptional magnitude (e.g., 20-year recurrence interval) to become mobilized (Jochner et al., 2015). Peak annual discharge for the 2022 water year was lower than that of five out of the past 10 years for which there are discharge data at Gordon Gulch, and thus it is possible that we missed certain CPOM transport trends that would have been exaggerated under higher-magnitude flows such as during the 2021 water year, the 2013 flood (Gochis et al., 2015), or in a year with multiple high flows (e.g., snowmelt with additional peaks due to late summer convective storms). Additionally, although we assessed the impact of retentive features on CPOM transport rates over a distance of 65m in our Hi-ret reach, and 23 min our Lo-ret reach, it is possible that the lengths of our two study reaches did not fully capture trends in CPOM transport through highly retentive streams over greater distances.
Although we did not find evidence that within-a-reach retentive features impact CPOM transport rates in Gordon Gulch, our results from Como Creek suggest that differences in valley bottom geometry (i.e., river beads versus narrow, confined reaches) are associated with differences in CPOM transport rates. At Como Creek, our results supported our hypothesis that retentive reaches such as river beads would result in lower downstream CPOM transport compared to locations downstream of more confined reaches (i.e., CC3) (H2b). CPOM transport was highest at CC3, the reach upstream of the river bead, and lowest at CC2, the reach just downstream of the river bead (Figures 4E, F), suggesting that CPOM is retained in wide, multithreaded, gradually sloping valley bottoms. Because CC1, the furthest downstream reach, also had reduced CPOM transport relative to the reach above the river bead, the impact of the river bead on CPOM transport rates likely extends downstream. Our results support previous studies that have identified river beads as regions of high organic matter retentiveness, for example in the form of large wood (Wohl et al., 2018; Sutfin et al., 2021). River beads store a disproportionate amount of organic carbon relative to the total stream length they cover in many watersheds (Sutfin et al., 2016, 2021; Wohl et al., 2018). Floodplain deposition of CPOM in tandem with reduced transport capacity of CPOM in beads relative to steeper, more confined reaches may reduce CPOM transport rates at river bead outlets and in reaches downstream of—but in close proximity to—river beads, explaining the lower rates of CPOM transport at our two downstream study reaches (CC1 and CC2). Given the scarcity of prior research into the impacts of valley bottom geometry on CPOM transport, further research is necessary to assess the scales at which geomorphic complexity influences CPOM transport.
4.3. Controls on patterns in CPOM storage
The results of our correlation analyses and regression model selection indicate that retentive feature frequency was strongly correlated and associated with CPOM accumulation frequency but was not significantly correlated with CPOM load (Figure 9B, Table 2; Supplementary materials S3, S4), partially supporting our hypothesis that high retentive feature frequency would be associated with higher CPOM storage (H3a). Although CPOM accumulation frequency increased with increased retentive feature frequency, not all CPOM accumulations trapped by retentive features were large, which may explain why retentive feature frequency does not appear to exert a strong influence on CPOM load. Bankfull width was strongly associated with CPOM load, with narrow stream channels associated with increased CPOM load (Figure 9A, Table 2). CPOM storage measurements occurred in early August under low flow conditions, after peak snowmelt flows, indicating that under low flow conditions during which transport capacity is reduced, narrower channels may have a higher capacity for CPOM retention or trapping. This may be due to an increased probability of CPOM particles interacting with the channel boundary and associated retentive features in narrower channels compared to wider channels.
Among the six retention mechanisms for CPOM accumulations that we assessed, woody CPOM trapped the greatest amount of CPOM in terms of both load and frequency (Figure 10). Large and small wood have been found to be highly effective retentive features for CPOM (Small et al., 2008; Jochner et al., 2015), however the role of woody CPOM and small woody CPOM in initiating the storage of additional CPOM in rivers has not been previously assessed. Furthermore, neither wood load nor wood frequency was included in the top model produced through our regression analysis, although wood was one of the retentive features included in retentive feature frequency. Thus, wood is just one of the retentive features associated with CPOM retention, and other factors also exert a strong control (e.g., woody CPOM, bankfull width). Hydrologic regime also appears to impact CPOM storage, with dry reaches associated with higher CPOM loads (Figure 8B). Few previous studies have measured CPOM storage under different hydrologic regimes, however, one other study found that intermittent streams were associated with widespread CPOM mats and longer residence time of CPOM (Wohl and Scamardo, 2022), suggesting that hydrologic regime (i.e., intermittent vs. perennial reaches) may influence the mode and residence time of CPOM storage. At our sites, it is likely that there was decreased mobilization and increased deposition of CPOM in the dry reaches. These results add to our limited understanding of CPOM storage in streams with intermittent flow regimes, which may be more prevalent in small headwater streams in the future (Larned et al., 2010).
We found that woody CPOM and small woody CPOM were responsible for storing significant proportions of CPOM volume and of accumulations (Figure 10), supporting our hypothesis H3b, but other retention mechanisms were also effective. This result is significant, because although several previous studies have identified the importance of small wood in rivers (Figure 10) (Small et al., 2008; Galia et al., 2018; Wohl et al., 2019a), and the importance of wood in storing CPOM (Small et al., 2008; Jochner et al., 2015; Pfeiffer and Wohl, 2018), we are unaware of any studies that have examined potential feedback loops under which woody CPOM pieces can have an amplifying effect on subsequent CPOM storage in rivers. Our finding that woody CPOM and small woody CPOM key pieces stored the overwhelming majority of CPOM is likely due to the relatively small drainage area (and channel width) and low discharge of our basin. However, it highlights that future studies in headwater streams should use smaller woody size classes to investigate the role of wood in influencing CPOM dynamics. In addition, our results point to the need to understand how the relative influence of different size classes of wood scale with channel geometry metrics and drainage area.
4.4. Comparison of CPOM storage between regions
Comparisons of CPOM storage in Gordon Gulch to published estimates in different climate regimes demonstrate that CPOM storage is generally lower in semi-arid climates than in more temperate environments (Smock et al., 1989; Minshall et al., 1992; Benfield et al., 2000; Gorecki et al., 2006; Flores et al., 2011; Galia et al., 2022), likely due in part to increased primary productivity in wetter environments. Previous studies have used several different metrics to report CPOM storage, making broad comparisons across numerous studies difficult. However, post peak flow CPOM loads in semi-arid Gordon Gulch (9.61–36.96 m3 ha−1, mean = 22.20 m3 ha−1) were higher than those of the Krathis (mean = 5.44 m3 ha−1 in lower Krathis; mean = 15.65 m3 ha−1 in upper Krathis) and Kerinitis (mean = 4.85 m3 ha−1), two semi-arid, intermittent mountainous streams in Greece (Galia et al., 2022). Gordon Gulch CPOM storage was lower than in the temperate Kangaroo River, NSW, Australia (range of 17.1 to 46.6 m3 ha−1 depending on river style (confined, alluvial, partially-confined), mean = 41.8 m3 ha−1) (Gorecki et al., 2006). At our sites in Gordon Gulch, post peak flow CPOM AFDM storage (range: 2.40 to 9.23 g m−2; mean = 5.55 g m−2) was somewhat lower than some other published studies. For example, in the semiarid Lower Salmon River, Idaho, USA coarse benthic organic matter AFDM ranged from 2.2 to 49.6 g m−2 (mean = 18.03 g m−2), although the Salmon River is a much larger system than Gordon Gulch (Minshall et al., 1992). In Ball Creek and Coweeta Creek in North Carolina, USA, estimated coarse benthic organic matter AFDM was greater than 100 g m−2 at two study locations and greater than ~250 g m−2 in two other study locations (Benfield et al., 2000), indicating that CPOM storage is likely higher is the wetter, warmer southeastern USA. CPOM AFDM was significantly higher in Buzzards Branch (3356 g m−2) and Colliers Creek (922 g m−2) two headwater streams in Virginia (Smock et al., 1989), another regions with higher precipitation than our semi-arid study sites. An additional study conducted in four streams in the Basque Country, Spain, found that CPOM storage ranged from 9.3 to 631.9 g m−2, and the CPOM storage was even higher after additional wood was intentionally placed in the stream (Flores et al., 2011). The potential influence of climate on CPOM storage is in contrast to comparisons of CPOM yield across climate regimes, which showed no clear trends between climate regime and CPOM yield (Table 3).
5. Conclusion
CPOM storage provides an important food source for benthic organisms, and CPOM export from headwater streams is a mechanism for energy transfer within watersheds and influences watershed OC cycling. However, there are few studies on the influence of geomorphic complexity on CPOM transport, and CPOM storage in streams with differing hydrologic regimes has only rarely been explored. We found that CPOM transport was related to discharge at both study sites, with CPOM transport rates higher on the rising limb of snowmelt discharge and decreasing through to the falling limb. We interpreted these findings as indicative of a transport limited environment on the rising limb, and a supply limited environment on the falling limb. POC export in the form of CPOM was much lower than DOC export at one of the study locations. Although we did not find a significant relationship between within-a-reach retentive feature frequency and CPOM transport, we did find that variations in valley bottom geometry influence CPOM transport, highlighting the importance of river beads in influencing longitudinal connectivity and mediating transport through the river network. Retentive feature frequency and bankfull width were the most important variables influencing CPOM frequency and CPOM load, respectively. Woody CPOM was the most effective retentive feature in storing additional CPOM in Gordon Gulch. This finding is important because it suggests that future studies should assess the role of woody material from a range of sizes including woody CPOM, especially in small headwater streams such as Gordon Gulch. Our results indicate that the processes driving CPOM transport and storage are complex and include geomorphic context and hydrology. Direct (e.g., dam construction water diversions, wood removal, logging) and indirect (e.g., changes to precipitation patterns and snowpack conditions) alterations to streams that modify peak flow magnitude frequency, valley bottom geometry and lateral connectivity, and instream wood and woody CPOM load could substantially impact CPOM transport and storage in headwater streams. Therefore, it is important to consider these potential impacts on CPOM transport and storage when managing headwater streams. However, more research is needed to fully understand the processes driving CPOM transport and storage in small headwater streams.
Data availability statement
The datasets presented in this study can be found in online repositories. The names of the repository/repositories and accession number(s) can be found below: https://www.hydroshare.org/resource/10f42e54d6144fd6a76ff726739bdf57/.
Author contributions
All authors listed have made a substantial, direct, and intellectual contribution to the work and approved it for publication.
Funding
Funding for this work was provided by the National Science Foundation Award # 2012669 Collaborative Research: Network Cluster: Quantifying controls and feedbacks of dynamic storage on critical zone processes in western montane watersheds. Additional funding and support were provided by the University of Colorado Department of Geography.
Acknowledgments
We thank Dr. Holly Barnard and Dr. Eve-Lyn Hinckley for their thorough review and feedback which have greatly improved this study. Aidan Fletcher provided incredible support throughout the entire summer field season, and for this we owe him our deepest gratitude. We would also like to thank Dr. Kristin Bunte who loaned us sampling equipment and provided insight into CPOM transport measurement techniques. The CU Boulder Laboratory for Interdisciplinary Statistical Analysis provided assistance with statistical methods used in this project.
Conflict of interest
The authors declare that the research was conducted in the absence of any commercial or financial relationships that could be construed as a potential conflict of interest.
Publisher's note
All claims expressed in this article are solely those of the authors and do not necessarily represent those of their affiliated organizations, or those of the publisher, the editors and the reviewers. Any product that may be evaluated in this article, or claim that may be made by its manufacturer, is not guaranteed or endorsed by the publisher.
Supplementary material
The Supplementary Material for this article can be found online at: https://www.frontiersin.org/articles/10.3389/frwa.2023.1227167/full#supplementary-material
References
Adams, H. R., Barnard, H. R., and Loomis, A. K. (2014). Topography alters tree growth–climate relationships in a semi-arid forested catchment. Ecosphere 5, art148. doi: 10.1890/ES14-00296.1
Anderson, S. P., Anderson, R. S., Hinckley, E.-L. S., Kelly, P., and Blum, A. (2011). Exploring weathering and regolith transport controls on Critical Zone development with models and natural experiments. Appl. Geochemistr. 26, S3–S5. doi: 10.1016/j.apgeochem.2011.03.014
Anderson, S. P., Hinckley, E.-L., Kelly, P., and Langston, A. (2014). Variation in critical zone processes and architecture across slope aspects. Procedia Earth Planetar. Sci. 10, 28–33. doi: 10.1016/j.proeps.2014.08.006
Anderson, S. P., Kelly, P. J., Hoffman, N., Barnhart, K., Befus, K., and Ouimet, W. (2021). “Is this steady state? weathering and critical zone architecture in gordon gulch, colorado front range,” in Hydrogeology, Chemical Weathering, and Soil Formation (American Geophysical Union (AGU)), 231–252.
Anderson, S. P., and Ragar, D. (2021). BCCZO—Streamflow/Discharge—(GGL_SW_0_Dis)—Gordon Gulch: Lower—(2011-2019), HydroShare. Available online at: https://www.hydroshare.org/resource/c2384bd1743a4276a88a5110b1964ce0/
Bailey, A. S., Hornbeck, J. W., Campbell, J. L., and Eagar, C. (2003). Hydrometeorological database for Hubbard Brook Experimental Forest: 1955-2000 (NE-GTR-305; p. NE-GTR-305). U.S. Department of Agriculture, Forest Service, Northeastern Research Station.
Barnard, H. R., Hornslein, N., Schiff, M., and Parrish, E. (2023). DWCZ—CO—Gordon Gulch, 1 and 2—Streamflow/Discharge/Conductivity—(DWCZ-GG1-GG2_SW_0)—(2020-ongoing), HydroShare. Available online at: https://www.hydroshare.org/resource/6a2503c69a0d4cd28cd5bfad7cd5b079/ (accessed May 15, 2023).
Bartoń, K. (2022). MuMIn: Multi-Model Inference (1.47.1) [Computer software]. Available online at: https://CRAN.R-project.org/package=MuMIn
Battin, T. J., Kaplan, L. A., Findlay, S., Hopkinson, C. S., Marti, E., Packman, A. I., et al. (2008). Biophysical controls on organic carbon fluxes in fluvial networks. Nat. Geosci. 1, 2. doi: 10.1038/ngeo101
Battin, T. J., Lauerwald, R., Bernhardt, E. S., Bertuzzo, E., Gener, L. G., Hall, R. O., et al. (2023). River ecosystem metabolism and carbon biogeochemistry in a changing world. Nature 613, 7944. doi: 10.1038/s41586-022-05500-8
Bellmore, J. R., and Baxter, C. V. (2014). Effects of geomorphic process domains on river ecosystems: a comparison of floodplain and confined valley segments. River Res. Applicat. 30, 617–630. doi: 10.1002/rra.2672
Benfield, E. F., Webster, J. R., Hutchens, J. J., Tank, J. L., and Turner, P. A. (2000). Organic matter dynamics along a stream-order and elevational gradient in a southern Appalachian stream. SIL Proceed. 27, 1341–1345. doi: 10.1080/03680770.1998.11901454
Bilby, R. E., and Likens, G. E. (1980). Importance of organic debris dams in the structure and function of stream ecosystems. Ecology 61, 1107–1113. doi: 10.2307/1936830
Bovill, W. D., Downes, B. J., and Lake, P. S. (2020). A novel method reveals how channel retentiveness and stocks of detritus (CPOM) vary among streams differing in bed roughness. Freshwater Biol. 65, 1313–1324. doi: 10.1111/fwb.13496
Bright, C. E., Mager, S. M., and Horton, S. L. (2020). Catchment-scale influences on riverine organic matter in southern New Zealand. Geomorphology 353, 107010. doi: 10.1016/j.geomorph.2019.107010
Bunte, K., Swingle, K., Abt, S., and Cenderelli, D. (2015). Effects of Bedload Sampler Netting Properties on Hydraulic and Sampling Efficiency.
Bunte, K., Swingle, K. W., and Abt, S. R. (2007). Guidelines for using bedload traps in coarse-bedded mountain streams: Construction, installation, operation, and sample processing (Gen. Tech. Rep. RMRS-GTR-191; p. 91). U.S. Department of Agriculture, FOrest Service.
Bunte, K., Swingle, K. W., Turowski, J. M., Abt, S. R., and Cenderelli, D. A. (2016). Measurements of coarse particulate organic matter transport in steep mountain streams and estimates of decadal CPOM exports. J. Hydrol. 539, 162–176. doi: 10.1016/j.jhydrol.2016.05.022
Cole, J. J., Prairie, Y. T., Caraco, N. F., McDowell, W. H., Tranvik, L. J., Striegl, R. G., et al. (2007). Plumbing the global carbon cycle: integrating inland waters into the terrestrial carbon budget. Ecosystems 10, 172–185. doi: 10.1007/s10021-006-9013-8
Craney, T. A., and Surles, J. G. (2002). Model-dependent variance inflation factor cutoff values. Qual. Eng. 14, 391–403. doi: 10.1081/QEN-120001878
Dethier, D. P., Williams, N., and Fields, J. F. (2022). Snowmelt-driven seasonal infiltration and flow in the upper critical zone, niwot ridge (Colorado), USA. Water 14, 15. doi: 10.3390/w14152317
Ferguson, R. I. (1986). River loads underestimated by rating curves | semantic scholar. Water Resour. Res. 22, 74–76. doi: 10.1029/WR022i001p00074
Fisher, S. G., and Likens, G. E. (1973). Energy flow in bear brook, new hampshire: an integrative approach to stream ecosystem metabolism. Ecologic. Monograph. 43, 421–439. doi: 10.2307/1942301
Flores, L., Larrañaga, A., Díez, J., and Elosegi, A. (2011). Experimental wood addition in streams: effects on organic matter storage and breakdown. Freshwater Biol. 56, 2156–2167. doi: 10.1111/j.1365-2427.2011.02643.x
Fritz, K. M., Pond, G. J., Johnson, B. R., and Barton, C. D. (2019). Coarse particulate organic matter dynamics in ephemeral tributaries of a central appalachian stream network. Ecosphere 10, e02654. doi: 10.1002/ecs2.2654
Gaillard, J., Chanudet, V., Cunillera, G., and Dambrine, E. (2021). Coarse and fine particulate organic matter transport by a fourth-order mountain stream to lake bourget (France). Water 13, 19. doi: 10.3390/w13192783
Galia, T., Ruiz-Villanueva, V., Tichavsk,ý, R., Šilhán, K., Horáček, M., and Stoffel, M. (2018). Characteristics and abundance of large and small instream wood in a Carpathian mixed-forest headwater basin. Forest Ecol. Manage. 424, 468–482. doi: 10.1016/j.foreco.2018.05.031
Galia, T., Škarpich, V., and Vala, O. (2022). Trees and shrubs as components of the storage of coarse particulate organic matter and instream wood in Mediterranean intermittent streams. Ecohydrol. Hydrobiol. 8, 3. doi: 10.1016/j.ecohyd.2022.08.003
Gochis, D., Schumacher, R., Friedrich, K., Doesken, N., Kelsch, M., Sun, J., et al. (2015). The Great Colorado flood of september 2013. Bull. Am. Meteorologic. Soc. 96, 1461–1487. doi: 10.1175/BAMS-D-13-00241.1
Gomez, B., Trustrum, N. A., Hicks, D. M., Rogers, K. M., Page, M. J., and Tate, K. R. (2003). Production, storage, and output of particulate organic carbon: Waipaoa River basin, New Zealand. Water Resour. Res. 39, 6. doi: 10.1029/2002WR001619
Goñi, M. A., Hatten, J. A., Wheatcroft, R. A., and Borgeld, J. C. (2013). Particulate organic matter export by two contrasting small mountainous rivers from the Pacific Northwest, U.S.A. J. Geophysic. Res. Biogeosci. 118, 112–134. doi: 10.1002/jgrg.20024
Gorecki, V. I., Fryirs, K. A., and Brierley, G. J. (2006). The relationship between geomorphic river structure and coarse particulate organic matter (CPOM) storage along the Kangaroo River, New South Wales, Australia. Austral. Geograph. 37, 285–311. doi: 10.1080/00049180600954757
Hale, K. E., Wlostowski, A. N., Badger, A. M., Musselman, K. N., Livneh, B., and Molotch, N. P. (2022). Modeling streamflow sensitivity to climate warming and surface water inputs in a montane catchment. J. Hydrol. Reg. Stud. 39, 100976. doi: 10.1016/j.ejrh.2021.100976
Hilton, R. G., Galy, A., and Hovius, N. (2008). Riverine particulate organic carbon from an active mountain belt: importance of landslides. Global Biogeochem. Cycles 22, 05. doi: 10.1029/2006GB002905
Hilton, R. G., Galy, A., Hovius, N., Horng, M.-J., and Chen, H. (2011). Efficient transport of fossil organic carbon to the ocean by steep mountain rivers: an orogenic carbon sequestration mechanism. Geology 39, 71–74. doi: 10.1130/G31352.1
Hinckley, E.-L. S., Ebel, B. A., Barnes, R. T., Anderson, R. S., Williams, M. W., and Anderson, S. P. (2014). Aspect control of water movement on hillslopes near the rain–snow transition of the Colorado Front Range. Hydrologic. Process. 28, 74–85. doi: 10.1002/hyp.9549
Intergovernmental Panel on Climate Change (2006). 2006 IPCC Guidelines for National Greenhouse Gas Inventories, Volume 4: Agriculture, Forestry and Other Land Use. Available online at: https://www.ipcc-nggip.iges.or.jp/public/2006gl/vol4.html (accessed May 15, 2023).
Iroumé, A., Ruiz-Villanueva, V., and Salas-Coliboro, S. (2020). Fluvial transport of coarse particulate organic matter in a coastal mountain stream of a rainy-temperate evergreen broadleaf forest in southern Chile. Earth Surface Process. Landforms 45, 3216–3230. doi: 10.1002/esp.4961
Jochner, M., Turowski, J. M., Badoux, A., Stoffel, M., and Rickli, C. (2015). The role of log jams and exceptional flood events in mobilizing coarse particulate organic matter in a steep headwater stream. Earth Surface Dynam. 3, 311–320. doi: 10.5194/esurf-3-311-2015
Keith, M. K., Sobieszczyk, S., Goldman, J. H., and Rounds, S. A. (2014). Investigating organic matter in Fanno Creek, Oregon, Part 2 of 3: sources, sinks, and transport of organic matter with fine sediment. J. Hydrol. 519, 3010–3027. doi: 10.1016/j.jhydrol.2014.07.027
Larned, S. T., Datry, T., Arscott, D. B., and Tockner, K. (2010). Emerging concepts in temporary-river ecology. Freshwater Biol. 55, 717–738. doi: 10.1111/j.1365-2427.2009.02322.x
Lepori, F., Palm, D., and Malmqvist, B. (2005). Effects of stream restoration on ecosystem functioning: detritus retentiveness and decomposition. J. Appl. Ecol. 42, 228–238. doi: 10.1111/j.1365-2664.2004.00965.x
Livers, B., Lininger, K. B., Kramer, N., and Sendrowski, A. (2020). Porosity problems: comparing and reviewing methods for estimating porosity and volume of wood jams in the field. Earth Surface Process. Landforms 45, 3336–3353. doi: 10.1002/esp.4969
Marshall, A., Iskin, E., and Wohl, E. (2021). Seasonal and diurnal fluctuations of coarse particulate organic matter transport in a snowmelt-dominated stream. River Res. Applicat. 37, 815–825. doi: 10.1002/rra.3802
Minshall, G. W., Petersen, R. C., Bott, T. L., Cushing, C. E., Cummins, K. W., Vannote, R. L., et al. (1992). Stream ecosystem dynamics of the Salmon River, Idaho: an 8th-order system. J. North Am. Benthologic. Soc. 11, 111–137. doi: 10.2307/1467380
Mote, P. W., Li, S., Lettenmaier, D. P., Xiao, M., and Engel, R. (2018). Dramatic declines in snowpack in the western US. Npj Clim. Atmospheric Sci. 1, 1. doi: 10.1038/s41612-018-0012-1
Musselman, K. N., Addor, N., Vano, J. A., and Molotch, N. P. (2021). Winter melt trends portend widespread declines in snow water resources. Nat. Clim. Change 11, 5. doi: 10.1038/s41558-021-01014-9
National Ecological Observatory Network (NEON) (2022). NEON (National Ecological Observatory Network). Discharge field collection, RELEASE-2022 (DP1.20048.001) (RELEASE-2022, p. 35.4 MB) [Csv].
National Ecological Observatory Network (NEON) (2023). Chemical properties of surface water (DP1.20093.001): RELEASE-2023 (RELEASE-2023, p. 90.7 MB) [Csv]. National Ecological Observatory Network (NEON).
Pfeiffer, A., and Wohl, E. (2018). Where does wood most effectively enhance storage? network-scale distribution of sediment and organic matter stored by instream wood. Geophysic. Res. Lett. 45, 194–200. doi: 10.1002/2017GL076057
Poeppl, R. E., Fryirs, K. A., Tunnicliffe, J., and Brierley, G. J. (2020). Managing sediment (dis)connectivity in fluvial systems. Sci. Total Environ. 736, 139627. doi: 10.1016/j.scitotenv.2020.139627
R Core Team (2022). R: A Language and Environment for Statistical Computing [Computer software]. R Foundation for Statistical Computing, Vienna, Austria. Available online at: https://www.R-project.org/
Rhoades, C. C., Hubbard, R. M., and Elder, K. (2017). A decade of streamwater nitrogen and forest dynamics after a mountain pine beetle outbreak at the fraser experimental forest, Colorado. Ecosystems 20, 380–392. doi: 10.1007/s10021-016-0027-6
Ruiz-Villanueva, V., Piégay, H., Gurnell, A. M., Marston, R. A., and Stoffel, M. (2016). Recent advances quantifying the large wood dynamics in river basins: new methods and remaining challenges. Rev. Geophys. 54, 611–652. doi: 10.1002/2015RG000514
Ryan, S. E., Dwire, K. A., and Dixon, M. K. (2011). Impacts of wildfire on runoff and sediment loads at Little Granite Creek, western Wyoming. Geomorphology 129, 113–130. doi: 10.1016/j.geomorph.2011.01.017
Sear, D. A., Millington, C. E., Kitts, D. R., and Jeffries, R. (2010). Logjam controls on channel:floodplain interactions in wooded catchments and their role in the formation of multi-channel patterns. Geomorphology 116, 305–319. doi: 10.1016/j.geomorph.2009.11.022
Seo, J. I., Nakamura, F., Nakano, D., Ichiyanagi, H., and Chun, K. W. (2008). Factors controlling the fluvial export of large woody debris, and its contribution to organic carbon budgets at watershed scales. Water Resour. Res. 44, 53. doi: 10.1029/2007WR006453
Shumilova, O., Tockner, K., Gurnell, A. M., Langhans, S. D., Righetti, M., Lucía, A., et al. (2019). Floating matter: A neglected component of the ecological integrity of rivers. Aquatic Sci. 81, 25. doi: 10.1007/s00027-019-0619-2
Small, M. J., Doyle, M. W., Fuller, R. L., and Manners, R. B. (2008). Hydrologic versus geomorphic limitation on CPOM storage in stream ecosystems. Freshwater Biol. 53, 1618–1631. doi: 10.1111/j.1365-2427.2008.01999.x
Smock, L. A., Metzler, G. M., and Gladden, J. E. (1989). Role of debris dams in the structure and functioning of low-gradient headwater streams. Ecology 70, 764–775. doi: 10.2307/1940226
Stanford, J. A., Ward, J. V., Liss, W. J., Frissell, C. A., Williams, R. N., Lichatowich, J. A., et al. (1996). A general protocol for restoration of regulated rivers. Regul. Riv. Res. Manage. 12, 391–413.
Sutfin, N. A., Wohl, E., Fegel, T., Day, N., and Lynch, L. (2021). Logjams and channel morphology influence sediment storage, transformation of organic matter, and carbon storage within mountain stream Corridors. Water Resour. Res. 57, e2020WR028046. doi: 10.1029/2020WR028046
Sutfin, N. A., Wohl, E. E., and Dwire, K. A. (2016). Banking carbon: a review of organic carbon storage and physical factors influencing retention in floodplains and riparian ecosystems. Earth Surfac. Process. Landforms 41, 38–60. doi: 10.1002/esp.3857
Swetnam, T. L., Brooks, P. D., Barnard, H. R., Harpold, A. A., and Gallo, E. L. (2017). Topographically driven differences in energy and water constrain climatic control on forest carbon sequestration. Ecosphere 8, e01797. doi: 10.1002/ecs2.1797
Thompson, C. G., Kim, R. S., Aloe, A. M., and Becker, B. J. (2017). Extracting the variance inflation factor and other multicollinearity diagnostics from typical regression results. Basic Appl. Soc. Psychol. 39, 81–90. doi: 10.1080/01973533.2016.1277529
Turowski, J., Badoux, A., Bunte, K., Rickli, C., Federspiel, N., and Jochner, M. (2013). The mass distribution of coarse particulate organic matter exported from an Alpine headwater stream. Earth Surface Dynam. 1, 1–11. doi: 10.5194/esurf-1-1-2013
Turowski, J., Hilton, R. G., and Sparkes, R. (2016). Decadal carbon discharge by a mountain stream is dominated by coarse organic matter. Geology 44, 27–30. doi: 10.1130/G37192.1
Vannote, R. L., Minshall, G. W., Cummins, K. W., Sedell, J. R., and Cushing, C. E. (1980). The river continuum concept. Canad. J. Fisher. Aquatic Sci. 37, 130–137. doi: 10.1139/f80-017
Wagenmakers, E.-J., and Farrell, S. (2004). AIC model selection using Akaike weights. Psychonom. Bull. Rev. 11, 192–196. doi: 10.3758/BF03206482
Wallace, J. B., Whiles, M. R., Eggert, S., Cuffney, T. F., Lugthart, G. J., and Chung, K. (1995). Long-term dynamics of coarse particulate organic matter in three appalachian mountain streams. J. North Am. Benthologic. Soc. 14, 217–232. doi: 10.2307/1467775
Webster, J. R., Covich, A. P., Tank, J. L., and Crockett, T. V. (1994). Retention of coarse organic particles in streams in the southern appalachian mountains. J. North Am. Benthologic. Soc. 13, 140–150. doi: 10.2307/1467233
Wegener, P., Covino, T., and Wohl, E. (2017). Beaver-mediated lateral hydrologic connectivity, fluvial carbon and nutrient flux, and aquatic ecosystem metabolism. Water Resour. Res. 53, 4606–4623. doi: 10.1002/2016WR019790
Wohl, E. (2017). The significance of small streams. Front. Earth Sci. 11, 447–456. doi: 10.1007/s11707-017-0647-y
Wohl, E., and Beckman, N. D. (2014). Leaky rivers: Implications of the loss of longitudinal fluvial disconnectivity in headwater streams. Geomorphology 205, 27–35. doi: 10.1016/j.geomorph.2011.10.022
Wohl, E., Brierley, G., Cadol, D., Coulthard, T. J., Covino, T., Fryirs, K. A., et al. (2019a). Connectivity as an emergent property of geomorphic systems. Earth Surface Process. Landforms 44, 4–26. doi: 10.1002/esp.4434
Wohl, E., and Cadol, D. (2011). Neighborhood matters: patterns and controls on wood distribution in old-growth forest streams of the Colorado Front Range, USA. Geomorphology 125, 132–146. doi: 10.1016/j.geomorph.2010.09.008
Wohl, E., Hall, R. O J.r., Lininger, K. B., Sutfin, N. A., and Walters, D. M. (2017). Carbon dynamics of river corridors and the effects of human alterations. Ecologic. Monographs 87, 379–409. doi: 10.1002/ecm.1261
Wohl, E., Kramer, N., Ruiz-Villanueva, V., Scott, D. N., Comiti, F., Gurnell, A. M., et al. (2019b). The natural wood regime in rivers. BioScience 69, 259–273. doi: 10.1093/biosci/biz013
Wohl, E., Lininger, K. B., and Scott, D. N. (2018). River beads as a conceptual framework for building carbon storage and resilience to extreme climate events into river management. Biogeochemistry 141, 365–383. doi: 10.1007/s10533-017-0397-7
Wohl, E., and Scamardo, J. (2022). Patterns of organic matter accumulation in dryland river corridors of the southwestern United States. Sci. Total Environ. 833, 155136. doi: 10.1016/j.scitotenv.2022.155136
Keywords: coarse particulate organic matter, fluvial geomorphology, headwater streams, CPOM, particulate organic carbon, organic matter transport, organic matter storage, river beads
Citation: Fogel CB and Lininger KB (2023) Geomorphic complexity influences coarse particulate organic matter transport and storage in headwater streams. Front. Water 5:1227167. doi: 10.3389/frwa.2023.1227167
Received: 22 May 2023; Accepted: 11 August 2023;
Published: 15 September 2023.
Edited by:
Ronald Erwin Pöppl, University of Vienna, AustriaReviewed by:
Andrés Iroumé, Universidad Austral de Chile, ChileJens Turowski, GFZ German Research Centre for Geosciences, Germany
Copyright © 2023 Fogel and Lininger. This is an open-access article distributed under the terms of the Creative Commons Attribution License (CC BY). The use, distribution or reproduction in other forums is permitted, provided the original author(s) and the copyright owner(s) are credited and that the original publication in this journal is cited, in accordance with accepted academic practice. No use, distribution or reproduction is permitted which does not comply with these terms.
*Correspondence: Caleb B. Fogel, caleb.fogel@colorado.edu